 Gabriel Lucas Xavier da Silva
 Milton Kampel
95% of researchers rate our articles as excellent or good
Learn more about the work of our research integrity team to safeguard the quality of each article we publish.
Find out more
ORIGINAL RESEARCH article
Front. Mar. Sci. , 24 November 2022
Sec. Coral Reef Research
Volume 9 - 2022 | https://doi.org/10.3389/fmars.2022.1001185
This article is part of the Research Topic Innovative Approaches to Coral Reef Science by Early Career Researchers View all 15 articles
The rising trend in sea surface temperature presents a threat to tropical coral reefs, causing increased mass bleaching and mortality events. Brazilian reefs have been characterized as less susceptible to thermal stress, where the assessment of bleaching events based on temperature anomalies often overpredicts its actual occurrences in comparison with other regions of the global ocean. With coral reefs acclimatized to local environmental conditions, larval connectivity presents a potential role in introducing organisms adapted to different temperature conditions. In the present study, we evaluated the connectivity patterns of Brazilian coral reefs, verifying its potential influence on the variation of thermal stress tolerance supported by these communities. Connectivity was estimated based on 27-year larval dispersion simulations, from 1993 to 2019, among 180 reef sites distributed in seven ecoregions on the Brazilian continental margin. Simulations were performed using a biophysical model coupling ocean currents data and life history traits of Mussismilia hispida, a widespread stony-coral type species and one of the major endemic reef builders in the South Atlantic. The potential influence of larval connectivity on thermal stress tolerance was evaluated considering the probability of connections between each reef site, their respective bleaching thresholds, and the accumulation of sea surface temperature anomalies over 12-week periods. The results indicated that connectivity-influenced bleaching estimations were significantly closer to observations reported in the literature when compared to estimations without connectivity (p-value < 0.05). These findings present an evidence that larval connectivity may display a relevant role in the adaptation of Brazilian corals to changes in seawater temperature, leading to a potential variation of ± 0.3°C in local thermal stress thresholds. Different connectivity patterns assessed during the occurrence of El Niño–Southern Oscillation events were also observed in association with the migrations of the South Equatorial Current bifurcation. These conditions led to the disruption of connections between the Eastern and Northeastern reef sites during El Niño, and between the Northeastern and Amazon reef sites during La Niña. Ultimately, it is expected that those findings may contribute to the management of Brazilian coral reefs regarding changes in dispersal pathways and thermal stress tolerance given future climate change scenarios.
Coral reefs are marine ecosystems formed mainly by colonies of different calcium carbonate-secreting organisms, capable of generating large reef structures that have a fundamental role in the maintenance of numerous marine populations, the chemical balance of the oceans, and the global carbon cycle (Spalding et al., 2001; Reynaud et al., 2003; Buddemeier et al., 2004). Despite being sessile organisms, corals have a high dispersal capacity due to the characteristics of their life cycle. During their reproductive phase, hundreds to thousands of planula larvae are released into the water column allowing their dispersion over large distances (Pineda et al., 2007). These larvae are transported by ocean currents until they find a suitable habitat or die (Graham et al., 2008; Thompson et al., 2018). The larval transport from one coral community to another can be expressed in terms of connectivity, i.e., the likelihood of occurrence or probability of successful exchange of individuals between remote reef populations (Cowen and Sponaugle, 2009).
Several factors control successful larval exchange across ocean basins, including species life-history traits, abiotic factors, and geographic barriers (Treml et al., 2015a; Treml et al., 2015b). In particular, El Nino-Southern Oscillation (ENSO) events can shape reef connectivity patterns, given that ENSO-dependent variables such as temperature and ocean acidification affect both larval and adult stages of corals (Edmunds et al., 2001; Albright, 2011; Sutton et al., 2014). Understanding connectivity patterns and their abiotic drivers can be useful to identify possible refuges in the face of ocean warming (Studivan and Voss, 2018; Nakabayashi et al., 2019), and support the planning of reef-conservation strategies (Magris et al., 2016; Endo et al., 2019; Fontoura et al., 2022).
Rising sea surface temperatures (SST) threaten the health of shallow water corals reefs (Hughes et al., 2017). Previous studies indicate that global SST have increased by 0.13°C per decade over the last 100 years (Pachauri et al., 2014). As the ocean warms coral reefs become more vulnerable to thermal stress, which can lead to the bleaching and even death of these communities (Douglas, 2003). South Atlantic coral reefs appear to be more resilient to thermal stress when compared to other communities around the world (Mies et al., 2020). Some of the factors associated with this particular characteristic reside in coral’s higher morphological resistance (Loya et al., 2001), as two-thirds of South Atlantic reefs are composed of massive growth forms. The flexible symbiotic associations formed by the majority of coral populations can also be addressed as responsible for this phenomenon, which increases its adaptability to local environmental disturbances (Baker, 2003). Therefore, the combination of these factors leads to low accuracy of bleaching estimations based on SST anomalies, even in cases of intense and prolonged warming (Banha et al., 2020). Although several bleaching events have been reported over the last few decades (Migotto, 1997; Miranda et al., 2013; Teixeira et al., 2019), these have never been followed by mass mortality along the Brazilian coast (Leão et al., 2019).
The survival of reef ecosystems is reliant on the adaptation of corals to local environmental conditions (Couce et al., 2012). Therefore, the dispersion of coral larvae between reefs under different temperature regimes may display an important role in the adaptation of these populations to thermal stress (Kleypas et al., 2016). This variation in thermal stress tolerance should then be reflected in the accuracy of bleaching estimations when considering the influence of connectivity. The dispersal of coral larvae through different sea surface temperature conditions can also help in identifying areas of higher coral resilience in the face of ocean warming (Mumby et al., 2011; Hock et al., 2017).
Here we propose to evaluate the connectivity patterns of Brazilian coral reefs and verify their potential influence on the variation of thermal stress tolerance. Although the experiments performed for achieving this objective were focused on a single representative species, our aim was to quantify connectivity relationships in a generalized way for Brazilian coral reefs and their potential effect on temperature tolerance as a whole. A brief comparison of sea surface temperature and ocean currents products was also assessed to verify their adequacy in reproducing the study area’s local environmental conditions. To the best of our knowledge, this is the first time an integrated approach has been carried out to assess the relationship between connectivity and thermal stress in the Brazilian continental margin, South Atlantic Ocean.
Coral reefs are distributed along 3,000 kilometers on the Brazilian Continental Margin (BCM), comprising the majority of existing reefs in the South Atlantic Ocean (Leão et al., 2019). Their occurrence extends between 1°S–18°S, although rock formations with the presence of corals have been observed from 5°N to 27°S (Lindner et al., 2016; Moura et al., 2016). The coral reef distribution at the north of BCM is marked by Parcel de Manuel Luís reefs (∼ 1°S), occurring 90 km from the coast between 2–30 meters depth (Amaral et al., 2007). Under the Amazon River plume, there is an extensive reef formation composed of coral communities and other building organisms that extends up from 1°S to 5°N (Moura et al., 2016). Between 5°S and 10°S, coral reefs are concentrated close to the shoreline, generally between 5–10 meters in depth (Santos et al., 2007). From 10°S is found one of the largest reef formations along the BCM, encompassing the coral reefs around the Todos os Santos Bay up to the Abrolhos Bank, characterized by a variety of shapes and sizes, occurring from the surface to 90 meters depth (Leão et al., 2019; Zoffoli et al., 2022).
Surface ocean currents control the dispersal of pelagic larvae along the study region (Berti et al., 2011; Peluso et al., 2018). This circulation system is dominated by the western boundary currents along the BCM, mainly composed by the Brazil Current (BC) and the North Brazil Current (NBC) (Stramma and England, 1999). These currents are formed by the bifurcation of the South Equatorial Current southern branch (biSSEC) between 15°S–10°S. At this bifurcation, most of the South Equatorial Current (SSEC) flows northward, merging into the North Brazil Undercurrent (NBUC) (Peterson and Stramma, 1991) and granting the BC a relatively weak flow at its origin. Around 5°S the NBUC then merges into the North Brazil Current with the central branch of the South Equatorial Current (CSEC) (da Silveira et al., 1994). In addition to this western boundary currents system, other meteoceanographic drivers are responsible for contributing to larval dispersal along the BCM, such as wind stress, baroclinic pressure gradients, and tides (Castro et al., 2006).
The study area was delimited between latitudes 1°N–22.5°S, according to the geographic distribution of shallow water coral reefs on the BCM (UNEP-WCMC et al., 2018; Magris et al., 2021). This area was divided into seven regions, adapted from the marine ecoregions proposed by Spalding et al. (2007): (i) Amazon – AMZ, encompassing mainly the Parcel de Manuel Luís reefs; (ii) Fernando de Noronha-Atol das Rocas – FNA; (iii) Northeastern coast – NST; (iv) Eastern-north – ESTn, encompassing the reefs along the Baía de Todos os Santos and adjacent areas; (v) Eastern-center – ESTc, corresponding to the formations along the Abrolhos and Royal Charlotte banks; (vi) Eastern-south – ESTs, encompassing mainly the reefs near Guarapari; (vii) Trindade-Martim Vaz Islands – TMV, associated with isolated reef formations that extend to the end of the Vitória-Trindade Chain, from Mount Columbia to Trindade Island (Figure 1).
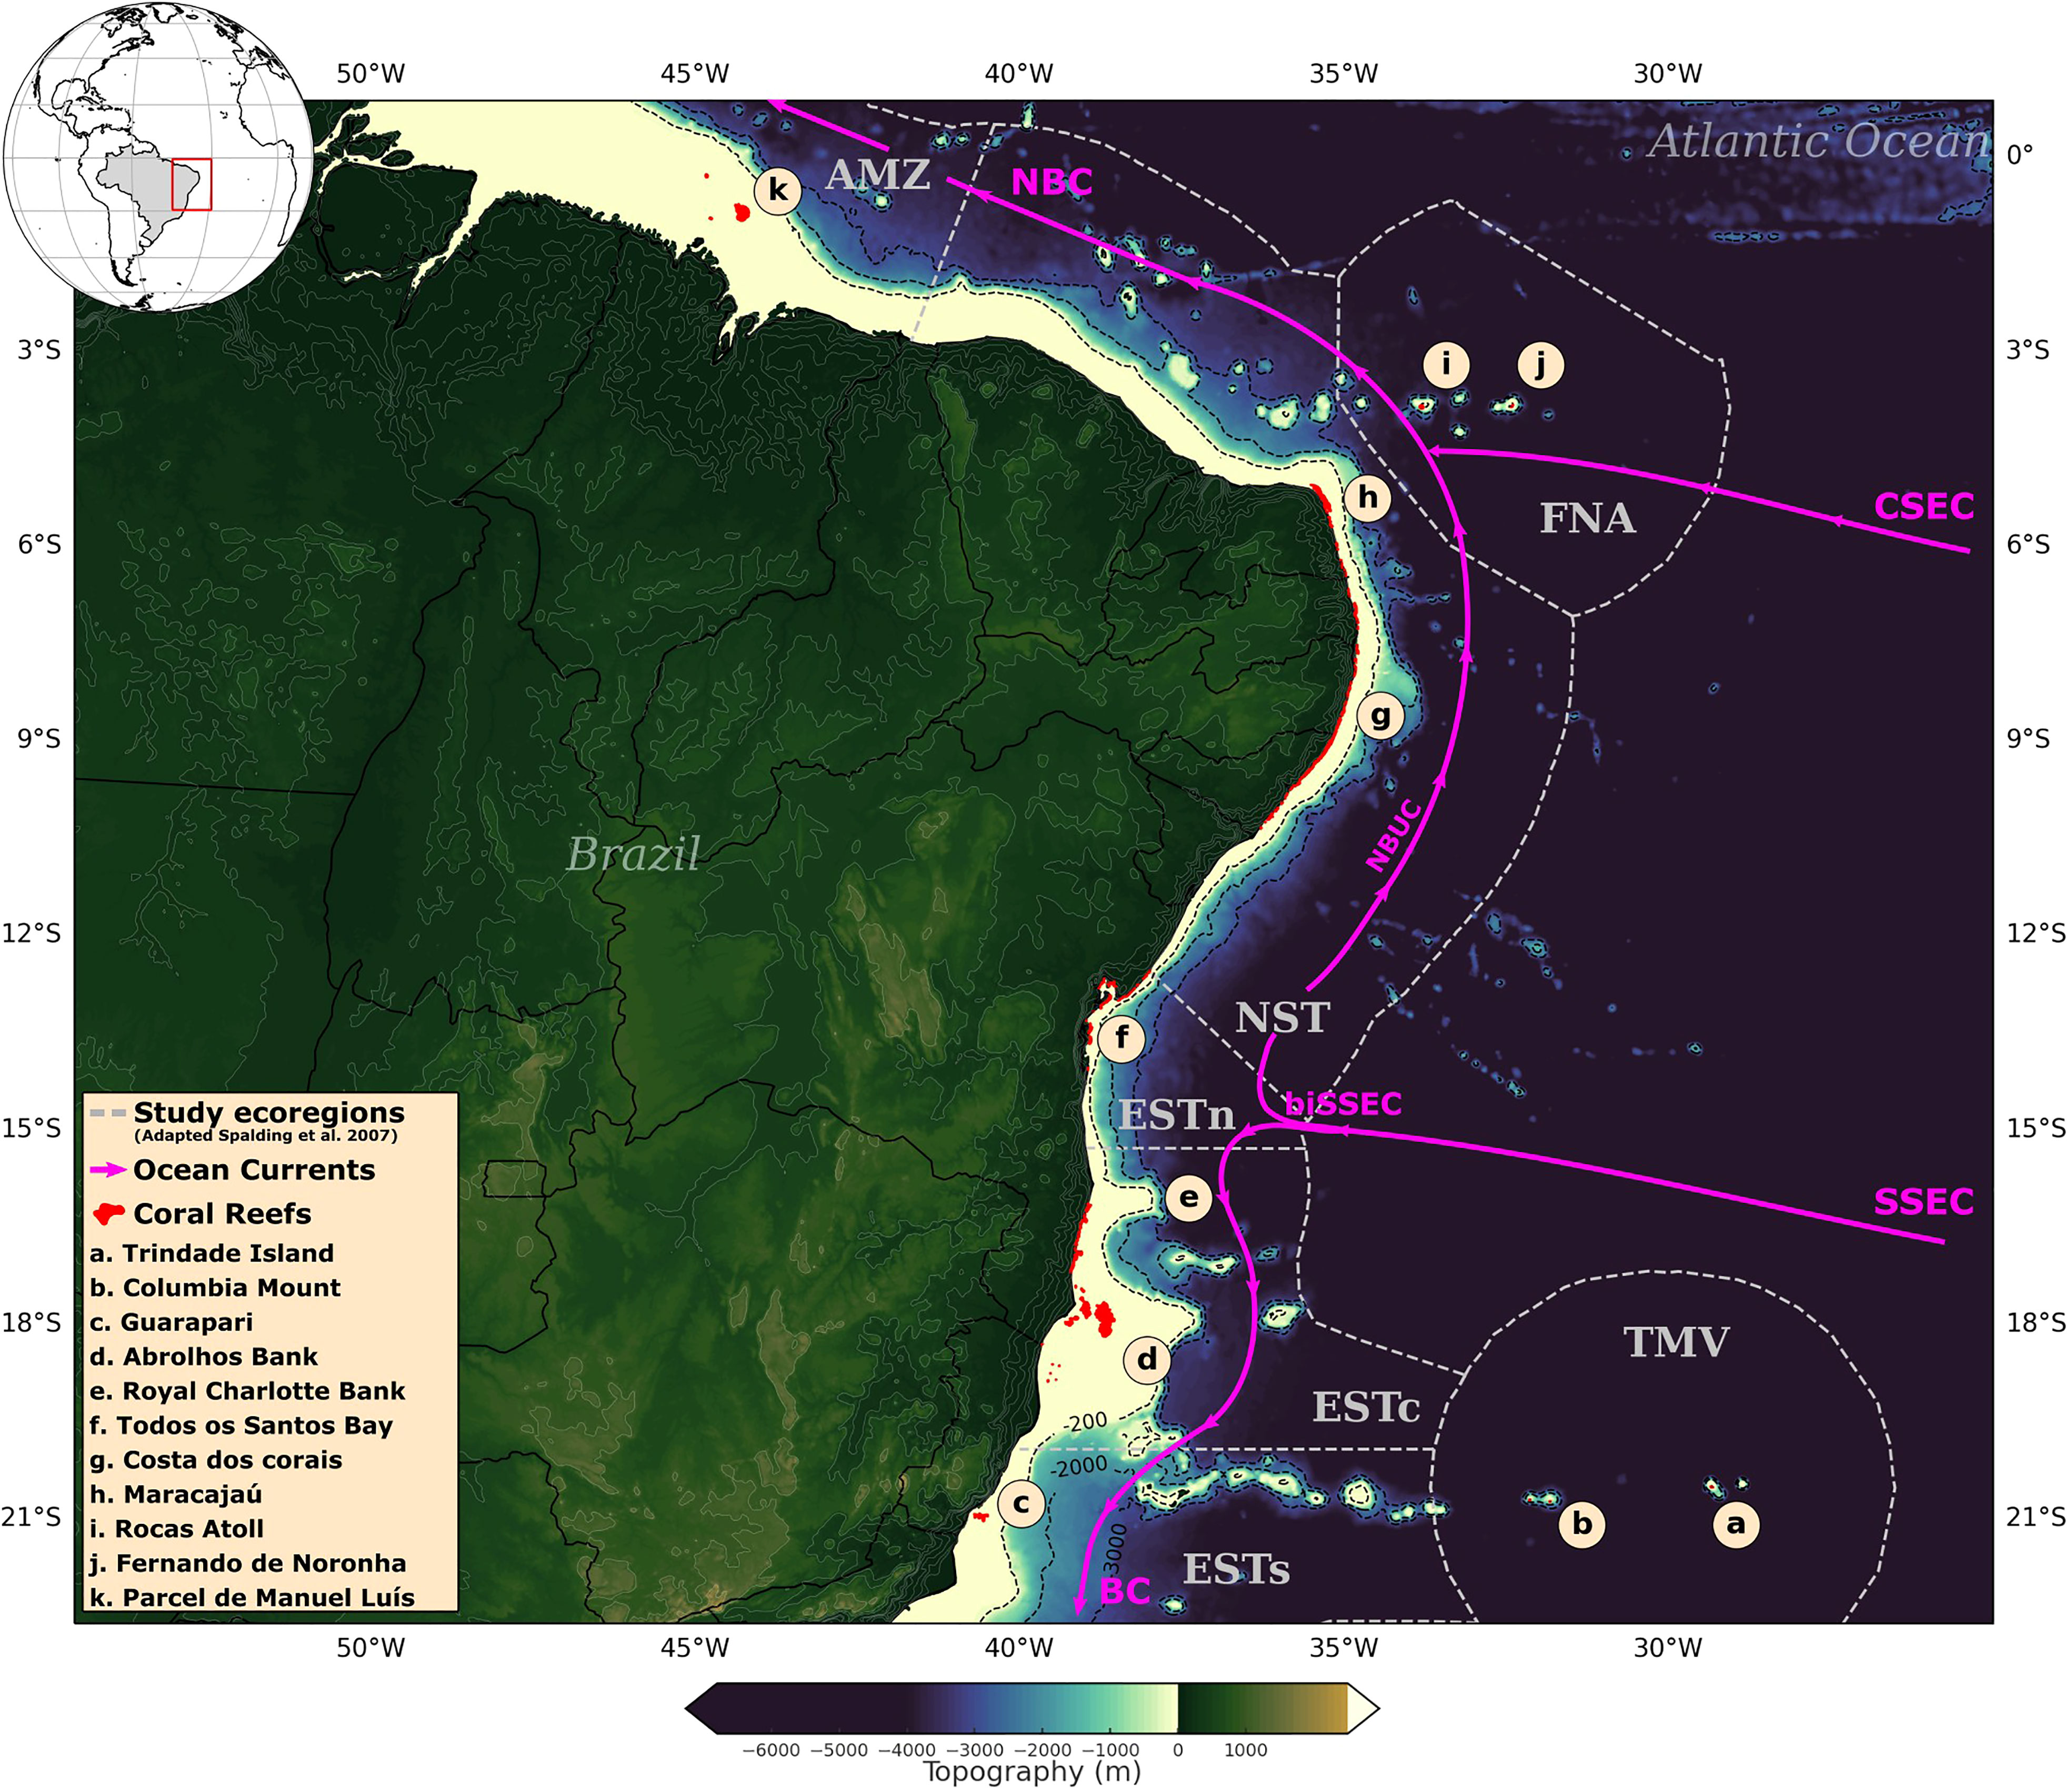
Figure 1 Coral reefs geographic distribution along the Brazilian continental margin (in red), according to UNEP-WCMC et al. (2018) and Magris et al. (2021). Ecoregions adapted from Spalding et al. (2007) (in grey): Eastern-south (ESTs); Eastern-center (ESTc); Eastern-north (ESTn); Northeastern (NST), Amazon (AMZ), Fernando de Noronha-Atol das Rocas (FNA), Trindade-Martim Vaz Islands (TMV). Simplified diagram of surface ocean currents (in pink) according to Stramma and England (1999); Soutelino et al. (2013): NBC, North Brazil Current; NBUC, North Brazil Undercurrent; CSEC, Central branch of the South Equatorial Current; SSEC, Southern branch of the South Equatorial Current; biSSEC, bifurcation of the South Equatorial Current southern branch; BC, Brazil Current.
Here we adopt a biophysical model proposed by Treml et al. (2008; 2012) to simulate coral larval dispersion and quantify the connectivity probabilities between Brazilian reefs during 1993–2019. This model is based on a graph-theoretic approach, in which a bidimensional cloud of virtual larvae is released from reef sites according to their reproductive potential (i.e., proportion of reef area) and dispersed by an advection transport algorithm (Smolarkiewicz and Margolin, 1998; Smolarkiewicz, 2006) through the current velocity fields given as input. This virtual cloud is quantified by the probabilistic density function of larval density in each grid cell, i.e., larval dispersion kernel. Therefore, instead of tracking the individual position of an integer number of released larvae, the model directly estimates each reef sites’ connectivity probability based on the larval dispersion kernel. This model is in the Marine Geospatial Ecology Tools (MGET) package, allowing the implementation of larval dispersion simulations using ESRI’s ArcGIS (Roberts et al., 2010).
The initial settings for connectivity modeling involved the creation of the virtual environment for larval dispersion simulations, consisting of a 10 x 10 km grid-based habitat map containing: (i) a water mask derived from the General Bathymetric Chart of the Oceans – GEBCO (Tozer et al., 2019); (ii) a total of 180 reef sites (Figure 2); (iii) proportion (%) of reef coverage within each reef site. The model was then coupled with surface ocean current fields from the Global Ocean Physics Reanalysis – GLORYS12V1 dataset and life history traits of Mussismilia hispida, a widespread endemic species across the BCM. In this setup, the current velocity fields were responsible for moving the larvae dispersion kernel from the initial 180 reef sites, delimiting its potential dispersal pathways, and pacing the intensity of its spatio-temporal distribution along the grid-based map. On the other hand, the life-history traits shaped the dates and frequencies of larvae release, the total duration of the dispersion, and other limiting factors for the simulations to occur, such as the larval mortality rate. A more detailed discussion on the larval simulation limiting factors is presented in the following sections. Given the bidimensional nature of the connectivity model used, the dispersal of coral larvae to deeper reefs was not considered. Although this vertical exchange may also be important when addressing potential climate change refugia (Holstein et al., 2016; Garavelli et al., 2018), here we were interested in assessing only the connectivity between reef sites near the ocean surface, i.e., the populations most impacted by SST anomalies.
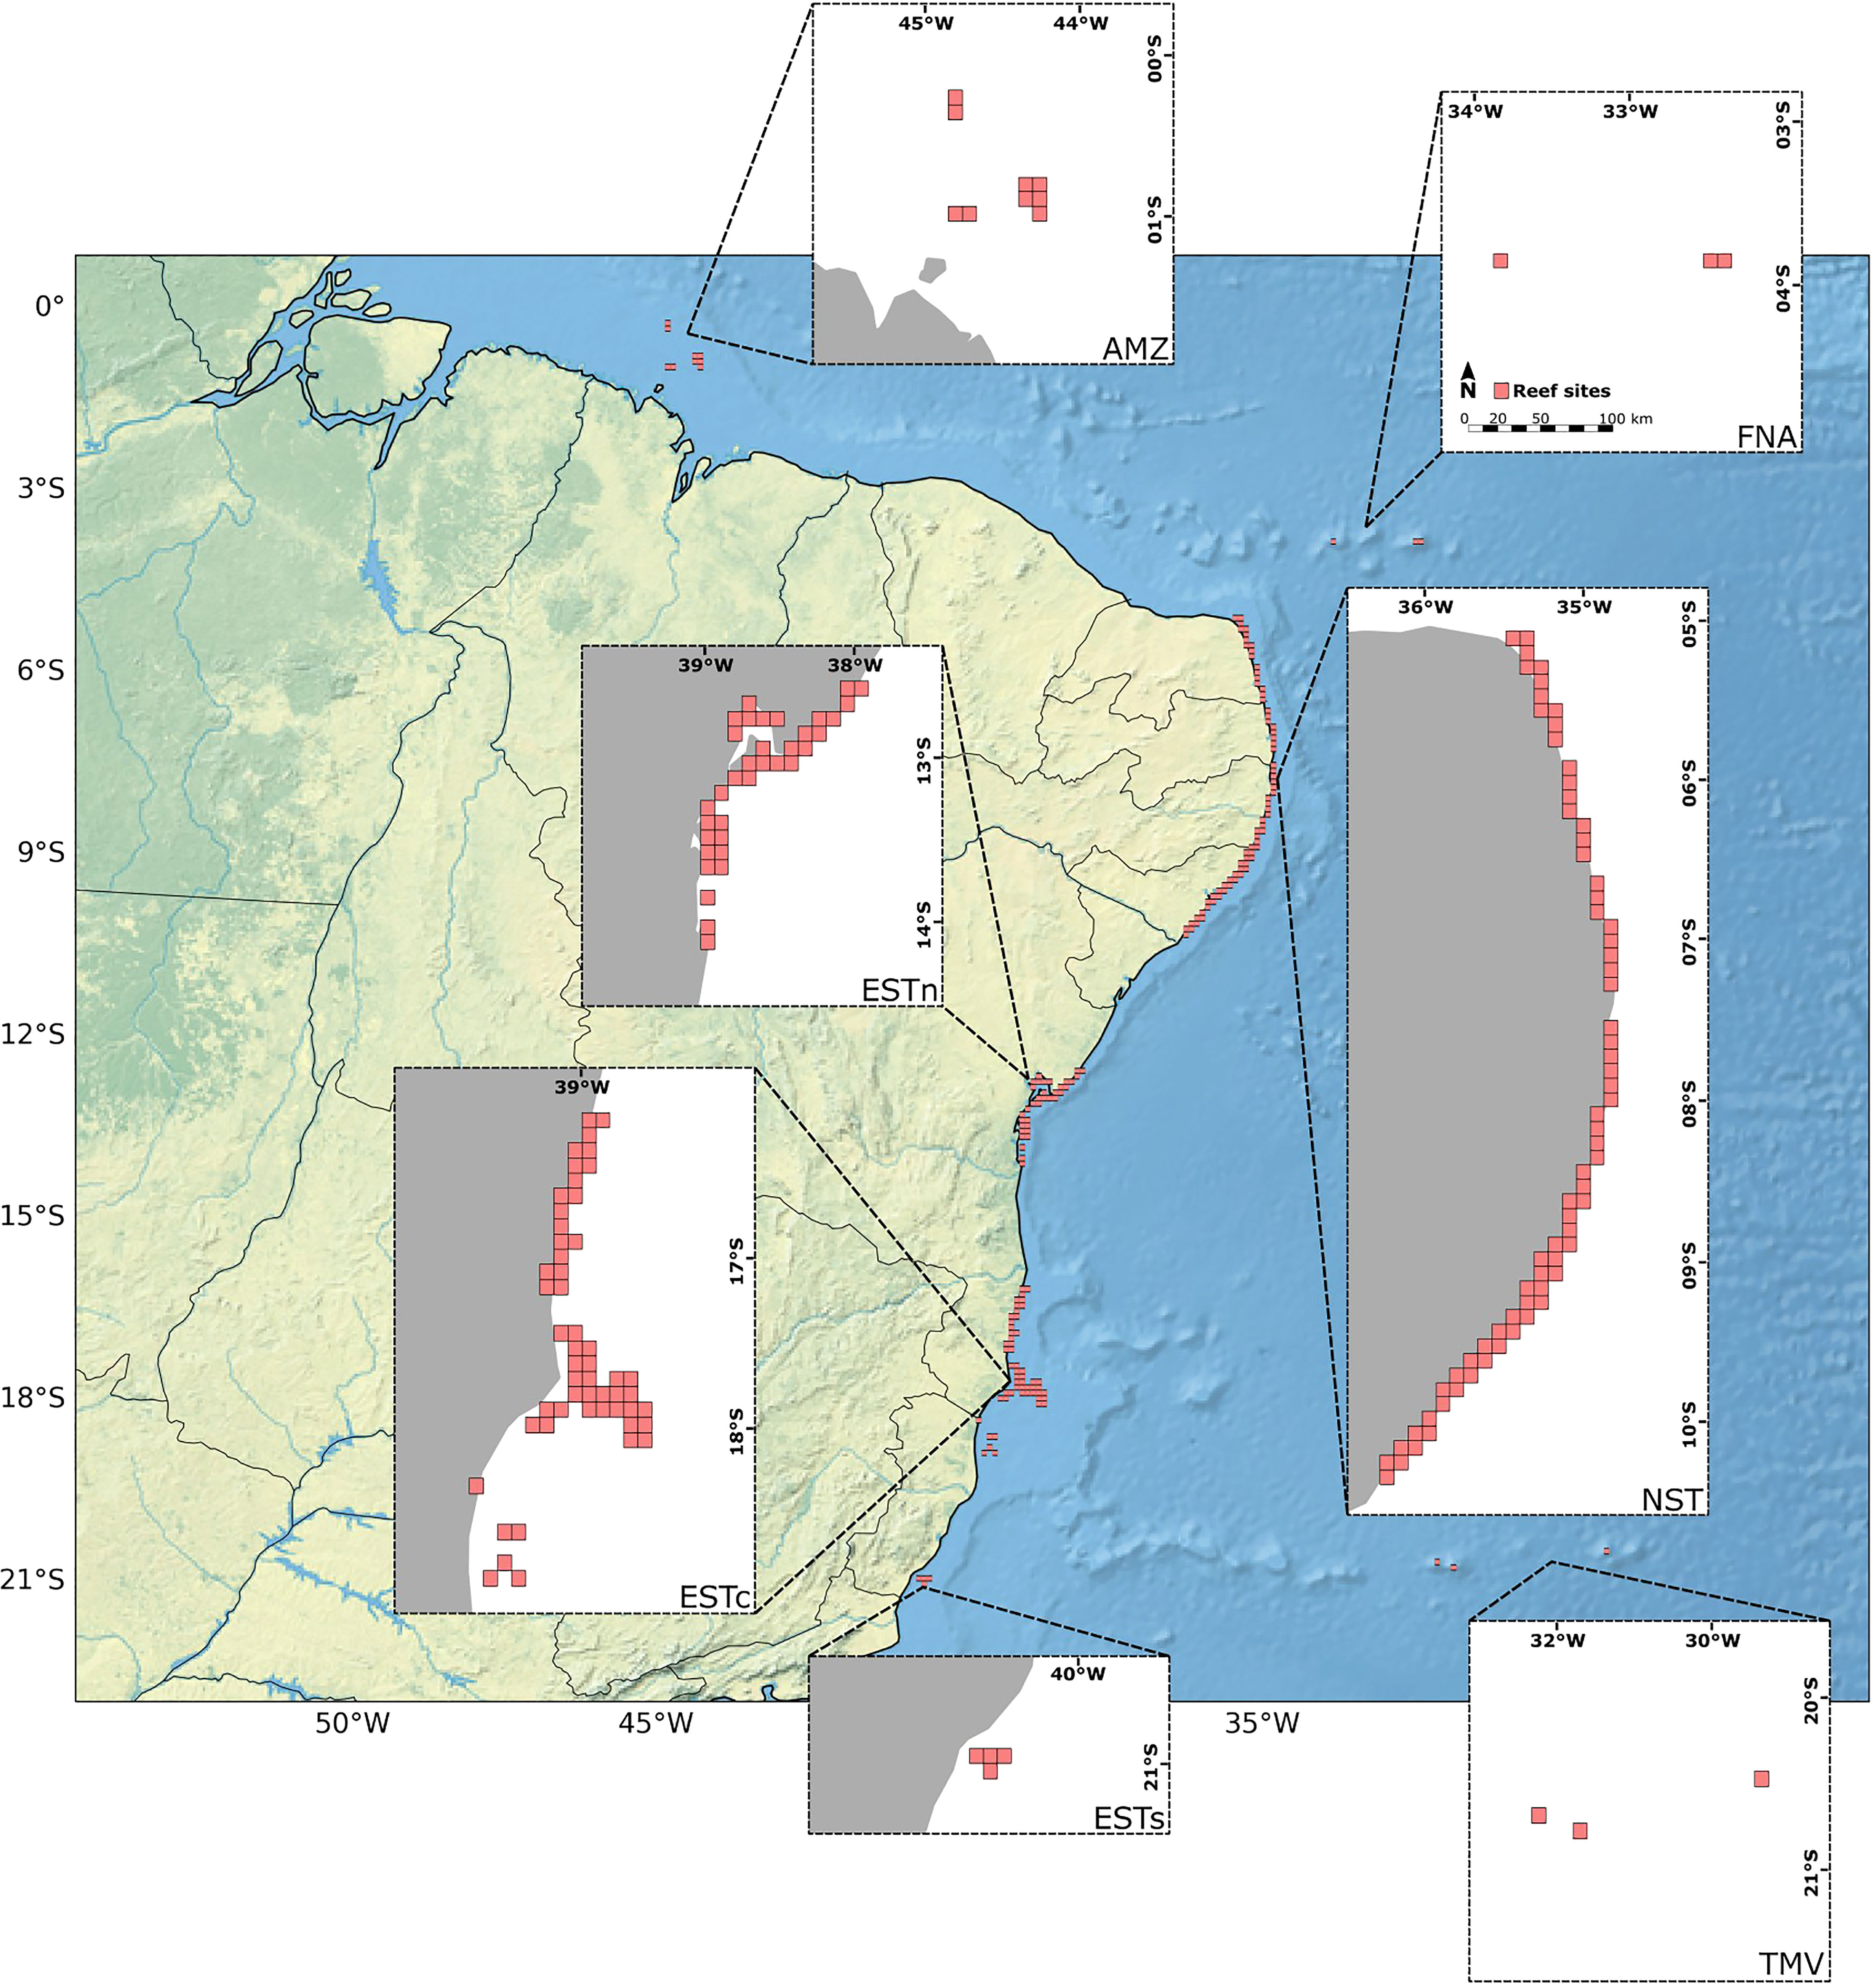
Figure 2 Distribution of the 180 reef sites with 10 x 10 km along the Brazilian continental margin (in gray). Ecoregions: Eastern-south (ESTs); Eastern-center (ESTc); Eastern-north (ESTn); Northeastern (NST), Amazon (AMZ), Fernando de Noronha-Atol das Rocas (FNA), Trindade-Martim Vaz Islands (TMV).
Surface ocean current fields were derived from GLORYS12V1 reanalysis (Lellouche et al., 2018). GLORYS12V1 product consists of a coupling of the real-time global forecast model from Copernicus Marine Service (CMEMS) with reanalysis of the European Center for Medium-Range Weather Forecasts (ECMWF) ERA-Interim and ERA5. The dataset have a spatial resolution of 1/12° × 1/12° (∼ 9.26 km × 9.26 km at the equator), 50 depth levels in a daily historical series from January/1993 to December/2019. The daily zonal and meridional components of the surface ocean currents were extracted between the months of August/1993 to November/2019, considering the average fields from 0 to 15 meters depth. This depth range is common to several estimates of surface ocean currents (Dohan et al., 2010; Dagestad and Röhrs, 2019) and was chosen to represent the major current fields associated with shallow water reefs.
The velocity fields were resampled in the connectivity model grid (10 × 10 km) using the bilinear interpolation method available in the pyresample package in Python language (https://pyresample.readthedocs.io/en/latest/grid.html). A diffusivity parameter equivalent to 50 m2s-1 was adopted as the input value in the larval connectivity model to represent the oceanic turbulence (Okubo, 1994). In order to verify the adequacy of the GLORYS12V1 product in reproducing the regional ocean current dynamics, a statistical comparison was performed considering daily zonal and meridional velocity fields derived from GLORYS12V1. These variables were compared against matching-pairs of satellite altimetry data from CMEMS (CMEMS, 2019), and in situ measurements from the Brazilian National Buoy Program – PNBOIA (Marinha do Brasil, 2017), according to the bias, root mean square error (RMSE) and correlation coefficient (R).
Although our analysis was more focused on a generalist approach rather than species-specific, it is important to note the necessity of incorporating coherent regional biological characteristics into the biophysical model. Therefore, here we choose to use Mussismilia hispida (Verrill et al,.1902) as a representative species for performing the larval dispersal simulations, due to its widespread distribution and importance as a major reef-building coral along the Brazilian continental margin. M. hispida is a hermaphroditic species and broadcasting-type coral. It has a roughly annual reproductive cycle, with at least two to three consecutive months of spawning each year. Recent studies also show that the species is able to spawn even when bleached (Godoy et al., 2021). Based on its life-history traits, the major biological parameters given as input to the connectivity model were its spawning date and larval release frequency, the pelagic larval duration (PLD), the pre-competency period, and larval mortality rate (Table 1). Other factors, such as the reproductive potential and migration rate threshold (MRT), were adopted considering the proportion of reef area in each site and the model accuracy threshold.
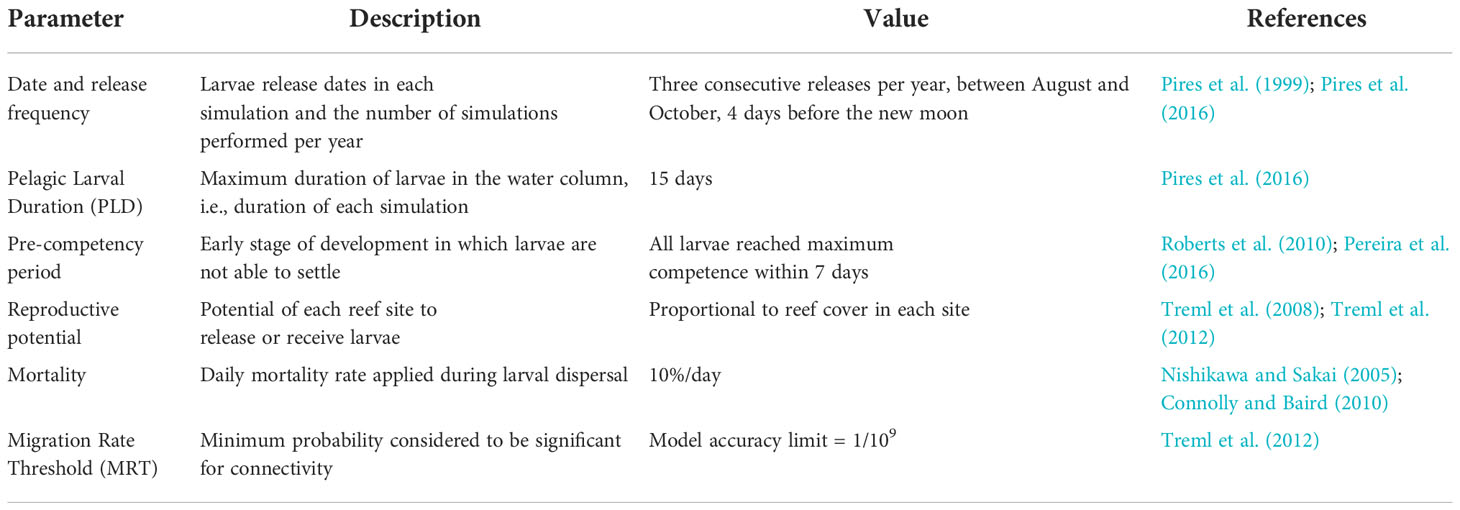
Table 1 Life-history traits of Mussismilia hispida used for the larval connectivity model.
We performed three consecutive releases during August–September–October (ASO) of each year between 1993–2019, corresponding to the maximum spawning intensity of M. hispida (Pires et al., 2016). Although the PLD for M. hispida has not been conclusively determined, preliminary results indicate that most larvae should settle around 10 days (Peluso et al., 2018), remaining at least 7 days in the water column (Pereira et al., 2016). Given that most larvae can settle within 7 to 10 days, some may still remain competent and survive in the water column if no suitable habitat is found. Therefore, a PLD equivalent to 15 days was adopted. The pre-competency time, i.e., period in which the larvae are not able to settle, was modeled by a gamma-cumulative distribution function (Roberts et al., 2010) causing all larvae to reach competence within a maximum of 7 days. In the absence of conclusive data on the settlement probability of M. hispida, we assumed that all competent larvae were able to settle when encountering a reef site. A mortality rate of 10%/day was also adopted for the drifting larvae during the simulations (Nishikawa and Sakai, 2005; Connolly and Baird, 2010).
Sea surface temperature data were obtained from NOAA Coral Reef Watch SST product, also known as CoralTemp (Skirving et al., 2020). The CoralTemp product is derived from nightly satellite data and reanalysis at a daily 5 km resolution, extending from 1985 to present. It is considered one of the main SST products currently available for obtaining and calculating thermal stress indices for coral reef monitoring (Liu et al., 2021a). Daily CoralTemp data was also statistically compared against matching-pairs of SST in situ measurements from PNBOIA. The matching-pairs time-series were compared in terms of the bias, root mean square error, and correlation coefficient.
Thermal stress indices were calculated based on the NOAA Coral Reef Watch protocol for monitoring bleaching events (https://coralreefwatch.noaa.gov/product/5km/methodology.php). First, we obtained the Maximum Monthly Means (MMM) for each reef site, directly from NOAA Coral Reef Watch suite (Skirving et al., 2020). These MMM values are based on a 28-year sea surface temperature climatology (1985–2012), but adjusted according to Heron et al. (2014) to the baseline time period of 1985–1993 (Liu et al., 2003). Therefore, the MMM represents the climatology warmest monthly mean value for each reef site.
Secondly, we use the MMM values to estimate the Thermal Stress Threshold (TST), which is defined as the threshold value at which corals begin to suffer the impacts of thermal stress. Usually, the TST is calculated by adding 1°C to the maximum monthly mean at each reef site (Glynn and D’croz, 1990). However, in order to better capture the bleaching responses based on temperature anomalies, here we calculated the TST considering the natural variability of the maximum monthly means during the study period, according to Donner (2009) (Equation 1). Incorporating MMM variability for TST calculation has been shown to improve bleaching estimations in the Indo-Pacific region (Kleypas et al., 2015; Kumagai and Yamano, 2018). Other modifications of the common TST calculation have also improved bleaching estimations at subtropical corals in eastern Australia (Kim et al., 2019).
Where TSTi = thermal stress threshold in site i, MMMi = maximum monthly mean in site i, σi = standard deviation of maximum SST monthly averages from 1993 to 2019 in site i.
Positive SST anomalies known as temperature hotspots were calculated as the difference between SST time-series and MMM in each reef site. The hotspot values were used to calculate the Degree Heating Week (DHW), a measure of the thermal stress accumulation in a given region over time. Therefore, DHW consists of the accumulation of temperature hotspots that exceeds TST values in a 12-week moving window (Equation 2) (Liu et al., 2006).
Where DHWi,j = sum of positive SST anomalies in the site i on day j; Hotspoti,k = positive SST anomalies (≥ 2.5σi ) in the site i for the 83 days prior to day j; σi = standard deviation of SST monthly average peaks from 1993 to 2019 in the site i.
Based on DHW values we estimated bleaching events occurrences according to three severity levels (Kayanne, 2017): (i) mild bleaching (4 to 8°C-weeks), (ii) moderate bleaching (8 to 12°C-weeks); (iii) severe bleaching (> 12°C-weeks). Bleaching events estimations for each reef site were grouped according to their respective ecoregion. Therefore, bleaching events within the same ecoregion and during the same period were counted as a single event.
From eighty-one larval dispersal simulations performed during August–September–October of 1993–2019 time-series we obtained the connectivity probabilities for 180 reef sites. We analyzed the connectivity patterns based on the overall average of simulations regarding the larval kernel density and established connection probabilities within 7 major ecoregions. These connectivity patterns were also assessed in relation to years of greater intensity of El Niño and La Niña events during ASO months, according to the Oceanic Niño Index (ONI) available from the NOAA Climate Prediction Center (https://origin.cpc.ncep.noaa.gov/products/analysismonitoring/ensostuff/ONIv5.php). Therefore, ASO months during 1997–1998 and 2015–2016 were selected as El Niño representative periods and 1998–1999 and 2010–2011 as La Niña periods. Connectivity matrices were calculated for each reference period (i.e., 1993–2019 time-series, El Niño and La Niña) considering the relative contribution of each ecoregion to overall connectivity, expressed by the number of successful connections and its weighted probabilities (Equation 3). The purpose of this analysis was to verify whether substantial changes in dispersal pathways and connectivity patterns could be observed during ENSO events.
Where RCij = relative contribution from ecoregion j to i; Nij = number of successful connections from ecoregion j to i; Pij = weighted average connection probability from ecoregion j to i; T = total number of successful connections between all ecoregions.
Given that connectivity describes successful larval dispersal relationships between two remote populations, which are often acclimatized to different temperature regimes, we can assume that it has the potential to play a relevant role in local thermal stress adaptation (Kleypas et al., 2016). Assuming that coral's thermal tolerance is inherited from its parents (Dixon et al., 2015), local populations receiving larvae from warmer/colder regions would tend to increase/decrease its thermal stress tolerance if these new individuals are recruited and become capable of reproducing in this new population. Therefore, the influence of connectivity in thermal stress tolerance should be reflected in the occurrence of bleaching events related to SST anomalies.
In order to verify this hypothesis, the potential influence of connectivity on thermal stress tolerance was assessed by incorporating the probability of connection between each reef site on the previous TST estimations. The TSTcp for a reef site i was calculated as a function of the connectivity probability (a) among all the other reef cells j and their respective TST values (Equation 4), adapted from Kleypas et al. (2016). The differences between the TST and TSTcp values were calculated in order to analyze the spatial variability influenced by connectivity and to identify the sites with a greater potential variation of temperature tolerance.
Based on the obtained TSTcp values, we re-calculated the DHW considering only the sum of positive SST anomalies that exceeded TSTcp at each reef site. The estimated bleaching events based on TST and TSTcp were statistically compared with reported events in the literature, in order to verify whether connectivity significantly improved bleaching estimations in the study area. The reported events were assessed through extensive bibliographic research (see Supplementary Material, Section 2) and cataloged according to the ReefBase protocol for coral reefs monitoring (Oliver et al., 2004).
For a proper comparison in terms of bleaching severity, the occurrences were weighted according to their severity level and their subsequent ReefBase code (i.e., ×1 for mild bleaching, ×2 for moderate bleaching, and ×3 for severe bleaching). We then calculated the absolute errors between the numbers of observed and estimated bleaching occurrences. The statistical comparison was performed according to the non-parametric Sign test and Wilcoxon signed-rank test. The purpose of this analysis was to determine whether connectivity-influenced estimations were significantly closer to actual bleaching observations (Kleypas et al., 2016).
In the Sign test, the differences were evaluated by classifying the connectivity-influenced estimations as “better” or “worse”, in case the absolute errors were lower or higher than the absolute errors presented by the estimations without connectivity. Assuming the probability that these results are random, i.e., a priori none of the methods are better or worse, the Sign test is then reduced to a simple binomial cumulative distribution function in which there is a 50% probability of obtaining both better and worse results among bleaching estimates. In the Wilcoxon signed-rank test, the results obtained for the bleaching estimations were evaluated considering the total number of absolute errors, and assessed in order to identify which of the estimations presented significantly lower values in relation to the real observations.
The brief validation of SST and ocean currents data indicated a moderate to excellent correlation with in situ measurements. CoralTemp SST presented a high correlation (R = 0.987), low bias (-0.065°C) and RMSE (0.548°C) when compared with in situ data from PNBOIA buoys (Figure 3). In general, the buoys that presented the lowest correlation values and the highest values of bias and RMSE were located in the southern portion or below the latitudinal limit of the study area (i.e., south of 23°S). A moderate correlation was observed for zonal (R = 0.637) and meridional (R = 0.510) velocities for GLORYS12V1 ocean surface currents when compared to PNBOIA buoys. The maximum magnitudes of the zonal velocity fields were observed in the northern portion of the BCM, as well as the maximum standard deviation. These regions also presented higher values of bias and RMSE when compared to altimeter-derived ocean current fields (see Supplementary Figures S1, S2), but just like SST comparisons, were located beyond the boundaries of the study area, and present no relevant interference in the larval dispersal simulations.
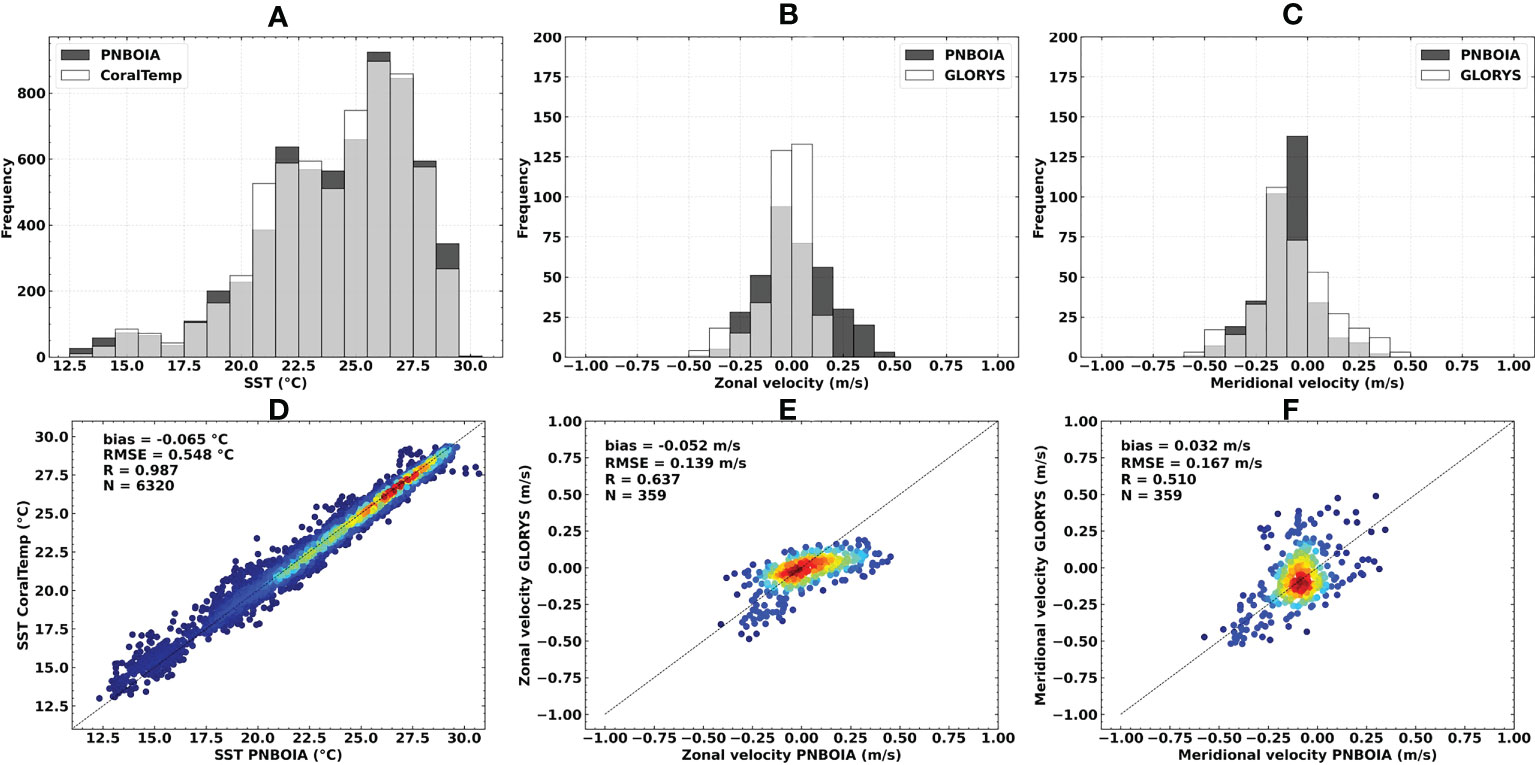
Figure 3 Sea surface temperature, zonal and meridional surface current velocities statistical comparisons in relation to in situ PNBOIA measurements: (A, D) CoralTemp SST (°C); (B, E) GLORYS12V1 ocean currents zonal velocity (m/s); (C, F) GLORYS12V1 ocean currents meridional velocity (m/s). N = number of observations. Warmer colors indicate higher data densities.
The larval dispersal simulations presented a kernel density < 10−4 for the major virtual larvae cloud release (see Supplementary Video S1). The highest values of kernel density (> 0.005) were observed in the first ten days, mostly along the inner continental shelf. Differences in the kernel dispersal distribution were also observed according to El Niño and La Niña years (see Supplementary Video S2). Simulations during 1993–2019 time-series and El Niño years were marked by an accentuated northward dispersion when compared to the simulations during La Niña years, mainly from the Northeastern, Fernando de Noronha-Atol das Rocas and Amazon ecoregions. The dispersion between the Eastern-central, Eastern-north and Northeastern ecoregions were also more accentuated during the 1993–2019 time-series and La Niña years when compared to El Niño years.
Connectivity patterns for the 1993–2019 time-series presented a distribution between all ecoregions, except for Trindade-Martim Vaz (Figure 4A). Greater connection probabilities (≥ 0.005) were observed for sites within the same ecoregion, reaching their maximum for the Eastern-center and Northeastern ecoregions. In general, all connection links between different ecoregions had probabilities ≤ 0.0001. During the El Niño years (Figure 5A) we observed a shutdown of connections between Fernando de Noronha-Atol das Rocas, Northeastern, and Eastern-north ecoregions. Its probabilities remained similar to the 1993–2019 time-series, presenting maximum values ≤ 0.005. In contrast, La Niña years presented a shutdown of connections between the Amazon, Northeastern, and Fernando de Noronha-Atol das Rocas ecoregions (Figure 6A). La Niña years were also marked by a high connection probability between the reef sites at the Eastern-center region ((≥ 0.01) and a decrease in connection probability with Eastern-south.
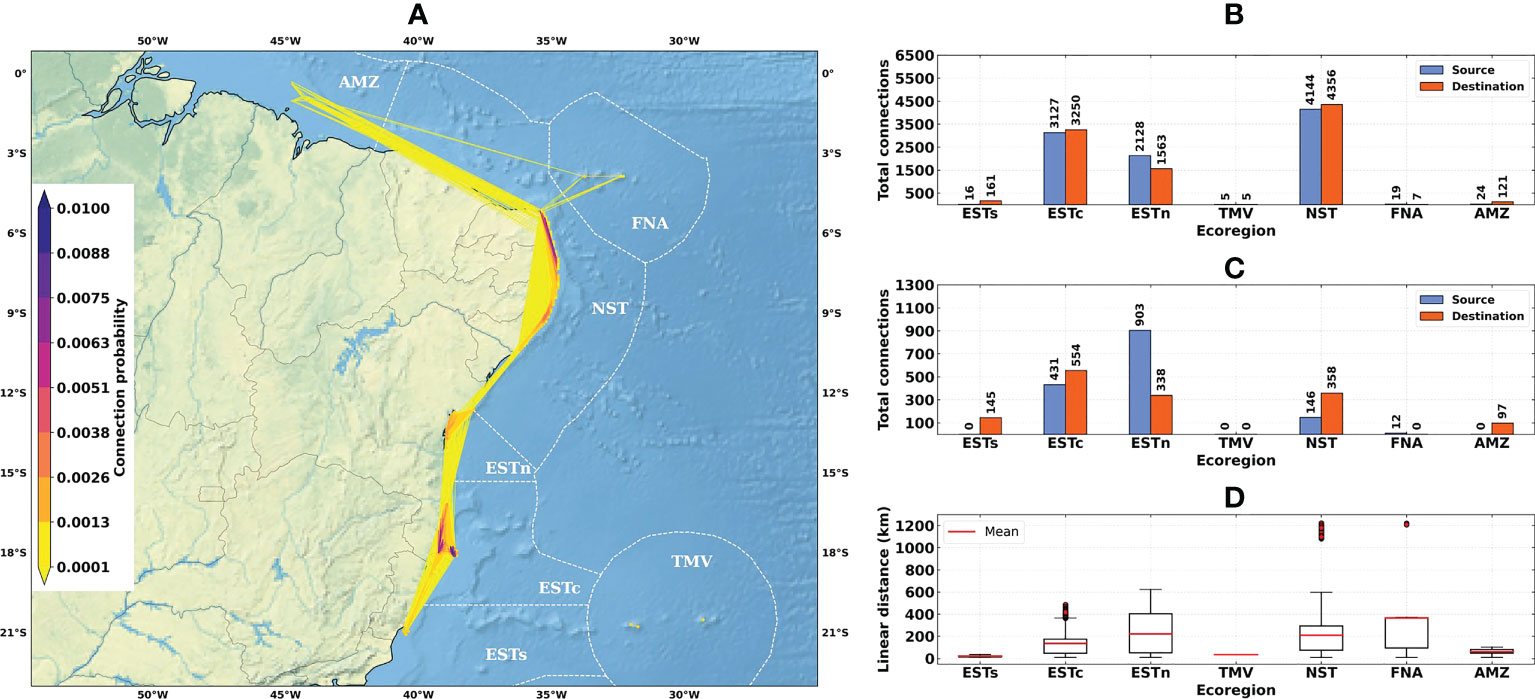
Figure 4 Connectivity patterns obtained from the larval connectivity model, considering the average of dispersal simulations between August–September–October for the 1993–2019 time-series: (A) Distribution of connection probabilities between reef sites; (B) Total number of connections given source (in blue) and destination (in orange) ecoregions; (C) Number of connections given source (in blue) and destination (in orange) ecoregions, disregarding connections between reef sites within the same ecoregion; (D) Linear distances from connections between the source and destination reef sites. Ecoregions: Eastern-south (ESTs); Eastern-center (ESTc); Eastern-north (ESTn); Northeastern (NST), Amazon (AMZ), Fernando de Noronha-Atol das Rocas (FNA), Trindade-Martim Vaz Islands (TMV).
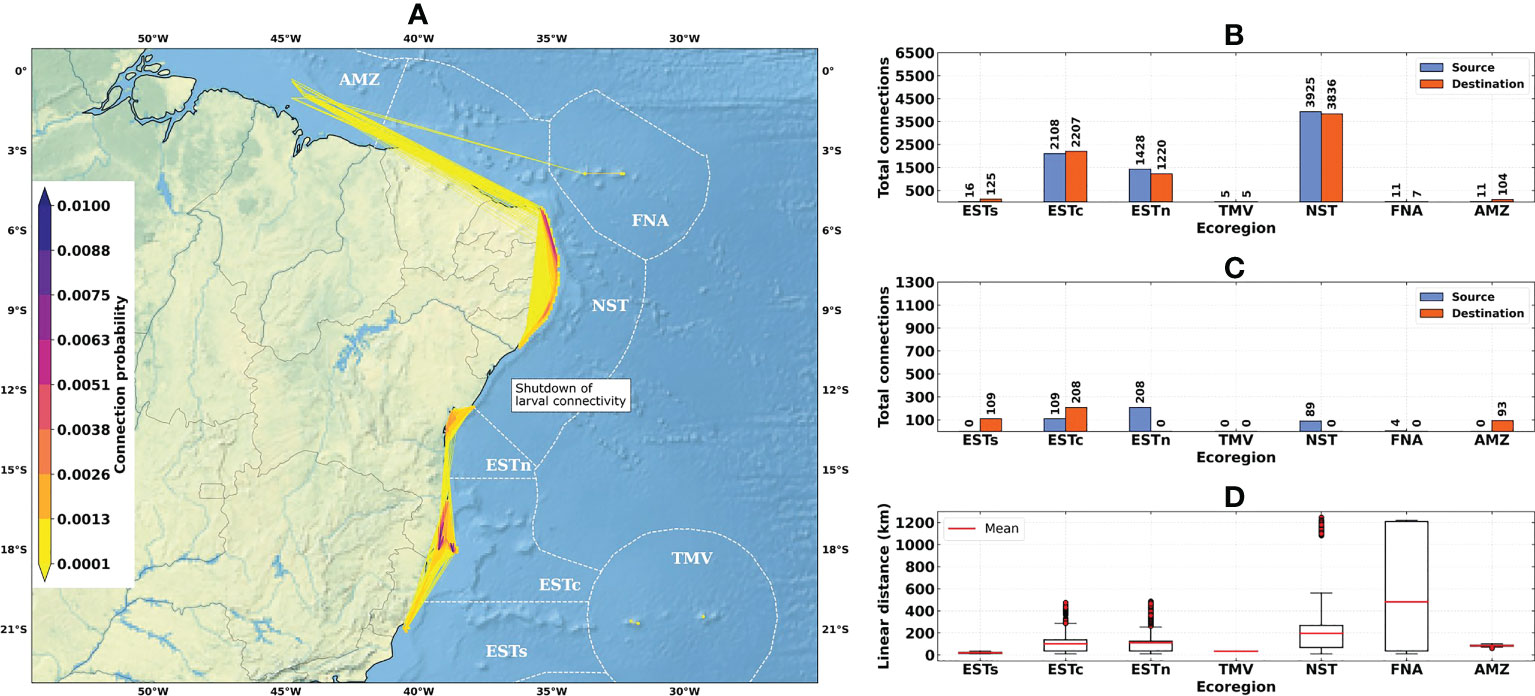
Figure 5 Connectivity patterns obtained from the larval connectivity model, considering the average of dispersal simulations between August–September–October for the El Niño years (1997–1998 and 2015–2016): (A) Distribution of connection probabilities between reef sites; (B) Total number of connections given source (in blue) and destination (in orange) ecoregions; (C) Number of connections given source (in blue) and destination (in orange) ecoregions, disregarding connections between reef sites within the same ecoregion; (D) Linear distances from connections between the source and destination reef sites. Ecoregions: Eastern-south (ESTs); Eastern-center (ESTc); Eastern-north (ESTn); Northeastern (NST), Amazon (AMZ), Fernando de Noronha-Atol das Rocas (FNA), Trindade-Martim Vaz Islands (TMV).
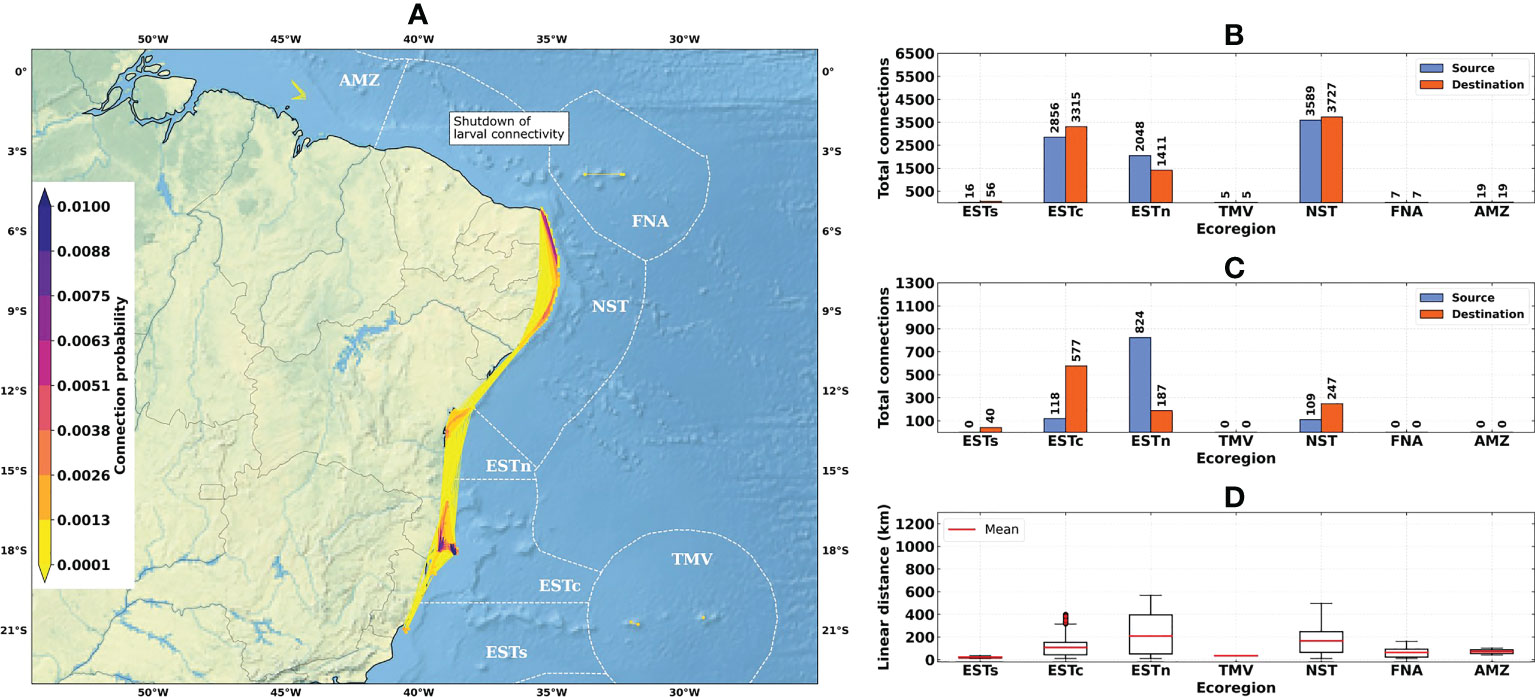
Figure 6 Connectivity patterns obtained from the larval connectivity model, considering the average of dispersal simulations between August–September–October for the La Niña years (1998–1999 and 2010–2011): (A) Distribution of connection probabilities between reef sites; (B) Total number of connections given source (in blue) and destination (in orange) ecoregions; (C) Number of connections given source (in blue) and destination (in orange) ecoregions, disregarding connections between reef sites within the same ecoregion; (D) Linear distances from connections between the source and destination reef sites. Ecoregions: Eastern-south (ESTs); Eastern-center (ESTc); Eastern-north (ESTn); Northeastern (NST), Amazon (AMZ), Fernando de Noronha-Atol das Rocas (FNA), Trindade-Martim Vaz Islands (TMV).
The total number of connections for the 1993–2019 time-series (N = 9463) was higher than for El Niño (N = 7504) and La Niña (N = 8540) years (Figures 4B, 5B and 6B). The higher numbers of connections were observed for the Northeastern, Eastern-center, and Eastern-north ecoregions. During the El Niño years, we observed a substantial decrease in the number of connections for Eastern-center and Eastern-north regions. Besides the changes in source and destination numbers for Northeastern, other ecoregions did not show relevant variations during these periods. Considering only connections established between different ecoregions, this number was drastically reduced, especially for El Niño years (Figure 5C). The total number of connections was 1492 for the 1993–2019 time-series, 410 for El Niño years and 1051 for La Niña years (Figures 4C, 5C and 6C).
Average connection distances were equivalent to 150 km for the 1993–2019 time-series, 146 km for El Niño years, and 95 km for La Niña years. Maximum distances were equivalent to 1222 km, 1246 km and 568 km, respectively (Figures 4D, 5D and 6D). Minimum distances correspond to self-recruitment and/or connections between neighboring reef sites (≤ 10 km). For the connectivity matrices, the greater values of relative contribution (i.e, number of successful connections per weighted probability) were observed within each ecoregion (Figure 7).
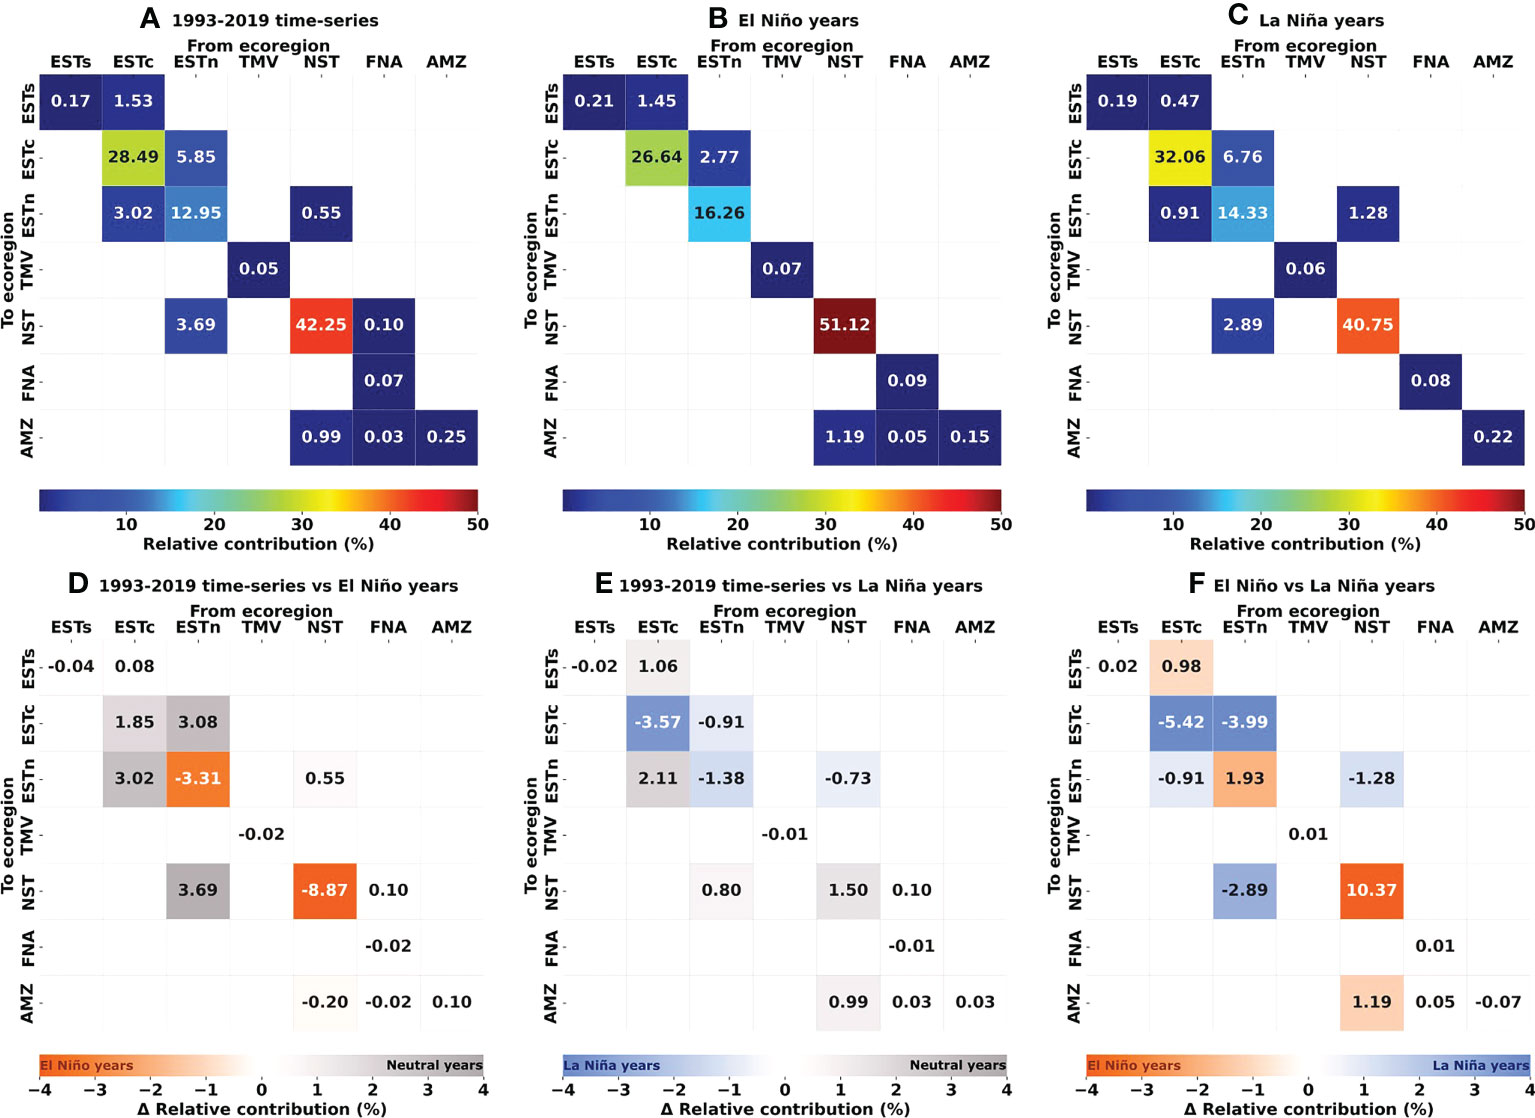
Figure 7 Connectivity and delta matrices showing the relative contribution (%) of source and destination ecoregions in larval dispersal, i.e, weighted number of reef sites connections per probability. (A) 1993–2019 time-series; (B) El Niño years (1997–1998 and 2015–2016); (C) La Niña years (1998–1999 and 2010–2011); (D) 1993–2019 time-series minus El Niño years; (E) 1993–2019 time-series minus La Niña years; (F) El Niño minus La Niña years. In (D–F), gray/blue/orange values indicate higher contribution during Neutral/El Niño/La Niña years, respectively. Ecoregions: Eastern-south (ESTs); Eastern-center (ESTc); Eastern-north (ESTn); Northeastern (NST), Amazon (AMZ), Fernando de Noronha-Atol das Rocas (FNA), Trindade-Martim Vaz Islands (TMV).
The Northeastern, Eastern-center, and Eastern-north ecoregions presented the highest values of self-recruitment, while the contribution percentages between these regions varied among periods, reaching values ≥ 50% in the Northeastern ecoregion during El Niño years. The highest relative contribution between two different regions was observed for Eastern-north and Eastern-center ecoregions, being 5.85% for the 1993–2019 time-series and 6.76% for the La Niña years.
The spatial distribution of thermal stress thresholds presented similar values for sites within the same ecoregion (Figure 8). TST values ranged from 26.50°C – 27.00°C in the Eastern-south ecoregion, 28.50°C – 29.00°C in the Amazon, and > 29.00°C in the Eastern-north, Northeastern, Fernando de Noronha-Atol das Rocas and Trindade-Martim Vaz ecoregions. The Eastern-center, Eastern-north, and Northeastern ecoregions showed the greatest variations of TST values, ranging from 27.50°C – 28.50°C in the Eastern-center, and 28.50°C – 29.50°C in Eastern-north and Northeastern ecoregions. The lowest and highest MMM mean values were observed in the Eastern-south (MMM = 25.53°C) and Fernando de Noronha-Atol das Rocas (MMM = 28.29°C) ecoregions, while the lowest and highest TST mean values were observed in the Eastern-south (TST = 26.75°C) and Trindade-Martim Vaz (TST = 29.38°C) ecoregions. TMV and Amazon ecoregions also showed the greatest and smallest differences for the TST and MMM mean values, being +1.47°C in the Eastern-south and +0.85°C in the Amazon ecoregion (see Supplementary Figure S3). Given the average SST time-series at each ecoregion, the highest number of the 12-week positive anomalies accumulation (DHW) had values above 4°C-weeks as observed for the Amazon ecoregion, which also presented the highest DHW intensity (> 16°C-weeks). In general, the highest DHW values were observed between 2010 and 2019. The year 1998 also presented a significant accumulation of more than 8°C-weeks in the Northeastern and Amazon ecoregions. The lowest accumulation of SST positive anomalies was observed for the Eastern-south ecoregion, in which the DHW values remained below 4°C-weeks during the entire 1993–2019 time-series (see Supplementary Figure S4).
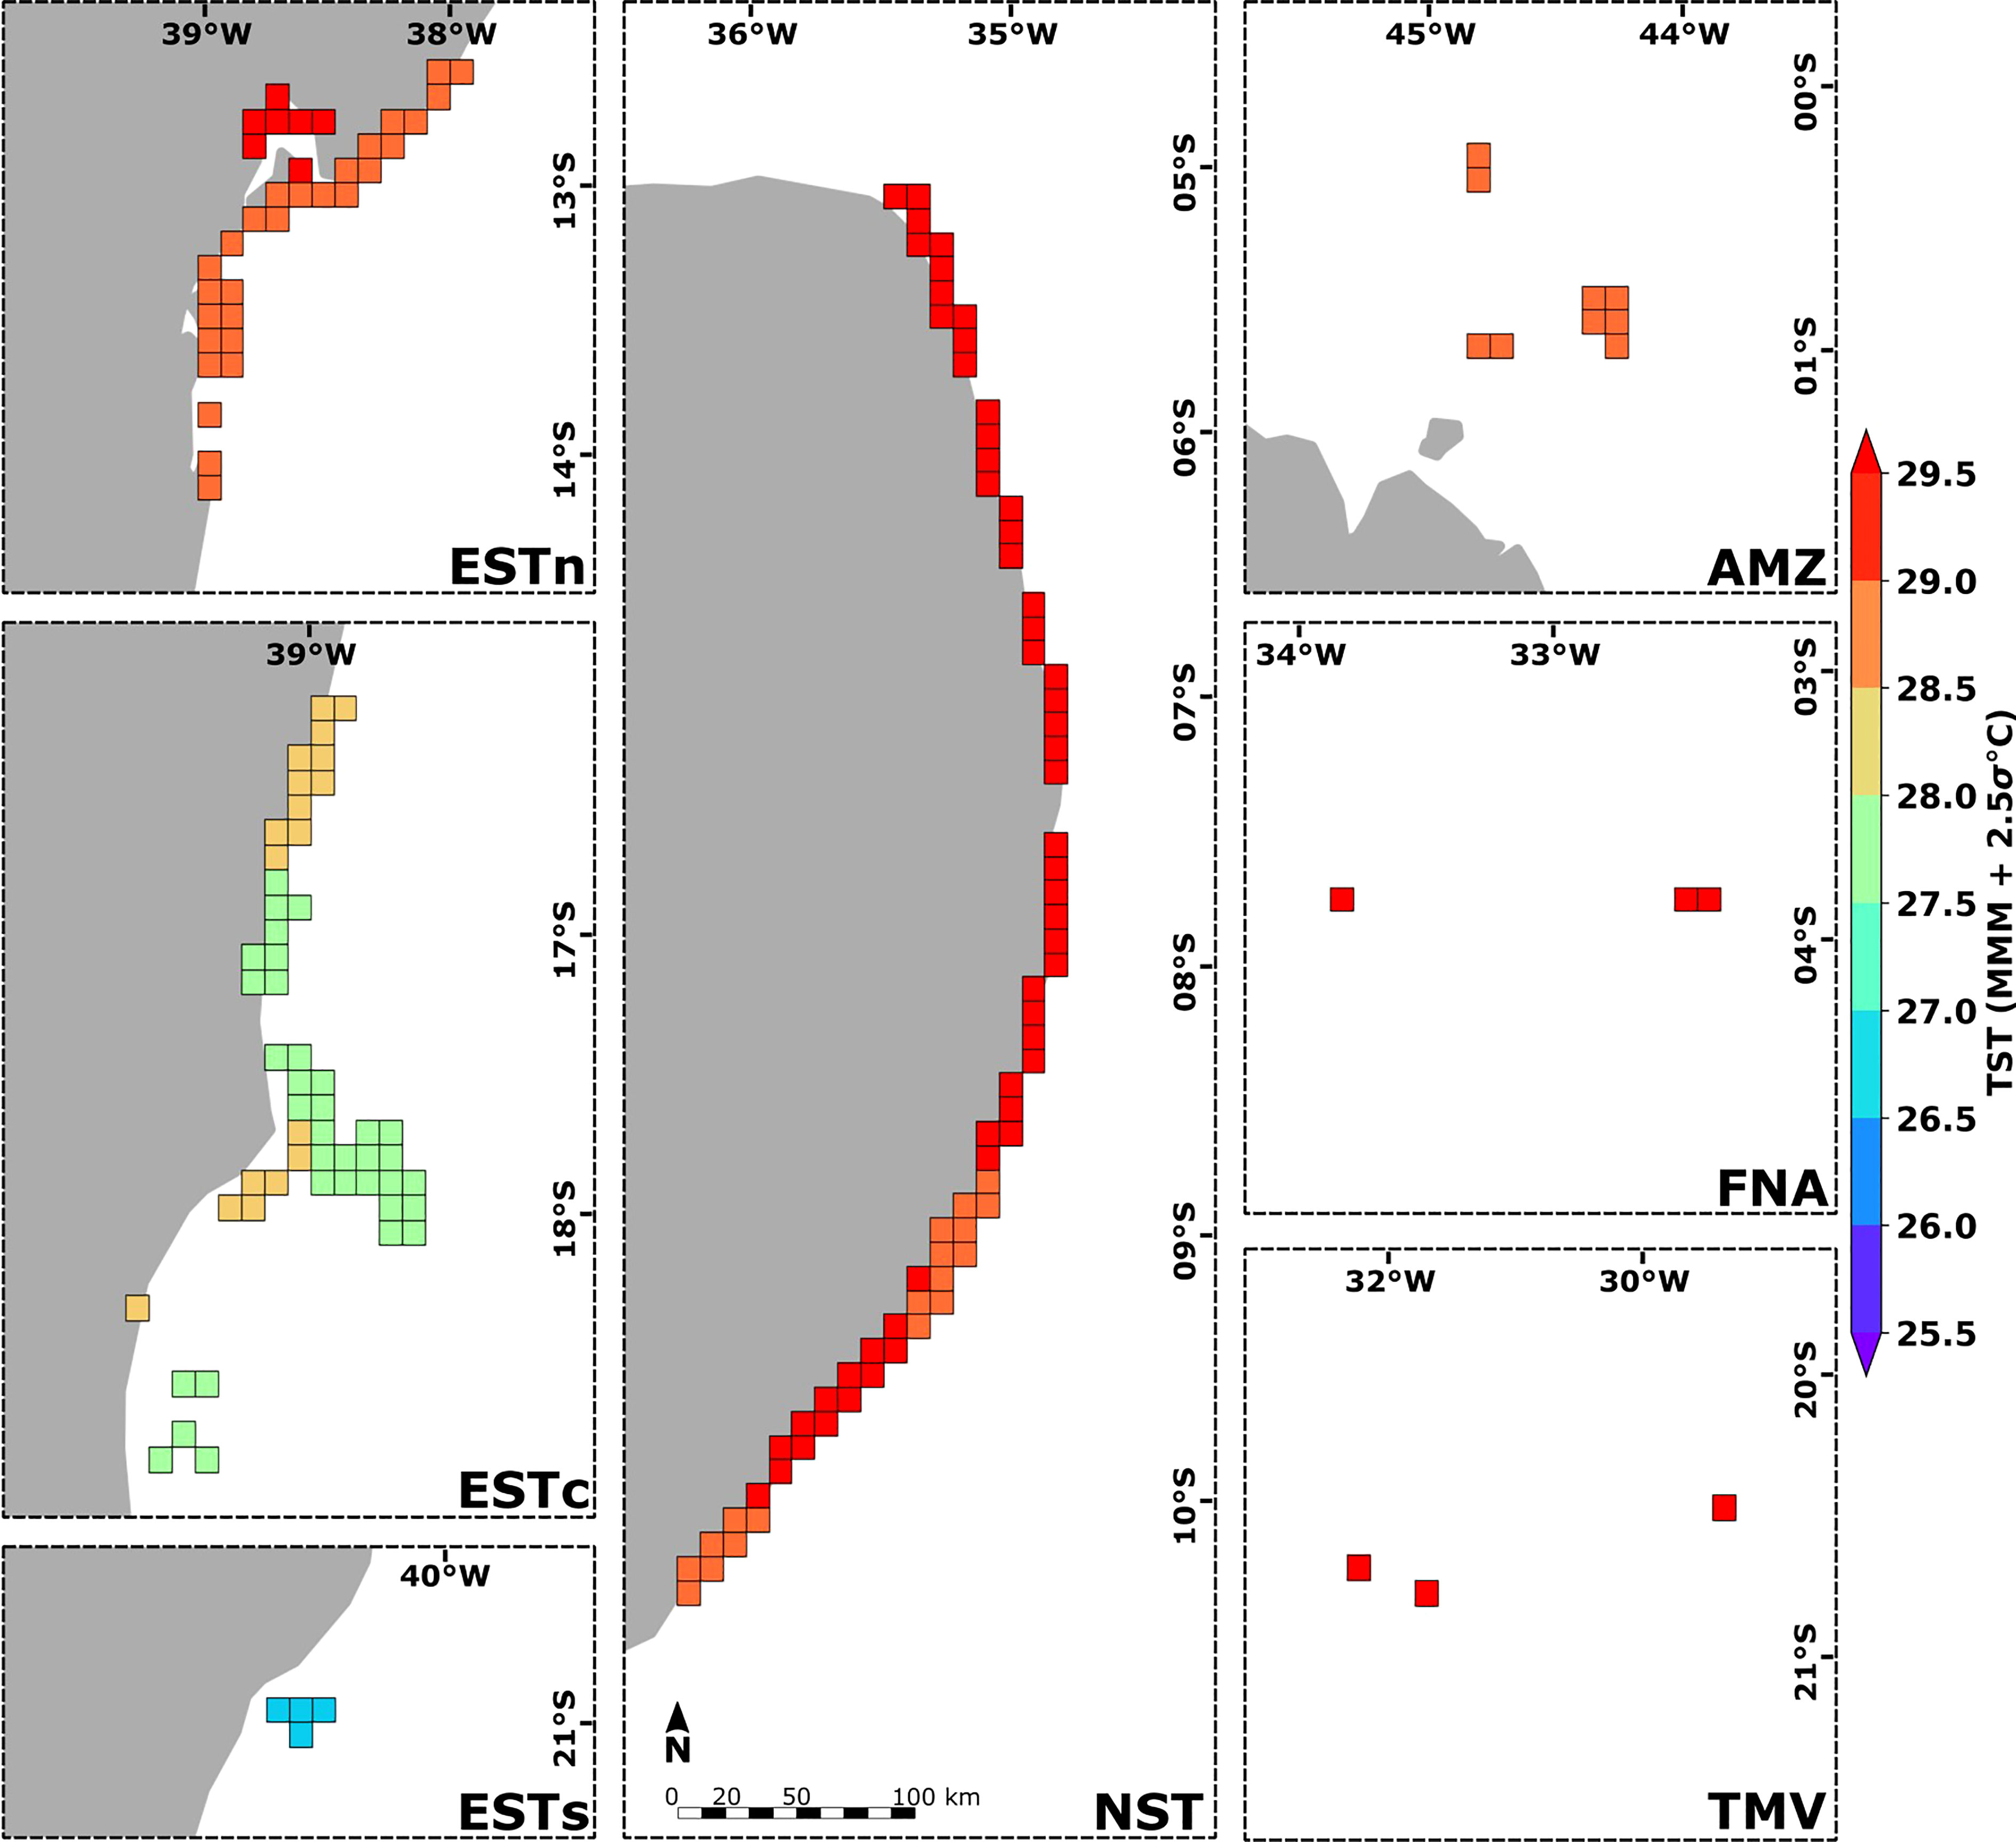
Figure 8 Spatial distribution of thermal stress thresholds (TST) calculated for the 180 reef sites along the Brazilian continental margin (in gray). Ecoregions: Eastern-south (ESTs); Eastern-center (ESTc); Eastern-north (ESTn); Northeastern (NST), Amazon (AMZ), Fernando de Noronha-Atol das Rocas (FNA), Trindade-Martim Vaz Islands (TMV).
Reef sites from the Eastern-south and Amazon ecoregions presented the greatest positive variation of TST values due to the influence of connectivity (ΔTST > 0.3°C) (Figure 9). The Eastern-center, Eastern-north and Northeastern ecoregions showed reef sites with maximum magnitudes of ΔTST around ± 0.2°C, although for most sites this variation was < ± 0.1°C. Sites with low connectivity interactions such as Fernando de Noronha-Atol das Rocas and Trindade-Martim Vaz ecoregions presented slightly smaller values, around ± 0.1°C. Considering the average of TST and TSTcp values at each ecoregion, the source reef sites in Eastern-south presented thermal stress thresholds contributions ranging from 26.50°C (∼ 40%), 27.00°C (∼ 35%) and 28°C (∼ 25%). In the Amazon ecoregion, the TSTs contributions varied between 28.50°C (∼ 25%) and 29.25°C (∼ 75%). The Eastern-center, Eastern-north, Northeastern, Fernando de Noronha-Atol das Rocas and Trindade-Martim Vaz ecoregions presented an almost null variation of TSTcp in relation to TST averages (see Supplementary Figure S5).
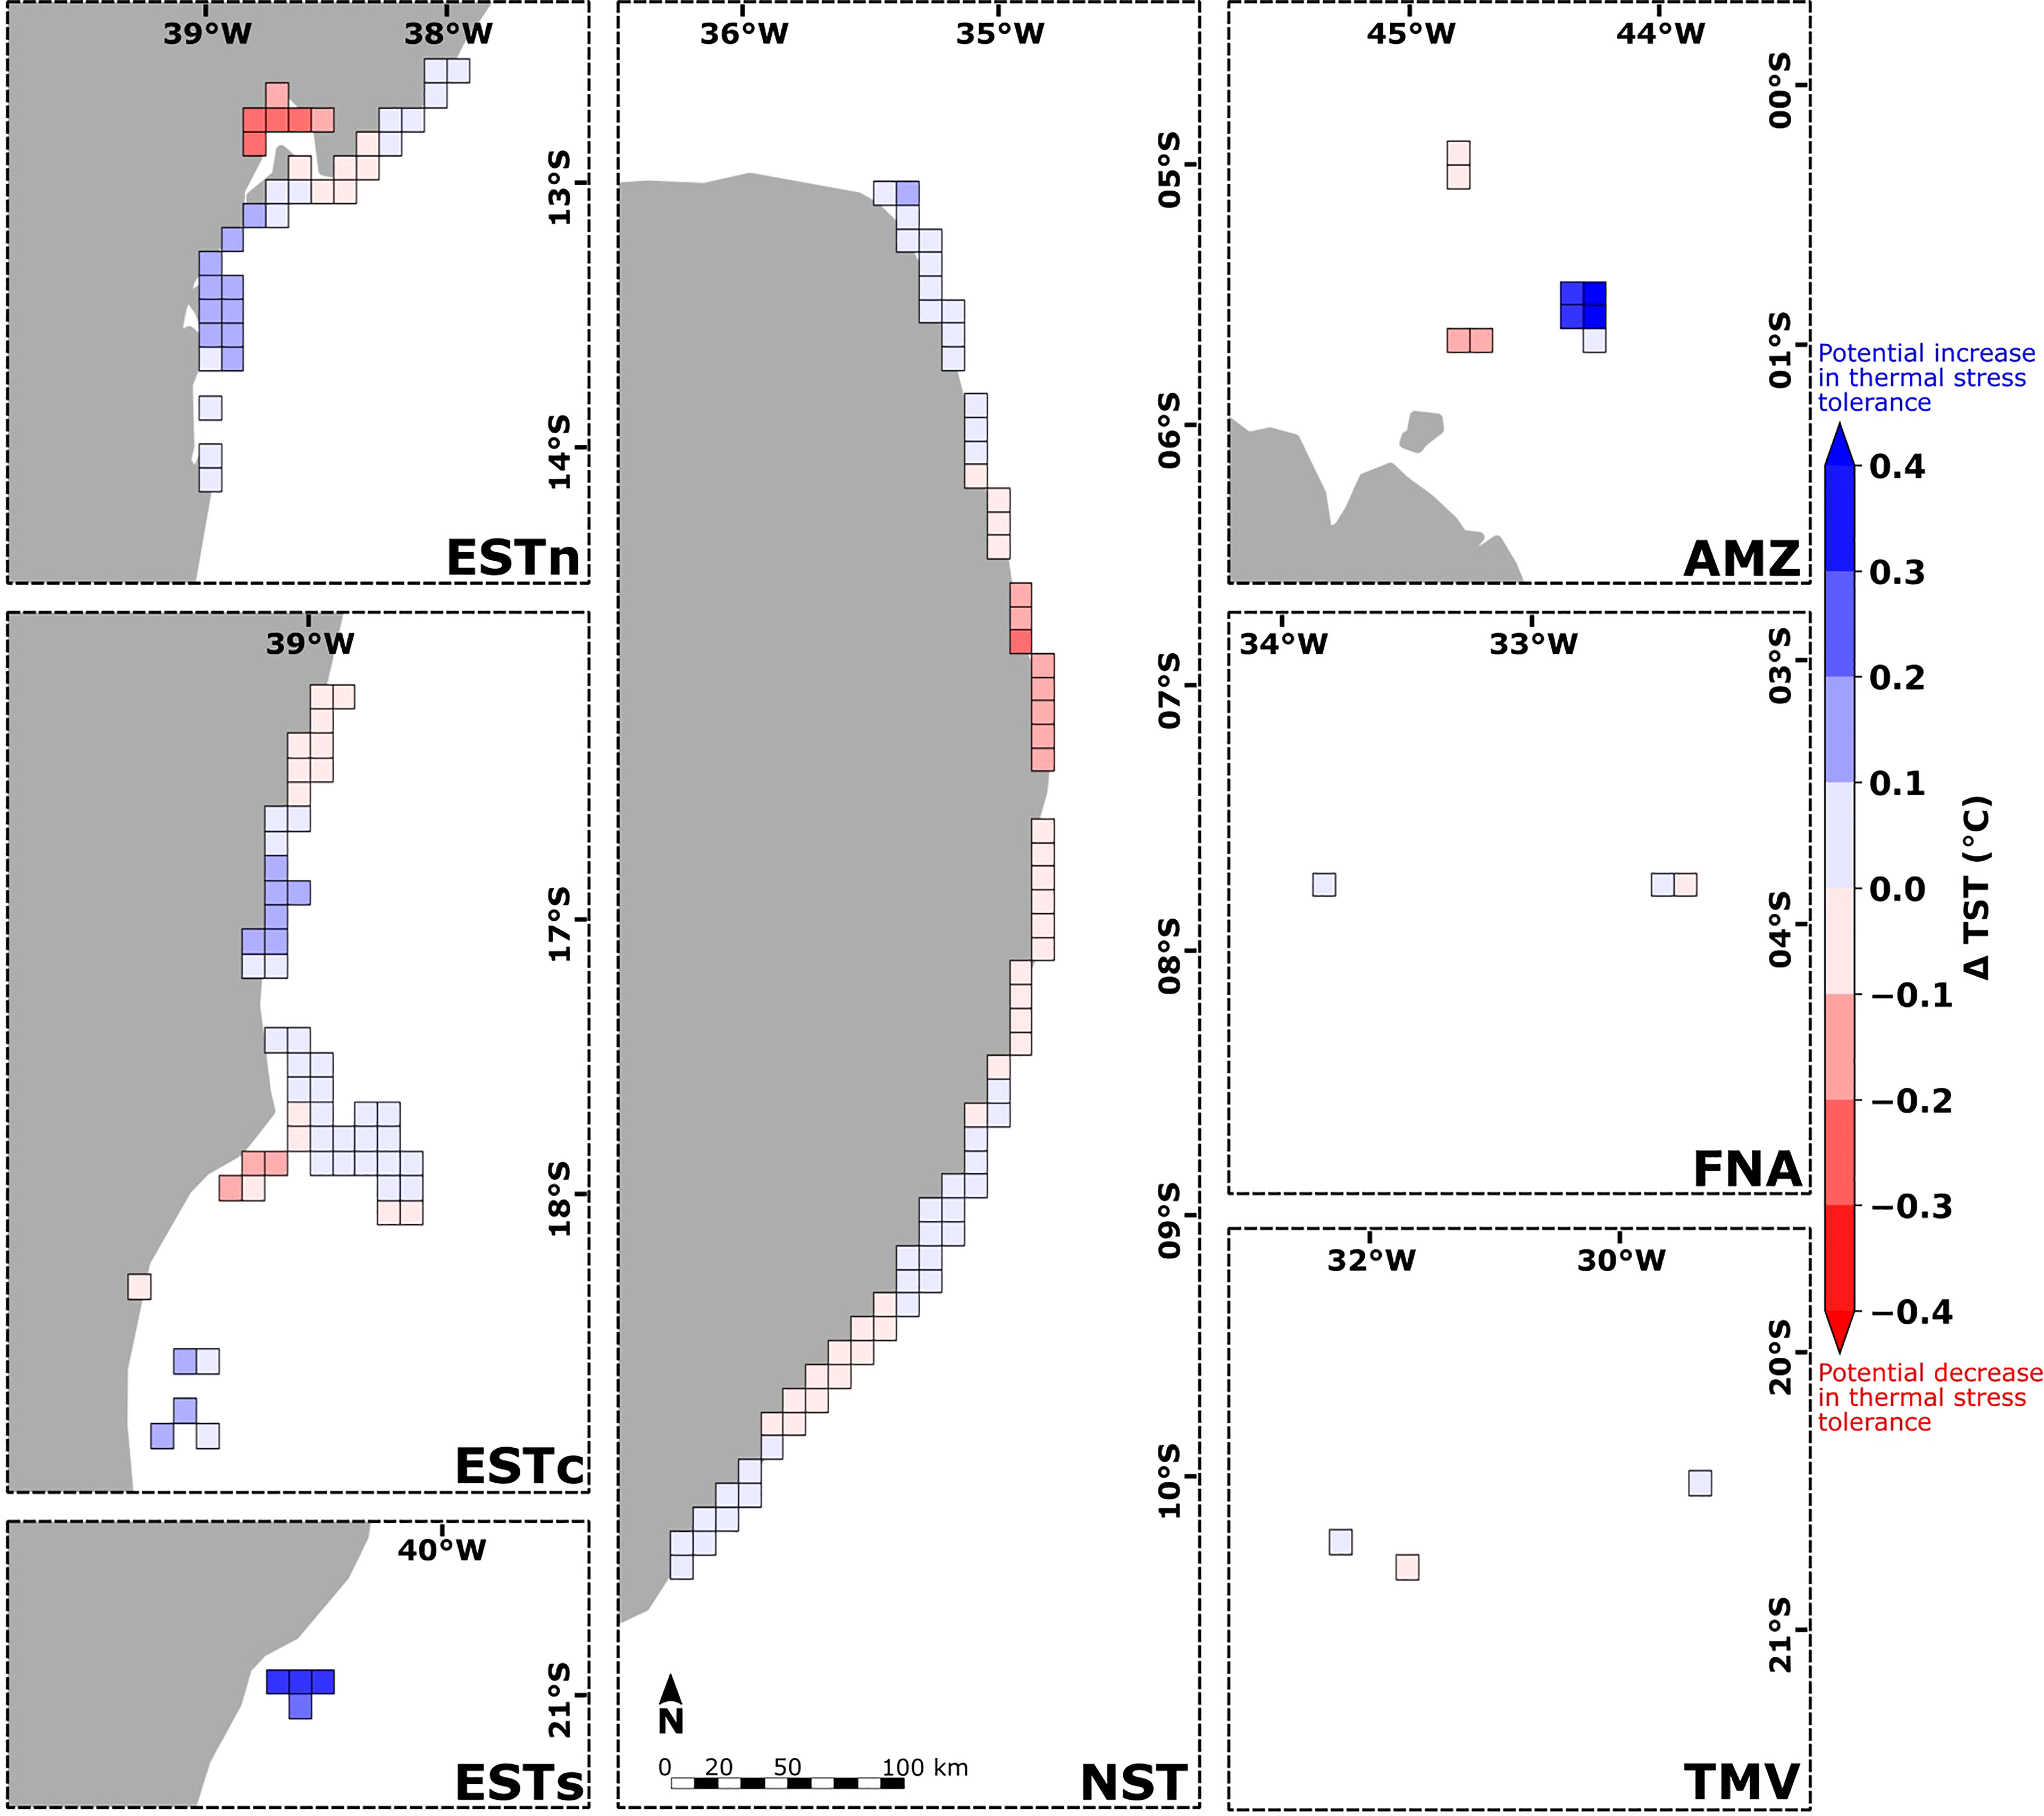
Figure 9 Spatial distribution of the difference between the thermal stress thresholds and connectivity-influenced TSTcp calculated for the 180 reef sites along the Brazilian continental margin (in gray). Blue and red colors indicate reef sites with potential increase and decrease in thermal stress tolerance, respectively. Ecoregions: Eastern-south (ESTs); Eastern-center (ESTc); Eastern-north (ESTn); Northeastern (NST), Amazon (AMZ), Fernando de Noronha-Atol das Rocas (FNA), Trindade-Martim Vaz Islands (TMV).
A total of 48 independent bleaching events were reported in the literature during 1993–2019, in comparison with 50 and 48 estimations with and without connectivity, respectively (Figure 10). The severity of reported events classified according to the ReefBase protocol varied from 19 mild bleaching, 14 moderate bleaching, and 15 severe bleaching events. No connectivity-influence severity varied from 33 mild bleaching, 11 moderate bleaching and only 4 severe bleaching events. The connectivity-influenced severity varied from 32 mild bleaching, 13 moderate bleaching and 5 severe bleaching events. The number of bleaching events between the estimated and reported events were particularly higher for the Eastern-center, Eastern-north and Northeastern ecoregions.
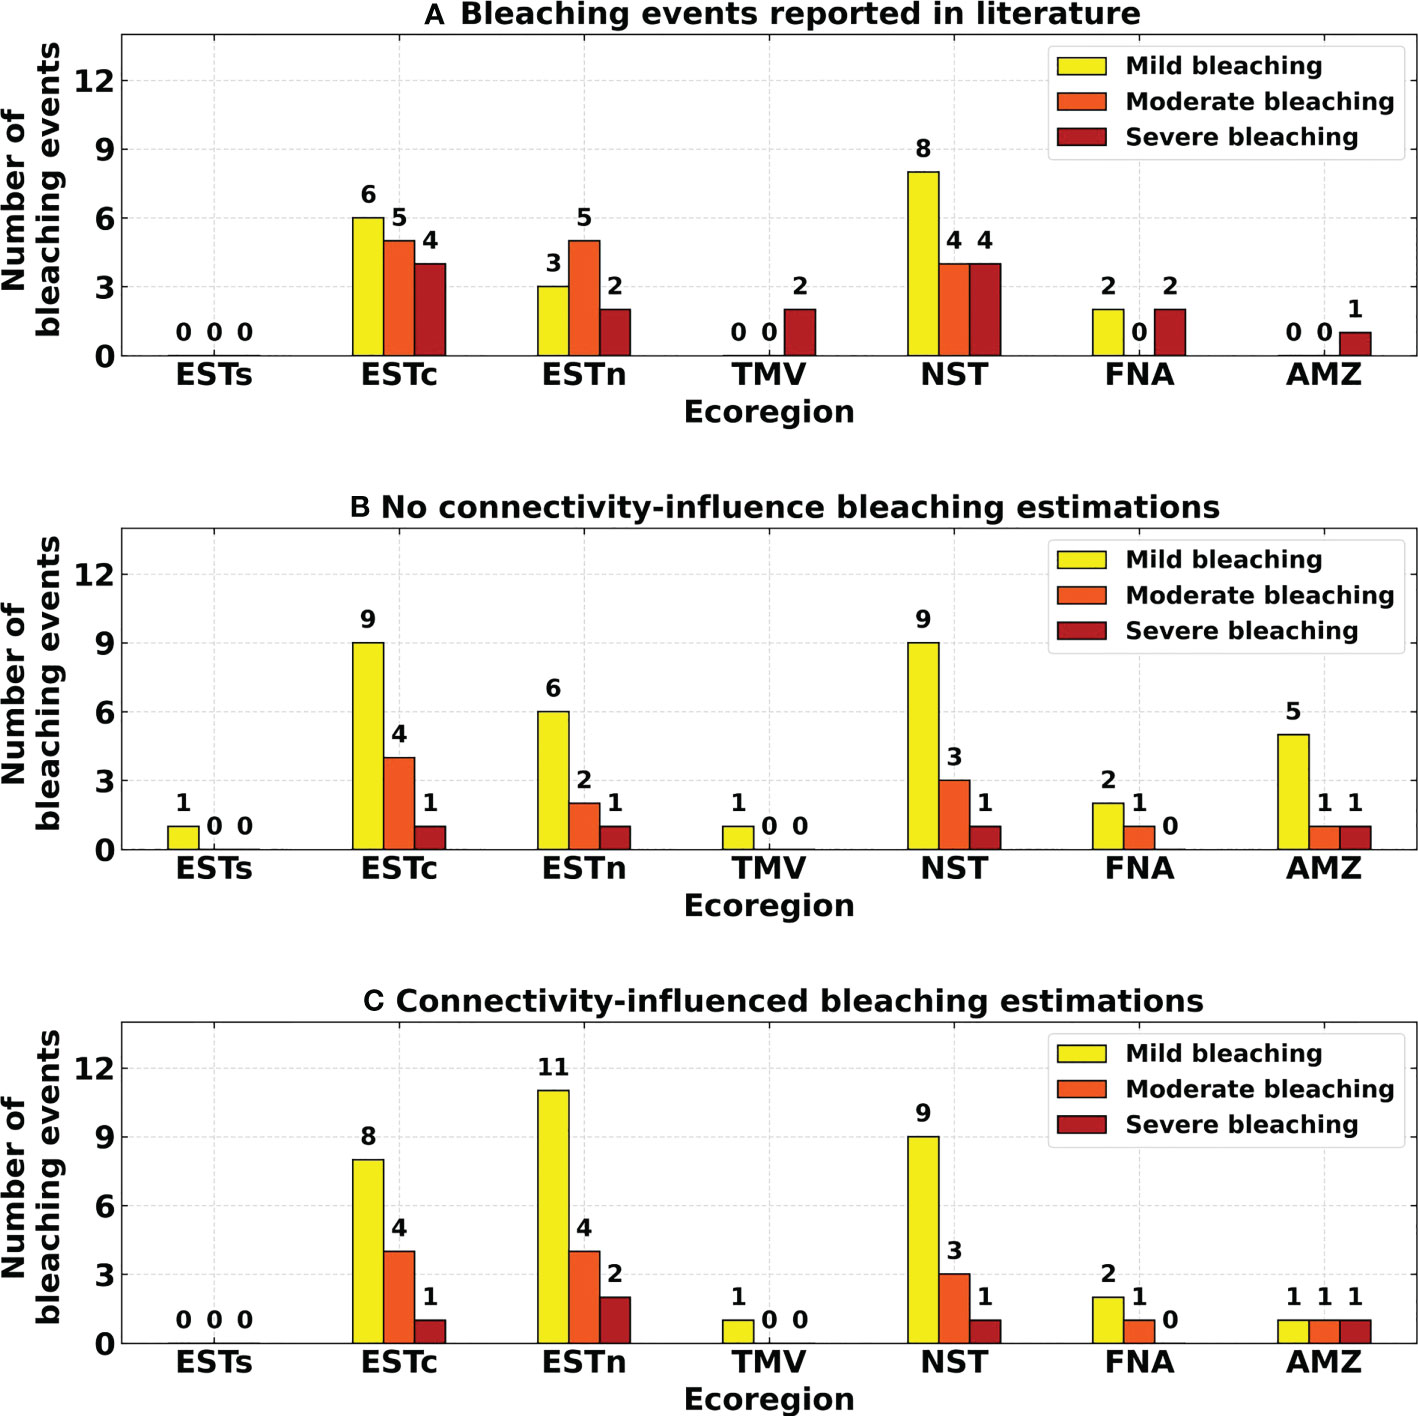
Figure 10 Number and severity of bleaching events for each ecoregion: (A) Bleaching events reported in the literature; (B) No connectivity-influence estimated bleaching events; (C) Connectivity-influenced estimated bleaching events. Ecoregions: Eastern-south (ESTs); Eastern-center (ESTc); Eastern-north (ESTn); Northeastern (NST), Amazon (AMZ), Fernando de Noronha-Atol das Rocas (FNA), Trindade-Martim Vaz Islands (TMV).
Although the total number of bleaching events was the same for the reported and no connectivity-influence events, greater absolute errors were obtained when comparing each ecoregion, especially after weighting the number of bleaching occurrences according to their severity. The absolute errors from the weighted bleaching events were smaller for connectivity-influenced estimations regarding mild bleaching in the Eastern-south, Eastern-center and Amazon ecoregions. Moderate and severe bleaching also presented a decrease in the Eastern-north region for connectivity-influenced estimations, although errors were higher for mild bleaching events. All other ecoregions presented the same values of absolute errors (Figure 11). The statistical comparison through Sign test showed that connectivity-influenced estimations were significantly closer to reported observations than no connectivity-influence estimations (p-value = 0.01562). Comparing the total absolute errors of the two estimation methods through Wilcoxon signed-rank test, also showed that connectivity significantly decreases absolute errors in comparison to no connectivity-influence estimations (p-value = 0.04876).
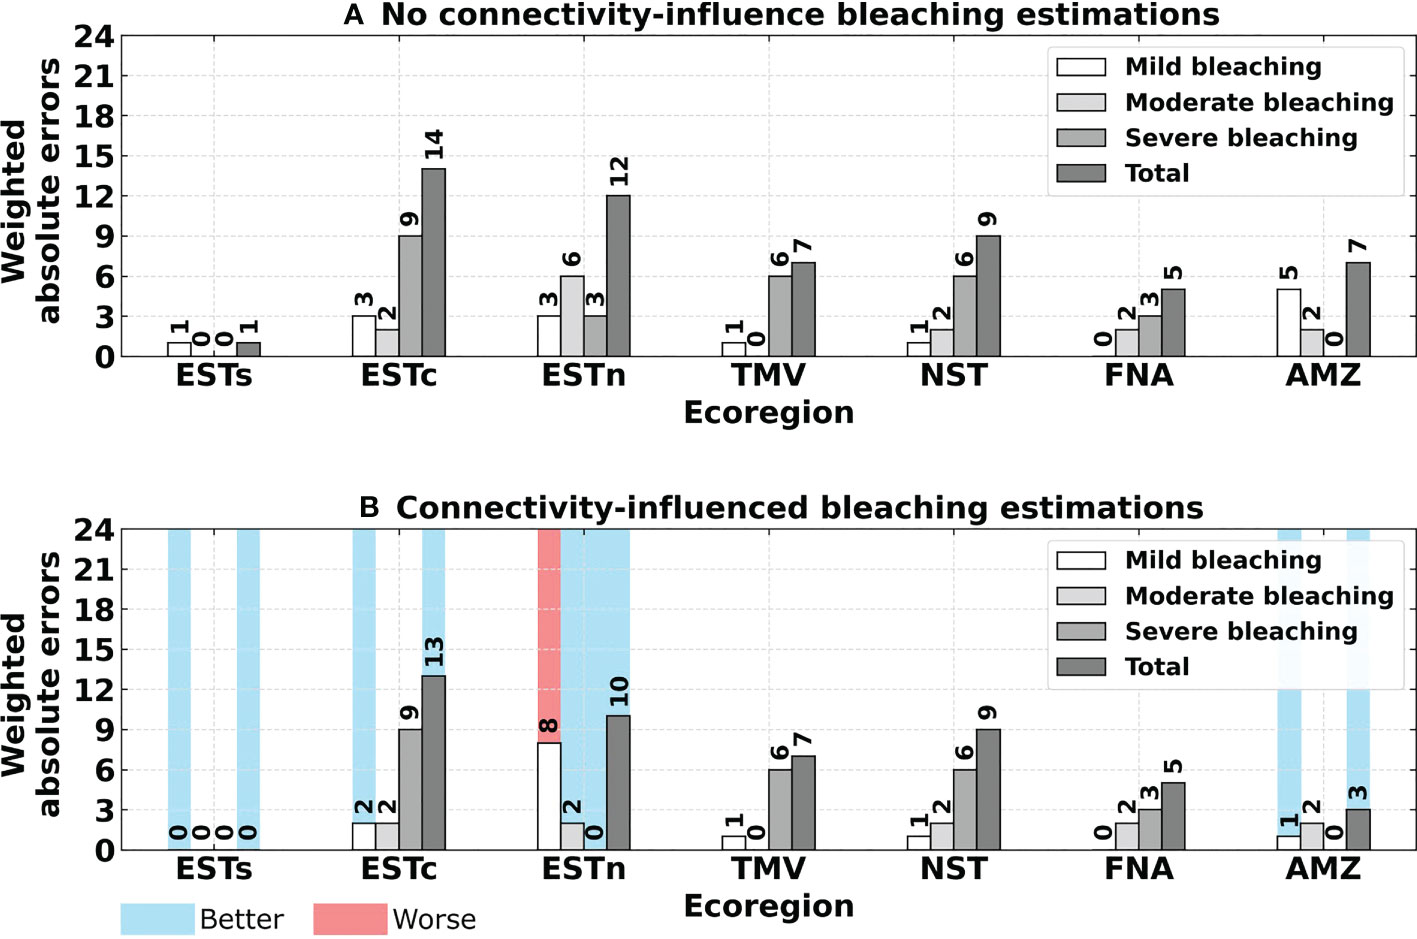
Figure 11 Absolute errors obtained for estimated bleaching events compared to reported bleaching events, as follows: (A) No connectivity-influence estimated bleaching events; (B) Connectivity-influenced estimated bleaching events. Values highlighted in blue and red indicate a better or worse bleaching estimate regarding the connectivity influence, respectively. Ecoregions: Eastern-south (ESTs); Eastern-center (ESTc); Eastern-north (ESTn); Northeastern (NST), Amazon (AMZ), Fernando de Noronha-Atol das Rocas (FNA), Trindade-Martim Vaz Islands (TMV).
The connectivity patterns obtained from larval dispersal simulations during the 1993–2019 time-series are the first assessed results for Brazilian coral reefs considering a broad time scale, i.e., 27 years. A time scale > 20 years is essential for capturing the true connectivity variability through biophysical simulations (Thompson et al., 2018). In general, the larval dispersion kernel obtained from the computational model obeys the surface ocean currents dynamics along the Brazilian continental margin, resulting in widespread connectivity across the reef sites (Figure 1). This overall connectivity pattern were disrupted during ENSO events, resulting in the shutdown of connections between Eastern and Northeastern ecoregions during El Niño periods (Figure 5), and between Northeastern and Amazon ecoregions during La Niña periods (Figure 6). In general, these results agree with the local TST distribution and the regional ocean currents dynamics, which transport larvae from reef sites more acclimatized to thermal stress to sites with lower TST values (Figures 8, 9). Given that the incorporation of connectivity significantly improved bleaching estimations at ecoregions receiving larvae from sites with higher TST values, these results present important evidence as to how connectivity can shape the thermal tolerance for Brazilian coral reefs, given the genetic inheritance of dispersed larvae from different thermal stress conditions (Dixon et al., 2015; Kleypas et al., 2016).
The validation of the products used for assessing the connectivity patterns and their potential influence on thermal stress tolerance indicated a satisfactory representation of regional sea surface temperatures and ocean currents dynamics along the BCM (Figure 3). Other studies also indicated a good correlation of CoralTemp SST with in situ and satellite derived temperature measurements (Claar et al., 2019; DeCarlo, 2020; Gomez et al., 2020), as well as its effectiveness in assessing the occurrence of bleaching events (Kumagai and Yamano, 2018; Liu et al., 2021a). Despite the moderate correlation presented by GLORYS12V1 ocean currents data, the number of in situ measurements available for comparison was relatively limited (N = 359) and prevented a more robust comparison. Relatively, larger differences were observed in the comparisons using altimeter data in regions with higher variability (see Supplementary Figures S4, S5), but agrees with other validation results for most of the study area (Luko et al., 2021).
Given the dominant ocean currents in the BCM, the cloud of virtual larvae released from the Eastern-south and Eastern-center ecoregions followed the Brazil Current southwards, while those released from the Northeastern, Fernando de Noronha-Atol das Rocas and Amazon ecoregions followed the North Brazil Current northwards (Figure 1). For the Eastern-north ecoregion, a dispersion in both directions was observed, justified by the bifurcation of the South Equatorial Current southern branch around 10°S–15°S, merging into the BC and NBC (Stramma and England, 1999). Finally, the Trindade-Martim Vaz ecoregion presented a predominant dispersion westwards, associated with the multi-band character of the SSEC around 20°S (Luko et al., 2021). Other relevant factors for larval dispersal along the BCM are the meanders and vortices generated by interactions of ocean currents with topographic features and barotropic instabilities (Silveira et al., 2000; Soutelino et al., 2013; Simoes-Sousa et al., 2021).
Connectivity patterns correspond with M. hispida gene flow along the BCM region (Peluso et al., 2018). In general, larvae are dispersed southwards for Eastern regions and northwards for Northeastern regions. During El Niño years, the shutdown of connections between the Northeastern and Eastern-south ecoregions can be explained by the migration of the Intertropical Convergence Zone (ITCZ) towards the north (Xavier et al., 2003). This migration shifts the SSEC bifurcation to the south, similarly to what is observed during austral winter (Rodrigues et al., 2007). Therefore, larvae from the Eastern-north ecoregion are captured by the southward flow of the Brazil Current, while larvae from the Northeastern ecoregion are captured by the northward flow of the North Brazil Current. The seasonal migration of the ITCZ has already been reported to influence the dispersion of the invasive sun-coral larvae (Tubastraea spp.) along the Brazilian continental margin (Coelho et al., 2022). In addition, there seems to be a strong competition between M. hispida and sun-coral species, which can lead to substantial changes in massive reef-builder communities in the region (dos Santos et al., 2013).
This variability in connectivity patterns and relationships with surface ocean and atmospheric circulation can also be noted by the decrease in the number of connections for the Eastern-north and Northeastern ecoregions (Figures 5B, 6B). The weakening of the trade winds observed during El Niño years (Hartmann, 2015) can be associated with the high larval retention observed during these periods, given the drastic decrease in the number of inter-ecoregion connections (Figure 5C) and the increase in the relative contribution of intra-ecoregion sources (Figure 7). The increase in sea surface temperature during El Niño years, which is often related to the occurrence of bleaching events along the BCM (Lisboa et al., 2018; Teixeira et al., 2019), can also be associated with the observed larval retention. Under higher temperature conditions the coral’s pelagic larval duration is usually shortened, and hence the larvae would disperse for smaller distances (Edmunds et al., 2001). Other ENSO-dependent variables such as ocean acidification also affect the different stages of the coral life cycle and may therefore affect connectivity through survivorship and growth (Jokiel et al., 2008).
As the connectivity patterns reflect the potential larvae exchange between reefs acclimatized to different SST regimes, the variation of thermal stress thresholds agrees with the major dispersal pathways presented. The highest positive variation of thermal stress thresholds was observed for reef sites in both latitudinal limits, such as in the Eastern-south and Amazon ecoregions, where the contribution from reef sites more acclimatized to thermal stress was greater (Figures 8, 9). The obtained TST and TSTcp distribution may be explained by several local factors, which may be difficult to completely describe given the long linear nature of the coastline, but is essentially linked to two major factors: (i) the poleward larval transport by the Brazil Current (as for the Eastern-south reef sites), and (ii) the larval transport from coastal reef areas to offshore areas by the North Brazil Current (as for the Amazon reef sites). In the reef sites with the highest negative variation of TST, such as in the Eastern-north, a more confined connectivity pattern was observed with greater larval contribution from reef sites of the same ecoregion (see Supplementary Figure S5).
The comparison of reported bleaching events against the thermal stress estimations presented some differences regarding the number of occurrences and maximum severity (Figure 10). These discrepancies are considered somewhat common or expected, given that global bleaching estimations based on SST are unable to perfectly agree with reported events at the local level (Boylan and Kleypas, 2008). However, thermal stress indices still remain one of the most effective methods for detecting bleaching events, especially in cases of moderate and severe bleaching (Kayanne, 2017). Our results indicate that remotely sensed estimations, either with or without connectivity, tend to overestimate the occurrence of mild bleaching events in the study area, given the increase of > 43% in mild bleaching estimations when compared to reported events. In contrast, the number of severe bleaching events reported in the literature was unexpectedly higher than those estimated based on SST anomalies. This discrepancy reasserts that thermal stress is not solely responsible for the occurrence of bleaching events along the BCM.
Estimations of bleaching events in the study area based on thermal stress indices have already been discussed as less accurate when compared with other regions of the global ocean, given the apparent natural resilience of the Brazilian coral reefs to SST anomalies (Banha et al., 2020; Mies et al., 2020). Major coral stressors in the region are also the water turbidity and sedimentation load conditions (Freitas et al., 2019; Loiola et al., 2019). The incorporation of bleaching indices based on these environmental variables might improve the accuracy of remotely-sensed bleaching estimations in the BCM, allowing even its association with connectivity patterns for the construction of a more robust bleaching detection model. Other environmental factors such as wind stress and ultraviolet radiation can also impact on coral health (Zhou et al., 2017; Paparella et al., 2019), although their relation with coral bleaching has not yet been properly assessed in the BCM region.
The overestimation of bleaching events in certain ecoregions may also be associated with the absence of adequate monitoring, given that although bleaching observations in BCM date back to 1993 (Migotto, 1997), a Brazilian national reef monitoring network was established only in 2000 (Ferreira and Maida, 2006). This lack of proper monitoring in previous years (1993–1999) may have resulted in unreported events in the literature, especially considering the occurrence of a global mass bleaching episode during the 1997–1998 El Niño event (Wilkinson, 1998). Therefore, it is important to note that just because a bleaching event was not observed and therefore not recorded, it does not mean that bleaching didn’t occur. We suggest that monitoring efforts must always be conducted to adequately record the occurrence of bleaching events in the region. Given the long linear nature of the BCM coastline, where specific local factors may change the severity of bleaching estimations, it could even be possible to use a Page-Rank measure to calculate the flow on effects (Brin and Page, 1998). So for example, if a reef j is isolated from the connectivity then its impact on i would be less from a long-term perspective.
Although the aim of this study was not to improve the accuracy of bleaching estimations regarding the influence or not of the connectivity per se, the comparison of these estimations reflects whether the connectivity may potentially shape the thermal stress tolerance in the region. The absolute errors obtained from the connectivity and no connectivity bleaching estimations present possible answers for this hypothesis (Figure 11). The statistical tests performed showed that connectivity-influenced estimations were significantly closer to reported events than no connectivity-influence estimations. Therefore, these results support the hypothesis that connectivity can display an important role on thermal stress tolerance among reef populations, as proposed by Kleypas et al. (2016).
The influence of connectivity on thermal stress tolerance is based on the dispersed larvae genetic inheritance from its local parents (Dixon et al., 2015). Therefore, thermal tolerance is associated with numerous cellular processes in coral's structure and its genes categories, such as stress enzymes, apoptosis regulators and even proteins (Barshis et al., 2013). From an evolutionary perspective, adaptation to thermal stress is usually determined by the outcome of divergent selection (Porcelli et al., 2015). These specific physiological traits can be tested to verify different coral responses to thermal stress conditions. Therefore, integrating the modeled connectivity influence on thermal stress tolerance with future approaches regarding coral’s temperature genetic inheritance may present an even more solid evidence for the discussed hypothesis. Still, the shutdown of connectivity links between ecoregions during ENSO events may represent a relevant interference in coral’s genetic trade between reef sites, specially for the Eastern-north, Northeastern and Amazon ecoregions. This could potentially impact genetic transfer, which may had resulted in the absolute errors observed for these ecoregions in certain cases.
A robust sensitivity analysis of the obtained connectivity patterns would also be helpful in addressing the major biological drivers for defining connectivity relations (Treml et al., 2015a) and thus influencing the variation of thermal stress tolerance in the study region. Future studies should be conducted to better understand how different life-history traits affects the initial hypothesis as here proposed and discussed. It is also important to note that thermal stress affects each coral species differently, given that a large variation in bleaching rates was observed during one of the largest thermal stress events ever recorded in the Brazilian continental margin (DHW > 19°C-weeks), ranging from 80% to none bleaching occurrence depending on the spp. (Duarte et al., 2020). In this way, although the use of M. hispida as a representative species presents a certain limitation to the analysis of bleaching comparisons, it still remains especially valid when considering that this species is one of the major coral reef builders in the South Atlantic Ocean. An effective way to overcome this limitation would be to compare only bleaching occurrences for a single species or spp. with similar biological characteristics. However, the limited number of published reports in this study region still prevents this comparison. The use of more than one representative species in the analysis could also increase the accuracy of bleaching event estimates, if more data were available. However, this approach would be computationally expensive when analyzing longer time periods, as considered in the present study.
Other limitations regarding the present approach consist of the availability of coral reef mapping data and the spatial resolution for connectivity modeling. Given the particular characteristics of some Brazilian reefs, i.e., associated with turbid and mesophotic waters, new coral ecosystems along the Brazilian continental margin continue to be discovered up to this day (Negrão et al., 2021). The absence of existing reef areas in the computational modeling can potentially decrease the accuracy of larval dispersal simulations, especially when considering the importance of stepping-stone reefs that sustain and promote regional connectivity (Liu et al., 2021b). The use of high-resolution connectivity modeling could also help coral reef mapping approaches by predicting reef growth trajectories (Zoffoli et al., 2022). Ultimately, these new advances will come in hand with regional management of coral reefs and a more in-depth discussion on connectivity relationships with thermal stress tolerance at local scales.
The influence of connectivity patterns of Brazilian coral reefs on the variation of thermal stress tolerance supported by these communities was evaluated for the first time using a biophysical model and SST data in a 27-year time-series, from 1993–2019. Our results indicated that connectivity-influenced coral bleaching estimations agree significantly better with reported observations, when compared with the estimations not considering the connectivity. These results can be considered as evidence that the coral larval dispersion between coral reefs under different SST conditions has the potential to modify local thermal stress tolerance. This is a relevant assessment considering the present ocean warming scenario and the efforts required for the management of Brazilian coral reefs.
Some limitations found in the development of this study can be improved with the use of more advanced biophysical models and processing capabilities, allowing more extensive larval dispersal simulations for several coral species simultaneously. The availability of a georeferenced coral bleaching database for the Brazilian continental margin region would also improve the comparison of bleaching estimates with in situ observations. Our findings also presented a statistical validation of CoralTemp SST and GLORYS12V1 ocean currents products, highlighting their potential uses in future studies on coral bleaching and connectivity modeling in the study region.
Finally, the differences in connectivity patterns found between the 1993–2019 time-series and years of ENSO events indicate that the migration of the South Equatorial Current may have a relevant role in decreasing the contribution of inter-ecoregion larvae. Given possible shifts in South Atlantic surface circulation as a consequence of global climate change (Sen Gupta et al., 2021), this finding indicates key regions where coral reef connectivity may be permanently disrupted in the future, highlighting its importance for coral conservation.
The original contributions presented in the study are all included in this manuscript and in the article/Supplementary Material. Further inquiries can be directed to the corresponding authors.
Conceptualization, GLXS and MK. Methodology, GLXS and MK. Formal analysis, GLXS. Data curation, GLXS and MK. Writing—original draft preparation, GLXS. Writing–review and editing, GLXS and MK. Supervision, MK. Project administration, MK. Funding acquisition, MK. All authors contributed to the article and approved the submitted version.
This study is a contribution from the Abrolhos Network (www.abrolhos.org) and was co-funded by Brazil´s National Research Council (CNPq) through the Abrolhos Long Term Ecological Monitoring Program (PELD-Site ABRS). The work was financed in part by the Coordenação de Aperfeiçoamento de Pessoal de Nível Superior - Brazil (CAPES) - Finance Code 001, Agência Espacial Brasileira (AEB) and Instituto Nacional de Pesquisas Espaciais (INPE). GLXS was supported by a CNPq M.Sc. fellowship (131044/2020-6). MK acknowledges grants from FAPESP (2021/04128-8) and FUSP (2017/00686-0).
We thank Vitor Galazzo de Paiva from National Institute for Space Research for helping with sea surface temperature and ocean currents data acquisition and validation, and Cristiano Pereira from Budiões Project for helping with M. hispida life-history traits. We also thank Rodrigo Leão de Moura (UFRJ), Rafael Almeida Magris (ICMBio), João Antonio Lorenzzetti (INPE) and the peer reviewers for the valuable considerations about the present work. We are grateful to PNBOIA, NOAA and CMEMS for providing in situ SST data, CoralTemp data and GLORYS12V1 data, respectively. We also thank the Marine Geospatial Ecology Lab. and partners for the development and availability of the biophysical model used in this study. Finally, we are grateful to all authors and researchers who have provided the literature reports of bleaching events in the Brazilian continental margin region.
The authors declare that the research was conducted in the absence of any commercial or financial relationships that could be construed as a potential conflict of interest.
All claims expressed in this article are solely those of the authors and do not necessarily represent those of their affiliated organizations, or those of the publisher, the editors and the reviewers. Any product that may be evaluated in this article, or claim that may be made by its manufacturer, is not guaranteed or endorsed by the publisher.
The Supplementary Material for this article can be found online at: https://www.frontiersin.org/articles/10.3389/fmars.2022.1001185/full#supplementary-material
Albright R. (2011). Reviewing the effects of ocean acidification on sexual reproduction and early life history stages of reef-building corals. J. Mar. Biol 2011, 1–14. doi: 10.1155/2011/473615
Amaral F. D., Hudson M. M., Steiner A. Q., Ramos C. A. C. (2007). Corals and calcified hydroids of the Manuel luiz marine state park (State of maranhão, northeast Brazil). Biota Neotropica 7, 73–81. doi: 10.1590/S1676-06032007000300008
Baker A. C. (2003). Flexibility and specificity in coral-algal symbiosis: diversity, ecology, and biogeography of symbiodinium. Annu. Rev. Ecol. Evol. Systematics 34, 661–689. doi: 10.1146/annurev.ecolsys.34.011802.132417
Banha T. N. S., Capel K. C. C., Kitahara M. V., Francini-Filho R. B., Francini C. L. B., Sumida P. Y. G., et al. (2020). Low coral mortality during the most intense bleaching event ever recorded in subtropical southwestern Atlantic reefs. Coral Reefs 39, 515–521. doi: 10.1007/s00338-019-01856-y
Barshis D. J., Ladner J. T., Oliver T. A., Seneca F. O., Traylor-Knowles N., Palumbi S. R. (2013). Genomic basis for coral resilience to climate change. Proc. Natl. Acad. Sci. 110, 1387–1392. doi: 10.1073/pnas.1210224110
Berti S., Dos Santos F. A., Lacorata G., Vulpiani A. (2011). Lagrangian Drifter dispersion in the southwestern Atlantic ocean. J. Phys. Oceanogr. 41, 1659–1672. doi: 10.1175/2011JPO4541.1
Boylan P., Kleypas J. (2008). New insights into the exposure and sensitivity of coral reefs to ocean warming. In Proc. 11th Int. Coral Reef Symp. 2, 854–858. Available at: https://www.researchgate.net/profile/Joan-Kleypas/publication/267222734.
Brin S., Page L. (1998). The anatomy of a large-scale hypertextual web search engine. Comput. Networks ISDN Syst. 30, 107–117. doi: 10.1016/S0169-7552(98)00110-X
Buddemeier R. W., Kleypas J. A., Aronson R. B. (2004). “Potential contributions of climate change to stresses on coral reef ecosystems,” in Coral reefs and global climate change (Virginia, USA: Pew Center on Global Climate Change).
Castro B. M., Brandini F. P., Pires-Vanin A. M. S., Miranda L. B. (2006). Multidisciplinary oceanographic processes on the Western Atlantic continental shelf between 4 n and 34 s. The sea 11, 209–251.
Claar D. C., Cobb K. M., Baum J. K. (2019). In situ and remotely sensed temperature comparisons on a central pacific atoll. Coral Reefs 38, 1343–1349. doi: 10.1007/s00338-019-01850-4
CMEMS (2019). Global ocean gridded L4 sea surface heights and derived variables reprocessed (1993-ongoing). (France: Copernicus Marine Environment Monitoring Service). doi: 10.48670/moi-00148
Coelho S. C. C., Gherardi D. F. M., Gouveia M. B., Kitahara M. V. (2022). Western Boundary currents drive sun-coral (Tubastraea spp.) coastal invasion from oil platforms. Sci. Rep. 12, 1–15. doi: 10.1038/s41598-022-09269-8
Connolly S. R., Baird A. H. (2010). Estimating dispersal potential for marine larvae: dynamic models applied to scleractinian corals. Ecology 91, 3572–3583. doi: 10.1890/10-0143.1
Couce E., Ridgwell A., Hendy E. J. (2012). Environmental controls on the global distribution of shallow-water coral reefs. J. Biogeogr. 39, 1508–1523. doi: 10.1111/j.1365-2699.2012.02706.x
Cowen R. K., Sponaugle S. (2009). Larval dispersal and marine population connectivity. Annu. Rev. Mar. Sci. 1, 443–466. doi: 10.1146/annurev.marine.010908.163757
Dagestad K.-F., Röhrs J. (2019). Prediction of ocean surface trajectories using satellite derived vs. modeled ocean currents. Remote Sens. Environ. 223, 130–142. doi: 10.1016/j.rse.2019.01.001
da Silveira I. C., de Miranda L. B., Brown W. S. (1994). On the origins of the north Brazil current. J. Geophysical Research: Oceans 99, 22501–22512. doi: 10.1029/94JC01776
DeCarlo T. M. (2020). Treating coral bleaching as weather: a framework to validate and optimize prediction skill. PeerJ 8, e9449. doi: 10.7717/peerj.9449
Dixon G. B., Davies S. W., Aglyamova G. V., Meyer E., Bay L. K., Matz M. V. (2015). Genomic determinants of coral heat tolerance across latitudes. Science 348, 1460–1462. doi: 10.1126/science.1261224
Dohan K., Bonjean F., Centurioni L., Cronin M., Lagerloef G., Lee D.-K., et al. (2010). Measuring the global ocean surface circulation with satellite and in situ observations. Proc. the" OceanObs 9, 1–12. doi: 10.5270/OceanObs09.cwp.23
Donner S. D. (2009). Coping with commitment: projected thermal stress on coral reefs under different future scenarios. PloS One 4, e5712. doi: 10.1371/journal.pone.0005712
dos Santos L. A. H., Ribeiro F. V., Creed J. C. (2013). Antagonism between invasive pest corals tubastraea spp. and the native reef-builder mussismilia hispida in the southwest Atlantic. J. Exp. Mar. Biol. Ecol. 449, 69–76. doi: 10.1016/j.jembe.2013.08.017
Douglas A. (2003). Coral bleaching–-how and why? Mar. pollut. Bull. 46, 385–392. doi: 10.1016/S0025-326X(03)00037-7
Duarte G. A., Villela H. D., Deocleciano M., Silva D., Barno A., Cardoso P. M., et al. (2020). Heat waves are a major threat to turbid coral reefs in Brazil. Front. Mar. Sci. 7, 179. doi: 10.3389/fmars.2020.00179
Edmunds P., Gates R., Gleason D. (2001). The biology of larvae from the reef coral porites astreoides, and their response to temperature disturbances. Mar. Biol. 139, 981–989. doi: 10.1007/s002270100634
Endo C. A. K., Gherardi D. F. M., Pezzi L. P., Lima L. N. (2019). Low connectivity compromises the conservation of reef fishes by marine protected areas in the tropical south Atlantic. Sci. Rep. 9, 1–11. doi: 10.1038/s41598-019-45042-0
Ferreira B. P., Maida M. (2006). Monitoramento dos recifes de coral do brasil (Brasília, DF: MMA, Secretaria de Biodiversidade e Florestas Brasília, DF).
Fontoura L., D’agata S., Gamoyo M., Barneche D. R., Luiz O. J., Madin E. M., et al. (2022). Protecting connectivity promotes successful biodiversity and fisheries conservation. Science 375, 336–340. doi: 10.1126/science.abg4351
Freitas L. M., Oliveira M., d. D. M., Leão Z. M., Kikuchi R. K. P. (2019). Effects of turbidity and depth on the bioconstruction of the abrolhos reefs. Coral Reefs 38, 241–253. doi: 10.1007/s00338-019-01770-3
Garavelli L., Studivan M. S., Voss J. D., Kuba A., Figueiredo J., Cherubin L. M. (2018). Assessment of mesophotic coral ecosystem connectivity for proposed expansion of a marine sanctuary in the northwest gulf of Mexico: larval dynamics. Front. Mar. Sci. 5, 174. doi: 10.3389/fmars.2018.00174
Glynn P., D’croz L. (1990). Experimental evidence for high temperature stress as the cause of El niño-coincident coral mortality. Coral reefs 8, 181–191. doi: 10.1007/BF00265009
Godoy L., Mies M., Zilberberg C., Pastrana Y., Amaral A., Cruz N., et al. (2021). Southwestern Atlantic reef-building corals mussismilia spp. are able to spawn while fully bleached. Mar. Biol. 168, 1–8. doi: 10.1007/s00227-021-03824-z
Gomez A. M., McDonald K. C., Shein K., DeVries S., Armstrong R. A., Hernandez W. J., et al. (2020). Comparison of satellite-based sea surface temperature to in situ observations surrounding coral reefs in la parguera, Puerto Rico. J. Mar. Sci. Eng. 8, 453. doi: 10.3390/jmse8060453
Graham E., Baird A., Connolly S. (2008). Survival dynamics of scleractinian coral larvae and implications for dispersal. Coral reefs 27, 529–539. doi: 10.1007/s00338-008-0361-z
Hartmann D. L. (2015). “El Niño, la niña, and the southern oscillation,” in Global physical climatology (Newnes) (2nd Edition), vol. 103. , 246–253.
Heron S. F., Liu G., Eakin C. M., Skirving W. J., Muller-Karger F. E., Vega-Rodriguez M., et al. (2014). Climatology development for NOAA coral reef watch’s 5-km product suite. (Washington, D.C. : National Oceanic and Atmospheric Administration)
Hock K., Wolff N. H., Ortiz J. C., Condie S. A., Anthony K. R., Blackwell P. G., et al. (2017). Connectivity and systemic resilience of the great barrier reef. PLoS Biol. 15, e2003355. doi: 10.1371/journal.pbio.2003355
Holstein D. M., Paris C. B., Vaz A. C., Smith T. B. (2016). Modeling vertical coral connectivity and mesophotic refugia. Coral Reefs 35, 23–37. doi: 10.1007/s00338-015-1339-2
Hughes T. P., Barnes M. L., Bellwood D. R., Cinner J. E., Cumming G. S., Jackson J. B., et al. (2017). Coral reefs in the anthropocene. Nature 546, 82–90. doi: 10.1038/nature22901
Jokiel P., Rodgers K., Kuffner I., Andersson A., Cox E., Mackenzie F. (2008). Ocean acidification and calcifying reef organisms: a mesocosm investigation. Coral reefs 27, 473–483. doi: 10.1007/s00338-008-0380-9
Kayanne H. (2017). Validation of degree heating weeks as a coral bleaching index in the northwestern pacific. Coral Reefs 36, 63–70. doi: 10.1007/s00338-016-1524-y
Kim S. W., Sampayo E. M., Sommer B., Sims C. A., Gómez-Cabrera M., Dalton S. J., et al. (2019). Refugia under threat: Mass bleaching of coral assemblages in high-latitude eastern Australia. Global Change Biol. 25, 3918–3931. doi: 10.1111/gcb.14772
Kleypas J. A., Castruccio F. S., Curchitser E. N., Mcleod E. (2015). The impact of ENSO on coral heat stress in the western equatorial pacific. Global Change Biol. 21, 2525–2539. doi: 10.1111/gcb.12881
Kleypas J. A., Thompson D. M., Castruccio F. S., Curchitser E. N., Pinsky M., Watson J. R. (2016). Larval connectivity across temperature gradients and its potential effect on heat tolerance in coral populations. Global Change Biol. 22, 3539–3549. doi: 10.1111/gcb.13347
Kumagai N. H., Yamano H. (2018). High-resolution modeling of thermal thresholds and environmental influences on coral bleaching for local and regional reef management. PeerJ 6, e4382. doi: 10.7717/peerj.4382
Leão Z. M., Kikuchi R. K., Oliveira M. D. (2019). “The coral reef province of Brazil,” in World seas: An environmental evaluation (United States: Elsevier), 813–833. doi: 10.1016/B978-0-12-805068-2.00048-6
Lellouche J.-M., Le Galloudec O., Greiner E., Garric G., Regnier C., Drevillon M., et al. (2018). “The copernicus marine environment monitoring service global ocean 1/12 physical reanalysis glorys12v1: description and quality assessment,” in EGU General Assembly Conference Abstracts (France; Copernicus Marine Environment Monitoring Service), Vol. 20. 19806. doi: 10.48670/moi-00021
Lindner A., Farias Junior E., Gregoletto B. F., Oliveira A. F. S., Lawley J. W., Capel K. C. C. (2016). “Cnidários,” in A vida marinha de Santa catarina (EdUFSC: Editora da Universidade Federal de Santa Catarina), 27–31.
Lisboa D., Kikuchi R., Leão Z. M. (2018). El Nino, sea surface temperature anomaly and coral bleaching in the south Atlantic: A chain of events modeled with a Bayesian approach. J. Geophysical Research: Oceans 123, 2554–2569. doi: 10.1002/2017JC012824
Liu S. Y. V., Green J., Briggs D., Hastings R., Jondelius Y., Kensinger S., et al. (2021b). Dongsha atoll is an important stepping-stone that promotes regional genetic connectivity in the south China Sea. PeerJ 9, e12063. doi: 10.7717/peerj.12063
Liu B., Guan L., Chen H. (2021a). Detecting 2020 coral bleaching event in the Northwest hainan island using CoralTemp SST and sentinel-2B MSI imagery. Remote Sens. 13, 4948. doi: 10.3390/rs13234948
Liu G., Strong A. E., Skirving W. (2003). Remote sensing of sea surface temperatures during 2002 barrier reef coral bleaching. Eos Trans. Am. Geophysical Union 84, 137–141. doi: 10.1029/2003EO150001
Liu G., Strong A. E., Skirving W., Arzayus L. F. (2006). “Overview of NOAA coral reef watch program’s near-real time satellite global coral bleaching monitoring activities,” in Proceedings of the 10th international coral reef symposium, vol. vol. 1793. (Gurugram Okinawa, Japan), 1783–1793.
Loiola M., Cruz I. C., Lisboa D. S., Mariano-Neto E., Leão Z. M., Oliveira M. D., et al. (2019). Structure of marginal coral reef assemblages under different turbidity regime. Mar. Environ. Res. 147, 138–148. doi: 10.1016/j.marenvres.2019.03.013
Loya Y., Sakai K., Yamazato K., Nakano Y., Sambali H., Van Woesik R. (2001). Coral bleaching: the winners and the losers. Ecol. Lett. 4, 122–131. doi: 10.1046/j.1461-0248.2001.00203.x
Luko C., da Silveira I., Simoes-Sousa I., Araujo J., Tandon A. (2021). Revisiting the Atlantic south equatorial current. J. Geophysical Research: Oceans 126, e2021JC017387. doi: 10.1029/2021JC017387
Magris R. A., Costa M. D., Ferreira C. E., Vilar C. C., Joyeux J.-C., Creed J. C., et al. (2021). A blueprint for securing brazil’s marine biodiversity and supporting the achievement of global conservation goals. Diversity Distributions 27, 198–215. doi: 10.1111/ddi.13183
Magris R. A., Treml E. A., Pressey R. L., Weeks R. (2016). Integrating multiple species connectivity and habitat quality into conservation planning for coral reefs. Ecography 39, 649–664. doi: 10.1111/ecog.01507
Marinha do Brasil (2017). Programa nacional de boias–Pnboia-Plano nacional de trabalho (Brasilia, Brazil: Marinha do Brasil).
Mies M., Francini-Filho R. B., Zilberberg C., Garrido A. G., Longo G. O., Laurentino E., et al. (2020). South Atlantic coral reefs are major global warming refugia and less susceptible to bleaching. Front. Mar. Sci. 7, 514. doi: 10.3389/fmars.2020.00514
Migotto A. E. (1997). Anthozoan bleaching on the southeastern coast of Brazil in the summer of 1994. In Proceedings of the 6th International Conference on Coelenterate Biology. 329–335
Miranda R. J., Cruz I. C., Leão Z. M. (2013). Coral bleaching in the caramuanas reef (Todos os santos bay, Brazil) during the 2010 El niño event. Latin Am. J. Aquat. Res. 41, 351–360. doi: 10.3856/vol41-issue2-fulltext-14
Moura R. L., Amado-Filho G. M., Moraes F. C., Brasileiro P. S., Salomon P. S., Mahiques M. M., et al. (2016). An extensive reef system at the Amazon river mouth. Sci. Adv. 2, e1501252. doi: 10.1126/sciadv.1501252
Mumby P. J., Elliott I. A., Eakin C. M., Skirving W., Paris C. B., Edwards H. J., et al. (2011). Reserve design for uncertain responses of coral reefs to climate change. Ecol. Lett. 14, 132–140. doi: 10.1111/j.1461-0248.2010.01562.x
Nakabayashi A., Yamakita T., Nakamura T., Aizawa H., Kitano Y. F., Iguchi A., et al. (2019). The potential role of temperate Japanese regions as refugia for the coral acropora hyacinthus in the face of climate change. Sci. Rep. 9, 1–12. doi: 10.1038/s41598-018-38333-5
Negrão F., Lacerda C., Melo T., Bianchini A., Calderon E., Castro C., et al. (2021). The first biological survey of the royal Charlotte bank (SW Atlantic) reveals a large and diverse ecosystem complex. Estuarine Coast. Shelf Sci. 255, 107363. doi: 10.1016/j.ecss.2021.107363
Nishikawa A., Sakai K. (2005). Settlement-competency period of planulae and genetic differentiation of the scleractinian coral acropora digitifera. Zoological Sci. 22, 391–399. doi: 10.2108/zsj.22.391
Okubo A. (1994). The role of diffusion and related physical processes in dispersal and recruitment of marine populations. Bio-Physics Mar. Larval Dispersal 45, 5–32. doi: 10.1029/CE045p0005
Oliver J., Setiasih N., Marshall P., Hansen L. (2004). A global protocol for monitoring of coral bleaching. ( NAGA, Worldfish Center Quarterly)
Pachauri R. K., Allen M. R., Barros V. R., Broome J., Cramer W., Christ R., et al. (2014). “Climate change 2014: synthesis report,” in Contribution of working groups I, II and III to the fifth assessment report of the intergovernmental panel on climate change (Ipcc). (Switzerland: Intergovernmental Panel on Climate Change)
Paparella F., Xu C., Vaughan G. O., Burt J. A. (2019). Coral bleaching in the Persian/Arabian gulf is modulated by summer winds. Front. Mar. Sci. 6, 205. doi: 10.3389/fmars.2019.00205
Peluso L., Tascheri V., Nunes F. L., Castro C., Pires D., Zilberberg C. (2018). Contemporary and historical oceanographic processes explain genetic connectivity in a southwestern Atlantic coral. Sci. Rep. 8, 1–12. doi: 10.1038/s41598-018-21010-y
Pereira C. M., Schiavetti A., Calderon E. N. (2016). “Renovação de comunidades coralíneas em recifes,” in Conhecendo os recifes brasileiros: Rede de pesquisas coral vivo (Museu Nacional: UFRJ), 129–139.
Peterson R. G., Stramma L. (1991). Upper-level circulation in the south Atlantic ocean. Prog. oceanogr. 26, 1–73. doi: 10.1016/0079-6611(91)90006-8
Pineda J., Hare J. A., Sponaugle S. (2007). Larval transport and dispersal in the coastal ocean and consequences for population connectivity. Oceanography 20, 22–39. doi: 10.5670/oceanog.2007.27
Pires D., Castro C., Ratto C. (1999). Reef coral reproduction in the abrolhos reef complex, Brazil: the endemic genus mussismilia. Mar. Biol. 135, 463–471. doi: 10.1007/s002270050646
Pires D. O., Castro C. B., Segal B., Pereira C. M., Carmo E. C., Silva R., et al. (2016). “Reprodução de corais de águas rasas do brasil,” in Conhecendo os recifes brasileiros: Rede de pesquisas coral vivo (Museu Nacional: UFRJ), 111–128.
Porcelli D., Butlin R., Gaston K., Joly D., Snook R. (2015). The environmental genomics of metazoan thermal adaptation. Heredity 114, 502–514. doi: 10.1038/hdy.2014.119
Reynaud S., Leclercq N., Romaine-Lioud S., Ferrier-Pagés C., Jaubert J., Gattuso J.-P. (2003). Interacting effects of CO2 partial pressure and temperature on photosynthesis and calcification in a scleractinian coral. Global Change Biol. 9, 1660–1668. doi: 10.1046/j.1365-2486.2003.00678.x
Roberts J. J., Best B. D., Dunn D. C., Treml E. A., Halpin P. N. (2010). Marine geospatial ecology tools: An integrated framework for ecological geoprocessing with ArcGIS, Python, r, MATLAB, and c++. Environ. Model. Software 25, 1197–1207. doi: 10.1016/j.envsoft.2010.03.029
Rodrigues R. R., Rothstein L. M., Wimbush M. (2007). Seasonal variability of the south equatorial current bifurcation in the Atlantic ocean: A numerical study. J. Phys. Oceanogr. 37, 16–30. doi: 10.1175/JPO2983.1
Santos C. L. A., Vital H., Amaro V. E., Kikuchi R.K.P.d. (2007). Mapeamento de recifes submersos na costa do Rio grande do norte, NE brasil: Macau a maracajau. Rev. Bras. Geofísica 25, 27–36. doi: 10.1590/S0102-261X2007000500004
Sen Gupta A., Stellema A., Pontes G. M., Taschetto A. S., Vergés A., Rossi V. (2021). Future changes to the upper ocean Western boundary currents across two generations of climate models. Sci. Rep. 11, 1–12. doi: 10.1038/s41598-021-88934-w
Silveira I.C.A.d., Schmidt A. C. K., Campos E. J. D., Godoi S., Ikeda Y. (2000). A corrente do brasil ao largo da costa leste brasileira. Rev. Bras. Oceanografia 48, 171–183. doi: 10.1590/S1413-77392000000200008
Simoes-Sousa I. T., Silveira I. C. A., Tandon A., Flierl G. R., Ribeiro C. H., Martins R. P. (2021). The barreirinhas eddies: Stable energetic anticyclones in the near-equatorial south atlantic. Front. Mar. Sci. 28. doi: 10.3389/fmars.2021.617011
Skirving W., Marsh B., de la Cour J., Liu G., Harris A., Maturi E., et al. (2020). CoralTemp and the coral reef watch coral bleaching heat stress product suite version 3.1. Remote Sens. 12, 3856. doi: 10.3390/rs12233856
Smolarkiewicz P. K. (2006). Multidimensional positive definite advection transport algorithm: an overview. Int. J. numerical Methods fluids 50, 1123–1144. doi: 10.1002/fld.1071
Smolarkiewicz P. K., Margolin L. G. (1998). MPDATA: A finite-difference solver for geophysical flows. J. Comput. Phys. 140, 459–480. doi: 10.1006/jcph.1998.5901
Soutelino R., Gangopadhyay A., Da Silveira I. (2013). The roles of vertical shear and topography on the eddy formation near the site of origin of the Brazil current. Continental Shelf Res. 70, 46–60. doi: 10.1016/j.csr.2013.10.001
Spalding M. D., Fox H. E., Allen G. R., Davidson N., Ferdaña Z. A., Finlayson M., et al. (2007). Marine ecoregions of the world: a bioregionalization of coastal and shelf areas. BioScience 57, 573–583. doi: 10.1641/B570707
Spalding M. D., Ravilious C., Green E. P., et al. (2001). World atlas of coral reefs (Univ of California press) spalding2001world. (Berkeley:University of California Press)
Stramma L., England M. (1999). On the water masses and mean circulation of the south Atlantic ocean. J. Geophysical Research: Oceans 104, 20863–20883. doi: 10.1029/1999JC900139
Studivan M., Voss J. (2018). Population connectivity among shallow and mesophotic montastraea cavernosa corals in the gulf of Mexico identifies potential for refugia. Coral Reefs 37, 1183–1196. doi: 10.1007/s00338-018-1733-7
Sutton A. J., Feely R. A., Sabine C. L., McPhaden M. J., Takahashi T., Chavez F. P., et al. (2014). Natural variability and anthropogenic change in equatorial pacific surface ocean pCO2 and pH. Global Biogeochem. Cycles 28, 131–145. doi: 10.1002/2013GB004679
Teixeira C. D., Leitão R. L., Ribeiro F. V., Moraes F. C., Neves L. M., Bastos A. C., et al. (2019). Sustained mass coral bleaching, (2016–2017) in Brazilian turbid-zone reefs: taxonomic, cross-shelf and habitat-related trends. Coral Reefs 38, 801–813. doi: 10.1007/s00338-019-01789-6
Thompson D. M., Kleypas J., Castruccio F., Curchitser E. N., Pinsky M. L., Jönsson B., et al. (2018). Variability in oceanographic barriers to coral larval dispersal: Do currents shape biodiversity? Prog. Oceanogr. 165, 110–122. doi: 10.1016/j.pocean.2018.05.007
Tozer B., Sandwell D. T., Smith W. H., Olson C., Beale J., Wessel P. (2019). Global bathymetry and topography at 15 arc sec: SRTM15+. Earth Space Sci. 6, 1847–1864. doi: 10.1029/2019EA000658
Treml E. A., Ford J. R., Black K. P., Swearer S. E. (2015a). Identifying the key biophysical drivers, connectivity outcomes, and metapopulation consequences of larval dispersal in the sea. Movement Ecol. 3, 1–16. doi: 10.1186/s40462-015-0045-6
Treml E. A., Halpin P. N., Urban D. L., Pratson L. F. (2008). Modeling population connectivity by ocean currents, a graph-theoretic approach for marine conservation. Landscape Ecol. 23, 19–36. doi: 10.1007/s10980-007-9138-y
Treml E. A., Roberts J. J., Chao Y., Halpin P. N., Possingham H. P., Riginos C. (2012). Reproductive output and duration of the pelagic larval stage determine seascape-wide connectivity of marine populations. 52, 525–537. doi: 10.1093/icb/ics101
Treml E. A., Roberts J., Halpin P. N., Possingham H. P., Riginos C. (2015b). The emergent geography of biophysical dispersal barriers across the indo-West pacific. Diversity Distributions 21, 465–476. doi: 10.1111/ddi.12307
UNEP-WCMC, WorldFishCentre, WRI, TNC (2018). Global distribution of coral reefs, compiled from multiple sources including the millennium coral reef mapping project. version 4.0 unep-wcmc. (Cambridge (UK): UN Environment World Conservation Monitoring Centre). doi: 10.34892/t2wk-5t34
Verrill A. E., Beecher C. E., Richardson H., Mendel L. B., Banks N., Underhill F. P. (1902). Variations and nomenclature of Bermudian, West Indian, and Brazilian reef corals: with notes on various Indo-Pacific corals (Vol. 11). Connecticut Academy of Arts and Sciences
Wilkinson C. (1998). The 1997-1998 mass bleaching event around the world. Available at: http://hdl.handle.net/1834/545.
Xavier T., Xavier A. F. S., DIAS M., DIAS P. (2003). Interrelações entre eventos ENOS (ENSO), a ZCIT (ITCZ) no atlântico e a chuva nas bacias hidrográficas do ceará. Rev. Bras. Recursos Hídricos 8, 111–126. doi: 10.21168/rbrh.v8n2.p111-126
Zhou J., Huang H., Beardall J., Gao K. (2017). Effect of uv radiation on the expulsion of symbiodinium from the coral pocillopora damicornis. J. Photochem. Photobiol. B: Biol. 166, 12–17. doi: 10.1016/j.jphotobiol.2016.11.003
Keywords: coral reefs, larval connectivity, sea surface temperature, thermal stress, coral bleaching, Brazilian Continental Margin, South Atlantic Ocean
Citation: Silva GLX and Kampel M (2022) Connectivity patterns of Brazilian coral reefs associated with potential variation on thermal stress tolerance. Front. Mar. Sci. 9:1001185. doi: 10.3389/fmars.2022.1001185
Received: 23 July 2022; Accepted: 25 October 2022;
Published: 24 November 2022.
Edited by:
Michael E. Hellberg, Louisiana State University, United StatesReviewed by:
Igal Berenshtein, University of Miami, United StatesCopyright © 2022 Silva and Kampel. This is an open-access article distributed under the terms of the Creative Commons Attribution License (CC BY). The use, distribution or reproduction in other forums is permitted, provided the original author(s) and the copyright owner(s) are credited and that the original publication in this journal is cited, in accordance with accepted academic practice. No use, distribution or reproduction is permitted which does not comply with these terms.
*Correspondence: Gabriel Lucas Xavier da Silva, Z2FicmllbC54YXZpZXJAaW5wZS5icg==; Milton Kampel, bWlsdG9uLmthbXBlbEBpbnBlLmJy
Disclaimer: All claims expressed in this article are solely those of the authors and do not necessarily represent those of their affiliated organizations, or those of the publisher, the editors and the reviewers. Any product that may be evaluated in this article or claim that may be made by its manufacturer is not guaranteed or endorsed by the publisher.
Research integrity at Frontiers
Learn more about the work of our research integrity team to safeguard the quality of each article we publish.