 Grayson Soetaert
 Roberta C. Hamme
- School of Earth and Ocean Sciences, University of Victoria, Victoria, BC, Canada
Injection of oxygenated water into anoxic basins sets off a cascade of biogeochemical reactions and ecosystem shifts. The dynamic nature of these events can create spatial variability in the resulting water mass that strongly affects subsequent observations. Their irregularity can also make their prediction for experiment planning challenging. Our study focuses on Saanich Inlet, one of the most accessible and well-studied anoxic basins in the world. In the late summer and early fall, dense water can cross the sill into this fjord, in discrete events, bringing oxygen and nitrate to the deep waters of the inlet. We assess the potential strength of these renewal events using density measured at a bottom mooring on the sill. We find that the occurrence and potential strength of renewals is primarily controlled by tidal current speeds, which can be well predicted. However, the intensity of coastal upwelling, which brings dense water into the estuarine system, plays a significant secondary control, reducing predictability. We also demonstrate that renewals do not result in a homogeneous water mass filling the deep inlet. Instead, high frequency measurements from a profiling mooring in the centre of the inlet reveal that different densities intruding over the several-day renewal period create a complex layering of waters containing different proportions of new oxic and old anoxic waters. Finally, we show that not every instance of high density water observed over the sill results in flushing of the deepest waters inside the inlet. We hypothesize that each renewal improves the chance of a subsequent renewal in the same season by reducing the density contrast between waters entering and already inside the inlet. Consideration of the temporal and spatial complexity of these renewal dynamics is necessary to support studies using Saanich Inlet as a natural laboratory for exploring oxygen deficient systems.
1 Introduction
Carefully planned field work can be thwarted by unexpected conditions at the site, a particular problem in dynamic Saanich Inlet. This glacially carved fjord with a long, shallow sill at the mouth lies in SW British Columbia, Canada (Figure 1A). Restricted deep-water circulation and high surface productivity (Takahashi et al., 1977; Timothy and Soon, 2001; Grundle et al., 2009) cause anoxia in the deep waters over most of the year (Carter, 1934; Richards, 1965). Its proximity to several major oceanographic institutions, particularly Fisheries and Oceans Canada’s Institute of Ocean Sciences right on its shore, and the installation in 2006 of a cabled observatory have made Saanich Inlet perhaps the most accessible and well-studied anoxic basin in the world. Indeed, Saanich Inlet has come to serve as a natural laboratory to investigate biogeochemical processes and ecological communities in Oxygen Deficient Zones (ODZs) (e.g. Emerson et al., 1979; Tunnicliffe, 1981; Juniper and Brinkhurst, 1986; Zaikova et al., 2010). However, this basin experiences discrete deep-water renewal events during the late summer and early fall of many years, which bring oxygen, nitrate, and other oxidized compounds to the deep-waters (Herlinveaux, 1962; Richards, 1965; Anderson and Devol, 1973), interrupting anoxia and creating much more dynamic conditions than ODZs typically experience. In 2014, we began planning the Saanich Inlet Redox Experiment, for which a team intended to sample the inlet every two weeks from oxygenated to sulfidic conditions. However, the intermittent nature of the renewal process and particularly its poorly understood interannual variability was frustrating to the planning process. This paper grew out of a desire to better predict and understand both the occurrence of large renewal events in Saanich Inlet and their impact on the resulting water mass structure. We hope it will aid others in planning their field programs in the region and serve as a basis to investigate the controls and complexity of water mass renewal in other restricted basins.
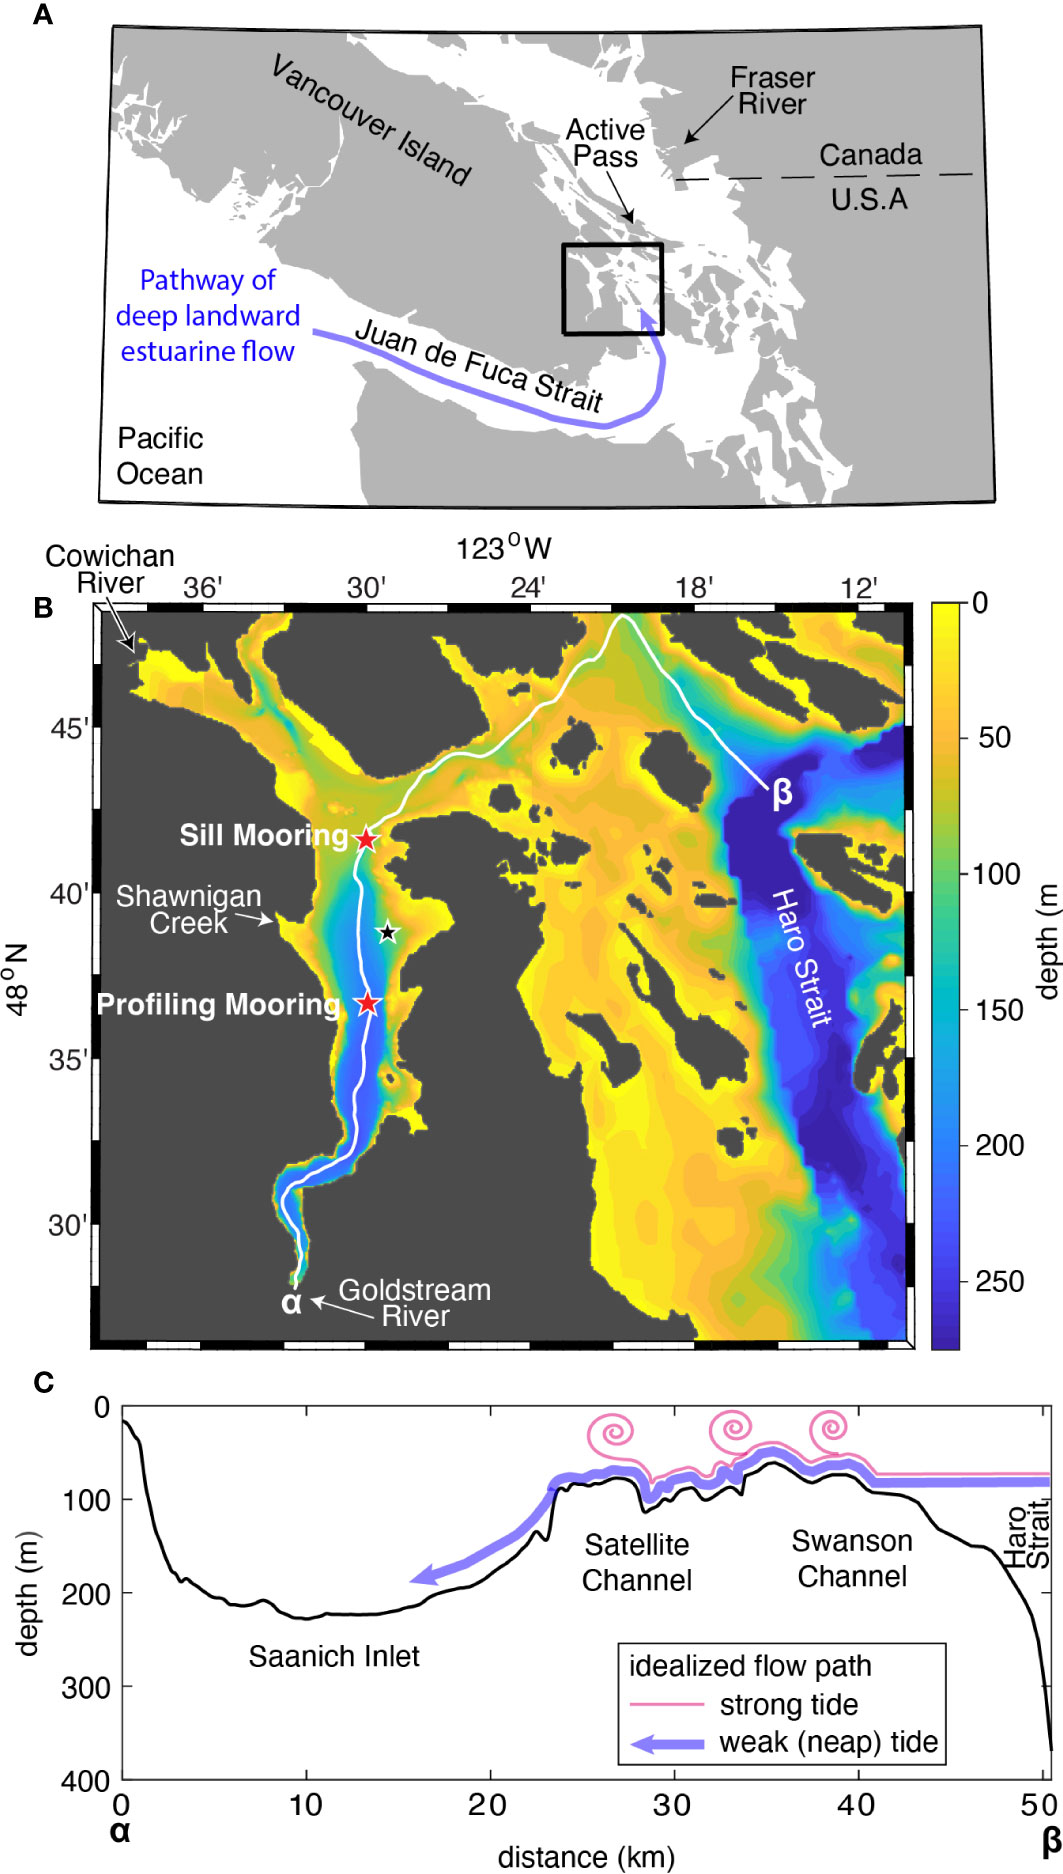
Figure 1 (A) Map of Salish Sea region on the west coast of North America. Blue line shows idealized conception of the landward pathway seawater follows in the estuarine system. Black box shows location of next panel. (B) Map of Saanich Inlet and its connection through Satellite Channel and Swanson Channel to Haro Strait. Red stars mark the locations of the sill mooring and profiling mooring. Smaller black star marks the location of a bottom mooring in Patricia Bay. White line marks the location of the deepest part of the channel (thalweg) (C) Cross-section along the thalweg from the southern end of Saanich Inlet (α, distance 0) to Haro Strait (β). Colored lines show idealized conception of bottom water flowing over the sill during neap tidal current speeds (blue) and higher tidal currents (pink).
The mechanism of renewal events in Saanich Inlet is similar to several other fjord systems and has been studied previously. Circulation of dense waters that could flush out the deep inlet is blocked by a shallow (~70 m), rather long (~10 km) sill at the mouth of the inlet (Figure 1B). In order for a renewal event to occur, waters denser than those in the deep inlet must flow over the sill and move into or under the water mass already present. Dense water arrives at the Saanich Inlet sill via the estuarine circulation of the Salish Sea, which pulls salty, dense waters landward (Figure 1A) as the fresher surface water (dominated by Fraser River outflow) flows seaward (Waldichuk, 1957; Masson, 2002; Masson, 2006). During late spring through early fall (Bylhouwer et al., 2013), intermittent upwelling off the coast of Vancouver Island supplies especially dense water (Freeland and Denman, 1982) to this deep landward estuarine flow. Indeed, Anderson and Devol (1973) suggested that Saanich Inlet renewal events occur primarily during the late upwelling season due to this supply of denser water. The estuarine circulation of the Salish Sea is forced through narrow straits and over multiple sills (Victoria Sill, Swanson and Satellite Channels, Boundary Pass), mixing the deeper salty water with the fresher water above. Tides drag these layers of water back and forth over the sills creating even more intense mixing (Gargett, 1994; Farmer et al., 1994; Camargo et al., 2014) and reducing the density of the bottom landward flow. The 14-d spring-neap cycle in tides strongly modulates this mixing (Gargett et al., 2003), so that it is more intense under faster flowing tidal current speeds - spring tides - and less intense during slower tidal current speeds - neap tides (Figure 1C). Stucchi and Giovando (1984) show that observations of high salinity water over the Saanich Inlet sill follow periods of low tidal current speeds, demonstrating the link between neap tides and dense water flowing over the Saanich Inlet sill. Thus, for Saanich Inlet and similar systems, deep water renewal only occurs during the lowest tidal current speeds (Geyer and Cannon, 1982; Griffin and LeBlond, 1990; LeBlond et al., 1991; Masson and Cummins, 2000; Masson, 2002; Manning et al., 2010; Thomson et al., 2020).
Note that the shallow waters of Saanich Inlet experience their own unique estuarine circulation, involving a fortnightly variation in the circulation direction (see Gargett et al., 2003). The vast majority of freshwater supplied to Saanich Inlet comes from outside the inlet (Fraser River, Cowichan River). When mixing over the sill is weak (neap tides), this freshwater flows into the inlet through the mouth creating a reverse estuarine flow and near surface downwelling. In contrast, when mixing is strong (spring tides), the near-surface salinity gradient changes, normal estuarine flow is established, and upwelling supplies nutrients to the surface driving Saanich Inlet’s high productivity. Although both this circulation and the deep renewal process are driven by the spring-neap tidal cycle, the shallow circulation dominates the upper waters, well above sill depth, and has little direct impact on the renewal process we focus on in this paper.
The impact of renewal events on the resulting water mass within Saanich Inlet has been explored in low frequency shipboard observations. Dense waters flowing along the bottom of Saanich can lift less dense anoxic waters to shallower depths where they may persist for weeks to a month before being fully flushed out by the shallower circulation (Richards, 1965; Anderson and Devol, 1973). Compared to the very stratified upper water column, the new deep waters can appear relatively homogeneous in properties such as temperature, salinity, oxygen, nutrients, and dissolved N2 gas (Manning et al., 2010). After renewal events cease, the biogeochemistry of the inlet typically evolves toward more reducing conditions (oxygen and nitrate are consumed and sulfide begins to accumulate). Deep Saanich Inlet is known for its low turbulence levels (Gargett et al., 2003), but slow mixing nevertheless reduces the salinity and temperature contrast between the deep waters and the waters above over time (Manning et al., 2010).
In this paper, we clarify the importance of competing factors on the potential for renewal events and show that renewals create complex layering of water masses within Saanich Inlet and likely other similar systems. In Section 2, we present the methods used in our study. While the effect of tidal current speeds on the deep-water renewal process has been a keystone in predicting renewal events in Saanich Inlet for some time and upwelling dynamics have been previously hypothesized to have a controlling factor, in Section 3.1 we quantitatively examine the relative influence of these two factors in controlling the potential for deep-water renewal events. In Section 3.2, we use new high frequency observations to demonstrate the complexity of the water mass produced in the deep inlet by renewals. In Section 3.3, we point out how conditioning of the inlet by renewals is an important factor in allowing dense water that has moved over the sill to actually flush the deep inlet. Finally, in Section 4, we emphasize how the results of this study can be used to allow researchers studying Saanich Inlet to time their expeditions and interpret their results in terms of the complexity of water masses emplaced by renewals. These findings will also help elucidate the main controls over dense water flowing over sills and the complexity of water masses produced in other fjord systems.
2 Materials and methods
2.1 Sill mooring
We used autonomous observations collected by Ocean Networks Canada (ONC) at a bottom mooring on the Saanich Inlet sill to examine the potential for deep-water renewal. Data from 10 deployments during 2012-2020 of a bottom mooring located at 90±3 m depth at the southern terminus of the Saanich Inlet sill (at 48.688°N 123.500°W, Figure 1B) were obtained from https://www.oceannetworks.ca. Each deployment lasted 4-8 months with gaps of a few weeks to years between deployments. Data were collected every 5-15 minutes during each deployment. (See Supplementary Material Table S1 for details on each deployment). Salinity, temperature, and pressure data came from a SeaBird SBE16plus or SBE19plus V2 while oxygen data in 2016 came from an Aanderaa Optode 4175C sensor. No further calibrations were applied other than those by Ocean Networks Canada based on factory calibration. This lack of additional calibration is justified for oxygen, since we use that data only qualitatively as a measure of relative change. A 50-hour triangular filter was further applied to the potential density and to the oxygen data, primarily to remove the short-term influence of the semi-diurnal tides.
Potential renewal events were identified in each year when minima in smoothed tidal current speeds were below 1.1 m s-1 during 1 July - 30 November at Active Pass (NE of Saanich Inlet, Figure 1A). This period encompasses when renewals have been observed historically (see also Section 4). We quantified the potential strength of a renewal event as the change in potential density between a pre-event baseline and the 25-hr averaged potential density maxima during the event. The pre-event baseline was defined as the average potential density over 2-4 days prior to the associated minimum in the smoothed tidal current speed, which ensured sufficient data for a robust average while avoiding variability in the timing of the increase at the start of the renewal event. This potential renewal strength is a metric of the potential for renewal to occur based on the availability of dense water supplied over the sill, rather than of actual displacement of water within the inlet itself.
2.2 Ship-based CTD profiles
We also examined a collection of CTD casts spanning 1976 to 2019 within Saanich Inlet. These casts came from four sources: Fisheries and Oceans Canada obtained from Frank Whitney (personal communication), the Hallam Lab at the University of British Columbia obtained from Céline Michiels (personal communication) but since available from Torres-Beltrán et al. (2017), the Juniper Lab at University of Victoria obtained from Kim Juniper (personal communication), and the University of Victoria’s Ocean Science Minor program. Individual profile data were chosen within 48.55°N-48.70°N and 123.40°W-123.55°W and binned into 1-m depth intervals. Density as σθ was calculated for each profile from temperature, salinity, and pressure using the 1983 equation of state (Fofonoff and Millard, 1983).
Profiles that spanned a potential renewal event were hand-selected. Profile timing was plotted on smoothed tidal current speeds at Active Pass. Event start profiles were selected if they preceded a minimum in the smoothed tidal current speed by no more than 10 days. Event end profiles were selected if they were no more than 2 weeks after the same minimum in smoothed tidal current speed. For events where more than one profile could be considered the event end, the profile which exhibited the highest change in density was chosen. By only choosing profiles that spanned a single tidal current minimum, we excluded the possibility that the change between profiles reflected more than one event. Finally, to quantify the strength of the renewal event, the average density change below 140 m was calculated between the event end and start profiles. The 140 m depth was chosen because waters above this depth often result from the uplift of the basin’s older water mass as the new water enters.
2.3 Profiling mooring
We used autonomous observations collected by ONC from a profiling mooring in the central inlet to examine the impact of deep-water renewals on the water column properties in Saanich Inlet. The ONC Buoy Profiler System was designed to profile four times per day near the deepest part of Saanich Inlet (at 48.622°N 123.499°W, 215 m bottom depth, Figure 1B). High frequency temperature, conductivity, pressure, and oxygen data from a SeaBird SBE19plus and SBE43 were downloaded directly from the ONCSensorDataService for the Nov 2015 - Dec 2016 deployment. Temperature and oxygen were both corrected for time lags from the conductivity sensor arising from system plumbing/sensor response time, and then salinity was calculated from conductivity and temperature. Downcasts were averaged in 1 dbar pressure bins. Communication problems, a faulty depth sensor on the winch prior to 8 Sep 2016, and power outages caused some casts to be aborted, resulting in data gaps of a few hours to a week. A corroded bulkhead connector on the CTD pump caused slower response times for sensors from at least 25 Oct 2016. We also used profiling mooring oxygen data in a qualitative manner and did not apply any further calibration.
2.4 Ancillary data
We combined observations from Saanich Inlet with tidal current predictions, coastal upwelling indices, and river discharge data to interpret the dynamics. Tidal current speeds at nearby Active Pass (NE of Saanich Inlet, 48.867°N, 123.307°W, Figure 1A) were predicted with a 15-min frequency for each year separately from 1975 to 2072 using the XTide database (Flater, 2001) queried using the T-Tide MATLAB Analysis Toolbox (Pawlowicz, 2002). Active Pass is the closest current speed prediction site in the database, and is used here as a proxy for tidal currents in Satellite and Swanson Channels. The absolute values of these current speeds were smoothed with a centred 50-hr triangular filter to highlight the spring-neap cycle. Other nearby tidal predictions were also considered (see Supplementary Material Section S2). Predictions for year 2038 and later were calculated using an updated version of the tidal equilibrium arguments and node factors obtained from https://flaterco.com/xtide/files.html. We obtained daily values of the Bakun Index at 48°N, 125°W as an upwelling metric representative of the conditions off the continental shelf. For each potential renewal event, an average of the Bakun Index was taken for 30 days prior to the minimum tidal current speed associated with that event, to account for lags in transfer of dense water by coastal upwelling into the estuarine system. Daily river discharge data for the Cowichan and Fraser Rivers during 2012-2019 was obtained from Environment and Climate Change Canada.
3 Results and discussion
3.1 Tidal currents and upwelling control potential strength and timing of renewals
An increase in potential density followed most strong minima in smoothed tidal current speeds (Figure 2 shows an example for 2020). To avoid bias in the following analysis, events resulting in decreased potential density were not removed from the data. Two minima in smoothed tidal current speeds occur every month (neap tides), but one is typically stronger, i.e. reaches lower speeds, than the other. The observed density increases over the sill create the possibility for renewal of the deep inlet. Fifty-two of these potential renewal events were observed in July through November of 2012-2020 (Supplementary Figure S2). Additional events occurred during this time, but were not observed due to data gaps. Clear increases in density at the sill mooring typically began up to two days before the minimum in tidal current speeds, while maximum densities were observed 2-5 days following the minimum. The potential density observed at high frequency (every 5-15 minutes at the sill mooring, grey line in Figure 2A) showed large semi-diurnal variability (two maxima and two minima per day, see Section 3.3).
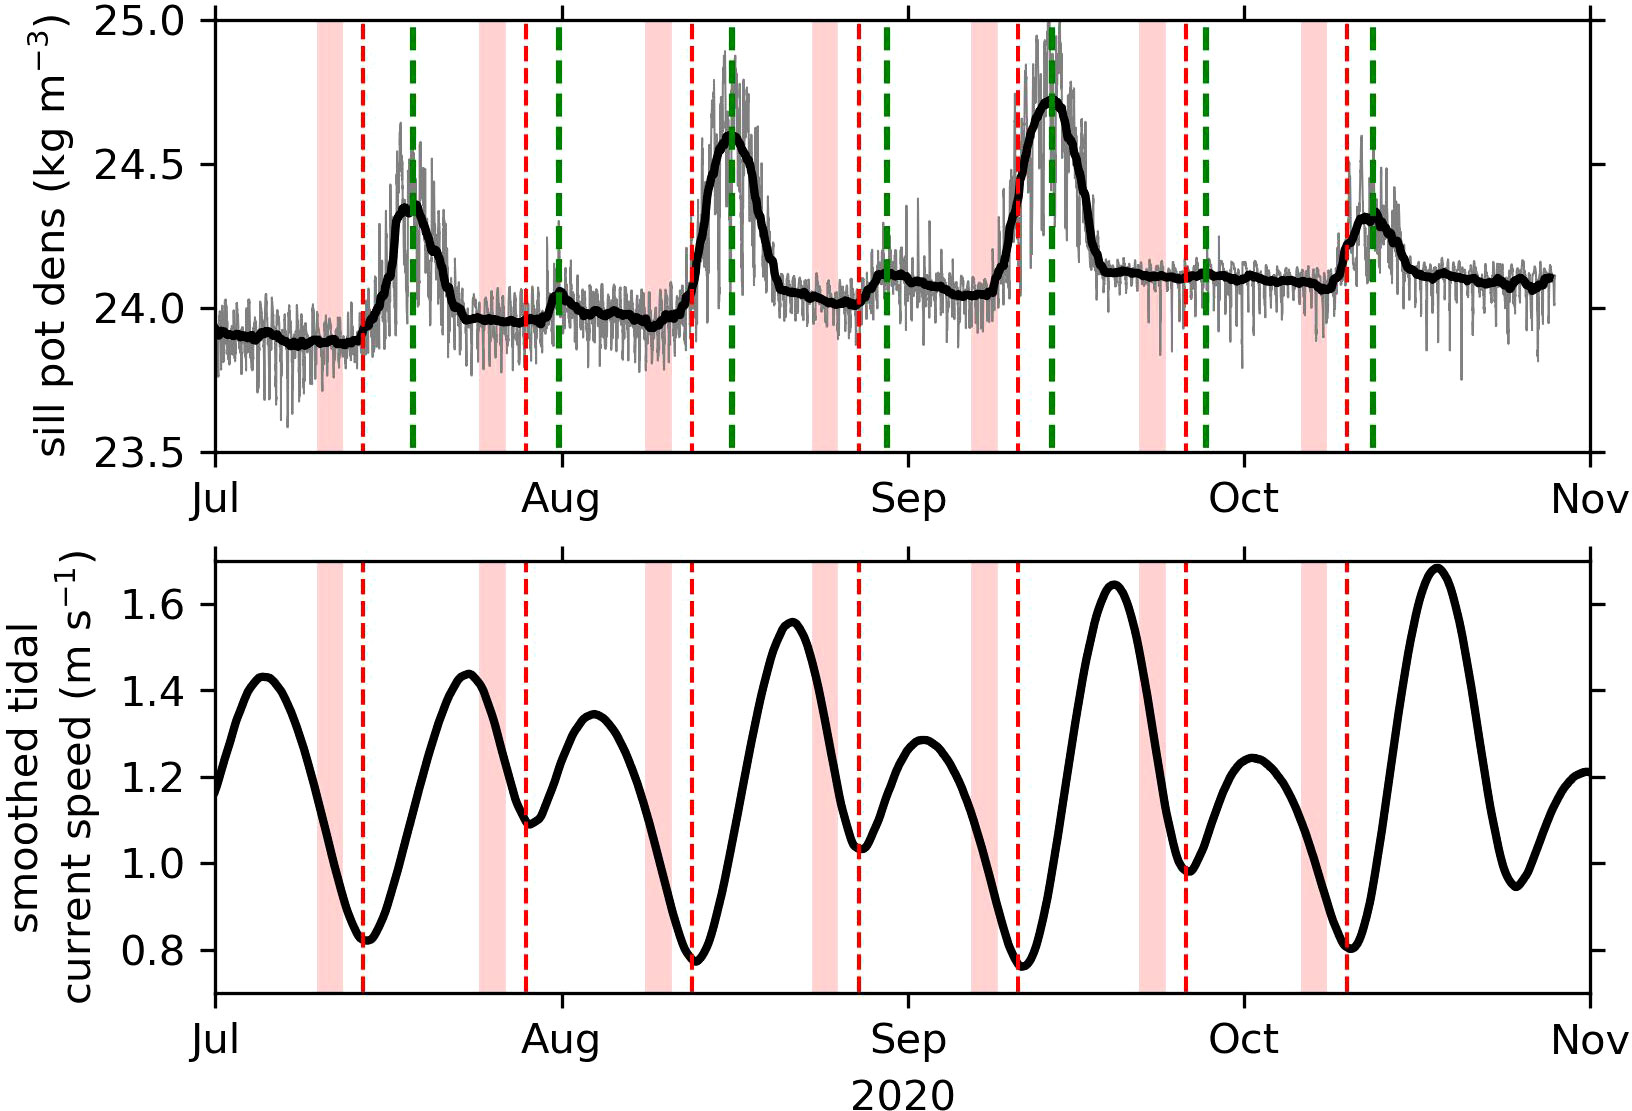
Figure 2 Relationship between potential density at the sill mooring and tidal current speeds for the 2020 renewal season. (upper panel) Potential density observed at the sill mooring (σθ, kg m-3). Thin gray line is the 10-min frequency data. Thick black line is smoothed with a 50-hr triangular filter. Vertical dashed green lines mark the times of the maximum smoothed density. (lower panel) Predicted absolute tidal current speeds at Active Pass smoothed with a 50-hr triangular filter (see Section 2.3). (both panels) Vertical red dashed lines mark the times of the minima in smoothed tidal current speed associated with an event. Lighter red bars indicate the pre-event window for calculation of the baseline potential density.
The strength of these possible renewal events was strongly related to the minimum smoothed tidal current speed and to coastal upwelling strength (Figure 3). Note how the largest density change events (density change > 0.3 kg m-3) occur at smoothed tidal current speeds less than 0.9 m s-1, while the three events with a density change greater than 0.6 kg m-3 all occurred at smoothed tidal current speeds less than 0.8 m s-1. In this region, the tides drag stratified waters back and forth over the complex topography of the sill, mixing the different density waters together (Farmer et al., 1994; Gargett et al., 2003). Lower tidal current speeds allow for the high density of water masses at the bottom to be preserved as they flow over the long and shallow Saanich Inlet sill, because less mixing occurs with lower density shallower waters (Stucchi and Giovando, 1984; Griffin and LeBlond, 1990; LeBlond et al., 1991; Masson, 2002).
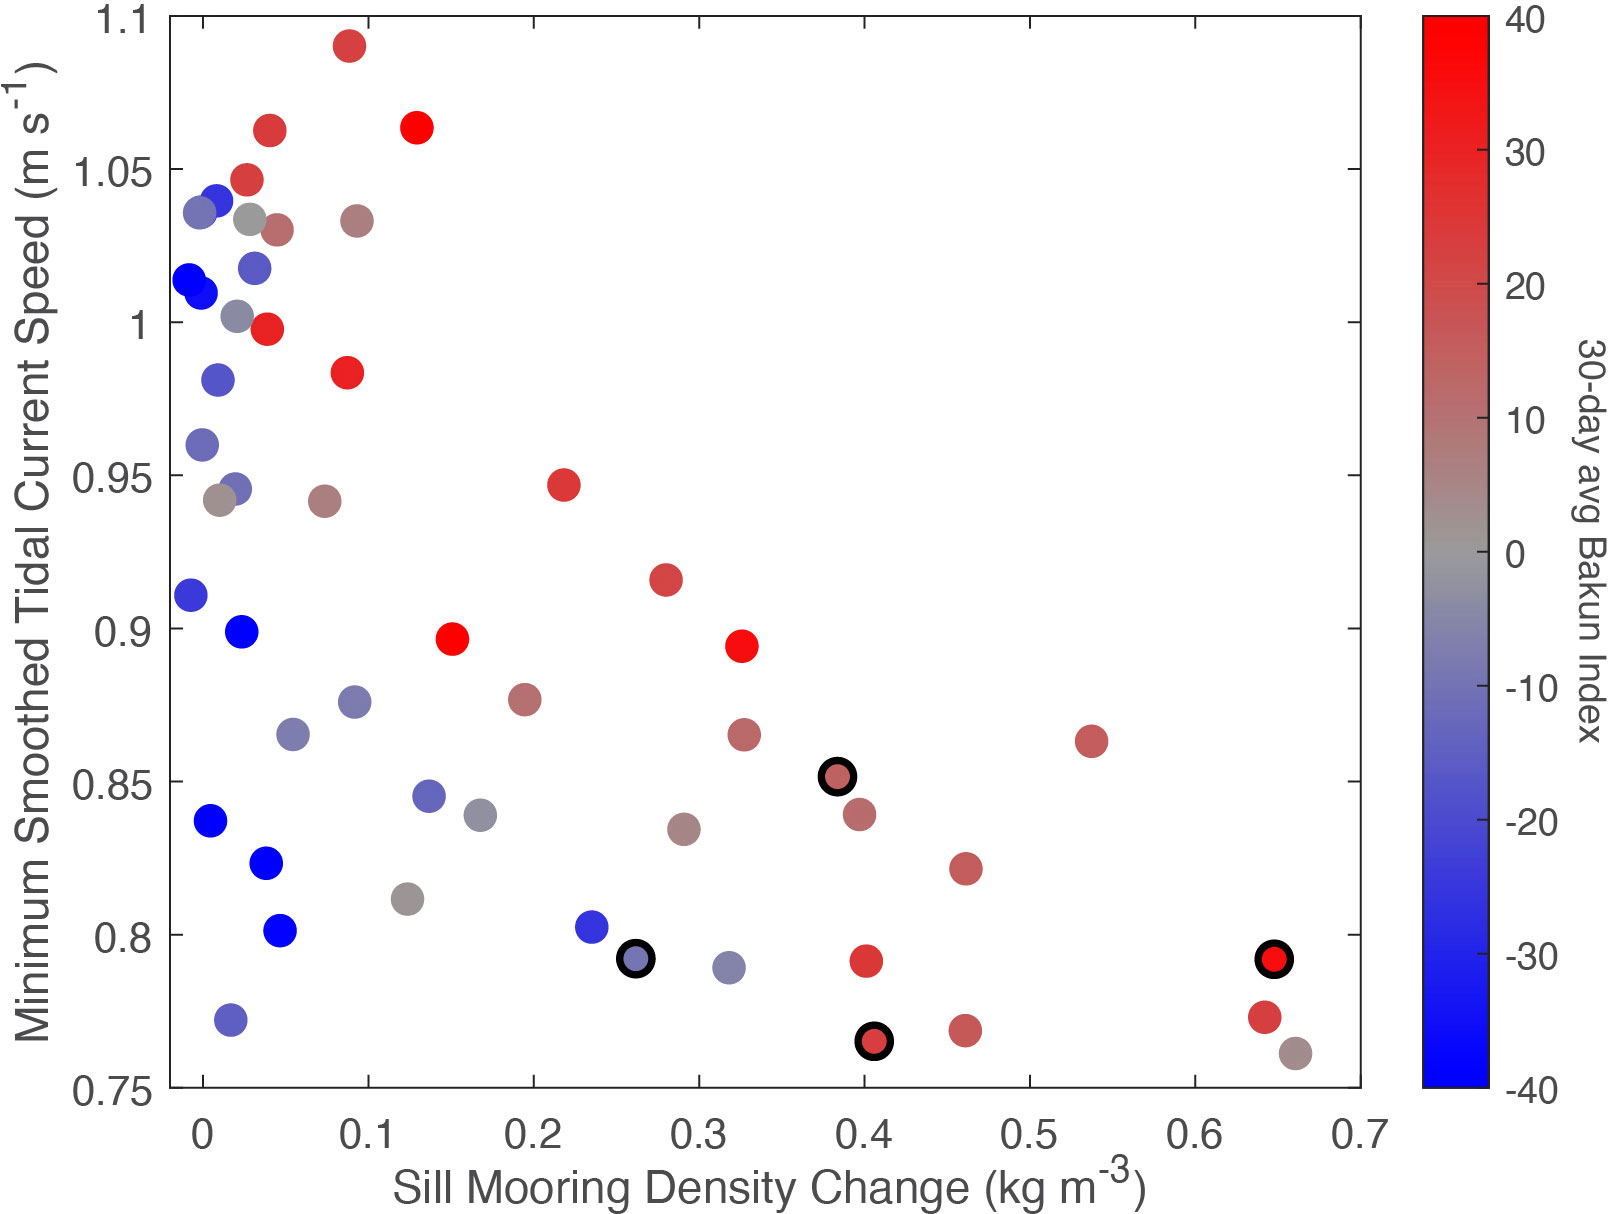
Figure 3 The minimum in the smoothed tidal current speed vs. the potential strength of a renewal event (change in potential density (Δσθ) observed at the Saanich Inlet sill mooring). Each renewal event is coloured by the average of the Bakun Index over the 30 days prior to the minimum smoothed tidal current speed. Events in 2016 (see next section) are outlined in black.
However, tidal current speeds are not the only control. When smoothed tidal current speeds are lower than 0.9 m s-1, there are many events where the change in density is less than 0.3 kg m-3 (points in the lower left quadrant of Figure 3). These small density change despite low tidal current events occurred when the Bakun Index was near or below zero, i.e. when downwelling was dominant off the coast of Vancouver Island. The Bakun Index (Bakun, 1973) is an upwelling metric that uses observations of sea level pressure (to estimate wind stress) and latitude to estimate Ekman transport as a proxy for coastal upwelling. Positive values indicate primarily upwelling conditions off the coast and negative values indicate downwelling. While upwelling off the coast of Vancouver Island is driven by more than wind dynamics (see last paragraph in this section), the Bakun Index still functions as a good proxy for upwelling/downwelling strength. Downwelling conditions on the coast supply lower density water to the deep estuarine flow into the Salish Sea (Figure 1A), while upwelling conditions supply higher density water (Freeland and Denman, 1982; Mackas et al., 1987; Kämpf and Chapman, 2016). Our results show that the density of water supplied outside of the Saanich Inlet sill, regulated by coastal upwelling vs. downwelling, plays an additional controlling role in the potential strength of a given renewal event. If tidal current speeds are low enough to facilitate a strong density change over the sill, downwelling conditions can still suppress the magnitude of the density change.
A multiple linear regression analysis shows that both tidal current speeds and upwelling dynamics are significant controls on the potential strength of renewals but that tidal current speeds are most important. The collection of 52 possible renewal events was fit to:
where Δσθ is the change in density observed at the sill mooring for each event, TidalCurrent is the associated minimum in the smoothed tidal current speed, and BakunIndex is the 30-d average of the upwelling Bakun index prior to the event. A, B, and Intercept parameters were determined by minimizing the sum of the least squares between the predicted and actual Δσθ. When the independent variables of such a model are uncorrelated (as is the case for the minimum tidal current speed and the Bakun Index with an r2< 0.0001 between them), their respective normalized coefficients (A and B) represent the relative power of each variable in determining the result, potential strength of renewals in this case. To normalize the coefficients, each coefficient was multiplied by the standard deviation of its respective variable and divided by the standard deviation of the change in density. The relatively high r2 value of 0.65 for the multiple linear regression (Table 1) demonstrates that these two factors control a high proportion of the potential strength of renewals in Saanich Inlet. Both the minimum smoothed tidal current speed and the Bakun Index are important factors in determining the potential strength of a given renewal event (Table 1), but the larger magnitude normalized coefficient of -0.64 indicates that current speed is the dominant factor. The sign of the coefficient is negative, because low tidal current speeds correlate with high density changes. However, the reasonably high normalized coefficient for the Bakun Index shows that upwelling dynamics have a controlling factor on the potential strength of deep-water renewal events that shouldn’t be dismissed. We found similar results using shorter averaging periods for the Bakun Index of 14 and 7 days, suggesting that it is the overall seasonal cycle that matters most for this variable. Multiple regression analysis using other upwelling indices yielded similar results but with slightly lower coefficients (see Supplementary Material Section S4).
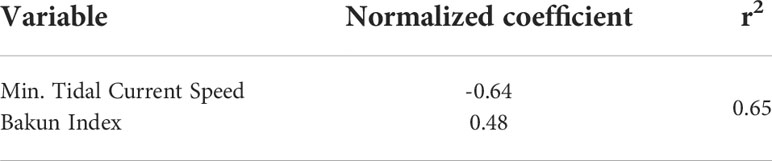
Table 1 Multiple linear regression analysis results for the dependence of the potential renewal strength on the minimum smoothed tidal current speed and the Bakun Index.
In addition to the analysis of the sill mooring data, we also examined a 50-yr dataset of CTD casts from within Saanich Inlet for the impact of tides and upwelling on renewal. Nineteen renewal events were identified based on our selection procedure (Section 2.2). The strongest observed changes in density occurred for renewal events at low tidal current speeds (<0.8 m s-1) when upwelling, as indicated by a positive Bakun Index, was prevalent (Figure 4). However, the suppression of renewal events by downwelling is less clear here, possibly because the data available from individual profiles captured few events during times of downwelling. A similar multiple linear regression analysis suggested that tidal current speeds and the Bakun Index explain much less of the variance in the strength of renewal events from CTD data compared to the sill mooring analysis (Table 2). The normalized coefficients still demonstrate an important control by smoothed tidal current speeds, but no significant dependence on the Bakun Index could be detected. Several factors may explain the overall lower correlation. First, the timing of the CTD casts relative to renewals was much more variable. There was never more than a five day difference between the smoothed tidal current speed minimum and the maximum density observed at the sill mooring. However, event start profiles varied from days to hours prior to the minimum tidal current speed, while CTD profiles spanning an event were on average 11 days apart, ranging from 3 to 18 days. The geomorphology of Saanich Inlet is such that new water is introduced during a deep-water renewal event along the western edge of the basin, driven by the Coriolis force (Hamme et al., 2015). This spatial distribution leads to an east-west gradient in water mass properties within the deep-waters of Saanich Inlet, which then drives lateral mixing following deep-water renewal events. The inconsistent duration between profiles is likely to mean that some profiles capture renewal events before and some after the lateral mixing with older water. Similarly, a very short duration between profiles could mean that the full impact of the renewal event was not captured. Second, we show in Section 3.3 that when waters within deep Saanich Inlet are denser, this situation preconditions the inlet to experience stronger renewals. The multiple linear regression analysis presented here does not consider the average density of the deep water but only the density change from one profile to another.
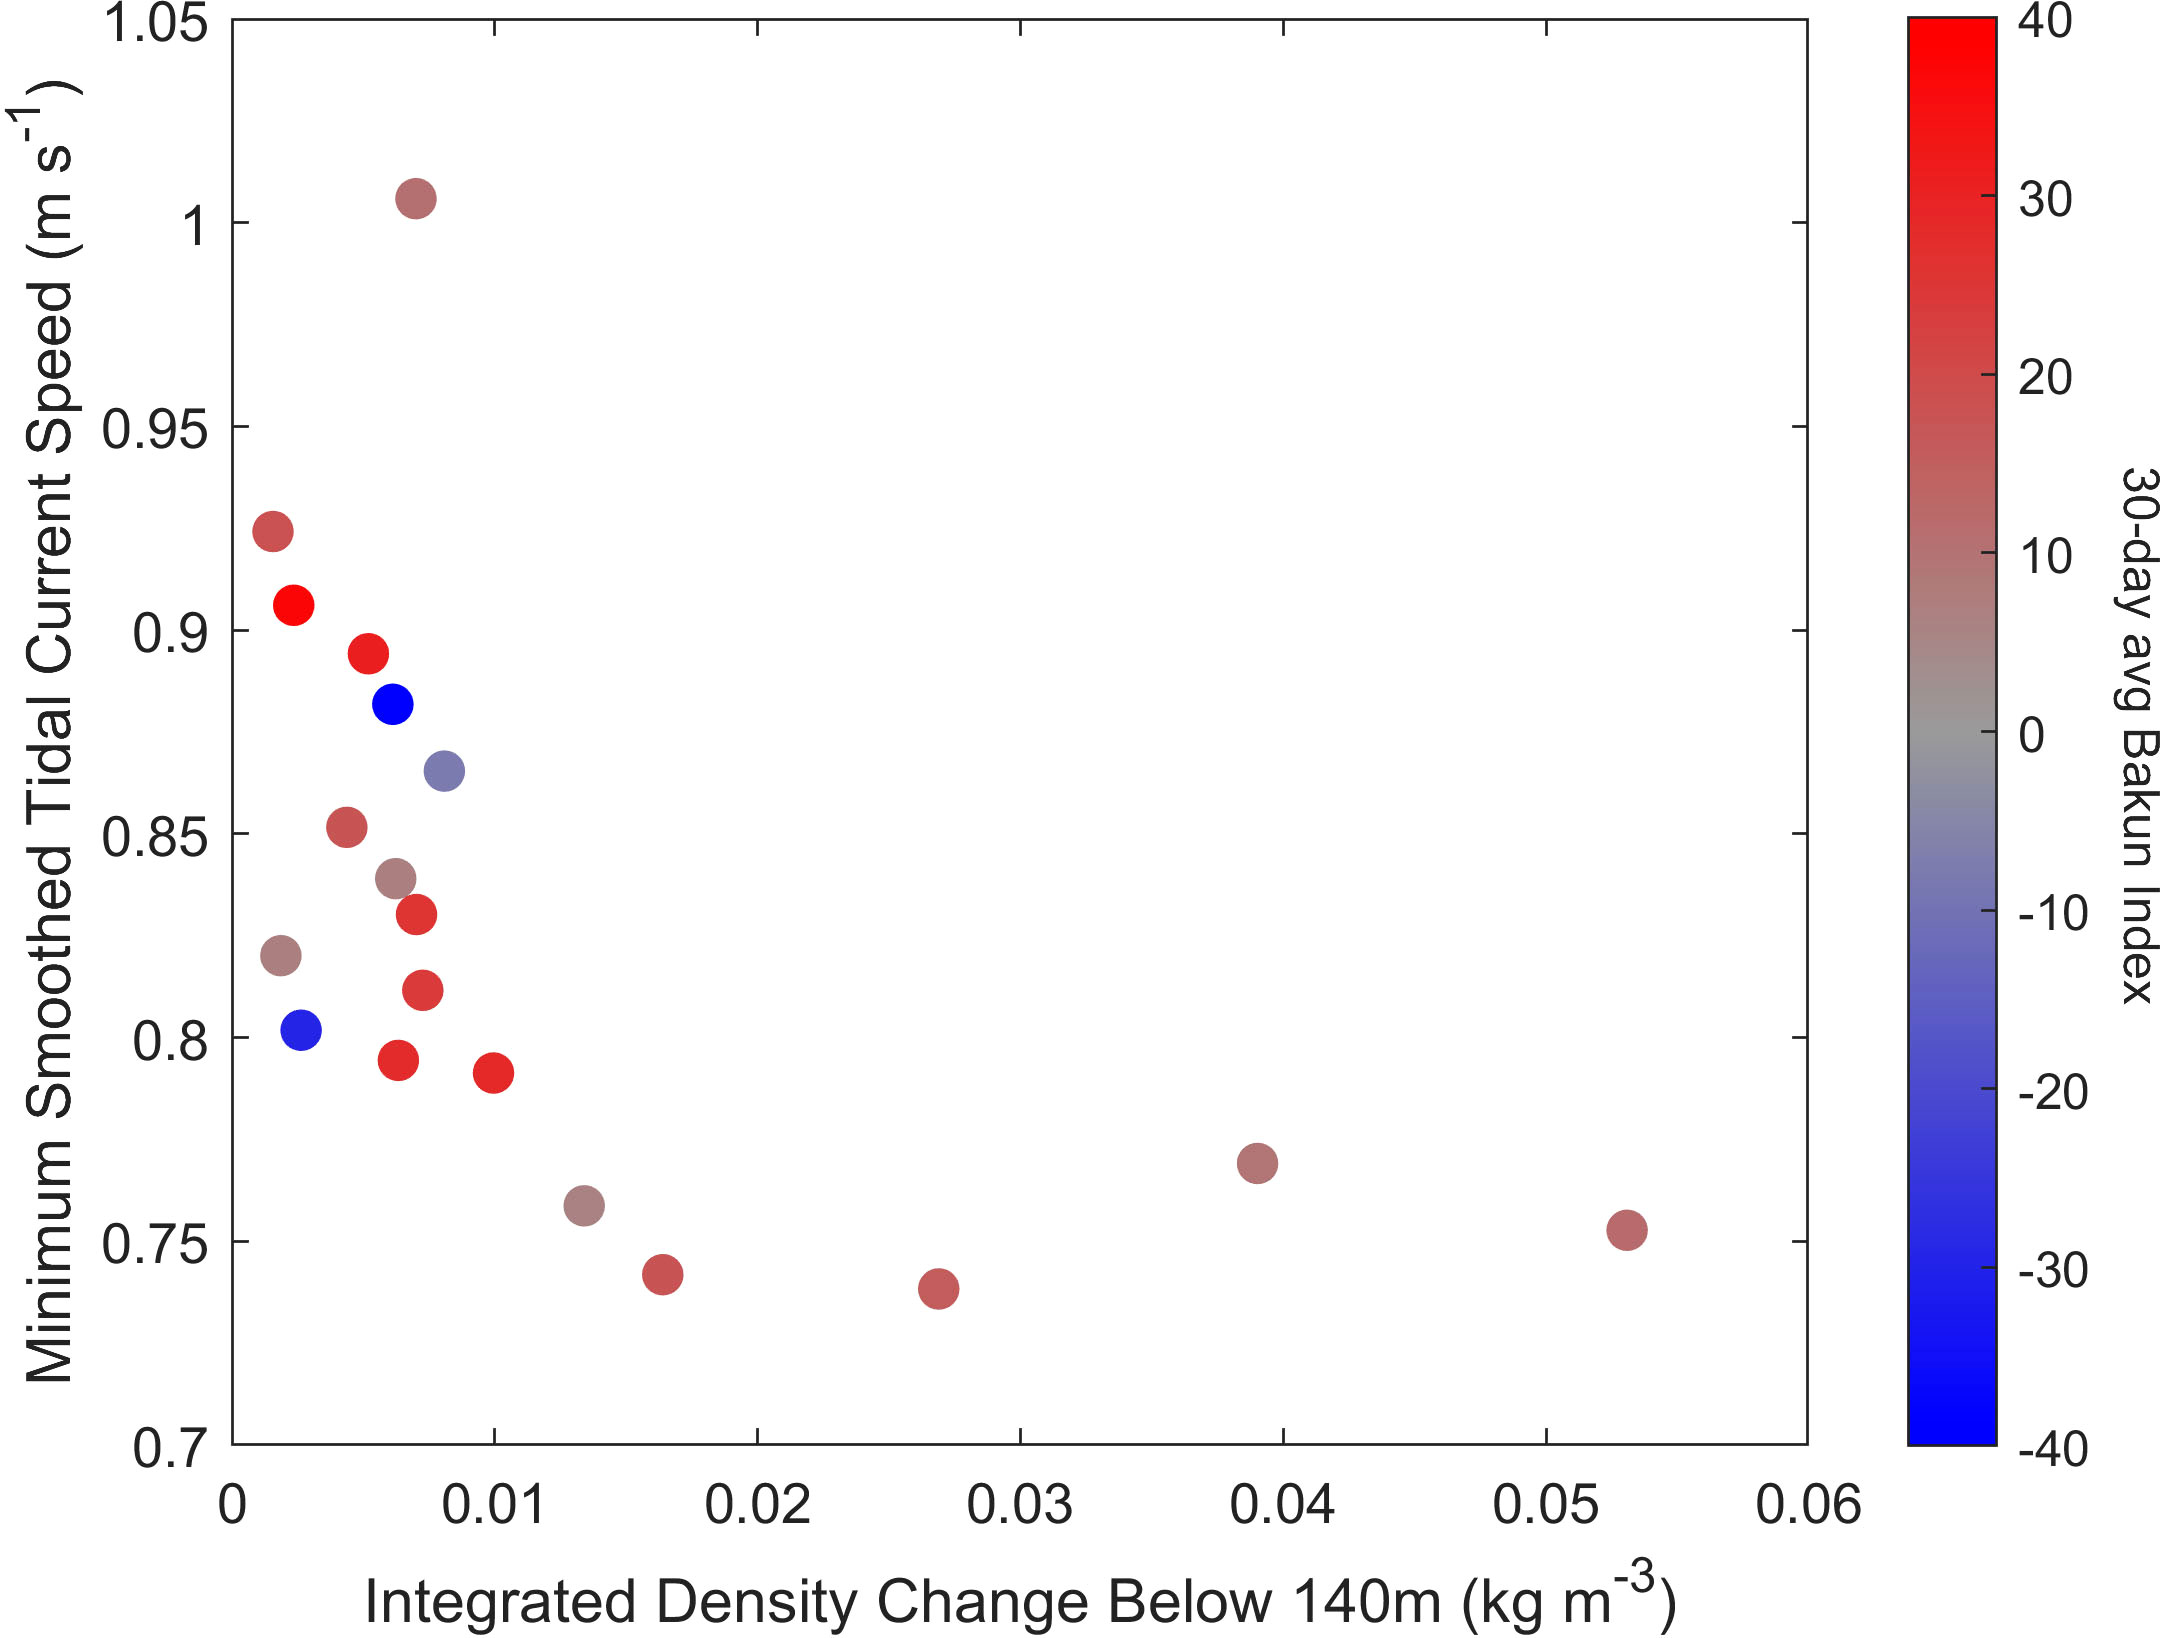
Figure 4 The minimum in the smoothed tidal current speed vs. the potential strength of a renewal event (change in potential density (Δσθ) below 140m observed through CTD casts in Saanich Inlet). Each renewal event is coloured by the average of the Bakun Index over the 30 days prior to the minimum smoothed tidal current speed.
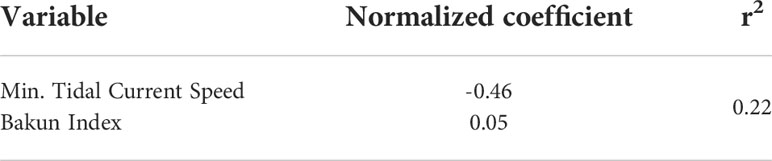
Table 2 Multiple linear regression analysis results for the dependence of the potential renewal strength on the minimum smoothed tidal current speed and the Bakun Index as observed through CTD casts in Saanich Inlet.
We considered whether river discharge into the region represented a significant third control on the potential strength of renewals, but found its inclusion did not improve predictions. The Cowichan River feeds into the northwest segment of the inlet (Figure 1B) and reaches a peak discharge of ~100 m3 s-1 in the winter season due to local rainfall (Pike et al., 2018). The Fraser River is the primary freshwater input to the Salish Sea (Figure 1A) and reaches a peak discharge near 7000 m3 s-1 in the summer due to snow melt (Griffin and LeBlond, 1990; Johannessen and McCarter, 2010). The discharge of Goldstream River at the southern part (head) of the inlet and Shawnigan Creak nearer the mouth are negligible at 5 and 8 m3 s-1, respectively (Herlinveaux, 1962; Campbell and Belcic, 2006). Freshwater input drives the estuarine circulation, which draws dense seawater landward along the bottom of the region’s straits, supplying the renewals. Although river discharge and upwelling have no direct effect on each other, upwelling conditions on the coast are somewhat correlated with discharge from both rivers, because all three have a strong seasonal cycle (r2 of 0.26 between Fraser River discharge and the Bakun Index and 0.47 between Cowichan River discharge and the Bakun Index). We performed a cross-validation analysis to show that the addition of river discharge records as additional explanatory variables did not improve predictions from the multiple linear regression (see Supplementary Material Section S5).
El Niño Southern Oscillation (ENSO) and coastal trapped waves also impact the density of waters entering the estuarine system, and may affect the potential strength of renewals in Saanich Inlet, but we could not assess the potential impact. Indeed, Masson (2002) suggested that El Niño conditions can lead to a shutdown of the deep-water renewal process in the Strait of Georgia, to the northeast of Saanich Inlet. Regional shifts in winds, Ekman transport, and associated upwelling strength occur during the warm and cool phases of ENSO (Alexander et al., 2002; Alexander and Scott, 2008); these effects should be included in the wind-based Bakun Index. However, coastal trapped waves also depress the pycnocline off the coast of British Columbia during El Nino, leading to upwelling of lower density water (Miller et al., 1997; Fiedler et al., 2013; Ray et al., 2020). Our time series from the sill mooring (2012-2020) is too short to investigate an interannual variation like ENSO, so its impact on Saanich Inlet remains unquantified. More generally, coastal trapped waves play an important role in upwelling dynamics in this region, independent of the winds and apart from their interaction with ENSO (Freeland and Denman, 1982; Frischknecht et al., 2015; Engida et al., 2016). However, a time series of the occurrence of these waves is not available for analysis.
3.2 Renewals create complex water mass layering
Summer and fall of 2016 experienced four distinct renewal events, captured in unprecedented detail by the profiling mooring in the central inlet (Figure 5). Each pulse of higher density water observed at the sill mooring began approximately a day before the lowest average smoothed tidal current speeds (beginning of pink bars/vertical lines in Figure 5) and lasted for 6-9 days. The higher density water was oxygen rich compared to bottom water over the sill either before or after the event (Figure 5C). Oxygen concentration over the sill actually experienced a maximum every 14 days, but density only showed significant increases during the weaker neaps in tidal current speed.
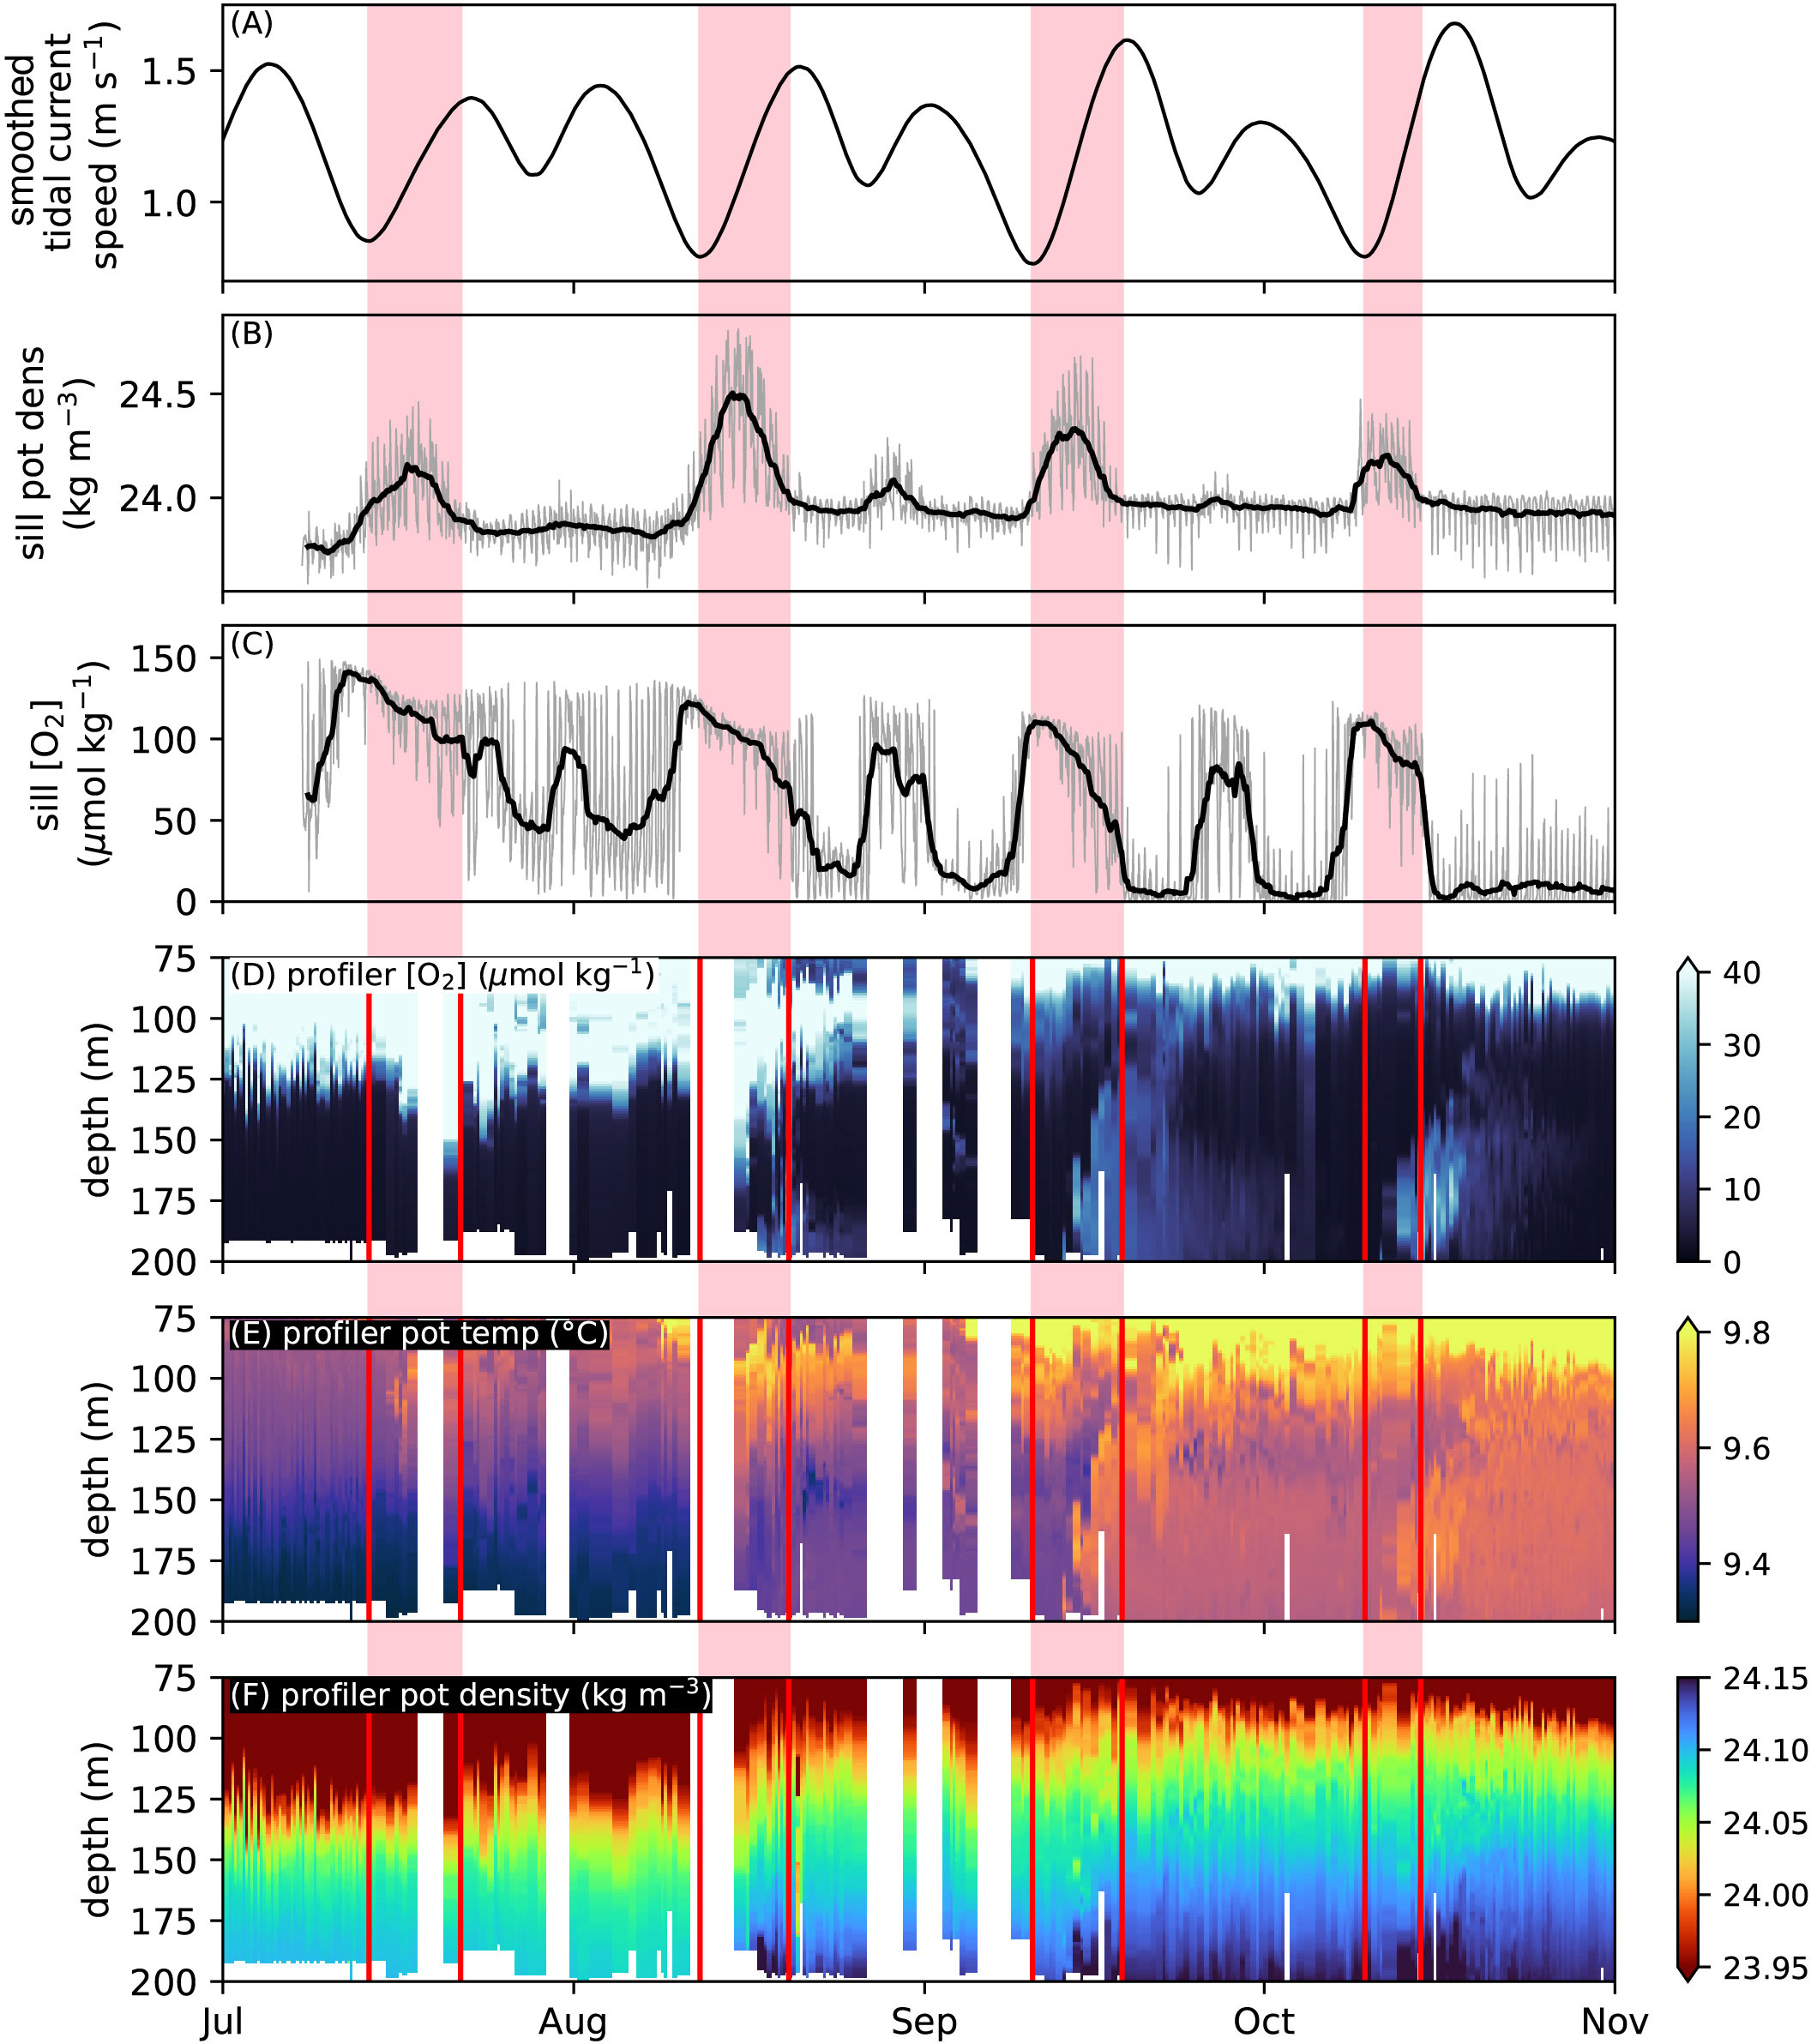
Figure 5 Overview of 2016 renewal season. (A) Smoothed tidal current speeds at Active Pass (m s-1). (B) Potential density (σθ kg m-3) at the sill mooring. (C) Oxygen concentration (μmol kg-1) at the sill mooring. (B, C) Grey lines show 10-min frequency data. Black lines show 50-hr triangular filter. (D) Oxygen concentration (μmol kg-1) at the profiling mooring. (E) Potential temperature (°C) at the profiling mooring. (F) Potential density (σα kg m-1) at the profiling mooring. (A-F) Pink bars/red lines indicate the renewal event from the minimum in smoothed tidal current speed in (A) to the approximate return of the sill mooring density to the baseline in (B). (D-F) Only waters deeper than 75 m are shown.
These four renewal events in 2016 had very different effects on the deepest waters of the inlet. The profiling mooring observed no changes to water properties below 160 m during July (Supplementary Figure S3), suggesting that the July renewal did not penetrate to the bottom of the inlet. In contrast, the next three renewal events affected depths all the way to the bottom, bringing new warmer, denser, saltier, and more oxygen rich waters to these depths (Figures 5D-F). The profiling mooring executed very few profiles during the August renewal (Supplementary Figure S4), so we do not consider this event further and instead focus on the September and October renewals.
Water intruded at different densities and then mixed in several stages during the September renewal (Figure 6). New, warmer, saltier, and oxygen-rich water first intruded to a depth of ~130 m during 9-12 Sept. Data from the profiling mooring is missing 5-8 Sept, so we cannot precisely quantify the date of the first change, but the minimum in tidal current speed is near this time on 10 Sept. In the next three days (13-15 Sept), new water is observed intruding below 160 m. This new water mass appears to displace the previous water mass upward (note the shoaling partway through the September renewal of the lower temperature, low oxygen water mass and the persistence of that signal at shallower depths for a week in Figure 5). New water is not observed at 130-160 m until 16 Sept. Density over the sill returned to pre-renewal levels by 18 Sept. During 22-25 Sept, the profiling mooring then captured the relaxation of properties at 120-160 m toward pre-renewal conditions. New water enters the inlet from the north hugging the western side of the inlet, then mixes laterally with older anoxic water present on the eastern side of the inlet (Hamme et al., 2015). Here we see evidence of that mixing process, as waters become cooler and less oxygen rich at 120-160 m following the main September renewal period.
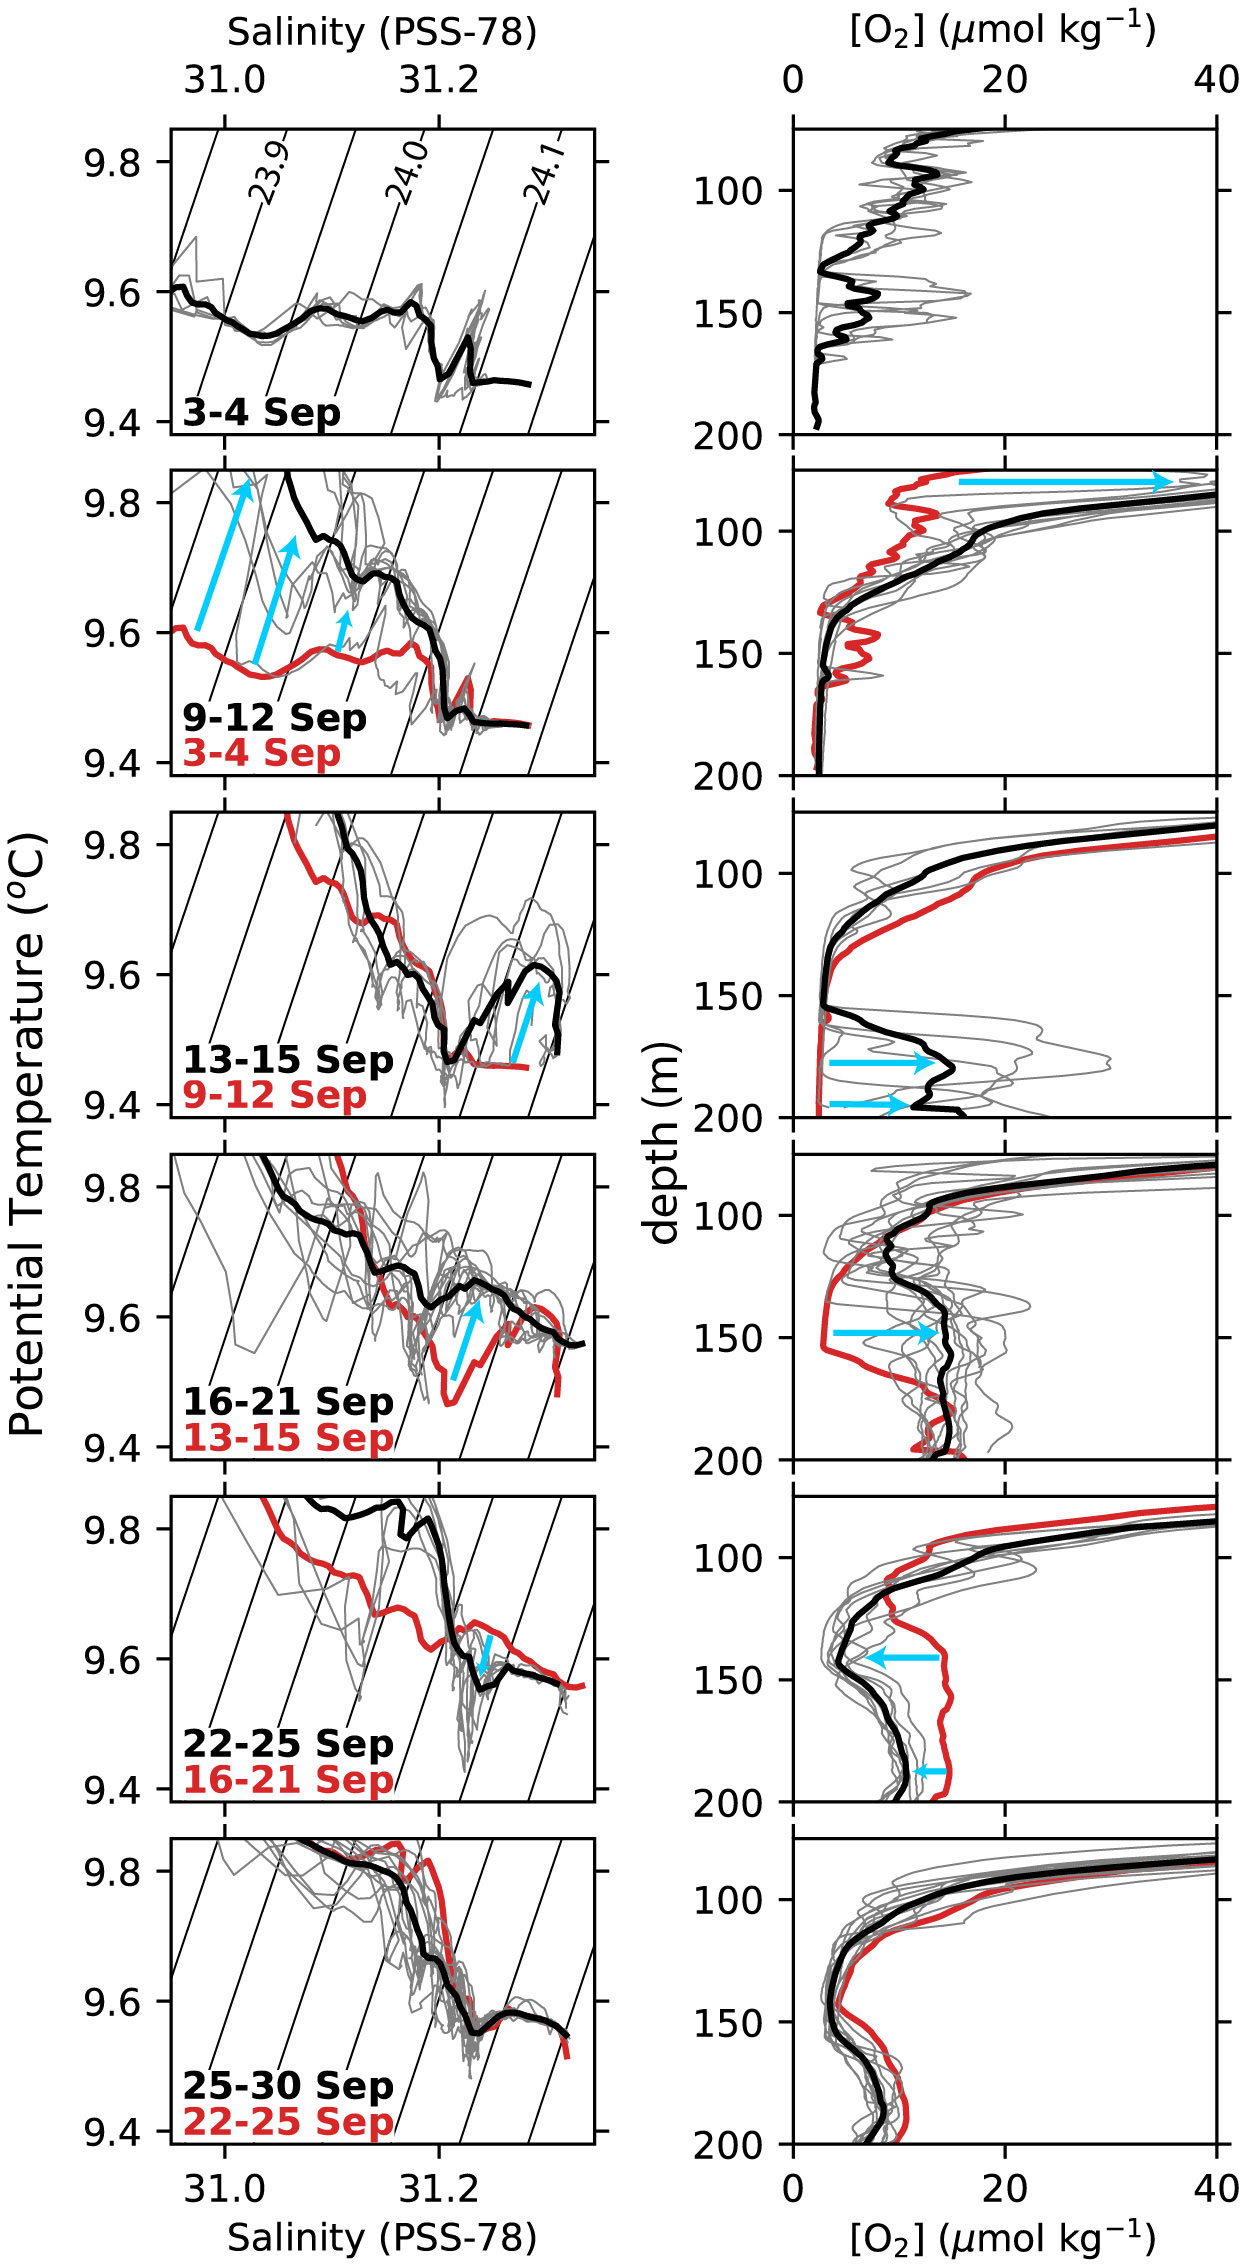
Figure 6 Detailed profiles over the Sept 2016 renewal event. Left hand panels show T-S diagrams with potential temperature on the y-axis and salinity on the x-axis. Black contours are lines of constant potential density (σθ kg m-3, labeled in the top panel). Right hand panels show depth profiles of O2 concentration deeper than 75 m. In each panel thin grey lines show individual profiles collected by the profiling mooring during the dates shown in black text, while the thick blackline is the average of the individual profiles. Thick red line shows the average of individual lines from the panel above (during the dates shown in red text). Blue arrows highlight changes between the red and black dates. Missing dates indicate missing data.
The October renewal showed contrasting behavior (Figure 7). New water appeared first at the deepest depths (>130 m) beginning on 11 Oct, two days after the lowest tidal current speeds. The largest changes in water properties were centered at 160-180 m, but small changes were observed down to the deepest depths. By 18 Oct, changes were observed above 130 m, and the properties of water at deeper depths relaxed partly back to early October observations, again likely by lateral mixing with older waters.
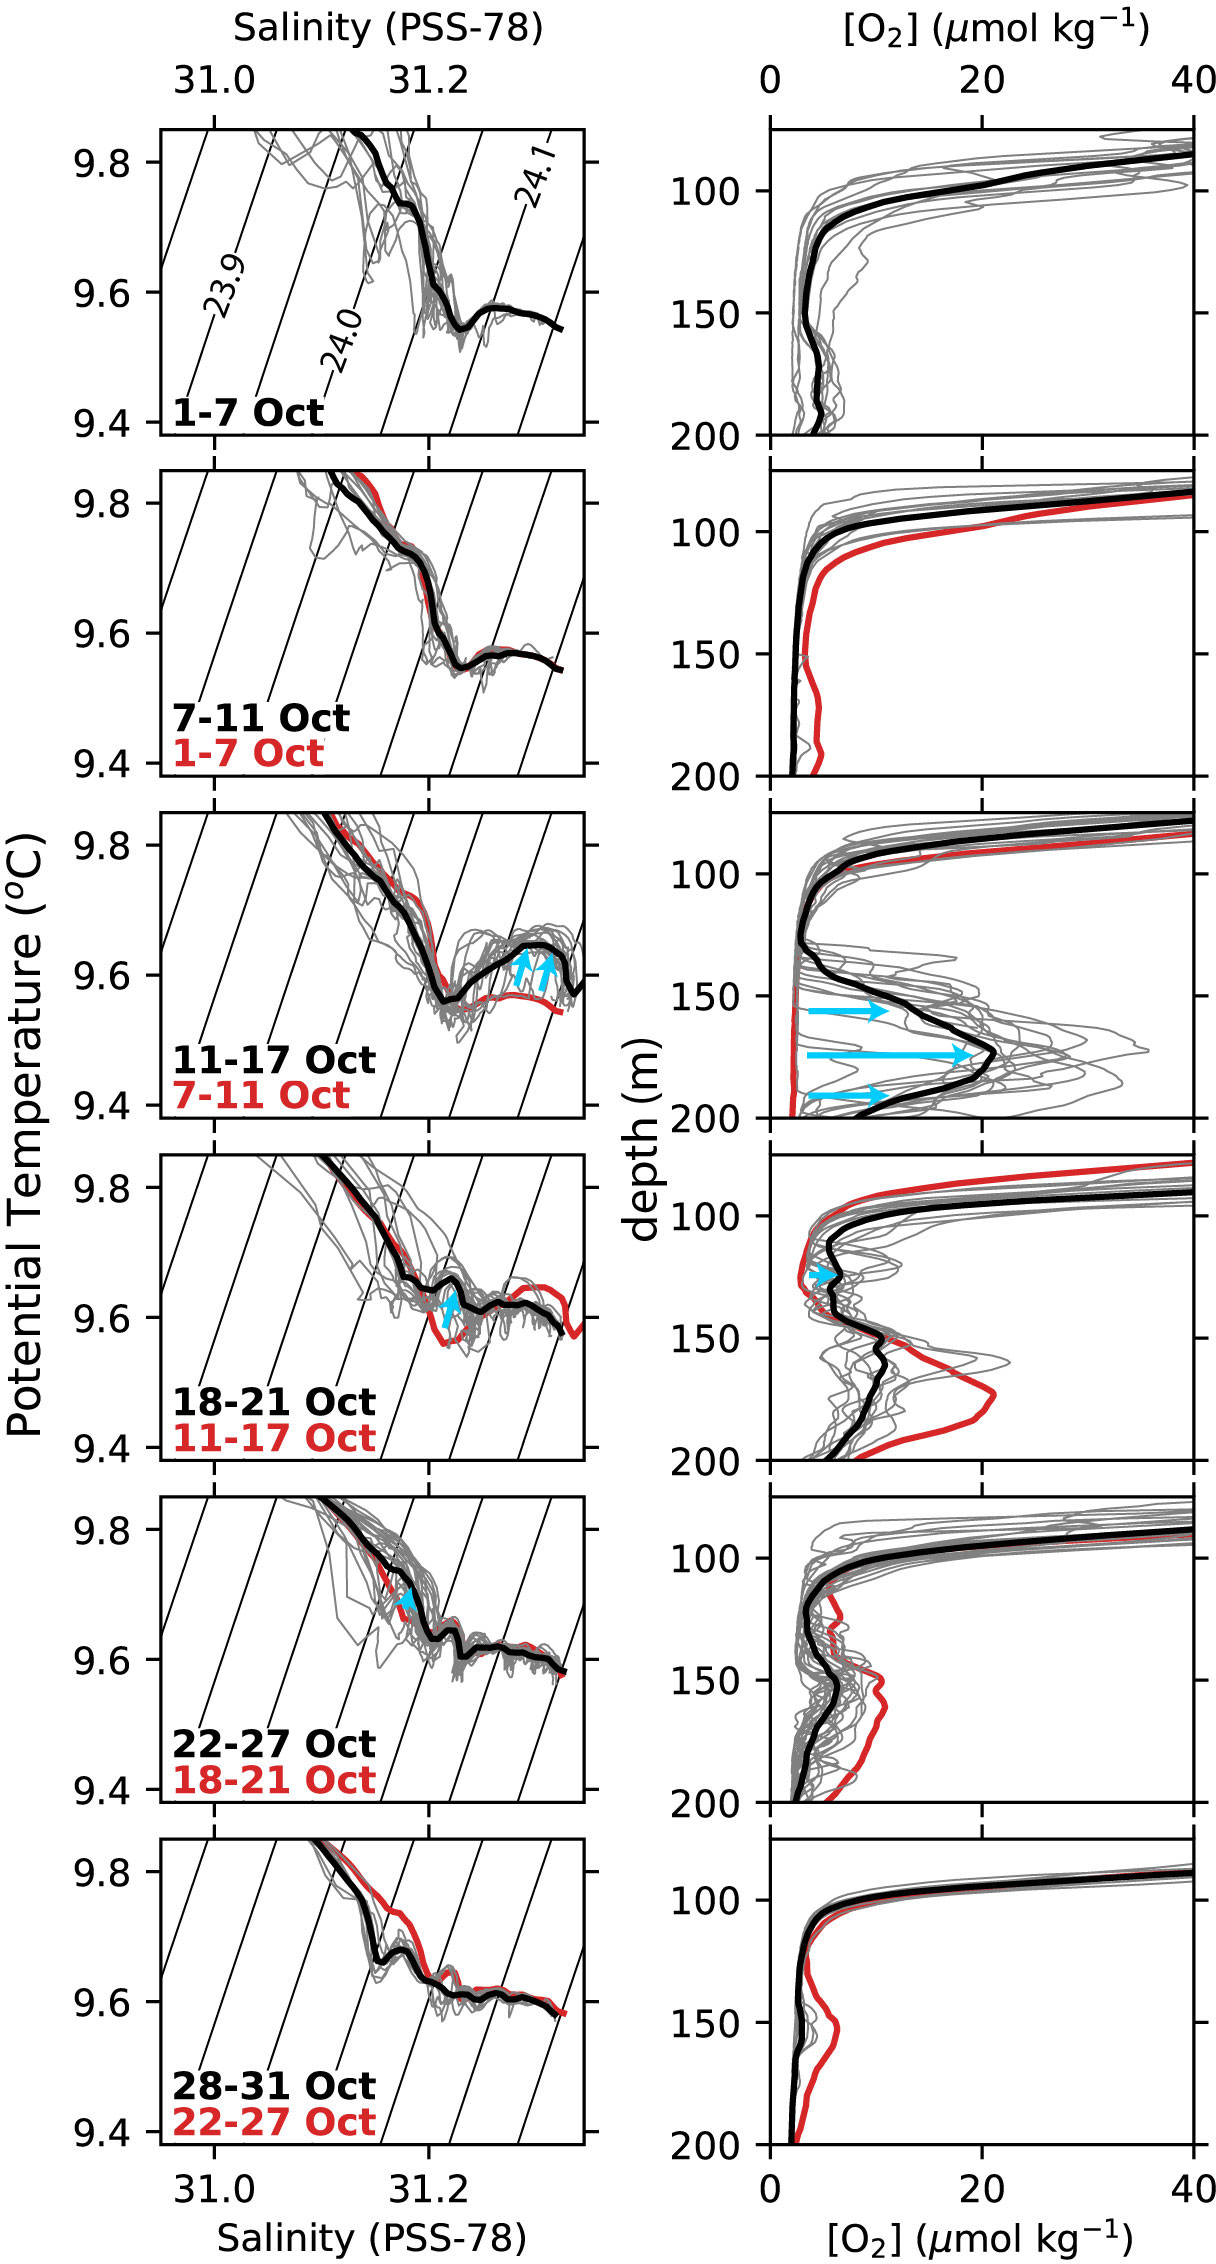
Figure 7 Same as Figure 6 but for October 2016.
The result of each renewal, and indeed the entire renewal season, was not a new homogeneous water mass filling the deep Saanich Inlet. Instead, the progressive intrusion of waters of different densities at different depths resulted in a layered injection of warmer, saltier waters carrying oxygen. The V-shaped cross-section of the inlet (Figure 1B) means that these injections of new water encounter varying volumes of old, anoxic water. Lateral mixing (Hamme et al., 2015) finally creates layers containing different proportions of new oxygenated waters and old anoxic waters present in the inlet since renewal events of the previous year, which are likely laterally homogeneous while remaining vertically distinct. We suspect that this behavior is characteristic of renewal events in Saanich Inlet generally, but the profiling mooring dataset from 2016 is the first profile data with such high temporal resolution where the phenomenon can be clearly observed.
3.3 Renewals condition the deep waters to promote subsequent renewals
The very different behavior of these 2016 renewals - July did not reach bottom, September began at shallower depths, October began at the deeper depths - suggests variability in the conditions of renewal that affect the resulting waters masses in Saanich Inlet. Of the four renewal periods, July had the highest smoothed tidal current speeds (minimum at 0.85 m s-1 compared to 0.76-0.79 m s-1 for the other three renewals). Despite higher current speeds, the maximum density observed over the sill in July was similar to that in October (though lower than both August and September) and sustained for longer than in October. Note that the lower density change in October despite the low tidal current speeds is explained by the reduction in coastal upwelling at that time (30-d mean Bakun Index of -10 for the October 2016 event vs. 13-35 for the other events that year).
We suggest that each renewal within a single season conditions the inlet to promote further renewals. In July, the density of the water column within the inlet is at its lowest value at every depth (Figure 5F). This low density means that new dense water flowing over the sill encounters and mixes with low density water within the inlet, creating a mixed water mass with lower density than if that same entering water had encountered higher density inlet water. As each subsequent renewal emplaces higher density water within the inlet, water entering at the next renewal encounters a smaller density contrast, remains at higher density as it flows into the inlet, and is more likely to reach the deepest depths. The idea that higher density water within the inlet promotes renewals may seem counter-intuitive, but the notion that water entering the inlet experiences significant mixing is supported by the higher density of inflowing water (values as high as 24.4 σθ observed at the sill mooring for brief periods in July) compared to the maximum density where changes are observed at the profiling mooring (24.05 σθ in July).
The differences between the September and October renewals, with the October renewal characterized by density changes at the bottom first, may be partially explained by this same effect, but here the density of the inflowing water appears to be an additional factor. The density of the water observed over the sill during renewal events is variable, largely in phase with the semi-diurnal tidal cycle, higher density during flood tide and lower density during ebb tide (Figure 8). This relationship between density over the sill and the semi-diurnal tides was first hypothesized by Anderson and Devol (1973) and makes sense as flood tide brings water outside the inlet toward the inlet and ebb removes lower density water from the inlet. The start of the October renewal was characterized by unusually high densities, while the density observed over the sill during the September renewal built slowly over several days. Lower density water entering at the start of the September renewal would have intruded at shallower depths than the unusually high density water entering at the start of the October renewal.
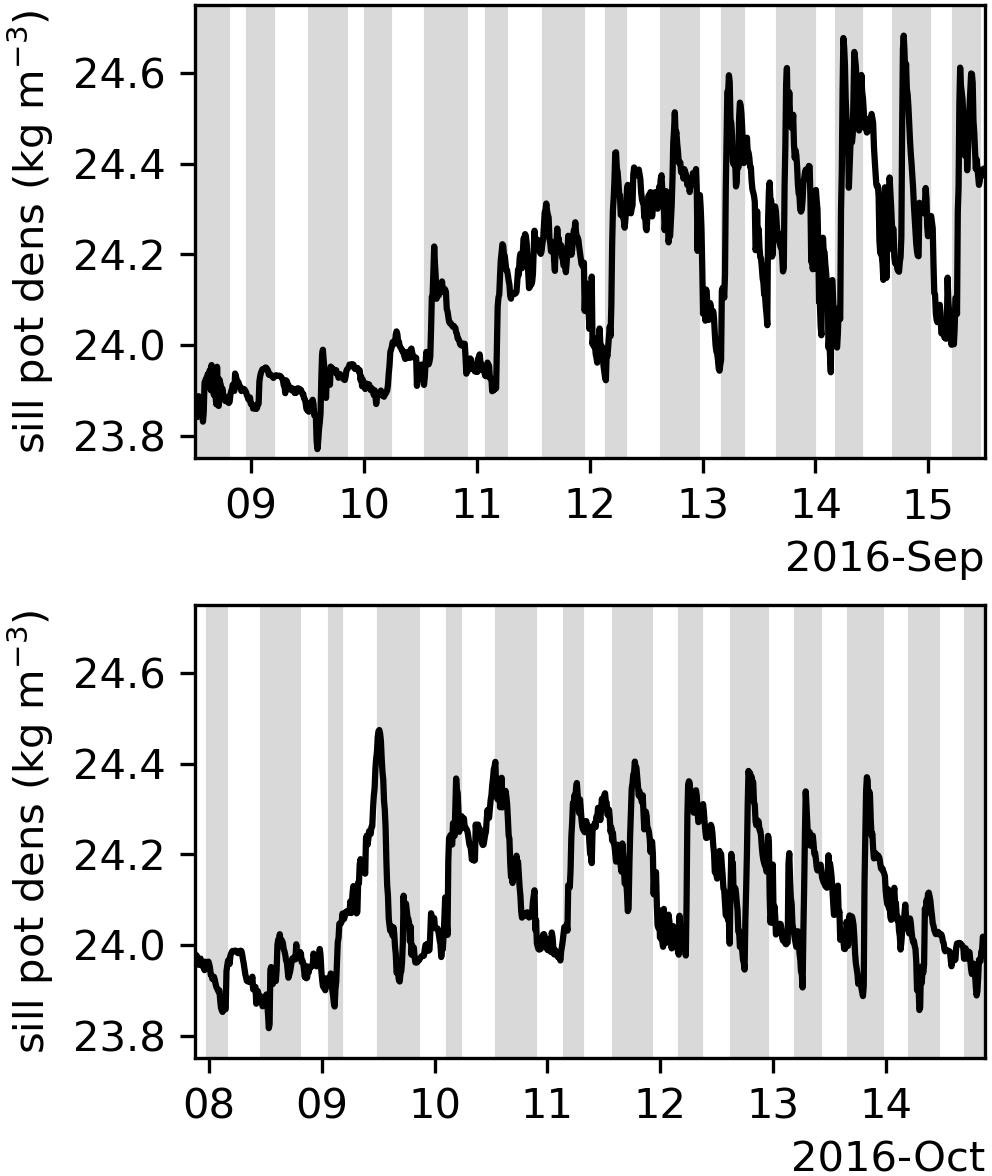
Figure 8 Potential density (σθ kg m-3) at the sill mooring, 10-min frequency data. Upper panel shows data from one week in September 2016 while lower panels shows one week in October 2016. Each time period begins two days before the minimum in smoothed tidal current speed predicted at Active Pass. Grey bars in background mark flood tide/white marks ebb tide.
4 Conclusions and implications for prediction
Being able to predict renewal events that flush the deep waters of Saanich Inlet is important to experiment planning in this accessible, natural laboratory used to investigate processes and organisms in oxygen deficient zones (e.g., Manning et al., 2010; Bourbonnais et al., 2013; Hawley et al., 2014; Chu and Tunnicliffe, 2015; Capelle et al., 2019; Torres-Beltrán et al., 2019; Ji et al., 2020). Understanding Saanich Inlet renewal events may also help to understand such events in other fjords, especially ones marked by periodic low oxygen conditions (Levings, 1980; Newton et al., 2007). Probably due to its location separated from the coast by many kilometers of straits and sills where mixing is enhanced, renewals in Saanich Inlet may be more strongly controlled by tidal current speeds than basins where only a single sill or a short distance separates them from coastal waters. For example, Barkley Sound on the west coast of Vancouver Island appears strongly controlled by upwelling alone (Pawlowicz, 2017). Upwelling supplying dense waters has also been the primary explanation for basin renewal events in Santa Barbara Basin (Bograd et al., 2002). Effingham Inlet, near Barkley Sound, displays fortnightly variations in water intrusions but a clear link to spring-neap timing has not been identified (Thomson et al., 2017). In contrast, reduced mixing during neap tides has been shown to play an important role in the occurrence of intrusions of high density waters into the nearby Strait of Georgia and into Puget Sound, a region of the southern Salish Sea with several sills separating it from the open ocean (Geyer and Cannon, 1982; Cannon et al., 1990; Griffin and LeBlond, 1990; Lavelle et al., 1991; LeBlond et al., 1991; Masson and Cummins, 2000; Masson, 2002; Leonov and Kawase, 2009). Our study establishes the link between the strength of the neap and the likelihood of renewal, which likely characterizes these other fjords of the Salish Sea. Note that the studies mentioned above that focus on upwelling alone are based on low temporal resolution sampling (monthly or quarterly) and could miss a potential role of tidal currents that our high resolution data reveals. However, renewals of other intermittently anoxic basins, for example the deep Baltic Sea, have been firmly tied to specific wind conditions in the region (Schinke and Matthäus, 1998), demonstrating that tidal currents do not play a role everywhere.
Our analysis reveals that the density of water flowing over the Saanich Inlet sill is controlled by tidal current speeds and upwelling dynamics. Tidal current speeds have a larger role in determining the potential strength of a renewal event but unfavourable upwelling dynamics (i.e. downwelling conditions) can lead to weaker renewals. This dominance by currents suggests that, in general, the predictable tidal current speeds at Active Pass can be used to plan cruises in Saanich Inlet, and that variations in tidal current speeds should be a primary avenue for investigation of other silled basins. However, the seasonally and interannually varying upwelling dynamics off the west coast of Vancouver Island inject a factor of unpredictability. We go on to show that the actual flushing of the deep waters within the inlet is affected by previous flushing events, so that each renewal within a single season conditions the inlet to subsequent renewals by lowering the density contrast between the waters flowing over the sill and those already within the inlet. This conditioning suggests that a series of events with high density water flowing over the sill is necessary to replace a large proportion of the deep waters in the inlet.
Although tidal current speeds in the region are very predictable for many years into the future, they vary strongly both seasonally and interannually, causing renewals to typically be observed in Saanich Inlet in late summer and early fall and creating the potential for some years to experience much stronger renewals than others (e.g., Capelle et al., 2018). Bylhouwer et al. (2013) show that upwelling near the mouth of the Juan de Fuca Strait typically begins in mid-May, ends in mid-September, and fully transitions to downwelling by mid-November. The lowest tidal current speeds in the region are not typically observed until mid-July and last until mid-November (Figure 9A). Based on this timing, we conclude that the greatest possibility for full-bottom water renewals exists from mid-July to mid-October, with greater likelihood towards the end of this period given the pre-conditioning of the water column by earlier renewals. Experiments that require a well developed anoxic water column with significant sulfide concentrations should be planned for the period from winter to very early summer. Significant sulfide concentrations are typically observed by mid-January, especially farther south within the inlet (observations by the University of Victoria Ocean Science Minor program), and continue accumulating until the next renewal. Note that occasional mid-water renewal events have been observed in winter and spring, but these have not flushed the very deepest waters (e.g., Manning et al., 2010).
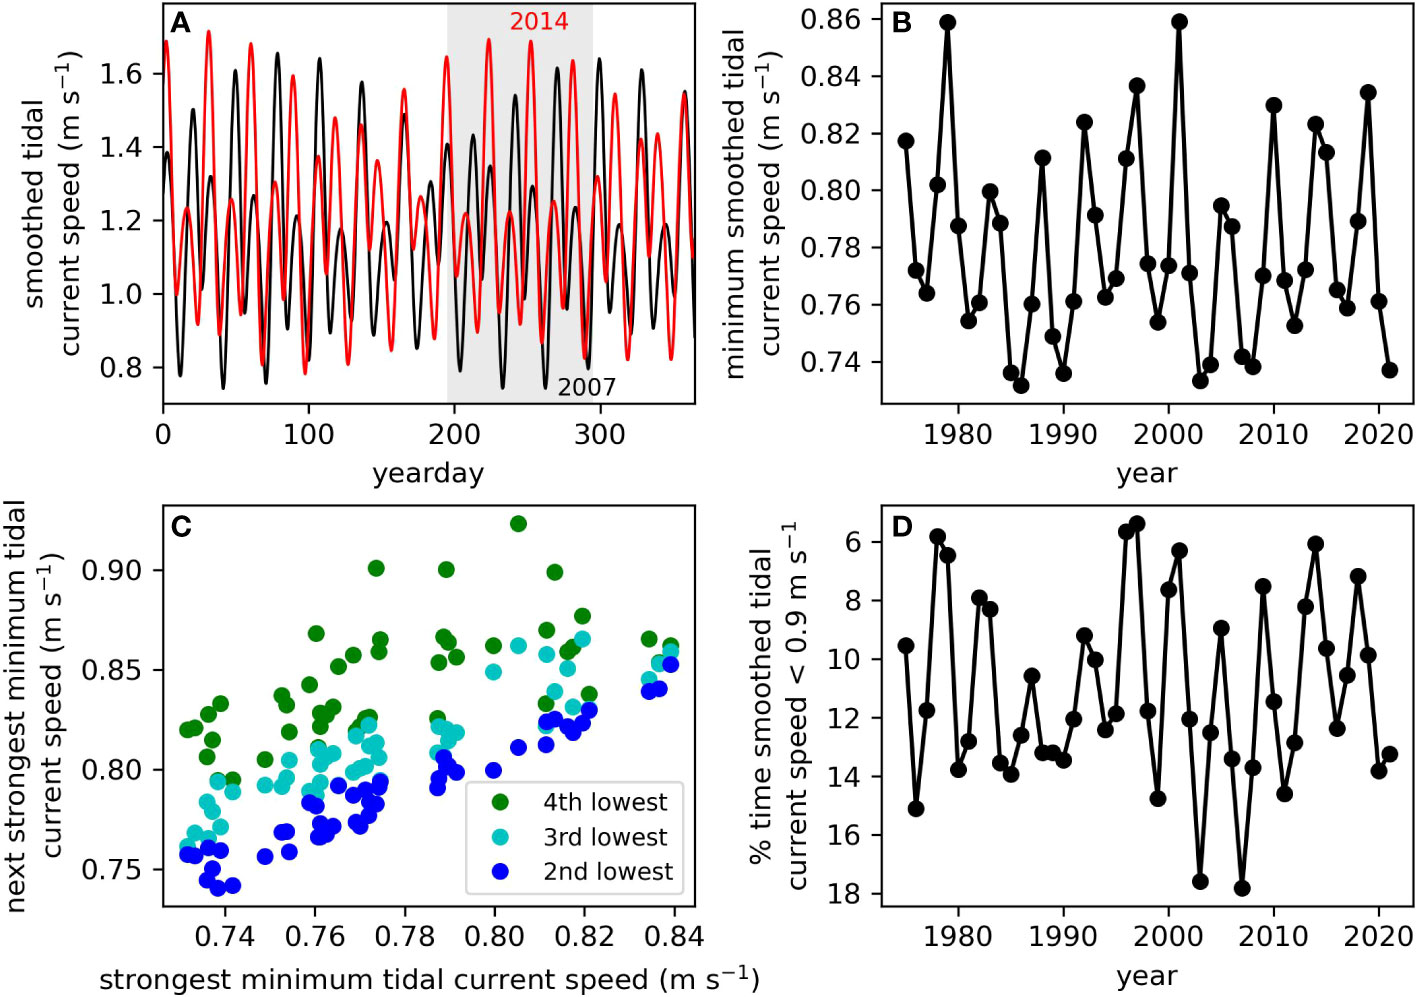
Figure 9 Interannual variability in tidal current speed. (A) Predicted smoothed tidal current speeds in 2007 with strong minimums (black) and in 2014 with weak minimums (red). Grey background shows the summer/fall renewal period considered in the rest of the panels. (B) Minimum smoothed tidal current speed predicted during the renewal season in a given year. (C) Correlation between the minimum smoothed tidal current speed during the renewal season in a given year and the 2nd (blue), 3rd (cyan), and 4th (green) lowest events in the same season and year. (D) Percentage of time smoothed tidal current speed is below 0.9 m s-1 during the renewal season in a given year. Note the y-axis is reversed to show the correspondence with the panel above.
Based only on tidal current speeds, there are large differences in the potential for renewals between years, even within the late summer/early fall period (compare 2007 with several strong minima in smoothed tidal current speeds with 2014 where such strong minima are not observed, black vs. red lines in Figure 9A). The strongest minima in smoothed tidal current speed varies between 0.73 and 0.86 m s-1 among different years (Figure 9B). Moreover, years with one strong minima are likely to experience several strong minima as shown by the high correlation between the strongest minima in each year and the 2nd, 3rd, and 4th strongest minima in the same year (Figure 9C). Similarly, years with a strong minima are also likely to have a larger percentage of the renewal season at lower current speeds (Figure 9D). Experiments that rely on a strong flushing of the deep Saanich Inlet should be planned for those years that experience the strongest reductions in tidal current speeds (see Supplementary Material Figure S5 for predictions for the next 50 years) and targeted for just past the lowest tidal current speeds in August and September. Over the next decade, 2025 is an example of a year likely to experience strong renewals based on very low tidal current speeds, whereas 2032 is an example of a year that may experience no renewal at all (Supplementary Material Figure S5). Note that factors that cannot be predicted so far in advance may strongly enhance or hinder renewals, particularly upwelling strength, which may be affected not only by local winds but also by coastal trapped waves and ENSO, but also potentially river discharge. Future climate change may also impact upwelling and the estuarine circulation of the Salish Sea in ways that affect renewal strength in Saanich Inlet but are not easily predicted.
Finally, we emphasize that renewals do not result in deep Saanich Inlet being filled with a new homogeneous water mass. Several previous studies have shown that renewal events do not completely replace the previously anoxic waters in the inlet, but instead create mixtures of old and new water in varying proportions (Anderson and Devol, 1973; Lee et al., 1999; Manning et al., 2010). Here we show that renewal events result in a complex layering of water masses, with each layer containing different proportions of old and new water. This layering is caused by the variations in the density of water flowing over the sill during a renewal event and by the V-shape of the inlet with different volumes of old water encountered at each depth. Such layering of water masses with different physical and biogeochemical properties as the result of each renewal event has strong implications for ecosystem shifts and process rates in these different layers (companion paper) and is likely to characterize other systems with occasional renewal events as well.
Data availability statement
The 2012-2020 sill mooring and 2016 profiling mooring datasets analyzed for this study are openly available from Ocean Networks Canada at https://data.oceannetworks.ca/, and are presented as a dataset collection at https://doi.org/10.26152/rk52-qy70. Bakun Index values were obtained from the Environmental Resource Division of the National Oceanic and Atmospheric Administration (NOAA), https://oceanview.pfeg.noaa.gov/products/upwelling/dnld. Daily river discharge data for the Cowichan and Fraser Rivers was extracted from the Environment and Climate Change Canada Historical Hydrometric Data web site, https://wateroffice.ec.gc.ca/mainmenu/historical_data_index_e.html.
Author contributions
GS analyzed the sill mooring data (Section 3.1) and drafted the first version of much of the manuscript. ER analyzed and presented the initial interpretation of the profiling mooring data. RH expanded the profiling mooring analysis, drafted the first version of Sections 3.2 and 3.3, and revised the manuscript. All authors contributed to revising the figures and manuscript and approved the submitted version.
Funding
Funding for this work came from the Natural Sciences and Engineering Research Council of Canada (NSERC) under DG 328290-2012 and University of Victoria internal funding to RH, a Jamie Cassels Undergraduate Research Award to GS, and an NSERC Undergraduate Student Research Award to ER.
Acknowledgments
We are grateful to the following people whose work helped make this paper possible: Adam Monahan for statistical advice, Caitie Frenkle for initial analysis of the profiling mooring data, Akash Sastri (ONC) for facilitating the deployment of the profiling mooring and initial work with the data, Rowan Fox for code to download and process the profiling mooring data, Frank Whitney for emphasizing the importance of interannual tidal variations to Saanich Inlet renewals at the 2016 Saanich Inlet Symposium, Petra Clementson and Pandora Gibbs for work creating and updating the Saanich Inlet CTD profile database, Alice Olga Victoria Bui (ONC) for communicating key metadata, Melissa Cuthill (ONC) for creating the data citation, and Frank Whitney, Brett Jameson, and Philippe Tortell for comments on a draft of the manuscript.
Conflict of interest
The authors declare that the research was conducted in the absence of any commercial or financial relationships that could be construed as a potential conflict of interest.
Publisher’s note
All claims expressed in this article are solely those of the authors and do not necessarily represent those of their affiliated organizations, or those of the publisher, the editors and the reviewers. Any product that may be evaluated in this article, or claim that may be made by its manufacturer, is not guaranteed or endorsed by the publisher.
Supplementary material
The Supplementary Material for this article can be found online at: https://www.frontiersin.org/articles/10.3389/fmars.2022.1001146/full#supplementary-material
References
Alexander M. A., Bladé I., Newman M., Lanzante J. R., Lau N.-C., Scott J. D. (2002). The atmospheric bridge: The influence of ENSO teleconnections on air–sea interaction over the global oceans. J. Climate 15, 2205–2231. doi: 10.1175/1520-0442(2002)015<2205:TABTIO>2.0.CO;2
Alexander M. A., Scott J. D. (2008). The role of Ekman ocean heat transport in the northern hemisphere response to ENSO. J. Climate 21, 5688–5707. doi: 10.1175/2008JCLI2382.1
Anderson J. J., Devol A. H. (1973). Deep water renewal in Saanich Inlet, an intermittently anoxic basin. Estuar. Coast. Mar. Sci. 1, 1–10. doi: 10.1016/0302-3524(73)90052-2
Bakun A. (1973). Coastal upwelling indices, West Coast of North America 1946-1971. (Seattle, WA, USA:Department of Commerce, National Oceanic and Atmospheric Administration, National Marine Fisheries Service) SSRF–671, 103pp.
Bograd S. J., Schwing F. B., Castro C. G., Timothy D. A. (2002). Bottom water renewal in the Santa Barbara Basin. J. Geophys. Res.: Oceans 107, 9–1. doi: 10.1029/2001JC001291
Bourbonnais A., Lehmann M. F., Hamme R. C., Manning C. C., Juniper S. K. (2013). Nitrate elimination and regeneration as evidenced by dissolved inorganic nitrogen isotopes in Saanich Inlet, a seasonally anoxic fjord. Mar. Chem. 157, 194–207. doi: 10.1016/j.marchem.2013.09.006
Bylhouwer B., Ianson D., Kohfeld K. (2013). Changes in the onset and intensity of wind-driven upwelling and downwelling along the North American Pacific coast. J. Geophys. Res.: Oceans 118, 2565–2580. doi: 10.1002/jgrc.20194
Camargo D., Murowinski E., Lueck R., Wolk F. (2014). “Turbulence over the sill of Saanich Inlet, BC, Canada,” in Proceedings of the 17th Physics of Estuaries and Coastal Seas (PECS) conference. Available at: https://rocklandscientific.com/wp-content/uploads/2015/01/xabs_183_Camargo_etal.pdf.
Campbell C., Belcic B. (2006). Shawnigan-Goldstream water allocation plan. (Victoria, BC, Canada:Water Stewardship Division, Ministry of Environment, Province of British Columbia).
Cannon G., Holbrook J., Pashinski D. (1990). Variations in the onset of bottom-water intrusions over the entrance sill of a fjord. Estuaries 13, 31–42. doi: 10.2307/1351430
Capelle D., Hallam S., Tortell P. (2019). Time-series CH4 measurements from Saanich Inlet, BC, a seasonally anoxic fjord. Mar. Chem. 215:1–10. doi: 10.1016/j.marchem.2019.103664
Capelle D. W., Hawley A. K., Hallam S. J., Tortell P. D. (2018). A multi-year time-series of N2O dynamics in a seasonally anoxic fjord: Saanich inlet, British Columbia. Limnol. Oceanography 63, 524–539. doi: 10.1002/lno.10645
Carter N. M. (1934). Physiography and oceanography of some British Columbia fjords. Proc. Fifth Pacif. Sci. Cong 1, 721.
Chu J. W., Tunnicliffe V. (2015). Oxygen limitations on marine animal distributions and the collapse of epibenthic community structure during shoaling hypoxia. Global Change Biol. 21, 2989–3004. doi: 10.1111/gcb.12898
Emerson S., Cranston R., Liss P. (1979). Redox species in a reducing fjord: equilibrium and kinetic considerations. Deep Sea Res. Part A 26, 859–878. doi: 10.1016/0198-0149(79)90101-8
Engida Z., Monahan A., Ianson D., Thomson R. E. (2016). Remote forcing of subsurface currents and temperatures near the northern limit of the California Current System. J. Geophys. Res.: Oceans 121, 7244–7262. doi: 10.1002/2016JC011880
Farmer D., D’Asaro E., Trevorrow M., Dairiki G. (1994). Three-dimensional structure in a tidal convergence front. Continental Shelf Res. 15, 1649–1673. doi: 10.1016/0278-4343(94)00084-Z
Fiedler P., Mendelssohn R., Palacios D., Bograd S. (2013). Pycnocline variations in the Eastern Tropical and North Pacific 1958–2008. J. Climate 26, 583–599. doi: 10.1175/JCLI-D-11-00728.1
Flater D. (2001) XTide. Available at: https://flaterco.com/xtide/.
Fofonoff N. P., Millard R. C. (1983). Algorithms for the computation of fundamental properties of seawater. UNESCO Tech. Papers Mar. Sci 44, 53pp. (Paris, France:UNESCO). doi: 10.25607/OBP-1450
Freeland H. J., Denman K. L. (1982). A topographically controlled upwelling center off southern Vancouver Island. J. Mar. Res. 40, 1069–1093.
Frischknecht M., Münnich M., Gruber N. (2015). Remote versus local influence of ENSO on the California Current System. J. Geophys. Res.: Oceans 120, 1353–1374. doi: 10.1002/2014JC010531
Gargett A. E. (1994). Observing turbulence with a modified acoustic Doppler current profiler. J. Atmospheric Oceanic Technol. 11, 1592–1610. doi: 10.1175/1520-0426(1994)011<1592:OTWAMA>2.0.CO;2
Gargett A. E., Stucchi D., Whitney F. (2003). Physical processes associated with high primary production in Saanich Inlet, British Columbia. Estuarine Coast. Shelf Sci. 56, 1141–1156. doi: 10.1016/S0272-7714(02)00319-0
Geyer W., Cannon G. (1982). Sill processes related to deep water renewal in a fjord. J. Geophys. Res.: Oceans 87, 7985–7996. doi: 10.1029/JC087iC10p07985
Griffin D. A., LeBlond P. H. (1990). Estuary/ocean exchange controlled by spring-neap tidal mixing. Estuarine Coast. Shelf Sci. 30, 275–297. doi: 10.1016/0272-7714(90)90052-S
Grundle D. S., Timothy D. A., Varela D. E. (2009). Variations of phytoplankton productivity and biomass over an annual cycle in Saanich Inlet, a British Columbia fjord. Continental Shelf Res. 29, 2257–2269. doi: 10.1016/j.csr.2009.08.013
Hamme R. C., Berry J. E., Klymak J. M., Denman K. L. (2015). In situ O2 and N2 measurements detect deep-water renewal dynamics in seasonally-anoxic Saanich Inlet. Continental Shelf Res. 106, 107–117. doi: 10.1016/j.csr.2015.06.012
Hawley A. K., Brewer H. M., Norbeck A. D., Paša-Tolić L., Hallam S. J. (2014). Metaproteomics reveals differential modes of metabolic coupling among ubiquitous oxygen minimum zone microbes. Proc. Natl. Acad. Sci. 111, 11395–11400. doi: 10.1073/pnas.1322132111
Herlinveaux R. (1962). Oceanography of Saanich Inlet in Vancouver Island, British Columbia. J. Fish. Board Canada 19, 1–37.
Ji Q., Jameson B. D., Juniper S. K., Grundle D. S. (2020). Temporal and vertical oxygen gradients modulate nitrous oxide production in a seasonally anoxic fjord: Saanich inlet, British Columbia. J. Geophys. Res.: Biogeosci. 125, e2020JG005631. doi: 10.1029/2020JG005631
Johannessen S. C., McCarter B. (2010). Ecosystem status and trends report for the Strait of Georgia ecozone. Fish. Oceans Canada Can. Sci. Advisory Secretariat 1919-50442010/010, 51pp.
Juniper S. K., Brinkhurst R. O. (1986). Water-column dark CO2 fixation and bacterial-mat growth in intermittently anoxic Saanich Inlet, British Columbia. Mar. Ecol. Prog. Ser. 33, 41–50.
Lavelle J. W., Cokelet E. D., Cannon G. A. (1991). A model study of density intrusions into and circulation within a deep, silled estuary: Puget Sound. J. Geophys. Res. 96, 16779. doi: 10.1029/91jc01450
LeBlond P. H., Ma H., Doherty F., Pond S. (1991). Deep and intermediate water replacement in the Strait of Georgia. Atmosphere-Ocean 29, 288–312. doi: 10.1080/07055900.1991.9649406
Lee B.-S., Bullister J. L., Whitney F. A. (1999). Chlorofluorocarbon CFC-11 and carbon tetrachloride removal in Saanich Inlet, an intermittently anoxic basin. Mar. Chem. 66, 171–185. doi: 10.1016/S0304-4203(99)00039-0
Leonov D., Kawase M. (2009). Sill dynamics and fjord deep water renewal: idealized modeling study. Continental Shelf Res. 29, 221–233. doi: 10.1016/j.csr.2008.04.005
Levings C. D. (1980). Demersal and benthic communities in Howe Sound basin and their responses to dissolved oxygen deficiency. Fisheries and Aquatic Sciences no. 951,. (Vancouver, BC, Canada:Department of Fisheries and Oceans).
Mackas D. L., Denman K. L., Bennett A. F. (1987). Least squares multiple tracer analysis of water mass composition. J. Geophys. Res.: Oceans 92, 2907–2918. doi: 10.1029/JC092iC03p02907
Manning C. C., Hamme R. C., Bourbonnais A. (2010). Impact of deep-water renewal events on fixed nitrogen loss from seasonally-anoxic Saanich Inlet. Mar. Chem. 122, 1–10. doi: 10.1016/j.marchem.2010.08.002
Masson D. (2002). Deep water renewal in the Strait of Georgia. Estuarine Coast. Shelf Sci. 54, 115–126. doi: 10.1006/ecss.2001.0833
Masson D. (2006). Seasonal water mass analysis for the Straits of Juan de Fuca and Georgia. Atmosphere-Ocean 44, 1–15. doi: 10.3137/ao.440101
Masson D., Cummins P. F. (2000). Fortnightly modulation of the estuarine circulation in Juan de Fuca Strait. J. Mar. Res. 58, 439–463. doi: 10.1357/002224000321511106
Miller A., White W., Cayan D. (1997). North Pacific thermocline variations on ENSO timescales. J. Phys. Oceanography 27, 2023–2039. doi: 10.1175/1520-0485(1997)027<2023:NPTVOE>2.0.CO;2
Newton J., Bassin C., Devol A., Kawase M., Ruef W., Warner M., et al. (2007). “Hypoxia in Hood Canal: An overview of status and contributing factors,” in Proceedings of the 2007 Georgia Basin Puget Sound Research Conference. Seattle, WA, USA:University of Washing.
Pawlowicz R. (2002). Observations and linear analysis of sill-generated internal tides and estuarine flow in Haro Strait. J. Geophys. Res. 107, 1–13. doi: 10.1029/2000jc000504
Pawlowicz R. (2017). Seasonal cycles, hypoxia, and renewal in a coastal fjord (Barkley Sound, British Columbia). Atmosphere-Ocean 55, 264–283. doi: 10.1080/07055900.2017.1374240
Pike R., Goetz J., Spittlehouse D. L., Young E. (2018). Cowichan River: A summary of historical disturbances, water use pressures and streamflow trends. Tech. rep., Water Science Series WSS2017-05. (Victoria B.C, Canada:Prov. B.C).
Ray S., Siedlecki S., Alexander M., Bond N., Hermann A. (2020). Drivers of subsurface temperature variability in the Northern California Current. J. Geophys. Res.: Oceans 125, e2020JC016227. doi: 10.1029/2020JC016227
Richards F. A. (1965). “Anoxic basins and fjords,” in Chemical Oceanography vol. I. Eds. Riley J. P., Skirrow G. (New York, USA:Academic Press), 611–645.
Schinke H., Matthäus W. (1998). On the causes of major Baltic inflows–an analysis of long time series. Continental Shelf Res. 18, 67–97. doi: 10.1016/S0278-4343(97)00071-x
Stucchi D., Giovando L. (1984). “Deep water renewal in Saanich Inlet, B.C,” in Proceedings of a Multidisciplinary Symposium on Saanich Inlet, vol. 38, 7–15. (Sidney, BC, Canada:Department of Fisheries and Oceans Canada).
Takahashi M., Seibert D., Thomas W. (1977). Occasional blooms of phytoplankton during summer in Saanich Inlet, BC, Canada. Deep Sea Res. 24, 775–780. doi: 10.1016/0146-6291(77)90499-4
Thomson R., Kulikov E., Spear D., Johannessen S. (2020). A role for gravity currents in cross-sill estuarine exchange and subsurface inflow to the southern Strait of Georgia. J. Geophys. Res.: Oceans 125, 1–24. doi: 10.1029/2019JC015374
Thomson R. E., Spear D. J., Krassovski M. V., Hourston R. A., Juhász T. A., Mihály S. F. (2017). Buoyancy-driven coastal current blocks ventilation of an anoxic fjord on the Pacific coast of Canada. J. Geophys. Res.: Oceans 122, 2976–2998. doi: 10.1002/2016JC012512
Timothy D. A., Soon M. Y. (2001). Primary production and deep-water oxygen content of two British Columbian fjords. Mar. Chem. 73, 37–51. doi: 10.1016/S0304-4203(00)00071-2
Torres-Beltrán M., Hawley A. K., Capelle D., Zaikova E., Walsh D. A., Mueller A., et al. (2017). A compendium of geochemical information from the Saanich Inlet water column. Sci. Data 4, 1–11. doi: 10.1038/sdata.2017.159
Torres-Beltrán M., Mueller A., Scofield M., Pachiadaki M. G., Taylor C., Tyshchenko K., et al. (2019). Sampling and processing methods impact microbial community structure and potential activity in a seasonally anoxic fjord: Saanich Inlet, British Columbia. Front. Mar. Sci. 6. doi: 10.3389/fmars.2019.00132
Tunnicliffe V. (1981). High species diversity and abundance of the epibenthic community in an oxygen-deficient basin. Nature 294, 354–356. doi: 10.1038/294354a0
Waldichuk M. (1957). Physical oceanography of the Strait of Georgia, British Columbia. J. Fish. Board Canada 14, 321–486. doi: 10.1139/f57-013
Keywords: anoxic, renewal, flushing, intermittent anoxia, Saanich Inlet, tides and currents, oxygen deficient zones
Citation: Soetaert G, Hamme RC and Raftery E (2022) Renewal of seasonally anoxic Saanich Inlet is temporally and spatially dynamic. Front. Mar. Sci. 9:1001146. doi: 10.3389/fmars.2022.1001146
Received: 22 July 2022; Accepted: 15 September 2022;
Published: 11 October 2022.
Edited by:
Sudheesh Valliyodan, Central University of Kerala, IndiaReviewed by:
Alyse K. Hawley, University of British Columbia, CanadaMónica Torres-Beltrán, Autonomous University of Baja California, Mexico
Copyright © 2022 Soetaert, Hamme and Raftery. This is an open-access article distributed under the terms of the Creative Commons Attribution License (CC BY). The use, distribution or reproduction in other forums is permitted, provided the original author(s) and the copyright owner(s) are credited and that the original publication in this journal is cited, in accordance with accepted academic practice. No use, distribution or reproduction is permitted which does not comply with these terms.
*Correspondence: Roberta C. Hamme, cmhhbW1lQHV2aWMuY2E=