 Peter A. U. Staehr1*
 Karsten Dahl1Helle Buur1
 Cordula Göke1
 Rumakanta Sapkota2
 Anne Winding2
 Marina Panova3
 Matthias Obst3
 Per Sundberg3
- 1Department of Ecoscience, Aarhus University, Roskilde, Denmark
- 2Department of Environmental Sciences, Aarhus University, Roskilde, Denmark
- 3Department of Marine Sciences, University of Gothenburg, Gothenburg, Sweden
We investigated the use of eDNA metabarcoding for supplementing traditional diver-based monitoring of biodiversity of marine boulder reefs within the photic zone. The applied sampling design made it possible to evaluate the usefulness of eDNA monitoring as a supplement for traditional monitoring. Specifically, this study aimed to (1) assess the local influence of boulder reefs on biodiversity across the North Sea to Baltic Sea transition zone and (2) investigate the importance of environmental gradients for patterns in community structure. On samples collected during August 2020, we compared the composition and abundance of species associated with nine reefs, representing an environmental gradient of salinity (16–33 psu), water temperature (16–21°C) and water depth (6–29 m). At each reef site, water was sampled near the bottom just above the reef and on average 2.6 km upstream and downstream (location) and sequenced with metabarcoding using COI, 18S and 12S rDNA primers. eDNA identified 400 species, diver-based observations identified 184 with an overlap of 70 species (12%) and 81 genera (18%). While eDNA identified many infaunal species, it did not detect several macroalgal species which dominated in the diver-based observations. Multivariate analysis of eDNA and diver-based community structure both distinguished between reef communities, with a significant match between patterns observed by the two methods (r = 0.37, p = 0.02). Furthermore, the eDNA approach made it possible to identify significant differences in species composition between upstream, above-reef and downstream locations, suggesting that eDNA leaves a local footprint in benthic habitats. Patterns in both eDNA and diver-based species composition and richness were significantly related to geographical distance, salinity, water temperature and water depth. Despite of low detection of macroalgae, the eDNA sampling provided a substantial supplement to traditional diver-based monitoring of biodiversity around benthic hotspots in the Danish marine waters and therefore we recommend to add eDNA methods to conventional monitoring programs in the future.
Introduction
Boulder reefs are productive hard bottom habitats in marine ecosystems otherwise characterized by soft sediments (Dahl, 2003). The reefs encompass a large range of sizes, compactness and complexity which under favorable photic conditions are associated with a high coverage of macroalgae, and with diminishing light at depth gradually change to faunal communities (Figure 1). The reefs are known to be active sites for marine carbon sequestration (Krause-Jensen and Duarte, 2016) and provide habitat, refuge and food for sessile and mobile animals (Lundsteen et al., 2008). This includes fish species (Stenberg and Kristensen, 2015) with evidence of enhanced overall fish productivity through better access to shelter, increased food availability and reduced metabolic costs (Schwartzbach et al., 2020). Therefore, boulder reefs are considered as important biological hotspots for a range of benthic and pelagic species, resulting in several reefs being protected in regions, within the European Union (Directive, 1992). Due to the ecosystem services associated with reefs, they are increasingly restored and used as a management tool to mitigate human pressures on marine ecosystems (Bohnsack and Sutherland, 1985; Kristensen et al., 2017; Stæhr et al., 2020; Staehr et al., 2021).
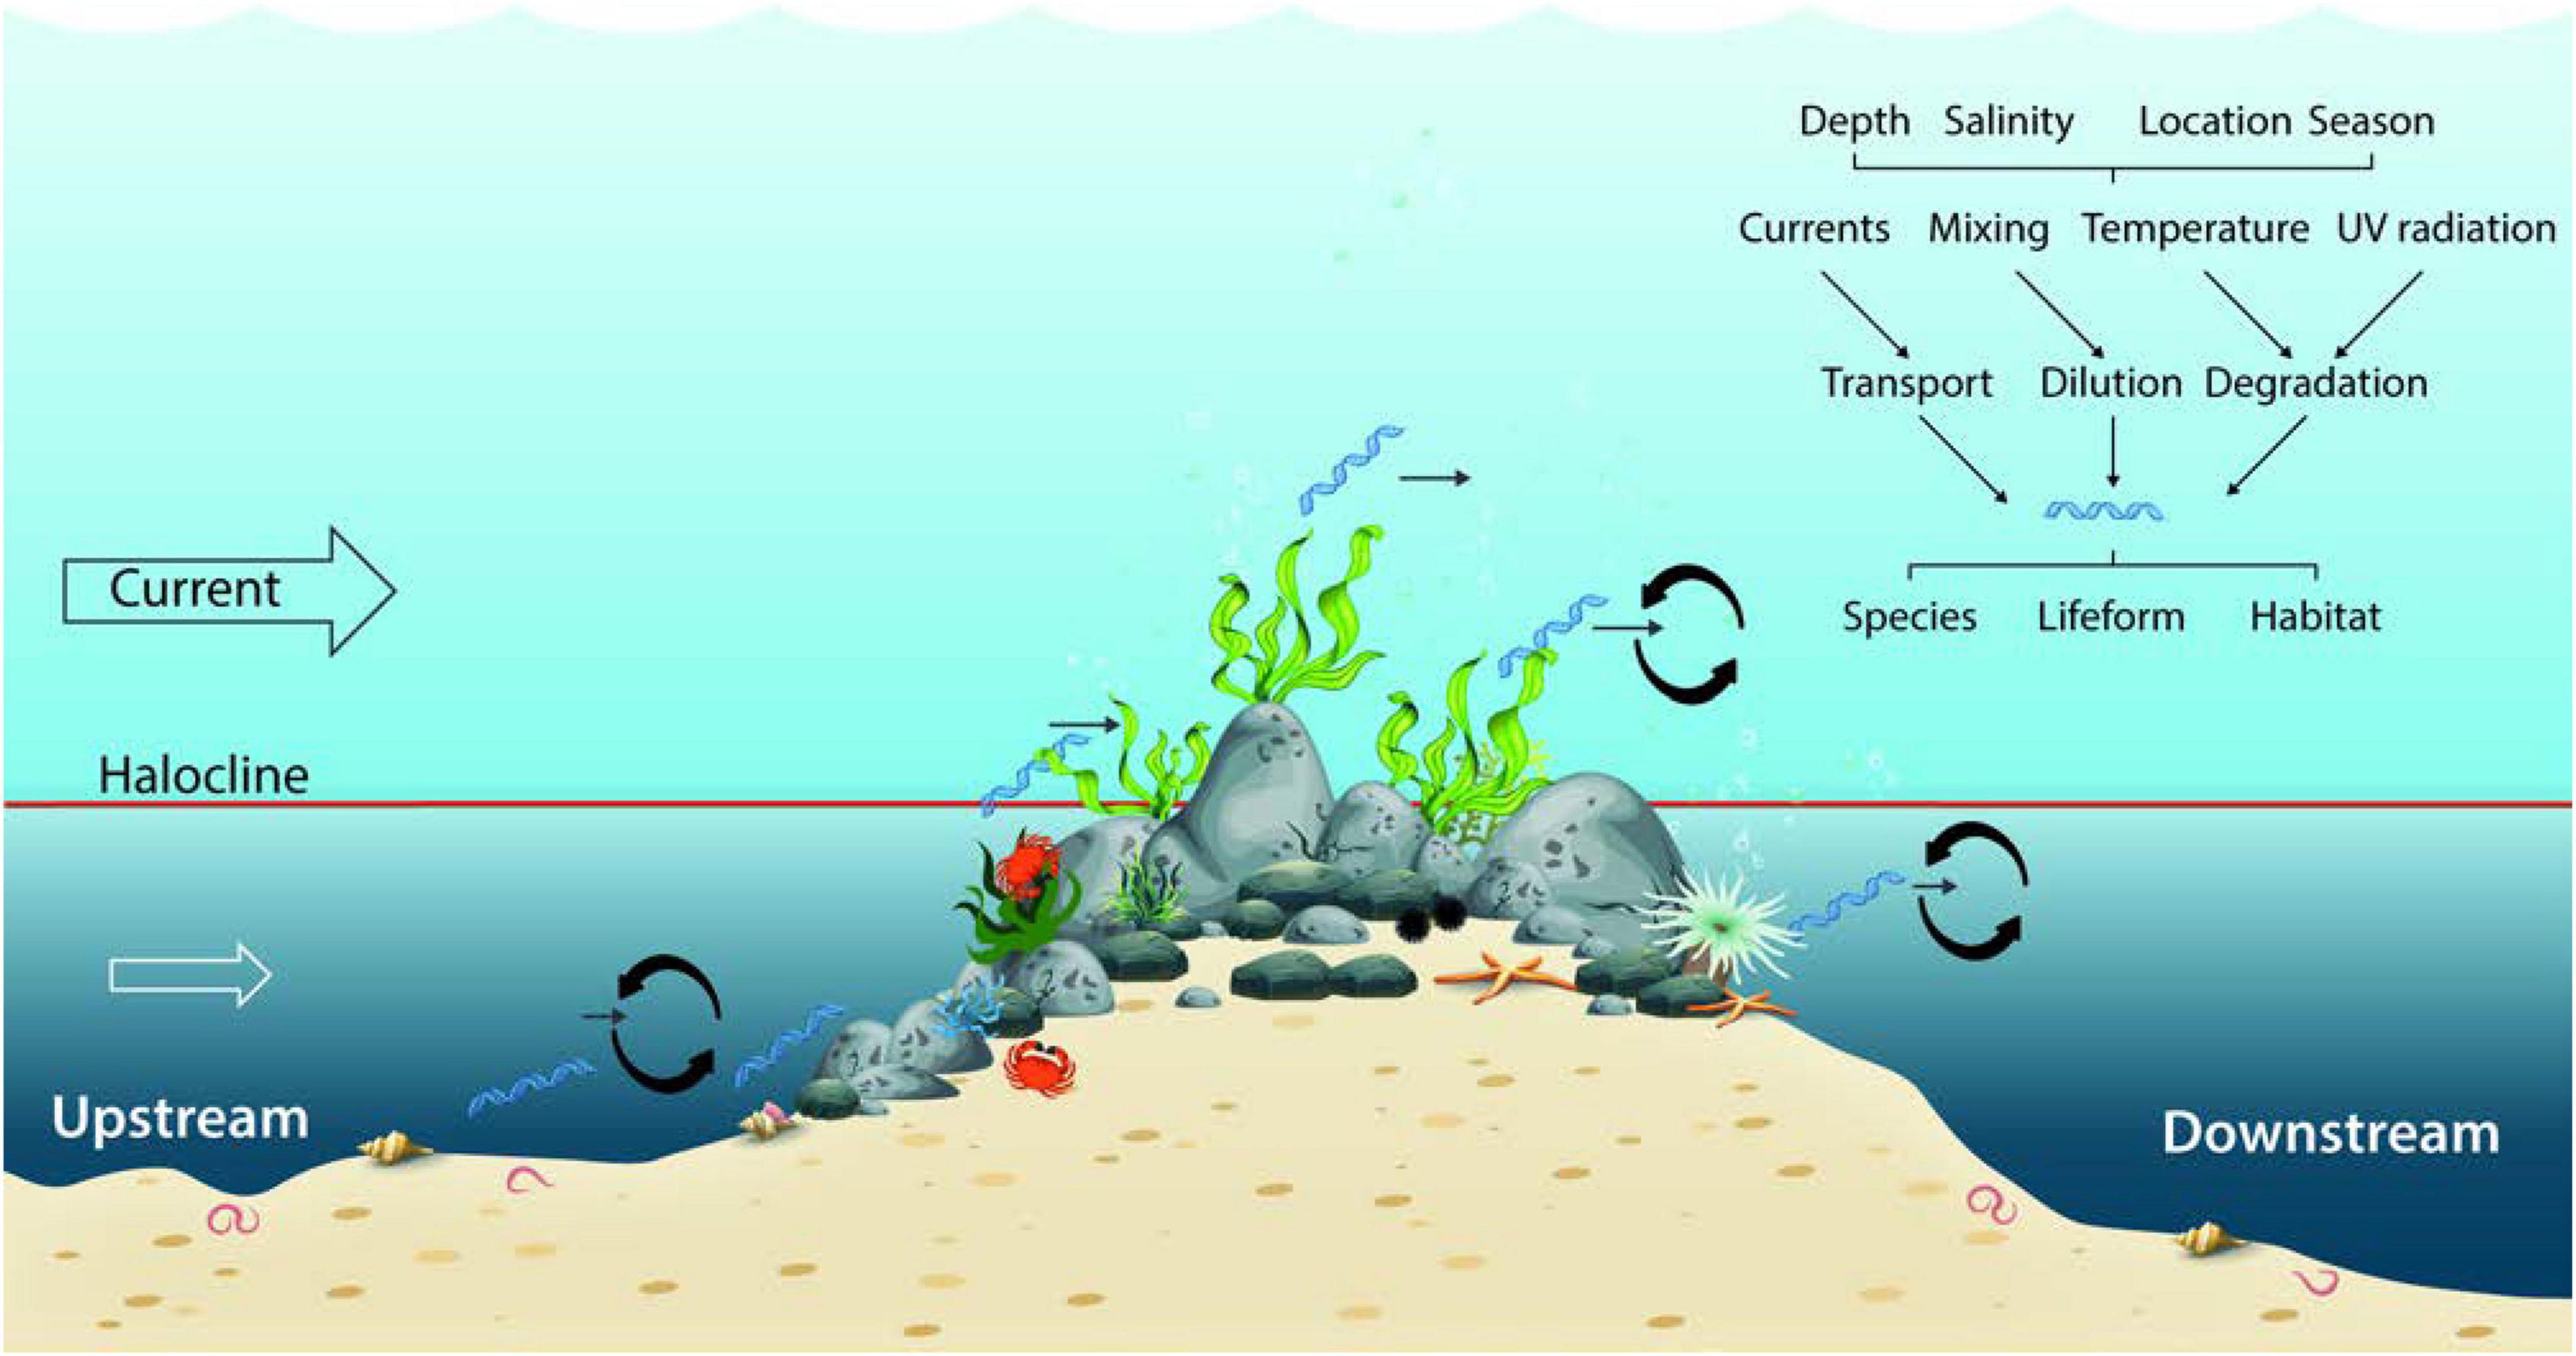
Figure 1. Boulder reefs are accumulations of boulders in an otherwise soft bottom dominated seascape. Divers perform observations of cover and composition of species at the reef foot and toward the reef top. These include different lifeforms (macroalgae, sessile, and mobile fauna). Vertical gradients in salinity can cause strong stratification (halocline) of the water column reducing inflow of deeper waters on the reef. The reef structure itself furthermore affects the local mixing conditions. Composition and concentration of eDNA around a boulder reef results from release of intra- and extracellular material from reef associated organisms and will likely be affected by a range of environmental conditions affecting species abundance, and transportation, dilution and degradation of eDNA. Upstream currents are expected to carry eDNA from neighboring soft bottom dominated habitats. The importance of environmental conditions on eDNA composition and concentration will vary seasonally, with depth and between reef sites.
Structurally complex reef habitats are becoming rarer across many marine environments (Pandolfi et al., 2003; Airoldi and Beck, 2007) with negative implications for biodiversity (Airoldi et al., 2008). In Danish waters, boulder reefs have been diminished for decades through the removal of boulders to be used for port mills and construction works. A recent estimation suggests that over the last 50 years, around 55 km2 of boulders and stones were removed from Danish coastal waters (Helmig et al., 2020). This was done mostly from the shallow waters (<10 m), until prohibited by law in the year 2010. In addition, significant amounts of stones have been removed from the fjords due to mussel dredging (Krause-Jensen et al., 2012). Although there was no systematic survey to estimate to what extent the removal of natural boulder reefs affected the ecosystem, evidence from a large reef restoration project in The Kattegat region, document that reintroducing boulders can result in a several fold increase in the abundance of associated macroalgae and fauna and the functions these provide (Stenberg et al., 2015). The restoration effort also documented the importance of boulder reefs as food and nursery grounds for higher trophic levels such as marine mammals which increased in numbers (Mikkelsen et al., 2013).
Robust and affordable monitoring surveys are necessary to provide assessment of ecosystem health, including detailed data on species’ distributions and trends in abundance (Keith et al., 2015). Monitoring of reefs in Danish waters has been ongoing for more than 30 years using divers equipped with underwater video and radio communication. Species verification on collected material has provided high taxonomic certainty and enabled a thorough understanding of responses in species composition, coverage and diversity in relation to changes in environmental conditions including eutrophication and climate change (Krause-Jensen et al., 2021). While this monitoring approach is robust, it is very resource demanding and it provides limited information on fish associated with reefs and on species living in the soft sediment between (here referred to as infaunal species) the boulders as these are less visible to the diver. Also, occurrence of species with unresolved taxonomy including those of unknown origin (cryptogenic) in combination with general diminishing taxonomic expertise in many countries, may reduce the applicability of traditional, observation-based monitoring techniques with implications for proper protection of marine areas (Gill et al., 2017). Attempts are therefore being made worldwide to apply a variety of molecular approaches to monitor marine biodiversity (Leray and Knowlton, 2015; Barnes and Turner, 2016). They are potentially less expensive and/or provide more detailed information on the plants, sessile and mobile animals and plankton associated with the reefs.
The use of environmental DNA (eDNA), in particular metabarcoding, has gained attention as a promising tool for monitoring aquatic species for biodiversity assessments. By avoiding visual species observation, capture and direct sampling (Goldberg et al., 2016) eDNA metabarcoding has the potential to greatly reduce cost and time, while aiding ecosystem conservation and management through improved detection of species (Thomsen and Willerslev, 2015; Winding et al., 2019). Studies have demonstrated that eDNA metabarcoding can detect taxa not easily detectable such as alien or endangered species (Dejean et al., 2012; Piaggio et al., 2014), and document local scale patterns in benthic communities in marine habitats connected by water movement (Jeunen et al., 2019).
There are potential problems with eDNA based monitoring (Darling and Mahon, 2011) one should be aware of. There may for example be false positives, where DNA from a species is detected during the analysis although actually not present in the area. This could be a case of DNA arising from species far from the study site and would depend on the DNA “life-time,” currents and other environmental conditions. There is also the possibility of false negatives, i.e., no DNA is detected from a particular species although present in the area. We know that “detectability” varies between phyla and also depends on the primers used (see e.g., the case of the macroalgae in this study). It could also depend on abiotic factors like DNA degradation. The completeness of reference databases will determine the match between sequence and species. As a consequence, all sequences cannot be assigned Linnean names. Like traditional visual biodiversity inventories there are thus also shortcomings with eDNA monitoring (McClenaghan et al., 2020).
Application of eDNA metabarcoding as a technique to monitor biodiversity in hotspot areas such as boulder reefs in Danish marine water, is furthermore challenging as there are many conditions (Figure 1) which may potentially confound results by dispersal of eDNA in the water column (Goldberg et al., 2016; Jeunen et al., 2019). The shallow bathymetry of the Danish marine waters combined with a significant exchange of high saline North Atlantic waters with the outflowing brackish Baltic Sea water cause large scale movement within the Baltic-North Sea transition zone (Bendtsen et al., 2007). In addition, water movements around boulder reefs vary greatly over time from different directions depending on local dynamics (e.g., turbulence, vertical mixing) influencing currents around and within the reefs (Sørensen, 2012). It is therefore likely that currents are capable of transporting eDNA over larger distances, potentially leading to false positive signals (Roussel et al., 2015).
In this study, we investigated the applicability of eDNA metabarcoding to survey boulder reef habitats in a hydrodynamically complex marine system within the transition zone from the North Sea to the Baltic Sea. We present eDNA data from three metabarcoding assays for eukaryotes (18S rDNA), fish (12S rDNA) and invertebrates (COI) collected on average 2.6 km upstream and downstream and ca. 1 m above a boulder reef (see Table 1). Nine reef sites were sampled representing a total distance of 430 km and salinity gradient from 10 to 34 psu, with depth ranges of 6–29 m. At each reef we also obtained diver-based observations of benthic sessile and mobile fauna and attached macroalgae. These surveys enabled us to address the following questions and hypotheses:
(1) Does eDNA metabarcoding enable detection of benthic associated species related to discrete boulder reef habitats? We expect that reef samples will be dissimilar compared to samples collected upstream and downstream of the reefs and contain more reef-associated species.
(2) What is the level of agreement between benthic species community composition and species richness detected by eDNA metabarcoding and diver-based observations, respectively? We expect some similarity in the characterization of the nine reef sites for both methods, but with overall more species detected through eDNA which is expected also to better detect infaunal species and fish not associated with the hard-bottom reef structures.
(3) To what extent can patterns in species composition determined from eDNA and diver-based observations be explained by the environmental conditions associated with the reefs? We expect salinity to be the most important driver of change in species richness and benthic community structure.
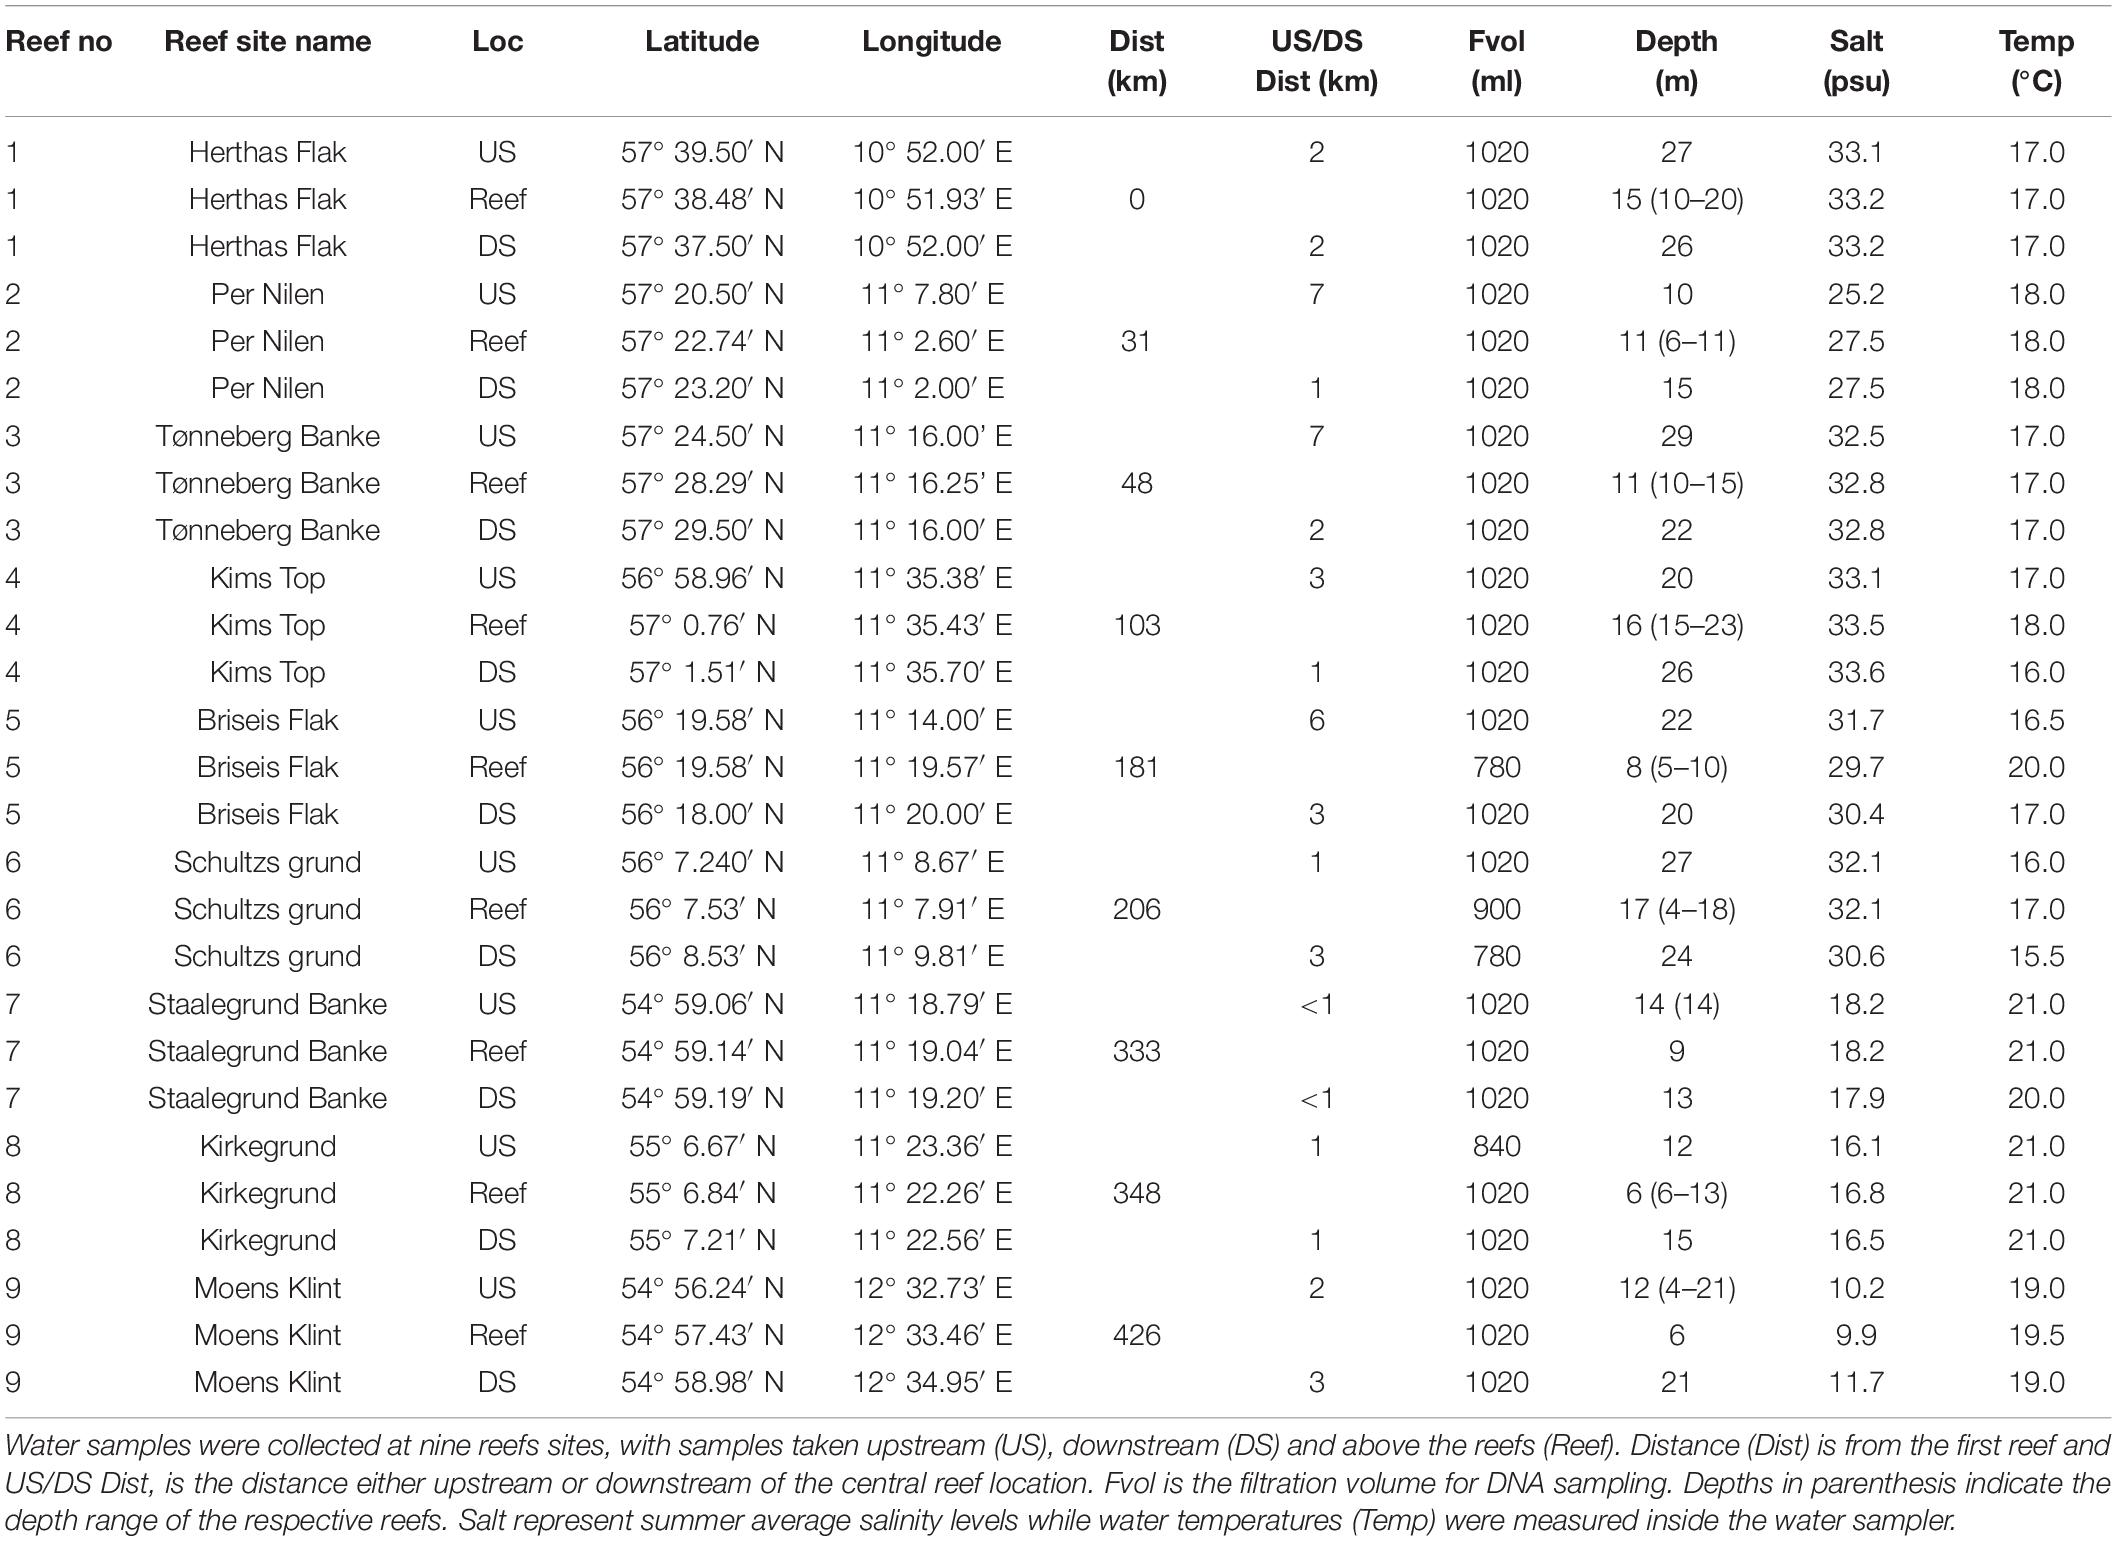
Table 1. Information on depth distribution of boulders and eDNA sampling locations (Loc).
Methods and Study Sites
Sampling Sites
The inner Danish marine waters covers a transition zone from the high saline dense North Sea waters entering from the north into the Kattegat area, where the water is intercepted by less saline surface waters outflowing from the Baltic Sea (Figure 2). Along this transition zone several natural formations of boulders are scattered providing habitats for several sessile and mobile organisms. The boulders are interspersed with sand and gravel, and typically surrounded by deeper soft sandy and muddy sediments. The boulders consist of mostly granite, gneiss and limestone left behind by retreating glaciers, and ranges from a few cm to 1–2 m in diameter. Formations of boulders covering more than 25% of the seafloor are defined as boulder reefs according to the Danish EPA’s definition. As part of the Danish national marine monitoring program, a number of the larger boulder reefs have been investigated since the 1990s. Of these, we selected nine of the largest reefs for our investigation (Figure 2). The depth distribution of the nine reef structures varies considerably, some more shallow some deeper and some having a larger depth range (Table 1).
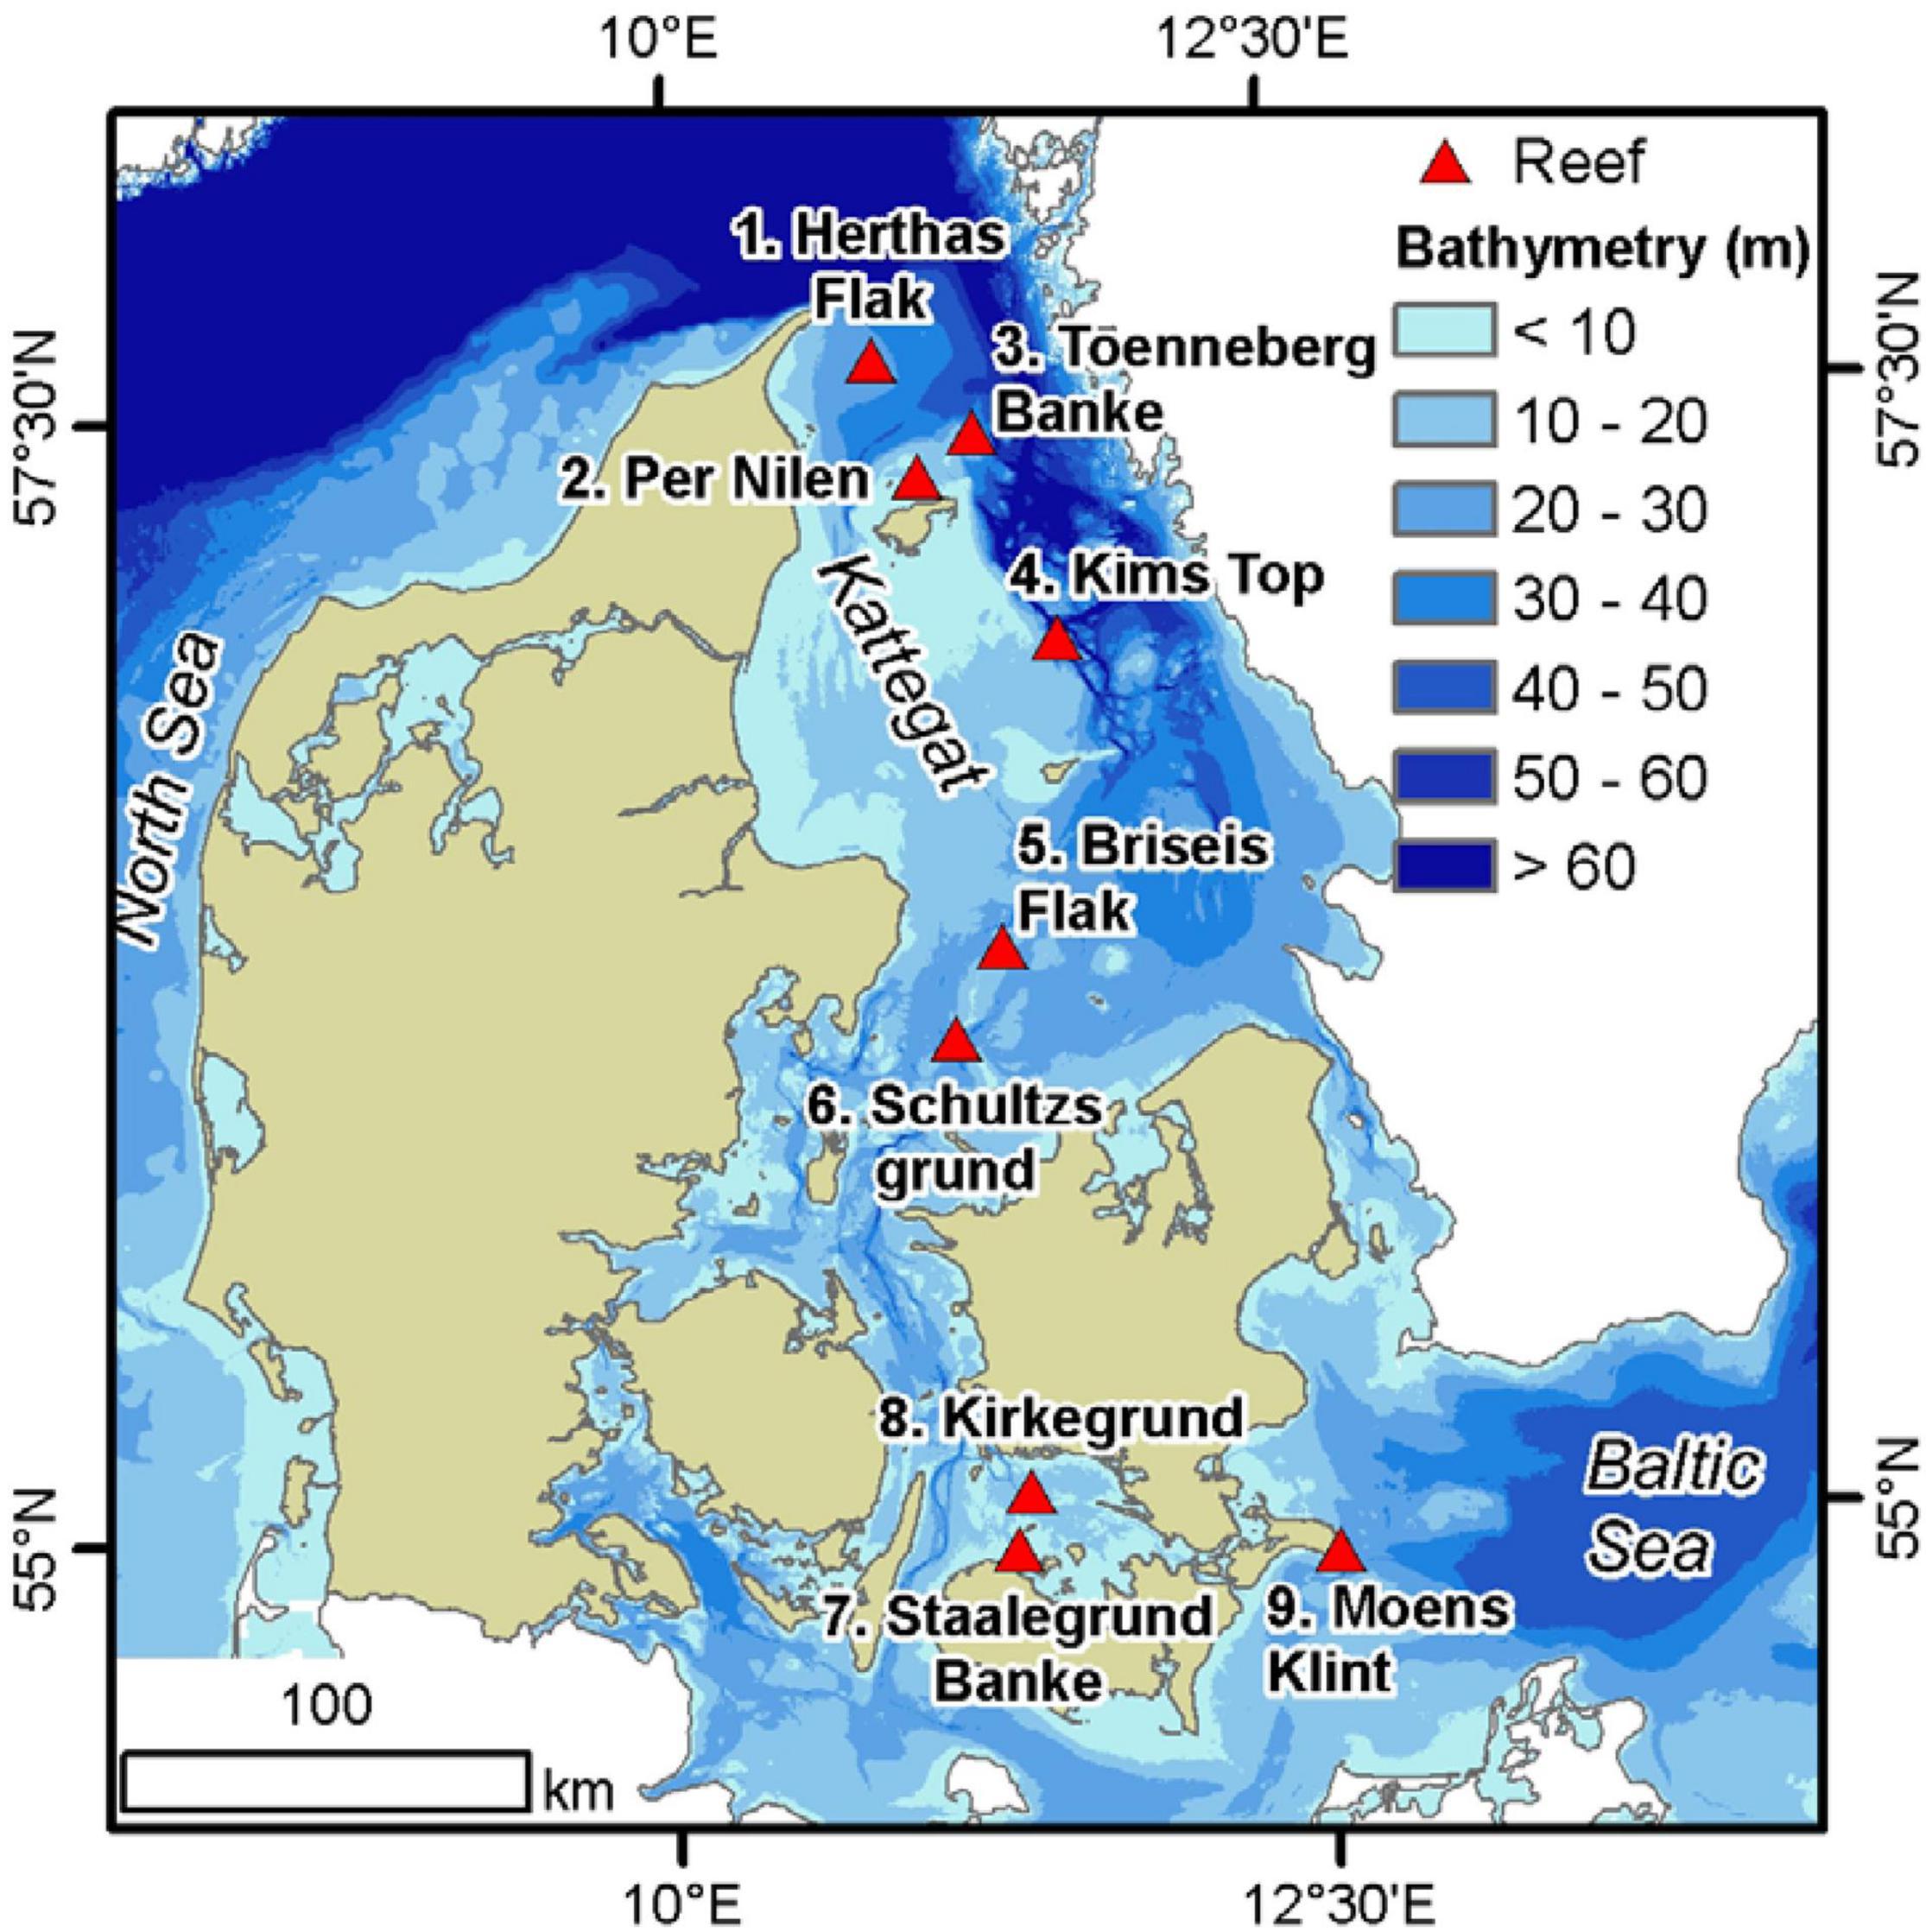
Figure 2. Reef sampling sites in the Danish inner marine waters. Blue colors represent depth contours.
Environmental DNA Sample Collection, Filtration, and Extraction
At each of the nine reef sites, water eDNA was collected above the central part of each reef (above-reef) and on average 2.6 km upstream (US) and 2.6 km downstream (DS) from the reef center. Samples were collected during the annual reef monitoring cruise during 1 week in August 2020. At each sampling site, the maximum water column depth was determined by the ships echo sounder, after which the sampling depth (max – 1 m) was decided and replicate water samples were collected 1–2 m above the seafloor with a 1.5 L Niskin water sampler. In cases where the water sampler touched the seafloor a new sample was taken. This approach was used to optimize collection of benthic eDNA traces while avoiding collection of resuspended material (Tréguier et al., 2014; Turner et al., 2015). The choice of downstream and upstream sites was based on interpretation of the direction and strength of the local currents and knowledge of bathymetry conditions. Shorter distances were thus chosen around reefs. e.g., at Kirkegrund (Figure 3) where currents were low and bathymetry indicated hard bottom structures at greater distance. Current direction was determined from positioning of the anchored ship over the central reef site relative to the geographic north. Current speeds were obtained from the Sejladsudsigt1. Between 780 and 1020 mL of water were collected per samples and manually pressure filtered using 100 ml vials through a 0.22 mm Sterivex filter cartridge (Millipore). Filters were transferred to individual zip lock plastic bags and stored at –20°C until DNA extraction. Negative controls during fieldwork were carried out by filtering RNA/DNA free water at sampling sites using the same equipment and procedures as for the sharp samples. To avoid cross-contamination, non-disposable and non-sterile equipment was wiped or soaked in 10% bleach between sampling sites. Information on sampling depth, position, water depth and filtration volume is shown in Table 1.
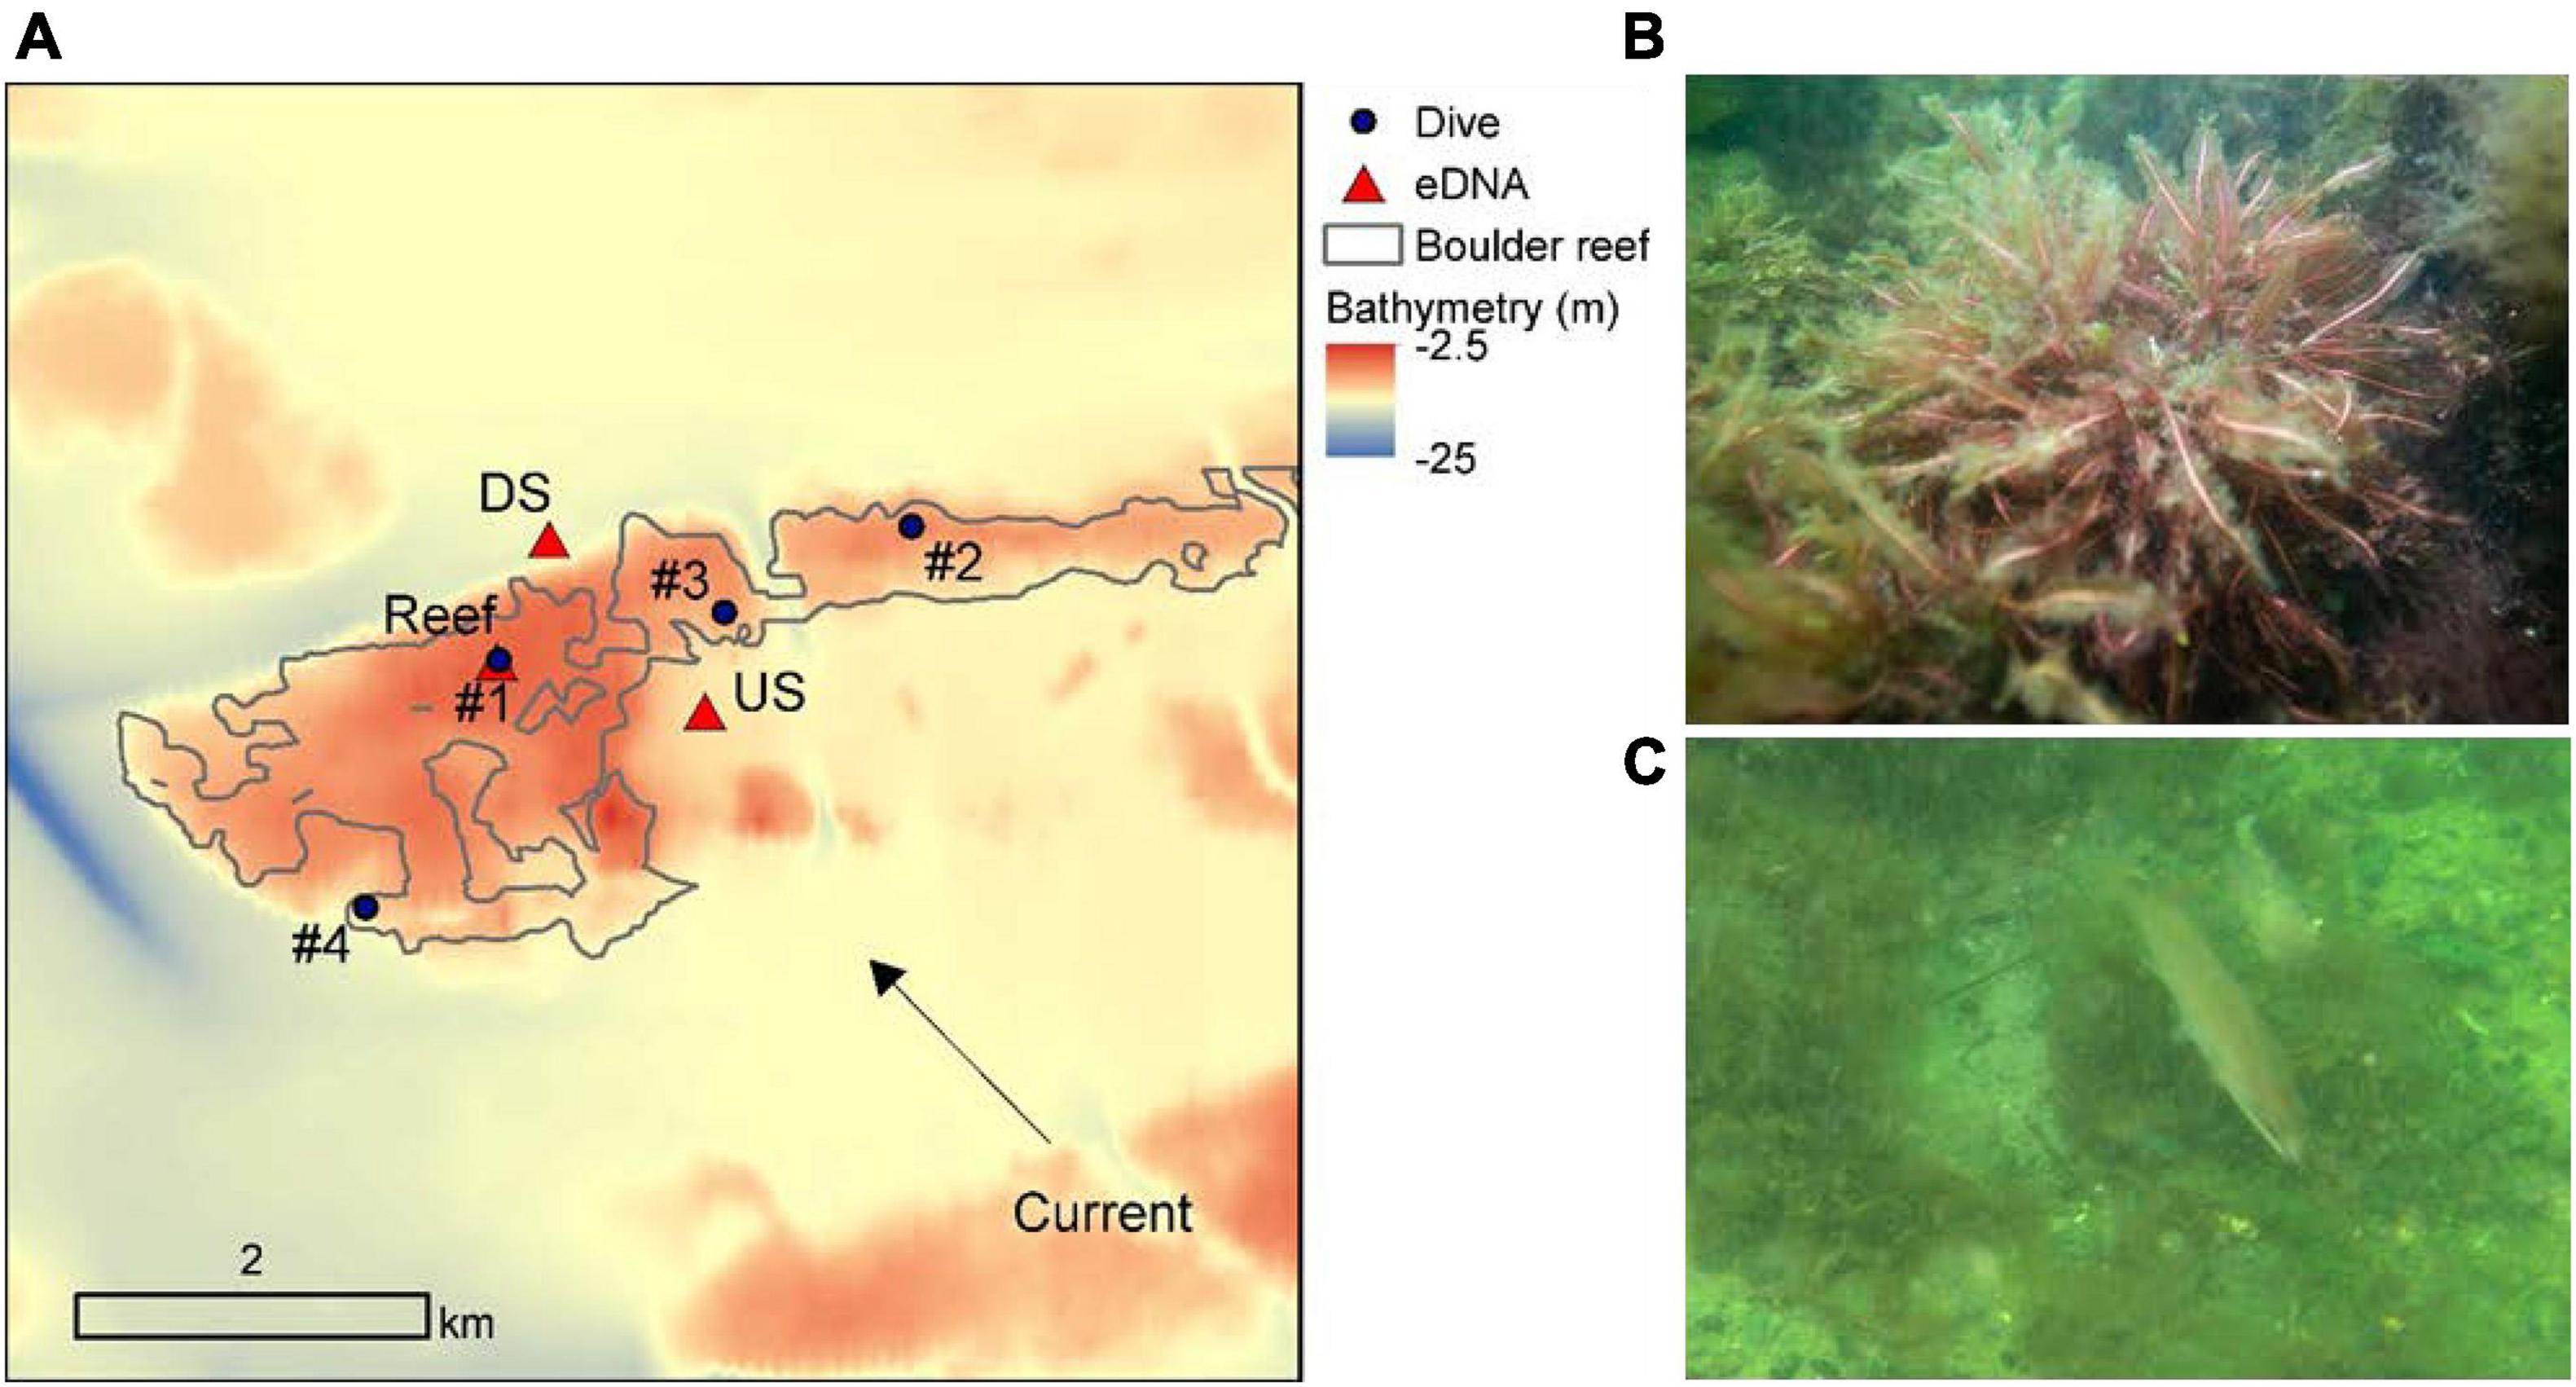
Figure 3. Close up of eDNA and diver-based sampling at Kirkegrund reef (#8). (A) The reef is outlined by a solid gray line. eDNA was sampled at the dive station #1 (reef site) in the center of the reef and upstream and downstream of the reef as indicated by the dominating water current. A total of four dive stations were sampled covering a depth range of 6–12 m. Sampling depths for up- and downstream eDNA stations were 12 and 15 m respectively. Photos are examples of differences in distribution of hard- and soft bottom organisms and substrate near the top (B) dominated by macroalgae (Delesseria sanguinea) on bounders and (C) near the bottom of the reef with a common reef fish (Ctenolabrus rupestris) in an area dominated by of sand and gravel.
The DNA extraction was performed with NucleoSpin® eDNA Water, MACHEREY-NAGEL according to the manufacturer’s instructions. This kit allows processing of encapsulated Sterivex filters which prevents cross-sample contaminations. A no-sample control was included at the DNA extraction stage. DNA extraction and the following PCR were carried out in separate rooms. Laboratory procedures to avoid contamination involved regular wiping of bench surfaces with DNA Away™, placing equipment in UV-cabinet, using sterile filter pipette tips and small aliquots of chemical solutions. No-template controls were included in all PCRs.
In addition to the field samples we included two mock community samples: one containing DNA from nine invertebrate species and the other containing DNA from ten fish species. These mock communities were used as positive controls for PCR amplification and sequence analyses. Altogether, 63 samples were included for each of the three barcodes: nine reefs × three locations (upstream, above-reef, downstream) per reef site × two field replicates per location = 54 water samples, five negative controls (three field controls, one lab control and one PCR no-template control) and two mock communities. More details on positive and negative controls are provided in the Supplementary Material.
Metabarcoding of Environmental DNA Samples
The amplicon libraries were prepared using three targeted markers: 18S rDNA with universal eukaryote primers SSU-F04 and SSU-R22, fragment size approx. 370 nt (Fonseca et al., 2010), COI with universal invertebrates primers mICOIintF and dgCOI2198, fragment size 367 nt (Leray et al., 2013), and 12S rDNA with universal ray-finned fish primers MiFish-U-F and MiFish-U-R, fragment size approx. 260 nt (Miya et al., 2015). The libraries were prepared in two steps: first, the target gene fragments were amplified with the locus-specific primes, extended with overhang adapter sequences compatible with Illumina Nextera XT library preparation kit in the second PCR. The first PCR products were amplified with the Nextera index primers to add Illumina sequencing adapters and dual−index barcodes.
The first, locus-specific PCR, two PCR reactions were performed for each sample and pooled to minimize random variation. Each PCR was performed in 25 μL volume, containing 12.5 μl KaPa HiFi HotStart ReadyMix 2x (Roche), 1 μl of 10 mM forward and reverse primers, 0.5 μl of bovine serum albumin 20 mg μL–1, and 2 μL (10–20 ng) of DNA template. Thermocycling conditions involved initial denaturation at 98°C for 2 min followed by 35 cycles at 98°C for 40 s, Ta °C for 30 s, 72°C for 30 s, and final extension at 72°C for 5 min. Annealing temperatures (Ta) were 57°C for 18S rDNA, 48°C for COI and 65°C for 12S rDNA. PCR products were visualized on agarose gels to confirm successful amplification and cleaned with AMPure XP beads in 1:1 ratio (Beckman Coulter) following the Illumina amplicon preparation protocol2.
The second index-PCR was performed in 50 μL volume, containing 25 μl KaPa HiFi HotStart ReadyMix 2x (Roche), 5 μL of index 1 and index 2 primers from Illumina Nextera XT v.2 Index kit, 5 μL of cleaned inner PCR products and 10 μL of PCR-grade water. Thermocycling conditions (Tm) were 95°C for 2 min; 10 cycles at 95°C for 30 s, 55°C for 30 s, 72°C for 30 s; 72°C for 5 min. PCR products were cleaned with AMPure XP beads (Beckman Coulter) following the Illumina protocol, see above. The DNA concentrations of the cleaned PCR were measured with Qubit fluorometer and PCR products were pooled in equimolar concentrations (900 nM). The samples were sequenced on the Illumina MiSeq v3-600 (2x300) platform by the National Genomic Infrastructure (NGI) in Sweden, 96 samples per run combining PCR products for different loci. All sequence files and metadata from this study were deposited in the NCBI sequence read archive under the project accession number PRJEB48452.
Bioinformatic Analyses
Bioinformatic analysis was performed with a custom pipeline written in the R programming language (R-Core-Team, 2019). Raw sequencing files in fastq format were processed with Dada2 (Callahan et al., 2016). Primer location and orientation was assessed, while primer removal was done with Cutadapt (Martin, 2011). Quality profiles for all samples and markers were assessed with FastQC. Subsequently, low-quality read ends were trimmed off at the first instance with a quality score less than 2 and the error model was trained and evaluated, resulting in a good match between observed and expected errors. Thereafter de-replication and inference of Amplicon Sequence Variants (ASV) were performed and forward and reverse reads merged. Finally, chimeras and singletons were removed using “pseudo-pooling” option. Remaining sequences were trimmed to a minimum length to exclude short reads (12S: 150 bp, COI: 300 bp, 18S: 300 bp). After filtering, the number of reads per sample was on average 24,176 (range 7,554–100,784). The scripts are available in the Supplementary Material.
Taxonomic assignment for COI was done against the BOLD reference library3 using BOLDigger (Buchner and Leese, 2020). 18S rDNA ASVs (Amplicon Sequence Variants) were assigned against the PR2 reference library4, and 12S rDNA against MitoFish reference library5 using “assignTaxonomy” option in Dada2. Output files included the distribution of identical sequence reads across all samples associated with a taxonomic identification, process-ID, and similarity value. ASVs tables were transformed into presence/absence tables for all taxa unambiguously identified with a similarity threshold 98% across all samples and species assignments with lower similarity as well as sequences without any match were discarded. All ASV tables are available in the Supplementary Material, while all original files and derived species observations are publicly available under the PlutoF project https://plutof.ut.ee/#/study/view/107978.
All species with a low match to the reference libraries were excluded from the data set as well as observations of typical lab contaminants (Canis lupus, Homo sapiens) which were rare. Finally, we removed observations of 6 tropical fish detected by the 12S rDNA marker, which are considered highly unlikely to occur in Danish waters. In these cases, observations were based on a single ASV occurring only in one or two samples with few reads (<20) and may originate from using a low quality score during trimming of raw sequences. Two separate data sets were saved, one including and one excluding presumed contaminations and are available in the Supplementary Material. The taxonomic species lists were finally reduced to macroalgae, fish and benthic epi- and infauna species as we wanted to focus the investigation on species that are expected to be associated with the boulder reef habitats. This accordingly excluded species belonging to phytoplankton and zooplankton.
Diver-Based Species Detection
The dive investigation included an in situ description of the seabed sediment composition at each of the nine reef sites, a description of the total vegetation cover, and species-specific cover of macroalgae and hard bottom fauna organisms identified by the diver. In addition to the in situ dive observations, video recordings were later used for quality assessment and a more detailed species account. The area covered at each dive site was at least 25 m2. A dive site was located for each 2–3 m depth interval on the reef structure from the top of the reef to the reef foot where hard stable substrate became scarce (<10% cover, Figure 1). Thus, depending on the size and depth range of the reefs, there were between 1 to 6 dive sites at each reef site (Figure 3). The investigation followed the Danish technical guideline TA-M14 for reef monitoring (Dahl and Lundsteen, 2018), which describes the reef monitoring conducted as part of the Danish national monitoring program (NOVANA). Some organisms were not identified to species level but at higher taxonomic level. Examples are crust-forming algae that are separated into calcified red crusts, red and brown crusts and the species Lithothamnion glaciale. In addition to the diver-based in situ observations, individual species were sampled for verification, thus providing a more detailed species account. The species were stored in 5–10 L buckets to which 70% alcohol was added for conservation and later identified in the laboratory. The investigations were made by divers with many years of experience in hard bottom monitoring and a trained taxonomist with high expertise. Eventually all species were assigned a cover value ranging from 0.1 to 100% as an integrated measure over the ca. 25 m2 covered area. For the purpose of comparing with the eDNA based detection we, however, reduced cover information to presence/absence. All diver-based species observations are available in the Supplementary Material and also under the public PlutoF project https://plutof.ut.ee/#/study/view/107978.
Environmental Variables
At each site water temperature of the sample was measured with a thermometer inside the water sampler. Salinity was extracted for each site from position and depth using modeled data representing summer average values (Staehr et al., 2019). From the sample positions we calculated the straight distances between the central reef sites. The upstream and downstream distance was calculated in relation to the central reef position (Table 1).
Community Analysis
Rank vs. relative abundance curves were used to compare the level of evenness (Foster and Dunstan, 2010) between benthic communities determined by eDNA and diver observations. For each species, relative abundance was calculated as the number of sites a species was observed divided by the total number of sites investigated (54 for eDNA, and 35 for diver-based observations). As a measure of evenness, we calculated the slope of the relations between Log10 abundance and rank, using an exponential decay model.
Patterns in community structure for both eDNA and diver-based observations were analyzed with Bray–Curtis similarities (Bray and Curtis, 1957) using a non-parametric multivariate statistical software PRIMER (Clarke and Gorley, 2015). To investigate the effect of location (upstream, above-reef, downstream), and site (nine reefs) on eDNA based species composition, we applied a Permutational Analysis of Variance (PERMANOVA) from the PRIMER add on package (Anderson et al., 2008) based on the Bray–Curtis similarity matrix. We ran PERMANOVA using sums of squares (SS) Type III. Highly non-significant terms were removed from the final model. Similarities between sample groups (eDNA based: location and reef sites, Diver-based: reef sites and sampling depths) were visualized with a metric Multi-Dimensional Scaling plot (mMDS-plots) using the PRIMER software package (Clarke and Gorley, 2015). To assess significant differences in diver-based species composition among the nine reef sites, we applied a one-way analysis of variance (ANOSIM) (Clarke et al., 2014). The RELATE analysis in PRIMER (Clarke et al., 2014) was applied to investigate the level of agreement between resemblance matrices for eDNA and diver-based observations.
The Biota–Environmental (BIO–ENV) routine in PRIMER v7 was used to explore relationships between community structure and the environmental variables (water depth, temperature, salinity, distance between sampling sites) presented in Table 1. The BIO–ENV routine calculates Spearman rank correlations between the similarity matrix derived from species absence/presence data and matrices derived from environmental variables that could explain the biotic structure (Clarke et al., 2014). The statistical significance of the results was tested by the global BIO–ENV match permutation test whereby each set of samples was randomly permuted relative to the other. We tested the null hypothesis that there is no relationship between the species abundance matrix and any of the possible resemblance matrices subsets of the environmental variables. The real rank correlation coefficient was compared with the permuted null hypothesis values, and if the actual coefficient was larger than any of the permuted coefficients, the null hypothesis of no relationship between the species abundance matrix and any of the possible resemblance matrices subsets was rejected with a p < 1%. Environmental parameters were log-transformed and normalized prior to analysis to derive meaningful Euclidean distances between environmental variables.
Results
Comparability in Species Richness and Evenness
eDNA metabarcoding using three barcodes detected a total of 400 species within 328 genera in 54 samples. In comparison diver-based monitoring provided 254 species and 206 genera in 35 samples (Table 2). There was an overlap between the two methods of 70 species (12%) and 81 genera (18%) (Figure 4). The highest overlap was within epifauna (gastropods, hydrozoans, crabs, bryozoans, barnacles etc.) and macroalgae (red, brown and green) (Table 2). Divers only observed 12 fish species, four of which was also identified by eDNA, which, however, detected 40 fish species. While eDNA detected 120 infaunal species (polychaetes etc.), divers only observed six. In the mock communities, 96% of the reads were correctly assigned to the invertebrate species and 93% of the reads to the fish species by COI. By 12S, 100% of the reads were correctly assigned to the fish species in the mock at the genus level (not at the species level because the pikeperch in the mock was identified both as Sander lucioperca and S. canadensis).
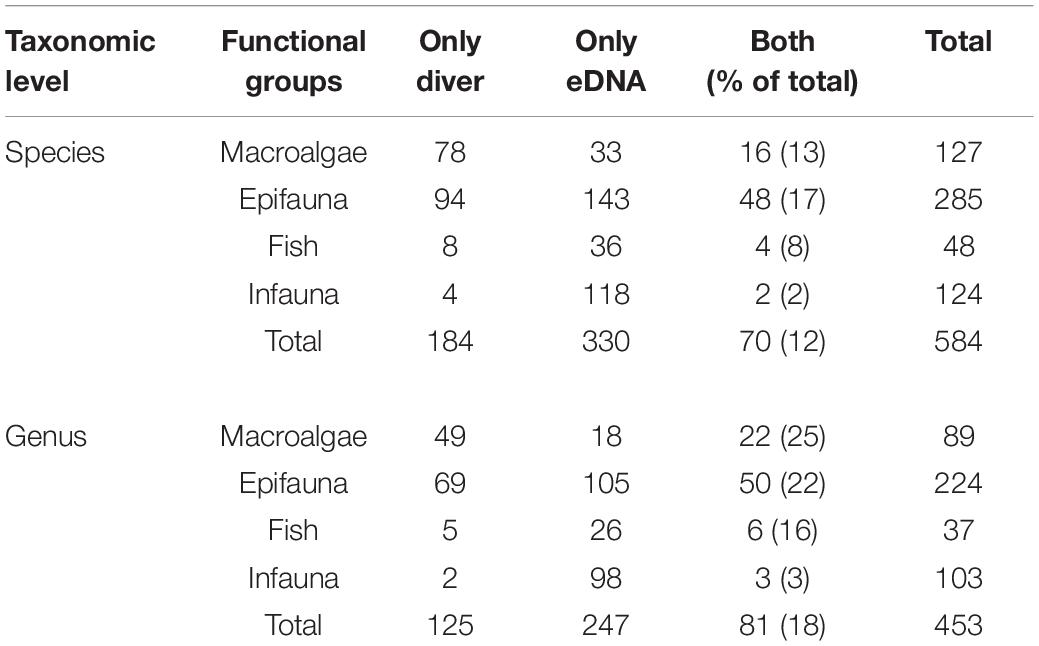
Table 2. Comparison of the number of species and genus within functional groups.
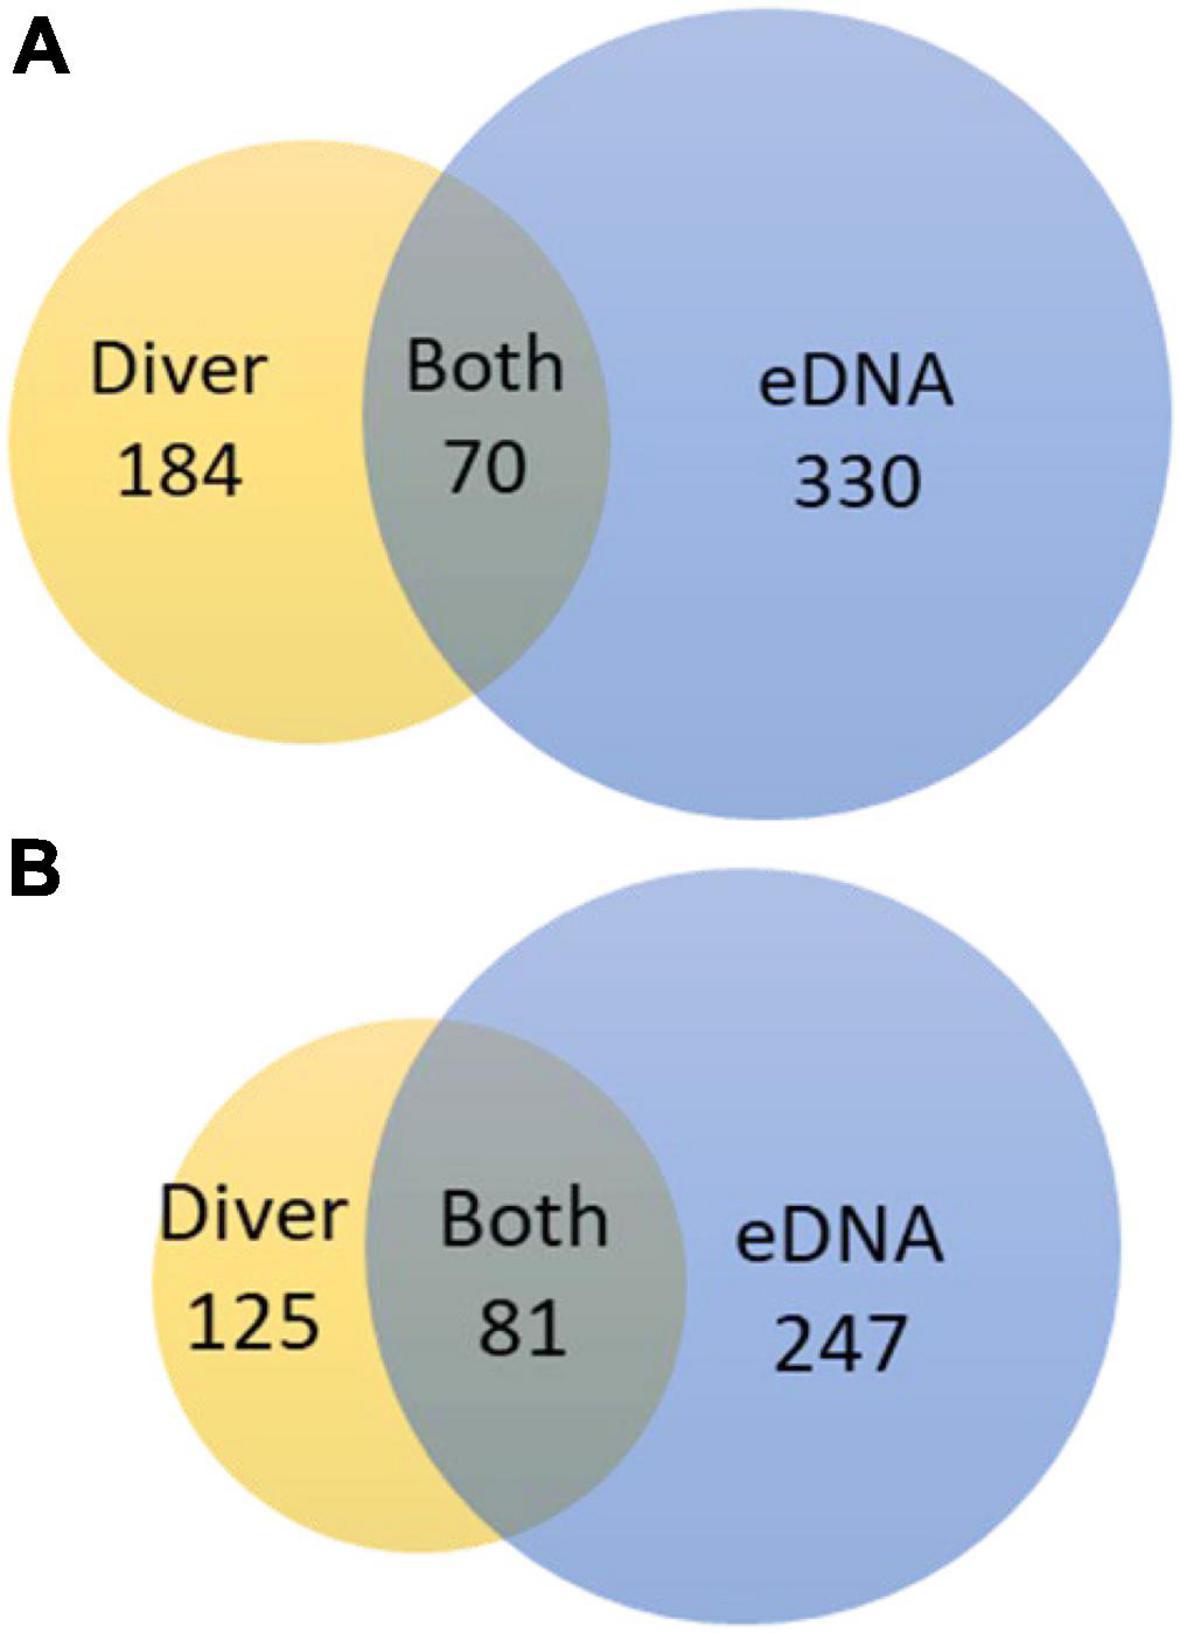
Figure 4. Venn diagrams comparing overlap in (A) number of species and (B) number of genus detected for all of the nine reef sites investigated using diver-based and eDNA based observations.
While eDNA detected more species overall, the two methods identified on average a similar number of species per site (Figure 5). For the eDNA approach, we detected slightly more species when sampling above the boulder reefs (46) compared to downstream (43) and upstream (43) of the reef. Differences in number of species detected were mostly associated with the hard bottom associated species (Table 3). Both methods provided significant different number of species among reef sites (p < 0.001, one-way ANOVA). Species richness detected by eDNA at sample locations (upstream, above-reef, downstream), were however, not significant different (p = 0.127, one-way ANOVA).
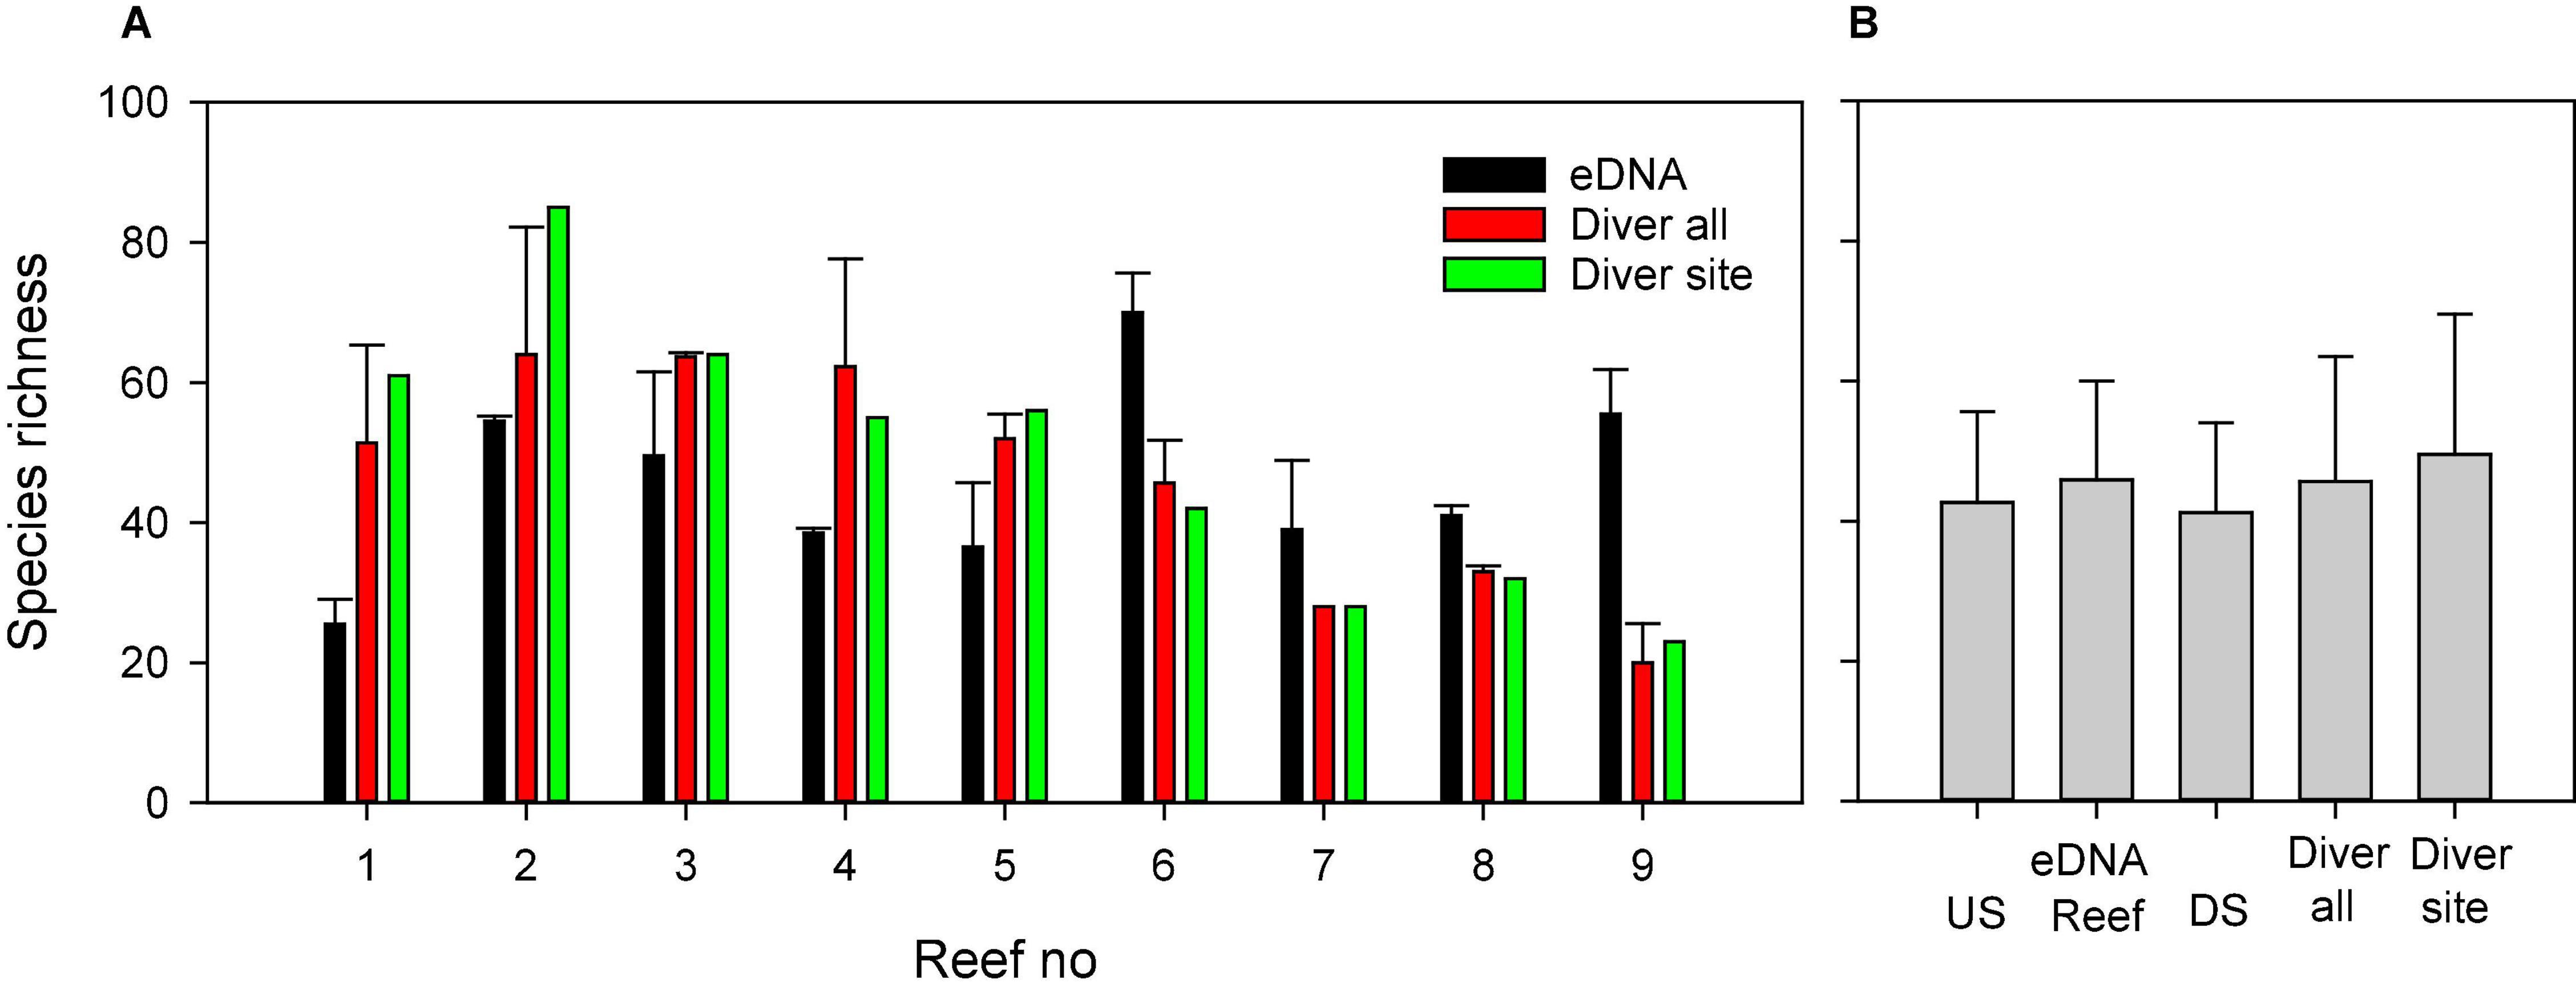
Figure 5. Comparison of the average number of species observed through eDNA and diver-based observations at (A) each reef and (B) overall for upstream (US), above-reef, downstream (DS) locations and from diving. Diver all, is an average of the number of species observed from multiple diving locations while Diver site is the number of species at the site of eDNA sampling only. Error bars are one SD.
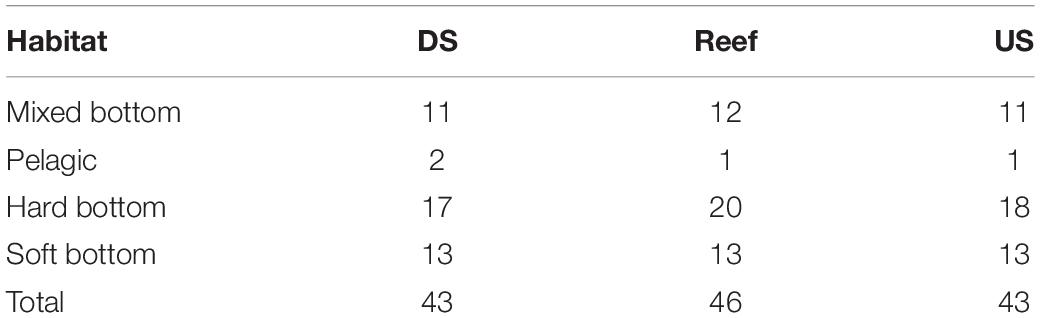
Table 3. Average number of species identified with eDNA for samples collected downstream (DS), above the reef (Reef) and upstream (US) of the nine reef sites and their distribution between four different habitats.
To compare the overall species composition by the two methods, we calculated the relative abundance of species, as sum of species present divided by number of samples. Sorting the species lists according to their relative abundance, and plotting these with their rank number, provided rank abundance curves where the slope can be used as a simple indicator of the overall evenness of the species composition (Figure 6). Each data set was modeled with an exponential decay function. Overall, the eDNA method had a higher slope (–0.021) compared to diver-based data (slope = –0.017). The eDNA method therefore seems to provide a less even distribution of species with a few species being very dominant. The eDNA records were furthermore dominated by many infaunal species not detected by the divers, while divers reported a number of macroalgae not recognized in the eDNA analysis (Figure 6 and Table 2).
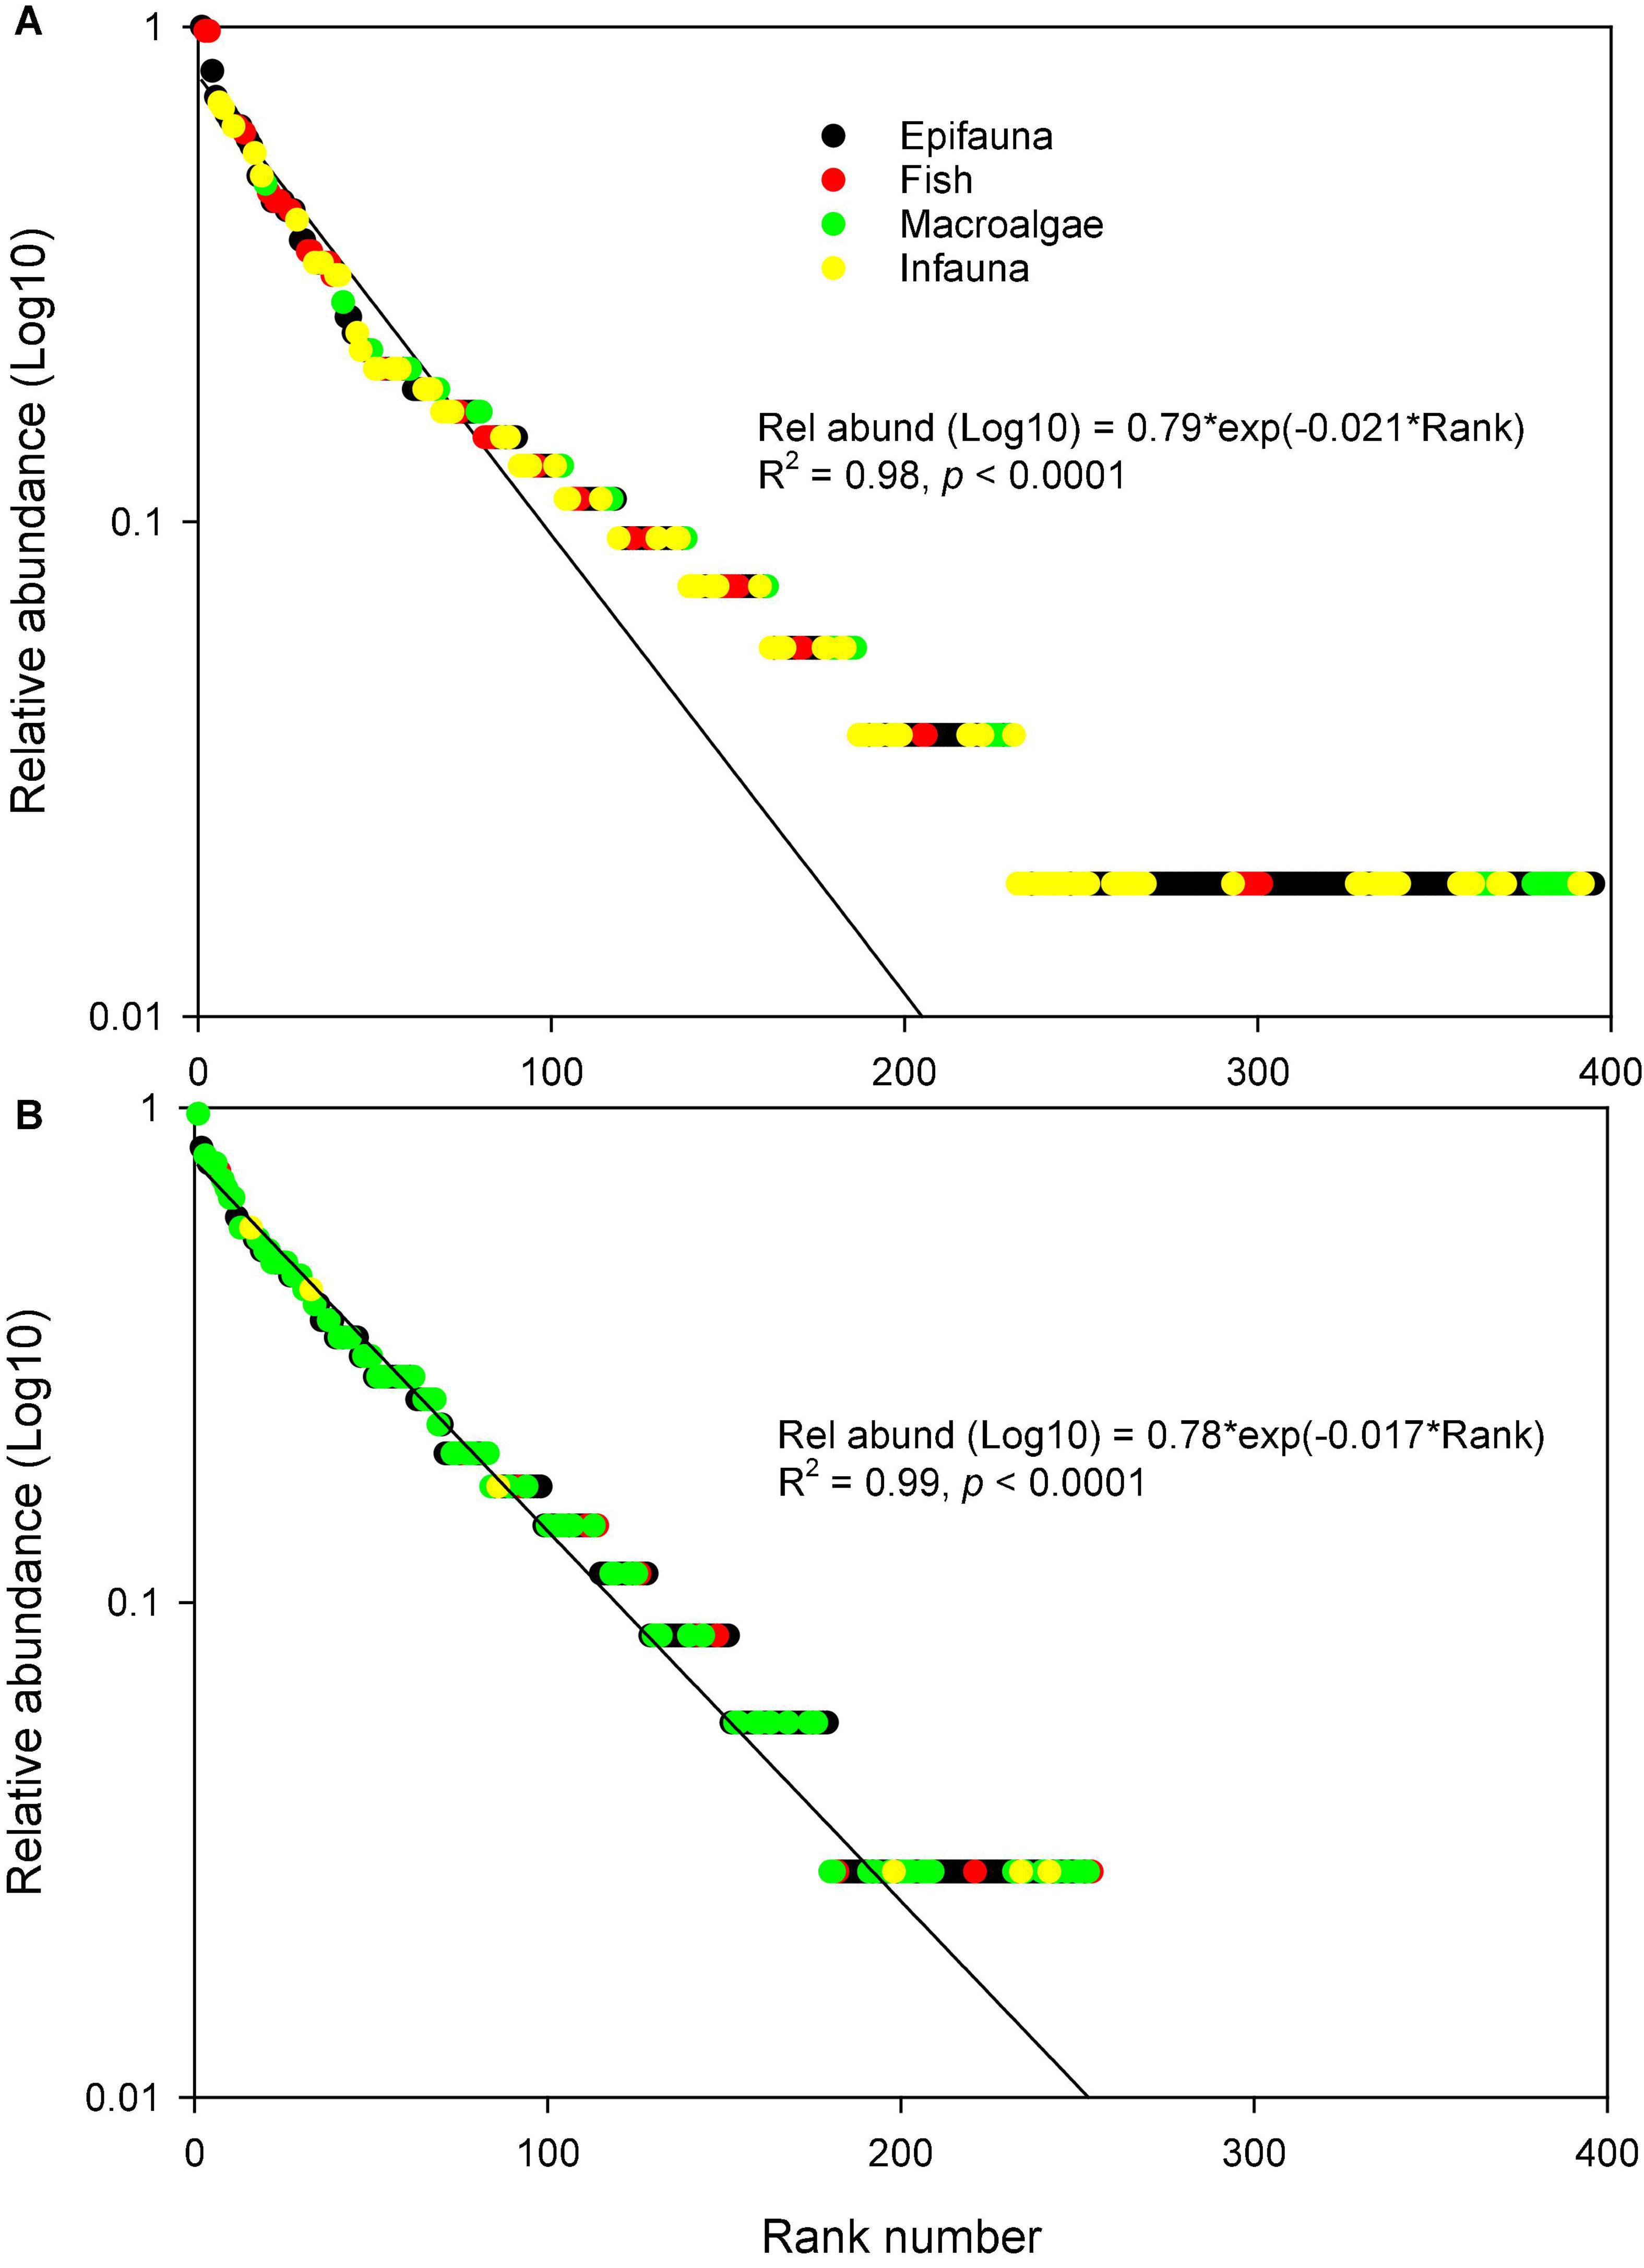
Figure 6. Rank abundance curves for species identified using (A) eDNA and (B) diver-based observations. Curves represent exponential regression models used to highlight differences in slope (evenness) between the two observation types.
Patterns in Community Structure
To assess the level of agreement between benthic species community composition detected through eDNA metabarcoding and diver-based observations, we calculated the similarity of the species communities using the Bray–Curtis similarity index. Based on eDNA data, the species community structure was overall significantly different among reefs and between locations, using replicate samples for each location and analysis of variance with PERMANOVA (Table 4). Also, differences in diver-based species composition among the nine reef sites, were significant (p = 0.001, one-way ANOSIM).
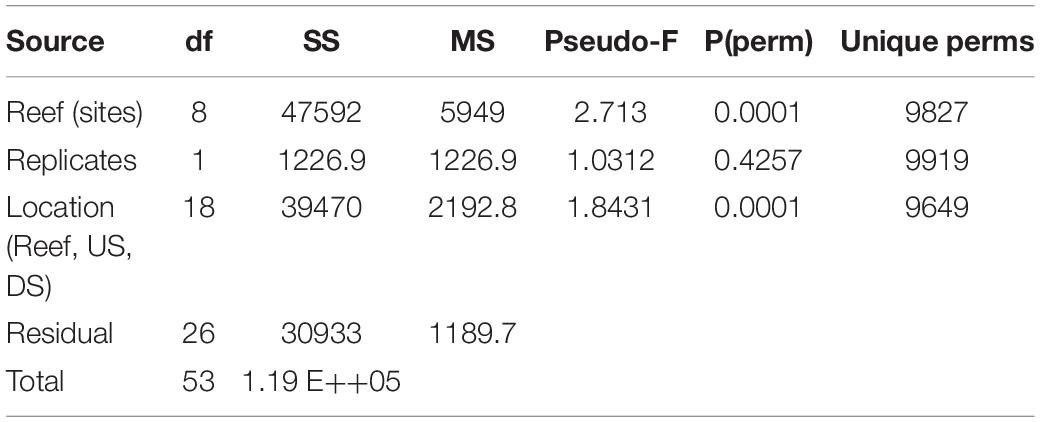
Table 4. PERMANOVA table of the significance of reefs site and location [downstream (DS), above-reef (Reef), and upstream (US)] for the variation in community structure in eDNA samples.
To visualize differences in species composition detected by eDNA and diver-based observations, we made 2D ordination plots and outlined the reef sites on these (Figure 7). Both eDNA and diver-based 2D ordination plots had a high stress of 0.33 and 0.26 respectively (Figure 7), compared to stress of 0.24 and 0.18 in 3D ordination (not shown). Thus, while the reef sites, according to the PERMANOVA (eDNA data) and ANOSIM (diver data) tests were statistically different, similarity in species composition were not optimally visualized in 2D ordination plots. Accordingly, some overlap was observed among reef sites for both the eDNA (Figure 7A) and diver-based (Figure 7B) data, with the highest degree of overlap for neighboring reefs. Furthermore, the PERMANOVA test indicated that there was a significant difference between the upstream, above-reef and downstream communities as detected by eDNA sampling. A visual comparison of the eDNA and diver-based ordination plots, suggested some similarities in the overall distribution of reef sites. This was supported by comparison of resemblance matrices using the RELATE analysis (r = 0.37, p = 0.02), indicating a moderate but significant match between the species composition pattern detected by the two methods.
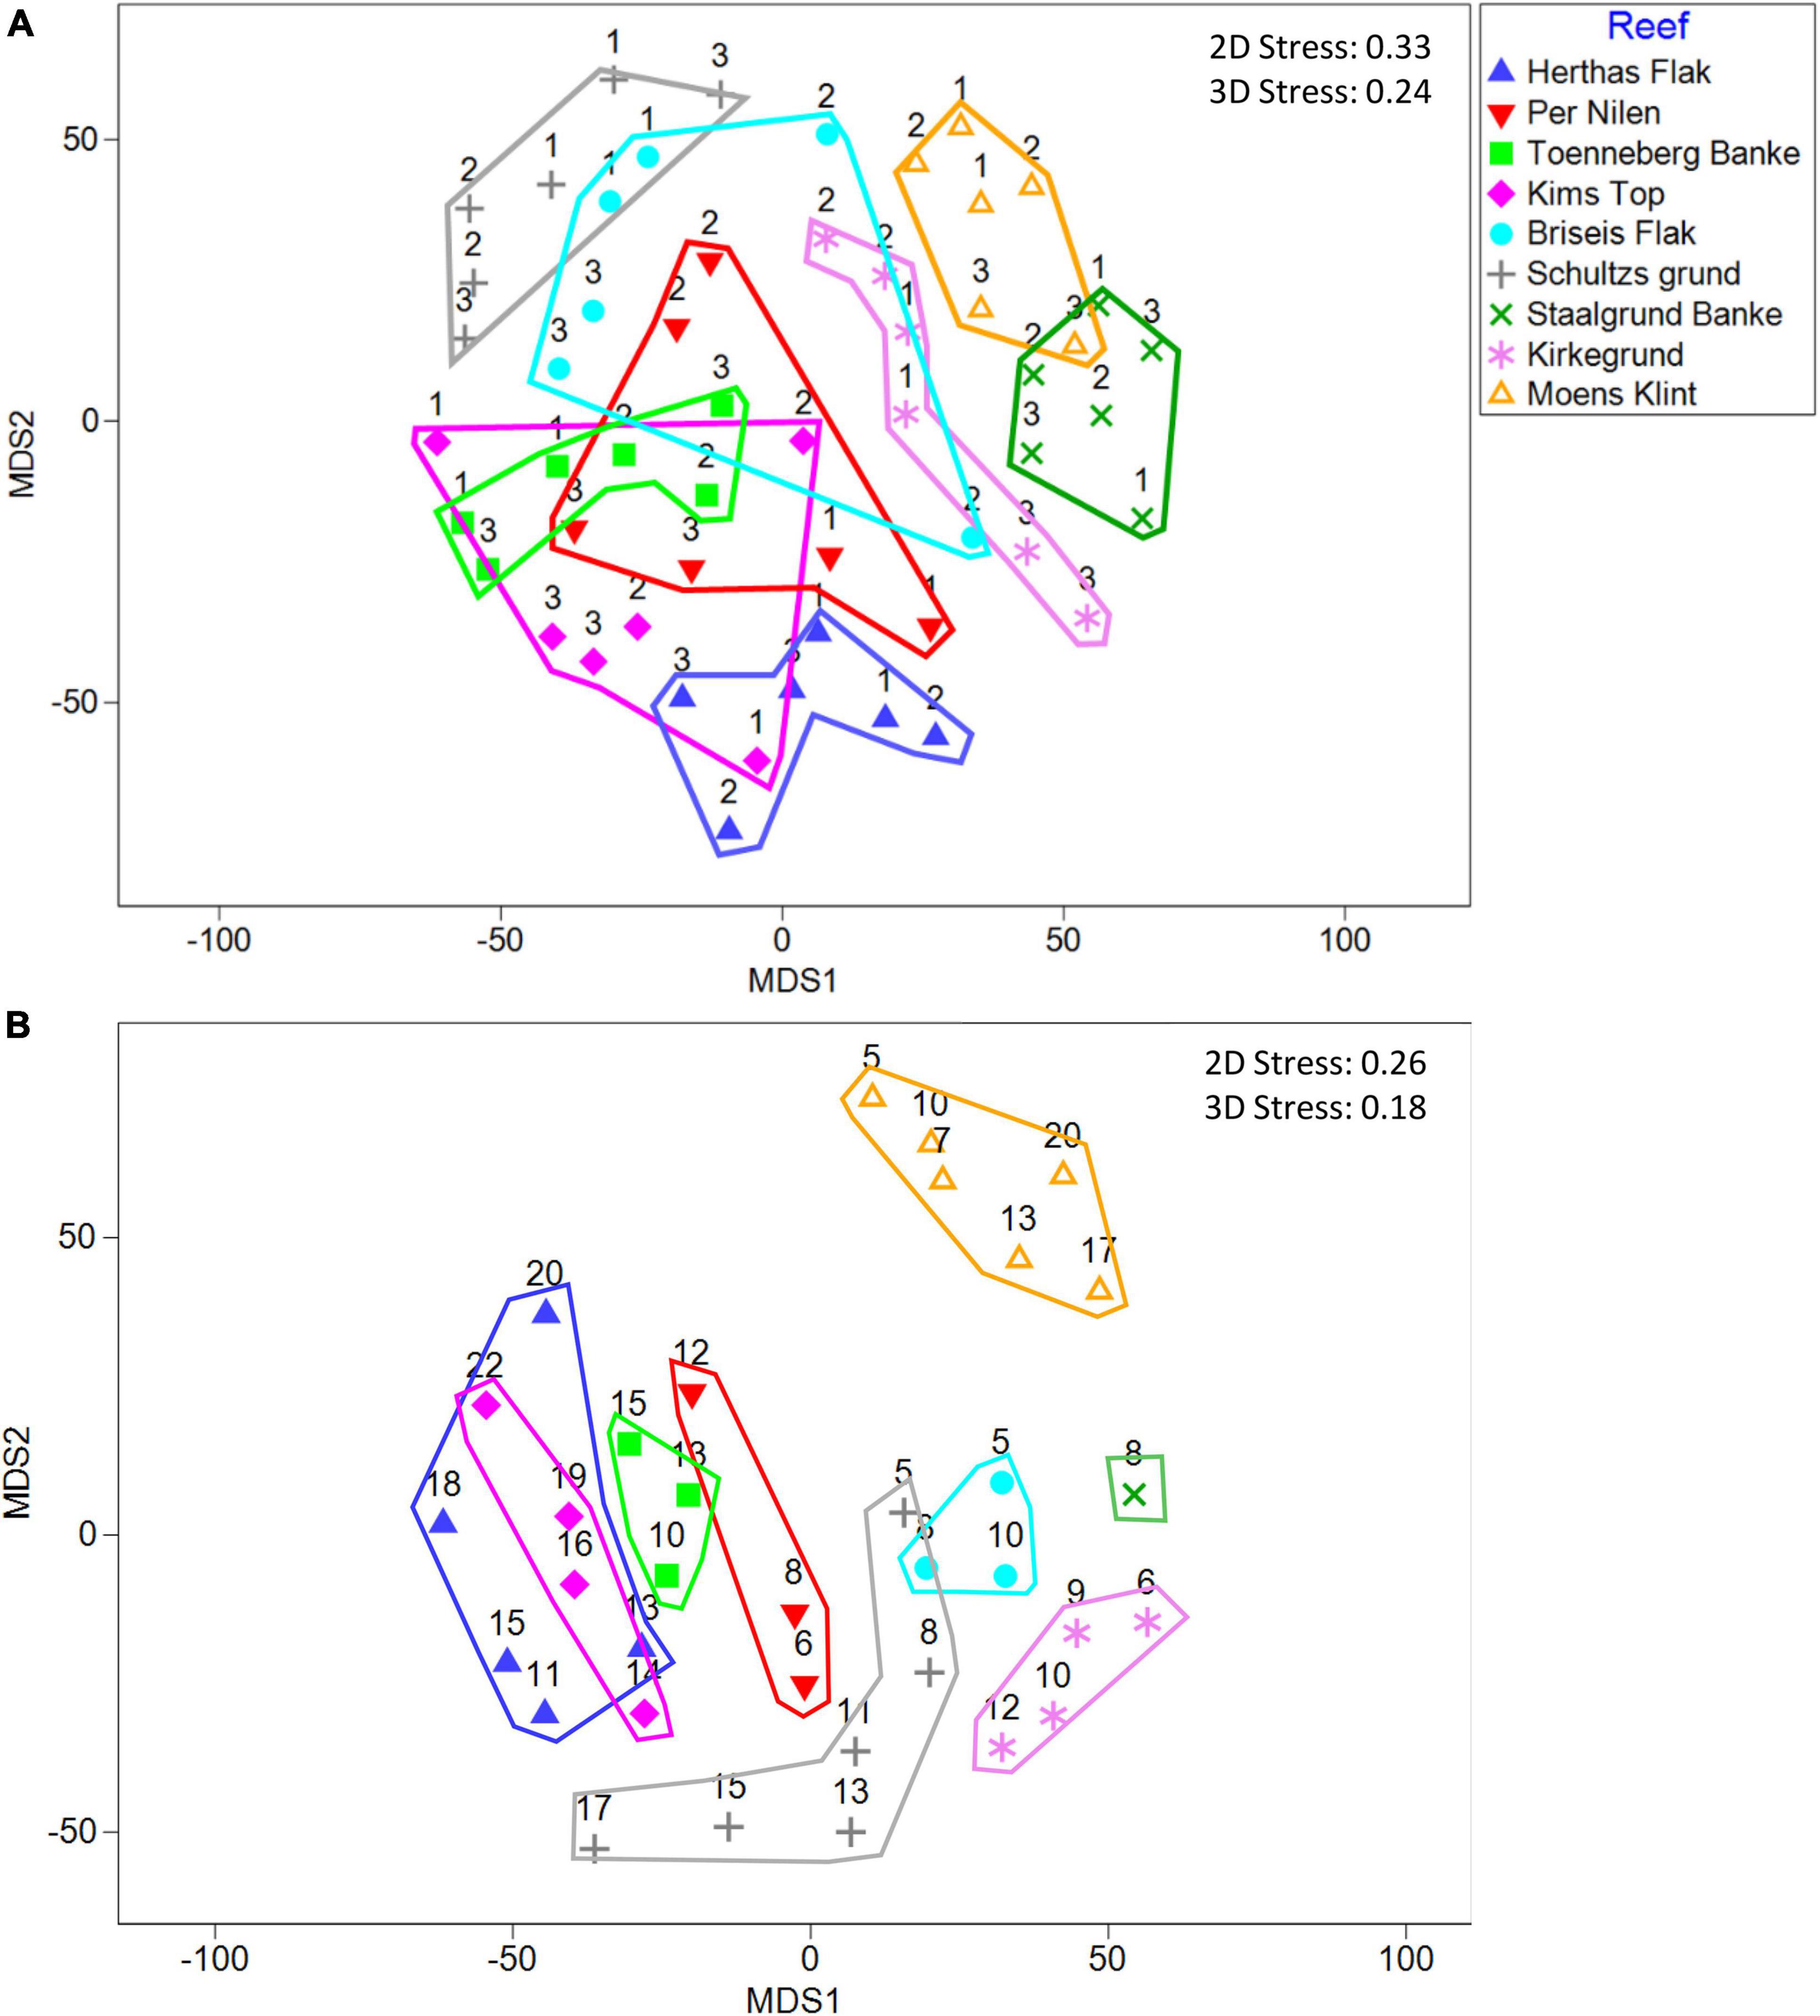
Figure 7. mMDS plot of the distribution of species among reefs determined from (A) eDNA and (B) diver observations. Numbers in (A) refer to 1 = upstream, 2 = above-reef, and 3 = downstream locations, and numbers in (B) refer to sampling depths. Analysis was based on non-transformed presence/absence data using Bray-Curtis similarity.
Importance of Environmental Conditions
A Pearson correlation analysis showed that, as expected, salinity decreased with increasing distance from the northern reef sites (r = –0.87, p < 0.001) and increased with depth (r = 0.58, p < 0.001). Also, water temperature decreased significantly with depth (r = 0.71, p < 0.001) and reef depths decreased with distance from north (r = –0.41, p < 0.001). Thus, with increasing distance from north to south, reefs overall became shallower, with warmer and less saline waters. Along this gradient, the species richness detected by eDNA showed a weak decrease with decreasing salinity (r = 0.23, p = 0.09), and a decrease with increasing temperatures (r = –0.44, p < 0.001). A correlation analysis for diver-based observations of species richness, showed similar trends, with higher richness in more saline waters (r = 0.77, p < 0.001), decreasing richness toward southern sites (r = –0.80, p < 0.001) and a decrease with increasing temperatures (r = –0.46, p = 0.005). Using the BIO–ENV routine to explore relationships between community structure and the environmental variables patterns, we found that the highest level of explanation to derive from a combination of distance, salinity, and water temperature (r = 0.48, p = 0.01) listed in order of importance.
Discussion
The usefulness of eDNA metabarcoding as a possible supplement to traditional diver-based monitoring of biodiversity at boulder reefs was investigated. The eDNA approach provided substantial additional information for the investigation of patterns in community structure along large scale environmental gradients as well as local differences around the nine reefs. While this is promising, the inability to identify several dominant macroalgal species, indicate that adjustments of the metabarcoding protocol for this specific group is needed to allow for better detection of benthic flora associated with boulder reefs. The relatively low agreement between species lists obtained from eDNA and diver-based observations is not surprising as it has been described in other comparative studies such as (Obst et al., 2020; Valdivia-Carrillo et al., 2021), demonstrating in part how these methods complement each other and highlighting that both techniques have limitations.
Comparability in Species Richness and Evenness
The eDNA approach provided an overall much larger list of species compared to the diver-based observations, suggesting that eDNA is a more sensitive approach. Part of this stems from the fact that eDNA captures signals from several infaunal and fish species not observed by the diver. In addition, due to exchange of water masses, the size of the investigated area is many times larger (square km) compared to the diver observations, which record species within an area of only approximately 25 m2. While eDNA provided more species overall, the average number of species at each reef site was surprisingly similar to the diver-based approach. However, there was a geographical difference with eDNA detecting less species at the northern sites (1–4) and more species at the southern sites compared to diver observation. The northern sites typically have a stronger stratification due to higher influence from the high saline inflow combined with generally greater water depth. At the southern sites with likely more mixing, the species identified by eDNA water samples, might originate from a larger and less restricted area leading to “overestimation” of the local species richness. A recent study of fish composition using metabarcoding, however, found that even in systems with strong vertical stratification, eDNA derived species composition, did not vary much between surface and bottom samples (Stoeckle et al., 2021), suggesting that mixing conditions may be less of an issue for fish. Also, looking carefully at changes in the species composition at the nine reef areas, the eDNA method has a larger renewal of species between sites compared to the diver-based method, which is more homogeneous across reefs. This interpretation stems from the fact that although two methods provided quite similar levels of species richness, the eDNA method identified many more species. Also, the rank abundance curves for the two methods are quite different. At ranks above ca. 50 there are several species identified by the eDNA technique which have very low relative abundance. This suggests a larger replacement of species compared to the diver-based method. In addition, most variation in species between reefs detected by eDNA are within the group of infaunal species not detectable by the diver-based approach. Comparing rank abundance curves, we likewise found a more even distribution of species with the diver method. This suggests that while divers may overlook some rare species, they overall manage to account for a comparable number of species across the investigated reef sites. In comparison, the eDNA method picked up more fish and infaunal species, and seemed to detect more rare species, but failed to detect some of the larger key species, especially within the group of macroalgae.
Remarkably, the eDNA method only detected 16 out of 94 (13%) species of macroalgae observed through diver-based sampling. At the genus level the eDNA approach detected 22 out of 81 (22%). Missing a target group in eDNA metabarcoding could be due to its absence in the reference database or low taxonomic resolution here; low affinity of the metabarcoding primers, or lack of DNA in the water sample from low release rate from the target organisms (Guillera-Arroita et al., 2017). Checking of the reference databases revealed that most of the missing macroalgal species are present in the 18S-PR2 and COI-BOLD databases. As recently shown, other 18S markers are only able to identify brown algae to order or family level (Ørberg et al., 2021). The COI-marker has also been used for the DNA barcoding of both brown and red algae with specific primers developed for these groups (Bartolo et al., 2020). Therefore, it is likely that the universal invertebrate COI primers, used in this study, misses the macroalgae due to a low affinity. At present there are no standard barcoding primers known to cover the whole macroalgal diversity (Bartolo et al., 2020), and the important lesson learned from this study is new protocols are required to catch this important organism group. Application of statistical models, such as occupancy models, should also be considered in preparation of future comparisons of visual and eDNA methods. Experiences show that application of occupancy models help assess the performance of used methods, reduce the risk of false detections (Ficetola et al., 2015), and improve ecological inference (McClenaghan et al., 2020).
Origin of Environmental DNA Sampled
Considering the differences between upstream, above-reef, and downstream sampling sites, our results indicated slightly higher number of species physically close to the reefs, as expected. However, differences in species richness were not significant, as the number of infaunal and fish species were similar among sites and because eDNA failed to detect the majority of macroalgal species, which dominated the reef locations (see Figure 5B). As boulder reefs consist of aggregations of stones of varying sizes laying on a bed of sandy sediment or clay, there will be a high number of soft bottom infaunal species within the boulder reefs themselves (see Figure 1). Furthermore, there was a water current of between 0.1 and 1.5 knots during the time of sampling. With the down- and upstream areas placed on average 2.6 km away from the central part of the reef area, it would approximately take less than 3 h for upstream water masses to move over the reef to the downstream site. Another factor which influences the exchange of water masses and thus DNA between upstream, above-reef and downstream sampling locations, is the sampled water depth. Due to the influence of salt water intrusion from the North Sea and outflow of less saline water from the Baltic Sea, many of the reefs have a top which is located strictly in water mass above the halocline during summer. As up- and downstream sites were sampled at greater depth, exchange of DNA between these water masses across the halocline is highly unlikely, albeit this has been observed in fish surveys (Stoeckle et al., 2021). Furthermore, in areas where exchange of water masses with remote DNA do occur, the concentration will be strongly affected by dilution from currents and degradation. Studies have shown that eDNA degrades exponentially over time in sea water, with rates reported between 10 and 50% per hour for fish (Saito and Doi, 2021). These factors suggest, that while eDNA from up- and downstream areas may influence the eDNA sampled above a reef (Figure 1), the majority of eDNA measured within a reef area would likely be of local origin. While species richness was similar among upstream – above-reef - downstream locations, the PERMANOVA analysis indicated significant differences in the composition of species. Although we expected species richness to be higher above-reef, eDNA detection suggested that approximately the same number of species were found around the reefs. But according to the PERMANOVA analysis the composition of the communities varied locally around the reefs. Thus, while water movement between adjacent areas around a reef may efficiently transport DNA material, there were still sufficiently large differences in the eDNA footprint among the local locations to distinguish these.
Importance of Environmental Conditions
It is known that higher water temperatures accelerate DNA degradation (Akihide et al., 2020), thus reducing the potential geographical donor area contributing to the DNA sampled at a given site. We observed a significant reduction in species richness with increasing temperature, indicating a direct effect of temperature on eDNA fate. This supports previous findings that the eDNA methodology to obtain species is sensitive toward a range of environmental conditions (Barnes and Turner, 2016). There was, however, also a significant negative correlation between species richness, determined by divers and water temperature. This suggests that the temperature effect was not causal, but inferred from a significant covariation with other governing conditions, such as salinity, which is known to affect species richness in benthic communities of Danish waters (Middelboe et al., 1997; Josefson and Hansen, 2004). In support of this expectations, both the eDNA and diver-based method indicated a significant salinity dependency, with lowest species richness in the less saline and warmer waters in the south eastern waters. The observed correlations between eDNA derived species richness, temperature and salinity are therefore likely caused by a combination of direct physical effects and a range of ecological factors including seasonal affinity to prevailing environmental conditions by the species (see Figure 1). In addition, the multivariate analysis showed that community structure was significantly related to gradients in distance, salinity, and water temperature, underlying the importance of these conditions for observed patterns in species composition and species richness associated with boulder reef structures. Also, differences in temperature and salinity conditions around the reefs resulting from different sampling depths, suggests that differences in eDNA sampled were affected by the level of water column mixing within each of the nine reef sites.
Patterns in Regional Community Structure
Multivariate analysis of eDNA and diver-based observations, both showed that the nine reefs, differed significantly in community structure. The mMDS ordination plots were associated with high uncertainty (high stress values) indicating large variations in the species composition among samples from the same reef. This is to be expected when comparing data from sites spanning large gradients in several environmental conditions, in particular since the within site variability in conditions (i.e., light, temperature, salinity, and substrate conditions) framing the benthic communities vary substantially. Nevertheless, a significant match was found between the overall community structure detected by the eDNA and diver-based method. Thus, while the methods emphasize different aspects of the benthic communities, with eDNA method biased toward faunal species, and diver-based method focusing on macroalgae, the detected patterns in community structure suggest that the methods provide complimentary information. Lack of replication for the diver-based method precluded us from a rigorous statistical testing of differences between reefs sites. This was possible and a clear advantage with the eDNA method, which in agreement with our expectations, showed that the nine investigated reef sites differed significantly in their community structure.
Conclusion
Environmental DNA added substantially to the diver-based observations of benthic species composition, especially within infauna and fish which are difficult to detect as a diver. While insignificant differences in species richness between downstream, above-reef and upstream locations suggest that the local imprint of boulder reefs is rather weak, analysis of species community structure showed a significant effect of sample location indicating a boulder-specific imprint in the region, although smaller than anticipated. While the eDNA technique currently misses many of the macroalgal species, eDNA sampling within a reef can be a useful supplement to diver-based observations, providing a much more detailed account of many faunal species, not accessible to the diver-based methodology. To reduce the influence of eDNA signals from species outside the reefs, it is important to sample water from different sites around the reefs, and to collect environmental data such as water temperature, salinity, current speed, and direction to characterize and discriminate water masses. This will also be useful to assess the importance of physical (dilution) and biochemical (degradation) processes that may affect eDNA signals at the study site.
Data Availability Statement
The datasets presented in this study can be found in online repositories. The names of the repository/repositories and accession number(s) can be found below: European Nucleotide Archive (accession: PRJEB48452).
Author Contributions
PSt designed the study, contributed to eDNA and diver-based data collection, and wrote the manuscript and was responsible for analyzing data and producing figures and tables. MP designed the metabarcoding experiment, supervised the laboratory work, and contributed to the discussion of results. MO performed the bioinformatical analysis and contributed to write the manuscript. HB identified species from stone samples collected by the divers and performed quality assessment of the diver-based observations. RS contributed to the statistical and bioinformatical analysis and in the manuscript writing. AW contributed to the writing of the manuscript. KD organized the field sampling trip and contributed to diver-based assessment and helped write the manuscript. PSu designed and planned the eDNA study and associated research questions, and contributed manuscript writing. CG helped obtain environmental data, produce maps and contributed to manuscript writing. All the authors contributed to the article and approved the submitted version.
Funding
Funding for this research was received through 38-2-22-18 GEANS project (Genetic tools for Ecosystem health Assessment in the North Sea region), an Interreg project supported by the North Sea Programme of the European Regional Development Fund of the European Union. We are furthermore thankful for support from the eDNA center at Aarhus University, DCE for AW and RS and financial support from the Swedish Environmental Protection Agency and Swedish Agency for Marine and Water Management (contract 802-0107-18) to PSu.
Conflict of Interest
The authors declare that the research was conducted in the absence of any commercial or financial relationships that could be construed as a potential conflict of interest.
Publisher’s Note
All claims expressed in this article are solely those of the authors and do not necessarily represent those of their affiliated organizations, or those of the publisher, the editors and the reviewers. Any product that may be evaluated in this article, or claim that may be made by its manufacturer, is not guaranteed or endorsed by the publisher.
Acknowledgments
We thank Yannic Wocken, Alizz Axberg, and Olga Ortega-Martinez for assistance in the molecular laboratory. We acknowledge support from the National Genomics Infrastructure in Stockholm funded by Science for Life Laboratory, the Knut and Alice Wallenberg Foundation and the Swedish Research Council, and SNIC/Uppsala Multidisciplinary Center for Advanced Computational Science for assistance with massively parallel sequencing and access to the UPPMAX computational infrastructure. Finally, we greatly appreciate constructive comments and detailed suggestions from three reviewers which helped improve clarity of the study.
Supplementary Material
The Supplementary Material for this article can be found online at: https://www.frontiersin.org/articles/10.3389/fmars.2021.800474/full#supplementary-material
Footnotes
- ^ https://ifm.fcoo.dk/
- ^ https://support.illumina.com/documents/documentation/chemistry_documentation/16s/16s-metagenomic-library-prep-guide-15044223-b.pdf
- ^ www.boldsystems.org/
- ^ https://pr2-database.org/
- ^ http://mitofish.aori.u-tokyo.ac.jp/
References
Airoldi, L., Balata, D., and Beck, M. W. (2008). The gray zone: relationships between habitat loss and marine diversity and their applications in conservation. J. Exp. Mar. Biolo. Ecol. 366, 8–15. doi: 10.1016/j.jembe.2008.07.034
Airoldi, L., and Beck, M. W. (2007). Loss, status and trends for coastal marine habitats of Europe. Oceanogr. Mar. Biol. 45, 345–405. doi: 10.1201/9781420050943.ch7
Akihide, K., Shingo, T., Aya, Y., Reiji, M., and Hiroki, Y. (2020). The effect of temperature on environmental DNA degradation of Japanese eel. Fish. Sci. 86, 465–471. doi: 10.1007/s12562-020-01409-1
Anderson, M., Gorley, R., and Clarke, R. (2008). Permanova+ for Primer: Guide to Software and Statisticl Methods: Primer-E Limited; 2008. Plymouth, UK: Massey University.
Barnes, M. A., and Turner, C. R. (2016). The ecology of environmental DNA and implications for conservation genetics. Conserv. Genet. 17, 1–17. doi: 10.1007/s10592-015-0775-4
Bartolo, A. G., Zammit, G., Peters, A. F., and Küpper, F. C. (2020). The current state of DNA barcoding of macroalgae in the mediterranean sea: presently lacking but urgently required. Bot. Mar. 63, 253–272. doi: 10.1515/bot-2019-0041
Bendtsen, J., Söderkvist, J., Dahl, K., Hansen, J., and Reker, J. (2007). Model Simulations of Blue Corridors in the Baltic Sea. BALANCE interim Report No 9.
Bohnsack, J. A., and Sutherland, D. L. (1985). Artificial reef research: a review with recommendations for future priorities. Bull. Mar. Sci. 37, 11–39.
Bray, J. R., and Curtis, J. T. (1957). An ordination of the upland forest communities of southern wisconsin. Ecol. Monogr. 27, 326–349. doi: 10.2307/1942268
Buchner, D., and Leese, F. (2020). BOL digger–a python package to identify and organise sequences with the barcode of life data systems. Metab. Metagenomics 4:e53535. doi: 10.3897/mbmg.4.53535
Callahan, B. J., McMurdie, P. J., Rosen, M. J., Han, A. W., Johnson, A. J. A., and Holmes, S. P. (2016). DADA2: high-resolution sample inference from Illumina amplicon data. Nat. Methods 13, 581–583. doi: 10.1038/nmeth.3869
Clarke, K. R., Gorley, R., Somerfield, P. J., and Warwick, R. (2014). Change in Marine Communities: An Approach to Statistical Analysis and Interpretation. Plymouth: Primer-E Ltd.
Dahl, K., and Lundsteen, S. (2018). Macroalgae and Hardbottom Fauna on Boulder and Boble Reefs Technical Report. Roskilde: Aarhus University, DCE — National Center for Environment and Energy.
Darling, J. A., and Mahon, A. R. (2011). From molecules to management: adopting DNA-based methods for monitoring biological invasions in aquatic environments. Environ. Res. 111, 978–988. doi: 10.1016/j.envres.2011.02.001
Dejean, T., Valentini, A., Miquel, C., Taberlet, P., Bellemain, E., and Miaud, C. (2012). Improved detection of an alien invasive species through environmental DNA barcoding: the example of the American bullfrog Lithobates catesbeianus. J. Appl. Ecol. 49, 953–959. doi: 10.1111/j.1365-2664.2012.02171.x
Directive, H. (1992). Council directive 92/43/EEC of 21 may 1992 on the conservation of natural habitats and of wild fauna and flora. Off. J. Eur. Union 206, 7–50.
Ficetola, G. F., Pansu, J., Bonin, A., Coissac, E., Giguet-Covex, C., De Barba, M., et al. (2015). Replication levels, false presences and the estimation of the presence/absence from eDNA metabarcoding data. Mol. Ecol. Resour. 15, 543–556. doi: 10.1111/1755-0998.12338
Fonseca, V. G., Carvalho, G. R., Sung, W., Johnson, H. F., Power, D. M., Neill, S. P., et al. (2010). Second-generation environmental sequencing unmasks marine metazoan biodiversity. Nat. Commun. 1, 1–8. doi: 10.1038/ncomms1095
Foster, S. D., and Dunstan, P. K. (2010). The analysis of biodiversity using rank abundance distributions. Biometrics 66, 186–195. doi: 10.1111/j.1541-0420.2009.01263.x
Gill, D. A., Mascia, M. B., Ahmadia, G. N., Glew, L., Lester, S. E., Barnes, M., et al. (2017). Capacity shortfalls hinder the performance of marine protected areas globally. Nature 543, 665–669. doi: 10.1038/nature21708
Goldberg, C. S., Turner, C. R., Deiner, K., Klymus, K. E., Thomsen, P. F., Murphy, M. A., et al. (2016). Critical considerations for the application of environmental DNA methods to detect aquatic species. Methods Ecol. Evolu. 7, 1299–1307. doi: 10.1111/2041-210X.12595
Guillera-Arroita, G., Lahoz-Monfort, J. J., van Rooyen, A. R., Weeks, A. R., and Tingley, R. (2017). Dealing with false-positive and false-negative errors about species occurrence at multiple levels. Methods Ecol. Evolu. 8, 1081–1091. doi: 10.1111/2041-210X.12743
Helmig, S. A., Nielsen, M. M., and Petersen, J. K. (2020). Andre Presfaktorer end Næringsstoffer og KlimaforandringerVurdering af Omfanget af Stenfiskeri i Kystnære Marine Områder. Nykøbing Mors: Technical University of Denmark, Institute for Aquatic Resources.
Jeunen, G. J., Knapp, M., Spencer, H. G., Lamare, M. D., Taylor, H. R., Stat, M., et al. (2019). Environmental DNA (eDNA) metabarcoding reveals strong discrimination among diverse marine habitats connected by water movement. Mol. Ecol. Resour. 19, 426–438. doi: 10.1111/1755-0998.12982
Josefson, A., and Hansen, J. (2004). Species richness of benthic macrofauna in danish estuaries and coastal areas. Global Ecol. Biogeogr. 13, 273–288. doi: 10.1111/j.1466-822X.2004.00091.x
Keith, D., Akçakaya, H. R., Butchart, S. H., Collen, B., Dulvy, N. K., Holmes, E. E., et al. (2015). Temporal correlations in population trends: conservation implications from time-series analysis of diverse animal taxa. Biol. Conserv. 192, 247–257. doi: 10.1016/j.biocon.2015.09.021
Krause-Jensen, D., Bruhn, A., Dahl, K., and Carstensen, J. (2021). “Bundplanter: ålegræs og makroalger,” in Marine områder 2019: NOVANA (in Danish), ed. J. W. Hansen (DCE - Nationalt Center for Miljø og Energi: Aarhus University), 76–87.
Krause-Jensen, D., and Duarte, C. M. (2016). Substantial role of macroalgae in marine carbon sequestration. Nat. Geosci. 9, 737–742. doi: 10.1038/ngeo2790
Krause-Jensen, D., Markager, S., and Dalsgaard, T. (2012). Benthic and pelagic primary production in different nutrient regimes. Estuar. Coasts 35, 527–545. doi: 10.1007/s12237-011-9443-1
Kristensen, L., Støttrup, J., Svendsen, J., Stenberg, C., Højbjerg Hansen, O., and Grønkjær, P. (2017). Behavioural changes of Atlantic cod (Gadus morhua) after marine boulder reef restoration: implications for coastal habitat management and natura 2000 areas. Fishe. Manage. Ecol. 24, 353–360. doi: 10.1111/fme.12235
Leray, M., and Knowlton, N. (2015). DNA barcoding and metabarcoding of standardized samples reveal patterns of marine benthic diversity. Proc. Natl. Acad. Sci. 112, 2076–2081. doi: 10.1073/pnas.1424997112
Leray, M., Yang, J. Y., Meyer, C. P., Mills, S. C., Agudelo, N., Ranwez, V., et al. (2013). A new versatile primer set targeting a short fragment of the mitochondrial COI region for metabarcoding metazoan diversity: application for characterizing coral reef fish gut contents. Front. Zool. 10:1–14. doi: 10.1186/1742-9994-10-34
Lundsteen, S., Dahl, K., and Tendal, O. (2008). Biodiversity on boulder reefs in central kattegat. Balance Int. Rep. 15, 25.
Martin, M. (2011). Cutadapt removes adapter sequences from high-throughput sequencing reads. EMBNET J. 17, 10–12. doi: 10.14806/ej.17.1.200
McClenaghan, B., Compson, Z. G., and Hajibabaei, M. (2020). Validating metabarcoding-based biodiversity assessments with multi-species occupancy models: a case study using coastal marine eDNA. PLoS one 15:e0224119. doi: 10.1371/journal.pone.0224119
Middelboe, A. L., Sand-Jensen, K., and Brodersen, K. (1997). Patterns of macroalgal distribution in the kattegat-baltic region. Phycologia 36, 208–219. doi: 10.2216/i0031-8884-36-3-208.1
Mikkelsen, L., Mouritsen, K., Dahl, K., Teilmann, J., and Tougaard, J. (2013). Re-established stony reef attracts harbour porpoises phocoena phocoena. Mar. Ecol. Prog. Ser. 481, 239–248. doi: 10.3354/meps10260
Miya, M., Sato, Y., Fukunaga, T., Sado, T., Poulsen, J., Sato, K., et al. (2015). MiFish, a set of universal PCR primers for metabarcoding environmental DNA from fishes: detection of more than 230 subtropical marine species. R. Soc. Open Sci. 2:150088. doi: 10.1098/rsos.150088
Obst, M., Exter, K., Allcock, A. L., Arvanitidis, C., Axberg, A., Bustamante, M., et al. (2020). A marine biodiversity observation network for genetic monitoring of hard-bottom communities (ARMS-MBON). Front. Mar. Sci. 7:572680. doi: 10.3389/fmars.2020.572680
Ørberg, S., Krause-Jensen, D., Geraldi, N., Ortega, A., Díaz-Rúa, R., and Duarte, C. (2021). Fingerprinting Arctic and North Atlantic macroalgae with eDNA - application and perspectives. Environ. DNA. doi: 10.1002/edn3.262
Pandolfi, J. M., Bradbury, R. H., Sala, E., Hughes, T. P., Bjorndal, K. A., Cooke, R. G., et al. (2003). Global trajectories of the long-term decline of coral reef ecosystems. Science 301, 955–958. doi: 10.1126/science.1085706
Piaggio, A. J., Engeman, R. M., Hopken, M. W., Humphrey, J. S., Keacher, K. L., Bruce, W. E., et al. (2014). Detecting an elusive invasive species: a diagnostic PCR to detect B urmese python in F lorida waters and an assessment of persistence of environmental DNA. Mol. Ecol. Resour. 14, 374–380. doi: 10.1111/1755-0998.12180
R-Core-Team (2019). A Language and Environment for Statistical Computing. Vienna: R Foundation for Statistical Computing.
Roussel, J. M., Paillisson, J. M., Treguier, A., and Petit, E. (2015). The downside of eDNA as a survey tool in water bodies. J. Appl. Ecol. 52, 823–826. doi: 10.1111/1365-2664.12428
Saito, T., and Doi, H. (2021). Degradation modeling of water environmental DNA: experiments on multiple DNA sources in pond and seawater. Environ. DNA 3, 850–860. doi: 10.1002/edn3.192
Schwartzbach, A., Behrens, J. W., and Svendsen, J. C. (2020). Atlantic cod gadus morhua save energy on stone reefs: implications for the attraction versus production debate in relation to reefs. Mar. Ecol. Prog. Ser. 635, 81–87. doi: 10.3354/meps13192
Sørensen, L. K. D. (2012). Oceanographic Variability at a Boulder Reef in the Kattegat and Surrounding Waters. Ph. D, Thesis. University of Copenhagen.
Staehr, P. A., Göke, C., Holbach, A. M., Krause-Jensen, D., Timmermann, K., Upadhyay, S., et al. (2019). Habitat model of eelgrass in danish coastal waters: development, validation and management perspectives. Front. Mar. Sci. 6:175. doi: 10.3389/fmars.2019.00175
Staehr, P. A., Staehr, S. U., Tonetta, D., Høgslund, S., and Nielsen, M. M. (2021). Contribution of boulder reef habitats to oxygen dynamics of a shallow estuary. Sci. Total Environ. 805:150261. doi: 10.1016/j.scitotenv.2021.150261
Stæhr, P. A., Markager, S., Høgslund, S., Hansen, J. W., Tonetta, D., Upadhyay, S., et al. (2020). Stenrev som muligt kvælstofvirkemiddel: vækstbetingelser for bentiske alger og deres betydning for ilt-og næringsstofdynamikken i limfjorden. Aarhus Univ. DCE Natl. Centre Environ. Energy 394:1.
Stenberg, C., and Kristensen, L. D. (2015). Stenrev som gyde-og opvækstområde for fisk (Revfisk). Charlottenlund: Institute for Aquatic Ressources.
Stenberg, C., Støttrup, J., Dahl, K., Lundsteen, S., Göke, C., and Andersen, O. N. (2015). Ecological Benefits From Restoring A Marine Cavernous Boulder Reef in Kattegat. Denmark. DTU Aqua, Danmarks Tekniske Universitet.
Stoeckle, M. Y., Adolf, J., Charlop-Powers, Z., Dunton, K. J., Hinks, G., and VanMorter, S. M. (2021). Trawl and eDNA assessment of marine fish diversity, seasonality, and relative abundance in coastal New Jersey, USA. ICES J. Mar. Sci. 78, 293–304. doi: 10.1093/icesjms/fsaa225
Thomsen, P. F., and Willerslev, E. (2015). Environmental DNA–an emerging tool in conservation for monitoring past and present biodiversity. Biol. Conserv. 183, 4–18. doi: 10.1016/j.biocon.2014.11.019
Tréguier, A., Paillisson, J. M., Dejean, T., Valentini, A., Schlaepfer, M. A., and Roussel, J. M. (2014). Environmental DNA surveillance for invertebrate species: advantages and technical limitations to detect invasive crayfish P rocambarus clarkii in freshwater ponds. J. Appl. Ecol. 51, 871–879. doi: 10.1111/1365-2664.12262
Turner, C. R., Uy, K. L., and Everhart, R. C. (2015). Fish environmental DNA is more concentrated in aquatic sediments than surface water. Biol. Conserv. 183, 93–102. doi: 10.1016/j.biocon.2014.11.017
Valdivia-Carrillo, T., Rocha-Olivares, A., Reyes-Bonilla, H., Domínguez-Contreras, J. F., and Munguia-Vega, A. (2021). Integrating eDNA metabarcoding and simultaneous underwater visual surveys to describe complex fish communities in a marine biodiversity hotspot. Mol. Ecol. Resour. 21, 1558–1574. doi: 10.1111/1755-0998.13375
Winding, A., Bang-Andreasen, T., Hansen, L., Panitz, F., Krogh, P., Krause-Jensen, D., et al. (2019). eDNA in Environmental Monitoring. Aarhus University, DCE—Danish Centre for Environment and Energy Technical Report No. 133. Roskilde: Aarhus University, DCE—Danish Centre for Environment and Energy.
Keywords: community structure, benthic, boulder reefs, eDNA metabarcoding, biodiversity
Citation: Staehr PAU, Dahl K, Buur H, Göke C, Sapkota R, Winding A, Panova M, Obst M and Sundberg P (2022) Environmental DNA Monitoring of Biodiversity Hotspots in Danish Marine Waters. Front. Mar. Sci. 8:800474. doi: 10.3389/fmars.2021.800474
Received: 23 October 2021; Accepted: 10 December 2021;
Published: 13 January 2022.
Edited by:
Katerina Vasileiadou, Hellenic Centre for Marine Research (HCMR), GreeceReviewed by:
Yuan Liu, Milford Laboratory, Northeast Fisheries Science Center, National Oceanic and Atmospheric Administration (NOAA), United StatesTania Valdivia, Center for Scientific Research and Higher Education at Ensenada (CICESE), Mexico
Mark Stoeckle, The Rockefeller University, United States
Copyright © 2022 Staehr, Dahl, Buur, Göke, Sapkota, Winding, Panova, Obst and Sundberg. This is an open-access article distributed under the terms of the Creative Commons Attribution License (CC BY). The use, distribution or reproduction in other forums is permitted, provided the original author(s) and the copyright owner(s) are credited and that the original publication in this journal is cited, in accordance with accepted academic practice. No use, distribution or reproduction is permitted which does not comply with these terms.
*Correspondence: Peter A. U. Staehr, cHN0QGVjb3MuYXUuZGs=