 Manuel J. Zetina-Rejón1*
 Gladis A. López-Ibarra1
 Lorena Rocha-Tejeda2
 Alesa Flores-Guzmán2
 Inés López-Ercilla2Ellmi Rodríguez-Rodríguez3Sergio Antonio Sandoval-Jiménez3
 Francisco Arreguín-Sánchez1
 Andrés M. Cisneros-Montemayor4
- 1Instituto Politécnico Nacional, Centro Interdisciplinario de Ciencias Marinas, La Paz, Mexico
- 2Comunidad y Biodiversidad, A.C., Guaymas, Mexico
- 3Sociedad Cooperativa de Producción Pesquera 79 Ensenada S.C.L., Ensenada, Mexico
- 4School of Resource and Environmental Management, Simon Fraser University, Burnaby, BC, Canada
The constant demand for seafood products and the undeniable effects of fishing on marine ecosystems make it urgent to implement an ecosystem approach, even in data-poor scenarios such as small-scale fisheries. Understanding the impacts of fishing is essential for promoting management strategies that prevent irreversible damage to marine ecosystems. Thus, ecosystem quantitative science-based models have been frequently used to evaluate the effects of fishing, although fishers’ local ecological knowledge (LEK) can aid the implementation of qualitative models, particularly in data-poor conditions. Here, we present a framework for simulating and assessing the effects of fishing following two strategies: (1) for both types of models, we simulated species removal scenarios, and (2) for quantitative science-based models, we fitted time series to dynamically assessed impacts. The impacts were analyzed through ecological indicators commonly used for quantitative models, and because these indicators cannot be easily estimated for qualitative models, we propose the use of topological indicators in both types of models. The approach was applied to three case studies of small-scale finfish fisheries in northwestern Mexico. We found that the ecosystem response to species removal was different in each case study and that the target species can play an important role in ecosystems, but their removal does not generate abrupt changes in the ecosystem structure. The quantitative science-based models were able to reproduce the historical catch trends, which allowed us to reveal that changes in ecosystems are indeed influenced by fishing effort but also by underlying primary productivity. Furthermore, topological and ecological indicators showed similar trends in the quantitative models, which suggests that the former could be useful when data-poor conditions allow only qualitative models. This result confirms the relevance of the participation of fishers in generating qualitative models and their decisive role in the discussion of co-management strategies and risk scenarios in a better-informed manner.
Introduction
To cope with the global growing demand for seafood consumption and the concurrent recognition of the impacts of fisheries on marine ecosystems and coastal livelihoods, it is necessary to visualize fisheries using an ecosystem approach (EA). The EA must account for direct and indirect impacts on both the target species and the wider ecosystem (FAO, 2003, 2020). The EA is currently a core element in most nations’ fisheries policy and in guidelines from non-governmental actors regarding marine conservation and fisheries management. This approach is mandated even in data-poor fisheries scenarios, which tend to be the case for small-scale fisheries. For this reason, it is necessary to seek alternatives to implement adaptive and precautionary co-management (Johannes, 1998; Johnson et al., 2017). In this context, the assessment of fishing impacts, the strategies to avoid serious damage to the ecosystem, and the quality of information are elements that allow government agencies to adopt an EA to achieve sustainability and increase benefits in coastal communities.
Some fisheries have begun to make efforts in research and information generation together with stakeholders, which favor the co-management of their fisheries and cooperative research (Kaplan and McCay, 2004). Currently, there are international sustainability standards that integrate these elements through an EA to improve resource management. One of them is the Marine Stewardship Council (MSC) standard, which evaluates three principles: (1) health of the target population; (2) mitigation of environmental effects, impacts of fishing gear, and impacts of extraction on the ecosystem; and (3) effective management and improvement of the governance system (Fernández-Rivera Melo et al., 2018; Arton et al., 2020). Derived from this standard, there is a scheme based on these three principles that seeks to address environmental challenges and thus encourages positive changes that last over time and change public policies. This scheme, which involves collaboration between multisectoral stakeholders and is named the Fishery Improvement Project (FIP) (Zelasney et al., 2020), has been applied for more than 20 years and has enabled users to participate in citizen science and to publicize management improvements and impacts on fisheries.
Due to the nature and dimensions of marine ecosystems, modeling is one of the most frequently used tools for ecosystem-based fisheries management (Plagányi, 2007; Collie et al., 2016; Townsend et al., 2019). This tool makes it possible to evaluate the direct and indirect impacts generated in the ecosystem by the extraction of biomass from target species. Despite this situation, which suggests that ecosystem modeling would be helpful, most of its applications worldwide have been for strategic (long-term decisions) rather than tactical (short-term decisions) management advice (Heymans et al., 2016; Skern-Mauritzen et al., 2016). On the other hand, because fisheries are commonly related to negative impacts on marine ecosystems, particularly on the target and incidental species, effects may not necessarily occur at the whole level of an ecosystem’s food web. For this reason, it is relevant to use modeling tools to analyze the vulnerability of ecosystems to biodiversity loss as a consequence of human impacts (Dunne et al., 2002; Allesina et al., 2009; Marina et al., 2018), such as fishing (Ávila-Thieme et al., 2021). However, although the effects of fishing can modify the structure and function of the ecosystem, changes in the productivity of the system due to other factors can produce similar effects, and moreover, the interaction of different factors jointly affects ecosystems (Ávila-Thieme et al., 2021).
Nevertheless, the implementation of the EA remains a challenge for fisheries scientists and for artisanal fishing communities—particularly those involved in multispecies fisheries—that seek to comply with EA guidelines due to their limited capacity to collect data for traditional assessment models or the fact that these data are not made available by fisheries management bodies. Efforts have been made in this direction, including the development of models that are very robust given limited data and can still provide helpful management advice (Dowling et al., 2015; Carruthers and Hordyk, 2018). Additionally, it has been recognized that the incorporation of local ecological knowledge (LEK) can help fill the scientific gaps in the implementation of an EA (St. Martin et al., 2007; Bélisle et al., 2018; Berkström et al., 2019; Kaiser et al., 2019). Recently, Cisneros-Montemayor et al. (2020) proposed a framework for assessing the ecosystem effects of fishing that is applicable to data-poor artisanal fisheries. This framework proposes that quantitative science-based models and qualitative LEK-based models could be useful for assessing the ecosystem effects of fishing. In this regard, the framework shows how to use quantitative models to assess the effects of fishing on the ecosystem and how to use LEK to build qualitative models. However, the latter type of model has not been used to assess the magnitude of fishing impacts. Therefore, we further extended the framework to use both types of models for simulating and assessing the ecosystem effects of fishing in situations in which a quantitative model is available as well as in situations in which fishers’ LEK is integrated into a qualitative model. This study attempted to evaluate the ecosystem effects as a result of a multispecies finfish fishery in three regions: El Rosario, BC; Isla Natividad, BCS; and Guaymas, Sonora (Figure 1). For this purpose, trophic models that represent the main interactions between species in the ecosystem were used, and the changes in the ecosystem’s food web as a consequence of biomass removal were evaluated.
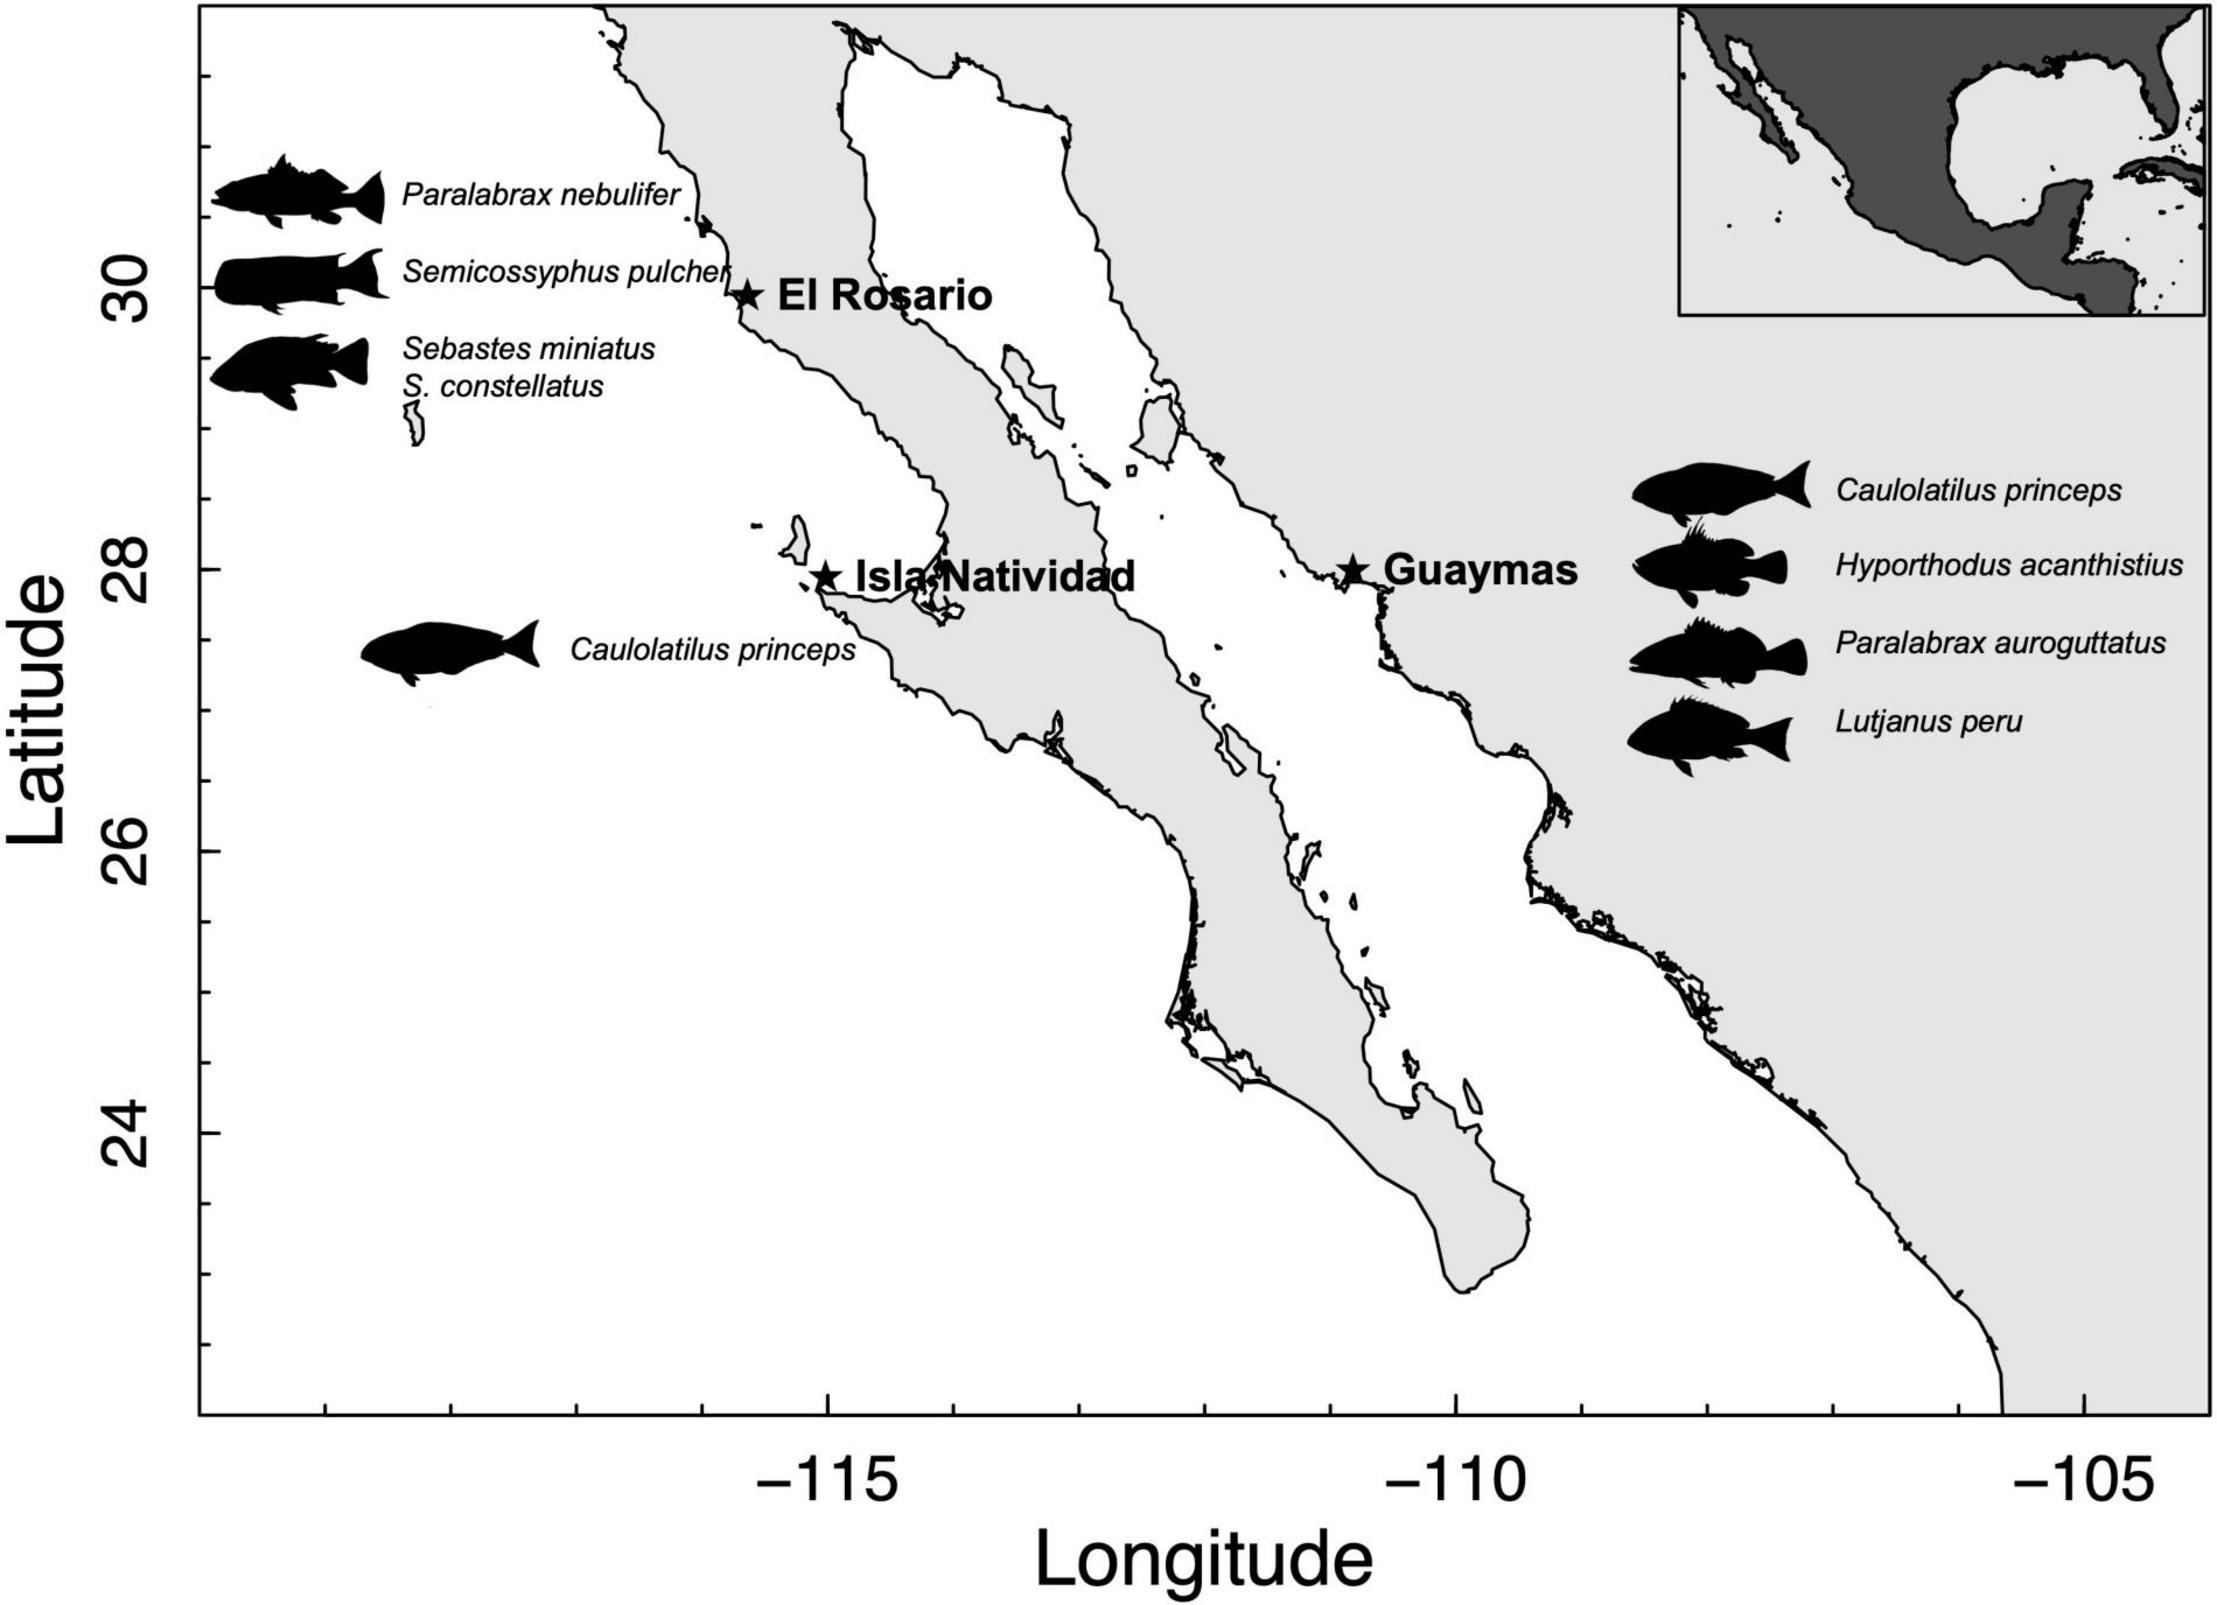
Figure 1. Case studies for evaluating ecosystem impacts from artisanal fisheries showing the target species in each area.
Materials and Methods
Strategy Approach
We extended the framework proposed by Cisneros-Montemayor et al. (2020) for data-poor small-scale fisheries to situations in which qualitative or quantitative ecosystem modeling is available. Our purpose was to demonstrate how the science-based (quantitative) and LEK-based (qualitative) models suggested by Cisneros-Montemayor et al. (2020) can be used to produce results that can guide strategic management decisions. Here, we consider temporal changes in the ecosystem as a consequence of fishing and environmental drivers that are applicable to quantitative modeling approaches. This study seeks to identify the potential ecosystem impacts of small-scale fisheries through dynamic scenarios. We used two different approaches according to data availability: (1) if the data allow only the use of a qualitative model, we performed species removal simulations to evaluate potential ecosystem impacts; (2) if the available data allow the use of a quantitative model, in addition to species removal simulations, we also calibrated the model using historical data to evaluate the dynamic historical ecosystem impacts. See Supplementary Figure 1 for the proposed extended framework.
Based on the abovementioned information, our approach can be applied to data-poor artisanal fisheries using qualitative LEK-based models or quantitative science-based models. In the first case, it is possible to evaluate ecosystem impacts due to the potential removal of target species, and in the second case, it is possible to include the effects of environmental and fishing effects. In addition, species removal simulations can be applied to quantitative models to perform a comparison of the results.
Case Studies
The framework was applied to three small-scale finfish fisheries, all of them under an FIP scheme. These fisheries are located in the western Mexican Pacific Ocean and the Gulf of California: El Rosario (Baja California), Isla Natividad (Baja California Sur), and Guaymas (Sonora) (Figure 1). For the purpose of this study, we primarily focused on the main finfish target species in each locality (Table 1).
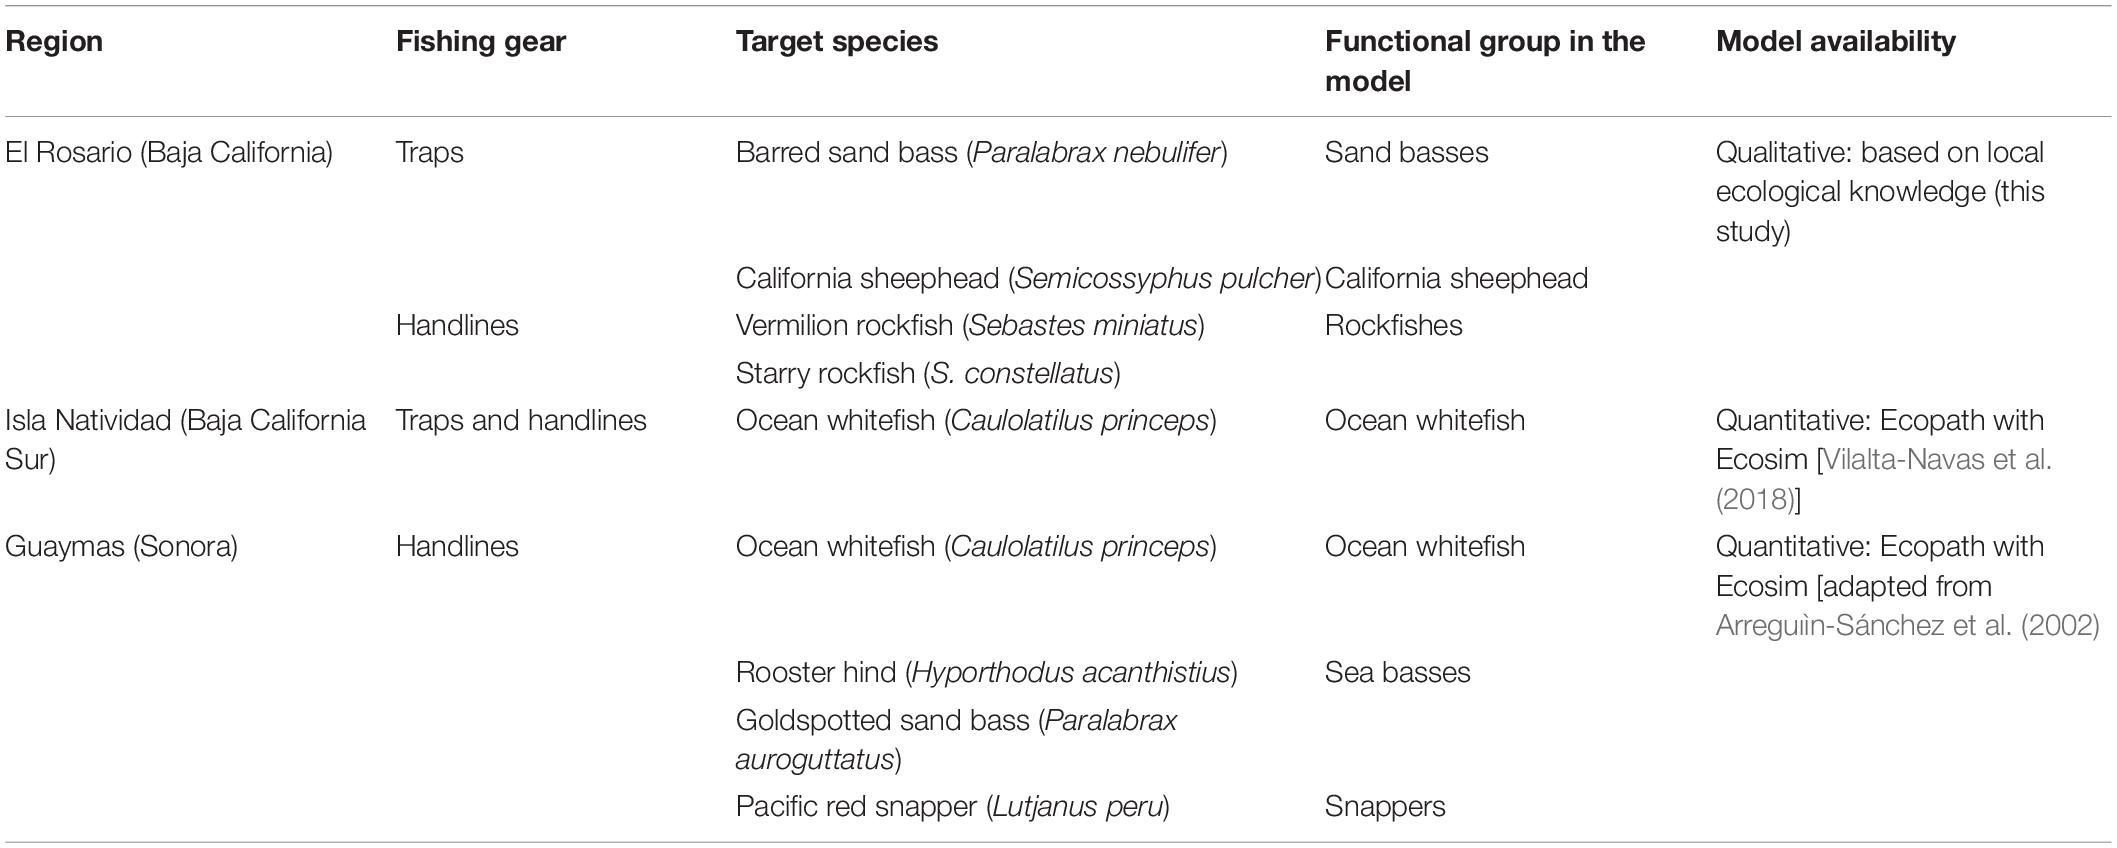
Table 1. Regions and finfish target resources used in the ecosystem impact analysis.
All of the tested fisheries are organized in fishing cooperatives that hold fishing permits for finfish and other marine resources. The fisheries usually alternate the main target species and therefore the fishing gear throughout the year depending on species abundances, climatic factors, market demand, and closed seasons. The fishing fleet comprises fiberglass small vessels (7–10 m length) operated by 2–3 fishers, which are locally known as pangas, with an outboard motor.
None of the main finfish target species in the three localities has a specific fishery management plan, and all the species are included within a finfish group composed of 271 finfish species distributed in the Mexican Pacific (Diario Oficial de la Federación, 2010). This group also lacks a fishery management plan and specific objectives. The applied regulations pertain to allowable fishing gear and fishing effort control regulated by a number of commercial fishing permits.
Qualitative Modeling
In El Rosario, because no ecosystem model was available, we used the qualitative modeling approach based on LEK, which has been proven to be useful in EAF studies (Espinosa-Romero et al., 2014; Bentley et al., 2019a; Sánchez-Jiménez et al., 2019; Cisneros-Montemayor et al., 2020). Due to the COVID-19 pandemic situation, a team of four people previously trained in the application of the survey and in data capture methods conducted phone surveys based on a systematic questionnaire applied to fishers to identify the main trophic relationships in an ecosystem. A total of 23 surveys were conducted from November to December 2020 with local fishers (18 men and five women) with an average of 14 years of fishery experience. The surveyed population included fishers that exploit several species (e.g., seaweeds, sea cucumbers, lobsters, abalone, sea urchins, finfishes, and sharks) and use several types of fishing gear (e.g., handlines, gillnets, traps, diving, and longlines), which allowed us to obtain a wide perspective on the different ecosystem habitats. The questionnaire was divided into two main parts: (1) mapping main biological components (species or groups of them) in the ecosystem and (2) identifying trophic relationships between them. In the first part, fishers named all biological components that they had identified as part of the ecosystem based on their LEK. In the second part, they described prey-predator relationships between each biological component they recognized in the first part of the interview.
We compiled the information collected from the surveys, grouped similar species, translated local names to standard names and compared the consistency of the trophic interactions with scientific knowledge, mainly that in FishBase1 and World of Marine Species2. The data collected from the surveys allowed the initial identification of 104 species, of which 25% corresponded to commercial species. Once the common names and synonyms were revised and the species were aggregated, the list was reduced to 52 functional groups and 264 trophic interactions. The final output from this process was a relational matrix that represented the main species or functional groups (nodes) and their trophic interactions (links) in the food web, which served as the input for building a qualitative (binary) network model (see Supplementary Figure 2a).
Quantitative Modeling
For Guaymas and Isla Natividad, we used previously built Ecopath with Ecosim (EwE) models. In the case of Isla Natividad, the model built by Vilalta-Navas et al. (2018) explicitly included ocean whitefish as a functional group (see Supplementary Figure 2b). In the case of the Guaymas region, we adapted the model built by Arreguıìn-Sánchez et al. (2002) (see Supplementary Figure 2c). The original model included Lutjanidae and Serranidae functional groups that allowed us to represent the Pacific red snapper and sea basses, respectively. However, we added an additional functional group representing the ocean whitefish. The input parameters such as biomass and commercial catches were based on data from the fishery monitoring program implemented by the fishers within the framework of the FIP and commercial statistics. Other input parameters required by the EwE models, such as diet and production/biomass and consumption/biomass ratios, were obtained from Vilalta-Navas et al. (2018).
We selected these models because they represent the zones for the case studies and because they met the thermodynamic principles recommended for EwE models (Heymans et al., 2016). For example, thermodynamically, for each functional group, the outputs (e.g., predation, fishing) cannot be greater than the biological production.
Simulations
We now detail the simulation approach for the qualitative and quantitative models. In the first case, we used the error and attack simulation scenarios proposed by Albert et al. (2000) that can be applied to qualitative or quantitative networks. This approach simulates the subsequent removal of the nodes, one at each step. At each step, the change in the network structure is quantified through network indicators (see below). To simulate random network failures, the order of node removal is random. In contrast, to represent attacks on the network, i.e., the impacts directly exerted on some node, the order of removal is decided based on a criterion, such as removing nodes according to their connectivity in decreasing order or relevance to the network. Here, we use the betweenness index (BCi) of each functional group as a criterion to determine the order of removal. This index, which measures the positional importance based on how frequently a functional group i is located on the trophic pathways between every pair of groups j and k, was estimated as follows:
where gjk is the total number of pathways between groups j and k, and gjki is the number of pathways where group i is present (Freeman, 1979; Wasserman and Faust, 1994). We performed error and attack simulations in the R environment3, and BCi was estimated with the help of igraph R-package version 1.2.6 (Csardi and Nepusz, 2006).
We then compared the changes in the structure of the food web due to random failures and direct impacts and gave particular attention to the nodes that represent the resources exploited by fishing. Topological indicators, which measure network properties based on connectivity, have been shown to be useful in the analysis of network vulnerability and resilience (Albert et al., 2000; Dunne et al., 2002; Moore et al., 2015; Gao et al., 2016; Dey et al., 2019). Although there are numerous topological indicators, our purpose in this study was to show the potential use of LEK-based models to track changes in the food web structure, and we selected the four indicators described in Table 2. The removal of species is expected to result in change in the food web. However, the attack and error scenarios seek to explore whether these changes differ in the face of random or directed impacts. In addition, we explored whether these changes were abrupt, particularly when a target species was removed. Because error and attack approaches can be applied to both qualitative and quantitative models, we applied this strategy to all case studies.
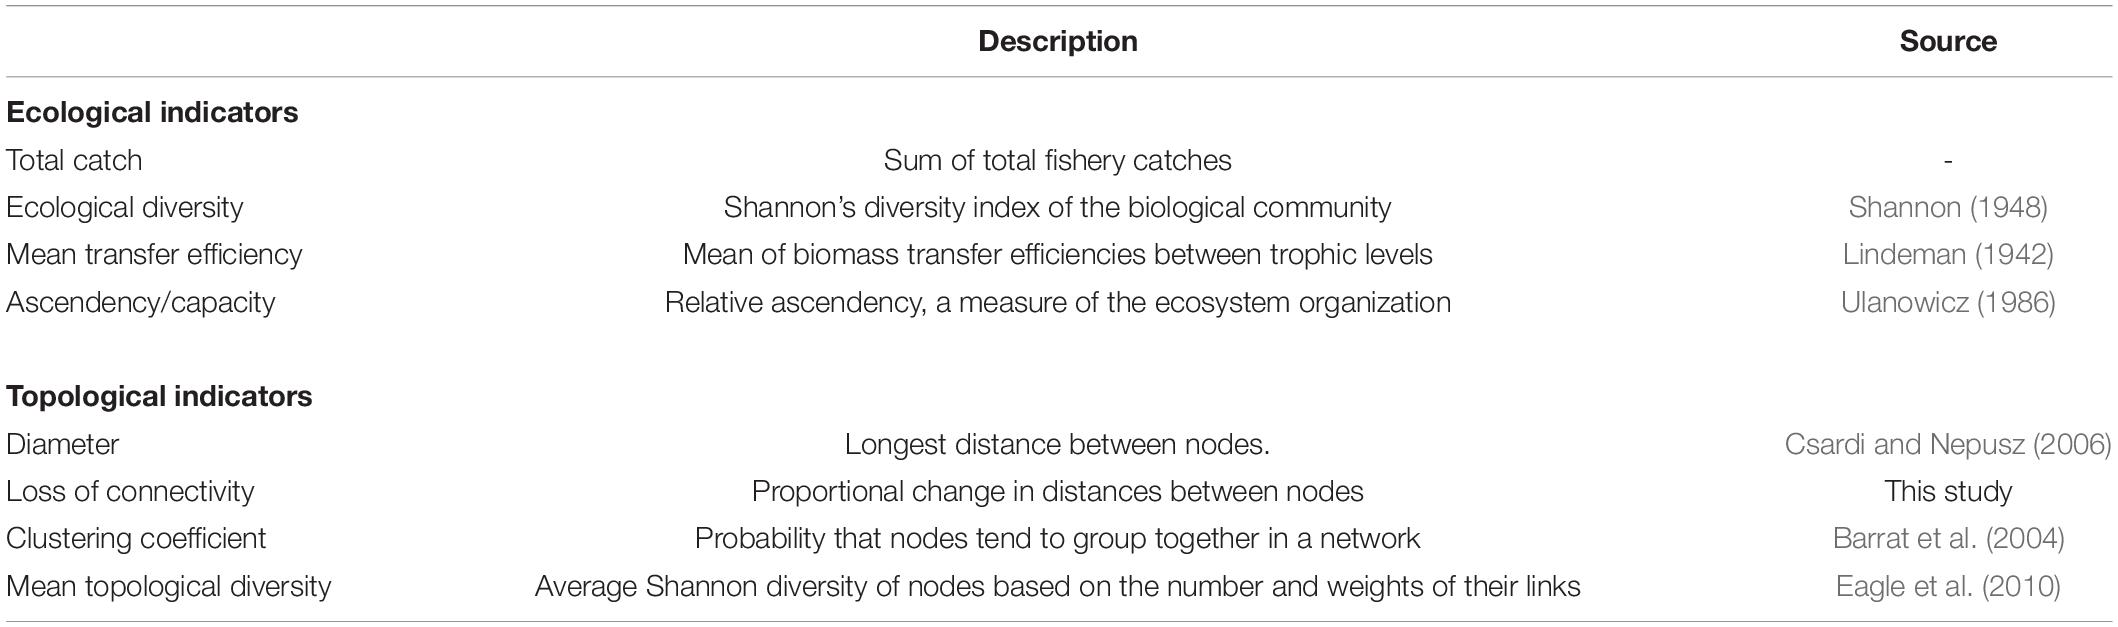
Table 2. Ecological and topological indicators used for analyzing the food web structure and dynamics.
The approach for quantitative models was available for the Guaymas and Isla Natividad finfish fisheries, and for these case studies, we fitted models to recorded historical catches. We used the “fitting to time series” routine included in EwE software (ver. 6.6.54), which dynamically performs model simulations forced by fishing and environmental drivers (Christensen and Walters, 2004). To calibrate the model to both drivers, the routine can optimize parameters that represent trophic interactions between predators and prey with the objective that the model predictions in response to environmental or fishing changes approximate historical data. These parameters, called trophic vulnerabilities, represent the degree to which a change in predator biomass affects prey mortality (Walters et al., 1997) and are based on the foraging arena theory (Ahrens et al., 2012). Here, using an approach similar to that described by Mackinson et al. (2009) and Scott et al. (2016), we evaluated the possible effects of environmental and fishing drivers that could explain historical catch data. In this case, as a fishing driver applied to target species, we used the number of fishing days obtained from regional offices where captures were reported. Additionally, as an environmental driver, we used phytoplankton satellite-derived chlorophyll-a anomalies (MODIS from NOAA’s CoastWatch program) because changes in primary productivity are mostly influenced by oceanographic conditions. These changes in primary productivity propagate through the food web and thereby indirectly affect species abundance, including that of the target species. During the fitting process, the sum of squared differences (SS) was used to measure the goodness-of-fit to the historical catch. To analyze the influence of environmental and fishery drivers, we separately measured the SS for both chlorophyll anomalies and fishing effort once the trophic vulnerabilities were optimized. Details of this procedure were described by Christensen and Walters (2004), Mackinson et al. (2009), and Scott et al. (2016). The purpose of the fitting procedure is to calibrate the model such that it is able to reproduce historical fishing patterns. After the model was calibrated, we evaluated possible structural and functional ecosystem changes as a consequence of fishing and changes in environmental conditions. Here, we analyzed trends in the four ecological indicators proposed by Cisneros-Montemayor et al. (2020) and the four selected topological indicators described in Table 2. All ecological indicators were obtained from EwE software, and for the estimation of topological indicators, we used a plugin developed for EwE software that allows us to save Ecosim consumption matrices during time simulations. These matrices were used as the input to build yearly network models for the quantification of topological indicators.
Results
Figure 2 shows the trends of topological indicators obtained from simulations of random failures and directed impacts scenarios (error and attack scenarios). We found differences in the results from the scenarios among the case studies. For some indices, the resulting effect from directed impacts was notoriously different from those expected by random failures, as was observed in the El Rosario and Isla Natividad regions. Conversely, in Guaymas, the effects on the food web indicators produced by random failures and direct impacts did not show many differences, and drastic changes in the clustering coefficient and network diameter were only obtained with a high number of removed nodes (>15). This result suggests that the food web in this area is more tolerant to the loss of functional groups regardless of their role on the food web (see below).
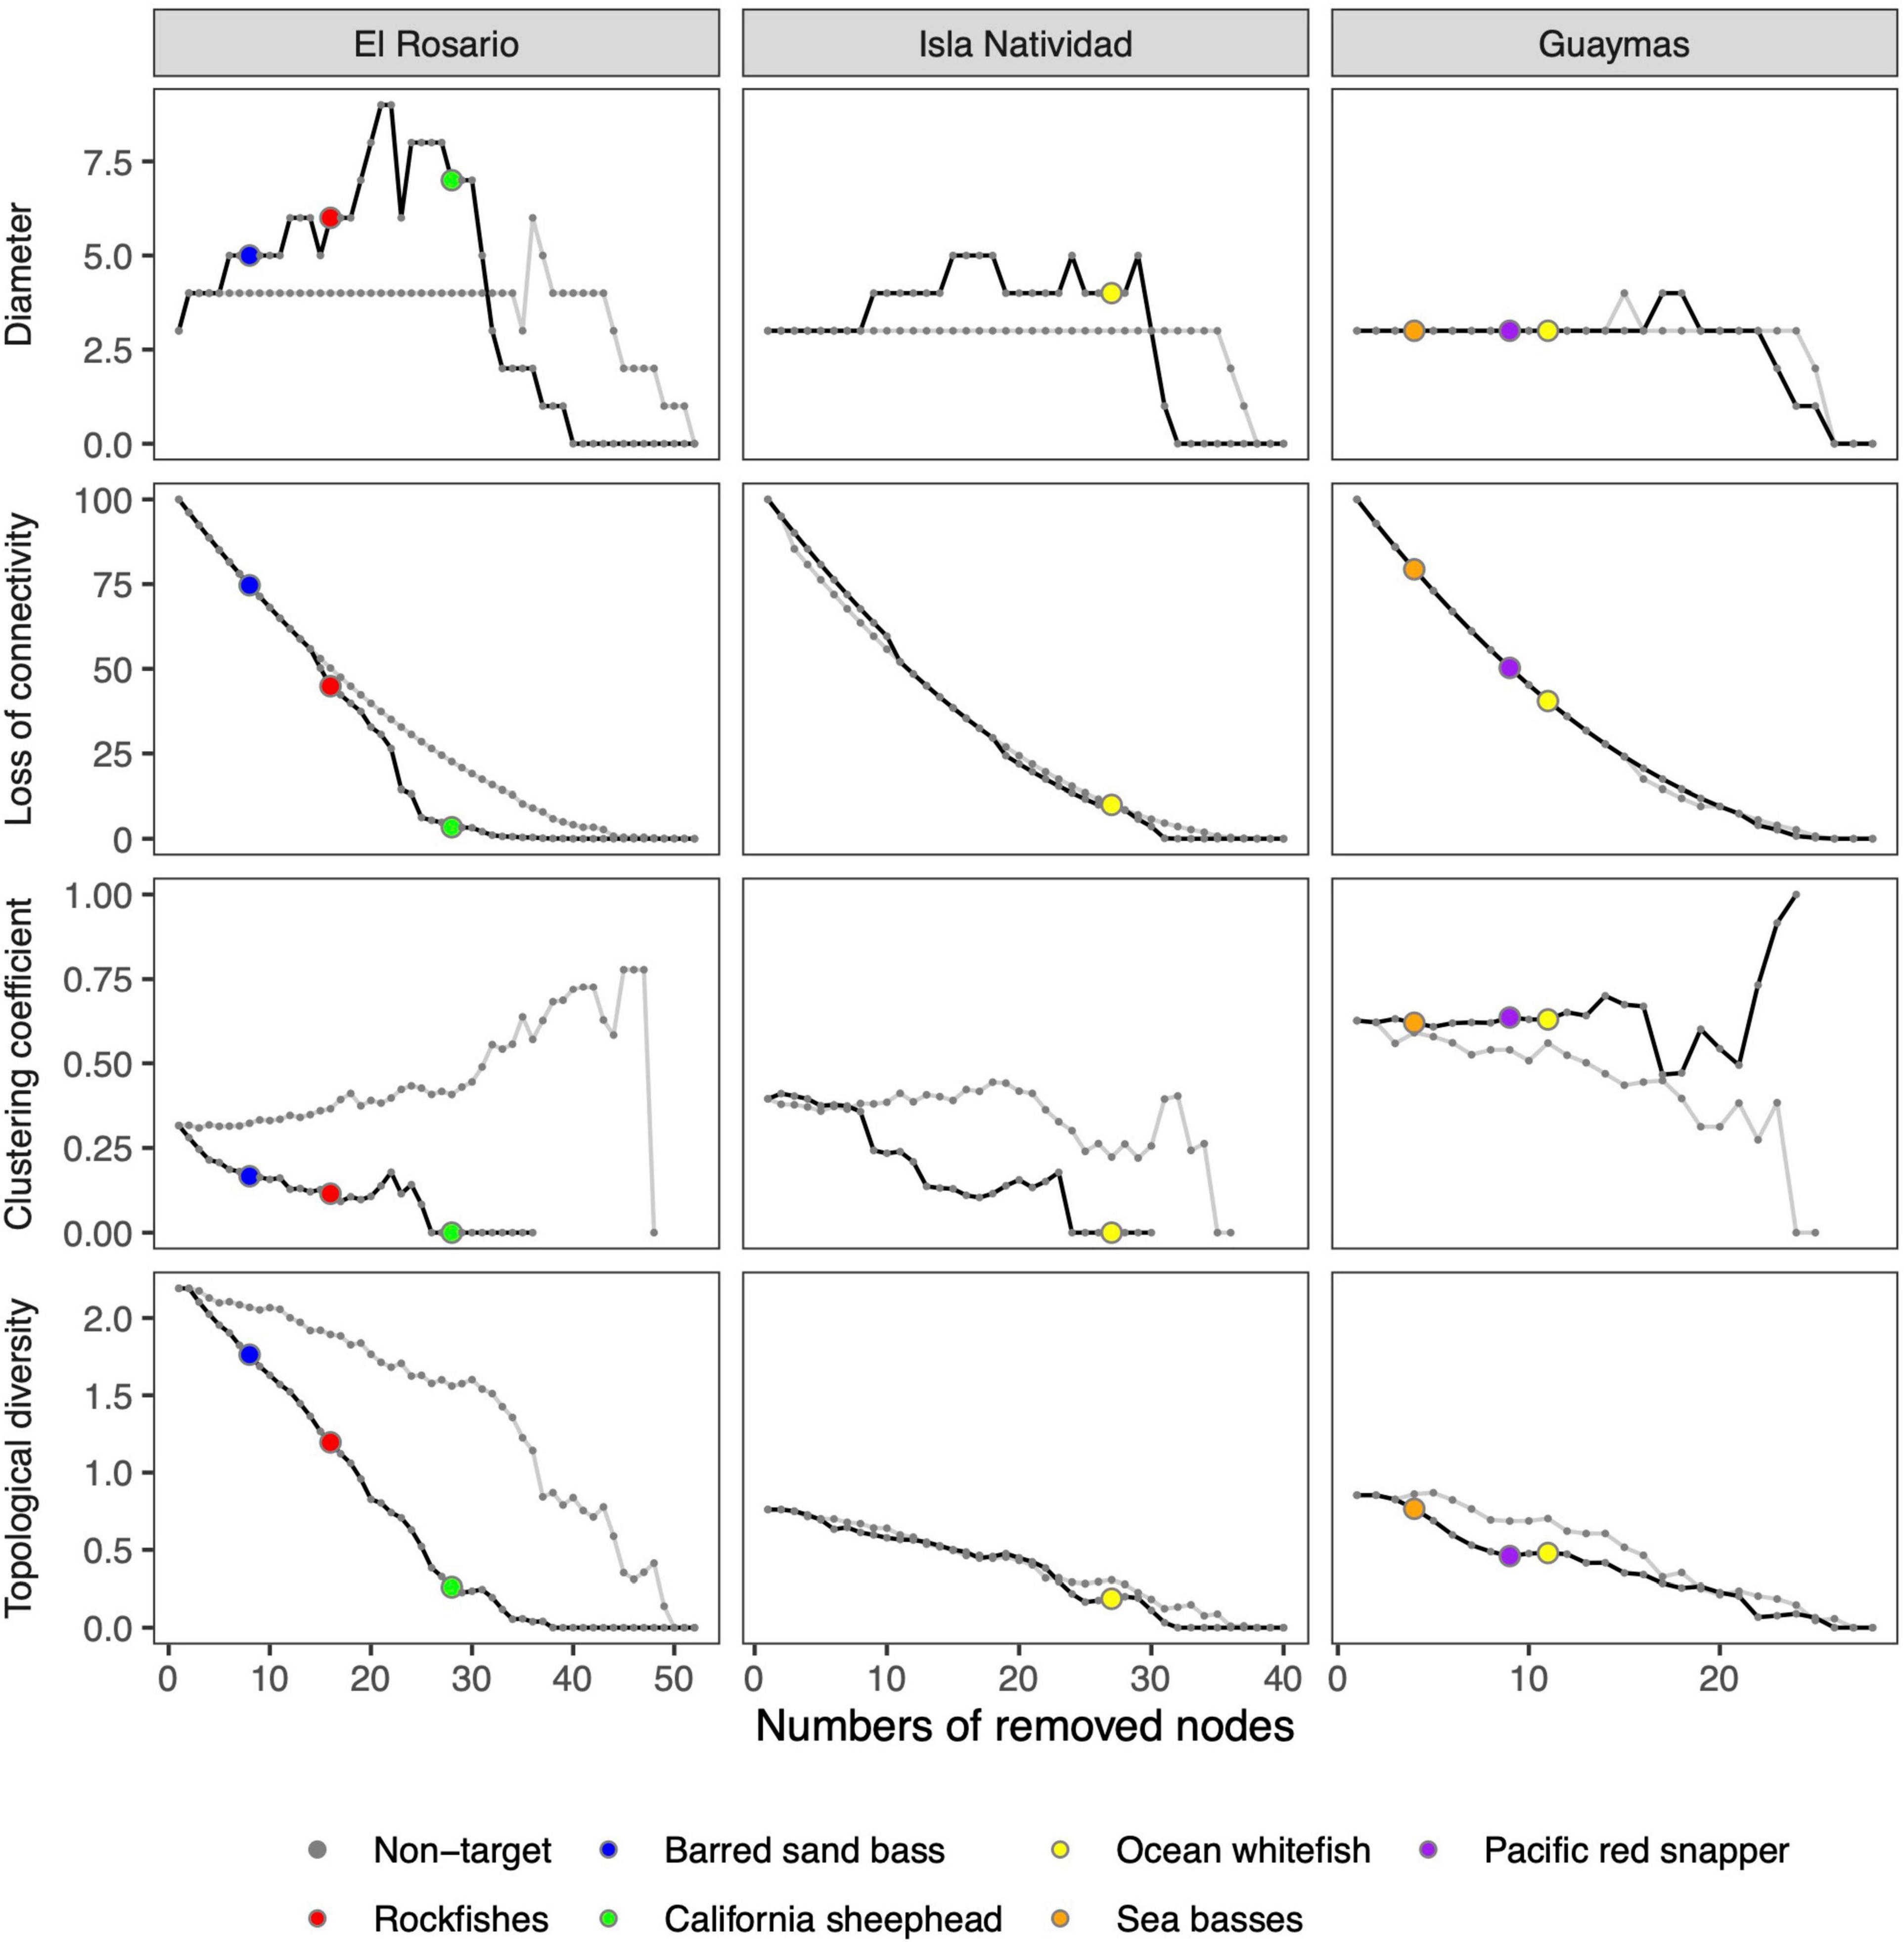
Figure 2. Changes in food web indicators in El Rosario, Isla Natividad, and Guaymas as a consequence of removing nodes (functional groups) based on two scenarios: random failures (gray lines) and directed impacts (black lines). In the directed impacts scenario, non-target species are indicated by gray dots, and target species are indicated by different colors.
For all case studies, a loss in connectivity and topological diversity indicators did not show abrupt changes but exhibited nearly monotonic trends in response to both random failures and direct impacts, which indicated that all food webs analyzed were tolerant to a loss of network connectivity and reductions in the diversity of trophic links. In contrast, the diameter and clustering coefficient showed changes in the food webs of El Rosario and Isla Natividad in addition to the differences between random failures and directed impacts (fishing). Thus, in the directed impacts scenario, decreases in the clustering coefficient and the number of removed nodes were found for both case studies, which indicated that the complexity of trophic interactions was reduced un response to loss of species. In addition, increases in the network diameter were found in both case studies as the functional groups were removed, which indicated that the distance between them was increasing. Both the clustering coefficient and the network diameter remained relatively constant in the random failure scenario and showed changes only when many functional groups were removed (> 30).
In relation to the target species, their removal can cause differential changes in the ecosystem food web in some areas regardless of the values of betweenness centrality. For example, in the El Rosario region, barred sand bass was identified as one of the most important functional groups in terms of its frequency in the trophic pathways and was among the first ten to be removed in the simulation. Similarly, sea basses, Pacific red snapper, and ocean whitefish were among the most important species in the Guaymas region. However, in the latter case, the structure of the food web did not experience abrupt changes, contrary to the results found for El Rosario. In Isla Natividad, ocean whitefish was not among the first species to be removed, which indicated that this species does not have a high betweenness value and thus that fishing effects do not appear to drastically modify the food web structure as a consequence of exploitation of this fish resource.
The goodness-of-fit (SS) estimated during the fitting procedure to the historical catch time series is shown in Table 3. We found that fishing effort produced the lowest SS in comparison to the effect of primary productivity (chlorophyll) in both case studies. However, it was undeniable that both factors influenced the ecosystem dynamics. For this reason, we chose to run simulations with both factors, but we allowed the Ecosim fitting routine to optimize the trophic vulnerabilities, which resulted in lower SS values than those obtained without optimized trophic vulnerabilities. The relative fishing effort and chlorophyll time series used in the fitting procedure appeared to exhibit an inverse pattern in both cases (Figures 3A, 4A). The first half of the time series showed higher primary productivity, which tended to be lower in the second half in both case studies. In contrast, fishing effort was higher in the second half of the time series and lower in the first half. The similar behavior found for primary productivity can be explained by the geographical proximity of both case studies. The resulting fitting of the simulated data to historical data was relatively good, and the model was able to reproduce the main trends in fishing catches for ocean whitefish in Isla Natividad (Figure 3B) and Guaymas (Figure 4B) and for Pacific red snapper (Figure 4D) in the latter case study. However, the fit obtained for sea basses was not as good, even though the model was able to capture the main trends (Figure 4C).
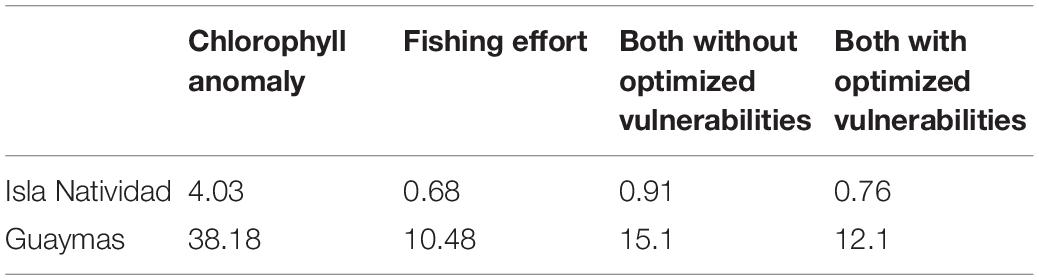
Table 3. Sum of squares (SS) estimated for environmental and fishing drivers during the fitting of the quantitative models of Isla Natividad and Guaymas.
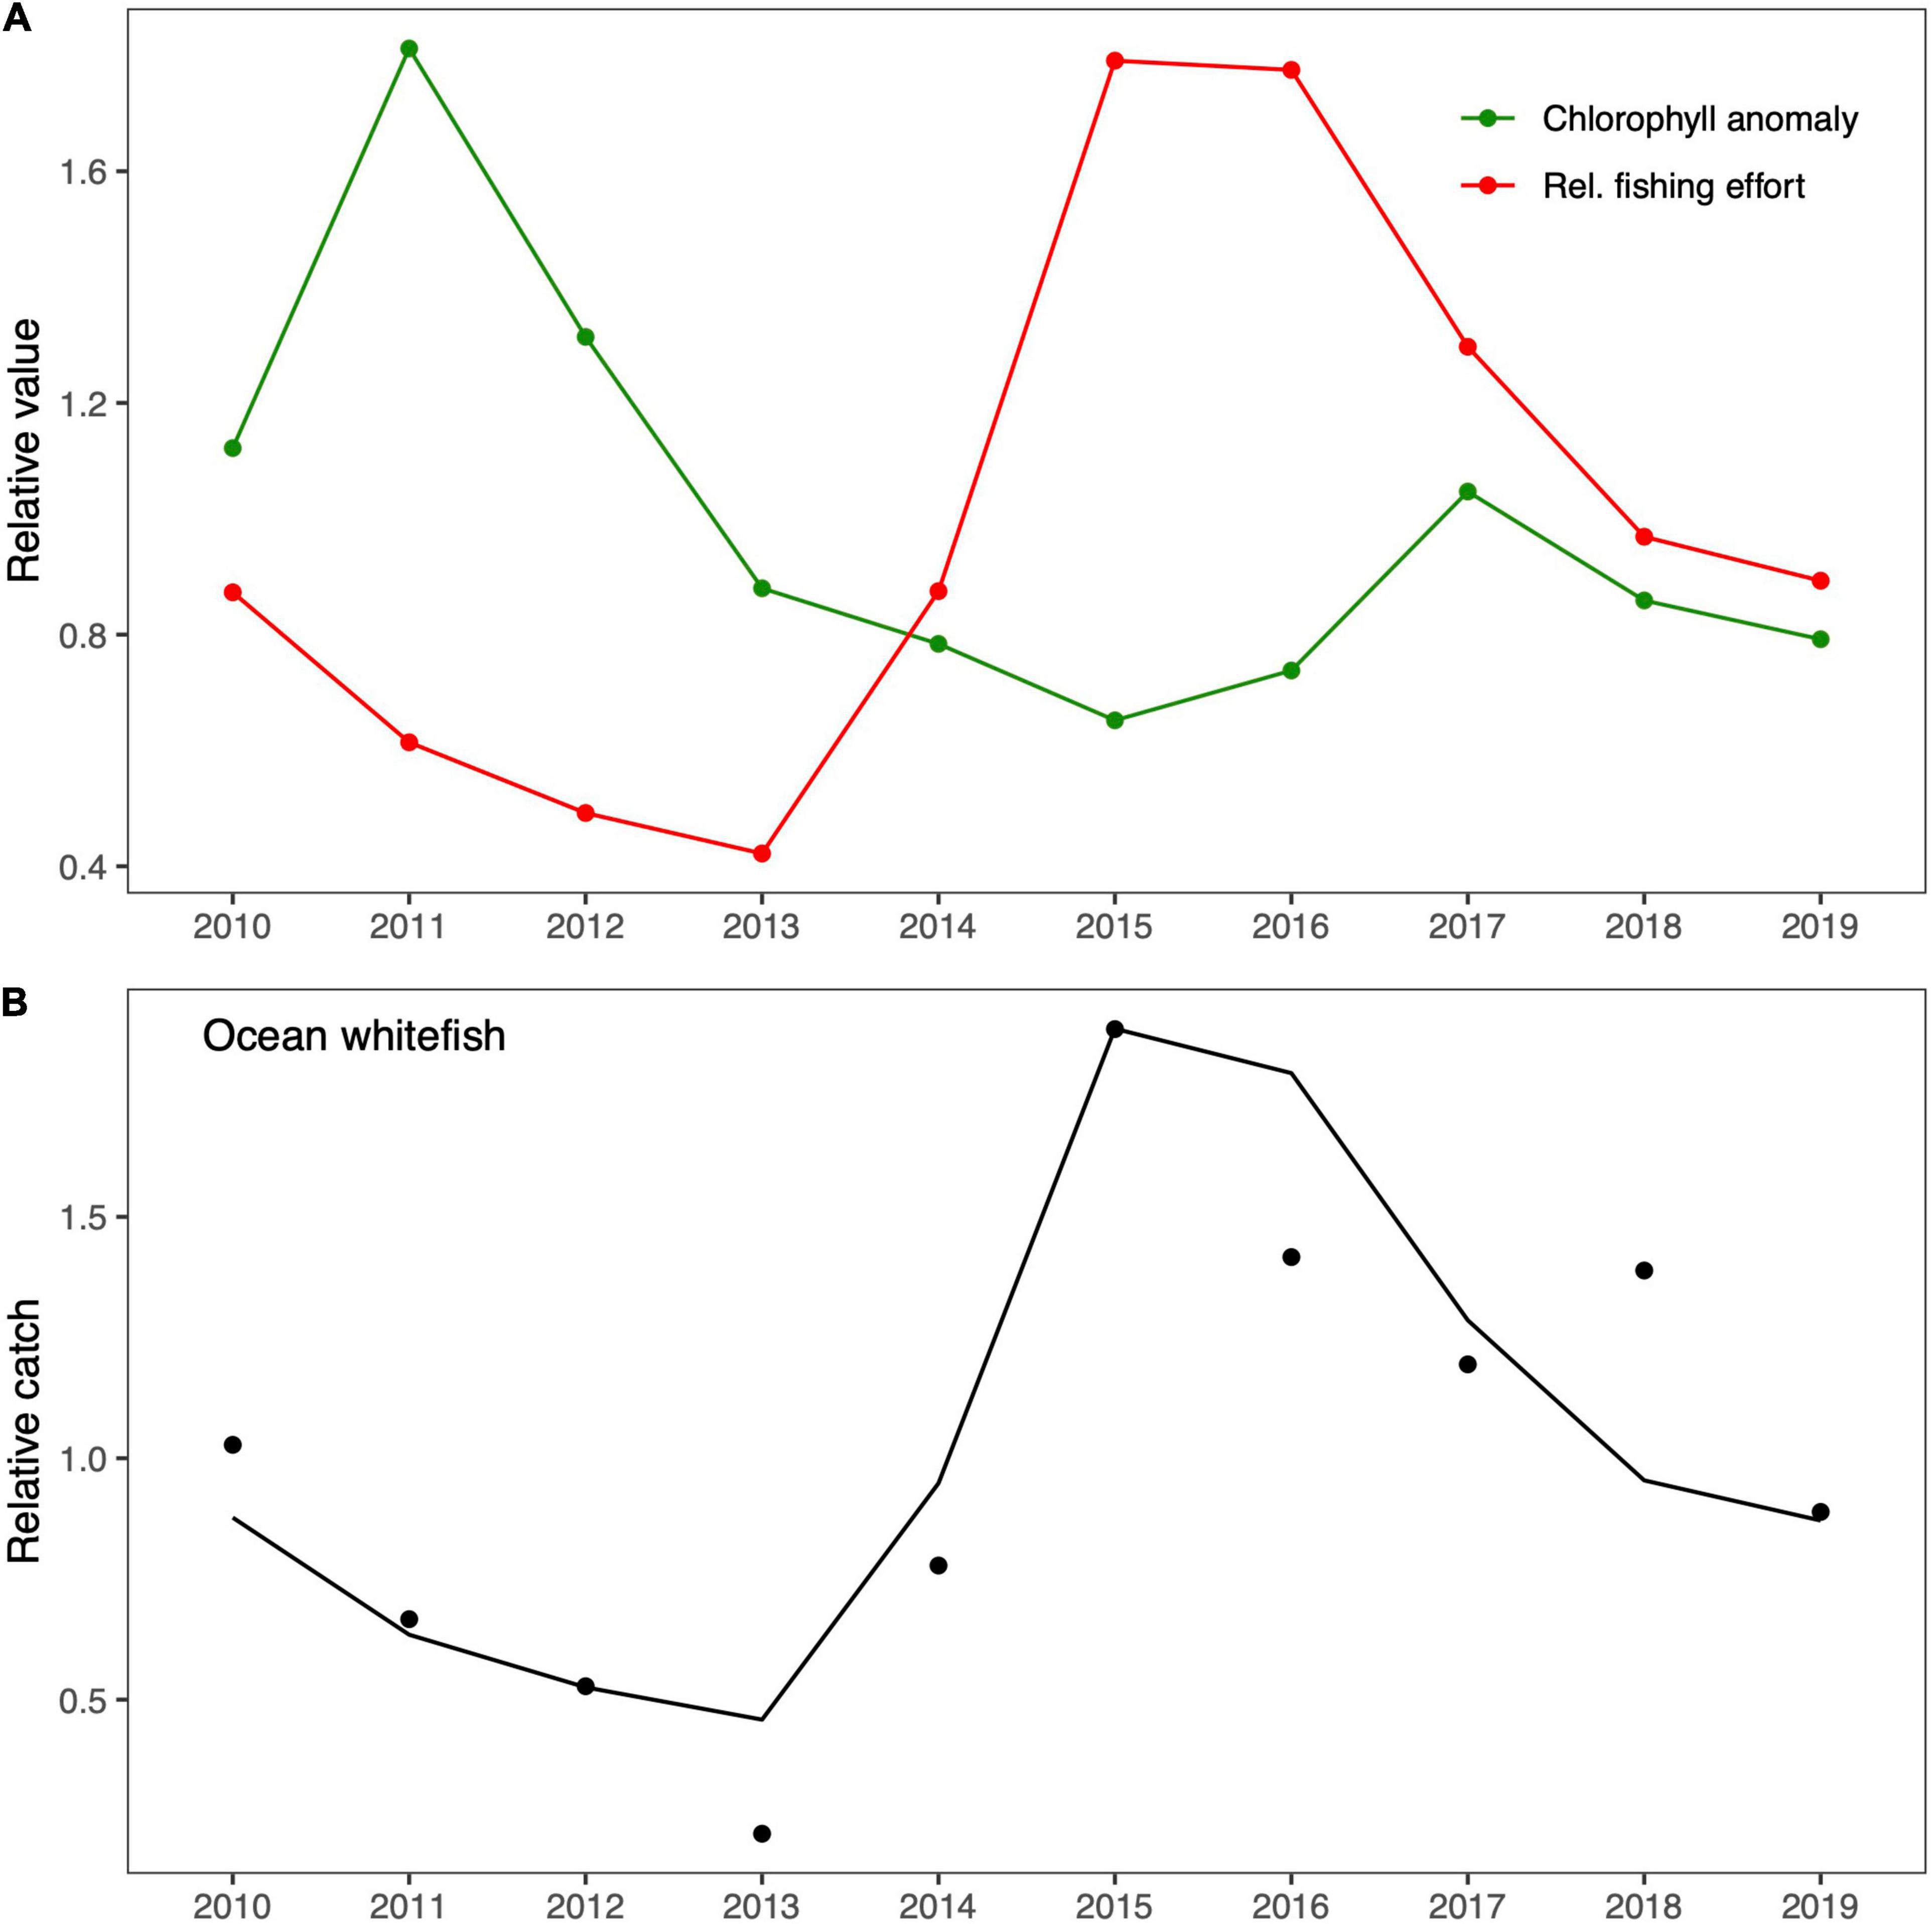
Figure 3. Fitting of the Isla Natividad EwE model. (A) The forcing drivers, namely, satellite-derived chlorophyll-a anomaly and the relative fishing effort, are shown in green and red, respectively. (B) The fitted trends of historical and predicted relative catches are shown by black dots and black lines, respectively.
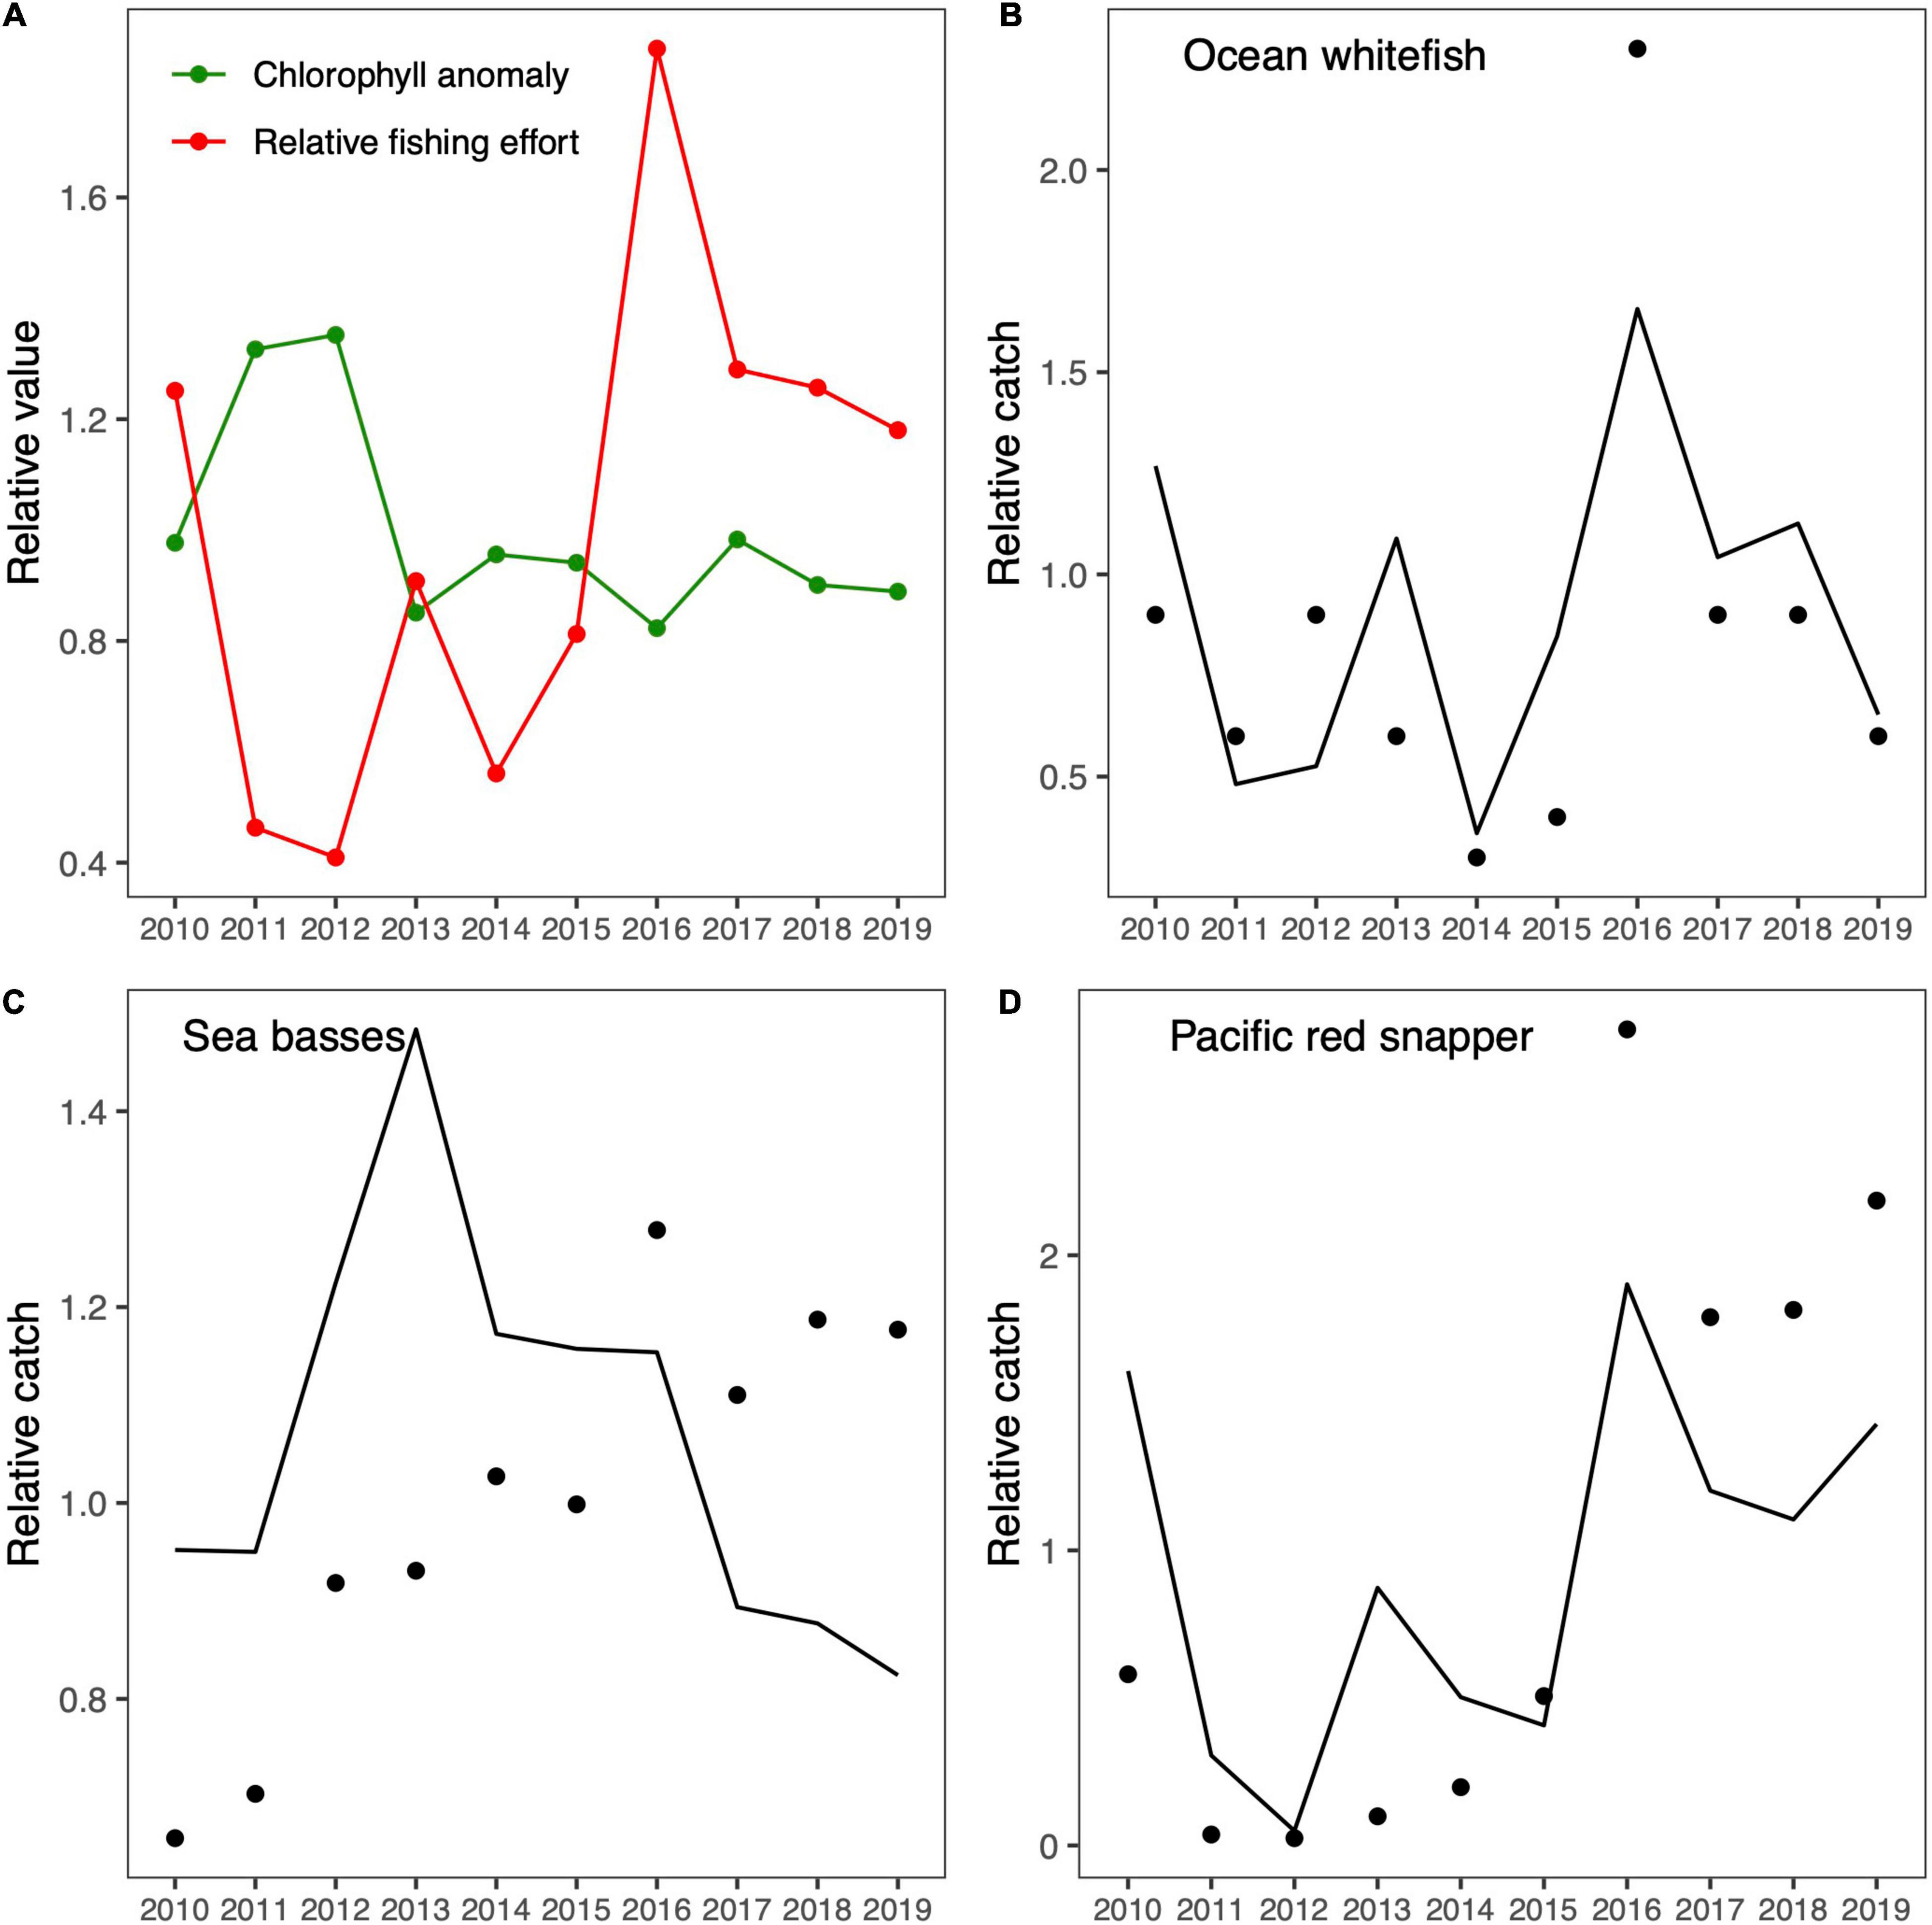
Figure 4. Fitting of the Guaymas EwE model. (A) The forcing drivers, namely, satellite-derived chlorophyll-a anomaly and relative fishing effort, are shown in green and red, respectively. (B–D) The fitted trends of historical and predicted relative catches are shown by black dots and black lines, respectively.
After we calibrated the Isla Natividad and Guaymas models to reproduce the historical observed trends in catches, we evaluated possible historical changes in the ecosystem structure and functioning. The results related to the variability of the ecological and topological indicators are shown in Figure 5. In all cases, the indicators varied as a consequence of the fishing effort exerted and changes in primary productivity. In general, the ecological and topological indicators showed similar trends in both areas. All the highest or lowest values occurred at some point between 2011 and 2013, a period that coincides with the highest chlorophyll values in both areas, with one exception, namely, the total catch in Isla Natividad, which presented the highest values between 2014 and 2015. Moreover, all indicators showed a tendency to decrease in the last 5 years, which contrasted with the fact that catches in the last 5 years increased. The trends found for diameter and loss of connectivity were the opposite of those found for the mean diversity of trophic links and clustering coefficient in both areas.
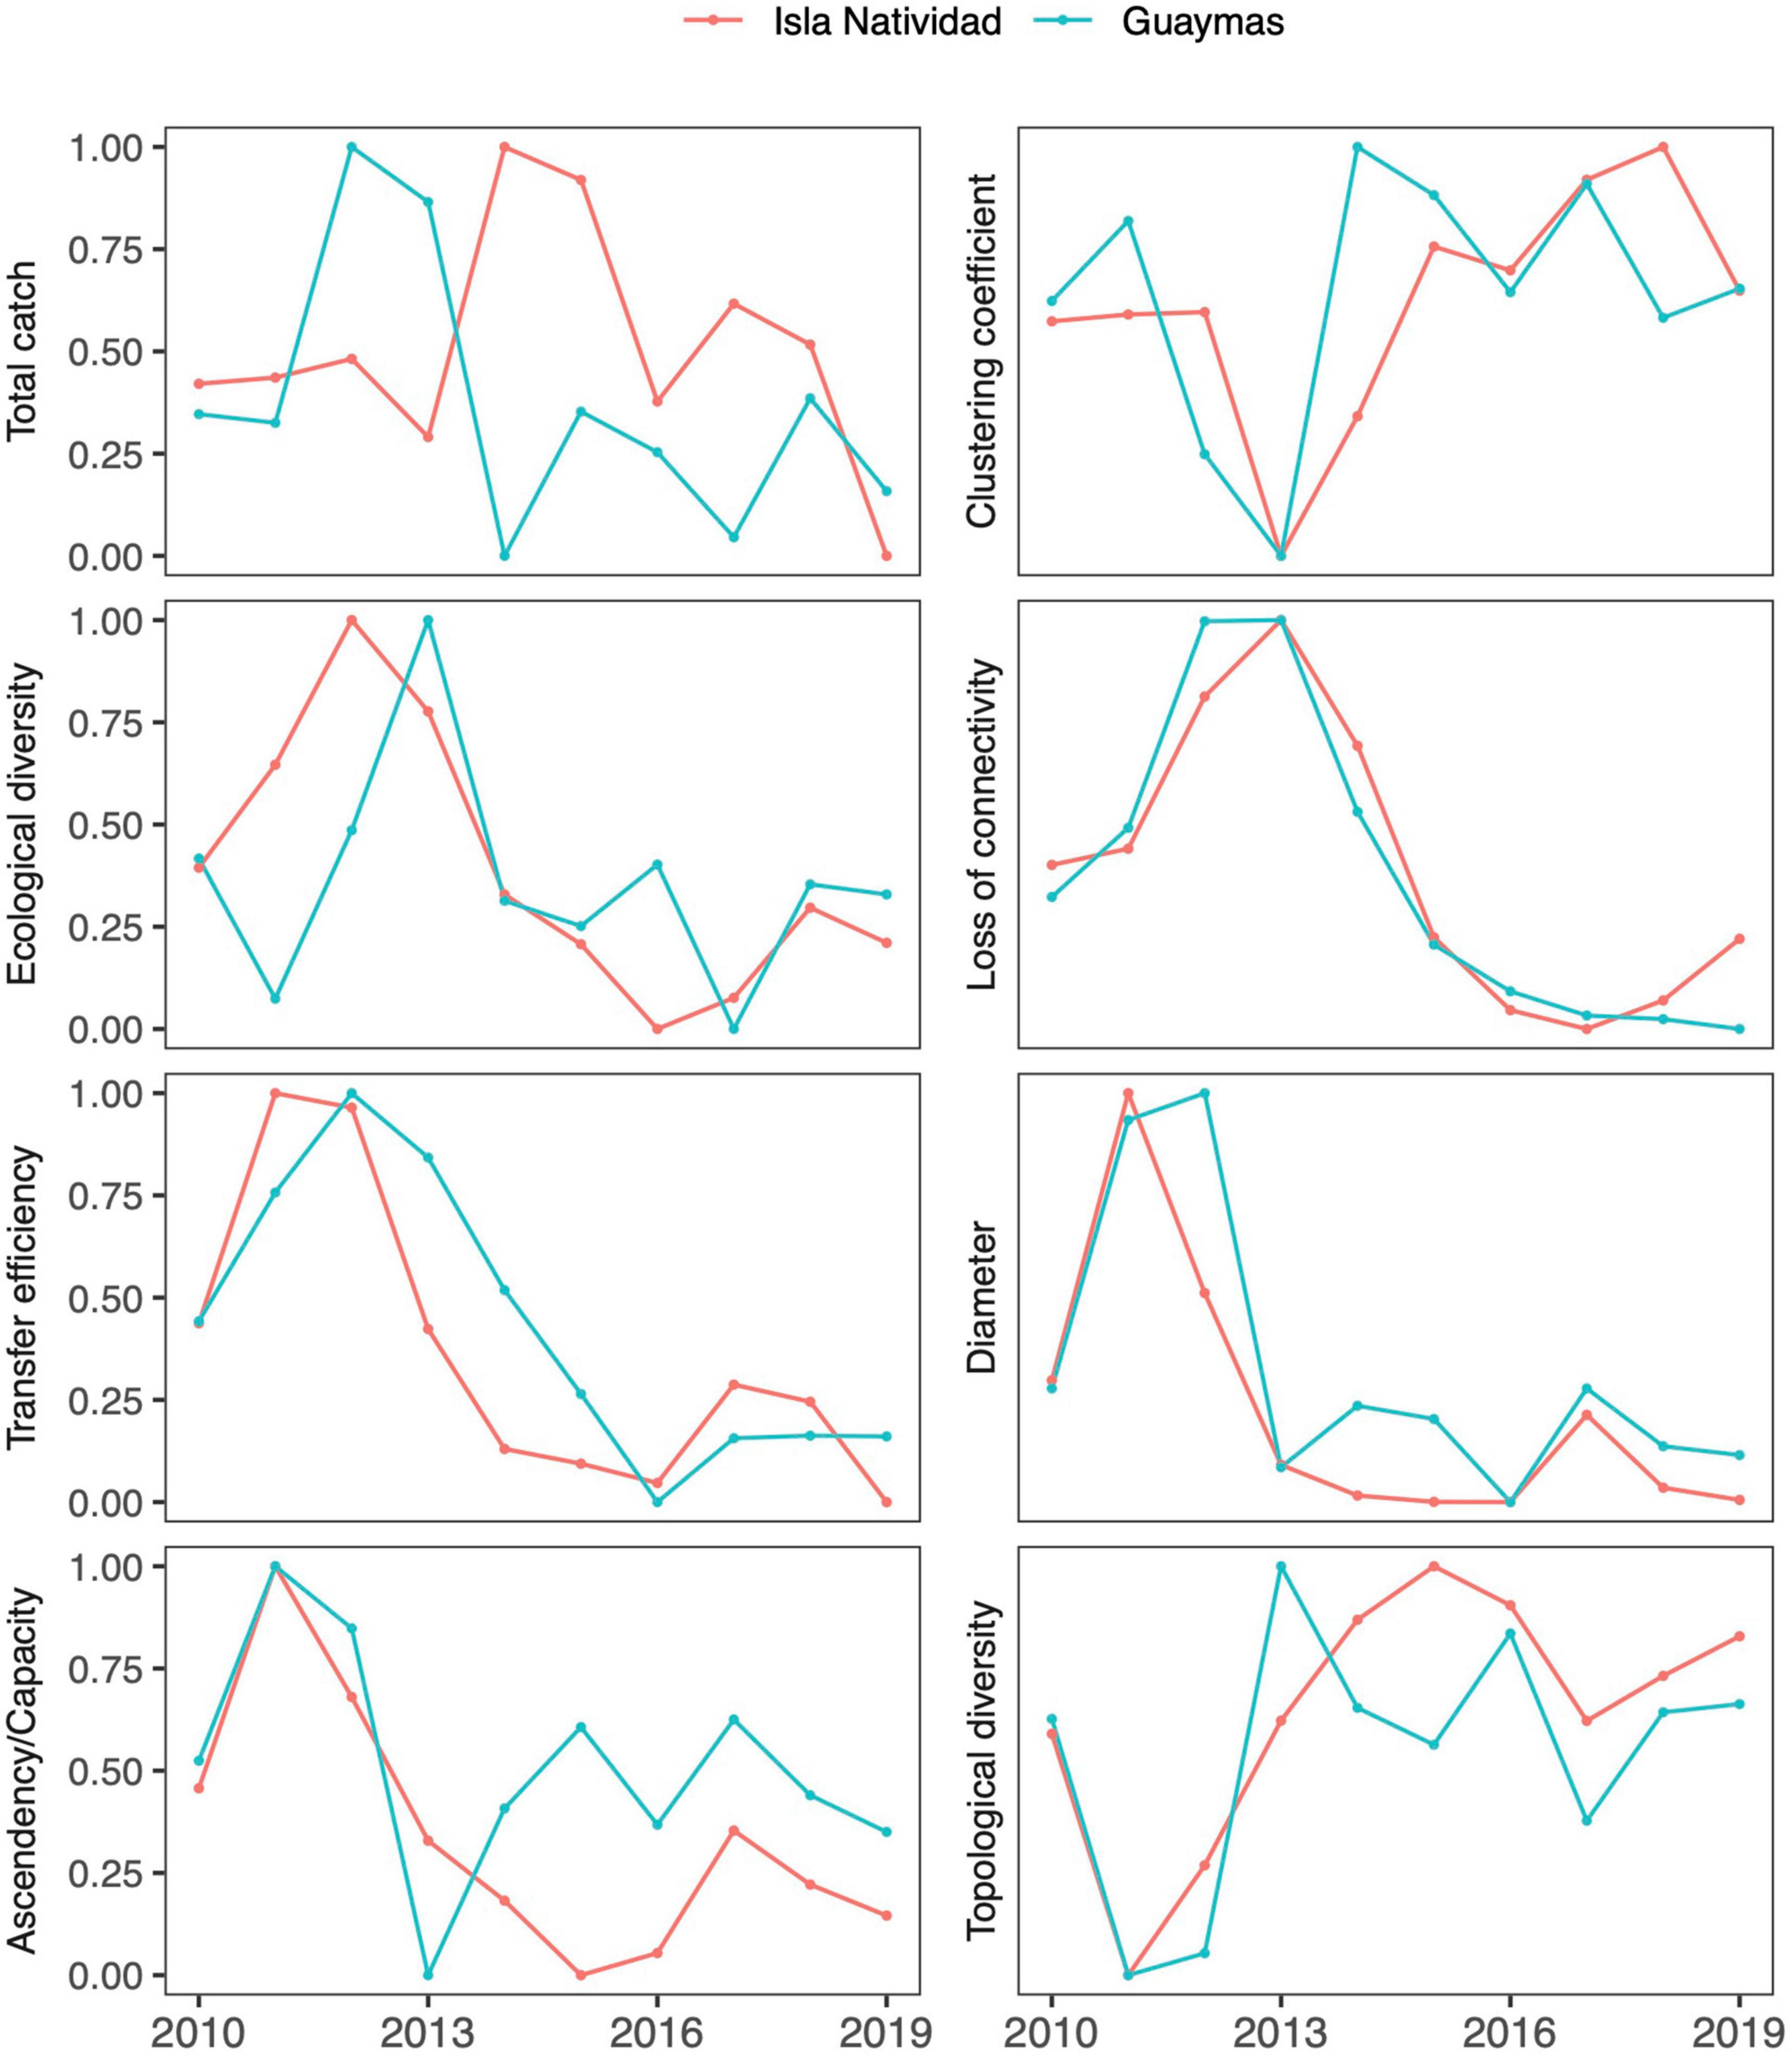
Figure 5. Estimated trends in ecological (left panels) and topological (right panels) indicators resulting after calibrating the Isla Natividad and Guaymas models. All indices were scaled from 0 to 1 for comparison purposes.
Discussion
In this study, we showed that potential ecosystem impacts could be assessed using dynamic simulation scenarios. The proposed framework could be applied to data-poor small-scale fisheries. In some cases, it is possible to use science-based quantitative models widely accepted by the scientific community, and in others, it is possible to use LEK from fishers to build qualitative models. These models can help explore fishing impacts and thus avoid serious damage to the composition and function of an ecosystem. This information can be used to develop strategic management plans that limit harvesting and focus on minimizing ecological impacts. This approach has allowed researchers to address the challenges of data-poor fisheries with the inclusion of LEK to generate comprehensive models. Even so, it is necessary to implement actions to ensure the availability of updated and quality data that will allow tactical decisions to be made regarding the management of small-scale fisheries. However, the involvement of fishers in the generation of LEK-based models could facilitate the co-management of fisheries because it is easier for fishers to adopt strategic management measures, as in the artisanal fisheries cases investigated in this work.
Experimentation through simulation scenarios may differ according to the information and models available. Nevertheless, in both cases, it is possible to devise models to improve the framework for decision-making processes. Our approach in this study was useful to analyze the potential impacts on the ecosystem structure in response to the depletion of a target species based on relatively simple topological indicators. The results indicated that some of the target species, such as barred sand bass and rockfishes in El Rosario and sea basses and Pacific red snapper in Guaymas, may play an important role in the structure of the ecosystem food web, but the effect of their removal depends on the degree of vulnerability and the resilience of the ecosystem. Additionally, the availability of a quantitative model that incorporates environmental and fishing effects made it possible to reproduce historical catch trends, which allowed the demonstration that changes in the structure of the ecosystem may be mainly influenced by primary productivity in the ecosystem.
The modeling approaches proposed here as alternatives show differences in terms of complexity and the level of information demand. On the one hand, EwE is one of the most widely accepted approaches in the scientific community for analyzing fisheries in an ecosystem context and has numerous applications, even for ecosystem theoretical applications (Heymans et al., 2014; Colléter et al., 2015; Heymans et al., 2016). For application of our proposed framework, it is important to review the assumptions and input data quality of the quantitative models to be used. We recommend checking the robustness of EwE models based on the criteria proposed by Link (2010) and Heymans et al. (2016). In addition, it has been mentioned that one of the desirable requirements for using EwE models to explore management scenarios is that they must be calibrated and capable of reproducing observed trends in abundance or catch. In this sense, one disadvantage of using EwE for management is the demand for data and time series, which are not always available. Mexico is one of the countries with a relatively large number of available models5, but the country has a complex fisheries system, an extensive coastline, a large number of multispecies fisheries, multiple users and stakeholders, and different types of fishing gear. There are many cases in which a quantitative EwE-type model is not available. On the other hand, the use of LEK can be an alternative to preliminarily fill these gaps and involve local user resources, in this case, fishers, to make contributions to improving their fishery management (Espinosa-Romero et al., 2014). LEK is capable of improving fishery management because it can provide information about the ecology and abundance of not only the target species but also other species that form part of the ecosystem (Silvano and Valbo-Jørgensen, 2008; Aswani et al., 2018). Additionally, it has been demonstrated that fishers’ LEK shows significant similarities compared with EwE models and the scientific literature (Silvano and Begossi, 2012; Sánchez-Jiménez et al., 2019). This result is very important for revealing the impacts generated by fishing activities, particularly small-scale fisheries, because most of the information on the ecological impacts originates from studies performed in countries with a high development of industrial fishing (Shester and Micheli, 2011; Lewison et al., 2014). Additionally, these results can be implemented to achieve improvements in fishery within the outcome, management, and ecosystem indicators of the MSC standard.
The role of resource users in the EA in marine resource management has been changing and increasing. User participation occurs mainly in two ways: in one case, users produce reliable data and information to complement scientific information that can be used in the decision-making processes for local and regional management (Fulton et al., 2019a,b), and in other cases, users have helped confront particular interests that go against local cultural interests and values (Gadgil et al., 2002). In this study, with the help of scientific knowledge, LEK was used to fill an information gap because fishers have been familiar with the diets of species for several years due to their fishing experience (e.g., bait preparation and product processing) (Gadgil et al., 2002; Espinosa-Romero et al., 2014; Bentley et al., 2019a). However, LEK may be subject to bias or uncertainty due to partial knowledge or the tendency of fishers to know the target species better. Therefore, it is advisable to apply rigorous methodological designs and identify local experts (Davis and Wagner, 2003) or supplement the obtained data with scientific information (Cisneros-Montemayor et al., 2020), as was done in this study. Non-etheless, our goal was to present how LEK can provide a first approximation of the ecosystem structure and the trophic interrelationships between species. This approach allowed us to run simulation scenarios of the impact of the extraction of a target species and to contrast the results with those obtained with random scenarios.
However, the availability of quantitative models does not always guarantee that the effects of fishing can be evaluated dynamically. It has been mentioned that an important aspect of the trophic models built with the EwE approach is the ability to reproduce observed historical patterns (Heymans et al., 2016). However, there are two main problems: (1) the constructed EwE models do not frequently include time-series calibration (Heymans et al., 2014), and (2) the use of time series from statistical records is associated with a risk of high uncertainty. Discrepancies have been repeatedly observed between real and registered fishery statistics (Watson and Pauly, 2001), which could be particularly important in the case of artisanal finfish fisheries (Salas et al., 2007; Cisneros-Montemayor et al., 2013). In addition, the EA to fisheries requires models that consider environmental and human drivers (e.g., climate variability and fishing effort), which could provide a more realistic scenario at the expense of increasing the complexity of the models (Sánchez-Jiménez et al., 2019). Although this complexity may aid the development of more representative models, their uncertainty could increase (Collie et al., 2016). We recognize that our approach does not include other stressors that may be relevant for ecosystem dynamics (e.g., pollution and climate change). However, it is possible to include other drivers that force quantitative model simulations or other criteria for species removal in qualitative models.
In this sense, ecosystem models constitute a valuable tool for informing fisheries management, and it has been recommended that these models be calibrated and validated as much as possible such that they can be used for experimentation through simulation scenarios (Heymans et al., 2016; Grüss et al., 2017). Although the use of ecosystem models has increased to inform management decisions by providing system-level information and in some cases for strategic analysis, their use in tactical decision processes has not been widely adopted due to the uncertainty of complex model outputs that do not provide sufficient confidence for specific management decisions (Collie et al., 2016). In view of the abovementioned factors, our goal was to propose a relatively simple scheme that can be used to evaluate the possible ecosystem impacts of data-poor fisheries, but the approach can be applied to other fisheries. In this sense, our goal was not meant to propose specific management measures but rather to offer a framework of the environmental context in which fishing is performed and to determinate whether fishing has had negative (or positive) effects within the ecosystem. Although we recognize the uncertainty associated with fishery statistics in data-poor systems, institutions have traditionally used lack of information as a factor that hinders fisheries management, which has a direct impact on fishers and their communities, who must manage their fisheries based on scarce data. In fact, most of the time, the few data available are outdated with respect to the current fisheries context and therefore do not serve their purpose. In this sense, in data-poor situations, it is important to generate knowledge that provides tools or possible solutions and measures to avoid environmental degradation (United Nations Conference on Environment and Development, 1992: Rio Declaration; Latifah and Imanullah, 2018). For this reason, we propose the use of LEK to help build preliminary qualitative models as an alternative to measuring the impacts of small-scale fisheries in the face of information deficiency. However, even when quantitative models with a larger amount of data are available, they often need to be updated, which is not always possible. Therefore, an alternative is the use of few available data, such as fishery statistics and satellite derivatives, to infer possible ecosystem impacts. Nevertheless, we recognize that better data are needed, and we also urge institutions to update the available fisheries information to enable better decision-making. Although an ecosystem approach to fisheries management does not allow the formulation of specific management decisions (tactical approach), this approach can provide clear advice during the process of developing effective strategies to ensure that the level of implementation is optimal and its likelihood of success and can therefore contribute to strengthening fishery management plans (strategic approach).
Despite the importance of monitoring the impacts of fisheries on the ecosystem, documenting those impacts remains a scientific challenge. Various approaches have been proposed for several decades, and various ecological indicators that require different amounts of data have been proposed (Rochet and Trenkel, 2011; Halouani et al., 2019). To date, there is no methodological standard for this analysis, but it is widely recognized that the management of fishery resources should be performed from an ecosystem perspective. In this sense, the ecosystem-related components of the MSC standard (outcome, management, and information) lead small- and large-scale fisheries to consider this approach, which is a way to begin to address this challenge and incorporate ecological indicators within the evaluation methodologies.
In the context of data limitations and the wider challenge of managing small-scale fisheries, it is necessary to propose versatile frameworks that generate simulation scenarios that allow the exploration of possible ecosystem responses that could be considered for sustainable management. Although there are several indicators for assessing impacts on the environment, an advantage of topological indicators is that they can be applied to both binary networks, such as qualitative networks, and weighted networks, such as those created through the Ecopath approach.
This study revealed that the topological indicators followed similar trends to the Ecopath-derived indicators. This result opens a door because it means that indicators that demand relatively less data, such as topological indicators, could capture environmental variability and the effects of fishing. Although the use of topological indicators in the temporal dynamics of food webs has already been tested, which indicators are most sensitive remains unclear, but the results have demonstrated that these indicators can be sensitive to the temporal dynamics of ecosystems and their food webs (Jordán and Osváth, 2009; Olivier et al., 2019). However, not all topological indicators for both binary and weighted networks can be estimated. For this reason, we selected four relatively easy-to-understand indicators that could be applied to both types of networks originating from qualitative and quantitative models. Indeed, it has been found that some binary topological indicators may be less sensitive to structural changes in food webs, but when changes in species abundance are considered, weighted indicators can detect these changes (Olivier et al., 2019). In this sense, the application of the topological indicators proposed in this study was able to capture the dynamics of the studied ecosystems because the temporal simulations contemplated changes in species abundances.
However, the attack and error scenarios allowed us to understand not only the role of the target species but also the broader vulnerability and resilience of the food webs (Solé and Montoya, 2001; Dunne et al., 2002) to fishing or environmental impacts on specific components (Ávila-Thieme et al., 2021). Although the attack and error scenarios represent extreme situations such as the total removal of functional groups, which is unlikely to be caused by fishing or environmental changes in the short term, these scenarios allow us to place into context both aspects, i.e., the role of target species and the vulnerability of the food web. This could be reached because we were able to understand how important the removal of the target species may be in comparison with other species and with random failures of the food web. This study found that some species may play an important role in food webs because they have a high participation in trophic pathways, as in the case of barred sand bass and sea basses in the El Rosario and Guaymas regions, respectively. However, although both groups play a significant role in the food web, their removal causes different impacts in both case studies, which we associated with the vulnerability of the ecosystem’s food web. For example, in Guaymas, the food web did not experience abrupt changes based on the four indicators used (Figure 2). However, in El Rosario and Isla Natividad, the food web was more vulnerable, but this vulnerability was not necessarily due to the removal of the target species but rather to the removal of other species (Figure 2).
The temporal analysis made it possible to evaluate the dynamics of the ecosystem and the changes in its structure and functioning. The process of fitting to time series can also be useful for assessing the contribution of environmental or fisheries effects (Mackinson et al., 2009; Scott et al., 2016). Because ecosystem models, such as EwE models, can include various assumptions and uncertainty, the realm of their applicability can be determined to the extent that the models may be able to replicate observed trends (Grüss et al., 2017). In this sense, the fitting achieved in the case studies allowed us to obtain a glimpse of the effects of fishing and changes in primary productivity. The fit to the historical data considering both effects was acceptable, but the catch trends were better explained by the fishing effort. However, the structure and functioning of the food web appeared to be mostly modulated by the changes in primary productivity that propagate through the entire food web. This type of analysis can help us to understand and put into context how much fishing or environmental effects may affect ecosystem function and fishing production (Mackinson et al., 2009).
The analysis of the vulnerability and resilience of marine food webs is relevant because it allows us to understand the context of the changes induced by environmental or fishing effects. The objective of our study was to demonstrate, using a relatively simple strategy, how environmental and fisheries effects can be considered when quantitative models that allow temporal simulation are available. Additionally, the analysis complemented with ecological indicators through historical trends allowed us to infer that the changes in the ecosystem depended both on primary productivity and on fishing effort. In contrast, although temporal simulations cannot be used for qualitative models, it is non-etheless possible to run simulations based on species removal, which allowed us to identify that the removal of the case study species does not cause abrupt changes in the ecosystem. Furthermore, these scenarios place into context the possible effects of fishing under worst-case scenarios by revealing that the tolerance of ecosystems to extreme loss of biomass and diversity depends on the vulnerability and resilience of the food web.
Conclusion
The results generated in this study can contribute to management plans and strategies for target species and the need for conservation actions for other non-target species. The fact that topological indicators have been matched with ecological indicators creates opportunities to involve fishery resource users and to develop qualitative models in data-poor circumstances. In fact, fishing communities have repeatedly been relegated from making decisions about the fishing resources on which they depend for their livelihoods, which can cause major negative impacts. This is why engaging fishers as a means of documenting LEK promotes better conservation decisions and management measures for fishery resources (Fulton et al., 2019a). LEK has a high complementarity, which means that the related investigations that constitute LEK have a greater impact on the development of management advice regarding fishery resources (Silvano and Valbo-Jørgensen, 2008; Bélisle et al., 2018; Bentley et al., 2019b). Various fishing certifying institutions (e.g., Marine Stewardship Council) recommend that for those cases with a lack of authority regarding data collection or management standards, the local information generated and the community agreements can be considered as long as this information and processes are documented and transparent (MSC, 2014). This can be particularly true for less-advanced fisheries management systems and data-poor fisheries. Therefore, the evaluators of the certifiers can be based on general observations and qualitative and quantitative information and/or can aim to identify alternative indicators that can indicate the impacts on the structure of the ecosystem. In this regard, user-generated information as a continuous process can improve both science-based and LEK-based models for mapping ecosystem changes. In particular, we recommend monitoring programs for target and key non-target species that support ecosystem function due to their important role in the food web structure. In this sense, citizen science contributes to the adaptive co-management of fish resources through the identification of risk scenarios or sudden changes in the ecosystem. This undoubtedly sets the standard in the construction of growing governance and improvements in the management of fisheries, where it can guide both fishing communities and researchers in discussing co-management decisions in a more informed manner.
Data Availability Statement
The raw data supporting the conclusions of this article will be made available by the authors, without undue reservation.
Author Contributions
MZ-R, LR-T, AF-G, and IL-E contributed to the conception and design of the study, funding acquisition, and manuscript writing and reviewing. MZ-R and GL-I contributed to modeling and data analysis. ER-R and SS-J contributed to design and implementation of citizen science including surveys application and data collection. FA-S and AMC-M contributed to writing and discussions for the manuscript. All authors contributed to manuscript revision, read, and approved the submitted version.
Funding
This work was supported by the Walton Family Foundation (grant number 00101951), the Waterloo Foundation (grant number 1017-4215), the David and Lucile Packard Foundation (grant number 2019-69961), the Sandler Foundation (grant number 20210356), and The Marisla Foundation (grant number 20200304).
Conflict of Interest
The authors declare that the research was conducted in the absence of any commercial or financial relationships that could be construed as a potential conflict of interest.
Publisher’s Note
All claims expressed in this article are solely those of the authors and do not necessarily represent those of their affiliated organizations, or those of the publisher, the editors and the reviewers. Any product that may be evaluated in this article, or claim that may be made by its manufacturer, is not guaranteed or endorsed by the publisher.
Acknowledgments
MZ-R and FA-S thank SIP project 20211538, EDI and COFAA from Instituto Politécnico Nacional. We thank SCPP Ensenada for contributing their LEK and collaborating during the interviews and SCPP 29 de Agosto, SCPP Buzos y Pescadores de la Baja California, and SCPP Ensenada for contributing fishery monitoring data. A. Romero and R. Hernández from COBI was acknowledged for applying the interviews to fishers at El Rosario, BC. AMC-M acknowledges support from the Nippon Foundation Ocean Nexus Center. We are also grateful to two reviewers for their insightful comments, which have improved the quality of our manuscript.
Supplementary Material
The Supplementary Material for this article can be found online at: https://www.frontiersin.org/articles/10.3389/fmars.2021.799068/full#supplementary-material
Footnotes
- ^ https://www.fishbase.se/
- ^ http://www.marinespecies.org/
- ^ https://www.r-project.org
- ^ https://www.ecopath.org
- ^ http://ecobase.ecopath.org/
References
Ahrens, R. N. M., Walters, C. J., and Christensen, V. (2012). Foraging arena theory. Fish Fish. 13, 41–59. doi: 10.1111/j.1467-2979.2011.00432.x
Albert, R., Jeong, H., and Barabasi, A. L. (2000). Error and attack tolerance of complex networks. Nature 406, 378–382. doi: 10.1038/35019019
Allesina, S., Bodini, A., and Pascual, M. (2009). Functional links and robustness in food webs. Philos. Trans. R. Soc. Lond. B Biol. Sci. 364, 1701–1709. doi: 10.1098/rstb.2008.0214
Arreguıìn-Sánchez, F., Arcos, E., and Chávez, E. (2002). Flows of biomass and structure in an exploited benthic ecosystem in the Gulf of California, Mexico. Ecol. Model. 156, 167–183. doi: 10.1016/S0304-3800(02)00159-X
Arton, A., Leiman, A., Petrokofsky, G., Toonen, H., and Longo, C. S. (2020). What do we know about the impacts of the marine stewardship council seafood ecolabelling program? A systematic map. Environ. Evid. 9:6. doi: 10.1186/s13750-020-0188-9
Aswani, S., Lemahieu, A., and Sauer, W. H. H. (2018). Global trends of local ecological knowledge and future implications. PLoS One 13:e0195440. doi: 10.1371/journal.pone.0195440
Ávila-Thieme, M. I., Corcoran, D., Pérez-Matus, A., Wieters, E. A., Navarrete, S. A., Marquet, P. A., et al. (2021). Alteration of coastal productivity and artisanal fisheries interact to affect a marine food web. Sci. Rep. 11:1765. doi: 10.1038/s41598-021-81392-4
Barrat, A., Barthélemy, M., Pastor-Satorras, R., and Vespignani, A. (2004). The architecture of complex weighted networks. Proc. Natl. Acad. Sci. U.S.A. 101, 3747–3752. doi: 10.1073/pnas.0400087101
Bélisle, A. C., Asselin, H., LeBlanc, P., and Gauthier, S. (2018). Local knowledge in ecological modeling. Ecol. Soc. 23:14. doi: 10.5751/ES-09949-230214
Bentley, J. W., Serpetti, N., Fox, C., Heymans, J. J., and Reid, D. G. (2019a). Combining scientific and fishers’ knowledge to co-create indicators of food web structure and function. ICES J. Mar. Sci. 76, 2218–2234. doi: 10.1093/icesjms/fsz121
Bentley, J. W., Serpetti, N., Fox, C., Heymans, J. J., and Reid, D. G. (2019b). Fishers’ knowledge improves the accuracy of food web model predictions. ICES J. Mar. Sci. 76, 897–912. doi: 10.1093/icesjms/fsz003
Berkström, C., Papadopoulos, M., Jiddawi, N. S., and Nordlund, L. M. (2019). Fishers’ local ecological knowledge (LEK) on connectivity and seascape management. Front. Mar. Sci. 6:130. doi: 10.3389/fmars.2019.00130
Carruthers, T. R., and Hordyk, A. R. (2018). The data-limited methods toolkit (DLMtool): an R package for informing management of data-limited populations. Methods Ecol. Evol. 9, 2388–2395. doi: 10.1111/2041-210X.13081
Christensen, V., and Walters, C. J. (2004). Ecopath with Ecosim: methods, capabilities and limitations. Ecol. Model. 172, 109–139. doi: 10.1016/j.ecolmodel.2003.09.003
Cisneros-Montemayor, A. M., Cisneros-Mata, M. A., Harper, S., and Pauly, D. (2013). Extent and implications of IUU catch in Mexico’s marine fisheries. Mar. Policy 39, 283–288. doi: 10.1016/j.marpol.2012.12.003
Cisneros-Montemayor, A. M., Zetina-Rejón, M. J., Espinosa-Romero, M. J., Cisneros-Mata, M. A., Singh, G. G., and Fernández-Rivera Melo, F. J. (2020). Evaluating ecosystem impacts of data-limited artisanal fisheries through ecosystem modelling and traditional fisher knowledge. Ocean Coast. Manage. 195:105291. doi: 10.1016/j.ocecoaman.2020.105291
Colléter, M., Valls, A., Guitton, J., Gascuel, D., Pauly, D., and Christensen, V. (2015). Global overview of the applications of the Ecopath with Ecosim modeling approach using the EcoBase models repository. Ecol. Model. 302, 42–53. doi: 10.1016/j.ecolmodel.2015.01.025
Collie, J. S., Botsford, L. W., Hastings, A., Kaplan, I. C., Largier, J. L., Livingston, P. A., et al. (2016). Ecosystem models for fisheries management: finding the sweet spot. Fish Fish. 17, 101–125. doi: 10.1111/faf.12093
Csardi, G., and Nepusz, T. (2006). The igraph software package for complex network research. Interj. Compl. Sys. 1695:1695.
Davis, A., and Wagner, J. R. (2003). Who knows? On the importance of identifying “experts” when researching local ecological knowledge. Hum. Ecol. 31, 463–489. doi: 10.1023/A:1025075923297
Dey, A. K., Gel, Y. R., and Poor, H. V. (2019). What network motifs tell us about resilience and reliability of complex networks. Proc. Nat. Acad. Sci. U.S.A 116:19368. doi: 10.1073/pnas.1819529116
Diario Oficial de la Federación (2010). Acuerdo Mediante el cual se da a Conocer la Actualizacion de la Carta Nacional Pesquera. Available online at: http://www.dof.gob.mx/nota_detalle.php?codigo=5169418&fecha=02/12/2010 (accesed April 15, 2021)
Dowling, N. A., Dichmont, C. M., Haddon, M., Smith, D. C., Smith, A. D. M., and Sainsbury, K. (2015). Empirical harvest strategies for data-poor fisheries: a review of the literature. Fish. Res. 171, 141–153. doi: 10.1016/j.fishres.2014.11.005
Dunne, J. A., Williams, R. J., and Martinez, N. D. (2002). Network structure and biodiversity loss in food webs: robustness increases with connectance. Ecol. Lett. 5, 558–567. doi: 10.1046/j.1461-0248.2002.00354.x
Eagle, N., Macy, M., and Claxton, R. (2010). Network diversity and economic development. Science 328, 1029–1031. doi: 10.1126/science.1186605
Espinosa-Romero, M. J., Cisneros-Mata, M. A., McDaniels, T., and Torre, J. (2014). Aplicación del enfoque ecosistémico al manejo de pesquerías artesanales. Caso de Estudio: Puerto Libertad, Sonora. Ciencia Pesq. 22, 65–77.
FAO (2003). The Ecosystem Approach to Fisheries. FAO Technical Guidelines for Responsible Fisheries 4 (Suppl. 2). Rome: FAO.
FAO (2020). The State of World Fisheries and Aquaculture 2020. Sustainability in Action. Rome: FAO. doi: 10.4060/ca9229en
Fernández-Rivera Melo, F. J., Rocha-Tejeda, L., Cuevas-Gómez, G. A., Gastélum-Nava, E., Sánchez-Cota, J. B., Goldman, N., et al. (2018). Criterios internacionales de sustentabilidad pesquera: >Dónde estamos y qué necesitamos para mejorar? Ciencia Pesq. 26, 65–88.
Freeman, L. C. (1979). Centrality in social networks I: conceptual clarification. Soc. Netw. 1, 215–239. doi: 10.1016/0378-8733(78)90021-7
Fulton, S., López-Sagástegui, C., Hudson Weaver, A., Fitzmaurice-Cahluni, F., Galindo, C., Fernández-Rivera Melo, F., et al. (2019a). Untapped potential of citizen science in mexican small-scale fisheries. Front. Mar. Sci. 6:517. doi: 10.3389/fmars.2019.00517
Fulton, S., Hernández, A., Suárez-Castillo, A., Fernández-Rivera Melo, F. J., Rojo, M., Sáenz-Arrollo, et al. (2019b). “From fishing fish to fishing data: the role of artisanal fishers in conservation and resource management in Mexico,” in Viability and Sustainability of Small-Scale Fisheries in Latin America and The Caribbean. MARE Publication Series, Vol. 19, eds S. Salas, M. J. Barragán-Paladines, and R. Chuenpagdee (Cham: Springer), 151–175.
Gadgil, M., Olsson, P., Berkes, F., and Folke, C. (2002). “Exploring the role of local ecological knowledge in ecosystem management: three case studies,” in Navigating Social-Ecological Systems: Building Resilience for Complexity and Change, eds F. Berkes, J. Colding, and C. Folke (Cambridge: Cambridge University Press), 189–209. doi: 10.1017/CBO9780511541957.013
Gao, J., Barzel, B., and Barabási, A. L. (2016). Universal resilience patterns in complex networks. Nature 530, 307–312. doi: 10.1038/nature16948
Grüss, A., Rose, K. A., Simons, J., Ainsworth, C. H., Babcock, E. A., Chagaris, D. D., et al. (2017). Recommendations on the use of ecosystem modeling for informing ecosystem-based fisheries management and restoration outcomes in the Gulf of Mexico. Mar. Coast. Fish. 9, 281–295. doi: 10.1080/19425120.2017.1330786
Halouani, G., Le Loc’h, F., Yunne-Jai, S., Velez, L., Hattab, T., Romdhane, M. S., et al. (2019). An end-to-end model to evaluate the sensitivity of ecosystem indicators to track fishing impacts. Ecol. Indic. 98, 121–130. doi: 10.1016/j.ecolind.2018.10.061
Heymans, J. J., Coll, M., Libralato, S., Morissette, L., and Christensen, V. (2014). Global patterns in ecological indicators of marine food webs: a modelling approach. PLoS One 9:e95845. doi: 10.1371/journal.pone.0095845.s002
Heymans, J. J., Coll, M., Link, J. S., Mackinson, S., Steenbeek, J., Walters, C., et al. (2016). Best practice in Ecopath with Ecosim food-web models for ecosystem-based management. Ecol. Model. 331, 173–184. doi: 10.1016/j.ecolmodel.2015.12.007
Johannes, R. E. (1998). The case for data-less marine resource management: examples from tropical nearshore finfisheries. Trends Ecol. Evol. 13, 243–246. doi: 10.1016/S0169-5347(98)01384-6
Johnson, A. F., Moreno-Báez, M., Giron-Nava, A., Corominas, J., Erisman, B., Ezcurra, E., et al. (2017). Correction: a spatial method to calculate small-scale fisheries effort in data poor scenarios. PLoS One 12:e0179114. doi: 10.1371/journal.pone.0174064
Jordán, F., and Osváth, G. (2009). The sensitivity of food web topology to temporal data aggregation. Ecol. Model. 220, 3141–3146. doi: 10.1016/j.ecolmodel.2009.05.002
Kaiser, B. A., Hoeberechts, M., Maxwell, K. H. Eerkes-Medrano, L., Hilmi, N., Safa, A., et al. (2019). The importance of connected ocean monitoring knowledge systems and communities. Front. Mar. Sci. 6:309. doi: 10.3389/fmars.2019.00309
Kaplan, I., and McCay, B. J. (2004). Cooperative research, co-management and the social dimension of fisheries science and management. Mar. Policy 28, 257–258. doi: 10.1016/j.marpol.2003.08.003
Latifah, E., and Imanullah, M. N. (2018). The precautionary principle in fisheries management under climate change: how the international legal framework formulate it? IOP Conf. Ser. Earth Environ. Sci. 129:012038. doi: 10.1088/1755-1315/129/1/012038
Lewison, R. L., Crowder, L. B., Wallace, B. P., Moore, J. E., Cox, T., Zydelis, R., et al. (2014). Global patterns of marine mammal, seabird, and sea turtle bycatch reveal taxa-specific and cumulative megafauna hotspots. Proc. Natl. Acad. Sci. U.S.A. 111, 5271–5276. doi: 10.1073/pnas.1318960111
Lindeman, R. L. (1942). The trophic-dynamic aspect of ecology. Ecology 23, 399–418. doi: 10.1007/BF02464428
Link, J. S. (2010). Adding rigor to ecological network models by evaluating a set of pre-balance diagnostics: a plea for PREBAL. Ecol. Model. 221, 1582–1593. doi: 10.1016/j.ecolmodel.2010.03.012
Mackinson, S., Daskalov, G., Heymans, J., Neira, S., Arancibia, H., Zetina-Rejón, M. J., et al. (2009). Which forcing factors fit? Using ecosystem models to investigate the relative influence of fishing and changes in primary productivity on the dynamics of marine ecosystems. Ecol. Model. 220, 2972–2987. doi: 10.1016/j.ecolmodel.2008.10.021
Marina, T. I., Saravia, L. A., Cordone, G., Salinas, V., Doyle, S. R., and Momo, F. R. (2018). Architecture of marine food webs: to be or not be a ‘small-world’. PLoS One 13:e0198217. doi: 10.1371/journal.pone.0198217
Moore, C., Grewar, J., and Cumming, G. S. (2015). Quantifying network resilience: comparison before and after a major perturbation shows strengths and limitations of network metrics. J. Appl. Ecol. 53, 636–645. doi: 10.1111/1365-2664.12486
MSC (2014). MSC Fisheries Standard and Guidance v2.0. (Extracted from Annexes SA, SB, SC and SD of the Fisheries Certification Requirements v2.0). London: Marine Stewardship Council.
Olivier, P., Frelat, R., Bonsdorff, E., Kortsch, S., Kröncke, I., Möllmann, C., et al. (2019). Exploring the temporal variability of a food web using long-term biomonitoring data. Ecography 42, 2107–2121. doi: 10.1111/ecog.04461
Plagányi, ÉE. (2007). Models for an Ecosystem Approach to Fisheries. FAO Fisheries Technical Paper. No. 477. Rome: FAO, 108.
Rochet, M. J., and Trenkel, V. M. (2011). Which community indicators can measure the impact of fishing? A review and proposals. Can. J. Fish. Aquat. Sci. 60, 86–99. doi: 10.1139/f02-164
Salas, S., Chuenpagdee, R., Seijo, J. C., and Charles, A. (2007). Challenges in the assessment and management of small-scale fisheries in Latin America and the Caribbean. Fish. Res. 87, 5–16. doi: 10.1016/j.fishres.2007.06.015
Sánchez-Jiménez, A., Fujitani, N., MacMillan, D., Schlüter, A., and Wolff, M. (2019). Connecting a trophic model and local ecological knowledge to improve fisheries management: the case of Gulf of Nicoya, Costa Rica. Front. Mar. Sci. 6:126. doi: 10.3389/fmars.2019.00126
Scott, E., Serpetti, N., Steenbeek, J., and Heymans, J. J. (2016). A stepwise fitting procedure for automated fitting of Ecopath with Ecosim models. SoftwareX 5, 25–30. doi: 10.1016/j.softx.2016.02.002
Shannon, C. E. (1948). A mathematical theory of communication. Bell Syst. Tech. J. 27, 379–423. doi: 10.1002/j.1538-7305.1948.tb01338.x
Shester, G. G., and Micheli, G. (2011). Conservation challenges for small-scale fisheries: bycatch and habitat impacts of traps and gillnets. Biol. Conserv. 144, 1673–1681. doi: 10.1016/j.biocon.2011.02.023
Silvano, R. A. M., and Begossi, A. (2012). Fishermen’s local ecological knowledge on Southeastern Brazilian coastal fishes: contributions to research, conservation, and management. Neotrop. Ichthyol. 10, 133–147. doi: 10.1590/S1679-62252012000100013
Silvano, R. A. M., and Valbo-Jørgensen, J. (2008). Beyond fishermen’s tales: contributions of fishers’ local ecological knowledge to fish ecology and fisheries management. Environ. Dev. Sustain. 10, 657–675. doi: 10.1007/s10668-008-9149-0
Skern-Mauritzen, M., Ottersen, G., Handegard, N. O., Huse, G. Dingsør, G. E., Stenseth, N. C., et al. (2016). Ecosystem processes are rarely included in tactical fisheries management. Fish Fish. 17, 165–175. doi: 10.1111/faf.12111
Solé, R. V., and Montoya, J. M. (2001). Complexity and fragility in ecological networks. Proc. Biol. Sci. 268, 2039–2045. doi: 10.1098/rspb.2001.1767
St. Martin, K., McCay, B. J., Murray, G. D., Johnson, T. R., and Oles, B. (2007). Communities, knowledge and fisheries of the future. Int. J. Glob. Environ. Issues 7, 221–239. doi: 10.1504/ijgenvi.2007.013575
Townsend, H., Harvey, C. J., DeReynier, Y., Davis, D., Zador, S. G., Gaichas, S., et al. (2019). Progress on implementing ecosystem-based fisheries management in the United States through the use of ecosystem models and analysis. Front. Mar. Sci. 6:641. doi: 10.3389/fmars.2019.00641
Ulanowicz, R. E. (1986). Growth and Development: Ecosystems Phenomenology. New York, NY: Springer-Verlag.
United Nations Conference on Environment and Development (1992). Agenda 21, Rio Declaration, Forest Principles. New York, NY: United Nation.
Vilalta-Navas, A., Beas-Luna, R., Calderon-Aguilera, L. E., Ladah, L., Micheli, F., Christensen, V., et al. (2018). A mass-balanced food web model for a kelp forest ecosystem near its southern distributional limit in the northern hemisphere. Food Webs 16:e00091. doi: 10.1016/j.fooweb.2018.e00091
Walters, C., Christensen, V., and Pauly, D. (1997). Structuring dynamic models of exploited ecosystems from trophic mass-balance assessments. Rev. Fish Biol. Fisher. 7, 139–172. doi: 10.1023/A:1018479526149
Wasserman, S., and Faust, K. (1994). Social Network Analysis: Methods and Applications. Cambridge: Cambridge University Press.
Watson, R., and Pauly, D. (2001). Systematic distortions in world fisheries catch trends. Nature 414, 534–536. doi: 10.1038/35107050
Keywords: fishing impacts, EAF, finfish, topological indicators, ecological indicators, LEK
Citation: Zetina-Rejón MJ, López-Ibarra GA, Rocha-Tejeda L, Flores-Guzmán A, López-Ercilla I, Rodríguez-Rodríguez E, Sandoval-Jiménez SA, Arreguín-Sánchez F and Cisneros-Montemayor AM (2022) A Framework for Simulating Ecosystem Effects in Data-Poor Small-Scale Fisheries Using Science-Based and Local Ecological Knowledge-Based Models. Front. Mar. Sci. 8:799068. doi: 10.3389/fmars.2021.799068
Received: 21 October 2021; Accepted: 13 December 2021;
Published: 11 January 2022.
Edited by:
Brett W. Molony, Oceans and Atmosphere (CSIRO), AustraliaReviewed by:
Marcus Sheaves, James Cook University, AustraliaWilliam David Heyman, LGL (United States), United States
Copyright © 2022 Zetina-Rejón, López-Ibarra, Rocha-Tejeda, Flores-Guzmán, López-Ercilla, Rodríguez-Rodríguez, Sandoval-Jiménez, Arreguín-Sánchez and Cisneros-Montemayor. This is an open-access article distributed under the terms of the Creative Commons Attribution License (CC BY). The use, distribution or reproduction in other forums is permitted, provided the original author(s) and the copyright owner(s) are credited and that the original publication in this journal is cited, in accordance with accepted academic practice. No use, distribution or reproduction is permitted which does not comply with these terms.
*Correspondence: Manuel J. Zetina-Rejón, bXpldGluYUBpcG4ubXg=