 Arjen Pieter Luijendijk1,2*
 Etiënne Kras1
 Vasiliki Dagalaki1Robin Morelissen1
 Ibrahim Hoteit3
 Roshanka Ranasinghe1,4,5
- 1Deltares, Hydraulic Engineering, Delft, Netherlands
- 2Department of Hydraulic Engineering, Faculty of Civil Engineering and Geosciences, Delft University of Technology, Delft, Netherlands
- 3Physical Science and Engineering Division, King Abdullah University of Science and Technology (Kaust), Thuwal, Saudi Arabia
- 4Department of Coastal and Urban Risk and Resilience, IHE Delft Institute for Water Education, Delft, Netherlands
- 5Water Engineering and Management, Faculty of Engineering Technology, University of Twente, Enschede, Netherlands
The Saudi Arabian tourism sector is growing, and its economy has flourished over the last decades. This has resulted in numerous coastal developments close to large economic centers, while many more are proposed or planned. The coastal developments have influenced the behavior of the shoreline in the past. Here we undertake a national assessment on the state of the coast of Saudi Arabia based on recent data sets on historic and future shoreline positions. While at national scale the shoreline is found to be stable over the last three decades, the Red Sea coast shows a regional-mean retreat rate while the Gulf coast shows a regional-mean prograding behavior. Detailed analysis of the temporal evolution of shoreline position at selected locations show that human interventions may have accelerated shoreline retreat along adjacent shorelines, some of which are Marine Protected Areas. Furthermore, reef-fronted coastal sections have a mean accretive shoreline change rate, while the open coast shows a mean retreat rate. Future shoreline projections under RCP 4.5 and RCP 8.5 show that large parts of the shoreline may experience an accelerated retreat or a change in its regime from either stable or sprograding to retreating. Under the high emission RCP 8.5 scenario, the length of coastline projected to retreat more than doubles along the Red Sea coast, and approximately triples along the Gulf coast in 2100. At national scale, the Saudi Arabian coastline is projected to experience regional-mean retreats of ~30 m and of ~130 m by 2050 and 2100 under both RCPs considered in this study. These results indicate that effective adaptation strategies will be required to protect areas of ecological and economic value, and that climate resilience should be a key consideration in planned or proposed coastal interventions.
1. Introduction
The Kingdom of Saudi Arabia is located in the Arabian Peninsula, in southwest Asia. The country's 2.25 million km2 terrain consists mostly of arid steppe, mountains and sand desert, while the 2,320 km of shoreline span over the Red Sea (ca. 1,760 km) and the Gulf (ca. 560 km). Ninety-nine percent of the Saudi Arabia coast is sandy, interrupted by rocky headlands (Luijendijk et al., 2018). Both on the Red Sea and Gulf, extensive fringing coral reef habitats (1,480 km2) are found along the coast and around offshore islands. These reefs together with the mangrove forests (35 km2) scattered along the Red Sea coast comprise the most significant coastal habitats of the Saudi coast.
Due to the flourishing economy and the growing tourism sector, numerous coastal interventions have been implemented in the last decades in the coastal front of the large economic centers of the country (Jeddah, Khobar, Dammam, Jubail, etc.), driven by the need to create more space for industrial, urban and recreational uses (Halpern et al., 2008; Sheppard et al., 2010). Over the last 30 years, 186 km2 of Saudi Arabian inland and coastal water surface has been transferred into land while 156 km2 of its land has been converted into water (Donchyts et al., 2016).
At present, seaside developments (e.g., Red Sea Development Project, NEOM, Economic Cities) are being planned and built, mostly in scarcely populated, pristine areas, with the aim of supporting economic activities and tourism growth. For developers and stakeholders, a smart, future-proof design of the coastal front, in combination with the conservation of the unique physical and ecological characteristics of these coasts, is a primary goal.
Understanding of the natural dynamics of the coast and present state of these rapidly developing coastal zone is therefore of great importance. Acquiring and analyzing information regarding the historical evolution of the coastal system toward its present state can provide useful insight into the influence of the different natural and/or anthropogenic drivers. At a national level, such an analysis has not yet been conducted for Saudi Arabia. Information on historical coastal change can also support the predictions of the future autonomous dynamics of the Saudi coastal systems. Additionally, it can inform the assessment of planned coastal interventions in terms of the type and magnitude of the expected impacts on the natural system, thus contributing to future-proof and sustainable coastal development.
This study investigates long-term historic and projected future shoreline changes for Saudi Arabia, by generating and analyzing detailed state-of-the-art geospatial datasets of historic and future shoreline change. After introducing the study area, data and methods (section 2), the historic long-term shoreline changes, including the temporal variability therein, are discussed (section 3). Thereafter, the projected shoreline changes under two climate change scenarios, and the expected regime shifts in shoreline behavior are discussed. Conclusions of the study are finally presented in section 4.
2. Study Area and Methods
2.1. Environmental Conditions
Saudi-Arabia is enclosed by water bodies on both the western and eastern side of the country; the Red Sea (including the Gulf of Aqaba) in the west and the Gulf in the east. The tide in the north Red Sea is semi-diurnal with typical range up to 1 m. Seasonal water level variations are also observed (0.2–0.3 m in the central Red Sea) (Deltares, 2015). Extreme water levels (with return period (RP) of 100 years) in the northern part of the Red Sea are estimated to be between 0.5 and 2 m (Muis et al., 2016; Vousdoukas et al., 2018). Under RCP4.5 (RCP8.5) the projected increase in 100 year RP water levels is 0.2 m (0.4 m) by 2100. The dimensions and layout of the Gulf result in a complex system of tidal standing waves. The tidal characteristics vary over the Gulf, with different areas experiencing diurnal, mixed and semi-diurnal tides (Reynolds, 1993). Tidal range is greater than 1 m everywhere and the highest tidal ranges (up to 4 m) are observed in the northern end of the Gulf and the east side of Qatar (Elshorbagy et al., 2006; Rakha et al., 2007).
The geography of the Red Sea surrounding land masses creates a wind system with dominant directions along the Red Sea axis. The analysis of Langodan et al. (2017) distinguishes different wind systems in the Red Sea. Northwesterly winds associated with storms in the Mediterranean Sea affect the northern part of the basin in the winter (with maximum speed up to 20 m/s) and the entire basin during summer. The southeasterly winds, present mainly in the southern part of the basin, are associated with winter monsoon events in the Arabian Sea. A 30-year regional reanalysis shows decreasing trends in the wind speeds in the area (Langodan et al., 2017). The wind climate in the Gulf is characterized by the presence of seasonal, high-intensity, north, north-easterly winds, the shamals. Summer shamals occur from May to July with velocities 7–13 m/s (Rao et al., 2001; Barlett, 2004) and may last for weeks at a time. Winter shamals affect the region from November to March with wind speeds up to 20 m/s at the center of the Gulf (Al Senafi and Anis, 2015).
The wave climatology in the Red Sea is strongly characterized by the main wind systems. Dominant wave directions in terms of frequency are northwesterly to northerly. In the north part of the Red Sea, Hs mean remains approximately 1 m all year around. Additionally, waves with swell characteristics, associated with the SE winds at the south Red Sea reach the north (Langodan et al., 2017). Energy from southerly waves is especially significant for the high percentiles during Oct-Apr. A 30 year hindcast shows decreasing trends in wave heights in the northern part of the Red Sea (in the order of 5–6 cm in 30 years for the northerly waves and 1 cm for the southerly waves) (Langodan et al., 2020). A decrease in the number of storm events per year related to the northerly and southerly waves is also detected. The prevailing wave direction over the Gulf is northwest to north, following the wind direction. The monthly mean Hs is lower than 1 m over the entirety of the Gulf with the highest values being reached in June and February in the central Gulf area (Kamranzad, 2018).
2.2. Methodology
Nowadays the added value of remote sensing in coastal engineering and coastal zone management is widely acknowledged and several global satellite-derived datasets have been generated (Donchyts et al., 2016; Luijendijk et al., 2018). These datasets can provide valuable information of the historic land-water changes and shoreline evolution since 1984. The historic shoreline change rates have also been used to assess future positions of the shorelines up to 2100 under various climate change scenarios (Vousdoukas et al., 2020). In the present study, these global data sets and methods have been deployed in more detail to conduct a national assessment on historic and future shoreline change of Saudi Arabia.
2.2.1. Historic Shoreline Change
Historical shoreline change data for the study area were obtained from the satellite derived shoreline (SDS) data set presented by Luijendijk et al. (2018). This global dataset provides historic annual shoreline positions derived from Landsat satellite imagery from 1984 to 2020 (Luijendijk et al., 2018).
First, yearly top-of-the-atmosphere reflectance composites were generated to remove the effects of clouds, shadows, snow, and ice. Then, the composites were used to estimate an accurate surface water mask using a dynamic thresholding method described in Donchyts et al. (2016). Analysis revealed that the influence of the tidal stage on detected shoreline positions was significantly reduced, which also applied for seasonal variability in wave and beach characteristics (Luijendijk et al., 2018).
Next, the composite images are used to determine the Normalized Difference Water Index (NDWI). The Canny edge detection filter is used to roughly estimate the position of the water-land transition, followed by the use of the Otsu thresholding method (Otsu, 1979) on a buffer polygon around the water-land transition to identify the most probable threshold to classify water and land on the image. The detected water lines at the edge of the water mask are smoothed using a 1D Gaussian smoothing operation to obtain a gradual shoreline avoiding the pixel-induced staircase effect (Luijendijk et al., 2018). A value of three gives the best results based on the four validation cases; meaning that it takes three cells on both sides during the 1D smoothing. The method may result in several shoreline vectors since lakes and small channels are detected. In this case, only the most seaward shoreline position is analyzed.
The validity of the shoreline detection method on sandy beaches has been demonstrated for multiple cases representing different types of beaches, sand, tidal and wave characteristics (Luijendijk et al., 2018). The accuracy of satellite derived shoreline positions is restricted to approximately 15 m over around 30 years (i.e., sub-pixel precision of the maximum spatial resolution (Hagenaars et al., 2017). In terms of shoreline change trends computed from these shoreline position data, trends in the range of –0.5 to +0.5 m/yr are taken to represent stable coastlines.
The automated shoreline detection method produces 37 annual global shorelines (1984–2020) with an alongshore resolution of 30 m. Using the defined transects at a 500 m alongshore spacing, the intersection point of each transect with the aforementioned annual shorelines was determined, which provided a sequence of shoreline positions per transect. The shoreline change rate (m/yr) at each transect is then computed by applying linear regression to all shoreline positions at that location. Ideally, a SDS position is available for each transect annually. However, the availability of satellite images and cloud cover can limit the number of SDS positions.
For each transect, a linear regression of the form ax+b+ϵ results in a change rate (a), a cross-shore intercept point with respect to 1984 (b) and a bootstrapped error term (ϵ) representing the reliability of the linear fit for historic shoreline change. To verify whether the change rate based on linear regression can be considered a representative proxy for the underlying data, the uncertainty bandwidth (or standard deviation) should be less than 0.5 m/yr (Luijendijk et al., 2018), which coincides with the limits of the stable regime.
To obtain high resolution time series of shoreline positions at specific sites, the same methods used by Luijendijk et al. (2018) were applied here, albeit using a dynamic (moving) 180-day window as this allows to generate Top of Atmosphere composite images at approximately 16-day intervals. These dynamic composites include seasonal variability in wave and beach characteristics while excluding noise and tidal variations. For this high resolution application, the GEE platform is used to obtain satellite imagery from the NASA Landsat-5 (1984–2013), Landsat-7 (1999-present) and Landsat-8 (2013-present) Operational Land Imager (OLI) sensors and the ESA Sentinel-2 (2015-present) Multi-Spectral Imager (MSI) sensor at a medium and high spatial resolution of 30 and 10 m respectively. Depending on the location on earth, the temporal resolution of the Landsat satellite missions is 16 days, whereas the Sentinel mission has a 5-day revisit time origination from two satellite constellations.
2.2.2. Future Shoreline Change
Estimates of future shoreline projections are obtained by combining data from Vousdoukas et al. (2020) and the historical change rates of Luijendijk et al. (2018). The probabilistic projections of Vousdoukas et al. (2020) explicitly take into account projections of future Relative SLR, spatial variations of coastal morphology, ambient shoreline change trends and future changes in meteorological drivers (for example, storm surge and waves).
In this study, the shoreline change throughout this century has been projected under two RCPs: RCP4.5 and RCP8.5. RCP4.5 may be viewed as a moderate-emission mitigation-policy scenario and RCP8.5 as a high-emissions scenario (Meinshausen, 2011). Here, the study focuses on the evolution of two components of sandy beach shoreline dynamics:
• AC, ambient shoreline dynamics driven by long-term hydrodynamic, geological and anthropic factors;
• R, shoreline retreat due to coastal morphological adjustments to SLR;
In the present study AC was exclusively obtained through the linear interpolation of the shoreline change rates reported by Luijendijk et al. (2018); see previous section. Note that Vousdoukas et al. (2020) computed AC combining the shoreline change data sets of Luijendijk et al. (2018) and Mentaschi et al. (2018). The R is directly obtained from Vousdoukas et al. (2020) projections, and represents SLR-driven shoreline retreat, the magnitude of which depends on the amplitude of SLR and the transfer of sediment from the subaerial to the submerged part of the active beach profile, to adjust to rising mean sea levels. The estimation of the equilibrium shoreline retreat R of sandy coasts due to SLR is based on the Bruun rule (Bruun, 1962). This approach builds on the concept that the beach morphology tends to adapt to the prevailing wave climate and is given by:
where tanβ is the active profile slope. Projections of regional SLR up to the end of this century are available from a probabilistic, process-based approach (Jackson, 2016) that combines the major factors contributing to SLR. Local scale vertical land movements such as land subsidence due to, for example, groundwater extraction are not included in the SLR projections. The tanβ term expresses the slope of the active beach profile, which was based on a global dataset of active beach slopes (Athanasiou et al., 2019). This dataset has been created combining the MERIT digital elevation dataset (Yamazaki et al., 2017) with the GEBCO bathymetry (Weatherall et al., 2015). Beach profiles are generated along each sandy beach transect by combining the above bathymetric and topographic data.
Here, shoreline change projection are derived, by adding the AC and R terms thus obtained, for 2050 and 2100 under RCP 4.5 and RCP 8.5.
3. Results
3.1. National Assessment of Historical Shoreline Change
The center panel in Figure 1 shows the historic long-term shoreline change rates for the complete shoreline of Saudi Arabia for the period 1984-2016. The mean shoreline change rate for the entire shoreline of Saudi Arabia is 0.06 m/yr. For the Saudi Arabian coast 29% shows shoreline retreat larger than 0.5 m/yr (i.e., the threshold for stable vs. unstable shorelines as per the inherent accuracy level associated with the SDS approach), while 23% show accretive behavior with change rates larger than 0.5 m/yr. The remaining 48% of the shoreline falls under the category of stable shorelines. As the Saudi Arabian Red Sea and Gulf coasts are different in terms of forcing and physical characteristics, results are discussed separately for the Red Sea and Gulf coast using 5-km averaged change rates as presented in Figure 1.
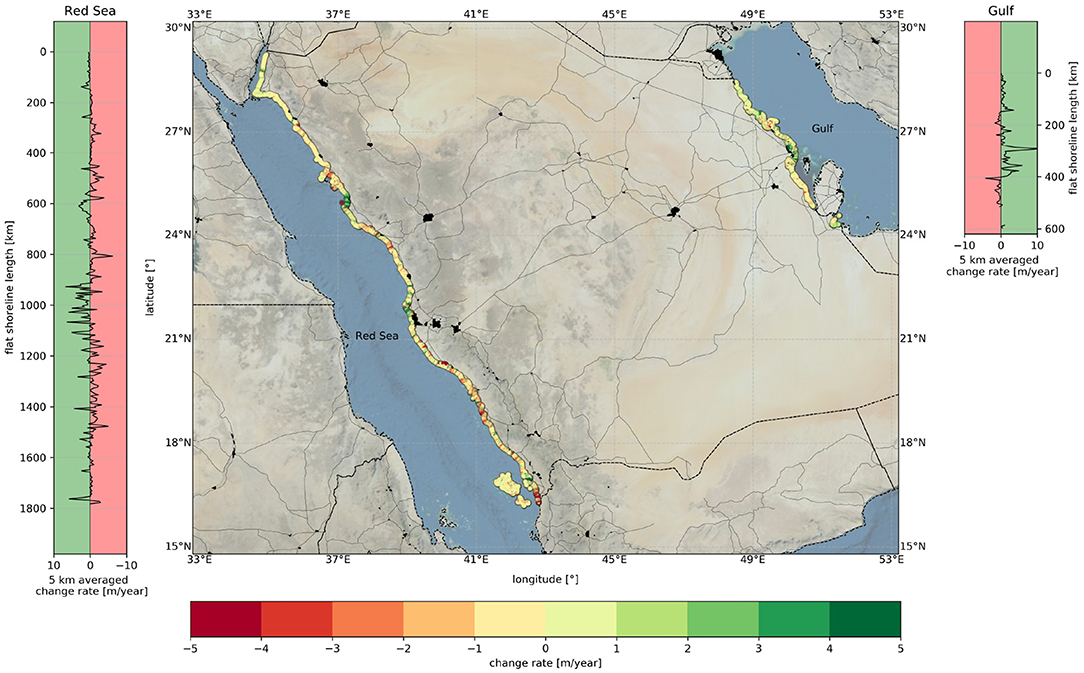
Figure 1. The center panel contains satellite derived annual shoreline change rates for the Saudi Arabian Red Sea and Gulf coast (1984-2016). Urban areas are indicated in black and the road network with thin black lines. Five-kilometer averaged change rates are shown on flat shoreline stretches for the Red Sea (left panel) and the Gulf (right panel). For all panels, negative indicates long-term retreat and positive indicates prograding.
The Saudi Arabian part of the Red Sea coast (including the Gulf of Aqaba) stretches along approximately 1760 km of shoreline. The mean change rate of all transects at the Red Sea coast is retreating with a rate of –0.18 m/year (i.e., retreating). About 19% (334 km) of the Red Sea coast shows a prograding trend, while 32% (563 km) of the coast show a retreating trend. The remaining 49% (863 km) of shoreline is stable.
The Saudia Arabian part of the Gulf coast is approximately 560 km long. The mean change rate of all the Gulf transects is 0.71 m/year (i.e., prograding). About 23% (129 km) exhibits a retreating trend and approximately 32% (179 km) show prograding behavior; the remaining 45% (252 km) of the coast is stable.
The Gulf coast exhibits higher prograding change rates compared to the Red Sea coast (see Figure 1). The prograding sections are also here found around economic centers, due to land reclamations and other human developments, while the retreating sections are often located in nature protected areas. Besides, as seen on the sides of Figure 1, the Red Sea coast contains higher retreating rates for longer shoreline stretches than the Gulf coast. These retreating sections are mostly located at relatively remote areas, whereas the prograding shorelines are typically found at inhabited areas.
To gain more detailed insights into distinctly different behaviors of the Red Sea and Gulf coasts of Saudi Arabia, below (Section 3.2) we perform a more high resolution analysis of a few selected locations on each coast.
3.2. Regional and Local Analysis
3.2.1. Red Sea Coast
Here we focus on 5 locations along the Red Sea coast (see inset in Figure 2). The first location highlights the spatial variations in shoreline behavior, here focusing on differences between an open and a reef-fronted coast. The other four locations are a representative set for the temporal variations of shoreline dynamics found along this coast.
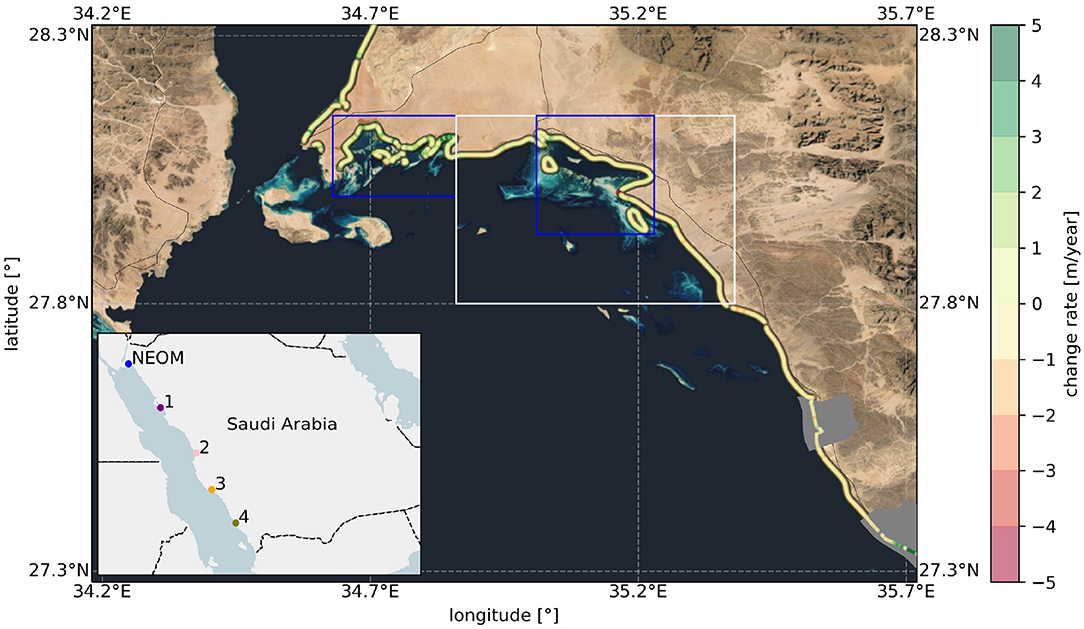
Figure 2. Satellite derived annual shoreline change rates (1984–2016) for the NEOM project site, located on the Red Sea in northwest Saudi Arabia (see blue dot in the small inset). Urban areas (Al Muwaileh and Duba) are marked gray and the road network with thin black lines. The blue polygons indicate reef-fronted coasts, while the white polygon indicates open coasts. All polygons are situated within Ra's Suwayhil/Ra's al-Qasbah Marine Protected Area.
NEOM is a recently announced developments (https://www.neom.com/en-us) which will be located on the Red Sea in northwest Saudi Arabia. The project site, as indicated in Figure 2 (spanning across the blue and white polygons), is characterized by reef-fronted (blue polygons) and open (white polygon) shorelines known to be part of a 3,700 km2 planned Marine Protected Area (MPA) called Ra's Suwayhil/Ra's al-Qasbah. At present, there are practically no human interventions on this pristine shoreline managed by the Saudi Wildlife Authority. The shorelines in the blue and white polygons are 135 km and 42 km long, respectively. The reef-fronted shoreline in the west shows a mean prograding change rate of 0.26 m/year, while the transects at the open coast show a mean retreating change rate of –0.09 m/year (see Figure 2).
For this specific area, it is found that for 88% of the transects the linear regression is a representative proxy to explain long-term behavior of the shoreline. For more detailed analyses it is useful to study the complete time series signals instead of solely looking into linear change rates. Up to this point, the presented analysis is restricted to annual shoreline positions and its associated linear change rates. Therefore, only natural phenomena or processes acting on at least multi-year timescales are incorporated. However, as explained in the last paragraph of the Methodology section, higher temporal resolution shoreline position data can be derived from the SDS dataset. This opens up the possibility to look into behavior at smaller timescales (like seasonality) within the time series signals as well as to extend the time series to 2020. Such a computationally demanding high temporal resolution analysis is performed for four locations along the Red Sea coast, as indicated with numbered, colored dots in the small inset in Figure 2. These locations are selected based on geographical location (nature area vs. developed coast). It gives an overview of the types of time series signals that are present the along the Red Sea shoreline (see Figure 3).
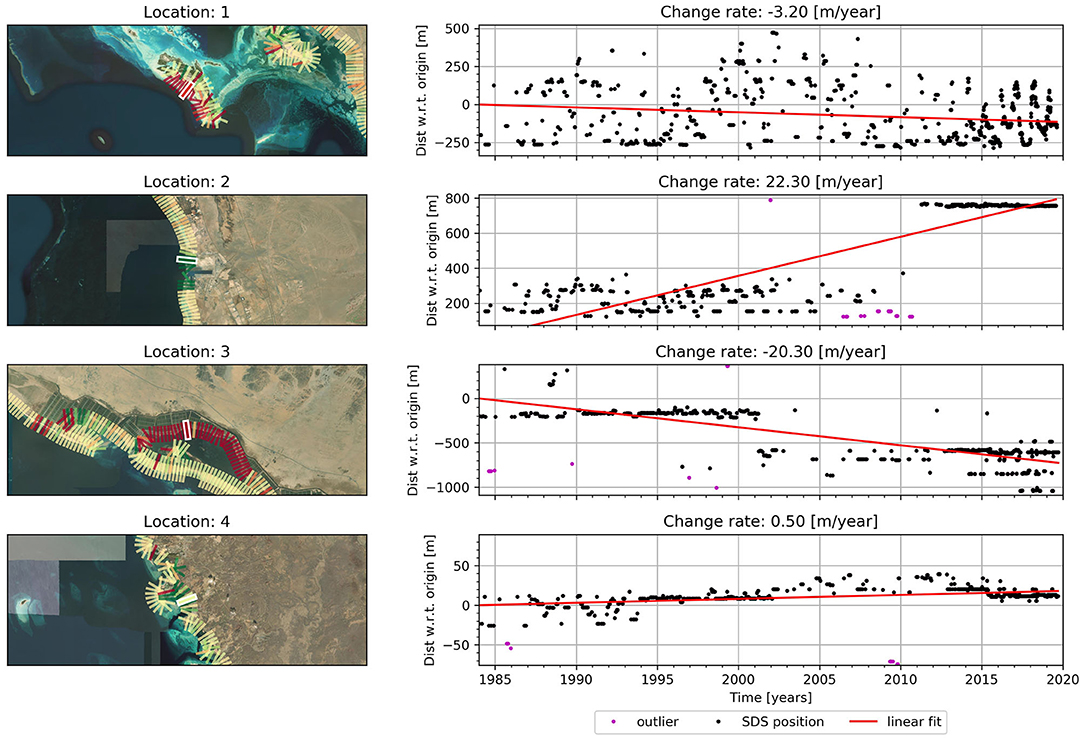
Figure 3. Right panels: high-resolution time series of shoreline positions for the period (1984–2020) for four locations on Saudi Arabia Red Sea coast. The purple dots are identified as outliers following the criteria in Luijendijk et al. (2018). Left panels: geographical location of the selected transect indicated as the white-marked transects.
Location 1 is located on an island in a remote area that contains a pristine coral reef environment. The time series of shoreline change shows a relatively stable long-term trend, albeit with substantial short-term variability. Seasonal cyclic pattern in shoreline position, up to 4~00 m, can be seen in the data from 2015 onward, due to the availability and inclusion of higher temporal resolution data from the Sentinel-2 satellite mission. Location 2 is located close to a coastal settlement. The time series shows a rather stable shoreline with limited temporal variability up to around 2010. A sudden advancement in shoreline position of 6~00 m can be seen in 2010. This is due to land reclamation (including coastal structures), which has stabilized the shoreline thereon. Location 3 is characterized by an area with a lot of aqua cultural activity. This anthropogenic driver is clearly seen to have an effect on the time series signal. Until 2001, when the aqua cultural activities commenced, this shoreline (which is protected by an offshore island and reefs), has been rather stable. However, around 2001, the shoreline retreated markedly by approximately 400 m, however remaining stable in its retreated position thereafter. Location 4 is located in a sheltered reef environment and has been steadily prograding at a rate of 0.5 m/year with limited short-term variability. In the last decade or so, however, the shoreline at this locations appears to have remained stable.
3.2.2. Gulf Coast
Similar to the Red Sea coast, we focus here on 5 locations along the Gulf coast (see inset in Figure 4). The first location highlights the spatial variations in shoreline behavior, here focusing on impacts of human interventions. The other four locations are a representative set for the temporal variations of shoreline dynamics found along this coast.
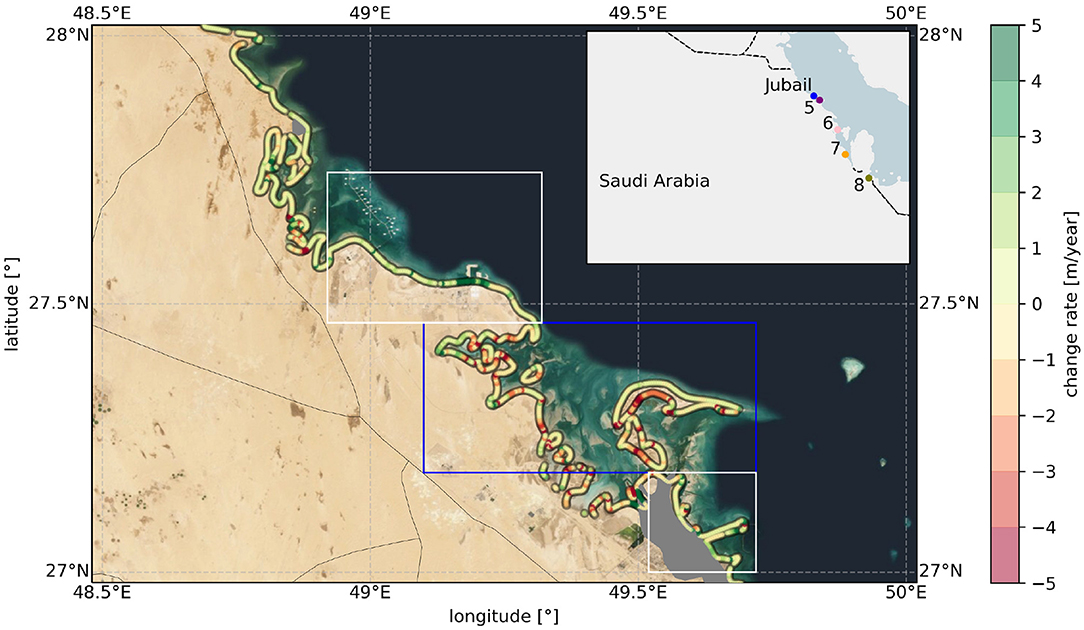
Figure 4. Satellite derived annual shoreline change rates (1984–2016) close to Jubail, located on the Gulf in northeast Saudi Arabia (see blue dot in the small inset). Urban areas (Tanajib and Jubail) are marked grey and the road network with thin black lines. The blue area shows the Jubail Marine Wildlife Sanctuary MPA, while the white polygons indicate areas subject to human interventions.
The Gulf coast of Saudi Arabia has been subjected to large-scale coastal developments, leading to human-engineered systems around its economic centers of Khobar, Dammam and Jubail (see white polygons in Figure 4). Between these economic centers, MPA's ensure human interventions are minimal. One of these MPA's is the 2,300 km2 de facto Jubail Marine Wildlife Sanctuary (see blue polygon in Figure 4), of which the state-owned oil enterprise Saudi Aramco is the managing authority (UNEP-WCMC, 2016). The sanctuary is the first MPA in the Arabian Gulf and consists of two coastal embayment systems and five offshore coral islands (Krupp and Khushaim, 1991). The shoreline in the MPA is 290 km long. Figure 4 shows the satellite derived annual shoreline change rates (1984–2016) in this area. The shoreline in the white polygons shows accretive behavior with a change rate of 1.21 m/year, while the MPA mainly shows shoreline retreat at a rate of -0.77 m/year.
Figure 5 shows the high resolution analysis for four locations along the Gulf coast. Location 5, which is located at a pristine peninsula, shows a cylic, low amplitude (25 m) temporal variability from the year 2013 onward. The years before 2013 indicate a greater, yet non-cylic variability in shoreline positions over time. The time series signal at Location 6 is from a beach that is bounded by two groins and situated in front of a coastal settlement. The data shows a stable trend that incorporates small temporal variability up to around 2003. In 2003, a land reclamation causes a sudden progradation of the shoreline of approximately 150 m. Hereafter, the temporal signal looks similar to its pre-2003 stable state. Location 7 is located at a pristine, undeveloped area. The temporal signal itself shows minor short-term variability while over time the general trend appears to be changing regimes. Up to 1994 it is slightly accretive, then it remains approximately stable for a little less than 10 years. After 2003, the shoreline steadily retreats. Location 8 is also located in an undeveloped area and therefore temporal variability likely caused by environmental forcing conditions. Especially after 2013, the short-term shoreline change becomes noticeably cyclic, as also seen at Location 5.
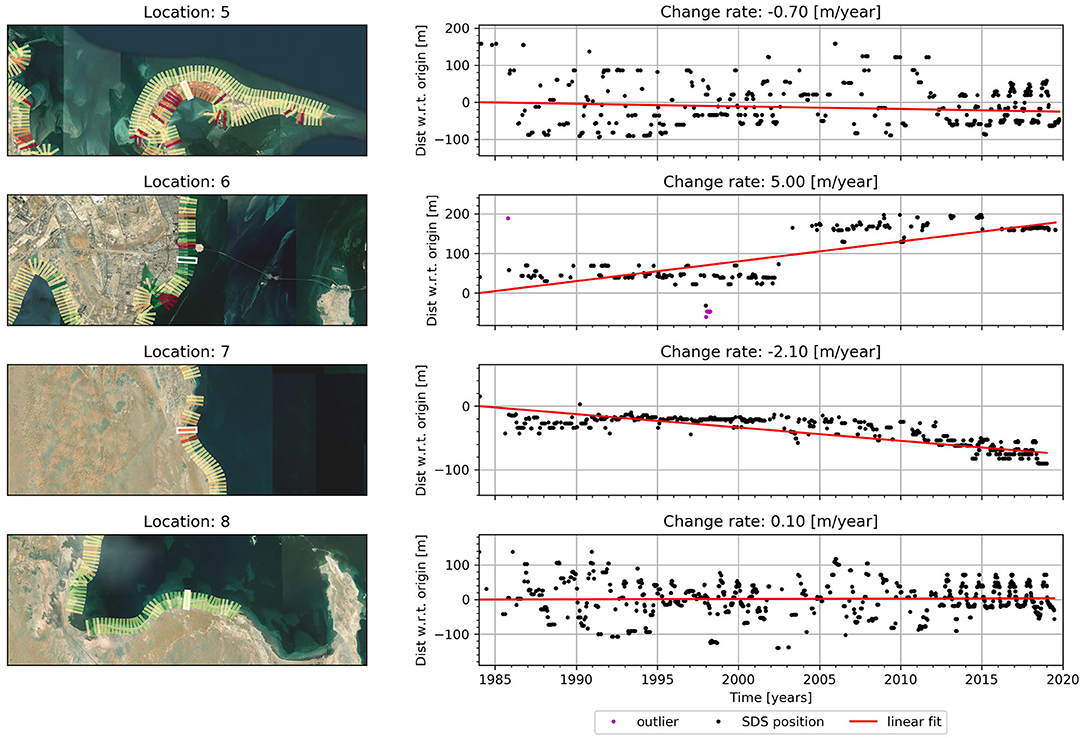
Figure 5. Right panels: high-resolution time series of shoreline positions for the period (1984–2020) for four locations on the Gulf coast of Saudi Arabia. Left panels: geographical location of the selected transect indicated as the white-marked transects.
3.3. Projected Shoreline Changes up to 2100
Timely and sustainable coastal zone management, especially considering the increasing anthropogenic pressure and changing climate, requires knowledge on how shorelines might change in the future, including uncertainties in future projections. The rate of global sea level rise since 1993 has been greater than that observed over the twentieth century (Church, 2013;). While shoreline change can be the combined result of a range of erosive and accretive phenomena, there is a clear cause and effect relationship between increasing sea levels and shoreline retreat (Bruun, 1962; Ranasinghe and Stive, 2009; Stive, 2010; Ranasinghe, 2016). Climate change will also affect waves and storm surge (Hemer, 2013; Vousdoukas et al., 2018; Morim et al., 2019), which are important drivers of coastal morphology. Therefore, considering the dynamics of extreme weather patterns is also important in assessing potential climate change impacts beyond that of sea-level rise (SLR) alone (Vousdoukas et al., 2020). Future shoreline positions, using combined data from Vousdoukas et al. (2020) and Luijendijk et al. (2018) as discussed in section 2.2.2, are projected for both RCP4.5 and RCP8.5 for the years 2050 and 2100. As example, projections for the presently prograding NEOM site in the north part of the Red Sea show a switch to a retreating regime (see Figure 6). Already retreating coastal sections will experience accelerated retreat in the future, which is the case for e.g., Jubail Marine Protected Area (see Figure 6).
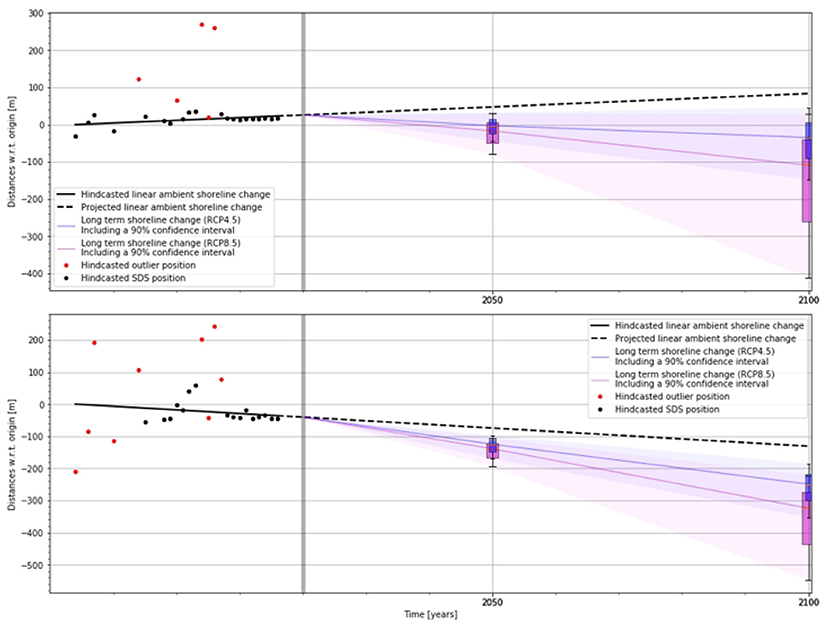
Figure 6. Historic and projected shoreline positions (1984–2100) for two RCP scenarios showing a shift from prograding to retreating for a location at the NEOM site (upper panel) and showing an accelerating retreat at Jubail (lower panel).
3.4. Regional Variations of Future Shoreline Positions
Regional projections of shoreline positions (relative to 2020) for the years 2050 and 2100 for both RCP 4.5 and RCP 8.5 are shown in Figure 7. At the scale of Saudi Arabia as a whole, regional-mean projections of shoreline retreat by 2050 are 29.0 and 32.1 m for RCP 4.5 and RCP 8.5, respectively. By 2100, these retreats increase to 112.9 and 145.5 m under RCP 4.5 and RCP 8.5, respectively.

Figure 7. Projected median shoreline positions (relative to 2020) for the Saudi Arabian Red Sea and Gulf coast for the years 2050 and 2100. The panels on the left show outcomes related to greenhouse gas concentration trajectory RCP4.5, while the panel on the right shows results for RCP8.5. Urban areas are marked black and the road network with thin black lines. For all panels, negative indicate retreating shorelines and positive indicate prograding shorelines.
At the Red Sea coast, regional mean projections indicate that the shoreline will retreat 31.6 m (RCP4.5) to 35.4 m (RCP8.5) in 2050 with respect to present-day shoreline position. For 2100 an additional retreat of 119.1 m (RCP4.5) to 151.7 m (RCP8.5) is projected due to sea level rise. At the Gulf coast, it is projected that on average the shoreline will retreat an additional mean distance of 20.1 m (RCP4.5) to 21.4 m (RCP8.5) in 2050 and 93.7 m (RCP4.5) to 127.2 m (RCP8.5) in 2100 due to sea level rise.
3.5. Future Regime Shifts in Shoreline Stretches
Analyses of future shoreline positions show that sea level rise may lead to a regime shift in shoreline behavior. The historically (1984-2020) retreating 5-km averaged coastline stretches (605 km) at the Red Sea coast will all be subject to an acceleration in the rate of retreat by 2050 (see Figure 8). In addition, a total length of 550 km that has been stable over the last 35 years will be retreating by 2050 for RCP4.5; 595 km for RCP8.5. This means that, regardless of climate scenario, the length of retreating coastline approximately doubles between 2020 and 2050. In 2100, even more of the Red Sea coastline is projected to change from a stable to retreating regime; i.e., additional 655 km and 725 km under RCP 4.5 and RCP 8.5 respectively. The shift from present-day prograding to retreating behavior is expected to occur at a coastline length of 35 km in 2100 for RCP4.5 and 80 km for RCP8.5. Overall, compared to the 32% of the Red sea coastline that has been retreating over the last 35 years, 63 and 66% of the Red Sea coast is projected to be retreating by 2050, increasing to 71 and 77% by 2100.
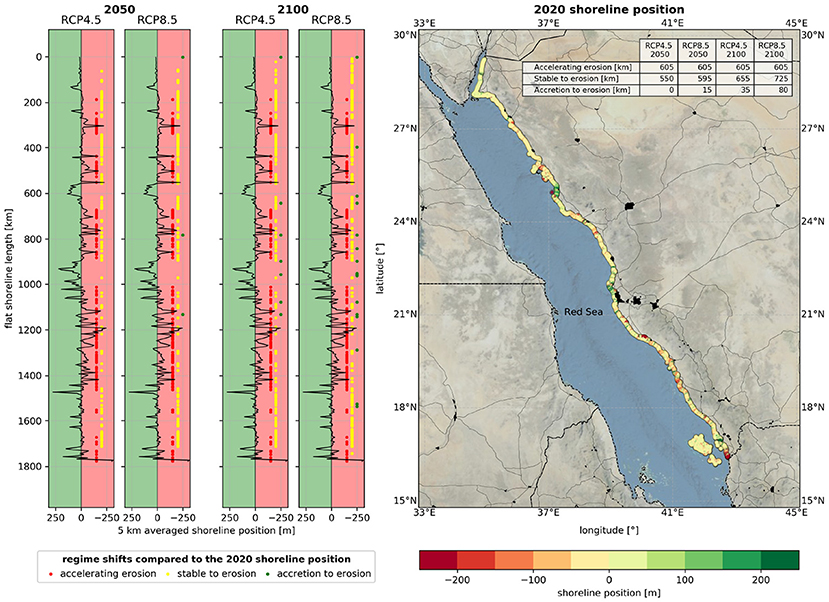
Figure 8. Projected median shoreline positions (relative to 2020) for the Saudi Arabian Red Sea coast for the years 2050 and 2100 for RCP4.5 and RCP8.5. For the map panel, negative indicates retreat and positive indicates prograding trends between 1984 and 2020.
For the Gulf coast, the historically retreating 5-km averaged coastline stretches (105 km) will all be subject to an acceleration retreat rate already in 2050 (see Figure 9). In addition, a total length of 120 km that has been stable over the last 35 years will in 2050 be retreating for scenario RCP4.5; for RCP8.5 this will be a length of 135 km. In 2100 even longer coastline lengths will change from a stable to retreating regime; i.e., 145 km for RCP4.5 and 160 km for RCP8.5. The shift from prograding to retreating behavior is expected to occur at a coastline length of 45 km in 2100 for RCP4.5 and 105 km for RCP8.5. All in all, where nowadays 23% is retreating, in 2050 46% will be retreating in case of RCP4.5 and 54% for RCP8.5, while in 2100 this will be further increased to 57% for RCP4.5 and 70% for RCP8.5. This means that the length of coastline subject to retreat more than triples for the Gulf coast.
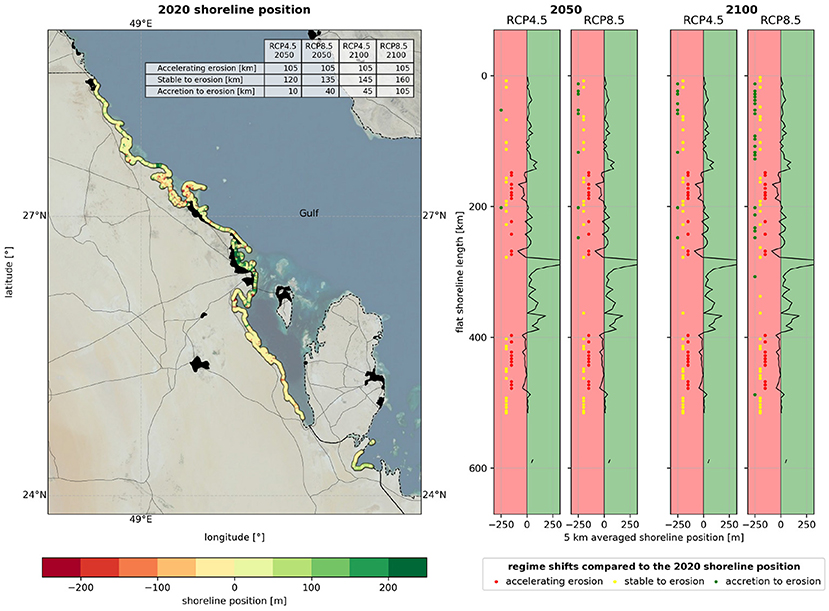
Figure 9. Projected median shoreline positions (relative to 2020) for the Saudi Arabian Gulf coast for the years 2050 and 2100 for RCP4.5 and RCP8.5. For the map panel, negative indicates retreat and positive indicates prograding.
4. Conclusions
This study presented a national assessment of the state of the coast of Saudi Arabia using two state-of-the-art data sets of historical and future shoreline change. At national scale, the shoreline of Saudi Arabia has been stable over the 1985–2016 period with a long-term change rate of 0.06 m/year. At a more granular scale, the Red Sea and Gulf coast of Saudi Arabia show substantial differences in long-term shoreline dynamics over the same historical period. The former has experienced a regional-mean retreat rate of –0.18 m/year, while the latter has experienced a regional-mean progradation rate of 0.71 m/year. A detailed analysis of bi-weekly shoreline positions shows that human interventions in both Red sea and Gulf coasts have changed the natural shoreline dynamics substantially.
At several of the Red Sea locations where the bi-weekly resolution analysis was done, coastal developments appear to accelerate the retreat along adjacent coastlines. Furthermore, reef-fronted coastal sections show a mean prograding behavior, while the nearby open coastal sections show a retreating trend. Shoreline evolution in the Gulf coast behaves rather differently. Here too, human interventions have lead to step-changes in shoreline position at a few coastal sections. The SDS data for the Gulf shows a change rate of 1.21 m/year, while the marine protected areas show a remarkable mean retreat rate of 0.77 m/year. This may be an indication that the economy-driven coastal developments trigger significant erosion in the adjacent (marine protected) areas.
Future projections of shoreline change indicate that large Saudi Arabian shoreline stretches will be subject regime shifts (e.g., stable to retreating) in coastline behavior under both RCP 4.5 and RCP 8.5, and that these regime changes could be taking place already. Projections show that the length of retreating shorelines along the Red sea coast could more than double by 2100 (RCP 8.5), while this length could triple along the Gulf coast by 2100 (RCP 8.5). Considering the entire Saudi Arabian coastline, projections indicate regional-mean retreats of around 30 m and of around 130 m by 2050 and 2100 under both RCPs considered. These projections highlight the need for timely and sustainable coastal zone management, to protect the areas with large economic and ecological values while also ensuring climate resilience in planned or proposed coastal interventions.
Data Availability Statement
Publicly available datasets were analyzed in this study. This data can be found here: https://shorelinemonitor.deltares.nl; https://data.jrc.ec.europa.eu/collection/liscoast.
Author Contributions
AL and RR conceived the idea of the study. AL, EK, and VD co-worked on the analysis and visualization and wrote the manuscript together with RR. RM and IH reviewed the manuscript. All authors contributed to the article and approved the submitted version.
Funding
This research was funded by King Abdullah University of Science and Technology and the Deltares Strategic Research Program Seas and Coastal Zones. RR is partly supported by the AXA Research Fund.
Conflict of Interest
The authors declare that the research was conducted in the absence of any commercial or financial relationships that could be construed as a potential conflict of interest.
Publisher's Note
All claims expressed in this article are solely those of the authors and do not necessarily represent those of their affiliated organizations, or those of the publisher, the editors and the reviewers. Any product that may be evaluated in this article, or claim that may be made by its manufacturer, is not guaranteed or endorsed by the publisher.
References
Al Senafi, F., and Anis, A. (2015). Shamals and climate variability in the northern arabian/persian gulf from 1973 to 2012. Int. J. Climatol. 35, 4509–4528. doi: 10.1002/joc.4302
Athanasiou, P., van Dongeren, A., Giardino, A., Vousdoukas, M., Gaytan-Aguilar, S., and Ranasinghe, R. (2019). Global distribution of nearshore slopes with implications for coastal retreat. Earth Syst. Sci. Data 11, 1515–1529. doi: 10.5194/essd-11-1515-2019
Barlett, K (2004). Dust storm forecasting for al udeid ab, qatar: an empirical analysis. Master Thesis, Air Force Institute of Technology, Wright-Patterson Air Force Base, Ohio.
Bruun, P (1962). Sea-Level Rise as a Cause of Shore Erosion. J. Waterw. Harb. Coast. Eng. Div. 8, 117–130. doi: 10.1061/jwheau.0000252
Church, J. A., Clark, P. U., Cazenave, A., Gregory, J. M., Jevrejeva, S., Levermann, A., et al (2013). Sea Level Change. Cambrige: Cambridge University Press. p.385
Donchyts, G., Baart, F., Winsemius, H., Gorelick, N., Kwadijk, J., and van de Giesen, N. (2016). Earth's surface water change over the past 30 years. Nat. Clim. Chang 6, 810–813. doi: 10.1038/nclimate3111
Elshorbagy, W., Azam, M., and Taguchi, K. (2006). Hydrodynamic characterization and modeling of the arabian gulf. J. Waterway Port Coastal Ocean Eng. 132, 47–56. doi: 10.1061/(ASCE)0733-950X(2006)132:1(47)
Hagenaars, G., de Vries, S., Luijendijk, A. P., de Boer, W. P., and Reniers, A. J. H. M. (2017). On the accuracy of automated shoreline detection derived from satellite imagery: a case study of the sand motor mega-scale nourishment. Coastal Eng. 133, 113–125. doi: 10.1016/j.coastaleng.2017.12.011
Halpern, B. S., Walbridge, S., Selkoe, K. A., Kappel, C. V., Micheli, F., D'Agrosa, C., et al. (2008). A global map of human impact on marine ecosystems. Science 319, 948–952. doi: 10.1126/science.1149345
Hemer, M., Fan, Y., Mori, N., Semedo, A., and Wang, X. L. (2013). Projected changes in wave climate from a multi-model ensemble. Nat. Clim. Chang. 3, 471–476. doi: 10.1038/nclimate1791
IPCC (2019). Climate Change and Land: an IPCC special report on climate change, desertification, land degradation, sustainable land management, food security, and greenhouse gas fluxes in terrestrial ecosystems eds P.R. Shukla, J. Skea, E. Calvo Buendia, V. Masson-Delmotte, H.-O. Pörtner, D. C. Roberts, P. Zhai, R. Slade, S. Connors, R. van Diemen, M. Ferrat, E. Haughey, S. Luz, S. Neogi, M. Pathak, J. Petzold, J. Portugal Pereira, P. Vyas, E. Huntley, K. Kissick, M. Belkacemi, J. Malley.
Jackson, L. P., and Jevrejeva, S. (2016). A probabilistic approach to 21st century regional sea-level projections using rcp and high-end scenarios. Glob. Planet. Change 146, 179–189. doi: 10.1016/j.gloplacha.2016.10.006
Kamranzad, B (2018). Persian gulf zone classification based on the wind and wave climate variability. Ocean Eng. 169, 604–635. doi: 10.1016/j.oceaneng.2018.09.020
Langodan, S., Cavaleri, L., Pomaro, A., Vishwanadhapalli, Y., Bertotti, L., and Hoteit, I. (2017). The climatology of the red sea part 2: the waves. Int. J. Climatol. 37, 4518–4528. doi: 10.1002/joc.5101
Langodan, S., Cavaleri, L., Portilla, J., Abualnaja, Y., and Hoteit, I. (2020). Can we extrapolate climate in an inner basin? the case of the red sea. Glob. Planetary Change 188:1035151. doi: 10.1016/j.gloplacha.2020.103151
Luijendijk, A., Hagenaars, G., Ranasinghe, R., Baart, F., Donchyts, G., and Aarninkhof, S. (2018). The state of the world's beaches. Sci. Rep. 8:6641. doi: 10.1038/s41598-018-24630-6
Meinshausen, M. S. S. C. K. (2011). The rcp greenhouse gas concentrations and their extensions from 1765 to 2300. Clim. Change 109:213. doi: 10.1007/s10584-011-0156-z
Mentaschi, L., Vousdoukas, M., Pekel, J.-F., Voukouvalas, E., and Feyen, L. (2018). Global long-term observations of coastal erosion and accretion. Sci. Rep. 8:12876. doi: 10.1038/s41598-018-30904-w
Morim, J., Hemer, M., Wang, X. L., Cartwright, N., Trenham, C., Semedo, A., et al. (2019). Robustness and uncertainties in global multivariate wind-wave climate projections. Nat. Clim. Chang. 9, 711–718. doi: 10.1038/s41558-019-0542-5
Muis, S., Verlaan, M., Winsemius, H., Aerts, J., and Ward, P. (2016). A global reanalysis of storm surges and extreme sea levels. Nat. Commun. 7:11969. doi: 10.1038/ncomms11969
Otsu, N (1979). Threshold selection method from gray-level histograms. IEEE Trans. Syst. Man. Cybern. 9, 62–66. doi: 10.1109/TSMC.1979.4310076
Rakha, K., Al-Salem, K., and Neelamani, S. (2007). Hydrodynamic atlas for the arabian gulf. J. Coastal Res. 550–554.
Ranasinghe, R., and Stive, M. (2009). Rising seas and retreating coastlines. Clim. Change. 97, 465–468. doi: 10.1007/s10584-009-9593-3
Ranasinghe, R. W. M. R. J. B (2016). Assessing climate change impacts on open sandy coasts: A review. Earth Sci. Rev. 160, 320–332. doi: 10.1016/j.earscirev.2016.07.011
Rao, P. G., Al Sulaiti, M., and Al Mulla, A. H. (2001). Winter shamals in qatar, arabian gulf. Weather 56, 444–451. doi: 10.1002/j.1477-8696.2001.tb06528.x
Reynolds, R (1993). Physical oceanography of the Gulf, Strait of Hormuz, and the Gulf of Oman-Results from the Mt Mitchell expedition. Mar. Pollut. Bull. 27, 35–59. doi: 10.1016/0025-326x(93)90007-7
Sheppard, C., Al-Husiani, M., Al-Jamali, F., Al-Yamani, F., Baldwin, R., Bishop, J., et al. (2010). The gulf: a young sea in decline. Mar. Pollut. Bull. 60, 13–38. doi: 10.1016/j.marpolbul.2009.10.017
Stive, M. J., Ranasinghe, R., and Cowell, P. J. (2010). “Sea level rise and coastal erosion,” in Handbook of Coastal and Ocean Engineering, eds Y. C. Kim (Los Angeles, LA: California University Press), 1023–1037.
Vousdoukas, M., Mentaschi, L., Voukouvalas, E., Verlaan, M., Jevrejeva, S., Jackson, L., et al. (2018). Global probabilistic projections of extreme sea levels show intensification of coastal flood hazard. Nat. Commun. 9:2360. doi: 10.1038/s41467-018-04692-w
Vousdoukas, M. I., Ranasinghe, R., Mentaschi, L., Plomaritis, T. A., Athanasiou, P., Luijendijk, A., et al. (2020). Sandy coastlines under threat of erosion. Nat. Clim. Chang 10, 260–263. doi: 10.1038/s41558-020-0697-0
Weatherall, P., Marks, K., Jakobsson, M., Schmitt, T., Tani, S., Arndt, J. E., et al. (2015). A new digital bathymetric model of the world's oceans. Earth Space Sci. 2, 331–345. doi: 10.1002/2015EA000107
Keywords: shoreline dynamics, sea level rise (SLR), Saudi Arabia, regime shift, coastal erosion, Persian Gulf, Arabian Gulf
Citation: Luijendijk AP, Kras E, Dagalaki V, Morelissen R, Hoteit I and Ranasinghe R (2022) Regime Shifts in Future Shoreline Dynamics of Saudi Arabia. Front. Mar. Sci. 8:798657. doi: 10.3389/fmars.2021.798657
Received: 20 October 2021; Accepted: 13 December 2021;
Published: 05 January 2022.
Edited by:
Giandomenico Foti, Mediterranea University of Reggio Calabria, ItalyReviewed by:
Giovanni Besio, University of Genoa, ItalyHumood Naser, University of Bahrain, Bahrain
Copyright © 2022 Luijendijk, Kras, Dagalaki, Morelissen, Hoteit and Ranasinghe. This is an open-access article distributed under the terms of the Creative Commons Attribution License (CC BY). The use, distribution or reproduction in other forums is permitted, provided the original author(s) and the copyright owner(s) are credited and that the original publication in this journal is cited, in accordance with accepted academic practice. No use, distribution or reproduction is permitted which does not comply with these terms.
*Correspondence: Arjen Pieter Luijendijk, YS5wLmx1aWplbmRpamtAdHVkZWxmdC5ubA==