 Dongyoung Kim1
 Rubao Ji2
 Hyun Je Park3
 Zhixuan Feng4
 Jaebin Jang1
 Chung l Lee3
 Yun-Ho Kang1
 Chang-Keun Kang1*
- 1School of Earth Sciences and Environmental Engineering, Gwangju Institute of Science and Technology, Gwangju, South Korea
- 2Department of Biology, Woods Hole Oceanographic Institution, Falmouth, MA, United States
- 3Department of Marine Bioscience, Gangneung-Wonju National University, Gangneung, South Korea
- 4State Key Laboratory of Estuarine and Coastal Research, School of Marine Sciences, Institute of Eco-Chongming, East China Normal University, Shanghai, China
A subpolar front (SPF) generated between the East Korea Warm Current (EKWC) and the North Korea Cold Current (NKCC) in the western margin of the East/Japan Sea has shifted northward in recent decades. This study investigated the biomass and composition of the phytoplankton assemblage in relation to hydrological and biogeochemical features in the shallow shelf and slope off the Korean coast from January to June in 2016 and 2017, to determine the mechanistic effects of SPF on spring–summer phytoplankton bloom dynamics. Monthly average depth-integrated chlorophyll a (Chl a) levels and the contribution of phytoplankton classes revealed bimodal diatom blooms in early spring and summer in the frontal zone. Canonical correspondence analysis showed that the distribution of high Chl a was associated with cold, low-salinity NKCC water in March 2016. No Chl a peak was observed in March 2017 when the warm saline EKWC water mass invaded. These results suggest that the NKCC intrusion acts as a forcing mechanism leading to enhanced phytoplankton biomass in the frontal zone. In contrast, positive correlations of Chl a concentration with water density and nutrient concentrations suggest that summer blooms were fed by the subsurface chlorophyll maximum (SCM) driven by shoaling of the pycnocline and nitracline. Varying water-column stratification determined the thickness of the SCM layer, driving year-to-year variability in the magnitude of diatom blooms. These findings further suggest that seasonal/interannual variability in the timing of algal blooms affects regional trophodynamics and hence could be an important factor in explaining ecosystem changes in this region.
Introduction
Nearshore surface water (<200 m water depth) in the western margin of the East/Japan Sea (EJS) is separated by a persistent subpolar front (SPF) into two hydrographically distinct regions: a relatively cold and fresh subpolar region to the north and a warm and saline subtropical region to the south (Lee et al., 2009, 2016). The front is formed when the northward-flowing East Korea Warm Current (EKWC) encounters the southward-flowing North Korea Cold Current (NKCC) near the Korean east coast between 36 and 40°N, and then veers east to the open ocean (Yun et al., 2004; Kim and Min, 2008; Lee et al., 2016). The intensity and position of the SPF vary seasonally and interannually, largely due to a variation of the EKWC and surface forcing (Park et al., 2007). The SPF is generally stronger and located further south during winter, but becomes weaker and moves northward during summer. The position of the SPF also varies at interannual and longer time scales (Teague et al., 2004; Park et al., 2007), and this variability appears stronger in the western segment of the front due to a more direct influence of EKWC variability (Park et al., 2007).
The narrow shelf region along the mid-eastern Korean coast (Figure 1), located at the inception of the SPF, is highly dynamic both hydrodynamically and biologically. Regional physicochemical properties of the water mass and water-column structure are mainly regulated by the position of the SPF (Park et al., 2004; Yoo and Kim, 2004). The northward-flowing EKWC water is warm, more saline and oligotrophic, and tends to remain above the southward-flowing NKCC, which entrains cold, nutrient-rich water into the subsurface layer of the shelf. The confluence of these two water masses induces sharp spatial gradients in physical and biogeochemical features across the frontal region (Yun et al., 2004; Kim and Min, 2008; Kwon et al., 2019). Consequently, a shift of the SPF is expected to affect the structure and function of the regional ecosystem, including primary productivity, phytoplankton community composition, and trophodynamics (Park et al., 1991; Moon et al., 1998; Tian et al., 2006).
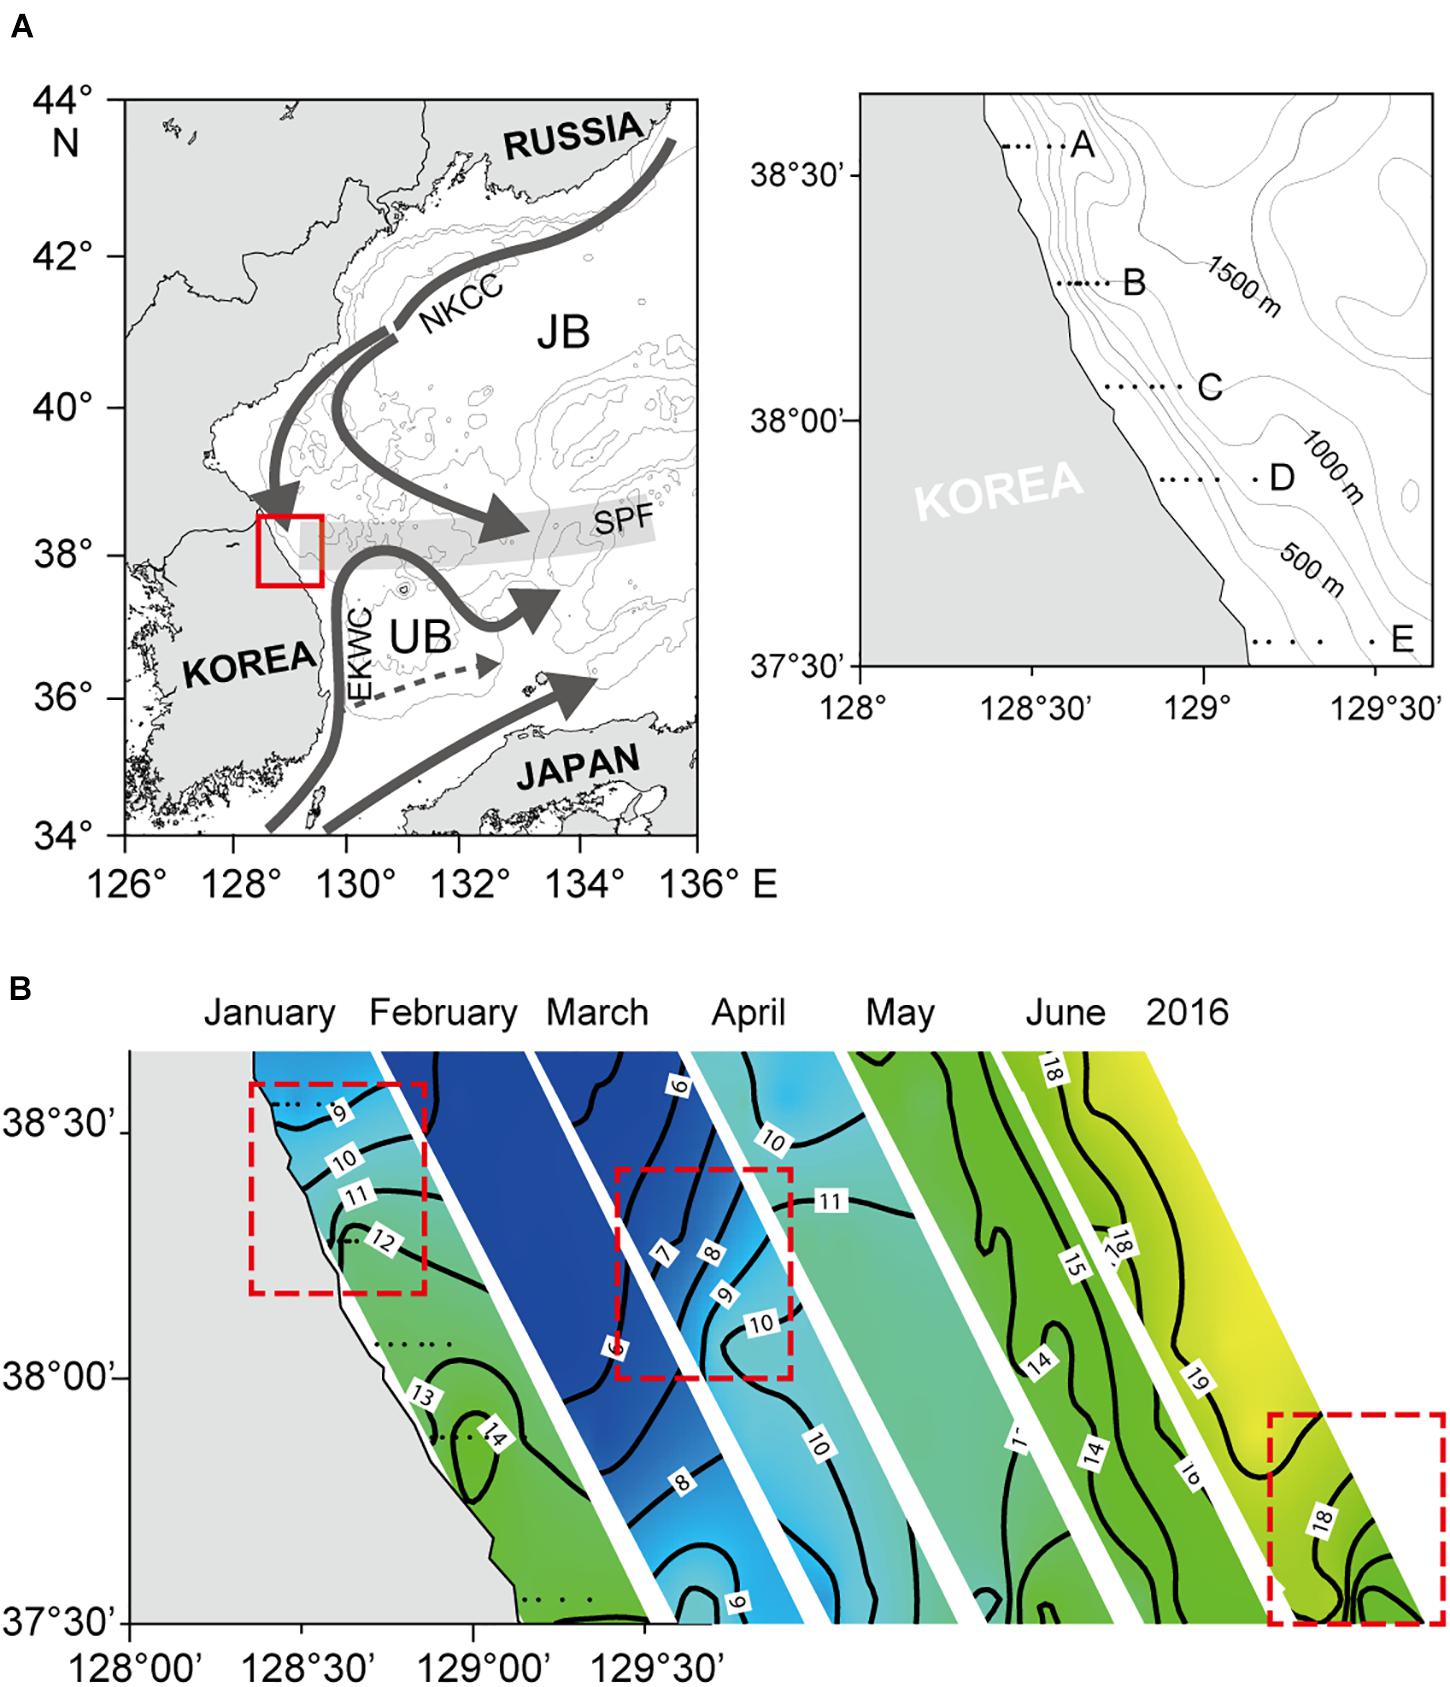
Figure 1. Map showing the study area in the East/Japan Sea. (A) Sampling location marked by the red square (left) and five observation transects (right). NKCC, North Korean Cold Current; EKWC, East Korean Warm Current; SPF, Subpolar front; JB, Japan Basin; UB, Ulleung Basin. (B) Horizontal distribution of sea surface temperature (SST) during winter–summer 2016. A sharp longitudinal SST gradient indicates that SPFs were formed in January–March 2016. Areas enclosed in the red-dotted lines represent the locations of SPFs.
Considerable research has been conducted in the EJS to understand the biological and physical mechanisms responsible for regional productivity patterns and their variability. Many of the studies focus on phytoplankton biomass and primary productivity in the southwestern EJS, including the Korean coastal region and the Ulleung Basin (UB) (Hyun et al., 2009; Kwak et al., 2013a,b, 2017; Ji et al., 2019), while a few studies directly target the SPF, although mostly in the open ocean (Kang et al., 2004; Kim et al., 2010). Additionally, most studies on phytoplankton blooms and productivity in the EJS have analyzed remote sensing data (Yamada et al., 2004; Joo et al., 2016; Park et al., 2020), and very few were based on in situ measurements of multiple physical and biogeochemical variables (Kwak et al., 2013a,b, 2017). So far, no study has been reported on the ecological impact of the SPF in the nearshore region based on a comprehensive in situ observation program.
Consistent with satellite observations (Park et al., 2020), field measurements in the UB demonstrated that phytoplankton blooms are closely associated with the shallow surface mixed-layer depth (due to shoaling of the thermocline) and thereby nitrate-repletion conditions in the euphotic zone (Kwak et al., 2013a; Son et al., 2014). When the water column is strongly stratified, primary production peaks at the subsurface chlorophyll maximum (SCM), reflecting nitrate supply from nutrient-replete cold water (Kwak et al., 2013b, 2014). In contrast, other studies showed that once upwelling brings nutrient-replete subsurface water to the southwest coast of the EJS, the EKWC transports nutrient-rich coastal water into the northern and then the central UB, thus expanding the area of high primary productivity and phytoplankton blooms (Shin et al., 2005; Hyun et al., 2009; Yoo and Park, 2009). This indicates the importance of nutrient advection in promoting phytoplankton growth.
This study examined the spring–summer dynamics of phytoplankton blooms and their taxonomic composition to improve our understanding of frontal ecosystem function in the mid-west shelf of the EJS. Nutrient availability in association with water-column stability is known to alter the composition of phytoplankton communities (Chang et al., 2003; Bel Hassen et al., 2009a,b; Kwak et al., 2017). We thus hypothesized that the NKCC intrusion beneath an oligotrophic surface layer would strengthen stratification, enrich nitrate (NO3–) in the euphotic layer, and finally promote chlorophyll a (Chl a) standing stock on the Korean mid-east continental shelf. To test this hypothesis, monthly field measurements of physical and biogeochemical variables and determination of phytoplankton biomass and community composition were conducted over two consecutive annual cycles. To our knowledge, it is the first time that we have a comprehensive study in the region because a less accessibility due to its proximity to the coastal area of North Korea has prevented data collection.
Materials and Methods
Study Site and Hydrographic Sampling
Sampling and field observations were conducted monthly from January to June in 2016 and 2017 on board the R/V Tamgu 12 at a total of 30 stations along five cross-shelf transects across the narrow continental shelf and slope (37–38°N to 128–129°E) off the east coast of the Korean Peninsula (Figure 1). At each station, a conductivity/temperature/depth, CTD, sensor (SBE 911 Plus CTD, Seabird Electronics Inc., Bellevue, WA), mounted on a SBE 32 Carousel water sampler supporting 12 Niskin (5 l) bottles, was deployed to record vertical profiles of temperature and conductivity. Water samples for dissolved inorganic nutrients, particulate organic matter, and photopigment analysis were collected from four depths (0, 20, 50, and 100 m) selected based on the water-column density structure. Water samples for nutrient analysis were filtered under low vacuum through 25-mm diameter, precombusted (450°C, 2 h) Whatman GF/F glass-fiber filters (0.7–1 μm nominal pore size), and the filtrate was transferred to 30-ml, acid-washed, polypropylene screw-capped centrifuge tubes and immediately stored at –20°C until laboratory analysis. Water samples (500 ml) for particulate organic carbon and nitrogen (POC and PON, respectively) measurements and for photopigment analysis (1–2 l) were filtered under low vacuum onto precombusted (450°C for 2 h) Whatman GF/F filters (25 and 47 mm in diameter, respectively). Filters were wrapped in aluminum foil and frozen immediately (–20°C) for subsequent laboratory analysis.
Nutrient Analysis
In the laboratory, water samples were thawed overnight at low temperature (2°C) and brought to room temperature prior to analysis. Concentrations of phosphate (PO4–), ammonium (NH4+), nitrite (NO2–), nitrate (NO3–), and silicate [Si(OH)4] were determined colorimetrically using a QuAAtro nutrient analyzer (SEAL Analytical GmbH, Norderstedt, Germany). Measurements were made according to practical manuals for use of the Autoanalyzer: PO43– (Murphy and Riley, 1962), NO2–, NO3–, and Si(OH)4 (Hansen and Grasshoff, 1983), and NH4+ (Helder and de Vries, 1979).
Photosynthetic Pigment Analysis by High-Performance Liquid Chromatography
To extract photosynthetic pigments, the 47-mm Whatman GF/F filters were soaked in 95% methanol (5 ml) at –4°C for 12 h in the dark. They were cut into small pieces, ground, and then sonicated for 5 min to disrupt the cells. The extracted solution was centrifuged to eliminate cellular and suspended filter debris. Aliquots (1 ml) of the supernatants were filtered through 0.45-μm polytetrafluoroethylene syringe filters and mixed with 300 μl of water before analysis. A Shimadzu LC-20A HPLC system (Shimadzu, Kyoto, Japan) equipped with a Waters Symmetry C8 (4.6 mm × 150 mm; 3.5 μm particle size; 100 Å pore size) column (Waters, Milford, MA, United States) was used to determine photosynthetic pigments according to Zapata et al. (2000). Canthaxanthin was used as an internal standard during analysis. To avoid chemical decomposition of pigments, the autosampler was cooled down to 5°C. Linear and step binary gradient profiles were adjusted to separate pigments; the flow rate was held constant at 1 ml min–1. Photosynthetic pigments were detected and quantified at an absorbance of 436 nm wavelength and/or fluorescence detection (excitation, 432 nm; emission, 650 nm). Commercially available external standards acquired from Sigma-Aldrich Ltd., (St Louis, MO, United States) and the Danish Hydraulic Institute (DHI, Hørsholm, Denmark) were used for peak identification and quantification. Sample peaks were identified based on their retention times compared with those of standards and used for CHEMTAX (CHEMical TAXonomy) analysis. The concentrations of standard pigments were obtained by spectrophotometry using known specific extinction coefficients (Jeffrey, 1997). More detailed procedures on the use of organic solvents for optimal separation of all pigments, their calibration, and subsequent quantification followed the study by Kwak et al. (2017).
Chemotaxonomic Identification of Phytoplankton Groups
The abundance of individual phytoplankton classes relative to total Chl a in a water sample was calculated using CHEMTAX (v. 1.951), which allows estimating phytoplankton composition from HPLC pigment data (Mackey et al., 1996; Wright et al., 1996). A steepest descent algorithm is employed to optimize the ratios of biomarker pigments to Chl a to calculate the proportion of Chl a concentration attributed to each class in the phytoplankton community. Previously published marker pigment: Chl a ratios for phytoplankton classes collected around the Korean peninsula were applied to initial pigment ratio matrices (Supplementary Table 1) and modified iteratively using CHEMTAX to minimize the sums of squares of differences between observed and calculated pigment concentrations (Lee et al., 2011). Eight different phytoplankton classes were uploaded for an initial CHEMTAX configuration: prasinophytes, chlorophytes, prymnesiophytes (typically coccolithophores), pelagophytes, dinoflagellates, cryptophytes, cyanobacteria, and diatoms. The data matrix included concentrations of diagnostic biomarker pigments: peridinin, 19′-butanoyloxy-fucoxanthin, fucoxanthin, 19′-hexanoyloxy-fucoxanthin, neoxanthin, prasinoxanthin, violaxanthin, alloxanthin, lutein, zeaxanthin, and Chl b. Final results are presented in terms of the absolute concentrations (μg l–1) of Chl a attributed to each phytoplankton class in a sample.
Statistical Analysis
Prior to performing statistical analyses, the normality of the data was evaluated using the Shapiro–Wilk test and homogeneity of variance was tested using Levene’s procedure. Depth-integrated Chl a concentrations were log-transformed to meet normality criteria. Because this transformation did not satisfy subsequent homogeneity of variance, a Kruskal–Wallis non-parametric test was used to test for significant differences in the monthly Chl a concentration, followed by a Dunn’s post hoc multiple comparison test. These tests were performed using IBM SPSS statistics software (v. 22.0, IBM Corp., Armonk, NY, United States). Canonical correspondence analysis (CCA) was employed to evaluate plausible relationships between the variability of phytoplankton classes (expressed in terms of Chl a concentration) and hydrological and biogeochemical parameters (temperature, salinity, density, NO3–, Si(OH)4, PO43– concentrations, and nitrogen:phosphorus, N:P, ratio). A subsequent Monte Carlo permutation test was used to assess the statistical significance of CCA results. CCA was performed using CANOCO statistical software (v. 4.5) (Ter Braak and Smilauer, 2002).
Results
Phytoplankton Bloom Dynamics
Monthly mean values of depth-integrated Chl a concentration during the study period displayed bimodal peaks in March (63.7 ± 39.3 mg m–2, mean ± 1SD) and June (105.9 ± 66.8 mg m–2) 2016, whereas no conspicuous peaks were observed in 2017 (Kruskal–Wallis test, P < 0.001; Dunn’s multiple comparison test, P < 0.05; Figure 2). The high coefficients of variation (62.1% in March and 63.1% in June 2016) during the blooms also showed a wide spatial variation, as indicated in cross-shelf transects (Supplementary Figure 1A). Variation in the spatial distribution of depth-integrated Chl a concentration was limited in March and June 2017, as was that in the remaining months of 2016 and 2017 (Supplementary Figure 1B). Chlorophyll a concentrations peaked in the surface layer (0–20 m) along nearshore, shallow stations parallel to the coastline in March 2016 and in the subsurface layer (20–50 m) across cross-shelf transects in June 2016. To relate the observed phytoplankton blooms to oceanographic conditions with and without SPF, hydrological and biogeochemical features in association with biomass (Chl a) and chemotaxonomic composition of phytoplankton in March and June 2016 were compared with those in both months of 2017 when equivalent blooms were not detected.
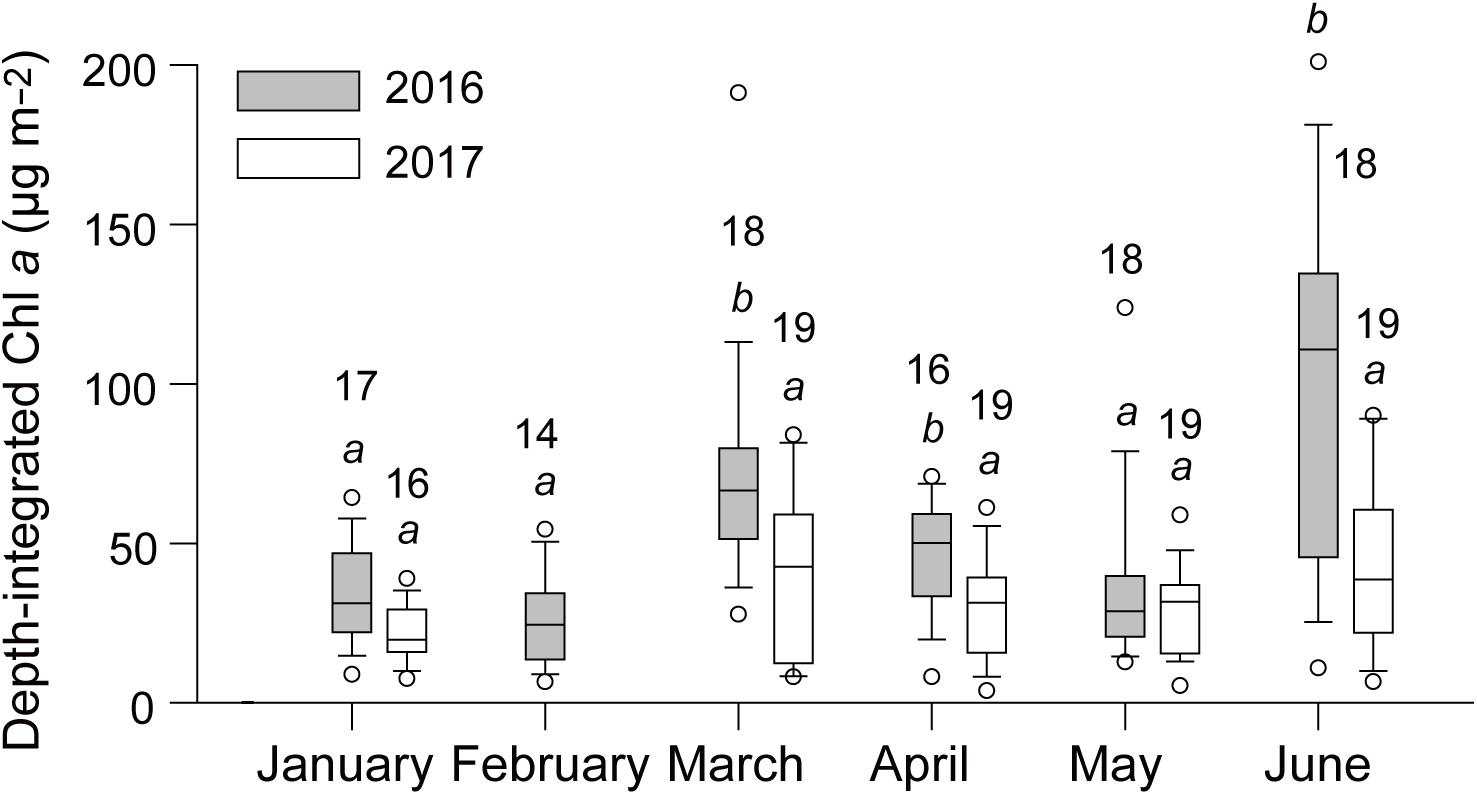
Figure 2. Seasonal and interannual variability in depth-integrated chlorophyll a (Chl a) concentrations. The box and whisker plots represent the median values (horizontal line in the boxes) and the smallest (10%) and largest (90%) values. The same letters indicate no significant difference among medians as determined by a Kruskal–Wallis test followed by Dunn’s post hoc multiple comparison test.
March 2016 and 2017
In March 2016, vertical profiles of physical variables (i.e., temperature, salinity, and density, σt) across the north–south transect indicated that the SPF formed between stations B1 and D1 (Figures 3A–C). The water column was well mixed at the northern stations, but was stratified with a distinct thermocline at a depth of 30 m at the southern stations. Spatial variation in salinity was more pronounced, ranging from < 33.9 at the northern stations to > 34 at the shallow (< 30 m depth) southern stations. Salinity below the thermocline at the latter stations was very similar to that (∼33.9) at the former stations. Accordingly, isopycnal lines were tilted from the surface to deep layers toward the south along the north–south transects.
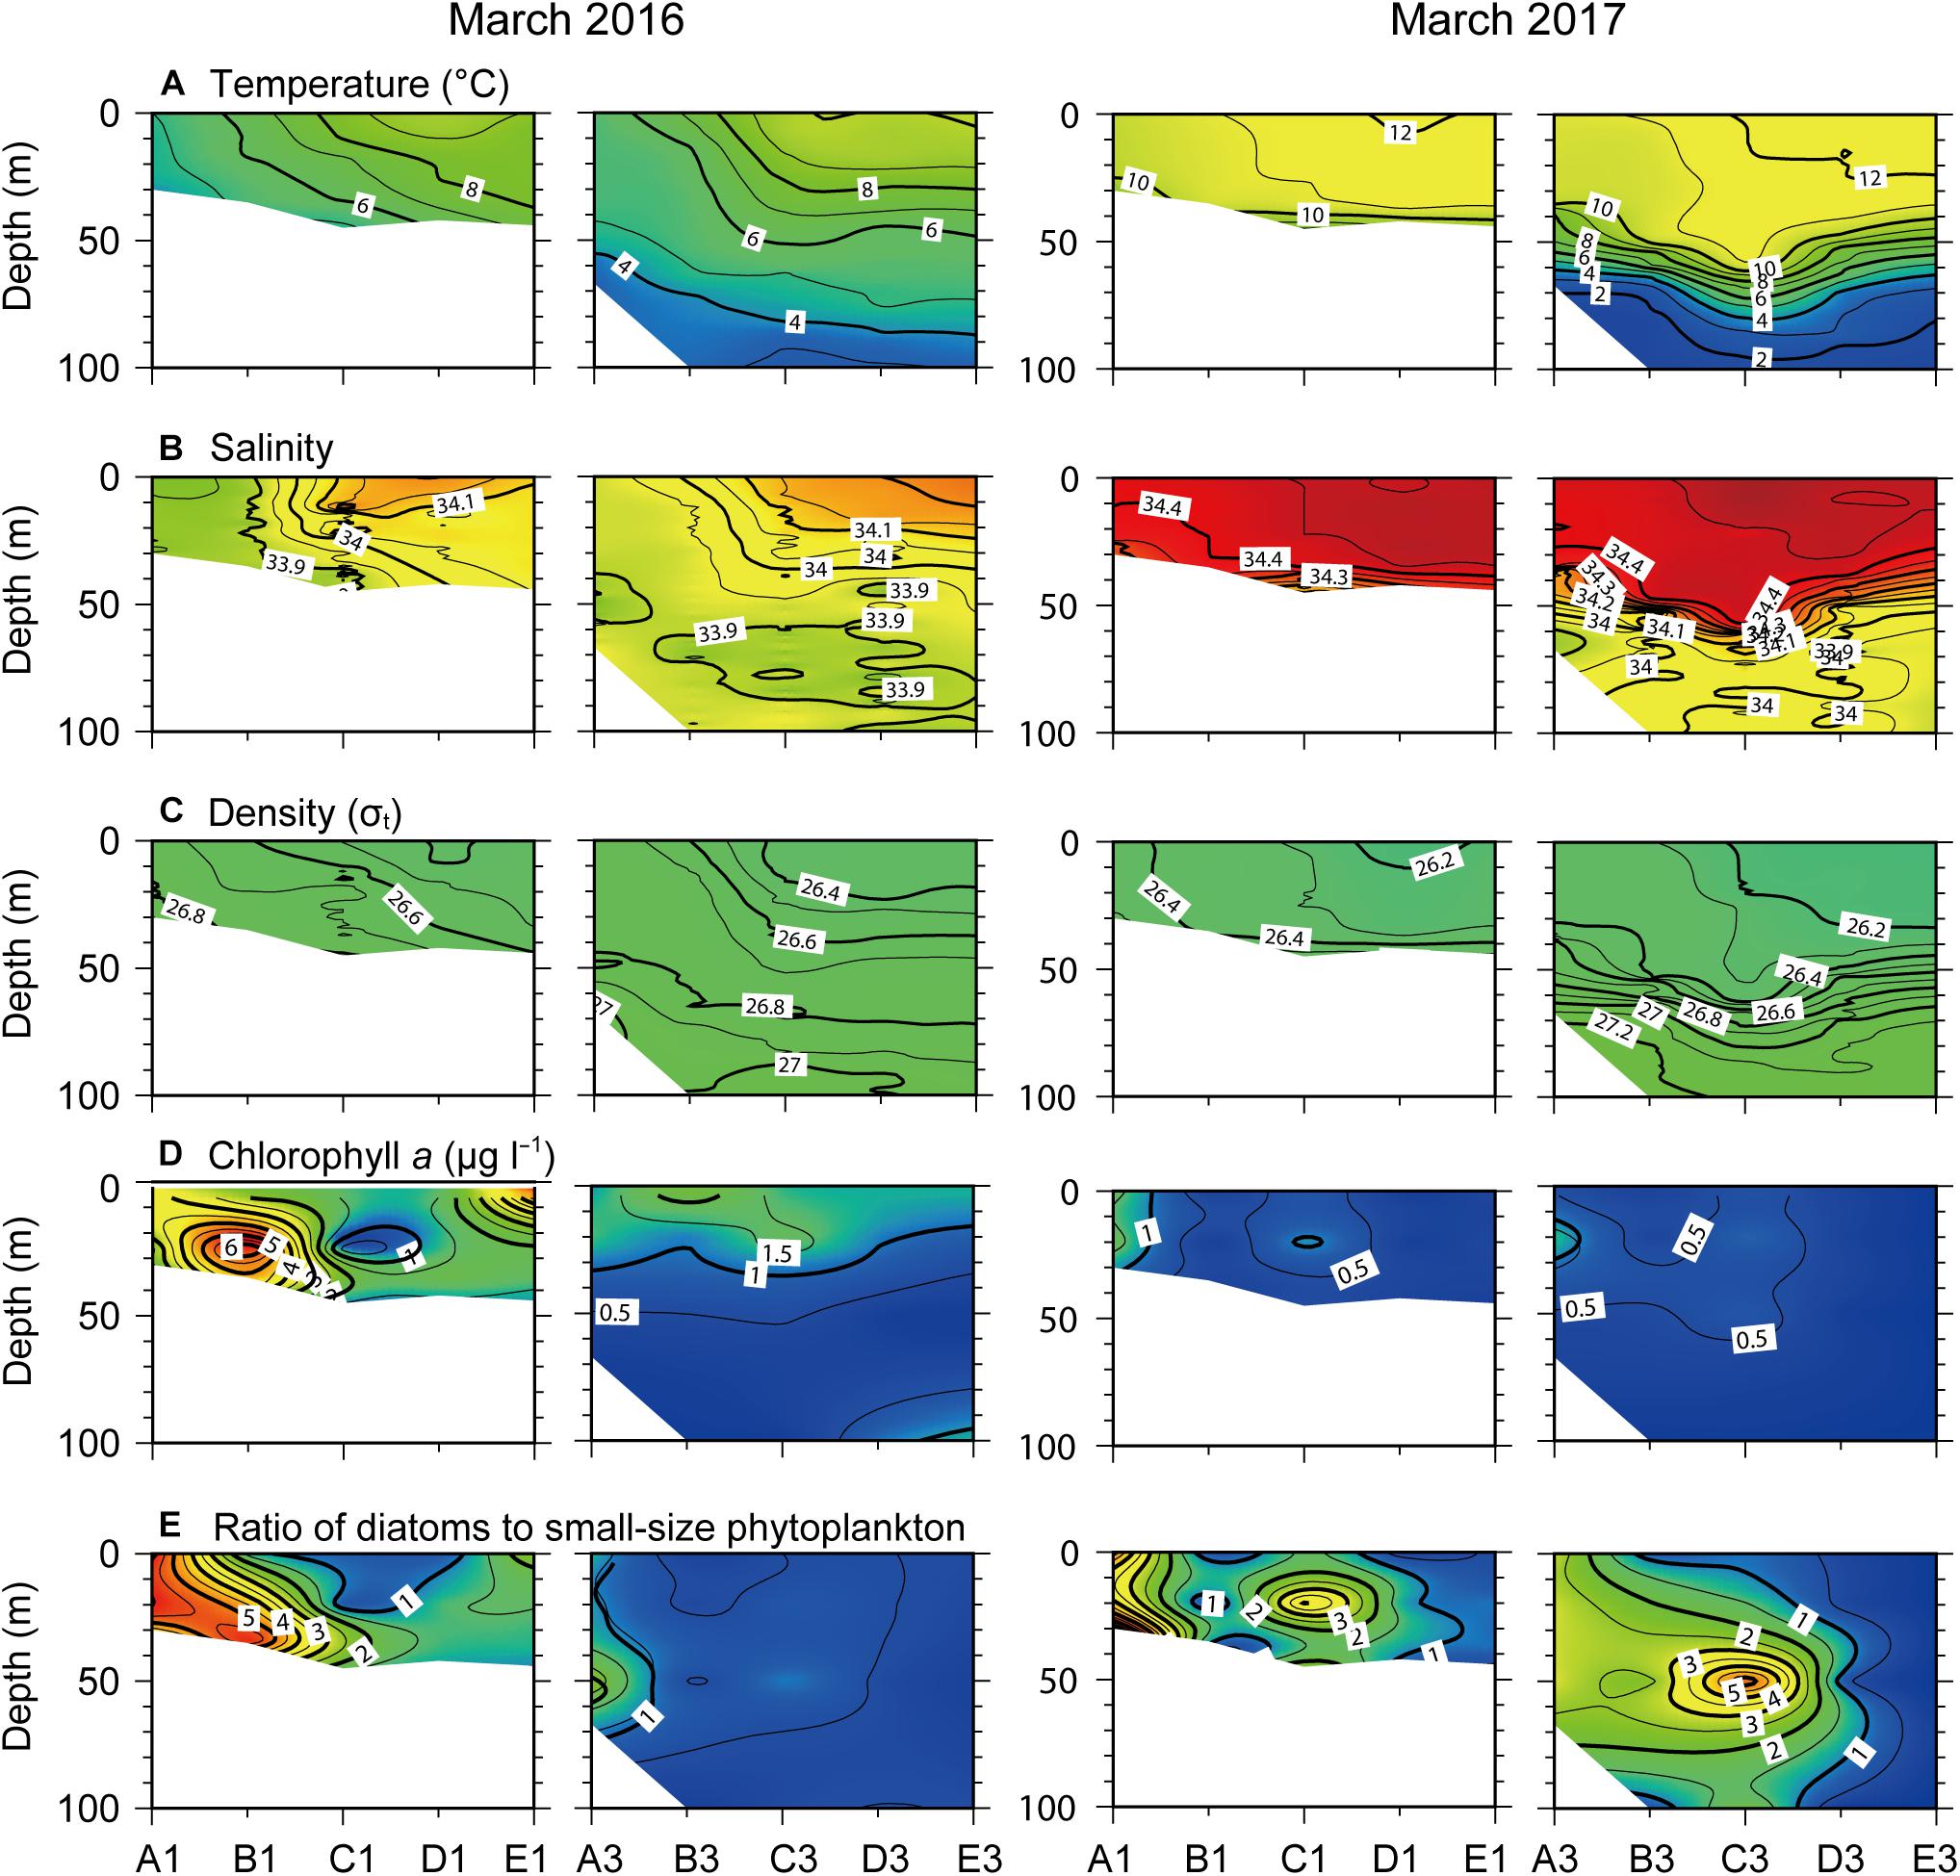
Figure 3. Vertical profiles of (A) temperature, (B) salinity, (C) density, (D) chlorophyll a concentration, and (E) ratio of diatoms to small-sized (<20 μm) phytoplanktons across the north–south longitudinal transects of the nearshore (left) and offshore (right) stations (see Figure 1) in March 2016 and 2017.
In March 2017, the water column was well mixed, with warmer water (>10°C) than in March 2016 throughout the nearshore transect, and the thermocline was established at a depth of 40–50 m throughout the offshore transect. Relatively high salinity (>34.3), compared to that below the thermocline (∼34.0), occurred throughout the water column across the nearshore transect and above the thermocline across the offshore transect. Isopycnal lines paralleled the isotherms with no clear hydrographic discontinuity in the surface layer (<50 m) across transects.
Chlorophyll a concentrations across the nearshore transect were relatively high (0.23–6.49 μg l–1) forming tongues that sloped down from the surface to the subsurface layer (<50 m) in March 2016, whereas this pattern was not observed in March 2017 (Figure 3D). Vertical profiles of the ratio of diatoms to small-sized phytoplankton showed a clear spatial shift in community composition (Figure 3E), indicating a predominance of diatoms (>20 μm size fraction) at the northern Chl a bloom stations, compared to the dominance of small-sized phytoplankton (<20 μm cells comprising prasinophytes, chlorophytes, cryptophytes, prymnesiophytes, pelagophytes, and cyanobacteria) at the southern non-bloom stations. Diatoms were dominant at the northern stations of the nearshore transect in March 2016, and from surface to subsurface layers throughout the study area except at the southernmost sites (stations E1 and E3) in March 2017.
During phytoplankton bloom development, the concentrations of dissolved inorganic nutrients [PO43–, Si(OH)4, and NO3–] were vertically homogeneous across nearshore and offshore transects in March 2016 (Figures 4A–C). In contrast, they exhibited a strong nutricline from the surface to 100 m depth across the offshore transect in March 2017. All nutrients exhibited low concentrations at the northern stations where Chl a concentrations were highest. The N:P ratio showed values < 15 at the SCM of northern stations in March 2016 (Figure 4D). Because NH4+ and NO2– concentrations were extremely low during the sampling period, they were excluded from our description.
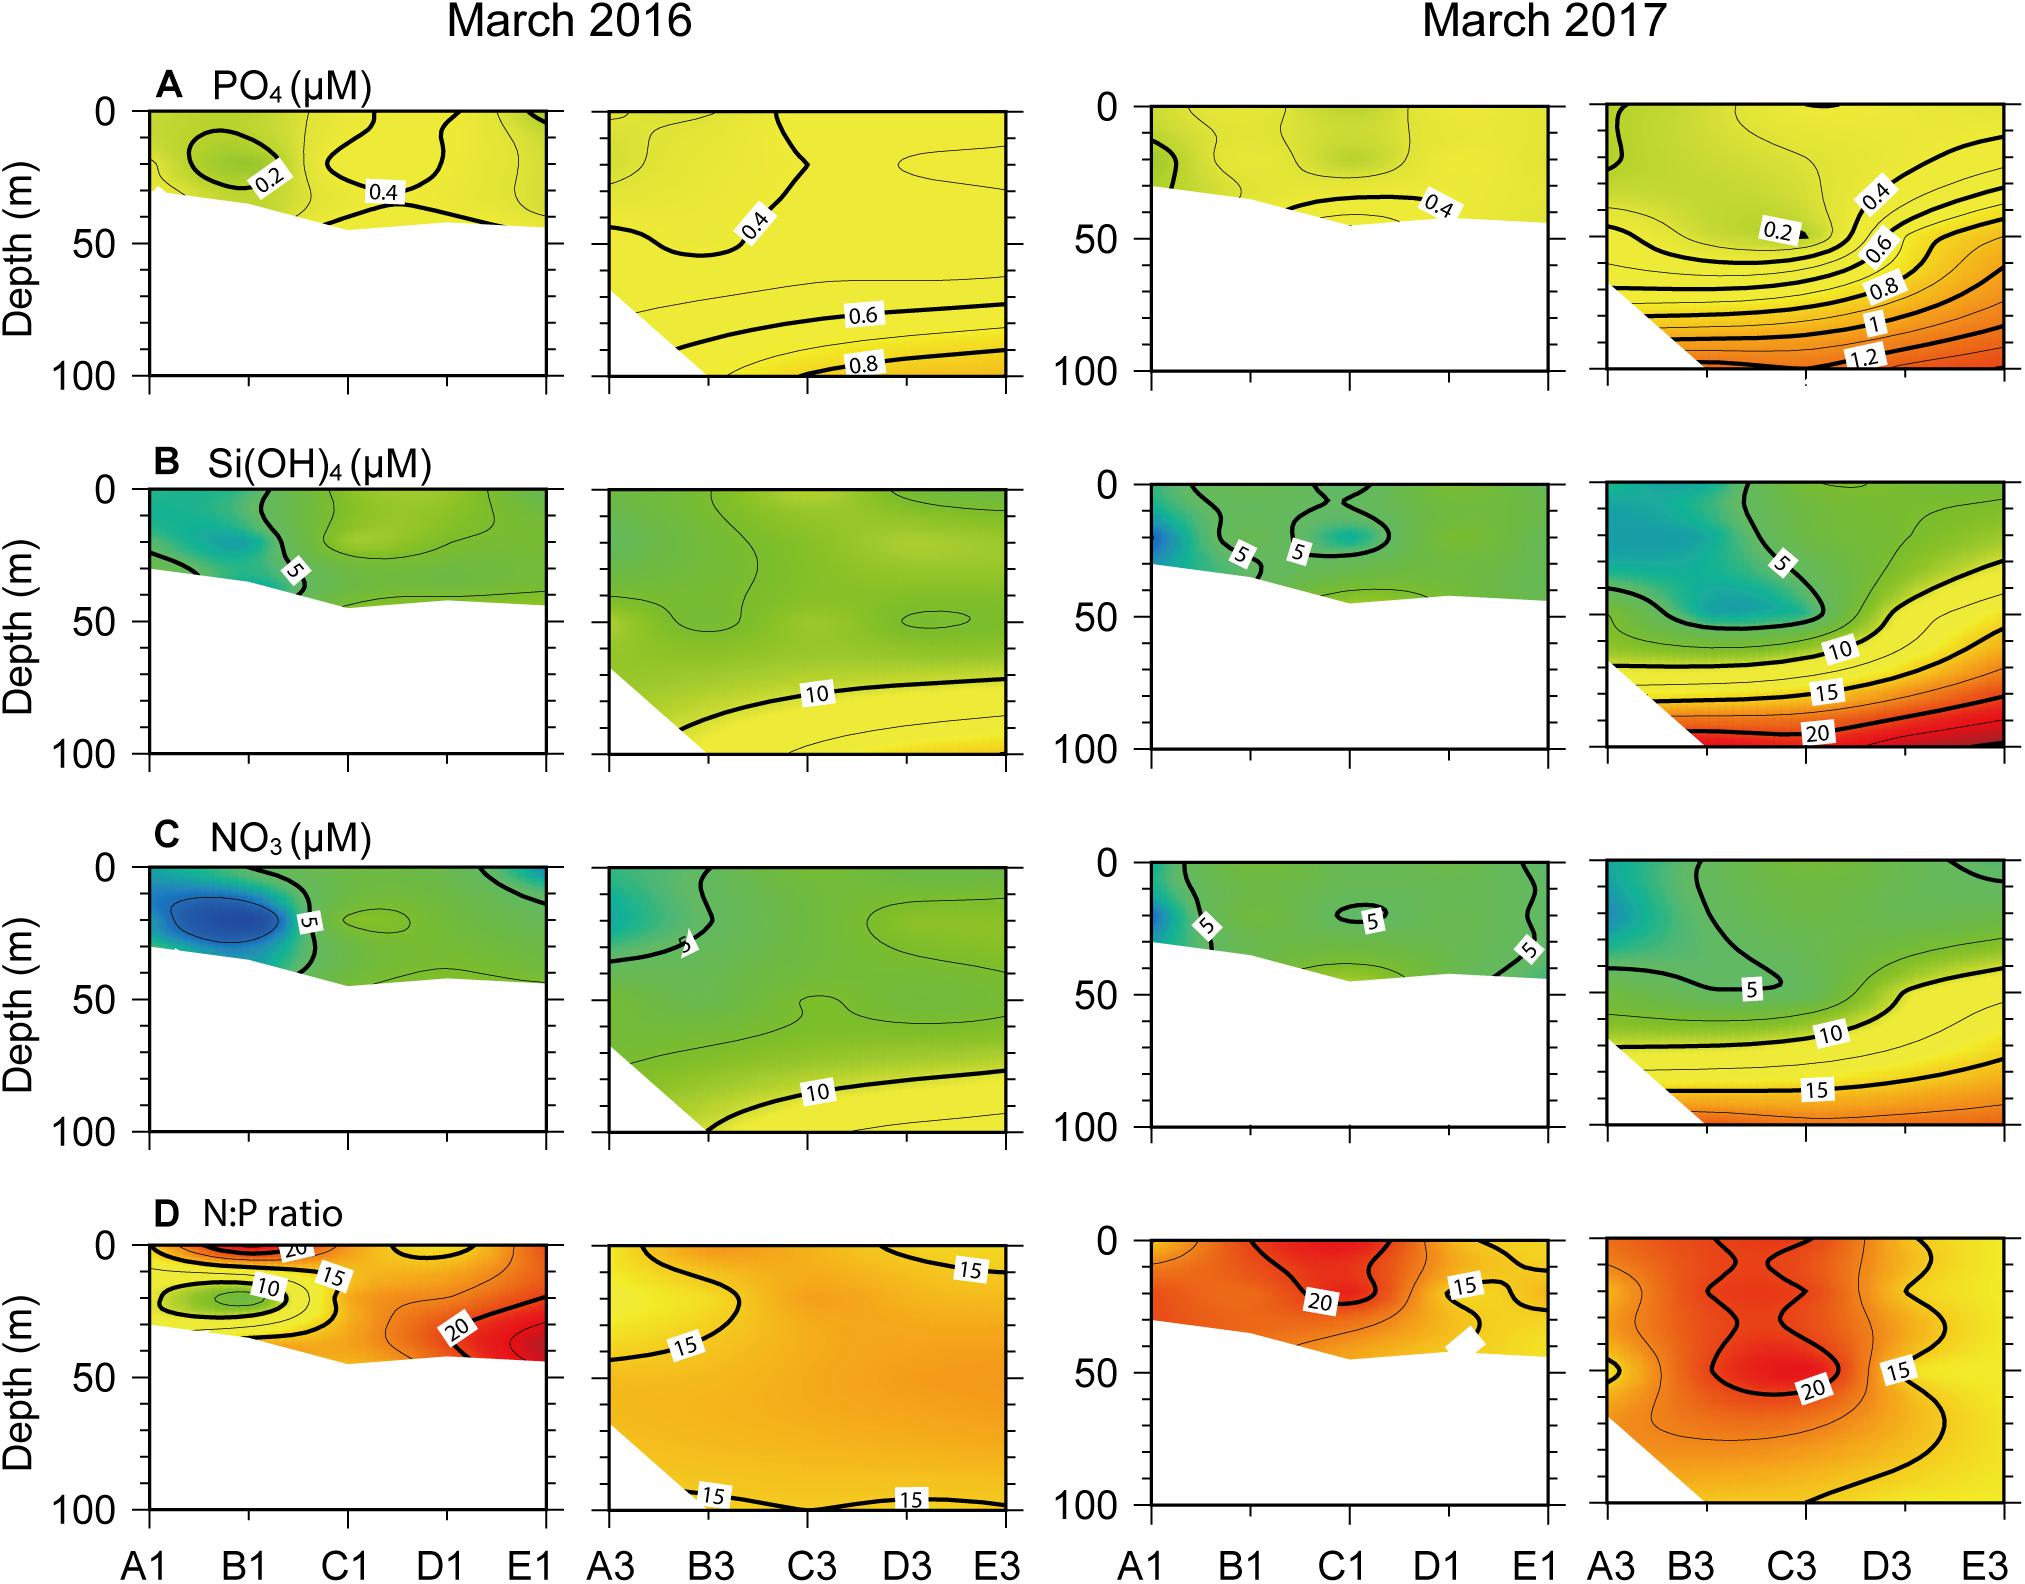
Figure 4. Vertical profiles of dissolved inorganic nutrient concentrations, (A) PO4–, (B) Si(OH)4, (C), NO3–, and (D) N:P ratio, across the north–south longitudinal transects of nearshore (left) and offshore (right) stations (see Figure 1) in March 2016 and 2017.
Contour plots of the percent contributions of individual phytoplankton groups to total Chl a reflect their distributional patterns (Figure 5). Out of eight phytoplankton groups, four (diatoms, cryptophytes, prymnesiophytes, and prasinophytes) were dominant, contributing > 10% to the total Chl a across March 2016 and 2017 transects. Diatoms tended to make the major contribution to total Chl a, with the highest percentages in the northern part of the nearshore transect in March 2016 and March 2017. Cryptophytes made relatively high contributions across the offshore transect in March 2016, but were reduced to ≤ 10% in March 2017. The contribution of both prymnesiophytes and prasinophytes increased gradually from ∼10% in the surface layer to 20% in the subsurface layer (<20 m depth) throughout March 2016 transects. Their highest percentages were found at southernmost stations of the offshore transect in March 2017.
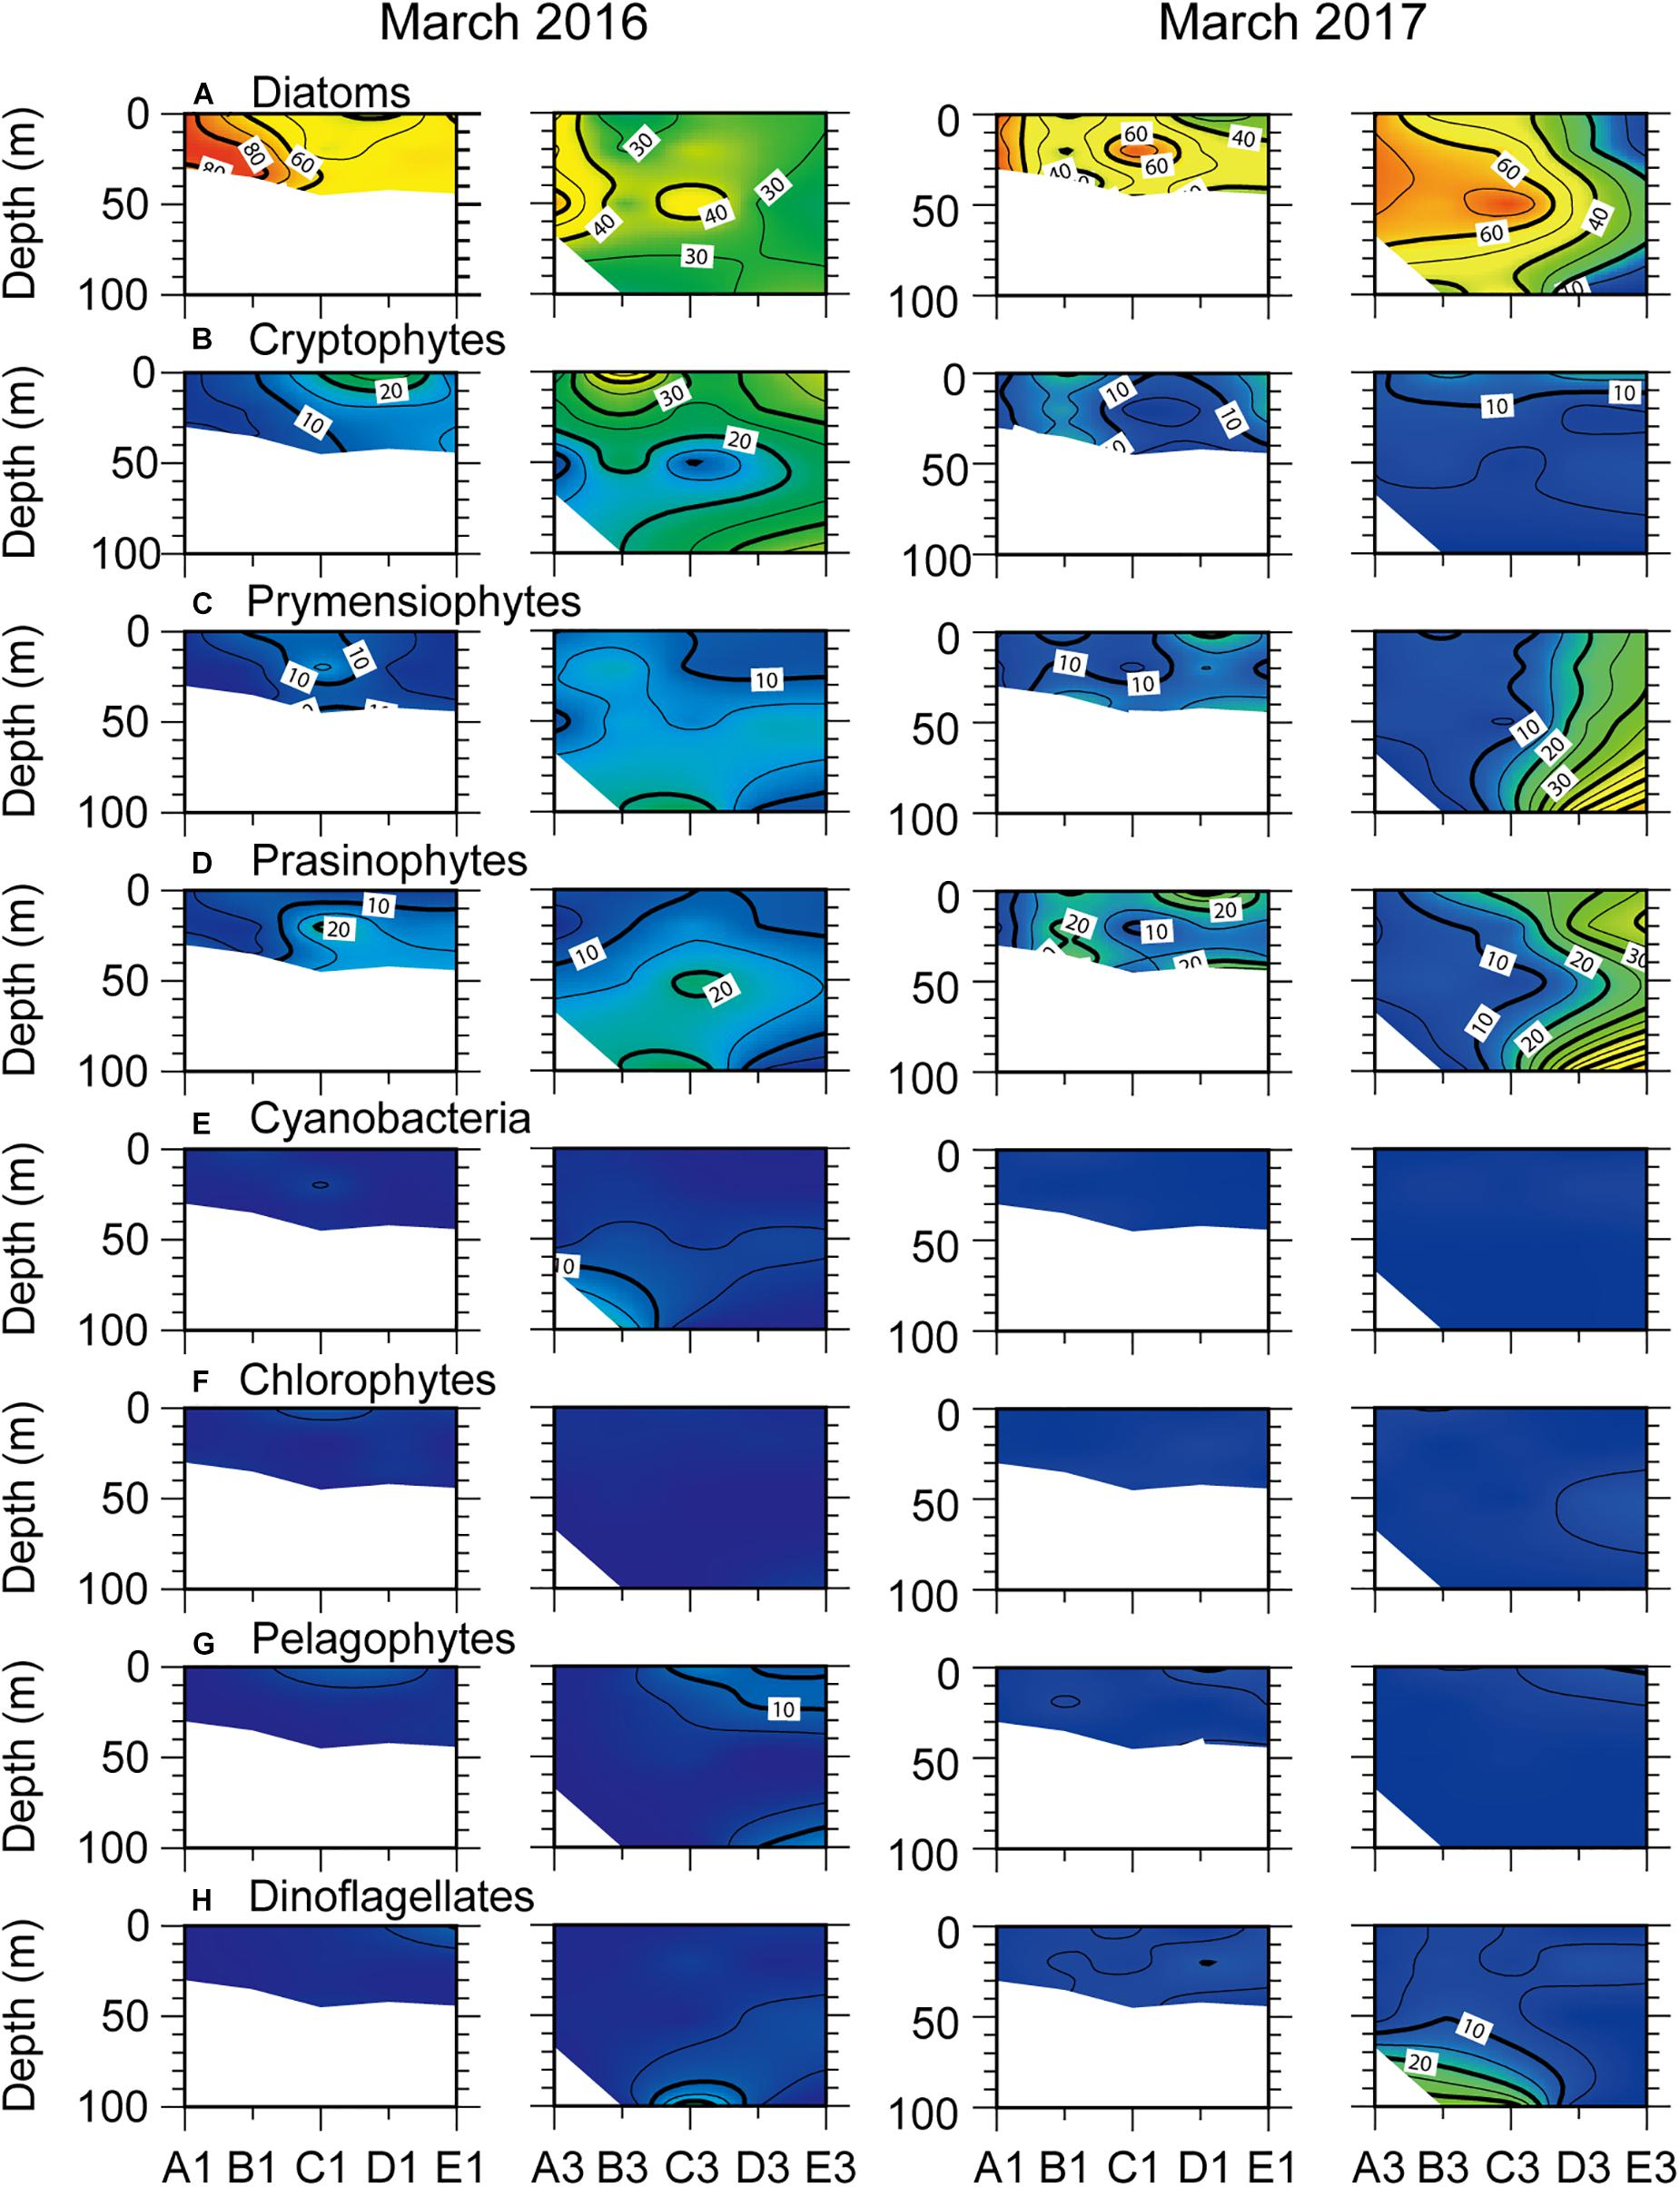
Figure 5. Relative contribution (%) of different phytoplankton classes to total chlorophyll a concentrations as calculated by CHEMTAX across north–south longitudinal transects of nearshore (left) and offshore (right) stations (see Figure 1) in March 2016 and 2017. (A) diatoms, (B) cryptophytes, (C) prymnesiophytes, (D) prasinophytes, (E) cyanobacteria, (F) chlorophytes, (G) pelagophytes, and (H) dinoflagellates.
June 2016 and 2017
In June of both years, strong thermoclines were established at 10–20 m depth that resulted in a well-stratified water column and shoaling of isotherms compared with March (Figure 6A). The temperature gradient with depth was more pronounced in 2016 than in 2017. In June 2016, salinity exhibited a local minimum of < 33.5 at the surface (<20 m, coinciding with the thermocline depth) at the northern stations, and increased toward the south (Figure 6B). In June 2017, vertical salinity profiles were characterized by low values (<33.9) in the surface layer (>10 m depth) and high values (>34.1) in the subsurface layer throughout all transects. Colder (14–15°C) and more saline (34.3–34.5) water compared with surface water appeared at a 20 to 70 m depth during this period. Strong pycnoclines were established around 20 and 10 m depths in 2016 and 2017, respectively (Figure 6C).
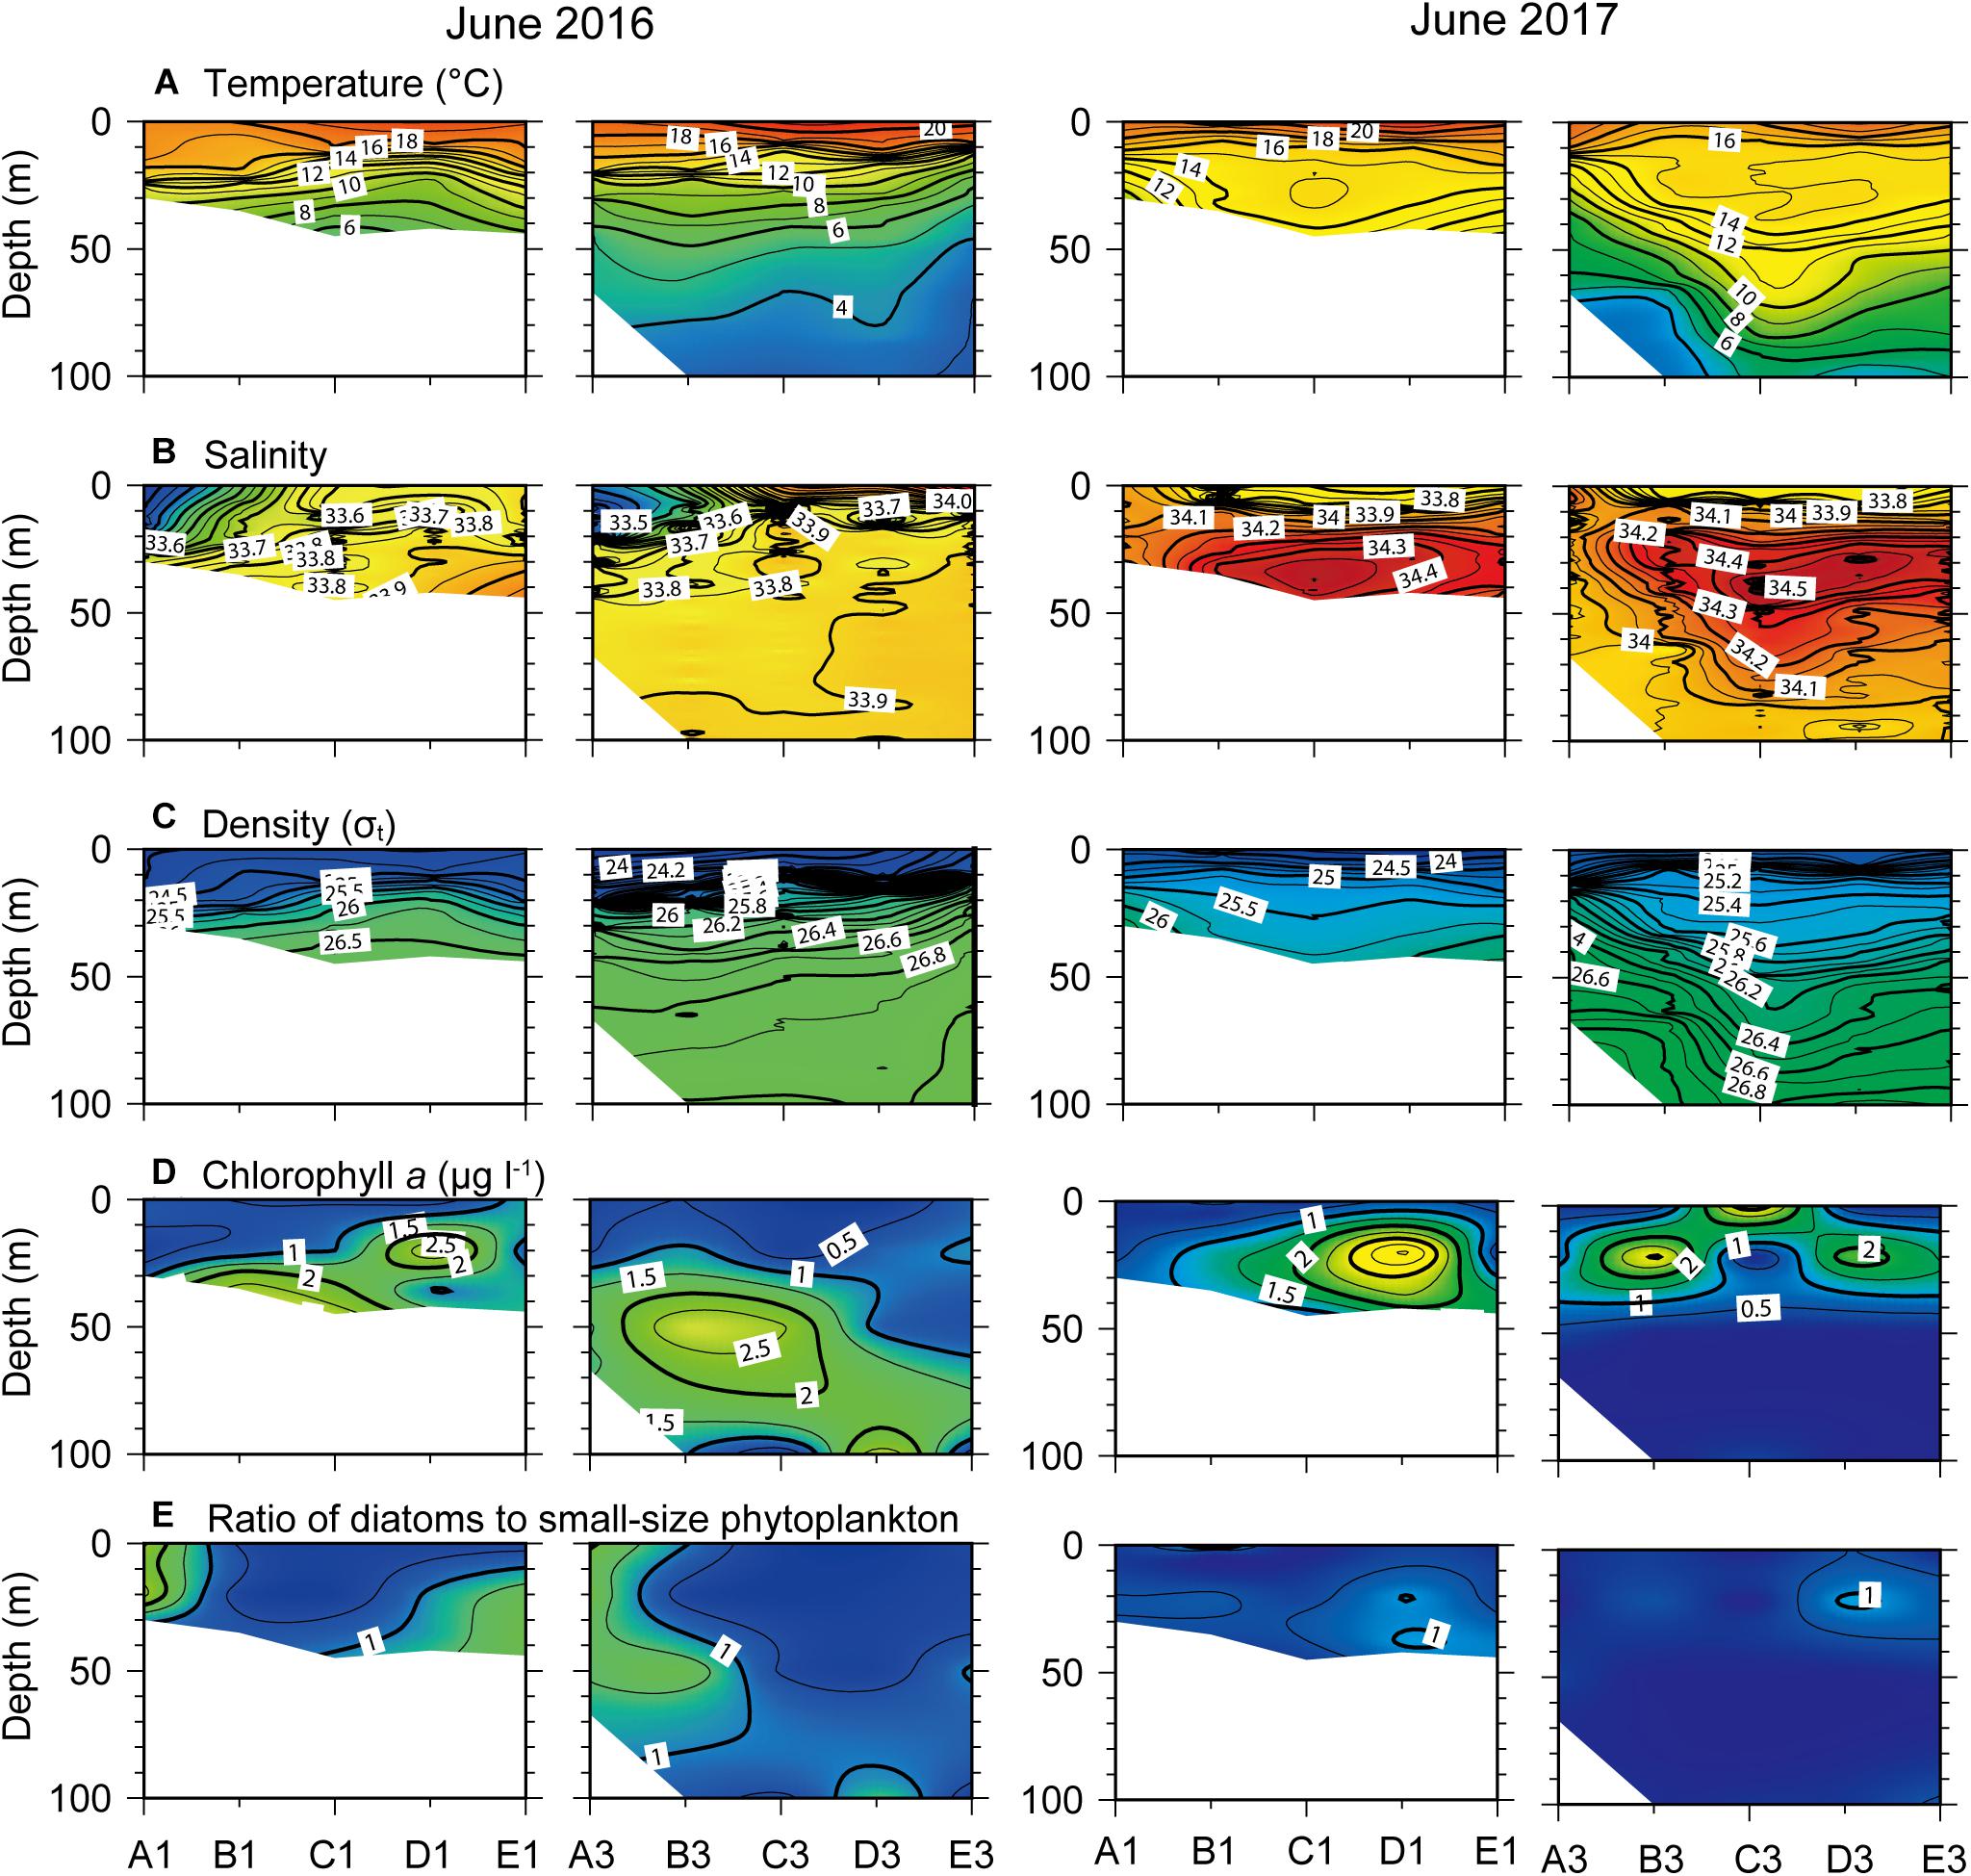
Figure 6. Vertical profiles of (A) temperature, (B) salinity, (C) density, (D) chlorophyll a concentration, and (E) ratio of diatoms to small-sized (<20 μm) phytoplanktons across north–south longitudinal transects of the nearshore (left) and offshore (right) stations (see Figure 1) in June 2016 and 2017.
High Chl a concentrations (> 1.0 μg l–1) were observed below the surface layer across transects in June of both years (Figure 6D). The SCM occurred at 100 m depth in 2016, but was detected above 40 m in 2017. Unlike the March 2016 distribution, there was no clear spatial difference in Chl a concentrations between nearshore and offshore transects at this time. The ratio of diatoms to small-sized (<20 μm) phytoplankton indicated that the latter dominated from the surface to the subsurface layer of most the study area except at some of the northern stations, compared with diatom dominance of phytoplankton blooms in March (Figure 6E).
Dissolved inorganic nutrient concentrations were consistently low throughout the water column at > 100 m depths across June 2016 transects (Figure 7). Phosphate and silicate concentrations of < 0.15 and 5 μM, respectively, were recorded in the surface layer above the pycnocline where a nutricline formed (Figures 7A,B). Extremely low NO3– concentrations extended down to the SCM below the pycnocline (Figure 7C). In contrast, a prominent nutricline was observed immediately below the surface layer across June 2017 transects, corresponding to shoaling of the pycnocline. Indeed, replete nutrients [PO43–, Si(OH)4, and NO3–] were observed beneath the thin surface layer across transects. The N:P ratios fell below the Redfield ratio of 16 at the surface across the nearshore transect and at the SCM across the offshore transect in June 2016 (Figure 7D). In contrast, N:P ratios were relatively constant (∼16) in the surface layer (with the exception of the northernmost stations) across both transects in June 2017 but slightly increased above the Redfield ratio in the subsurface layer.
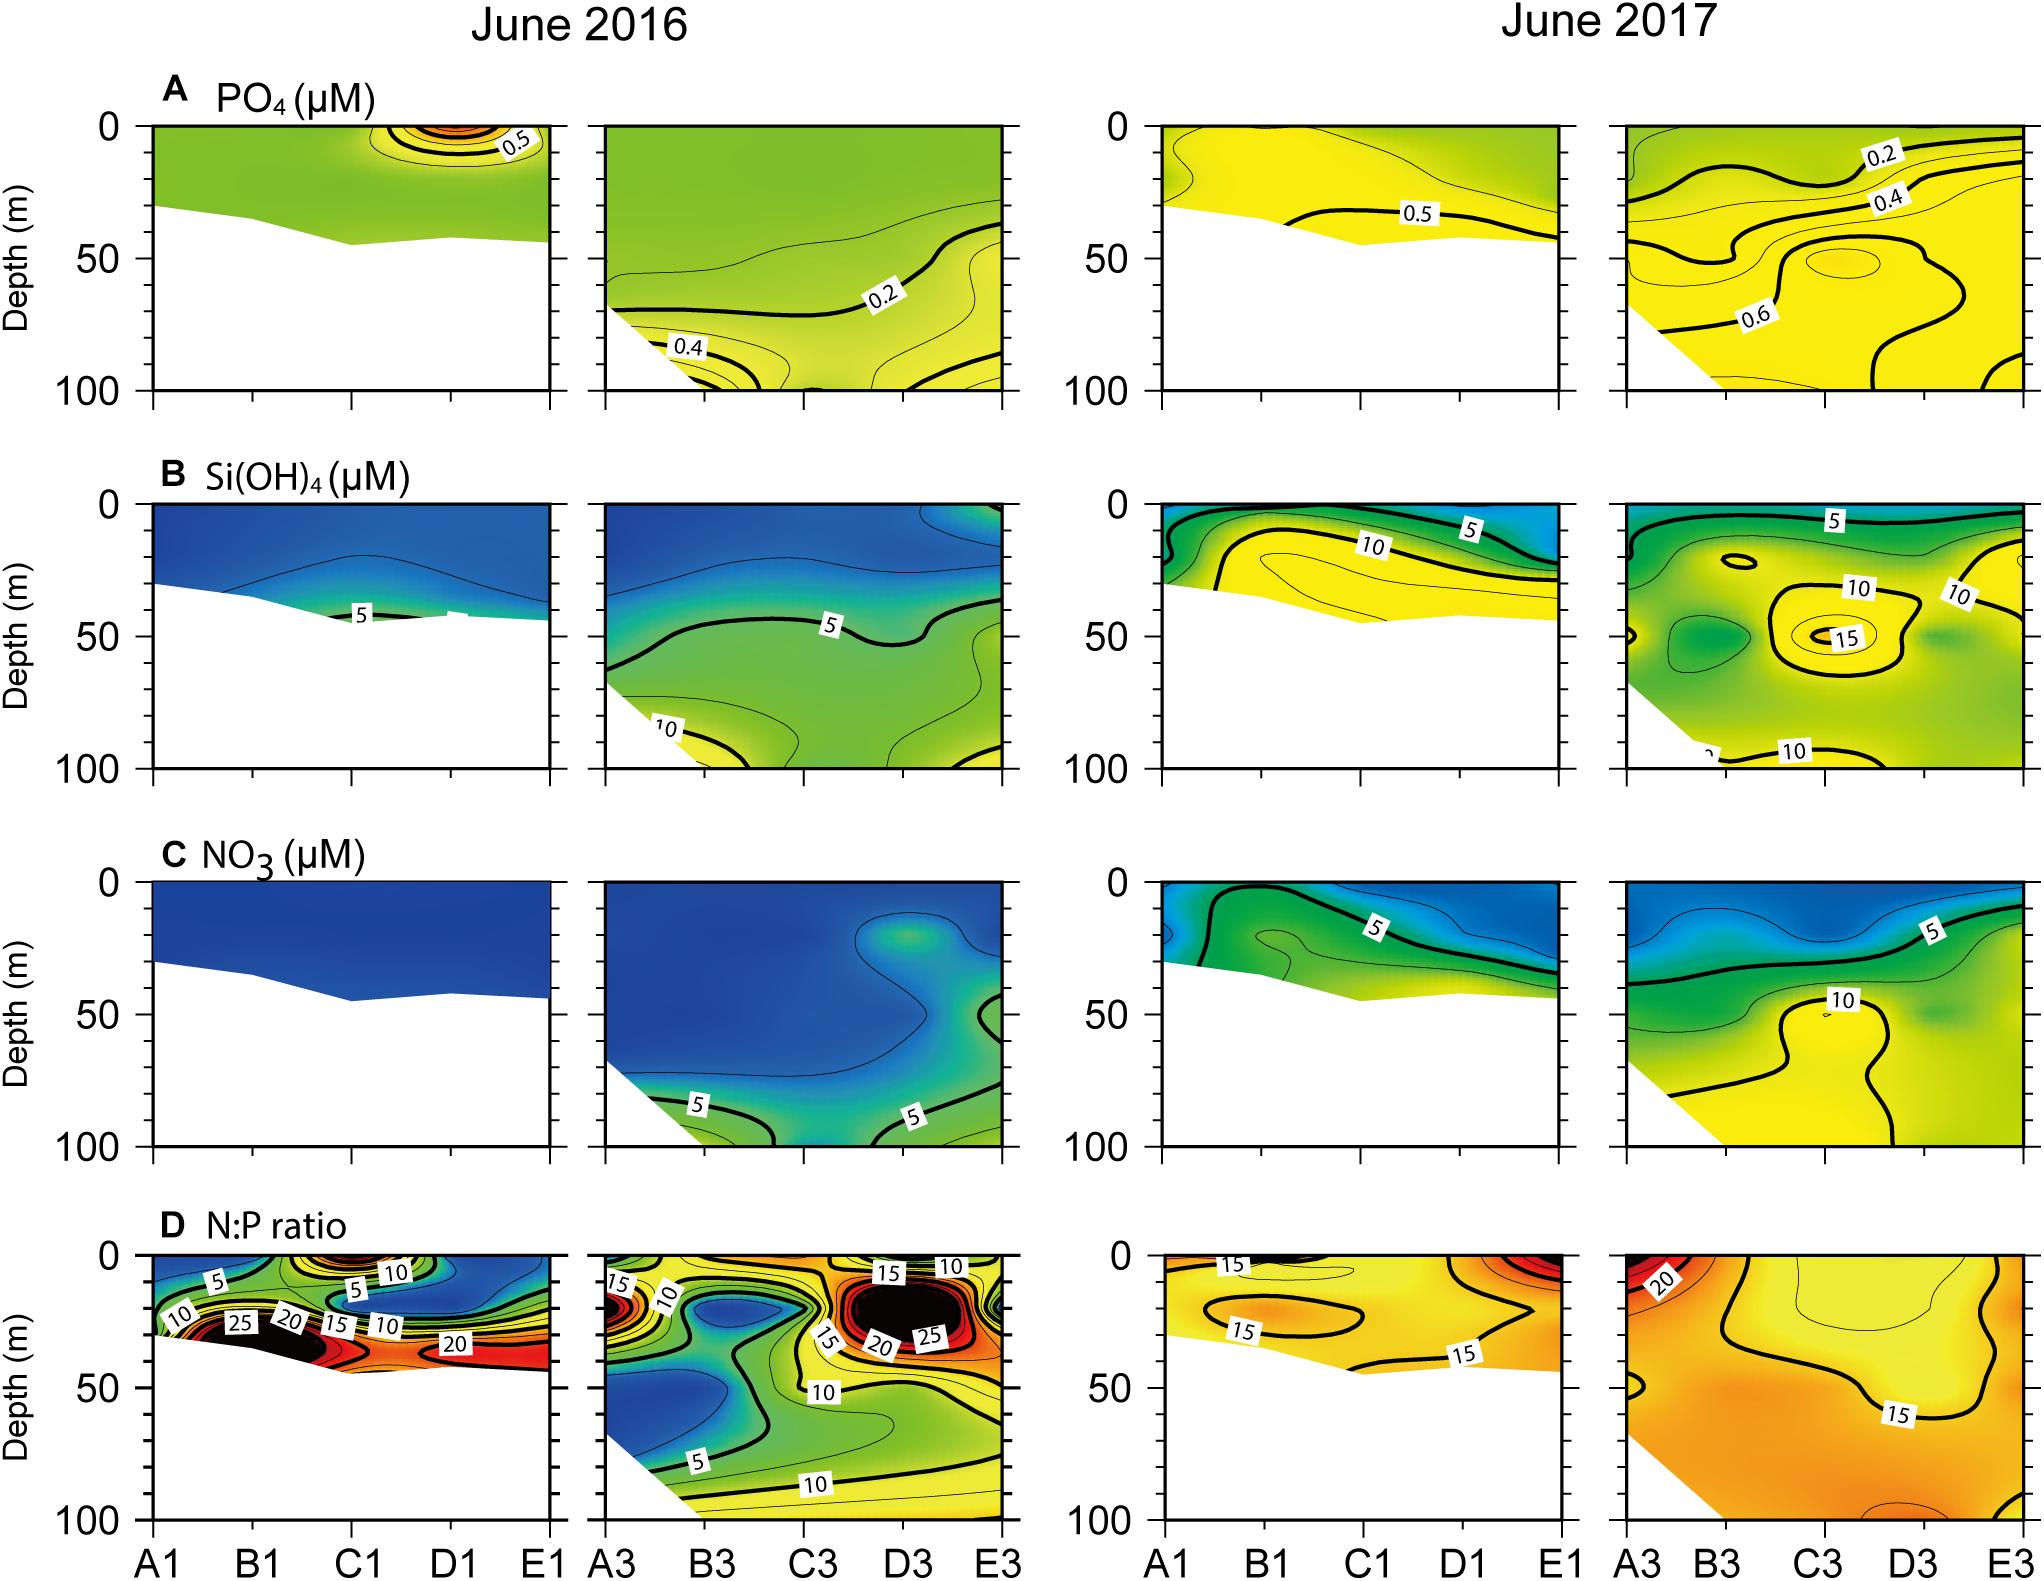
Figure 7. Vertical profiles of dissolved inorganic nutrient concentrations, (A) PO43–, (B) Si(OH)4, (C), NO3–, and (D) N:P ratio, across the north–south longitudinal transects of nearshore (left) and offshore (right) stations (see Figure 1) in June 2016 and 2017.
In June of both study years, phytoplankton distributions showed that the predominant small-sized taxa were more diverse, as evidenced by higher percentages of cyanobacteria and chlorophytes compared with those in March (Figure 8). Diatoms were the dominant group throughout almost all the survey area in June 2016, except in the surface layer of mid-portions of the transects, where cyanobacteria were dominant, contributing up to 40% to total Chl a. At this time, chlorophytes tended to show relatively high% contributions in the southern area of both transects, coinciding with high salinities. In June 2017, diatom dominance was restricted to the subsurface layer across transects, with maximum percent values observed below the strong surface thermocline. While high percentages of cryptophytes were generally consistent with those of diatoms, the% contribution of prymnesiophytes increased in the low-salinity zone of surface and deep layers. A high relative abundance of prasinophytes marked the cold, low-salinity deeper layer of offshore transects. Chlorophytes were dominant in June 2016 and 2017, switching their distributions with prymnesiophytes and prasinophytes.
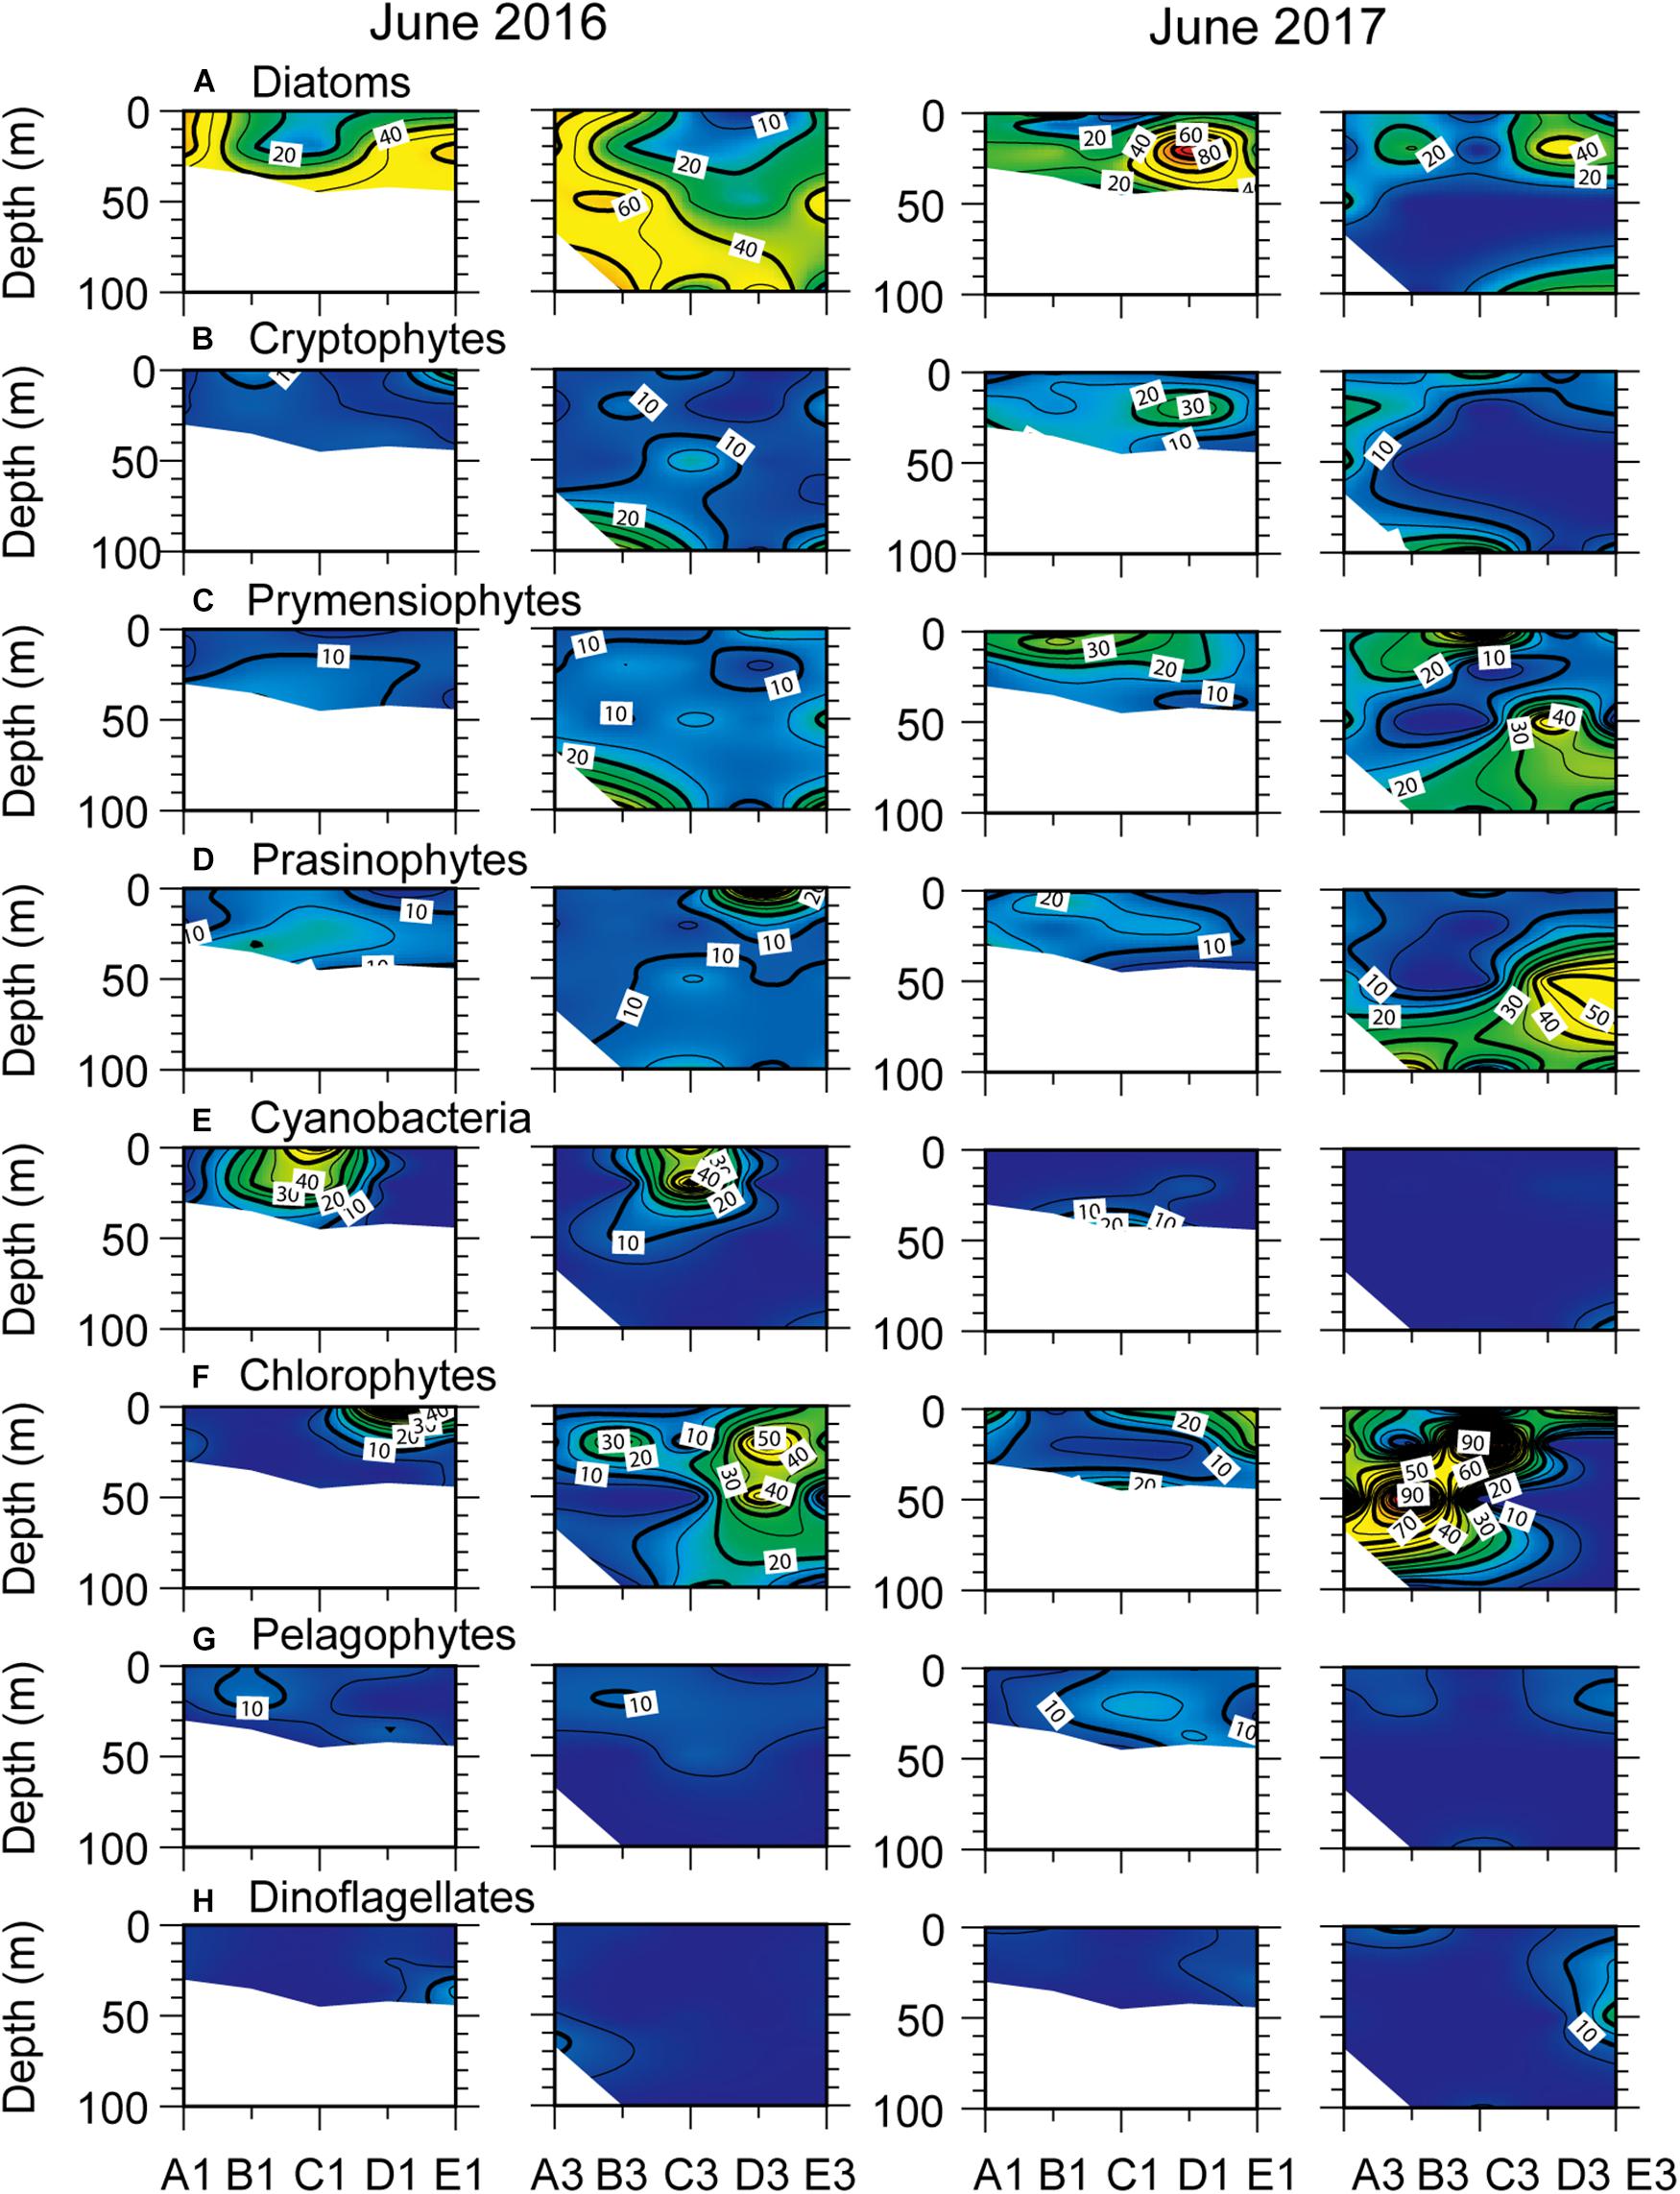
Figure 8. Relative contribution (%) of different phytoplankton classes to total chlorophyll a as calculated by CHEMTAX across north–south longitudinal transects of nearshore (left) and offshore (right) stations (see Figure 1) in June 2016 and 2017. (A) diatoms, (B) cryptophytes, (C) prymnesiophytes, (D) prasinophytes, (E) cyanobacteria, (F) chlorophytes, (G) pelagophytes, and (H) dinoflagellates.
Association of Phytoplankton Classes With Environmental Factors in 2016 and 2017
Plots of CCA show the relationship between phytoplankton bloom dynamics and environmental factors that contributed to structuring the phytoplankton community in both study years (Figure 9). On the CCA ordination diagrams, the first two axes (1 and 2) explained 77.4 and 10.6%, respectively, of the total variance of phytoplankton taxa related to environmental factors in March (Figure 9A and Supplementary Table 2) and 43.2 and 26.6%, respectively, in June (Figure 9B). The arrows in the CCA plots indicate that water temperature correlated negatively with Chl a concentration and σt in March and June of both study years. In contrast, the correlation between water temperature and dissolved inorganic nutrient concentrations differed between March and June in both years. The CCA arrow indicates that water temperature showed a positive correlation with nutrient concentrations in March but a negative correlation in June. The symbols representing phytoplankton community composition at each station–depth combination are widely scattered on the plane. Diatoms are located solely to the far left of the plots, denoting a positive correlation with Chl a and σt in both March and June of both years. Their correlation with nutrient concentrations alternated from negative values in March to positive values in June. Other phytoplankton taxa are clearly separated between prymnesiophyte/cyanobacteria and pelagophyte/chlorophyte/dinoflagellate groups based on their correlation with temperature along CCA axis 2 in both months.
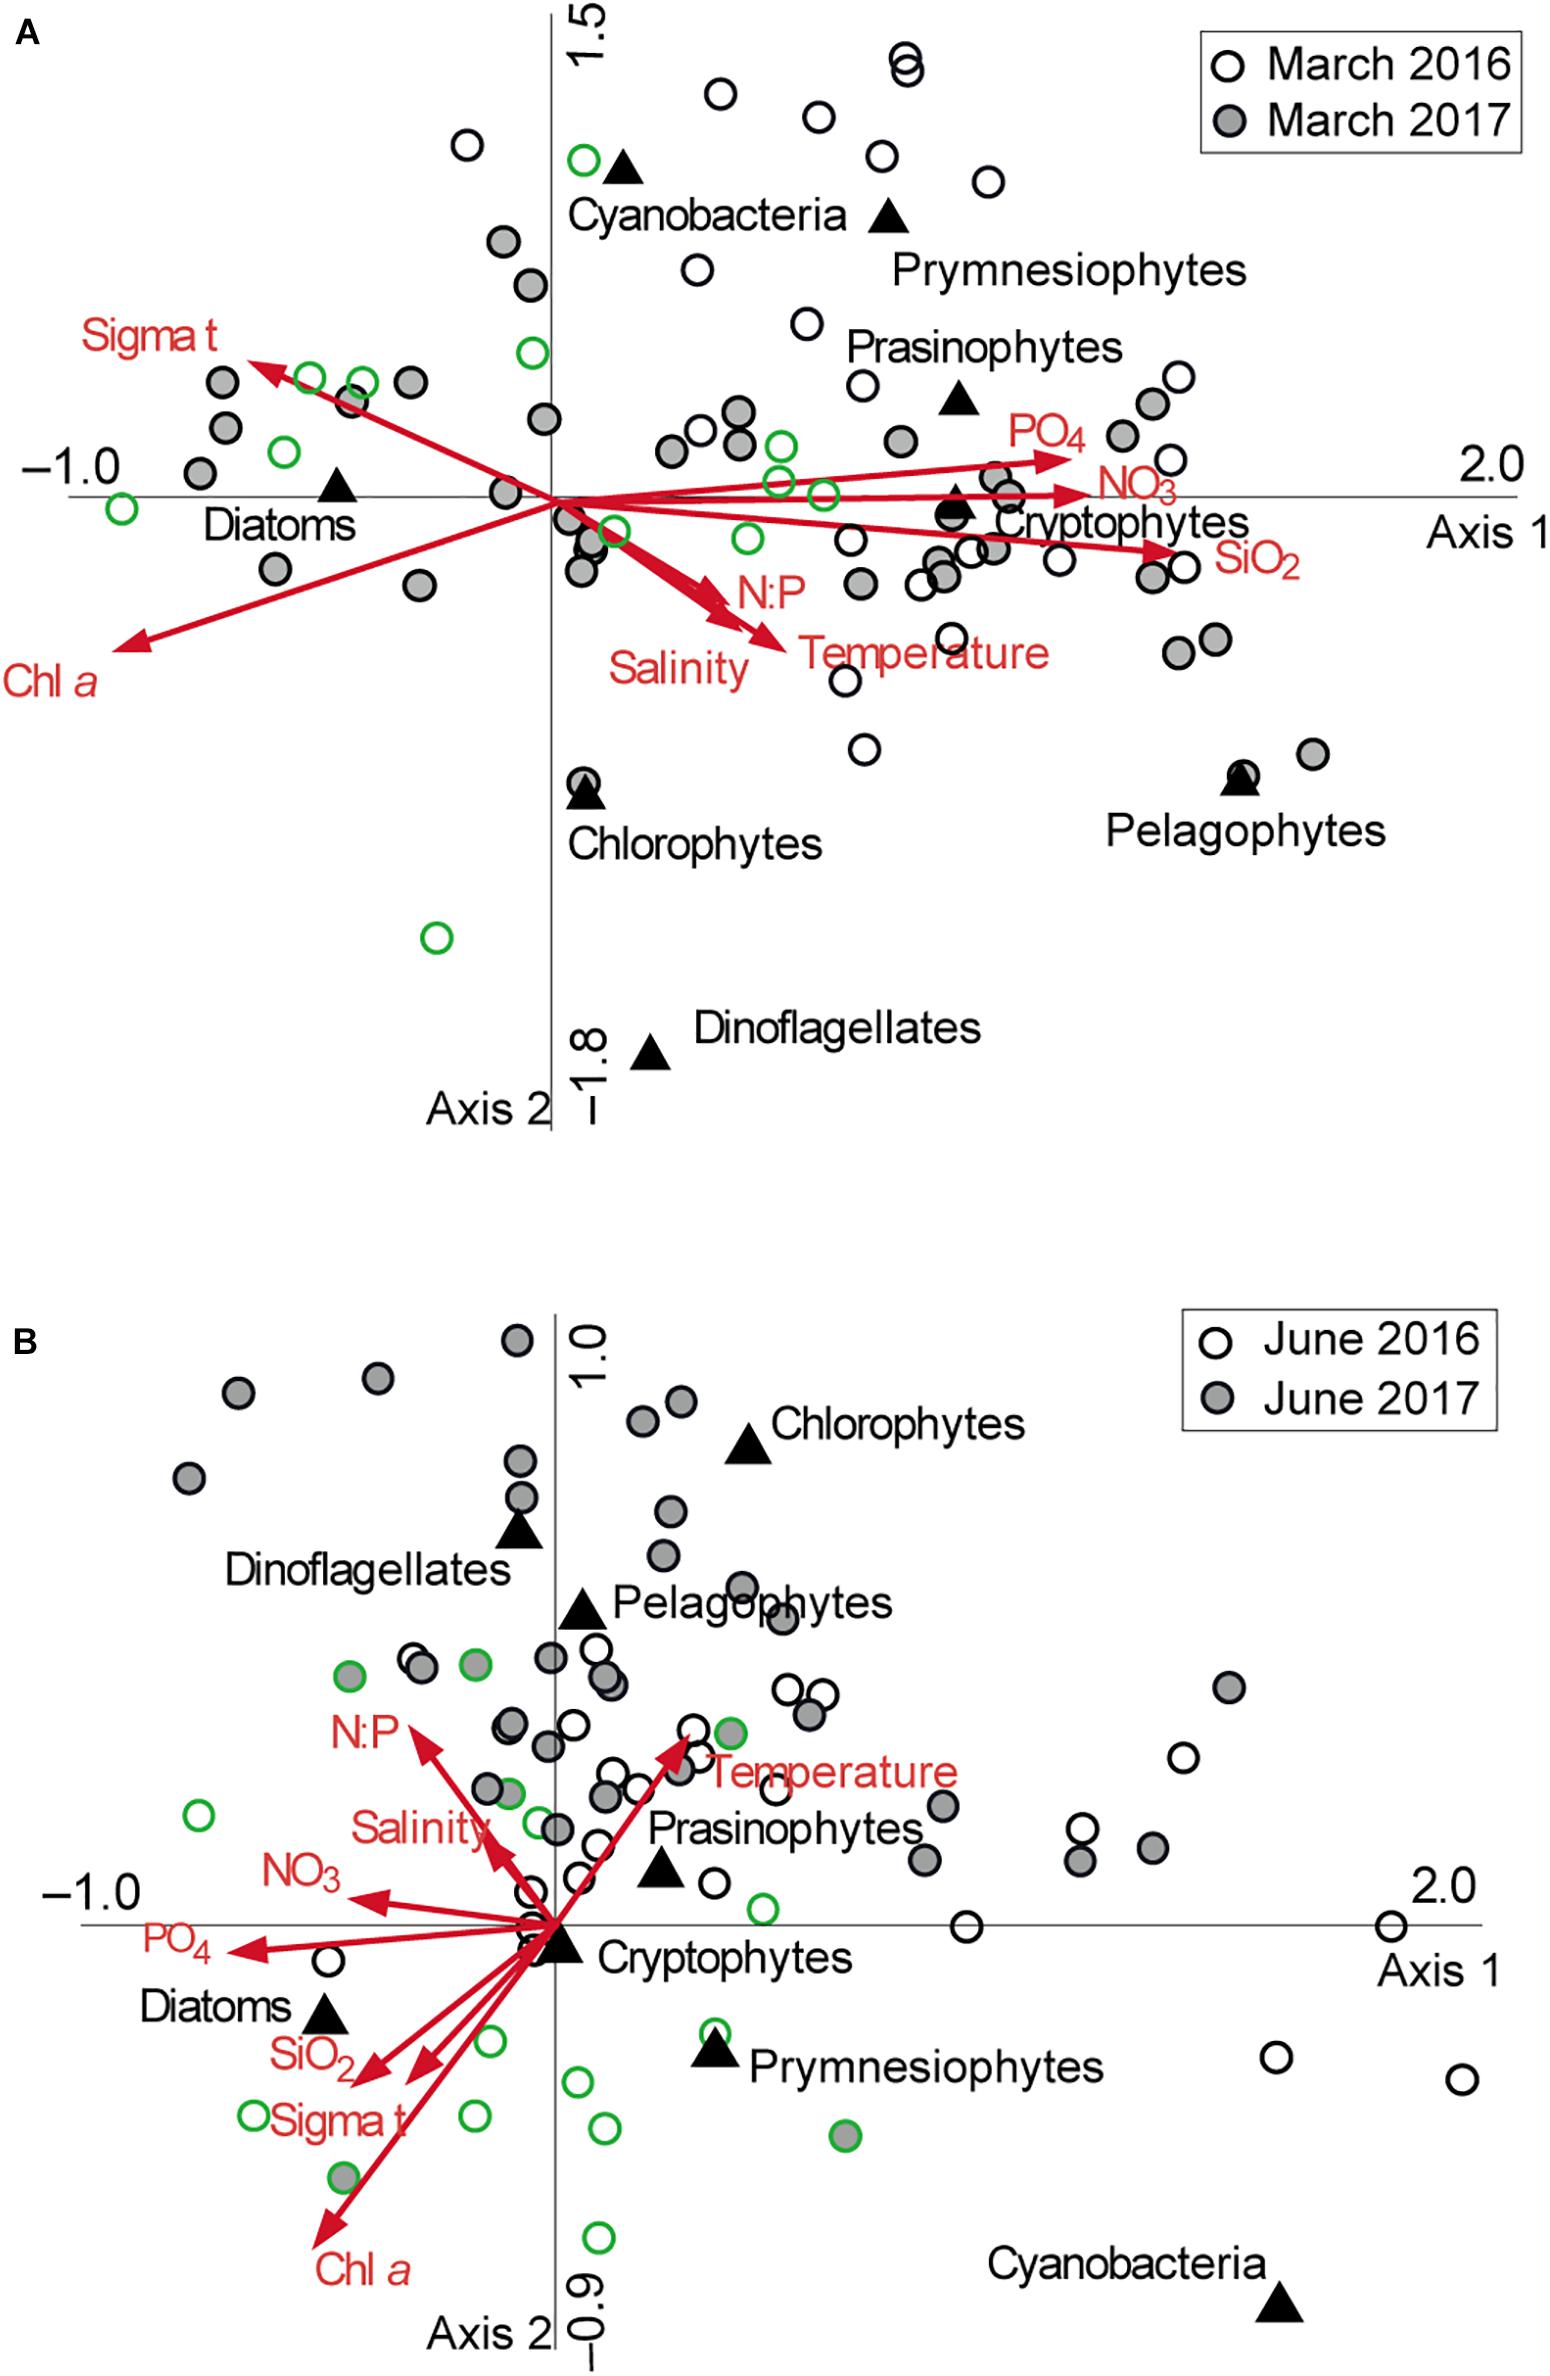
Figure 9. Canonical correspondence analysis: ordination diagrams of phytoplankton abundance and composition data at various station/depth combinations with environmental variables represented by arrows in panel (A) March and (B) June 2016 and 2017, respectively (see text for explanation). Phytoplankton classes are shown by filled triangles. Green symbols represent the samples with chlorophyll a (Chl a) concentrations > 1 μg l– 1.
Discussion
The UB in the southwestern EJS is characterized by a unimodal seasonal phytoplankton bloom in spring (April to May) (Son et al., 2014; Joo et al., 2016; Ji et al., 2019; Park et al., 2020). This bloom is associated with favorable conditions for phytoplankton growth, combined with seasonally increasing light availability and the presence of nutrient-rich water within the euphotic zone due to shoaling of isotherms. Other studies based on monthly field measurements also reported a SCM layer in summer (June and August) in association with shallowing of the pycnocline and nitracline, and marked stability of the water column (Kwak et al., 2013a,b). Contrasting with this consensus, shipboard observations in the present study reveal bimodal blooms in the frontal zone in both years: early spring (March) and summer (June). The spatial pattern and magnitude of algal blooms showed distinct interannual variation based on hydrologic conditions driven by the prevalence of two contrasting water masses, i.e., the NKCC and EKWC. In addition, the blooms coincided with high relative abundance of diatoms both in March and June. Thus, both seasonal/interannual variability and the diatom dominance of phytoplankton blooms are of significance in explaining ecosystem changes in the mid-west shelf and slope of the EJS.
Seasonal/2-Year Differences of Phytoplankton Blooms
One of the most prominent features of phytoplankton blooms in the present study was that Chl a concentrations showed opposite correlation with those of dissolved inorganic nutrients during early spring and summer blooms. A positive correlation between Chl a concentration and density during both bloom periods indicated that phytoplankton blooms occurred in relatively cold water. A contrasting distribution pattern in temperature as well as nutrient concentrations between the early spring (March) and summer (June) bloom periods suggests that different hydrologic mechanisms underlie the blooms’ spatial and temporal variability.
The spatial distribution of physicochemical parameters in March 2016 indicated that the early spring bloom was associated with intrusion of southward-flowing NKCC along the east coast of the Korean peninsula (see also Supplementary Figures 2–4). As indicated by the negative correlation of Chl a vs. temperature, salinity, and nutrient concentrations, these high Chl a concentrations were clearly associated with cold, low-salinity water off the northern coast (Kim and Min, 2008), indicating that the NKCC is the source of these high values. Low nutrient concentrations in the low-salinity water mass compared with offshore, deeper water generated negative correlations of these parameters with Chl a (see also distributions across cross-shelf transection, Supplementary Figures 1A, 5–7). Additionally, lower N:P ratios (<15) compared with those in southern and offshore areas suggest advection of nitrate-rich NKCC water rather than the upward flux of deep water. The composition of the phytoplankton community supports this interpretation, with diatom dominance at bloom locations compared with non-bloom areas, as discussed below.
Satellite image analysis has also shown high Chl a concentrations in March off the coast of North Korea (north of the SPF), providing evidence of an early spring bloom associated with the NKCC in the study area (Kim et al., 2000; Joo et al., 2016; Park et al., 2020). In contrast to the region north of the UB, a similar phenomenon has been reported off the southern UB coast where the northward-flowing EKWC is associated with the seasonal occurrence of coastal upwelling (Yoo and Kim, 2004; Hyun et al., 2009). These authors reported that high, diatom-dominated phytoplankton biomass originating from highly productive coastal upwelling water can be entrained into the anticyclonic warm eddy (i.e., EKWC) of the UB after passing the Korean strait in spring.
In contrast, warm and saline EKWC water covered the entire study area with no signature of the SPF (i.e., a lack of sharp horizontal gradients in temperature or salinity) in March 2017. At this time, the Chl a distribution was characterized by the absence of zones of high phytoplankton biomass accompanying deepening of the surface-mixed layer and a well-stratified water column (Kwak et al., 2013b). Water-column stratification coincided with oligotrophic conditions, specifically with respect to surface PO43– concentrations (< 0.5 μM). Low phosphate was evidenced by the high N:P ratio (greater than the 16:1 Redfield ratio) in the surface layer, which may indicate incomplete NO3– utilization by phytoplankton due to P depletion for their growth at this time (Kwon et al., 2019). As a result, the observed 2-year difference in hydrologic conditions and biogeochemical parameters suggests that NKCC intrusion may serve as a forcing mechanism to enhance and/or accumulate phytoplankton biomass in the frontal zone north of the UB.
Chlorophyll a concentrations observed in June of both years indicated that summer phytoplankton blooms were fed by the SCM, an established and prominent summer feature in the UB (Kwak et al., 2013a,b). These authors attributed the mechanism promoting the summer SCM to shoaling of the pycnocline and nitracline due to strong stratification in the shallow subsurface layer. Due to the subduction of the denser water mass of the NKCC underneath the EKWC, the pycnocline was formed in shallow depth. As a result, stratification was strengthened and replete nutrients below the pycnocline is supplied into the surface layer, enhancing the availability of nutrients. A positive correlation of Chl a concentration with both σt and dissolved inorganic nutrients in this study provide clear evidence supporting this explanation. The formation of the SCM varied between deeper layers in 2016 and shallower waters in 2017 depending on water-column stratification. Indeed, the sharp horizontal salinity gradient observed at the northernmost reaches of the study area in June 2016 indicates weakened NKCC advection. Moreover, a thick layer of warmer (14–15°C) and more saline (> 34.0) water observed beneath the surface mixed layer in June 2017—possibly corresponding to subduction of the anticyclonic intrathermocline eddy by the northward-flowing EKWC (Son et al., 2014; Lee, 2018)—also indicates that the northward path of the EKWC covered the upper layer of the water-column offshore of the study area. In both summers, water-column stratification led to the development of a steep vertical gradient in nutrients. However, different hydrologic conditions (vertical water-column structure) and thereby a shift of the pycnocline depth determined the formation (and location) of the SCMs in coincidence with the nutrient-rich layer. Our finding is consistent with a prior study in which a thin SCM was found immediately beneath the surface mixed layer (i.e., above a thick lens of homogeneous subsurface water), caused by the upward flux of deep nutrient-replete water in the summer intrathermocline eddy in the UB (Kim et al., 2012). Therefore, in our study, a thinner SCM layer in June 2017 than in 2016 resulted in a reduction of depth-integrated Chl a concentrations, thus driving the wide interannual variability in the magnitude of the phytoplankton bloom.
Diatom Dominance of Phytoplankton Blooms
Another noteworthy result of this study was the dominance of diatoms (> 40% total Chl a) during phytoplankton blooms. Results were consistent with those previously reported north of the SPF (off the Shinpo district of North Korea) in February (Kang et al., 2006) and in the SCM of the UB in spring and summer (Kwak et al., 2014, 2017). The abundance of diatoms showed an inverse relationship with that of small flagellates (i.e., cryptophytes, prasinophytes, and chlorophytes) and non-flagellated taxa (prymnesiophytes, cyanobacteria, and pelagophytes) during both blooms (Figures 5, 8, 9). However, diatom dominance exhibited different spatial patterns between early spring and summer. In March 2016, when the surface mixed layer was much deeper than in June, diatoms dominated the phytoplankton community in the NKCC. A considerable (20–40%) contribution of small flagellates (cryptophytes in 2016; prasinophytes in 2017) along with diatom dominance occurred in typical EKWC water, but did not lead to an increase in depth-integrated biomass (Kwak et al., 2013b). At this time, no marked depletion of nutrients compared to that in June was observed in the surface mixed layer of the study area (Figures 4, 6). These results suggest that two contrasting water masses established the spatial distribution of the phytoplankton community (Park et al., 1991; Hyun et al., 2009; Kim et al., 2010), emphasizing the role of advection of the NKCC rather than water-column stability and nutrient availability during early-spring, diatom-dominated blooms. A similar result was reported for the North Pacific Ocean Oyashio area, where low-salinity coastal Oyashio water regulates the generation and spatial extent of massive spring diatom blooms (Kuroda et al., 2019).
Consistent with prior findings (Kim et al., 2010; Kwak et al., 2013a, 2017), our CCA analysis supports the view that the phytoplankton community responsible for summer (June) blooms may be determined by seasonal hydrographic factors. Indeed, a positive correlation between σt and nutrient levels reflected the vertical structure in water-column properties during periods of strong stratification. A low N:P ratio (< 13 compared with the Redfield ratio of 16) has been generally reported in the EJS, including the UB (Talley et al., 2004; Kim et al., 2010), indicative of N deficiency in the surface layer. Here, the absolute abundance of some important groups (mainly small phytoplanktons, such as prymnesiophytes, prasinophytes, cyanobacteria, and chlorophytes) was negatively correlated with σt and nutrient concentrations. An increased% contribution of cyanobacteria (at the optimum temperature of the surface layer in June 2016) and prymnesiophytes (in the subsurface layer in June 2017) at lower N:P ratios has been previously reported in the EJS (Kim et al., 2010; Kwak et al., 2017). Prasinophytes and chlorophytes are known to be distributed homogeneously with depth in oligotrophic waters (Bel Hassen et al., 2009a,b). In contrast, diatom dominance is closely related to σt and nutrient concentrations that determine the depths of the mixed layer and nitracline. Silicate concentration showed a similar distribution pattern to that of nitrate. Strong stratification in the UB leads to a reduction in the depths of the pycnocline and nitracline and pushes the cold, nutrient-rich water up to the euphotic zone (Kwak et al., 2013a, 2017). Diatoms, as a highly opportunistic group, can rapidly take advantage of favorable nutrient conditions (Fogg, 1991; Cermeño et al., 2008). This characteristic facilitates their biomass accumulation under nutrient-replete conditions, whereas small, flagellates (cyanobacteria, cryptophytes, and chlorophytes) are favored under conditions of low N availability (Tilman et al., 1986; Örnólfsdóttir et al., 2004). As a result, the physicochemical mechanisms (i.e., shallowing of the pycnocline and enhanced nutrient availability) contributing to the formation of the SCM allow dominance of the depth-integrated Chl a biomass during the stratified period, as previously observed in the UB (Kwak et al., 2014, 2017).
Ecological Implications for the Regional Fisheries
The EJS has recently undergone pronounced climate-associated changes in environmental conditions. Sea surface temperature has increased rapidly over several decades (Kim et al., 2001; Kang et al., 2003; Belkin, 2009), leading to long-term shifts in the phenology and community structure of phytoplankton and mesozooplankton (Chiba and Saino, 2003; Rebstock and Kang, 2003; Chiba et al., 2008; Joo et al., 2016). Recent studies also reported significant year-to-year changes in the duration and intensity of the spring phytoplankton bloom in the EJS, showing a decreasing trend in annual primary production in the UB (Joo et al., 2014, 2016; Lee et al., 2014). Higher trophic levels have also been impacted by these changes; thus, recent winter sea surface warming in the northern EJS has led to earlier spawning and hatching of winter-spawning fish (Hiyama et al., 1995; Zuenko, 2011). Additionally, a northward shift of some exploited fish stocks has been reported in Korean waters (e.g., Zhang et al., 2004; Jung, 2014). Indeed, fishing ground of the warm-water common squid Todarodes pacificus has shifted to the north of the EJS (C. I. Lee unpubl.).
Walleye pollock (Theragra chalcogrammus) was one of the most economically important fishery species in Korean waters. Its catch in South Korea has been recorded only in the mid-west frontal area of the EJS (east coast of Korea), where it peaked in the 1970s–1980s, declined in the 1990s, and suffered complete collapse in the 2000s (Kang and Kim, 2015). These authors proposed three plausible hypotheses for this collapse: overfishing, warming of seawater, and changes in ecosystem structure and function. Indeed, pollock larvae move southward (i.e., to the western boundary of the SPF) in the NKCC after spawning in January–March in East Korea Bay (Kim and Kang, 1998; Kang et al., 2013). The spring phytoplankton bloom is likely accompanied by mass proliferation of copepods that subsequently provide food for pollock larvae, thus controlling this fish species’ population dynamics (Kang et al., 2004; Lee et al., 2009). These recent studies emphasize the importance of spring phytoplankton bloom dynamics in regulating overall biological processes in the mid-west shelf and slope frontal area of the EJS in conjunction with global and local variation in oceanographic conditions.
Results of the present study reveal seasonal and interannual shifts in hydrological conditions, from NKCC intrusion into coastal subsurface water to cap of the EKWC throughout the study area. Additionally, asynchronous long-term changes in temperature between upper and deep layers have been observed in the UB, i.e., warming of the upper layer and cooling (or a consistently low temperature) of deep water (Chung et al., 2013; Jung, 2014; Kang and Kim, 2015). Consequently, the unexpected increase in the catch of cold-water species (e.g., cod Gadus macrocephalus and herring Clupea pallasii) has replaced the decreasing warm-water species (e.g., filefish Thamnaconus modestus) during this period of unprecedented environmental change (Jung, 2014). Cold water is found at 100 m depth where pollock reside and are fished (Figures 3, 6). This suggests that the increasing annual mean temperature of the surface mixed layer is not the only factor responsible for the collapse of local stocks of T. chalcogrammus, a cold-water demersal species.
Combined with warming of the surface layer, the timing, duration, and magnitude of spring phytoplankton blooms may be critically important for the schooling of winter- and spring-spawning fish in the EJS (Platt et al., 2003; Zhang et al., 2004; Zuenko, 2011). These authors showed that the overlap between larval hatching of winter-spawning fish and the spring phytoplankton bloom guarantees their successful reproduction and thus recruitment. While earlier spawning of winter-spawning species caused by sea surface warming can lead to a mismatch between spawning and algal blooms, the timing of the bloom could also determine the above mismatch. In this context, results of this study highlight that a variation in hydrological conditions, driven by the NKCC and EKWC, can result in seasonal/interannual fluctuations in the timing of the spring phytoplankton bloom. While the early spring bloom induced by NKCC intrusion may be favorable in terms of prey abundance, late spring (or summer) blooms, resulting from the capping of the EKWC and thereby shoaling of the pycnocline, result in a large temporal mismatch between spawning and bloom occurrence. Thus, Park et al. (2020), using 2003–2015 satellite data, reported low interannual variability in Chl a concentrations and a decreasing trend in spring in coastal waters off Korea compared with high variability and an increasing trend off the Japanese coast. They also reported increasing Chl a concentration in summer in coastal waters off Korea in association with increasing upwelling. This suggests that the present frontal area may be subject to multiple consecutive years of spawning–bloom mismatch. Therefore, the absence of a spring phytoplankton bloom caused by interannual variability and the gradual northward shift of the SPF (Supplementary Figure 8) as well as warming of the surface layer can provide a mechanism explaining the collapse of the walleye pollock stock in this region.
Conclusion
A conceptual paradigm that explains the seasonal variability of primary production and phytoplankton biomass in the UB has been proposed based on water-column stability and its direct link to biogeochemical and phytoplankton-bloom dynamics (Kwak et al., 2013b). Indeed, local forcing processes, such as the strong inflow of the Tsushima Warm Current (Ji et al., 2019), the anticyclonic intrathermocline eddy (Kim et al., 2012; Lee, 2018), and upwelling along the SE coast of Korea (Yoo and Kim, 2004) and transport of upwelled water by the EKWC (Hyun et al., 2009), are known to drive episodic blooms. In the present study, we found early spring and summer phytoplankton blooms in the northern UB and identify the main forcing processes driving these blooms. These were linked to the formation of a SPF, in which summer blooms were fed by the SCM and seasonally strong water-column stability. Specifically, we show that the southward intrusion of the NKCC along the east coast of the Korean peninsula might serve as a key driver of early spring blooms. These were dominantly sustained by diatoms and high nutrient availability. Furthermore, we suggest that the absence of spring blooms caused by long-term variability of the SPF could be an important factor explaining ecosystem changes in this region.
Data Availability Statement
The original contributions presented in the study are included in the article/Supplementary Material, further inquiries can be directed to the corresponding author/s.
Author Contributions
DK, RJ, and C-KK wrote the manuscript, designed the study, and identified overarching research goals. DK, HP, and JJ conducted the field observations. DK, JJ, and CL carried out the biogeochemical measurement and HPLC chemosynthetic analysis of plankton. DK, ZF, and Y-HK analyzed the data and performed statistics. C-KK and CL involved in supervision and funding acquisition. All authors reviewed the manuscript and approved the submitted version.
Funding
This research was supported by “Long-term change of structure and function in marine ecosystems of Korea” and “Walleye pollock stock management based on marine information and communication technology” funded by the Ministry of Oceans and Fisheries, South Korea.
Conflict of Interest
The authors declare that the research was conducted in the absence of any commercial or financial relationships that could be construed as a potential conflict of interest.
Publisher’s Note
All claims expressed in this article are solely those of the authors and do not necessarily represent those of their affiliated organizations, or those of the publisher, the editors and the reviewers. Any product that may be evaluated in this article, or claim that may be made by its manufacturer, is not guaranteed or endorsed by the publisher.
Acknowledgments
We would like to thank the captain and crew members of R/V Tamgu 12 for their supporting during ship board operations.
Supplementary Material
The Supplementary Material for this article can be found online at: https://www.frontiersin.org/articles/10.3389/fmars.2021.790703/full#supplementary-material
Footnotes
References
Bel Hassen, M., Drira, Z., Hamza, A., Ayadi, H., Akrout, F., Messaoudi, S., et al. (2009a). Phytoplankton dynamics related to water mass properties in the Gulf of Gabes: ecological implications. J. Mar. Syst. 75, 216–226. doi: 10.1016/j.jmarsys.2008.09.004
Bel Hassen, M., Hamza, A., Drira, Z., Zouari, A., Akrout, F., Messaoudi, S., et al. (2009b). Phytoplankton-pigment signatures and their relationship to spring–summer stratification in the Gulf of Gabes. Estuar. Coast. Shelf Sci. 83, 296–306. doi: 10.1016/j.ecss.2009.04.002
Belkin, I. M. (2009). Rapid warming of large marine ecosystems. Prog. Oceanogr. 81, 207–221. doi: 10.1016/j.pocean.2009.04.011
Cermeño, P., Dutkiewicz, S., Harris, R. P., Follows, M., Schofield, O., and Falkowski, P. G. (2008). The role of nutricline depth in regulating the ocean carbon cycle. Proc. Natl. Acad. Sci. U.S.A. 105, 20344–20349. doi: 10.1073/pnas.0811302106
Chang, F. H., Zeldis, J., Galli, M., and Hall, J. (2003). Seasonal and spatial variation of phytoplankton assemblages, biomass and cell size from spring to summer across the north-eastern New Zealand continental shelf. J. Plankton Res. 25, 737–758. doi: 10.1093/plankt/25.7.737
Chiba, S., Aita, M. N., Tadokoro, K., Saino, T., Sugisaki, H., and Nakata, K. (2008). From climate regime shifts to lower-trophic level phenology: synthesis of recent progress in retrospective studies of the western North Pacific. Prog. Oceanogr. 77, 112–126. doi: 10.1016/j.pocean.2008.03.004
Chiba, S., and Saino, T. (2003). Variation in mesozooplankton community structure in the Japan/East Sea (1991–1999) with possible influence of the ENSO scale climatic variability. Prog. Oceanogr. 57, 317–339.
Chung, S., Kim, S., and Kang, S. (2013). Ecological relationship between environmental factors and Pacific cod (Gadus macrocephalus) catch in the southern East/Japan Sea. Anim. Cells Syst. 17, 374–382. doi: 10.1080/19768354.2013.853693
Fogg, G. E. (1991). The phytoplanktonic ways of life. New Phytol. 118, 207–212. doi: 10.1111/j.1469-8137.1991.tb00974.x
Hansen, H. P., and Grasshoff, K. (1983). “Automated chemical analysis,” in Methods of Seawater Analysis, eds K. Grasshoff, K. Kremling, and M. Ehrhardt (Weinheim: Verlag Chemie), 347–379.
Helder, W., and de Vries, R. T. P. (1979). An automatic phenol-hypochlorite method for the determination of ammonia in sea and brackish water. Neth. J. Sea Res. 13, 154–160.
Hiyama, Y., Ishida, H., and Goto, T. (1995). Interannual fluctuations in recruitment and growth of the sardine, Sardinops melanostictus, in the Sea of Japan and adjacent waters. Res. Popul. Ecol. 37, 177–183. doi: 10.1007/bf02515818
Hyun, J. H., Kim, D., Shin, C. W., Noh, J. H., Yang, E. J., Mok, J. S., et al. (2009). Enhanced phytoplankton and bacterioplankton production coupled to coastal upwelling and an anticyclonic eddy in the Ulleung Basin. East Sea. Aquat. Microb. Ecol. 54, 45–54. doi: 10.3354/ame01280
Jeffrey, S. W. (1997). “Application of pigment methods to oceanography,” in Phytoplankton Pigments in Oceanography: Guidelines to Modern Methods, eds S. W. Jeffery, R. F. C. Mantoura, and S. W. Wright (Paris: UNESCO Publishing), 127–166.
Ji, R., Jin, M., Li, Y., Kang, Y. H., and Kang, C. K. (2019). Variability of primary production among basins in the East/Japan Sea: role of water column stability in modulating nutrient and light availability. Prog. Oceanogr. 178, 102173.
Joo, H. T., Park, J. W., Son, S., Noh, J.-H., Jeong, J.-Y., Kwak, J. H., et al. (2014). Long-term annual primary production in the Ulleung Basin as a biological hot spot in the East/Japan Sea. J. Geophys. Res. Ocean. 119, 3002–3011. doi: 10.1002/2014jc009862
Joo, H. T., Son, S., Park, J. W., Kang, J. J., Jeong, J. Y., Lee, C. I., et al. (2016). Long-term pattern of primary productivity in the East/Japan Sea based on ocean color data derived from MODIS-aqua. Remote Sens. 8:25. doi: 10.3390/rs8010025
Jung, S. (2014). Asynchronous responses of fish assemblages to climate-driven ocean regime shifts between the upper and deep layer in the Ulleung Basin of the East Sea from 1986 to (2010). Ocean Sci. J. 49, 1–10. doi: 10.1007/s12601-014-0001-1
Kang, D. J., Park, S., Kim, Y. G., Kim, K., and Kim, K.-R. (2003). A moving-boundary box model (MBBM) for oceans in change: an application to the East/Japan Sea. Geophys. Res. Lett. 30:1299. doi: 10.1029/2002GL016486
Kang, J.-H., Kim, W.-S., Chang, K.-I., and Noh, J.-H. (2004). Distribution of plankton related to the mesoscale physical structure within the surface mixed layer in the southwestern East Sea, Korea. J. Plankton Res. 26, 1515–1528.
Kang, S., and Kim, S. (2015). What caused the collapse of walleye pollock population in Korean waters? KMI Int. J. Marit. Aff. Fish. 7, 43–58.
Kang, S., Park, J. H., and Kim, S. (2013). Size-class estimation of the number of walleye pollock Theragra chalcogramma caught in the Southwestern East Sea during the 1970s–1990s. Korean J. Fish. Aquat. Sci. 46, 445–453. doi: 10.5657/kfas.2013.0445
Kang, Y. S., Choi, H. C., Noh, J. H., Choi, J. K., and Jeon, I. S. (2006). Seasonal variation of phytoplankton community structure in the northeastern coastal water off the Korean peninsula. Algae 21, 83–90. doi: 10.4490/algae.2006.21.1.083
Kim, D., Yang, E. J., Kim, K. H., Shin, C.-W., Park, J., Yoo, S., et al. (2012). Impact of an anticyclonic eddy on the summer nutrient and chlorophyll a distributions in the Ulleung Basin, East Sea (Japan Sea). ICES J. Mar. Sci. 69, 23–29.
Kim, K., Kim, K.-R., Min, D.-H., Volkov, Y., Yoon, J.-H., and Takematsu, M. (2001). Warming and structural changes in the East (Japan) Sea: a clue to future changes in global oceans? Geophys. Res. Lett. 28, 3293–3296.
Kim, S., and Kang, S. (1998). The status and research direction for fishery resources in the East Sea/Sea of Japan. J. Korean Soc. Fish. Res. 1, 44–58.
Kim, S.-W., Saitoh, S. I., Ishizaka, J., Isoda, Y., and Kishino, M. (2000). Temporal and spatial variability of phytoplankton pigment concentrations in the Japan Sea derived from CZCS images. J. Oceanogr. 56, 527–538.
Kim, T.-H., Lee, Y.-W., and Kim, G. (2010). Hydrographically mediated patterns of photosynthetic pigments in the East/Japan Sea: low N:P ratios and cyanobacterial dominance. J. Mar. Syst. 82, 72–79.
Kim, Y. H., and Min, H. S. (2008). Seasonal and interannual variability of the North Korean Cold Current in the East Sea reanalysis data. Ocean Polar Res. 30, 21–31. doi: 10.4217/opr.2008.30.1.021
Kuroda, H., Toya, Y., Watanabe, T., Nishioka, J., Hasegawa, D., Taniuchi, Y., et al. (2019). Influence of coastal Oyashio water on massive spring diatom blooms in the Oyashio area of the North Pacific Ocean. Prog. Ocreanogr. 175, 328–344. doi: 10.1016/j.pocean.2019.05.004
Kwak, J. H., Han, E., Lee, S. H., Park, H. J., Kim, K. R., and Kang, C. K. (2017). A consistent structure of phytoplankton communities across the warm–cold regions of the water mass on a meridional transect in the East/Japan Sea. Deep Sea Res. II 143, 36–44. doi: 10.1016/j.dsr2.2017.07.001
Kwak, J. H., Lee, S. H., Hwang, J., Suh, Y. S., Park, H. J., Chang, K. J., et al. (2014). Summer primary productivity and phytoplankton community composition driven by different hydrographic structures in the East/Japan Sea and the Western Subarctic Pacific. J. Geophys. Res. Oceans 119, 4505–4519.
Kwak, J. H., Hwang, J., Choy, E. J., Park, H. J., Kang, D. J., Lee, T., et al. (2013a). High primary productivity and f-ratio in summer in the Ulleung basin of the East/Japan Sea. Deep Sea Res. I 79, 74–85. doi: 10.1016/j.dsr.2013.05.011
Kwak, J. H., Lee, S. H., Park, H. J., Choy, E. J., Jeong, H. D., Kim, K. R., et al. (2013b). Monthly measured primary and new productivities in the ULLEUNG Basin as a biological “hot spot” in the East/Japan Sea. Biogeosciences 10, 4405–4417.
Kwon, K.-Y., Shim, J. H., and Shim, J.-M. (2019). Temporal variations of sea water environment and nutrients in the east coast of Korea in 2013–2017: Sokcho, Jukbyeon and Gampo coastal areas. J. Korean Soc. Mar. Environ. Saf. 25, 457–467. doi: 10.7837/kosomes.2019.25.4.457
Lee, D. (2018). High concentration chlorophyll a rings associated with the formation of intrathermocline eddies. Limnol. Oceanogr. 63, 2806–2814. doi: 10.1002/lno.11010
Lee, D. K., Seung, Y. H., Kim, Y. B., Kim, Y. H., Shin, H. R., Shin, C. W., et al. (2016). “Circulation,” in Oceanography of the East Sea (Japan Sea), eds K. I. Chang, C. I. Zhang, and C. Park (Berlin: Springer), 33–57.
Lee, J. Y., Kim, I. N., Lee, T. S., Kang, C. K., and Kim, K.-R. (2009). Spatial and temporal variability in the pelagic ecosystem of the East Sea (Sea of Japan): a review. J. Mar. Sys. 78, 288–300.
Lee, S. H., Son, S., Dahms, H.-U., Park, J. W., Lim, J.-H., Noh, J.-H., et al. (2014). Decadal changes of phytoplankton Chl-a in the East Sea/Sea of Japan. Oceanology 6, 771–779. doi: 10.1134/s0001437014060058
Lee, Y.-W., Park, M. O., Kim, Y.-S., Kim, S.-S., and Kang, C. K. (2011). Application of photosynthetic pigment analysis using a HPLC and CHEMTAX program to studies of phytoplankton community composition. J. Korean Soc. Oceanogr. 16, 117–124. doi: 10.7850/jkso.2011.16.3.117
Mackey, M. D., Mackey, D. J., Higgins, H. W., and Wright, S. W. (1996). CHEMTAX- a program for estimating class abundances from chemical markers: application to HPLC measurements of phytoplankton. Mar. Ecol. Prog. Ser. 144, 265–283. doi: 10.3354/meps144265
Moon, C.-H., Yang, S.-R., Yang, H.-S., Cho, H.-J., Lee, S.-Y., and Kim, S.-Y. (1998). Regeneration process of nutrient in the polar front area of the East Sea. J. Korean Fish. Soc. 31, 259–266.
Murphy, J., and Riley, J. P. (1962). A modified single solution method for the determination of phosphate in natural waters. Anal. Chim. Acta 27, 31–36. doi: 10.1021/ja038277x
Örnólfsdóttir, E. B., Lumsden, S. E., and Pinckney, J. (2004). Phytoplankton community growth-rate response to nutrient pulses in a shallow turbid estuary, Galveston Bay, Texas. J. Plankton Res. 26, 325–339.
Park, J. S., Kang, C. K., and An, K. H. (1991). Community structure and spatial distribution of phytoplankton in the polar front region off the East Sea of Korea in summer. Bull. Korean Fish. Soc. 24, 237–247.
Park, J.-E., Park, K.-A., Kang, C. K., and Kim, G. (2020). Satellite-observed chlorophyll-a concentration variability and its relation to physical environmental changes in the East Sea (Japan Sea) from 2003 to 2015. Estuar. Coast. 43, 630–645. doi: 10.1007/s12237-019-00671-6
Park, K. A., Ullman, D. S., Kim, K., Chung, J. Y., and Kim, K. R. (2007). Spatial and temporal variability of satellite-observed Subpolar Front in the East/Japan Sea. Deep Sea Res. I 54, 453–470. doi: 10.1016/j.dsr.2006.12.010
Park, K.-A., Chung, J. Y., and Kim, K. (2004). Sea surface temperature fronts in the East (Japan) Sea and temporal variations. Geophys. Res. Lett. 31:L07304. doi: 10.1029/2004GL019424
Platt, T., Fuentes-Yaco, C., and Frank, K. T. (2003). Spring algal bloom and larval fish survival. Nature 423, 398–399. doi: 10.1038/423398b
Rebstock, G. A., and Kang, Y. S. (2003). A comparison of three marine ecosystems surrounding the Korean peninsula: responses to climate change. Prog. Oceanogr. 59, 357–379. doi: 10.1016/j.pocean.2003.10.002
Shin, H. R., Kim, C. W., Byun, S. K., and Hwang, S. C. (2005). Movement and structural variation of warm eddy WE 92 for three years in the western East/Japan Sea. Deep-Sea Res. II 52, 1742–1762.
Son, Y.-T., Chang, K.-I., Yoon, S.-T., Rho, T., Kwak, J. H., Kang, C. K., et al. (2014). A newly observed physical cause of the onset of the subsurface spring phytoplankton bloom in the southwestern East Sea/Sea of Japan. Biogeosciences 11, 1319–1329.
Talley, L. D., Tishchenko, P., Luchin, V., Nedashkovskiy, A., Sagalaev, S., Kang, D. J., et al. (2004). Atlas of Japan (East) Sea hydrographic properties in summer, 1999. Prog. Oceanogr. 61, 277–348. doi: 10.1016/j.pocean.2004.06.011
Teague, W. J., Jacobs, G. A., Mitchell, D. A., Wimbush, M., and Watts, D. R. (2004). Decadal current variations in the southwestern Japan/East Sea. J. Oceanogr. 60, 1023–1033. doi: 10.1007/s10872-005-0010-x
Ter Braak, C. J. F., and Smilauer, P. (2002). CANOCO Reference Manual and CanoDraw for Windows User’s Guide: Software for Canonical Community Ordination (Version 4.5). Wageningen: Biometris.
Tian, Y., Kidokoro, H., and Watanabe, T. (2006). Long-term changes in the fish community structure from the Tsushima warm current region of the Japan/East Sea with an emphasis on the impacts of fishing and climate regime shift over the last four decades. Prog. Oceanogr. 68, 217–237. doi: 10.1016/j.pocean.2006.02.009
Tilman, D., Kiesling, R., Sterner, R., Kilham, S. S., and Johnson, F. A. (1986). Green, bluegreen and diatom algae: taxonomic differences in competitive ability for phosphorus, silicon and nitrogen. Arch. Hydrobiol. 106, 473–485.
Wright, S. W., Thomas, D. P., Marchant, H. J., Higglns, H. W., Mackey, M. D., and Mackey, D. J. (1996). Analysis of phytoplankton of the Australian sector of the Southern Ocean: comparisons of microscopy and size frequency data with interpretations of pigment HPLC data using the ‘CHEMTAX’ matrix factorization program. Mar. Ecol. Prog. Ser. 144, 285–298. doi: 10.3354/meps144285
Yamada, K., Ishizaka, J., Yoo, S., and Kim, H. C. (2004). Seasonal and interannual variability of sea surface chlrophyll a concentration in the Japan/East Sea (JES). Prog. Oceanogr. 61, 193–211. doi: 10.1016/j.pocean.2004.06.001
Yoo, S., and Kim, H. C. (2004). Suppression and enhancement of the spring bloom in the southwestern East Sea/Japan Sea. Deep Sea Res. II 51, 1093–1111. doi: 10.1016/s0967-0645(04)00102-x
Yoo, S., and Park, J. (2009). Why is the southwest the most productive region of the East Sea/Sea of Japan? J. Mar. Syst. 78, 301–315. doi: 10.1016/j.jmarsys.2009.02.014
Yun, J.-Y., Magaard, L., Kim, K., Shin, C.-W., Kim, C., and Byun, S. K. (2004). Spatial and temporal variability of the North Korean Cold Water leading to the near-bottom cold water intrusion in Korea Strait. Prog. Oceanogr. 60, 99–131.
Zapata, M., Rodriguez, F., and Garrido, J. L. (2000). Separation of chlorophylls and carotenoids from marine phytoplankton: a new HPLC method using a reversed phase C8 column and pyridine-containing mobile phases. Mar. Ecol. Prog. Ser. 195, 29–45. doi: 10.3354/meps195029
Zhang, C. I., Lee, J. B., Young, I. S., Yoon, S. C., and Kim, S. (2004). Variations in the abundance of fisheries resources and ecosystem structure in the Japan/East Sea. Prog. Oceanogr. 61, 245–265.
Keywords: phytoplankton, diatom bloom, photosynthetic pigments, subpolar front, Ulleung Basin, East/Japan Sea, trophodynamics, ocean currents
Citation: Kim D, Ji R, Park HJ, Feng Z, Jang J, Lee CI, Kang Y-H and Kang C-K (2021) Impact of Shifting Subpolar Front on Phytoplankton Dynamics in the Western Margin of East/Japan Sea. Front. Mar. Sci. 8:790703. doi: 10.3389/fmars.2021.790703
Received: 07 October 2021; Accepted: 08 November 2021;
Published: 07 December 2021.
Edited by:
Wei-Bo Chen, National Science and Technology Center for Disaster Reduction (NCDR), TaiwanReviewed by:
Chenggang Liu, Ministry of Natural Resources, ChinaYoung-Heon Jo, Pusan National University, South Korea
Copyright © 2021 Kim, Ji, Park, Feng, Jang, Lee, Kang and Kang. This is an open-access article distributed under the terms of the Creative Commons Attribution License (CC BY). The use, distribution or reproduction in other forums is permitted, provided the original author(s) and the copyright owner(s) are credited and that the original publication in this journal is cited, in accordance with accepted academic practice. No use, distribution or reproduction is permitted which does not comply with these terms.
*Correspondence: Chang-Keun Kang, Y2trYW5nQGdpc3QuYWMua3I=