 Chao Cao1,2,3,4,5*
 Feng Cai1,2,3,4,5*Hongshuai Qi1,2,3,4,5Jianhui Liu1,2,3,4,5Gang Lei1,2,3,5Kai Zhu6
 Zijian Mao6
- 1Third Institute of Oceanography, Ministry of Natural Resources, Xiamen, China
- 2Fujian Provincial Key Laboratory of Marine Ecological Conservation and Restoration, Xiamen, China
- 3Key Laboratory of Marine Ecological Conservation and Restoration, Ministry of Natural Resources, Xiamen, China
- 4Fujian Provincial Station for Field Observation and Research of Island and Costal Zone in Zhangzhou, Xiamen, China
- 5Southern Marine Science and Engineering Guangdong Laboratory, Zhuhai, China
- 6Fuzhou University, Fuzhou, China
Global climate change-induced sea-level rise and storm wave intensification, along with the large population densities and high-intensity human development activities in coastal areas, have caused serious burden and damage to China’s coasts, led to the rapid growth of artificial shorelines development, and formed a “new Great Wall” of reinforced concrete against the laws of nature. After the last ice age, transgression formed the different features of China’s coast. Depending on the types of geological and landform features, coasts are divided into 36 evaluation units, and 10 indicators are selected from natural aspects (including tectonics, geomorphology, sediment, and storms) and aspects of social economy (population, GDP, Gross Domestic Product), and cloud model theory is used to build a coastal erosion vulnerability evaluation index system in China. The results show that high grade (V), high-middle grade (IV), middle grade (III), low-middle grade (II), and low grade (I) coastal erosion vulnerability degrees account for 5.56, 13.89, 41.67, 33.33, and 5.56% of the Chinese coastlines, respectively. The coastal erosion vulnerability of the subsidence zone is significantly higher than that of the uplift zone. Reverse cloud model and analytic hierarchy process calculation show that the main factors that control coastal erosion vulnerability since the transgression after the last ice age are geological structure, topography and lithological features, and in recent years, the decrease in sea sediment loads and increase in reclamation engineering. Mainland China must live with the basic situation of coastal erosion, and this study shows that the index system and method of cloud modeling are suitable for the evaluation of the coastal erosion vulnerability of the Chinese mainland. This study provides a scientific basis for the adaptive management of coastal erosion, coastal disaster assessment and the overall planning of land and sea.
Introduction
The coastal zone is an important area of social and economic development in coastal countries, and it is also the most active zone of human activities (McGranahan et al., 2007; Nicholls et al., 2007; Neumann et al., 2015; Jevrejeva et al., 2016; Luijendijk et al., 2018). Globally, 65% of the word’s cities with populations of more than 5 million people are located in coastal lowlands below 10 m above sea level (Ranasinghe, 2016; Toimil et al., 2017; Le Cozannet et al., 2019). In recent decades, with global climate change, sea-level rise and frequent storm surges, coastal zones have become increasingly sensitive to natural disasters, which make coastal erosion increasingly serious (Vörösmarty, 2003; Ge et al., 2017; Udo and Takeda, 2017; Ma et al., 2019; Ranasinghe et al., 2019; Vousdoukas et al., 2020). Mainland China has an 18,000 km-long coastline, with a dense population and developed economy. The coastal economic belt, which accounts for 13% of the land area and 42% of the country’s population, creates more than 60% of the country’s GDP (Gross Domestic Product) (Cai et al., 2009). Coastal areas play an important role in Chinese social and economic development. The length of the coastline that is eroded in China is approximately 3,255.3 km and approximately 49.5% of sandy beaches are eroded (Cai et al., 2009). In 2017, coastal erosion caused the losses of 14.3 ha (hectare) of national land and 350 million yuan. With economic development, many artificial shorelines have been built in economically developed and densely populated areas (Theuerkauf et al., 2014; IPCC, 2017; Toimil et al., 2017). In China, the proportion of human-made coastal areas is approximately 70%, forming the new Great Wall (Luo et al., 2013; Ma et al., 2014). Utilization of the coast (reclamation and the sea aquaculture) takes up too many shoreline resources, and fills the sea with dredged sand, which also damages the coastal ecological function and landscape. Under such environmental conditions, the dynamic balance of marine dynamics and sediment transport in the nearshore area has been changed from the original natural conditions. Seemingly powerful revetment banks violate the natural order and often cause coastal erosion from shorelines to revetment feet and nearshore areas, and the types of erosion range from visible to latent (Anderson et al., 2015; Mentaschi et al., 2018). The vulnerability of coastal erosion to disasters is increasing, and the potential risk of these disasters is also increasing (Zhang et al., 2001; Molnar et al., 2007; Wang et al., 2007; Athanasiou et al., 2020). Coastal erosion has a direct impact on coastal areas’ functions, such as land use, living environment, property safety and shipping, and has become an important natural disaster in coastal areas because of its impacts on human social and economic development.
Coastal vulnerability to erosion is related to the performance of the inherent and external attributes of the coast. It is important to identify index factors to evaluate coastal erosion (McGranahan et al., 2007; Gao et al., 2015). It is particularly important to identify the factors that affect the vulnerability of current coasts to disasters and those that play important roles in disaster risk assessment and management (Milliman et al., 2008; Cai et al., 2009). In current coastal erosion vulnerability assessments, the important influences of geological structures and natural landforms on coastal erosion vulnerability are ignored, and the impact of human activities on coastal erosion is overemphasized; on the other hand, the research is mostly focused on regional evaluations at medium and small scales, and national large-scale research is lacking. At the same time, in recent years, most coastal vulnerability assessments have focused on sea-level rise and storms caused by climate change; for coastal erosion vulnerability assessments, the assessment methods are outdated and too subjective, and there is no trend or predictability (FitzGerald et al., 2008; Kirwan et al., 2016; Jankowski et al., 2017). Therefore, for large-scale coastal erosion vulnerability assessment in China, it is necessary to use a coastal erosion vulnerability assessment method that is consistent with the structural geology, physical geography and sediment transport characteristics of China’s coastal areas. Based on cloud model theory and analytic hierarchy process (AHP), this study evaluates the degree and grade of coastal erosion vulnerability of a research object. Firstly, the uncertainty of the membership degree of the research object is described by the three digital characteristics of expectation, entropy and super-entropy, and the membership cloud map is described, which solves the uncertainty problem that only one membership value can be calculated for a certain research object by previous methods. Both probability and statistics, and common sense. At the same time, the AHP determines the factor weight by combining the entropy weight method of factor layer with the Delphi method of factor layer, which effectively and reasonably solves the irrationality of the subjective evaluation method of factor weight and the simple objective method of equal weight (McGranahan et al., 2007; Davidson-Arnott, 2010; Li and Du, 2014; Zhou et al., 2014; Angela and Giorgio, 2020). It is valuable to evaluate the coastal erosion vulnerability characteristics of China by using the cloud model method based on the unique tectonic geology and landform attributes of China’s coastal zones.
In this study, considering the natural and socioeconomic factors affecting coastal erosion vulnerability, and the characteristics of human and geological structures, coastal topography, etc. combined with multisource data sets (remote sensing, field survey, big data, statistical data, etc.), a set of national comprehensive evaluation index systems and models of coastal erosion vulnerability is established, which is suitable for large-scales with natural and prominent artificial characteristics.
Materials and Methods
Study Area
The Chinese coastal zone is located in southeastern Eurasia and eight different terrestrial climatic zones. The mainland continental coastline is approximately 18,000 km long and includes the uplift zones and subsidence zones of different tectonic elements (Cai et al., 2019), as well as different coastal landscape types, such as hills and plains. It forms a structural pattern of “three blocks and two belts,” with the Sino-Korean block, the Yangtze block, the South China block, the Dabie-Linjin River and the Jiangsha-Wuachuan plate junction. The neocathaysian structural system formed a large-scale tectonic pattern of 4 uplift zones and 3 subsidence zones parallel to each other in the NE direction along the coast of China. In the uplift zones, the crust is uplifted to form mountains and hills, and the pre-Cenozoic crystalline bedrock is exposed and in a state of denudation. The coastal morphology is controlled by the NNE-NE and NNW-NW faults in the neocathaysian structural system, which forms the serrated bedrock headland and harbor morphology. In the subsidence zone, the crust sank into a basin and accepted the filling and compensation of sediment from rivers and seas, which shaped the plain and the plain coast of eastern China. Neotectonic activity not only directly dominates the topography and the distribution of Quaternary sediments in China but also is one of the important factors that leads to the differences in coastal morphologies and coastline changes.
The types and evolution of coastal geomorphology in China are controlled by the interactions and influences of endogenic and exogenic processes (Li et al., 2015; Luo et al., 2015). As shown in Figure 1, the Mesozoic-Cenozoic structural geology division in the eastern part of the Chinese mainland is the main reason for the regional difference in the landforms and characteristics of the coastal land. In the coastal area of the subsidence zone, the Liaohe River, Hai River and Yellow River delta plain have formed a typical broad and straight coastal plain and delta estuarine lowland (Fang et al., 2017). A large amount of sediment has been delivered to the sea and has gradually formed into lagoons, cheniers, flat muddy seabeds, subtidal zones and other secondary geomorphic features. In the coastal area of the uplift zone, most of the crust is in a state of uplift and denudation, and the landforms are characterized by eroded and denuded mountains, hills and platforms. The transgression in the late Holocene after the last ice age resulted in the formation of many twists and turns in drowned valley-type bedrock bays.
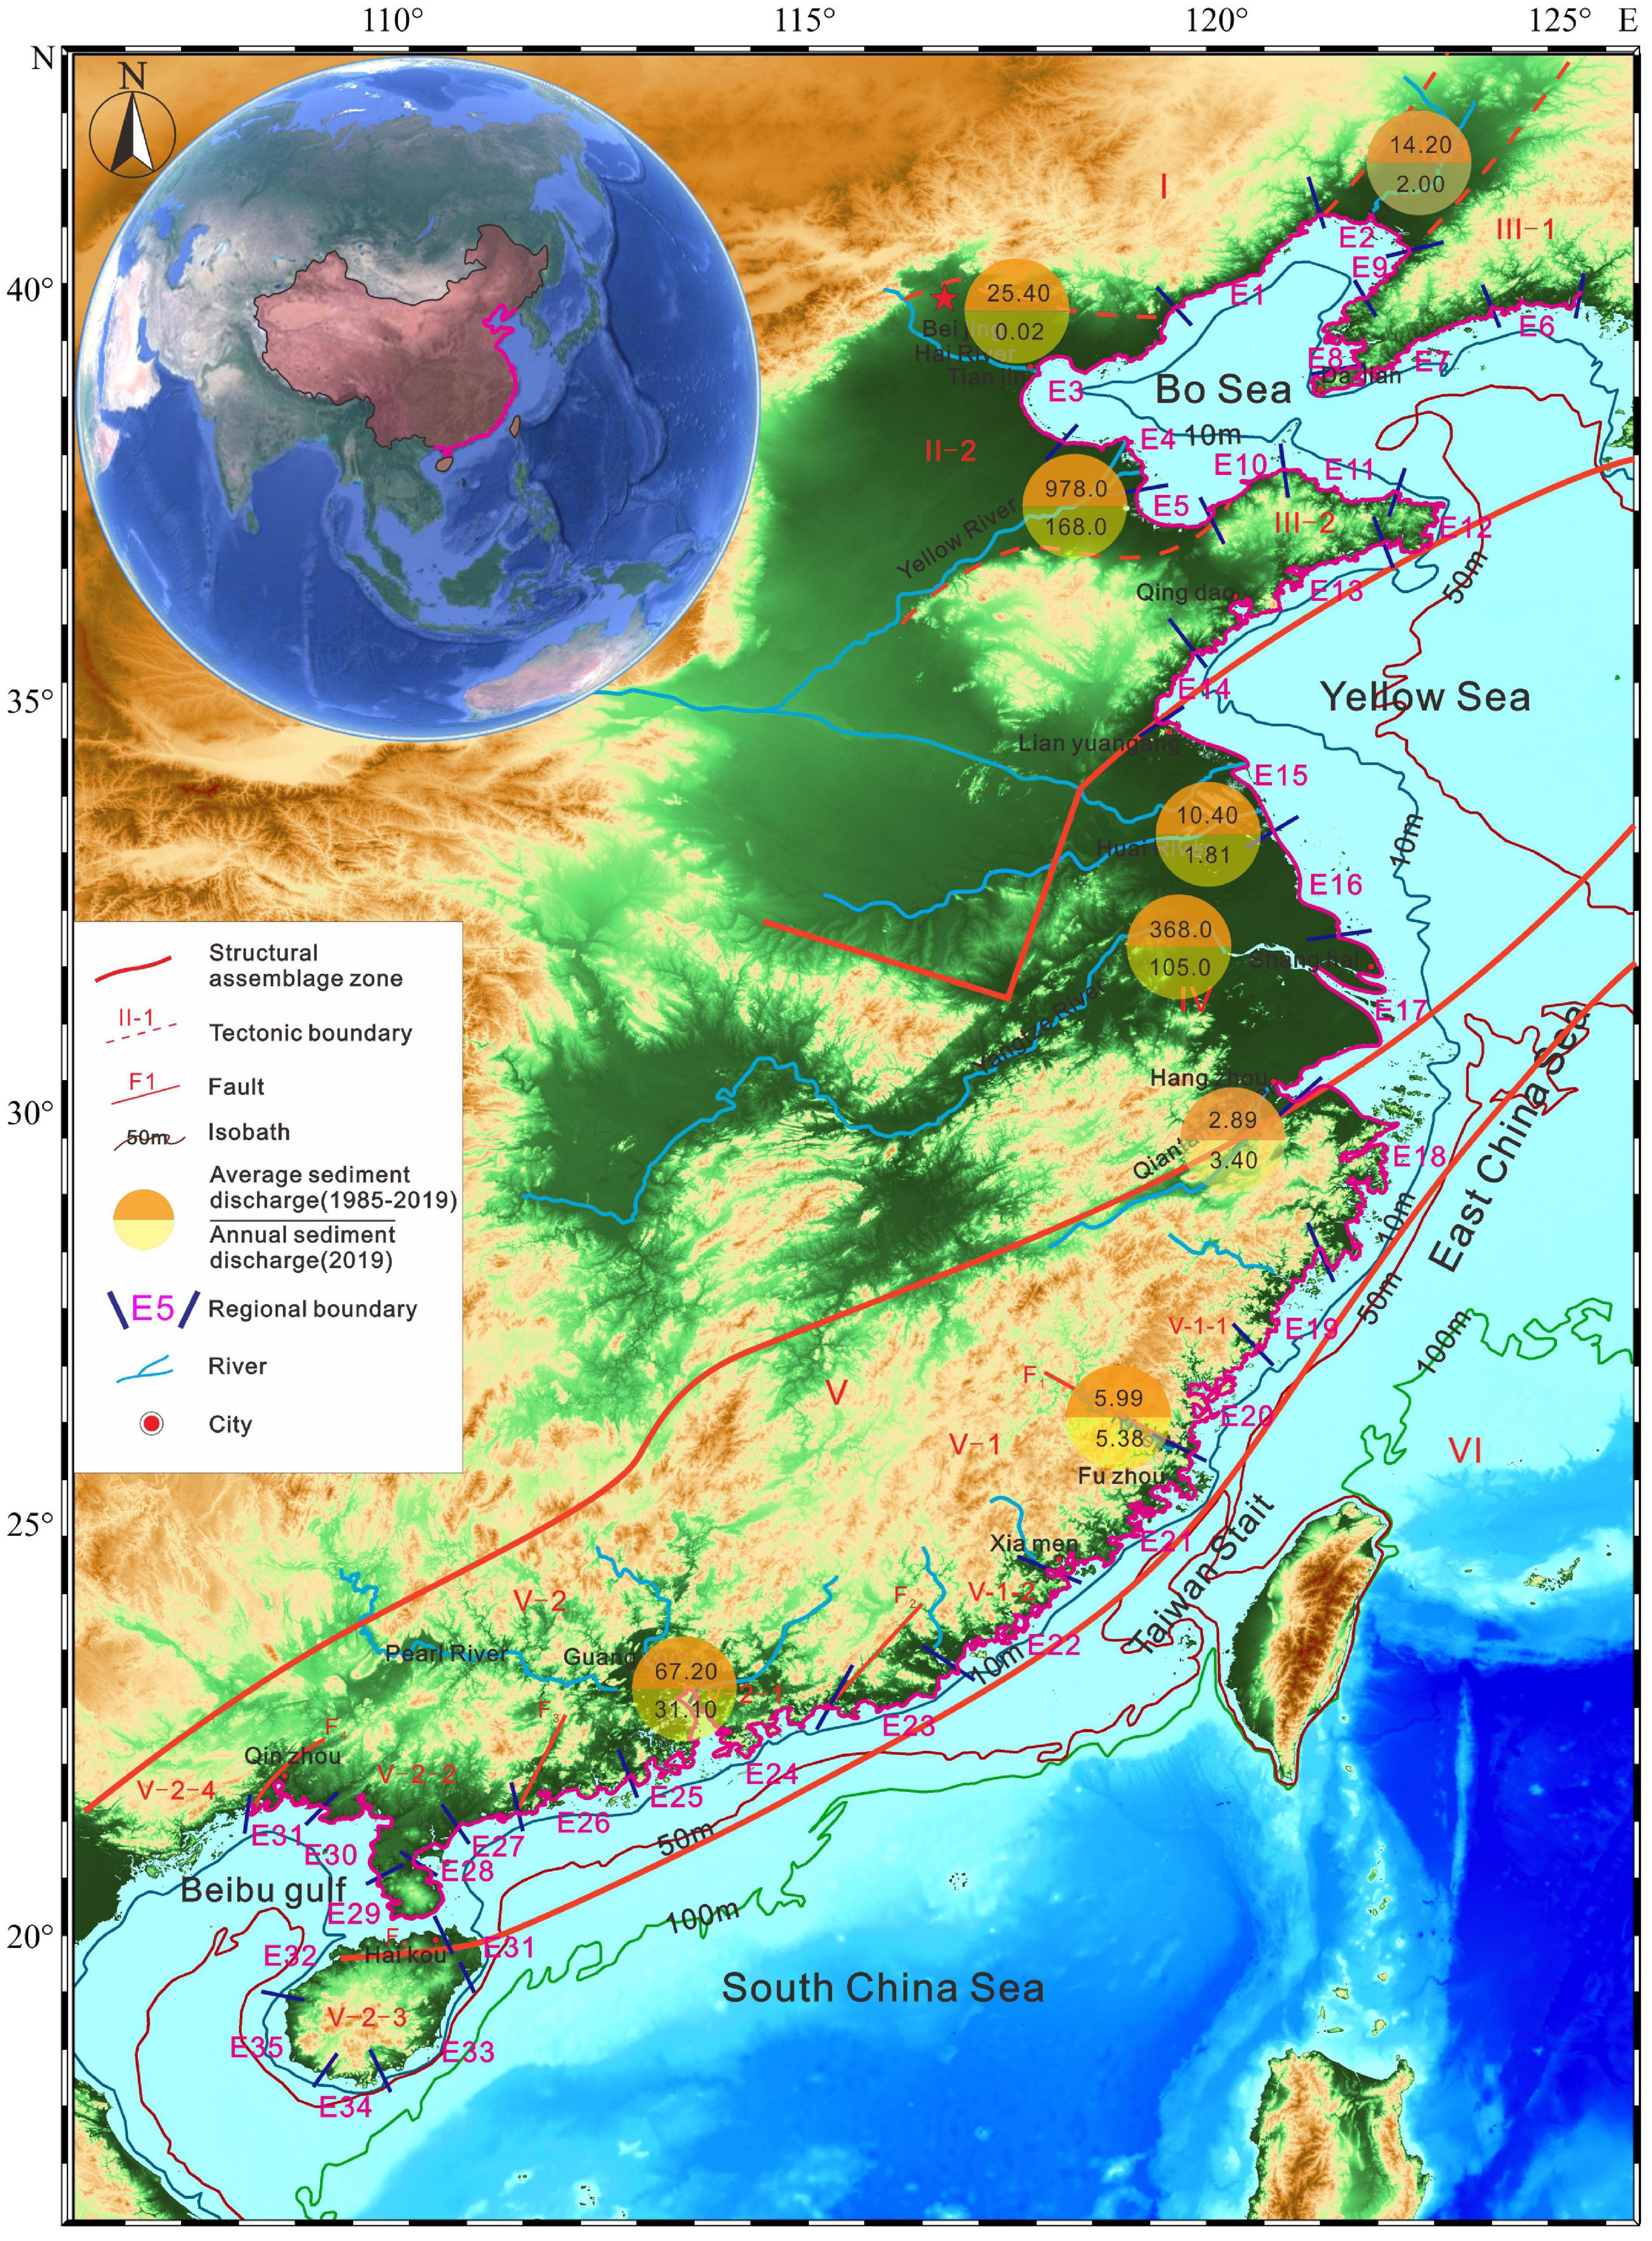
Figure 1. Division of coastal erosion vulnerability assessment units and structural divisions in China and schematic diagram of sediment inflow into the sea. The asterisk represents the capital of China.
In the past 10 years (2010–2019), the total runoff from hydrologically representative stations of major rivers in China was 1,523 billion cubic meters (m3), which is 9% larger than the average annual runoff of 1,397 billion m3, and 8% larger than the average annual runoff of 1,407 billion m3 in last 10 years. The total annual sediment discharge of the representative stations is 345 million tons, which is 77% less than the average annual sediment discharge of 1.51 billion tons and is basically equal to the average value of 357 million tons in last 10 years. The runoff of the Yangtze River and the Pearl River representative stations in 2019 accounted for 61 and 21% of the total annual runoff of the representative stations, respectively (Luo et al., 2013; Ma et al., 2014). The annual sediment discharge of representative stations in the Yangtze River and the Yellow River account for 30 and 49% about the total annual sediment discharge, respectively.
China is a country with a long coastline, and the total length from north to south (excluding Hong Kong, Macao, and Taiwan) is 19,955 km (Li et al., 2015). In recent years, under the background of global warming induced sea-level rise and storm surge strengthening, China, like other coastal countries and regions in the world, is facing increasing coastal erosion, which has had serious impacts on the productivity and lives of coastal people. According to the results of the 908 special survey, and the standard definition of eroded coastlines as those with erosion rates greater than 0.5 m/a (Cai et al., 2019), the total length of eroded coastline in China’s mainland is 3,255.3 km, of which the length of sandy eroded coastline is 2,463.4 km, accounting for 49.5% of the national sandy coasts; the length of eroded silty mud coastline is 791.9 km, accounting for 7.3% of China’s silty coasts. The impact of human activities on coastal erosion is increasingly prominent. Such as river basin development, coastal sand mining, artificial coastal construction, ecological environment destruction (Theuerkauf et al., 2014; IPCC, 2021). At present, China’s coastal erosion is facing four challenges: the decrease in sediment from rivers into the sea, the rise in sea level caused by global warming, the increase in the frequency and intensity of typhoons and storm surges, and the increasing intensity of human development activities (Cai et al., 2019). It is an indisputable fact that the pace of coastal erosion is accelerated. The threat of this kind of erosion disaster will be difficult to contain and will continue for a long time.
Evaluation Index Construction
The vulnerability assessment system of coastal erosion in this study includes two issues: the natural issues are the internal and external characteristics of the system, where coastal characteristics are internal characteristics and coastal dynamic conditions are external characteristics (Mattei et al., 2018; Pranzini, 2018; Rizzo et al., 2020), the social, economic and human activities issues are recovery capacity and disaster-reduction capacity in the face of potential loss due to coastal erosion. The coastal characteristics include the length of Quaternary deposits strata, the sand-mud ratio, the sediment amount entering the sea, and the rate of variation in the depth line of 0 m, the coastal dynamic conditions include the effective wave height and storm influence, the social and economic conditions include population and GDP. Human activities influence includes the length of artificial shoreline and the reclamation area (Table 1; Denner et al., 2015; Donchyts et al., 2016; Williams et al., 2018; Molina et al., 2020).
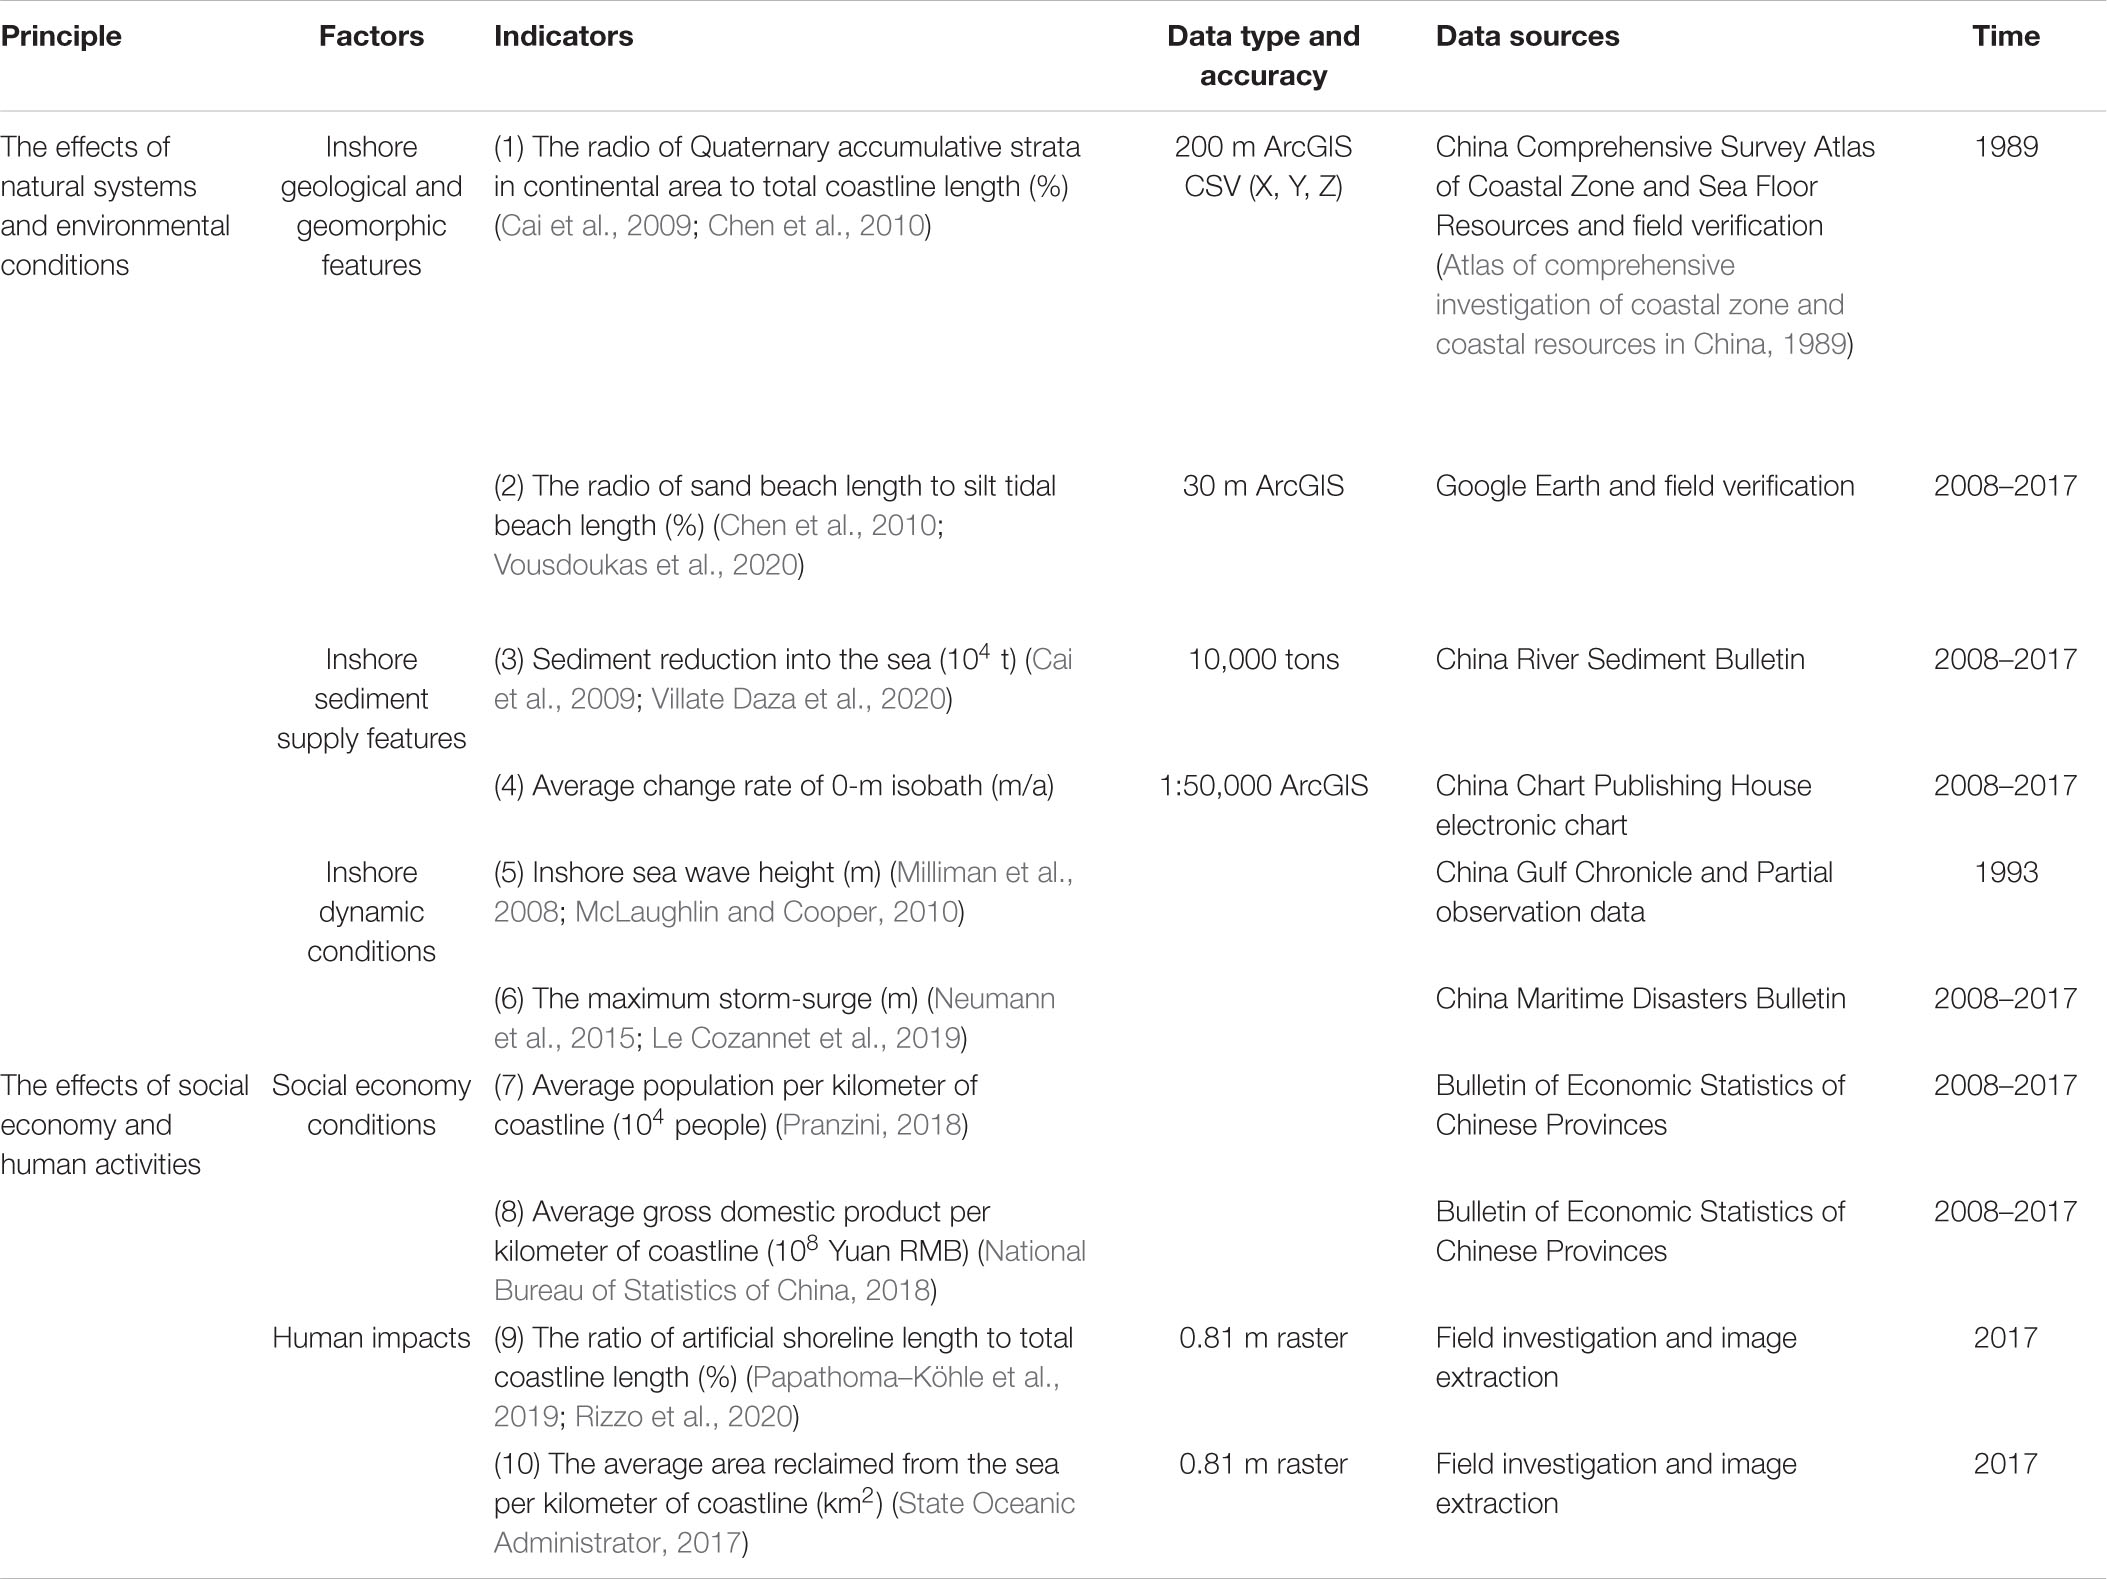
Table 1. Index factor information of coastal erosion vulnerability.
Indicator Concepts and Data Sources
(1) The shoreline of Quaternary accumulation strata usually refers to the various types of accumulation that formed in the Quaternary Period and are exposed on land and coastal areas, including residual, slope, alluvial, lacustrine, and aeolian deposits, marine deposits of weathered bedrock crust, and the coastlines formed by volcanic accumulation and artificial accumulation (Rizzo et al., 2020; Vousdoukas et al., 2020). Based on the geological map data (1:200,000) in the Comprehensive Survey Atlas of China’s Coastal Zone and Tidal Flat Resources published by the State Oceanic Administration and the State Bureau of Surveying and Mapping in 1989, each evaluation unit Ej (J = 1,2,…,36) has a total length of coastline in the coastal section and a coastline length of Quaternary accumulation strata, including Holocene deposits (QH) and Pleistocene deposits (QP), and the comparison between them is u1. Larger the sample data of u1, indicate higher coastal erosion vulnerability of the assessment unit.
(2) The ratio of u2 reflects whether the intertidal beach is in a state of erosion or deposition since the last transgression (Chen et al., 2010; Vousdoukas et al., 2020). The online remote sensing information of Earth/Google maps was used to extract the shoreline lengths of sandy beaches, bedrock beaches and muddy silt tidal beaches. The u2 dataset is composed of the actual ratios of the lengths of the sandy beach shorelines and the lengths of the muddy silt tidal beaches of each evaluation unit Ej in China. Larger sample data of u2 indicate lower coastal erosion vulnerability of the assessment unit.
(3) The inter annual variations in sediment discharge from different rivers is very obvious in China, which is an important indicate of whether sediment movement in coastal beaches loses balance (Cai et al., 2009; Villate Daza et al., 2020). The u3 factor index sample data are based on data published in the past 10 years. Linear regression analysis is used to obtain the different degrees of relative sediment reduction of each evaluation unit along the coast of China between 2008 and 2017. Larger sample data of u3 indicate higher coastal erosion vulnerability of the assessment unit.
(4) In the last 10 years, the 0-m isobaths retreated to land or pushed toward the sea, which is usually expressed as an increase or decrease, respectively, in the area of beach sediments in the section. This factor index is practical for measuring the vulnerability of coasts to erosion (Asensio-Montesinos et al., 2020). We extract the change in the u4 factor index in the coastal section of each evaluation unit based on the 1:200,000 scale charts published by the China Chart Publishing House (Tianjin) in 2008 and 2017 The value of land contraction regression (m/a) is expressed as a positive value, which reflects an increase in erosion vulnerability; conversely, the negative value of the transgression to the sea reflects a reduction in vulnerability.
(5) In the process of wave propagation from a deep water area to a coastal shallow water area, the wave becomes shallower, refracts, and diffracts until the wave surface breaks, which is called a nearshore wave; when the wave breaks, its energy immediately gathers to form a shock wave and has a large impact force (Milliman et al., 2008; McLaughlin and Cooper, 2010), which causes serious erosion disasters to the coasts, beach sediments or buildings. The data source of the u5 factor index is the annual average wave height obtained from the statistical data measured by wave observation stations in deep water areas. Larger sample data of u5 indicate higher coastal erosion vulnerability of the assessment unit.
(6) Storm surges are mainly caused by sudden changes in strong winds and pressures caused by tropical storms or extratropical cyclones. Based on this simple and dominant principle (Neumann et al., 2015; Le Cozannet et al., 2019), we extract the u6 factor index sample data by using the data of the China marine disaster Bulletin (2008–2017), according to the observation results of each evaluation unit coastal section from 2008 to 2017. Regardless of the number of storm surges, only the maximum surge value (m) is extracted. Obviously, larger values of u6 indicate that the coastal area is more vulnerable to erosion.
(7) For the extraction of the u7 index sample data, we mainly use the “Demographic Yearbook” of China’s coastal provinces and cities, divide the total population of each prefecture-level city (Hainan Province according to the county-level city) in 2017 by its coastline length and then merge them into each evaluation unit to obtain the current average population per kilometer of coastline in each evaluation unit (unit: 10,000 people). Larger sample data of u7 indicate higher coastal erosion vulnerability of the assessment unit.
(8) For the extraction of u8 factor index sample data, according to the statistical yearbook GDPs of China’s coastal provinces and cities, we divide the total GDP of each prefecture-level city (Hainan Province according to county-level city) in 2017 by its coastline length and then merge them into each evaluation unit to obtain the current average GDP per kilometer of coastline in each evaluation unit (unit: 100 million yuan). Larger sample data of u8 indicate lower coastal erosion vulnerability of the assessment unit.
(9) The artificial coastline refers to the coastline with enough land area enveloped by permanent artificial coastal structures, that is, the actual land-sea boundary formed after artificial transformation (Papathoma–Köhle et al., 2019; Rizzo et al., 2020). The extraction method is mostly based on the principle of the seaward side cutting of artificial dams. The sample data index extraction of the u9 factor is mainly based on the remote sensing image data of Google Earth (2017), mainly by manual identification, supplemented by field verification and published achievement data verification. The artificial coastline length is calculated in ArcGIS software. The proportion of the current artificial coastline length in the total coastline length of each evaluation unit (%) is obtained by division.
(10) The index of this factor refers specifically to the secondary type of artificial coastline, the area of coasts occupied by various reclamation types in the last 10 years, which accounts for the average area of coasts within each kilometer of the total coastline 10 years ago (Cai et al., 2009; Luo et al., 2015). The index of this factor refers specifically to the secondary type of artificial coastline, the area of coasts occupied by various reclamation types in the last 10 years, which accounts for the average area of coasts within each kilometer of the total coastline 10 years ago. Mainly using Google Earth’s remote sensing image data (2008–2017), mainly by manual identification, supplemented by field verification and published achievement data verification, the total reclamation area in the last 10 years is calculated in ArcGIS software. The total reclamation area (km2) in each evaluation unit is divided by the original total coastline length (km), to obtain the average land reclamation area per kilometer of coastline length for each evaluation unit in the last 10 years.
Cloud Model Computing
A normal cloud is defined with three digital characteristics, expected value Ex, entropy En, and hyper entropy He and a cloud, namely (Ex, En, He). Expectation Ex is the position at u corresponding to the center of gravity of the cloud (Li and Du, 2014). In other words, the element Ex in the universe of discourse is fully compatible with the linguistic term. The entropy En is a measure of the coverage of the concept within the universe of discourse. In other words, En is defined by of the normal cloud showing how many elements in the universe of discourse could be accepted to the linguistic term, the greater En, and the broader coverage. It can be also considered as a measure of fuzziness of the concept, representing the scope of the universe of discourse that can be accepted by the concept. The hyper entropy He is the entropy of the entropy En. It is a measure of dispersion of the cloud drops; it can be used a measure of thickness of the cloud, which not only reflects the randomness of samples appearing that represent qualitative concepts value but also reveals the relatedness between fuzziness and randomness. Normal cloud model makes full use of the universality of the normal distribution and normal membership function, which not only broaden the formation conditions of the normal distribution but also make the normal membership function be the expectation of the random membership degree; the randomness and fuzziness are represented uniformly by entropy and then the theoretical basis of universality of the normal cloud model is established. Cloud model has the 3σ characteristics; there are 99.7% drops of cloud located in [Ex-3En, Ex+3E]. These drops of cloud are generated by the normal cloud generator. Atomized feature of the cloud model: the drops of cloud spread around while the hyper entropy is increasing, but many drops still stand in the central area of the cloud, which can be used to adjust the strategies of the evolution and help to escaping from local optima (Zhou et al., 2014).
Based on the characteristics of crustal uplift during the neotectonic movement, the coastal regions of China are divided into 10 coastal regions. Then, the coastal regions of China are divided into 36 evaluation units according to the basic outline of the quaternary coastal geomorphology, the coastal dynamic conditions and the genetic characteristics of coastal erosion (Figure 1). Ten factors of each evaluation unit were extracted (Table 1) and normalized. The expected value (Exj), entropy (Enj), and hyperentropy (Hej) of the 36 evaluation units were calculated by using the AHP to calculate the weights of the 10 factors and combined with the reverse Gaussian cloud algorithm of cloud model theory (McGranahan et al., 2007; Davidson-Arnott, 2010; Ma et al., 2014; Angela and Giorgio, 2020) to form the cloud model of the erosion vulnerability cloud model of mainland China.
Results
Vulnerability Levels of Coastal Erosion
The evaluation results of the Ej coastal erosion vulnerability cloud model of the 36 evaluation units were collected (Table 2). Through the forward cloud algorithm, Python software programming was applied to generate the cloud map of the comprehensive results of each evaluation unit (Figure 2). In Figure 2, Ej (j = 1, 2,…, 36) cloud maps of each evaluation unit are arranged in order of their Ej values according to the corresponding x/CVI distribution points on the x-coordinate of the evaluation set to represent the distribution of the coastal erosion vulnerability class where each Ej cloud map is located. The value on the peak of each cloud map is the number of coastal sections of the evaluation unit.
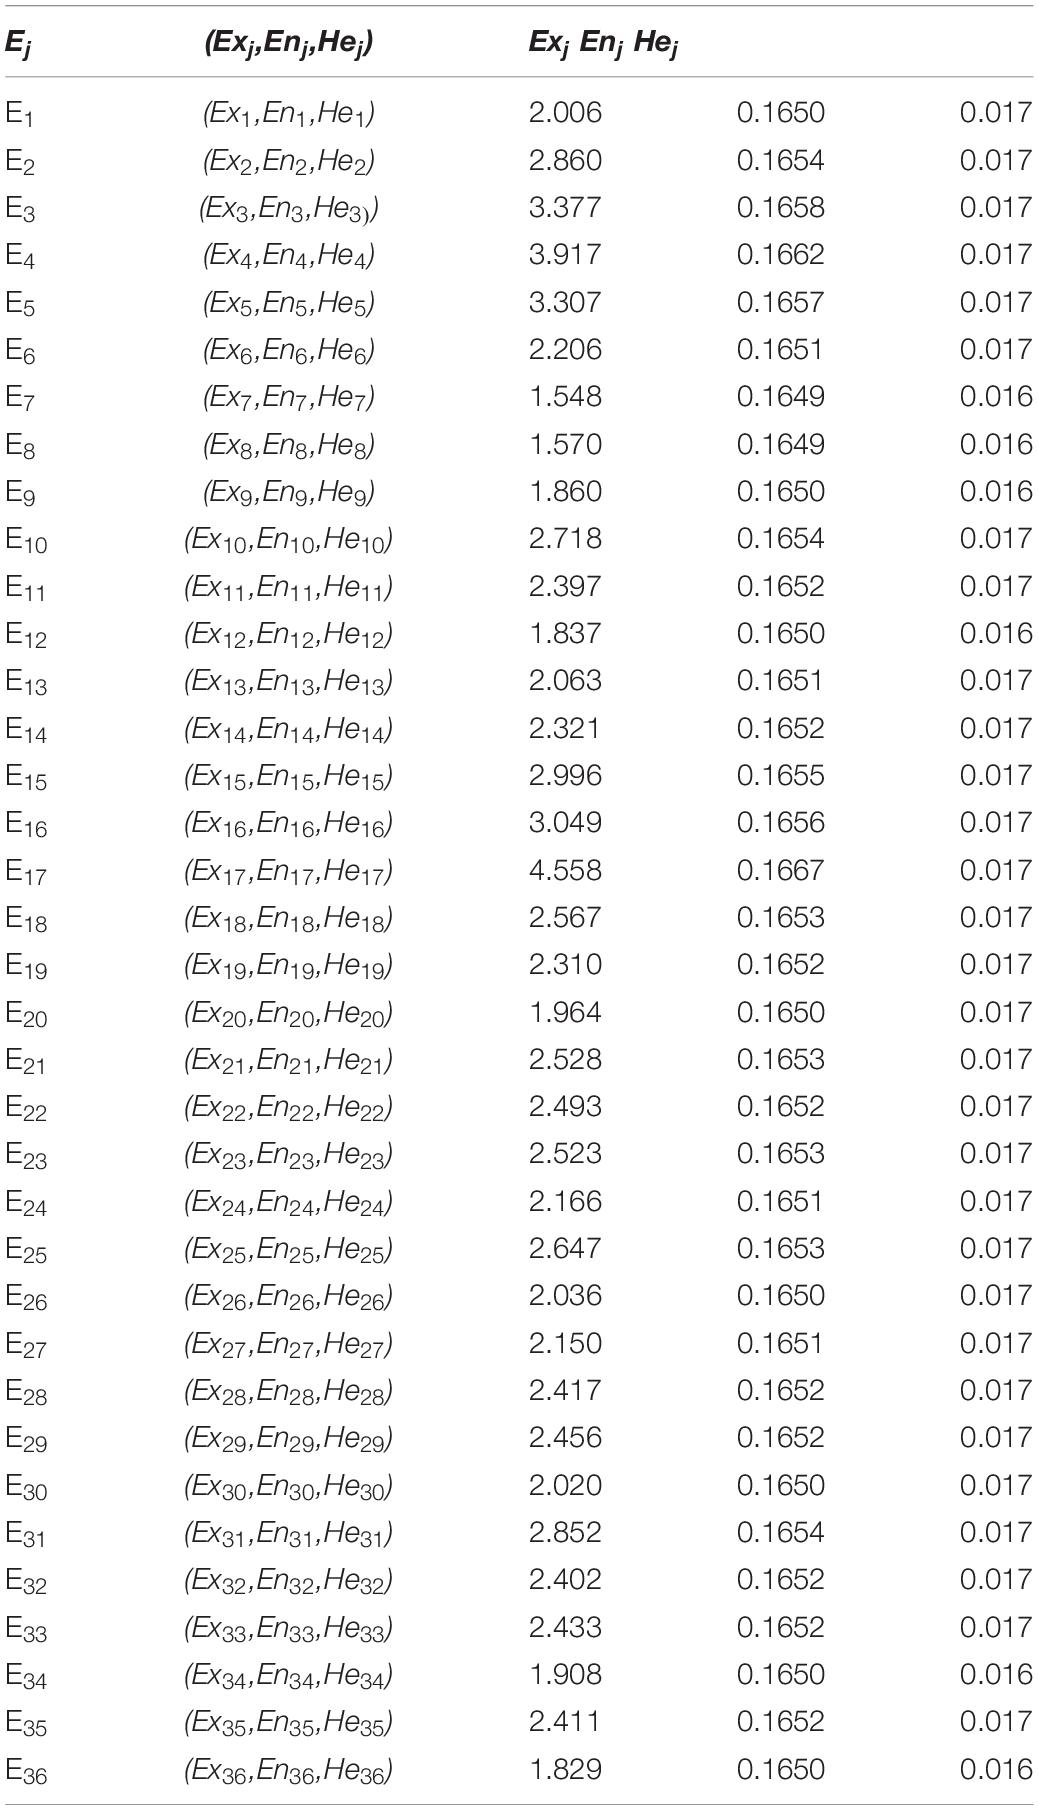
Table 2. Evaluation results of the coastal erosion vulnerability cloud model.
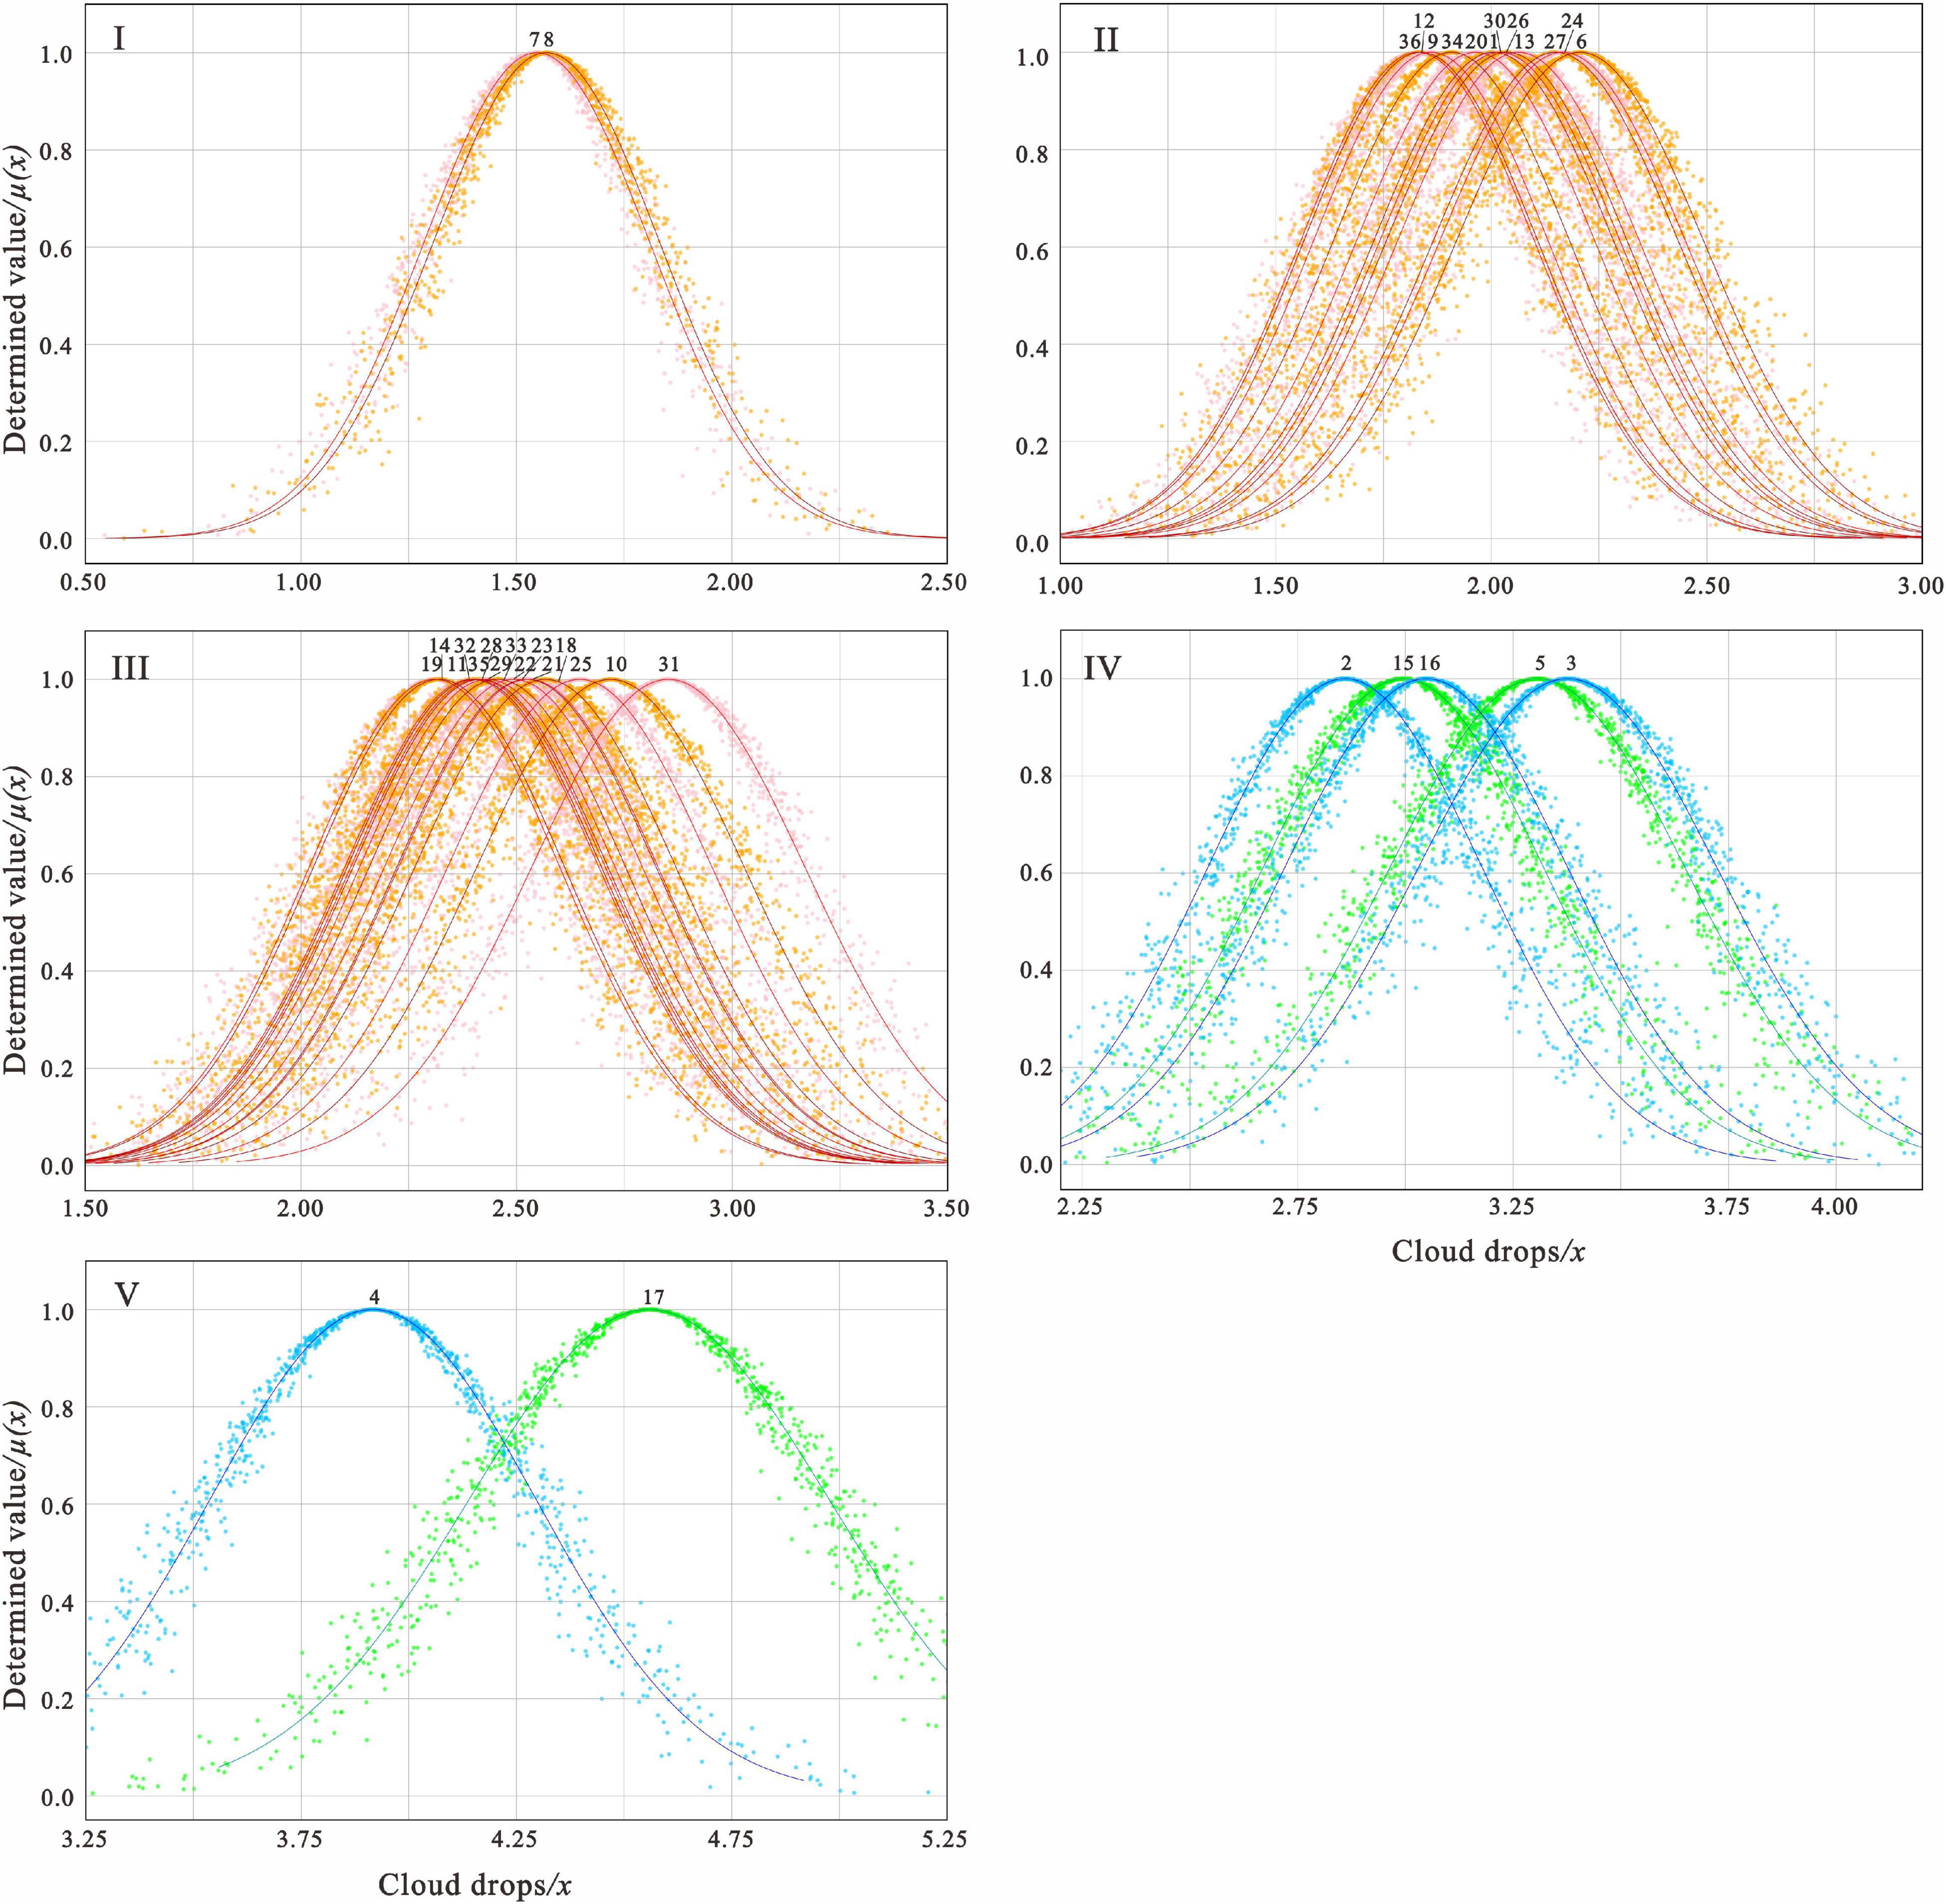
Figure 2. Cloud map distribution of comprehensive evaluation grade of coastal erosion vulnerability. Class I to class V represents the level of coastal erosion vulnerability.
Figure 2 shows that five different grades of coastal erosion vulnerability can be obtained from the clustering of the data field: low vulnerability areas (I), low-middle vulnerability areas (II), middle vulnerability areas (III), high-middle vulnerability areas (IV), and high vulnerability areas (V). Among the 36 evaluation units, only the seventh and eighth coastal sections belong to the low coastal erosion vulnerability level (I clustering), accounting for only 5.56% of coasts. There are 12 coastal sections belonging to the low-middle coastal erosion vulnerability level (II clustering), accounting for 33.33% of coasts. There are 15 coastal sections with middle coastal erosion vulnerability grades (III clustering), accounting for 41.67% of coasts. The high-middle coastal erosion vulnerability grades (IV clustering) includes five coastal sections, accounting for 13.89% of coasts. The high coastal erosion vulnerability grade (V cluster), includes only the 4th and 17th coastal sections, accounting for 5.56% of coasts.
Characteristics of Coastal Erosion Vunlnerability
The grading units were projected onto the coastal outline of the China mainland (Figure 3). The characteristics of China’s coastal geological structure, topography and geomorphology can be seen in this distribution (Supplementary Table 2). The low vulnerability areas are distributed in the coastal section of the marine eroded bedrock headland bay in the western part of the southern coast of the Liaodong Peninsula and the large composite bedrock promontory on the south western coast of the Liaodong Peninsula. The low-middle vulnerability areas are distributed in the following 12 sectors. The middle vulnerability areas are distributed in the following 15 sectors. The high-middle vulnerability areas are located in the coastal areas of alluvial marine plains. The high vulnerability areas are divided into modern Yangtze River delta plain coastal section and the modern Yellow River delta plain coastal section. The former starts from the port of Lusi, Jiangsu Province in the north, passes the Yangtze River estuary and the northern bank of Hangzhou Bay in the south, and reaches the northern extension of the Jiangshan-Shaoxing deep fault zone near the Qiantang River estuary to connect with the South China uplift. The latter is located between Bohai Bay and Laizhou Bay, starting from Chengkou in the west, turning slowly to the east and reaching the mouth of the Xiaoqinghe River in Dongying city in the south.
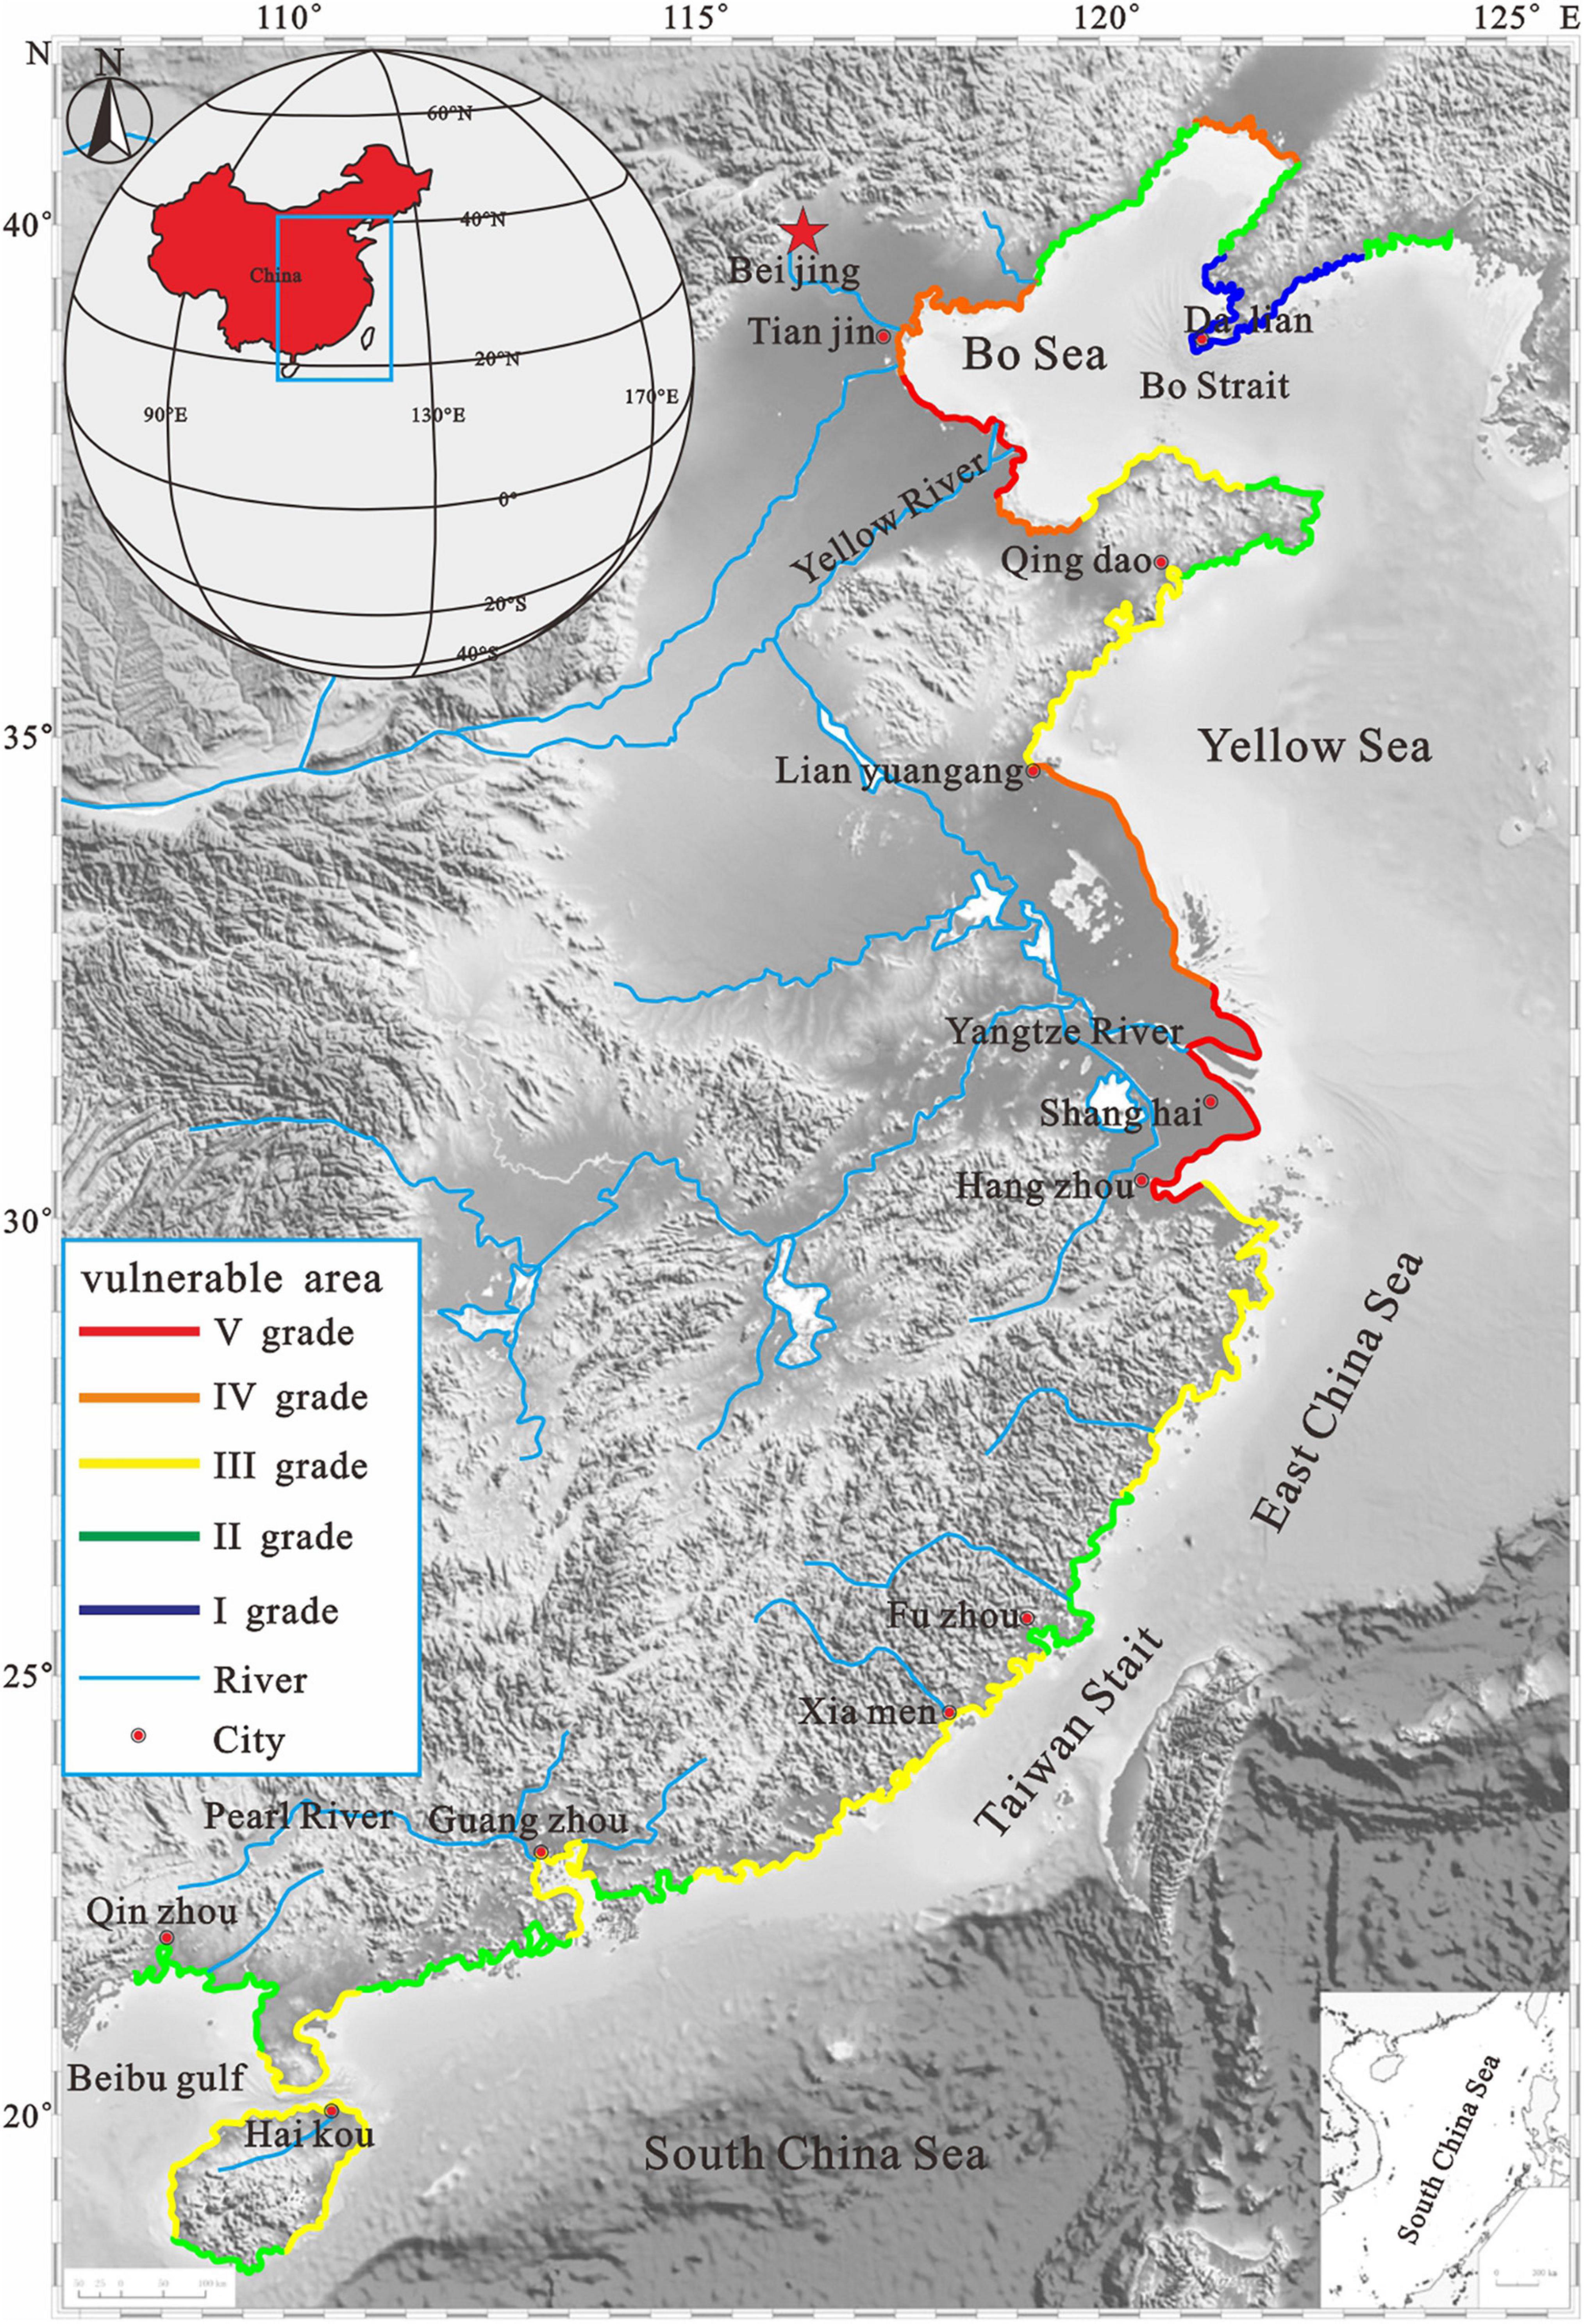
Figure 3. Coastal erosion vulnerability grade zoning map of mainland China. The asterisk represents the capital of China.
Discussion
Suitability and Reliability Analysis
According to the three digital eigenvalues of the coastal erosion vulnerability cloud model obtained from the 36 evaluation units in Table 2, the 36 data pairs (points) of Exj and Enj were composed into a two-dimensional point distribution map, and the data field of the 36 individuals was constructed as shown in Figure 4. At the same time, the five aggregations class numbers are divided according to the aggregation characteristics of the 36 individual objects in the figure. It can be clearly seen from Figure 4 that the aggregation characteristics of the five clusters, from low level to high level, are basically distributed along the diagonal, and the Enj value in their cloud model the qualitative uncertainty measure also shows a gradual increase from the low level to the high level of erosion vulnerability. In the coastal section belonging to the evaluation unit of the Meso-Cenozoic structural uplift zone, the vulnerability to coastal erosion is in I, II, and III clusters with lower grades, while the coastal section belonging to the evaluation unit of the Meso-Cenozoic structural subsidence zone is in the IV and V clusters with higher grades.
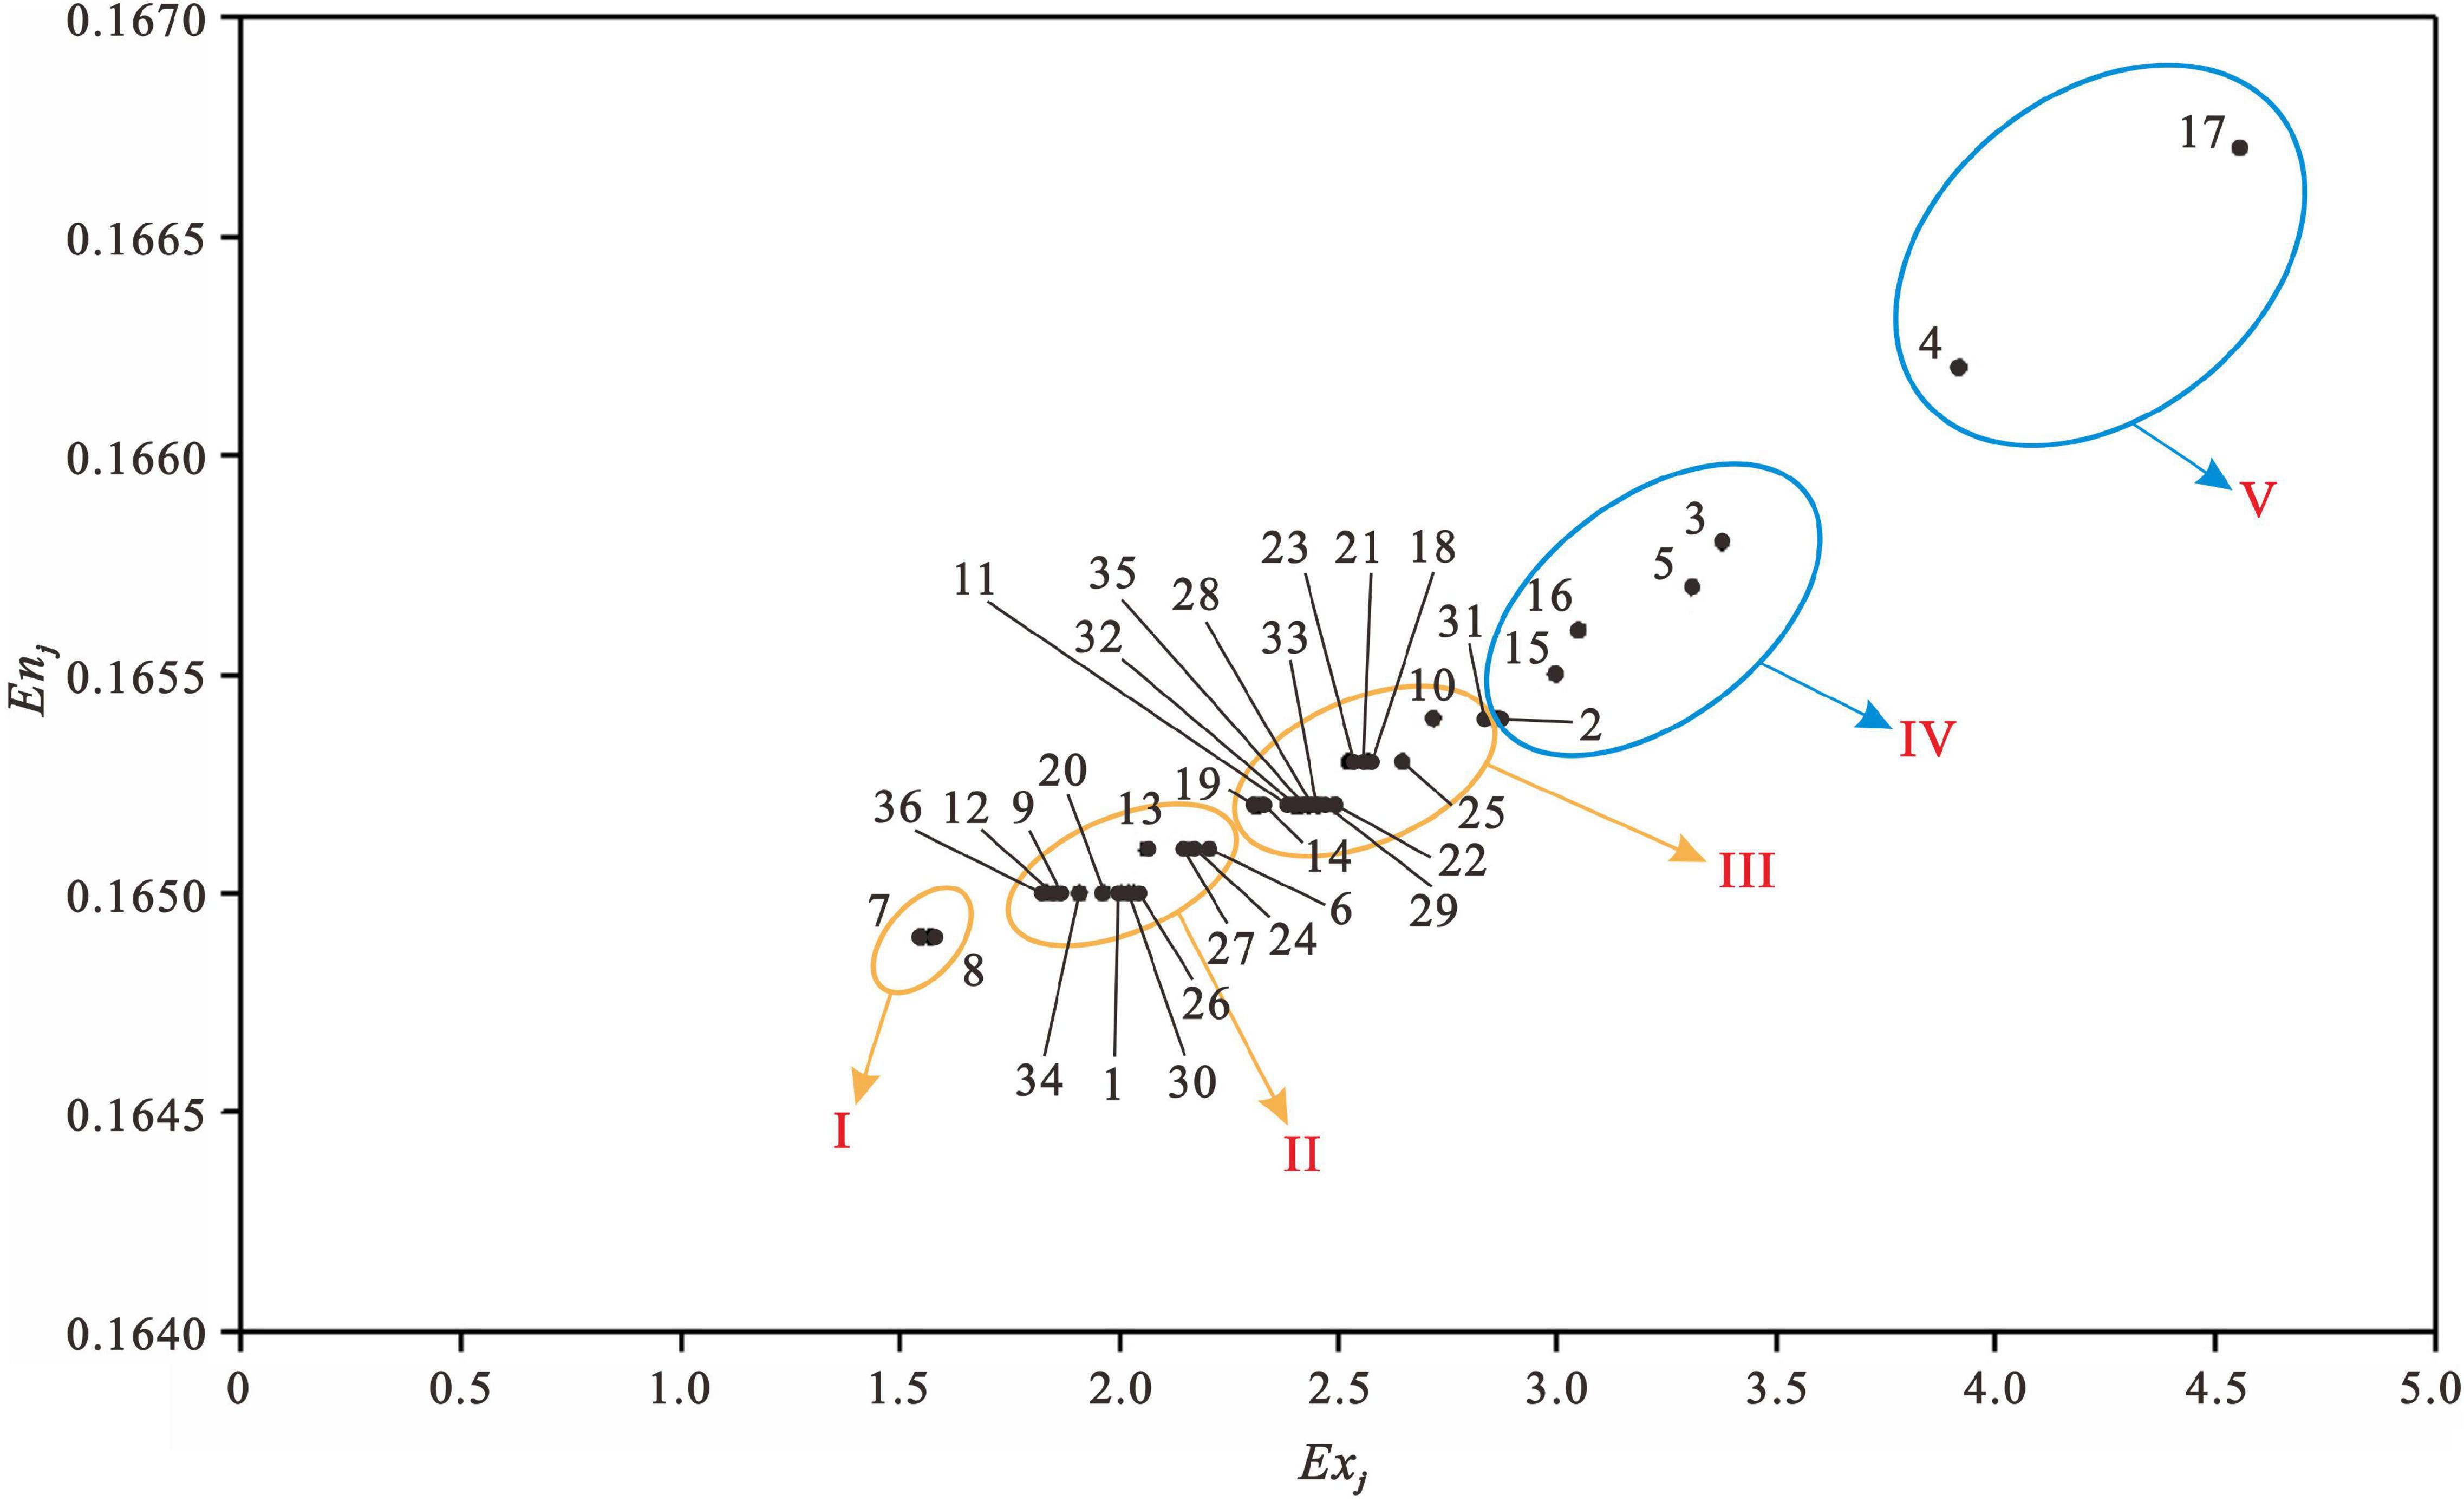
Figure 4. Exj-Enj numerical clustering property diagram.
The correlations between the Exj values of the evaluation results of the 36 evaluation units and the ui linear regressions of each of the 10 factor indexes shows the degree of correlation between the Exj values of the comprehensive evaluation results and each factor index of u1, u2, …, u10, which can express the main controlling factors affecting coastal erosion vulnerability (Alexandrakis and Poulos, 2014; Beccari, 2016; Di Paola et al., 2018).
Accordingly, in each distribution map, 29 coastal sections of evaluation units in the tectonic uplift zone (indicated by orange dots) and 7 coastal sections in the tectonic subsidence zone (indicated by light blue dots) are shown separately (Figure 5). The least squares method was used to determine the coefficients A and B of the respective linear regression equations for these two zones; each two-dimensional point distribution map had two different linear regression equations, one for the uplift zone and one for the subsidence zone. The former was expressed as y1, and the latter was expressed as y2.
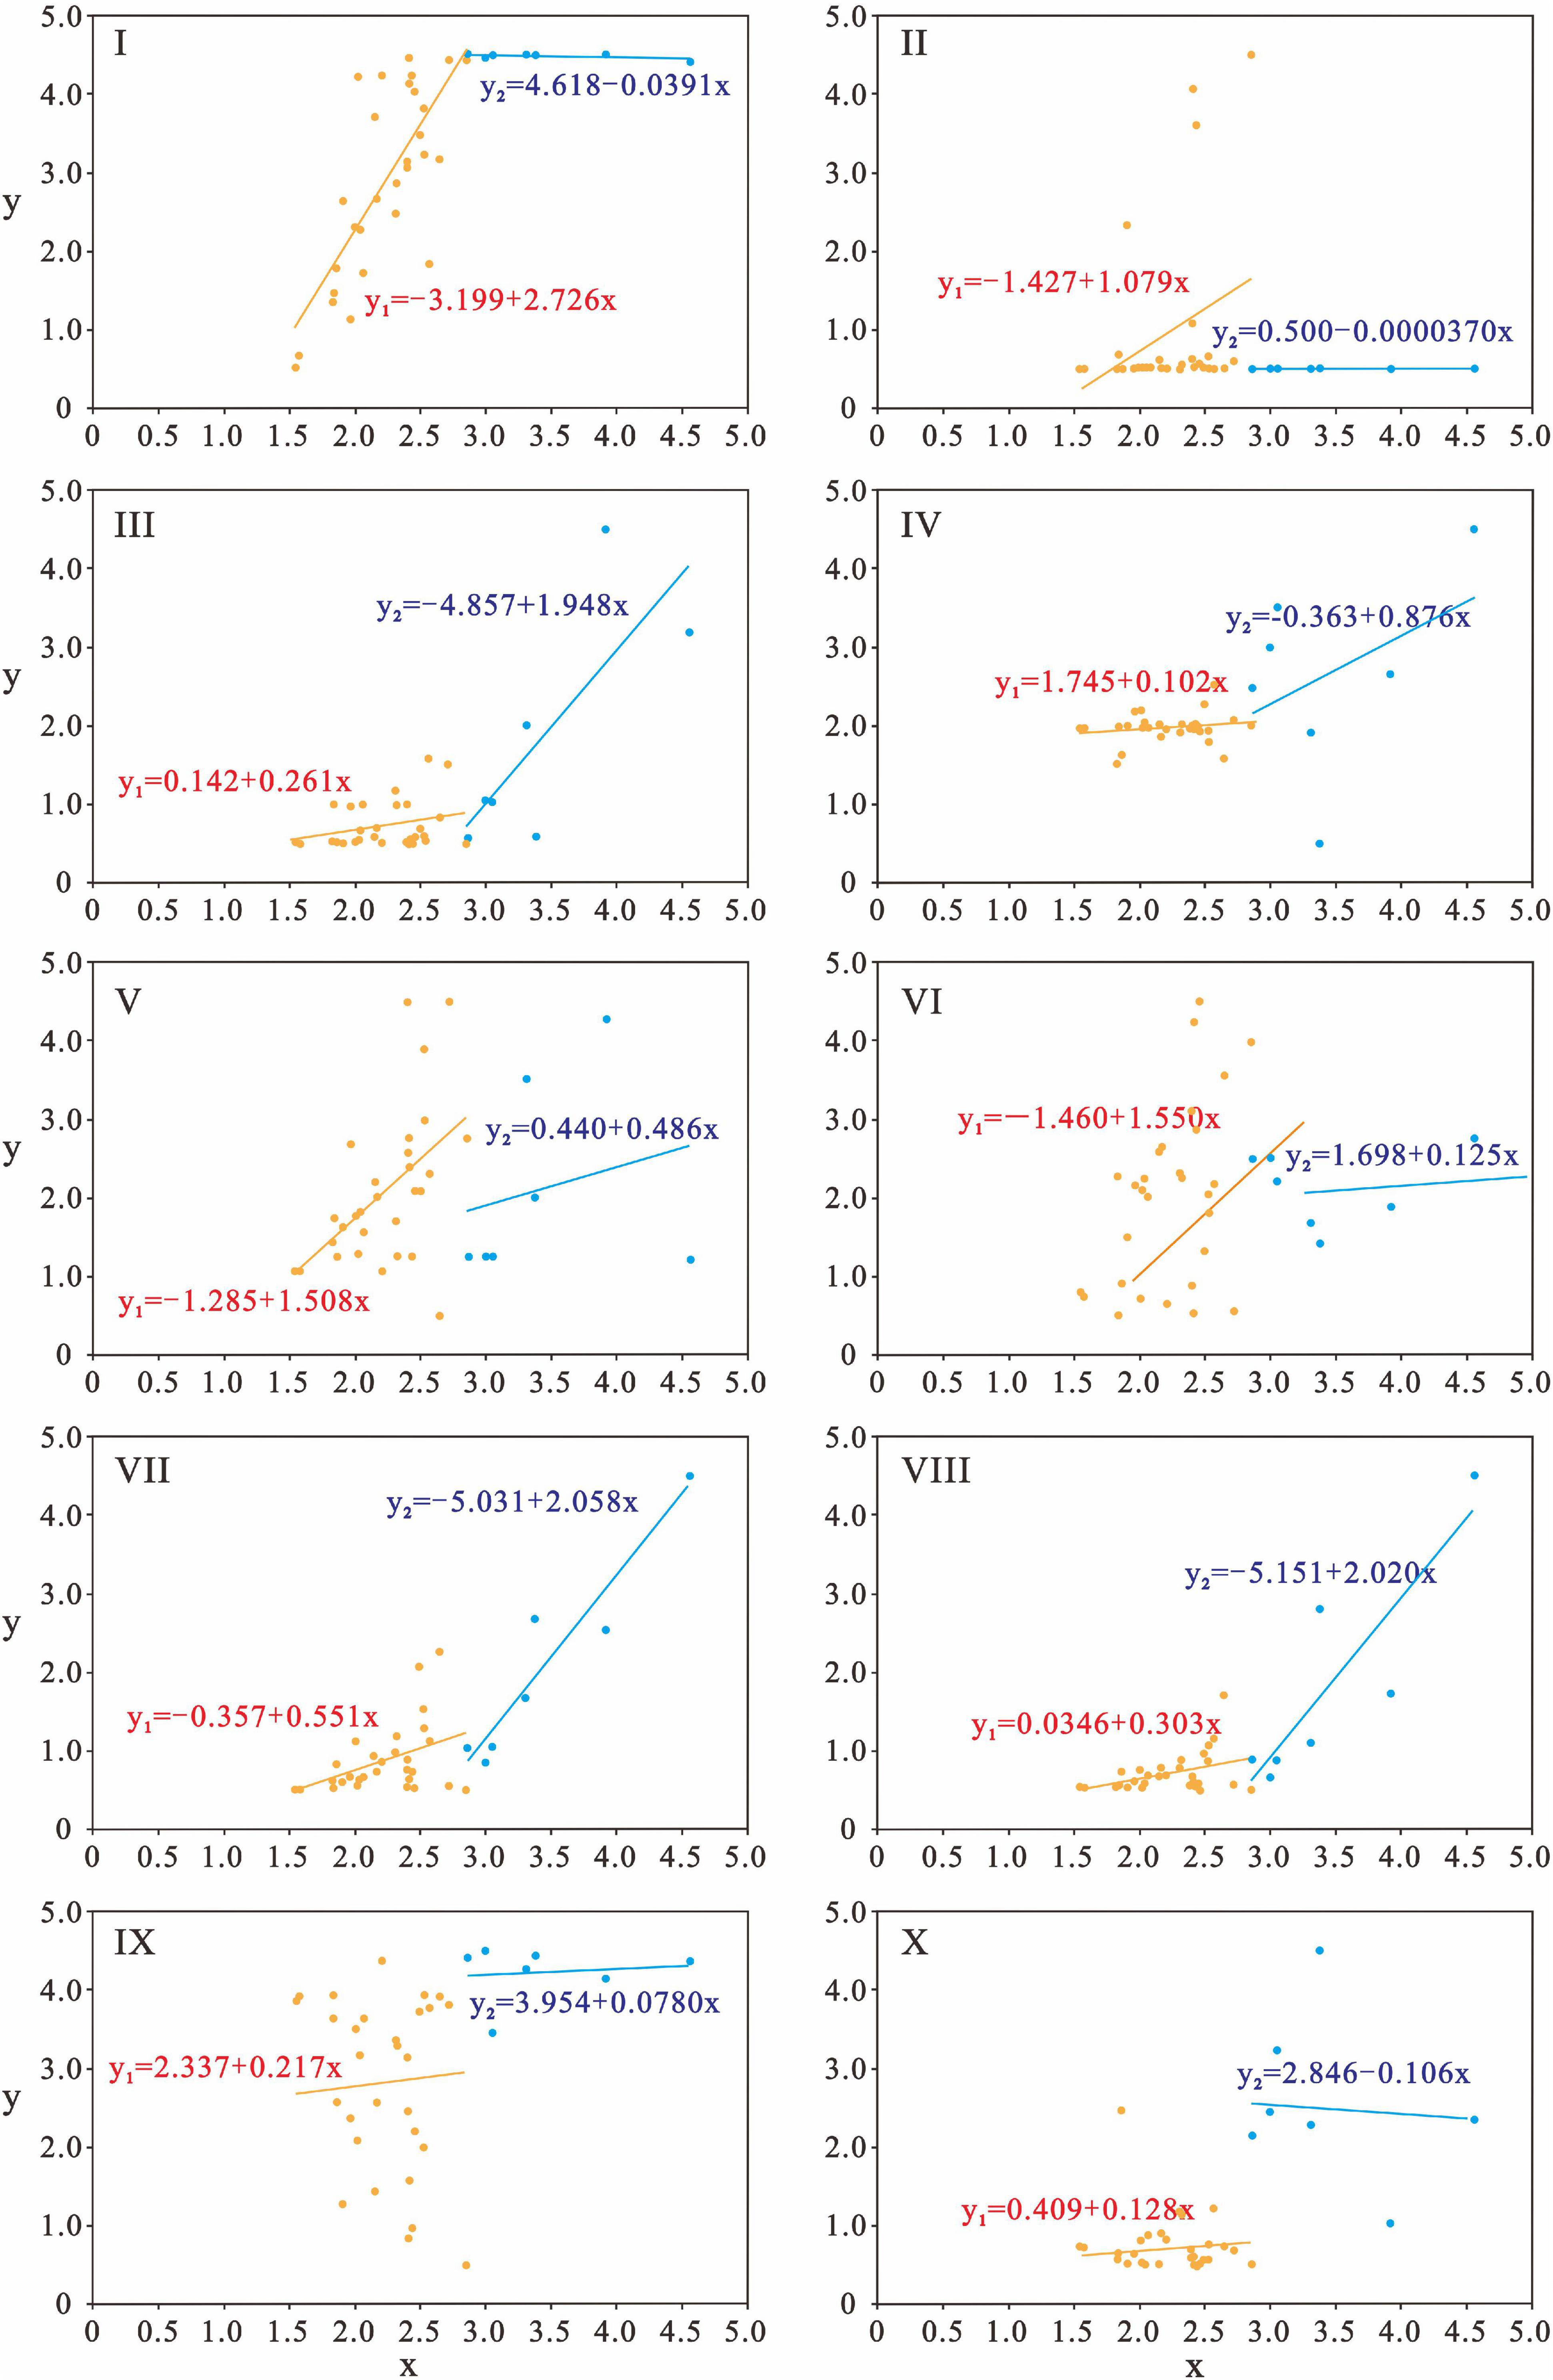
Figure 5. Correlation diagram between Exj value of comprehensive evaluation results and u1 linear regression of single factor index. Taking a and b as the regression coefficients of the regression equation, y = a + bx in the figure shows the optimal linear relationship model between x (Exj value of comprehensive evaluation unit result) and y (Rij element value corresponding to u1 factor index in R matrix). The distribution points of orange dots and their linear relationship belong to the coastal section of the evaluation unit of Mesozoic-Cenozoic tectonic uplift, where y is represented by y1. The cyan dots distribution points and their linear relationship belong to the coastal section of the evaluation unit of Mesozoic-Cenozoic tectonic subsidence zone, where y is represented by y2.
Based on the above regression analysis, on the one hand, it can be concluded that the Exj value of the comprehensive evaluation result of the section of the estuary and coast of the mound or platform drowning valley-type bedrock under the background of tectonic uplift since the Meso-Cenozoic era is mainly related to u1 among the 10 factor indexes, followed by u6, u5, and u2. However, the large Quaternary sedimentary plain coastal section in the tectonic subsidence zone is mainly related to u7, followed by u8, u3, and u4. On the other hand, from the correlation analysis based on every line i, the R matrix element data suggest different results. It can be concluded that when the cloud model is applied for comprehensive evaluation, the above results that we obtained using the linear regression analysis method of correlation between the Exj value and each single ui index and the results of ωi weight distribution calculation, which obviously is a more practical and objective method, are inconsistent (Arkema et al., 2013).
Coastal Erosion Vulnerability Analysis
Coastal erosion is a surface-shaping process, mainly due to landside erosion in shoreline retreat and intertidal flat-bottom bed erosion. The root cause of coastal evolution can be natural environmental erosion or the impacts of human activities, which both reduce the coastal area under the dynamic action of sediment recharge and enhance the material losses of vulnerability coasts (Gornitz, 1990; Bagdanavičiūtė et al., 2015; Fraser et al., 2017; Peña-Alonso et al., 2017; Cai et al., 2019). Coasts are influenced by the interactions of internal and external forcing through the continuous evolution of accumulation and erosion of material because the occurrence and development of coastal erosion is due to the intrinsic factors of the coast (inherent stability, geological structure, geomorphology, lithology, sediments off the coast, coast shape, etc.) and its external factors (mainly the dynamic strength and sediment supply conditions of the coastal ocean). When the state of material movement is out of balance, the loss of coasts occurs. In this regard, both internal and external factors can be changed due to natural processes or the influence of human activities, thus explaining the complexity of erosion factors (Leatherman et al., 2000; US Army Corps of Engineers [USACE], 2008; Kantamaneni, 2016; Lins-de-Barros, 2017). However, although the formation and development of coastal erosion in mainland China is subject to the influence of many factors, which make the manifestation of erosion phenomena and processes unpredictable, it also has certain distribution rules with regional differences.
Five important features can be seen in Figure 3. (1) The coastal features of the lower vulnerability areas are mainly reflected in the coastal section of the structural uplift zone; the shoreline is basically a headland of bedrock consisting of a hard ancient metamorphic series and a small amount of granite. The maximum water value and average wave height of storm surges in this coastal area are small, and the ratio of the lengths of the sandy beach to the muddy tidal beach is also low. The phenomenon of coastal erosion disasters has not been obvious recently. The main factors affecting the vulnerability to coastal erosion are the proportion of artificial shoreline and the relative change in sea level, but the values of these two factors are very small. The low-vulnerability area is less affected by human activities, and its vulnerability level changes little. (2) The low vulnerability coastal sections are all affected by the Cenozoic neocathaysian tectonic system, as well as by tectonic movement since the late Neogene; this forms the basis of the tectonic uplift belt, since the transgression after the last ice age has distinguishing features from the coastal geology of the uplift belt. The main factors affecting the vulnerability to coastal erosion are the proportion of Quaternary strata, the proportion of artificial shoreline, the relative change in sea level and the average wave height of the coastal area. (3) The moderately vulnerable areas are all coastal sections under the background of tectonic uplift since the Meso-Cenozoic era. The Exj value of their comprehensive evaluation results is similar to that of coastal erosion vulnerability and is higher than that of the B grade cluster. The main factors affecting the coastal erosion vulnerability are the reclamation area per kilometer, the proportion of artificial shoreline, the average wave height and the maximum storm surge. (4) Under the background of the Meso-Cenozoic tectonic subsidence zone, the middle and high vulnerability areas are the great plain coastal sections formed from Neogene to Quaternary on the basis of depression sedimentary basins. The main factors affecting the vulnerability to coastal erosion are the reclamation area per kilometer, the proportion of artificial shoreline and the change in relative sea level. (5) The main characteristics of the most vulnerable coastal areas are they are in the Cenozoic tectonic subsidence zone section of the coast and they are on the mainland coast. The first and second large modern delta plain coasts are the main causes of coastal erosion characteristics due to the changes in the macro environment: river water and the sand conditions, especially the recent sea sediment loads, human activities (such as large-scale land circumference, construction of ports and coastal engineering), and the large range or local conditions of water and sediment cause imbalances. The main factors affecting the vulnerability to coastal erosion are the change in sediment, the proportion of artificial shoreline and the reclamation area per kilometer. Coastal erosion vulnerability is mainly concentrated in the middle level. In hierarchical terms, the vulnerability to coastal erosion is significantly higher in the subsidence zone than in the uplift zone, and the fragility of large estuary deltas and bay plains is significantly higher than that of bedrock headlands. In the past 10 years, the level of vulnerability to coastal erosion in mainland China has increased gradually.
Adaptive Management Analysis
It is well known that the occurrence of coastal erosion and the trend of its intensity depend on the stability of the beach itself [internal factors, such as coastal topography, geomorphology, and material composition characteristics and the equilibrium between coastal marine dynamic conditions and sediment supply conditions (external factors)] (Nicholls and Cazenave, 2010; Masselink and Russell, 2013). The external cause is the condition of change, the internal cause is the basis of change, and the external cause works through the internal cause. The results show that both internal and external factors of coastal erosion can be derived from the influence of natural change processes and human activities; moreover, the human activities that cause coastal erosion often have many effects, some of which are positive, and some of which are negative (while others are caused by unwise or incorrect human decision-making, etc.) (Mujabar and Chandrasekar, 2013; Griggs et al., 2019). Furthermore, coastal erosion in China is facing increasing challenges. In addition to the global factors of climate warming, the natural resources and environmental changes in China’s coastal zones have some bearing capacity under the influence of human-made coastal resource development activities. Therefore, with the rapid development of coastal resource development in China, the main cause of coastal erosion has changed from natural factors to human activities. In other words, to cope with the increasing trend of coastal erosion disasters in China, we must take measures to adapt to nature (such as repairing and reconstructing beaches to promote the spontaneous adaptability of coastal systems) to greatly reduce the erosion impact of future sea-level rise and storm surge, and the more important countermeasure is to control and adjust the impact of human activities (plan adaptation measures). The latter, especially considering the negative environmental effects caused by large-scale reclamation activities in the last 30 years in China and the erosion potential due to the rapid decline in natural shoreline retention rate, is controlled. Countermeasures are proposed for specific plans to improve the quality of the marine ecological environment and realize the harmonious development and utilization of marine resources.
Conclusion
Chinese mainland coasts formed since the transgression following the last ice age have different characteristics, depending on the types of geological structures, and coastal landform features. The coasts are divided into 36 evaluation units, and 10 important indicators are selected from the geological structure, landform, sea sediment, storm water and other natural attributes such as population, GDP, and the reclamation area of social and economic attributes to construct China’s coastal erosion vulnerability evaluation index system, using an AHP and reverse cloud fuzzy evaluation to characterize coastal erosion vulnerability in mainland China.
Coastal erosion vulnerability in China is characterized by high (V), high-middle (IV), middle (III), low-middle (II), and low (I) level vulnerability areas, which account for 5.56, 13.89, 41.67, 33.33, 5.56%, respectively, of China’s coastal erosion vulnerability. The vulnerability to coastal erosion is mainly concentrated in the intermediate and low level areas, and the coastal erosion vulnerability of the subsiding belt is significantly higher than that of the uplift belt. The main factors controlling coastal erosion vulnerability in mainland China are the geological structure, topography, landform and lithologic characteristics of the coastal zone, as well as the decrease in sediment entering the sea and the increase in reclamation projects in recent years, which are consistent with the basic status of coastal erosion in mainland China.
The evaluation index system and cloud model method of coastal erosion vulnerability in this study are applicable to the evaluation of coastal erosion vulnerability in mainland China. The adaptive management of coastal erosion vulnerability should comply with nature, with the goals being to improve the quality of marine ecological environment and to harmoniously develop and utilize marine resources. Adaptability can limit the erosion of coasts by engineering measures and control and adjust the influence of human activities on coastal erosion, and the adaptive management of coastal erosion can provide a scientific basis for overall planning on land and sea.
Data Availability Statement
The original contributions presented in the study are included in the article/Supplementary Material, further inquiries can be directed to the corresponding author/s.
Author Contributions
CC designed the study, wrote the main manuscript, and prepared all figures. FC and HQ contributed to the improvement of the manuscript. JL and GL investigated. KZ and ZM prepared the figures and software. All authors reviewed the manuscript.
Funding
This research was funded by the National Natural Science Foundation of China (Grant Nos. 42076058, 41930538, and 42076211), the Scientific Research Foundation of Third Institute of Oceanography, MNR (Grant No. 2019006), the Special Funds for Scientific Research on Marine Public Causes (Grant Nos. 201505012, 201405037, and 200905008), and Comprehensive survey and evaluation of China’s Offshore Marine Resources (Grant No. 908-02-03-04).
Conflict of Interest
The authors declare that the research was conducted in the absence of any commercial or financial relationships that could be construed as a potential conflict of interest.
Publisher’s Note
All claims expressed in this article are solely those of the authors and do not necessarily represent those of their affiliated organizations, or those of the publisher, the editors and the reviewers. Any product that may be evaluated in this article, or claim that may be made by its manufacturer, is not guaranteed or endorsed by the publisher.
Acknowledgments
The authors would like to express their sincere thanks to Xiangjin Pan, Xiaojing Zhu, and Yazhuang Zhao who offered support.
Supplementary Material
The Supplementary Material for this article can be found online at: https://www.frontiersin.org/articles/10.3389/fmars.2021.790664/full#supplementary-material
References
Alexandrakis, G., and Poulos, S. (2014). An holistic approach to beach erosion vulnerability assessment. Sci. Rep. 4:6078. doi: 10.1038/srep06078
Anderson, T. R., Fletcher, C. H., Barbee, M. M., Frazer, L. N., and Romine, B. M. (2015). Doubling of coastal erosion under rising sea level by mid-century in Hawaii. Nat. Hazards 78, 75–103.
Angela, R., and Giorgio, A. (2020). Coastal dynamic and evolution: case studies from different sites around the world. Water 12:2829. doi: 10.3390/w12102829
Arkema, K. K., Guannel, G., Verutes, G., Wood, S. A., Guerry, A., Ruckelshaus, M., et al. (2013). Coastal habitats shield people and property from sea-level rise and storms. Nat. Clim. Change 3:913.
Asensio-Montesinos, F., Pranzini, E., Martínez-Martínez, J., Cinelli, I., Anfuso, G., and Corbí, H. (2020). The origin of sand and its colour on the south-eastern coast of spain: implications for erosion management. Water 12:377. doi: 10.3390/w12020377
Athanasiou, P., Ap van Dongeren, A., Giardino, A., Vousdoukas, M. I., Ranasinghe, R., and Kwadijk, J. (2020). Uncertainties in projections of sandy beach erosion due to sea level rise: an analysis at the European scale. Sci. Rep. 10:11895. doi: 10.1038/s41598-020-68576-0
Atlas of Comprehensive Investigation of Coastal Zone and Coastal Resources in China (1989). Atlas of Comprehensive Investigation of Coastal Zone and Coastal Resources in China. Ocean Press, Beijing, 1–20
Bagdanavičiūtė, I., Kelpšaitė, L., and Soomere, T. (2015). Multi-criteria evaluation approach to coastal vulnerability index development in micro-tidal low-lying areas. Ocean Coast. Manage. 104, 124–135.
Beccari, B. (2016). A comparative analysis of disaster risk, vulnerability and resilience composite indicators. PLoS Curr. 8, 58–71. doi: 10.1371/currents.dis.453df025e34b682e9737f95070f9b970
Cai, F., Su, X., Liu, J., Li, B., and Lei, G. (2009). Coastal erosion in China under the condition of global climate change and measures for its prevention. Prog. Nat. Sci. 19, 415–426. doi: 10.1016/j.pnsc.2008.05.034
Cai, F., Su, Z. X., and Cao, C. (2019). Vulnerability Assessment And Demonstration Of Coastal Erosion In China. Beijing: China Ocean Press.
Chen, J. Y., Xia, D. X., Yu, Z. Y., and Cai, F. (2010). Overview Of Coastal Erosion In China. Beijing: China Ocean Press.
Davidson-Arnott, R. (2010). An Introduction to Coastal Processes and Geomorphology. Cambridge: Cambridge University Press, 458.
Denner, K., Phillips, M. R., Jenkins, R. E., and Thomas, T. (2015). A coastal vulnerability and environmental risk assessment of Loughor Estuary, South Wales. Ocean Coast. Manage. 116, 478–490. doi: 10.1016/j.ocecoaman.2015.09.002
Di Paola, G., Aucelli, P. P. C., Benassai, G., Iglesias, J., Rodríguez, G., and Rosskopf, C. M. (2018). The assessment of the coastal vulnerability and exposure degree of Gran Canaria Island (Spain) with a focus on the coastal risk of Las Canteras Beach in Las Palmas de Gran Canaria. J. Coast. Conserv. 22, 1001–1014.
Donchyts, G., Baart, F., Winsemius, H., Gorelick, N., Kwadijk, J., and van de Giesen, N. (2016). Earth’s surface water change over the past 30 years. Nat. Clim. Change 6:810. doi: 10.1038/nclimate3111
Fang, J., Liu, W., Yang, S., Brown, S., Nicholls, R. J., Hinkel, J., et al. (2017). Spatial-temporal changes of coastal and marine disasters risks and impacts in Mainland China. Ocean Coast. Manage. 139, 125–140. doi: 10.1016/j.ocecoaman.2017.02.003
FitzGerald, D. M., Fenster, M. S., Argow, B. A., and Buynevich, I. V. (2008). Coastal impacts due to sea-level rise. Annu. Rev. Earth Planet. Sci. 36, 601–647.
Fraser, C., Bernatchez, P., and Dugas, S. (2017). Development of a GIS coastal land-use planning tool for coastal erosion adaptation based on the exposure of buildings and infrastructure to coastal erosion, Québec, Canada. Geomat. Nat. Hazards Risk 8, 1103–1125.
Gao, J. H., Jia, J., Wang, Y. P., Yang, Y., Li, J., Bai, F., et al. (2015). Variations in quantity, composition and grain size of Changjiang sediment discharging into the sea in response to human activities. Hydrol. Earth Syst. Sci. 19, 645–655.
Ge, Z. P., Dai, Z. J., and Pang, W. H. (2017). LIDAR-based detection of the post-typhoon recovery of a meso-macro-tidal beach in the Beibu Gulf, China. Mar. Geol. 391, 127–143. doi: 10.1016/j.margeo.2017.08.008
Google Earth (2017). See What was Trending in 2017. Available online at: https://www.google.com.hk/2017
Gornitz, V. (1990). Vulnerability of the East Coast, USA to future sea level rise. J. Coast. Res. 1, 201–237. doi: 10.1007/s10661-017-6282-y
Griggs, G., Davar, L., and Reguero, B. G. (2019). Documenting a century of coastline change along central california and associated challenges: from the qualitative to the quantitative. Water 11:2648. doi: 10.3390/w11122648
IPCC (2017). Managing the Risks of Extreme Events and Disasters to Advance Climate Change Adaptation, Special Report of the Intergovernmental Panel on Climate Change. Cambridge: Cambridge University Press, 10–13.
IPCC (2021). Managing the Risks of Extreme Events and Disasters to Advance Climate Change Adaptation, Special Report of the Intergovernmental Panel on Climate Change. Cambridge: Cambridge University Press, 3–5.
Jankowski, K. L., Törnqvist, T. E., and Fernandes, A. M. (2017). Vulnerability of louisiana’s coastal wetlands to present-day rates of relative sea-level rise. Nat. Commun. 8:14792. doi: 10.1038/ncomms14792
Jevrejeva, S., Jackson, L. P., Riva, R. E. M., Grinsted, A., and Moore, J. C. (2016). Coastal sea level rise with warming above 2 °C. Proc. Natl. Acad. Sci. U.S.A. 113, 13342–13347. doi: 10.1073/pnas.1605312113
Kantamaneni, K. (2016). Coastal infrastructure vulnerability: an integrated assessment model. Nat. Hazards 84, 139–154. doi: 10.1007/s11069-016-2413-y
Kirwan, M. L., Temmerman, S., Skeehan, E. E., Guntenspergen, G. R., and Fagherazzi, S. (2016). Overestimation of marsh vulnerability to sea level rise. Nat. Clim. Change 6, 253–260.
Le Cozannet, G., Bulteau, T., Castelle, B., Ranasinghe, R., Woppelmann, G., Rohmer, J., et al. (2019). Quantifying uncertainties of sandy shoreline change projections as sea level rises. Sci. Rep. 9:42.
Leatherman, S. P., Zhang, K., and Douglas, B. C. (2000). Sea level rise shown to drive coastal erosion. EOS Trans. Am. Geophys. Union 81, 55–57. doi: 10.1029/00eo00034
Li, D. Y., and Du, Y. (2014). Artificial Intelligence With Uncertainty. Beijing: National Defense Industry Press, 15–18.
Li, X., Zhou, Y. X., Tian, B., Kuang, R. Y., and Wang, L. H. (2015). GIS-based methodology for erosion risk assessment of the muddy coast in the Yangtze Delta. Ocean Coast. Manage. 108, 97–108.
Lins-de-Barros, F. M. (2017). Integrated coastal vulnerability assessment: a methodology for coastal cities management integrating socioeconomic, physical and environmental dimensions – Case study of Regido dos Lagos, Rio de Janeiro, Brazil. Ocean Coast. Manage. 149, 1–11. doi: 10.1016/j.ocecoaman.2017.09.007
Luijendijk, A., Hagenaars, G., Ranasinghe, R., Baart, F., Donchyts, G., and Aarninkhof, S. (2018). The state of the world’s beaches. Sci. Rep. 8:6641.
Luo, S., Cai, F., Liu, H., Lei, G., Qi, H., and Su, X. (2015). Adaptive measures adopted for risk reduction of coastal erosion in the People’s Republic of China. Ocean Coast. Manage. 103, 134–145. doi: 10.1016/j.ocecoaman.2014.08.008
Luo, S., Wang, H., and Cai, F. (2013). An integrated risk assessment of coastal erosion based on fuzzy set theory along Fujian coast, southeast China. Ocean Coast. Manage. 84, 68–76. doi: 10.1016/j.ocecoaman.2013.07.007
Ma, B. B., Dai, Z. J., and Pan, W. H. (2019). Dramatic typhoon-induced variability in the grain size characteristics of sediments at a meso-macrotidal beach. Cont. Shelf Res. 191, 1–9.
Ma, Z., Melville, D. S., Liu, J., Chen, Y., Yang, H., Ren, W., et al. (2014). Rethinking China’s new great wall. Science 346, 912–914. doi: 10.1126/science.1257258
Masselink, G., and Russell, P. (2013). Impacts of climate change on coastal erosion. MCCIP Sci. Rev. 2013, 71–86.
Mattei, G., Troisi, S., Aucelli, P. P., Pappone, G., Peluso, F., and Stefanile, M. (2018). Sensing the submerged landscape of nisida roman harbour in the gulf of naples from integrated measurements on a USV. Water 10:1686.
McGranahan, G., Balk, D., and Anderson, B. (2007). The rising tide: assessing the risks of climate change and human settlements in low elevation coastal zones. Environ. Urban. 19, 17–37.
McLaughlin, S., and Cooper, J. A. G. (2010). A multi-scale coastal vulnerability index: a tool for coastal managers? Environ. Hazard. 9, 233–248. doi: 10.3763/ehaz.2010.0052
Mentaschi, L., Vousdoukas, M. I., Pekel, J. F., Voukouvalas, E., and Feyen, L. (2018). Global long-term observations of coastal erosion and accretion. Sci. Rep. 8, 1–11. doi: 10.1038/s41598-018-30904-w
Milliman, J. D., Farnsworth, K. L., Jones, P. D., Xu, K. H., and Smith, L. C. (2008). Climatic and anthropogenic factors affecting river discharge to the global ocean, 1951–2000. Glob. Planet. Change 62, 187–194. doi: 10.1016/j.gloplacha.2008.03.001
Molina, R., Manno, G., Lo Re, C., and Anfuso, G. (2020). Dune systems’ characterization and evolution in the andalusia mediterranean coast (Spain). Water 12:2094. doi: 10.3390/w12082094
Molnar, P., Anderson, R. S., and Anderson, S. P. (2007). Tectonics, fracturing of rock, and erosion. J. Geophys. Res. Earth Surf. 112, 1–12.
Mujabar, P. S., and Chandrasekar, N. (2013). Coastal erosion hazard and vulnerability assessment for southern coastal Tamil Nadu of India by using remote sensing and GIS. Nat. Hazards 69, 1295–1314. doi: 10.1007/s11069-011-9962-x
National Bureau of Statistics of China (2018). China Statistics Yearbook. Beijing: China Statistics Press.
Neumann, B., Vafeidis, A. T., Zimmermann, J., and Nicholls, R. J. (2015). Future coastal population growth and exposure to sea-level rise and coastal flooding-A global assessment. PLoS One 10:e0118571. doi: 10.1371/journal.pone.0118571
Nicholls, R. J., and Cazenave, A. (2010). Sea-level rise and its impact on coastal zones. Science 328, 1517–1520. doi: 10.1126/science.1185782
Nicholls, R. J., Wong, P. P., Burkett, V., Codignotto, J., and Saito, Y. (2007). “Coastal systems and low-lying areas,” in Proceedings of the Climate Change 2007: Impacts, Adaptation And Vulnerability. Contribution of Working Group II to the Fourth Assessment Report of the Intergovernmental Panel on Climate Change, eds M. L. Parry, O. F. Canziani, J. P. Palutikof, P. J. van der Linden, and C. E. Hanson (Cambridge: Cambridge University Press), 315–356.
Papathoma–Köhle, M., Cristofari, G., Wenk, M., and Fuchs, S. (2019). The importance of indicator weights for vulnerability indices and implications for decision making in disaster management. Int. J. Disaster Risk. Reduct. 36:101103. doi: 10.1186/s12913-016-1423-5
Peña-Alonso, C., Fraile-Jurado, P., Hernández-Calvento, L., Pérez-Chacón, E., and Ariza, E. (2017). Measuring geomorphological vulnerability on beaches using a set of indicators (GVI): a tool for management. J. Environ. Manage. 204, 230–245. doi: 10.1016/j.jenvman.2017.08.053
Pranzini, E. (2018). Coastal erosion and shore protection: a brief historical analysis. J. Coast. Conserv. 22, 827–830. doi: 10.1007/s11852-017-0521-9
Ranasinghe, R. (2016). Assessing climate change impacts on open sandy coasts: a review. Earth Sci. Rev. 160, 320–332.
Ranasinghe, R., Wu, C. S., Conallin, J., Duong, T. M., and Anthony, E. J. (2019). Disentangling the relative impacts of climate change and human activities on fluvial sediment supply to the coast by the world’s large rivers: pearl river basin, China. Sci. Rep. 9:9236. doi: 10.1038/s41598-019-45442-2
Rizzo, A., Vandelli, V., Buhagiar, G., Micallef, A. S., and Soldati, M. (2020). Coastal vulnerability assessment along the North-Eastern sector of Gozo Island (Malta, Mediterranean Sea). Water 12:1405.
Theuerkauf, E. J., Rodriguez, A. B., Fegley, S. R., and Luettich, R. A. (2014). Sea level anomalies exacerbate beach erosion. Geophys. Res. Lett. 41, 5139–5147.
Toimil, A., Losada, I. J., Camus, P., and Díaz-Simal, P. (2017). Managing coastal erosion under climate change at the regional scale. Coast. Eng. 128, 106–122.
Udo, K., and Takeda, Y. (2017). Projections of future beach loss in Japan Due to sea-level rise and uncertainties in projected Beach Loss. Coast. Eng. J. 59:1740006. doi: 10.1142/s057856341740006x
US Army Corps of Engineers [USACE] (2008). Coastal Engineering Manual (CEM). Washington, DC: US Army Corps of Engineers.
Villate Daza, D. A., Sánchez Moreno, H., Portz, L., Portantiolo Manzolli, R., Bolívar-Anillo, H. J., and Anfuso, G. (2020). Mangrove forests evolution and threats in the caribbean sea of colombia. Water 12:1113.
Vörösmarty, C. J. (2003). Anthropogenic sediment retention: major global impact from registered river impoundments. Glob. Planet. Change 39, 169–190. doi: 10.1016/s0921-8181(03)00023-7
Vousdoukas, M. I., Ranasinghe, R., Plomaritis, T. A., Athanasiou, P., Luijendijk, A., and Feyen, L. (2020). Sandy coastlines under threat of erosion. Nat. Clim. Change 10, 260–263. doi: 10.1038/s41558-020-0697-0
Wang, H., Yang, Z. S., Saito, Y., Liu, J. P., Sun, X. X., and Wang, Y. (2007). Stepwise decreases of the Huanghe (Yellow River) sediment load (1950–2005): impacts of climate change and human activities. Glob. Planet. Change 57, 331–354. doi: 10.1016/j.gloplacha.2007.01.003
Williams, A. T., Rangel-Buitrago, N., Pranzini, E., and Anfuso, G. (2018). The management of coastal erosion. Ocean Coast. Manag. 156, 4–20.
Zhang, P. Z., Molnar, P., and Downs, W. R. (2001). Increased sedimentation rates and grain sizes 2-4 Myr ago due to the influence of climate change on erosion rates. Nature 410, 891–897. doi: 10.1038/35073504
Keywords: coastal erosion vulnerability, adaptive assessment, mainland China’s coast, cloud model, coastal disaster
Citation: Cao C, Cai F, Qi H, Liu J, Lei G, Zhu K and Mao Z (2022) Coastal Erosion Vulnerability in Mainland China Based on Fuzzy Evaluation of Cloud Models. Front. Mar. Sci. 8:790664. doi: 10.3389/fmars.2021.790664
Received: 07 October 2021; Accepted: 07 December 2021;
Published: 06 January 2022.
Edited by:
Zhi-jun Dai, East China Normal University, ChinaCopyright © 2022 Cao, Cai, Qi, Liu, Lei, Zhu and Mao. This is an open-access article distributed under the terms of the Creative Commons Attribution License (CC BY). The use, distribution or reproduction in other forums is permitted, provided the original author(s) and the copyright owner(s) are credited and that the original publication in this journal is cited, in accordance with accepted academic practice. No use, distribution or reproduction is permitted which does not comply with these terms.
*Correspondence: Chao Cao, Y2FvY2hhb0B0aW8ub3JnLmNu; Feng Cai, ZmNhaTgwMEAxMjYuY29t