 Zhujun Li
 Tianxiang Gao
 Zhiqiang Han
- Fishery College, Zhejiang Ocean University, Zhoushan, China
Salinity variation affects the physiological processes of fish. This study analyzed the transcriptome of the gill tissue of Argyrosomus japonicus to determine the significantly differentially expressed genes (DEGs) of A. japonicus under salinity changes. Transcriptome analysis of nine samples yielded 55.873 Gb of clean data, 64,912 transcripts, and 29,567 unigenes, and 83.62% of the transcripts and 81.89% of the unigenes were annotated. Compared with the control group, the high- and low-salt groups showed 1,731 and 695 DEGs, respectively. Gene Ontology enrichment analysis revealed that the DEGs were significantly enriched in transportation, metabolism, and stress response. Kyoto Encyclopedia of Genes and Genomes pathway enrichment revealed that the DEGs were significantly enriched in some signaling pathways. Several key genes (KRT1, KRT2, ATP1A, LDH, PFN, ACTB_G1, TUBB, GZMB, MHC2, CCL19, EPX, ANXA5, ACBP, EHF, BHMT, COL1A, and RHOA) were related to salinity adaptation. When environmental salinity fluctuated, genes related to stress, immunity, ion transport, and metabolism became more sensitive. These results suggest that the adaptation of A. japonicus under salinity changes is a complex process that involves multiple genes acting together.
Introduction
Argyrosomus japonicus, a warm-temperature and near-bottom marine teleost fish of the order Perciformes, family Sciaenidae, and genus Argyrosomus (Chen and Zhang, 2015). The species resides in the nearshore sand and mud seabed area in the Yellow Sea, East China Sea, South China Sea, Southern Japan, Korean Peninsula, Indian Ocean, and Pacific Ocean (Chen and Zhang, 2015). It is an economically important marine fish in China, popular for its high nutritional and economic value (Han et al., 2021). A. japonicus is suitable for aquaculture because of its high price, marketability, high fecundity, fast growth, non-territorial or cannibalistic nature, and saline resilience (Fitzgibbon et al., 2007). Thus, this species is farmed in sea cages, coastal earthen ponds, and recirculating aquaculture systems (PIRSA, 2001).
The marine environment is changing rapidly around the world because of global warming (Philippart et al., 2011). Therefore, marine salinity is affected and changed. Salinity, as a key abiotic environmental factor, could affect the survival, growth and development, physiological activities, and immune metabolism of marine fish (Boeuf and Payan, 2001; Wang and Zhu, 2002; Kultz, 2015). Studies have shown some possible differences in the adaptability of different species to salinity changes, and similar species may have different responses to different degrees of salinity changes (Romano and Zeng, 2006; Ye et al., 2009). Several differentially expressed genes (DEGs) and pathways involved in salinity changes have been identified in many species, such as Oratosquilla oratoria (Lou et al., 2019), Rachycentron canadum (Cao et al., 2020), Crassostrea gigas (Zhao et al., 2012), Eriocheir sinensis (Li et al., 2014), Exopalaemon carinicauda (Shen et al., 2020), and Nibea japonica (Meng et al., 2020). At present, more macroscopical studies on A. japonicus are available than those on the adaptive mechanism and the expression of functional genes and their regulatory pathways in response to salinity fluctuation.
Through the expression of different genes under salinity changes, some genes of salinity adaptability in A. japonicus could be found, and the salinity adaption mechanisms of A. japonicus could be understood. Transcriptome analysis provides an effective method to identify genes involved in salinity changes. Key genes and pathways that may be targets for selection can be identified by analyzing the transcriptional changes induced by salinity changes (Smith et al., 2013). In terms of aquatic fauna, transcriptome analysis has been successful in Ietalurus Punetaus (Li et al., 2012), Oncorhynchus mykiss (Mohamed et al., 2012), and Penaeus orientalis (Chen et al., 2014). RNA-seq could also be used to understand the growth and development, adaptive evolution, immune response and stress response, and other biological processes of fish (Qian et al., 2014).
Studies on this species at the transcriptome level to identify the genes responsible for salinity regulation, which affects the understanding of the fundamental mechanism underlying adaptation to fluctuations in salinity, are lacking. In the present study, RNA-seq was performed on the gill tissues of A. japonicus under salinity gradient changes. Functional gene annotation, enrichment analysis, and differential expression were used to analyze the functional genes and biological processes involved in response to salinity changes. The results provided data for studying the molecular mechanism of salinity adaptation in marine fish. Furthermore, the RNA-seq data act as an important resource not only for the identification of novel genes but also for further investigations regarding A. japonicus biology.
Materials and Methods
Materials and Experimental Design
Argyrosomus japonicus (Figure 1) was purchased from an aquatic product market in Zhoushan City, Zhejiang Province. This species was morphologically identified. Forty fish were temporarily kept in artificial seawater with a salinity of 25 psu. During the period, they were continuously oxygenated with oxygen pump, and the temperature was maintained at approximately 25°C. After 48 h, 30 randomly selected fish were exposed to different salinities for 24 h and stocked in three normal tanks (1.0 m × 0.7 m × 0.4 m) with 10 fish each. One group was exposed to the optimal salinity of 25 psu as the control group, and another two groups were exposed to the salinity of 35 and 15 psu as the high-salt group and the low-salt group, respectively. At the end of the experiment, three fish from each group were anesthetized, and samples were taken from the gill. The tissue was selected because it is considered a major osmoregulatory organ in most teleost fish (Higashimoto et al., 2001). These specimens were handled using RNA preservation solution and stored at a –80°C ultra-low temperature refrigerator for later use.
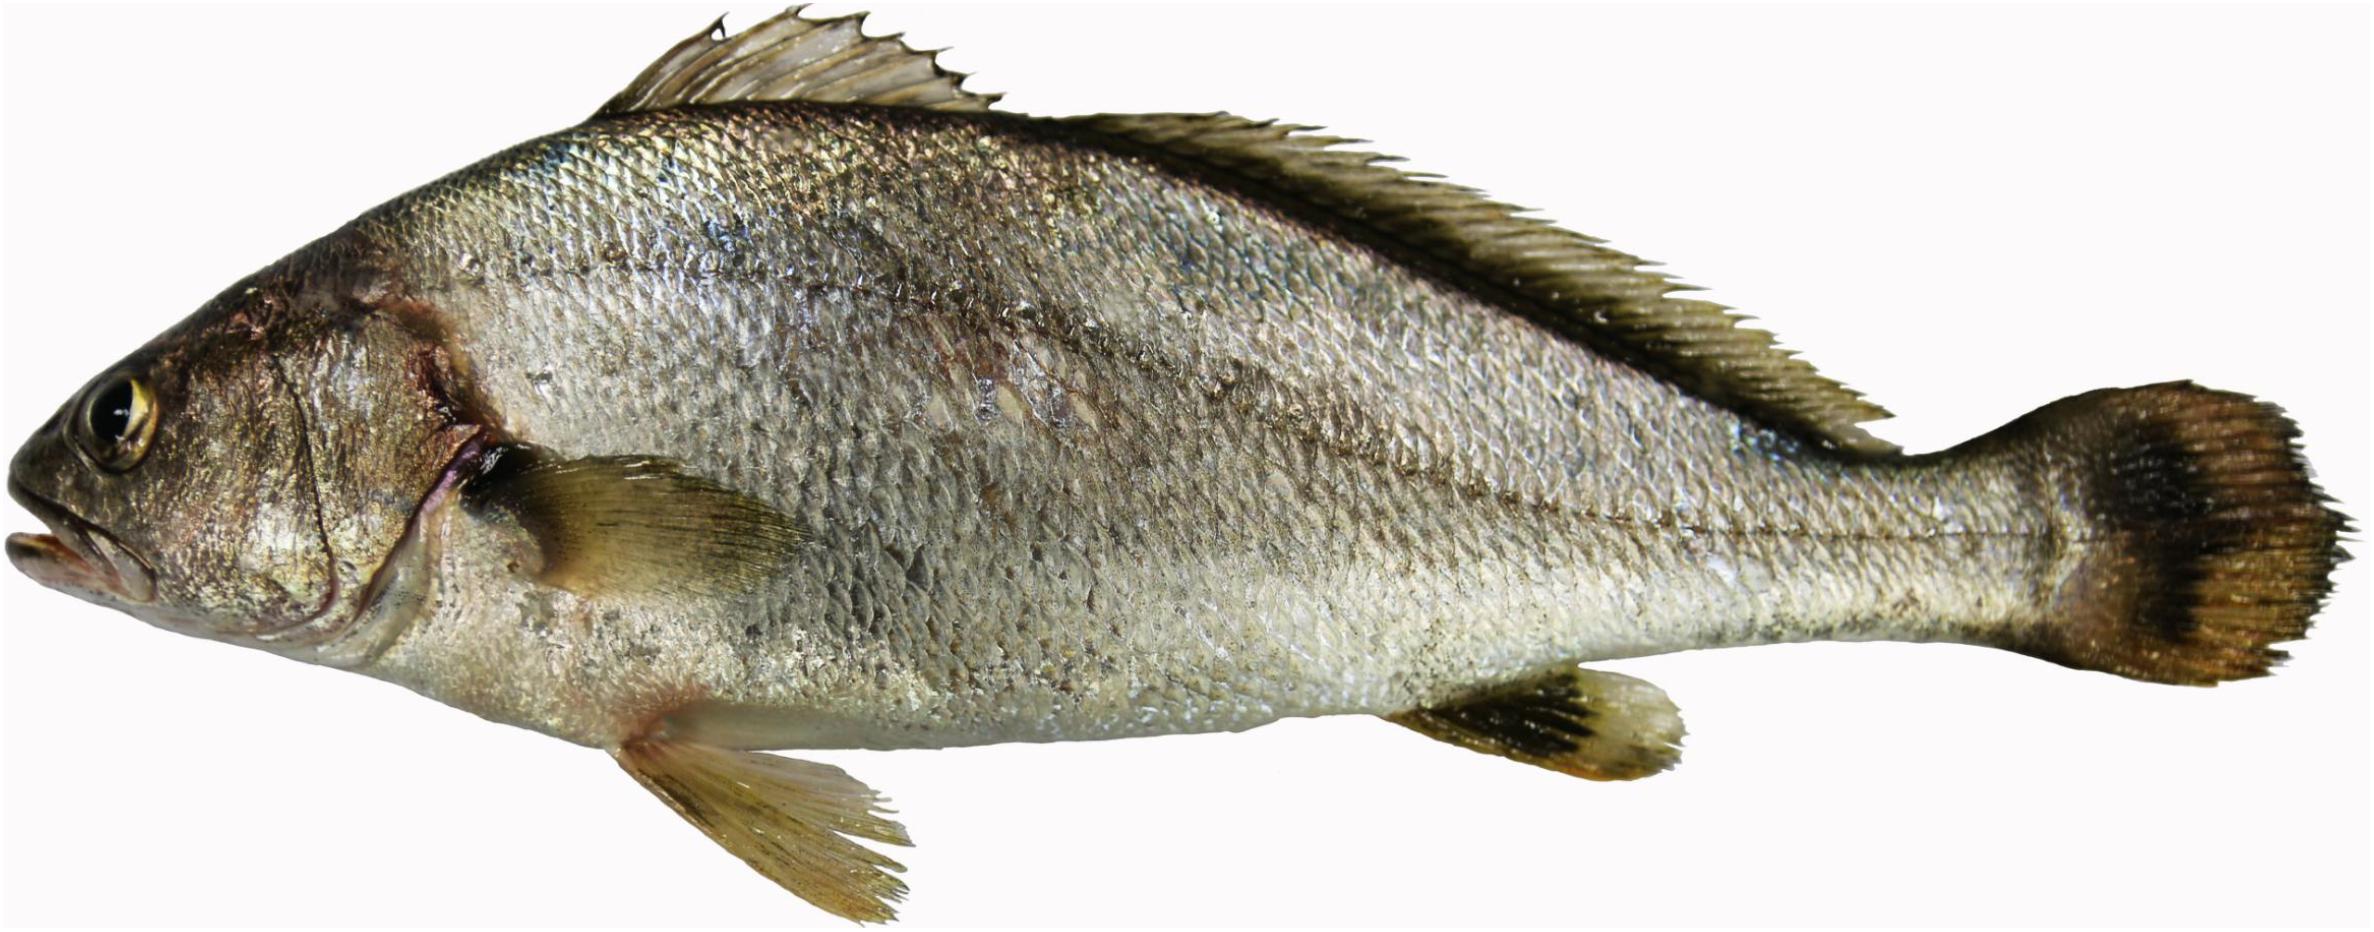
Figure 1. Argyrosomus japonicus.
RNA Extraction, Library Construction, and Illumina Sequencing
Total RNA was extracted from the gill tissues of the three groups by using a standard TRIzol Reagent Kit (Invitrogen, Carlsbad, CA, United States) in accordance with the manufacturer’s instructions. The integrity of RNA and the existence of DNA contamination were analyzed using 1% agarose gel electrophoresis. The absorbance values at the wavelengths of 230, 260, and 280 nm were measured using a NanoPhotometer spectrophotometer (Invitrogen, Carlsbad, CA, United States), and the ratios of OD260/280 and OD260/230 were calculated to detect RNA purity. RNA integrity was accurately measured using an Agilent 2100 bioanalyzer (Invitrogen, Carlsbad, CA, United States).
Illumina’s TruSeq RNA Library Preparation Kit was used following the manufacturer’s protocol for library construction. First, the mRNA with poly A tail was enriched using magnetic beads containing oligo (dT). Subsequently, the mRNA was randomly fragmented by adding NEB Fragmentation Buffer. The fragment mRNA was used as a template, and randomized oligonucleotides were used as primers to synthesize the first-strand cDNA. Then, the RNA chain was degraded by RNaseH. The second-strand cDNA was synthesized in the polymerase I system by using dNTPs as the raw material. The double-stranded cDNA was purified, and it underwent end repair. The poly A tail was added, and the sequencing joints were connected. The library was sequenced on Illumina HiSeq 2000, and the paired end was 150 bp.
Transcriptome Quality Control, Assembly, and Functional Annotation
Raw RNA-seq data were filtered by removing reads with sequencing adapters, unknown nucleotides (N ratio > 10%), low-quality reads (quality scores < 20), and non-AGCT bases in the 5′ end to ensure the accuracy of the subsequent bioinformatic analysis. The adapters and small fragments with a length less than 25 bp were removed after quality pruning. Thus, high-quality clean data could be obtained.
Comparison reference genome analysis was performed on Hisat2 (Kim et al., 2015; Johns Hopkins University), and the clean data obtained after quality control were compared with the reference genome of A. japonicus (GCA_015710095.1). Then, the mapped reads for transcript assembly and expression volume calculation were obtained. On the basis of the selected reference genome sequence, the software StringTie (Pertea et al., 2015) was used to assemble the mapped reads, compare them with the original genome annotation information, obtain the original unannotated transcription regions, and determine new transcripts and new genes of the species to supplement and improve the original genome annotation information. Sequences that coded for peptide chains that were too short (less than 50 amino acid residues) or contained only a single exon were filtered out. All unigenes were used to analyze the gene functions on the basis of NR (Non-Redundant Protein Sequence Database), Swiss-Prot (A manually annotated and reviewed protein sequence database), Pfam (Protein family database), STRING (An online search databases of known protein interaction relationships), GO (Gene Ontology), and KEGG (Kyoto Encyclopedia of Genes and Genomes) by using the BLAST (Scott and Madden, 2004) program1 alignments, with an E-value < 0.00001 (Shen et al., 2020).
Gene Differential Expression Analysis
The expression levels of all unigenes were normalized, and RSEM and Bowtie2 were used to determine the FPKM (Fragments Per Kilobase of exon model per Million mapped fragments) values (Mortazavi et al., 2008). The DEGs were identified across samples or groups by using DESeq2 (Love et al., 2014). FDR < 0.05 and | log2FoldChange| ≥ 1.00 were considered as the filtering thresholds for significant DEGs. The selected DEGs were analyzed for the enrichment of GO and KEGG pathways, and P < 0.05 indicated that the DEGs were significantly enriched in the GO and KEGG pathways. P < 0.05 is generally considered as significant enrichment, and the smaller the P value is, the greater the significance.
Quantitative Real-Time PCR Analysis
Quantitative real-time PCR (qRT-PCR) was performed to verify the transcriptome data and the Illumina sequencing results. Five genes with a high level of significance were randomly selected in accordance with the sequencing data, and GAPDH (forward, 5′-AAGACCAACCCAGAGCAAAATG-3′; reverse, 5′-TCACCTTGAAGCGACCA-3′) was selected as the reference gene for qRT-PCR analysis. Gene-specific primers were designed using Primer Premier 6.0 (Premier Biosoft Inc., CA, United States), as shown in Table 1. Standard curves were constructed to determine the dilution times of cDNA samples, and they served as calibrators. qRT-PCR analysis was performed in accordance with the manufacturer’s instructions for ACEQ qPCR SYBR Green Master Mix (without ROX). A 10 μL reaction system was amplified by Bio-Rad CFX96 real-time PCR system (Applied Biosystems, Bio-Rad, United States), including 2 μL of cDNA, 5 μL of SYBR Green Mix (2×), 0.5 μL of forward primers, 0.5 μL of reverse primers, and 9.5 μL of ddH2O. The PCR reaction conditions were as follows: 95°C for 5 min, 95°C for 10 s, and 60°C for 30 s, followed by 40 cycles. Dissolution curves were analyzed after the reaction was completed. Three parallel experiments were conducted for each cDNA template to strengthen the accuracy of the results. The relative expression of these genes was calculated using the 2–ΔΔCt method as follows: ΔCt = Ct target unigene – Ct reference gene; ΔΔCt = ΔCt treatment – ΔCt control (Livak and Schmittgen, 2002). SPSS 19.0 statistical software (International Business Machines Inc., United States) was used for statistical analysis.
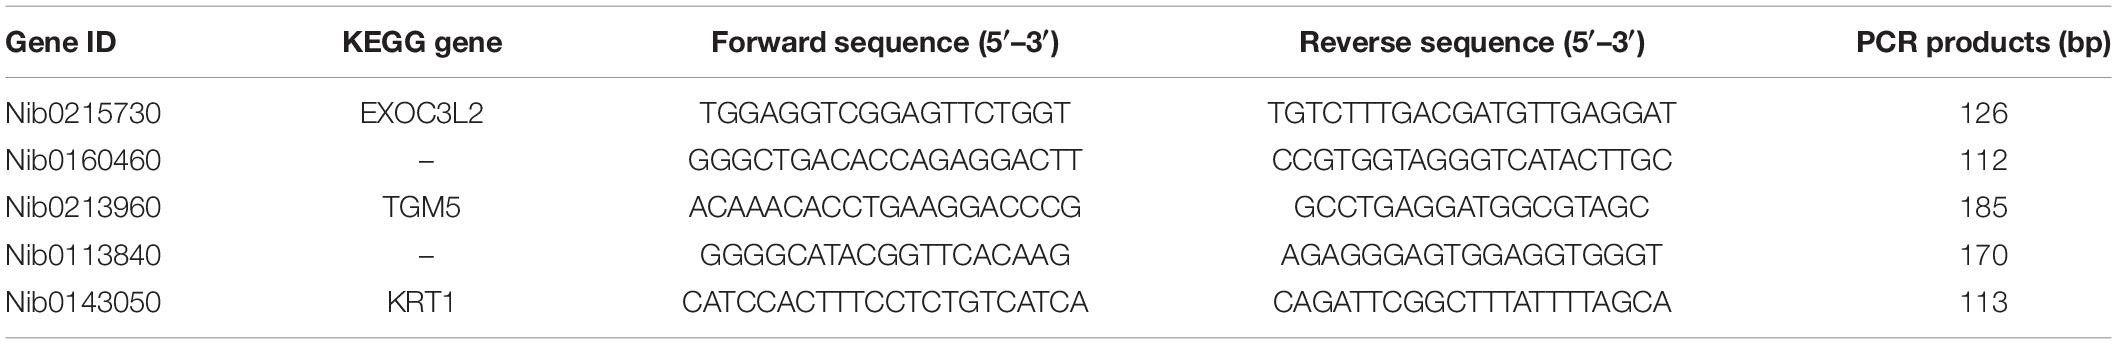
Table 1. Primer sequences of five target unigenes analyzed using quantitative real-time PCR.
Results
Sequencing Data, Transcriptome Assembly, and Gene Annotation
After filtering, approximately 55.873 Gb of clean data were generated for subsequent analysis. The percentage of Q20 base was above 97.50%, the percentage of Q30 base was above 93.70%, and the GC contents were all between 49.41 and 50.00%; the details are listed in Table 2. This finding indicated that the quality of RNA-seq of the gill tissue of A. japonicus improved. The clean data of each sample were aligned with the specified reference genome sequence, and the matching rates were above 92%, which indicated that the selected reference genome assembly could meet the requirements of information analysis.

Table 2. Information of transcriptomic reads of each sample.
A total of 64,368 transcripts were spliced into 29,567 unigenes after further redundancy removal (Table 3), and 40,802 new transcripts and 6,001 new unigenes were found. The target genes and transcripts were annotated, and 83.62% of the transcripts and 81.89% of the unigenes were annotated in the six large databases of NR, Swiss-Prot, GO, Pfam, KEGG, and STRING (Table 4).

Table 3. Statistics of assembly results.
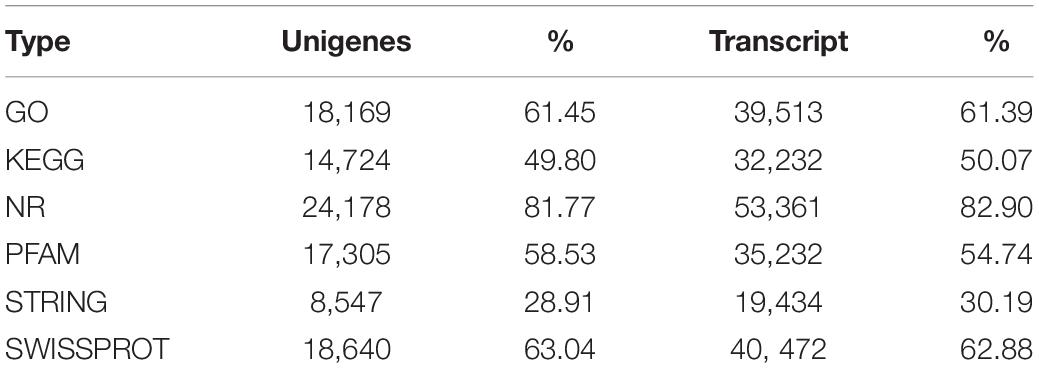
Table 4. Database annotation statistics for unigenes and transcripts.
Gene Differential Expression Analysis
The value of FPKM was taken as the gene expression amount in each sample. The expression levels of each sample are shown in a box diagram (Figure 2). The distribution of FPKM under different salinity conditions was not significantly different at the overall level. The correlation of gene expression levels between samples could be used to test the reliability of the experiment and whether the sample selection is reasonable. The sample correlation heatmap of gene expression (Figure 3) shows that the similarity of expression patterns among the samples was high, indicating high experimental reliability and reasonable sample selection.
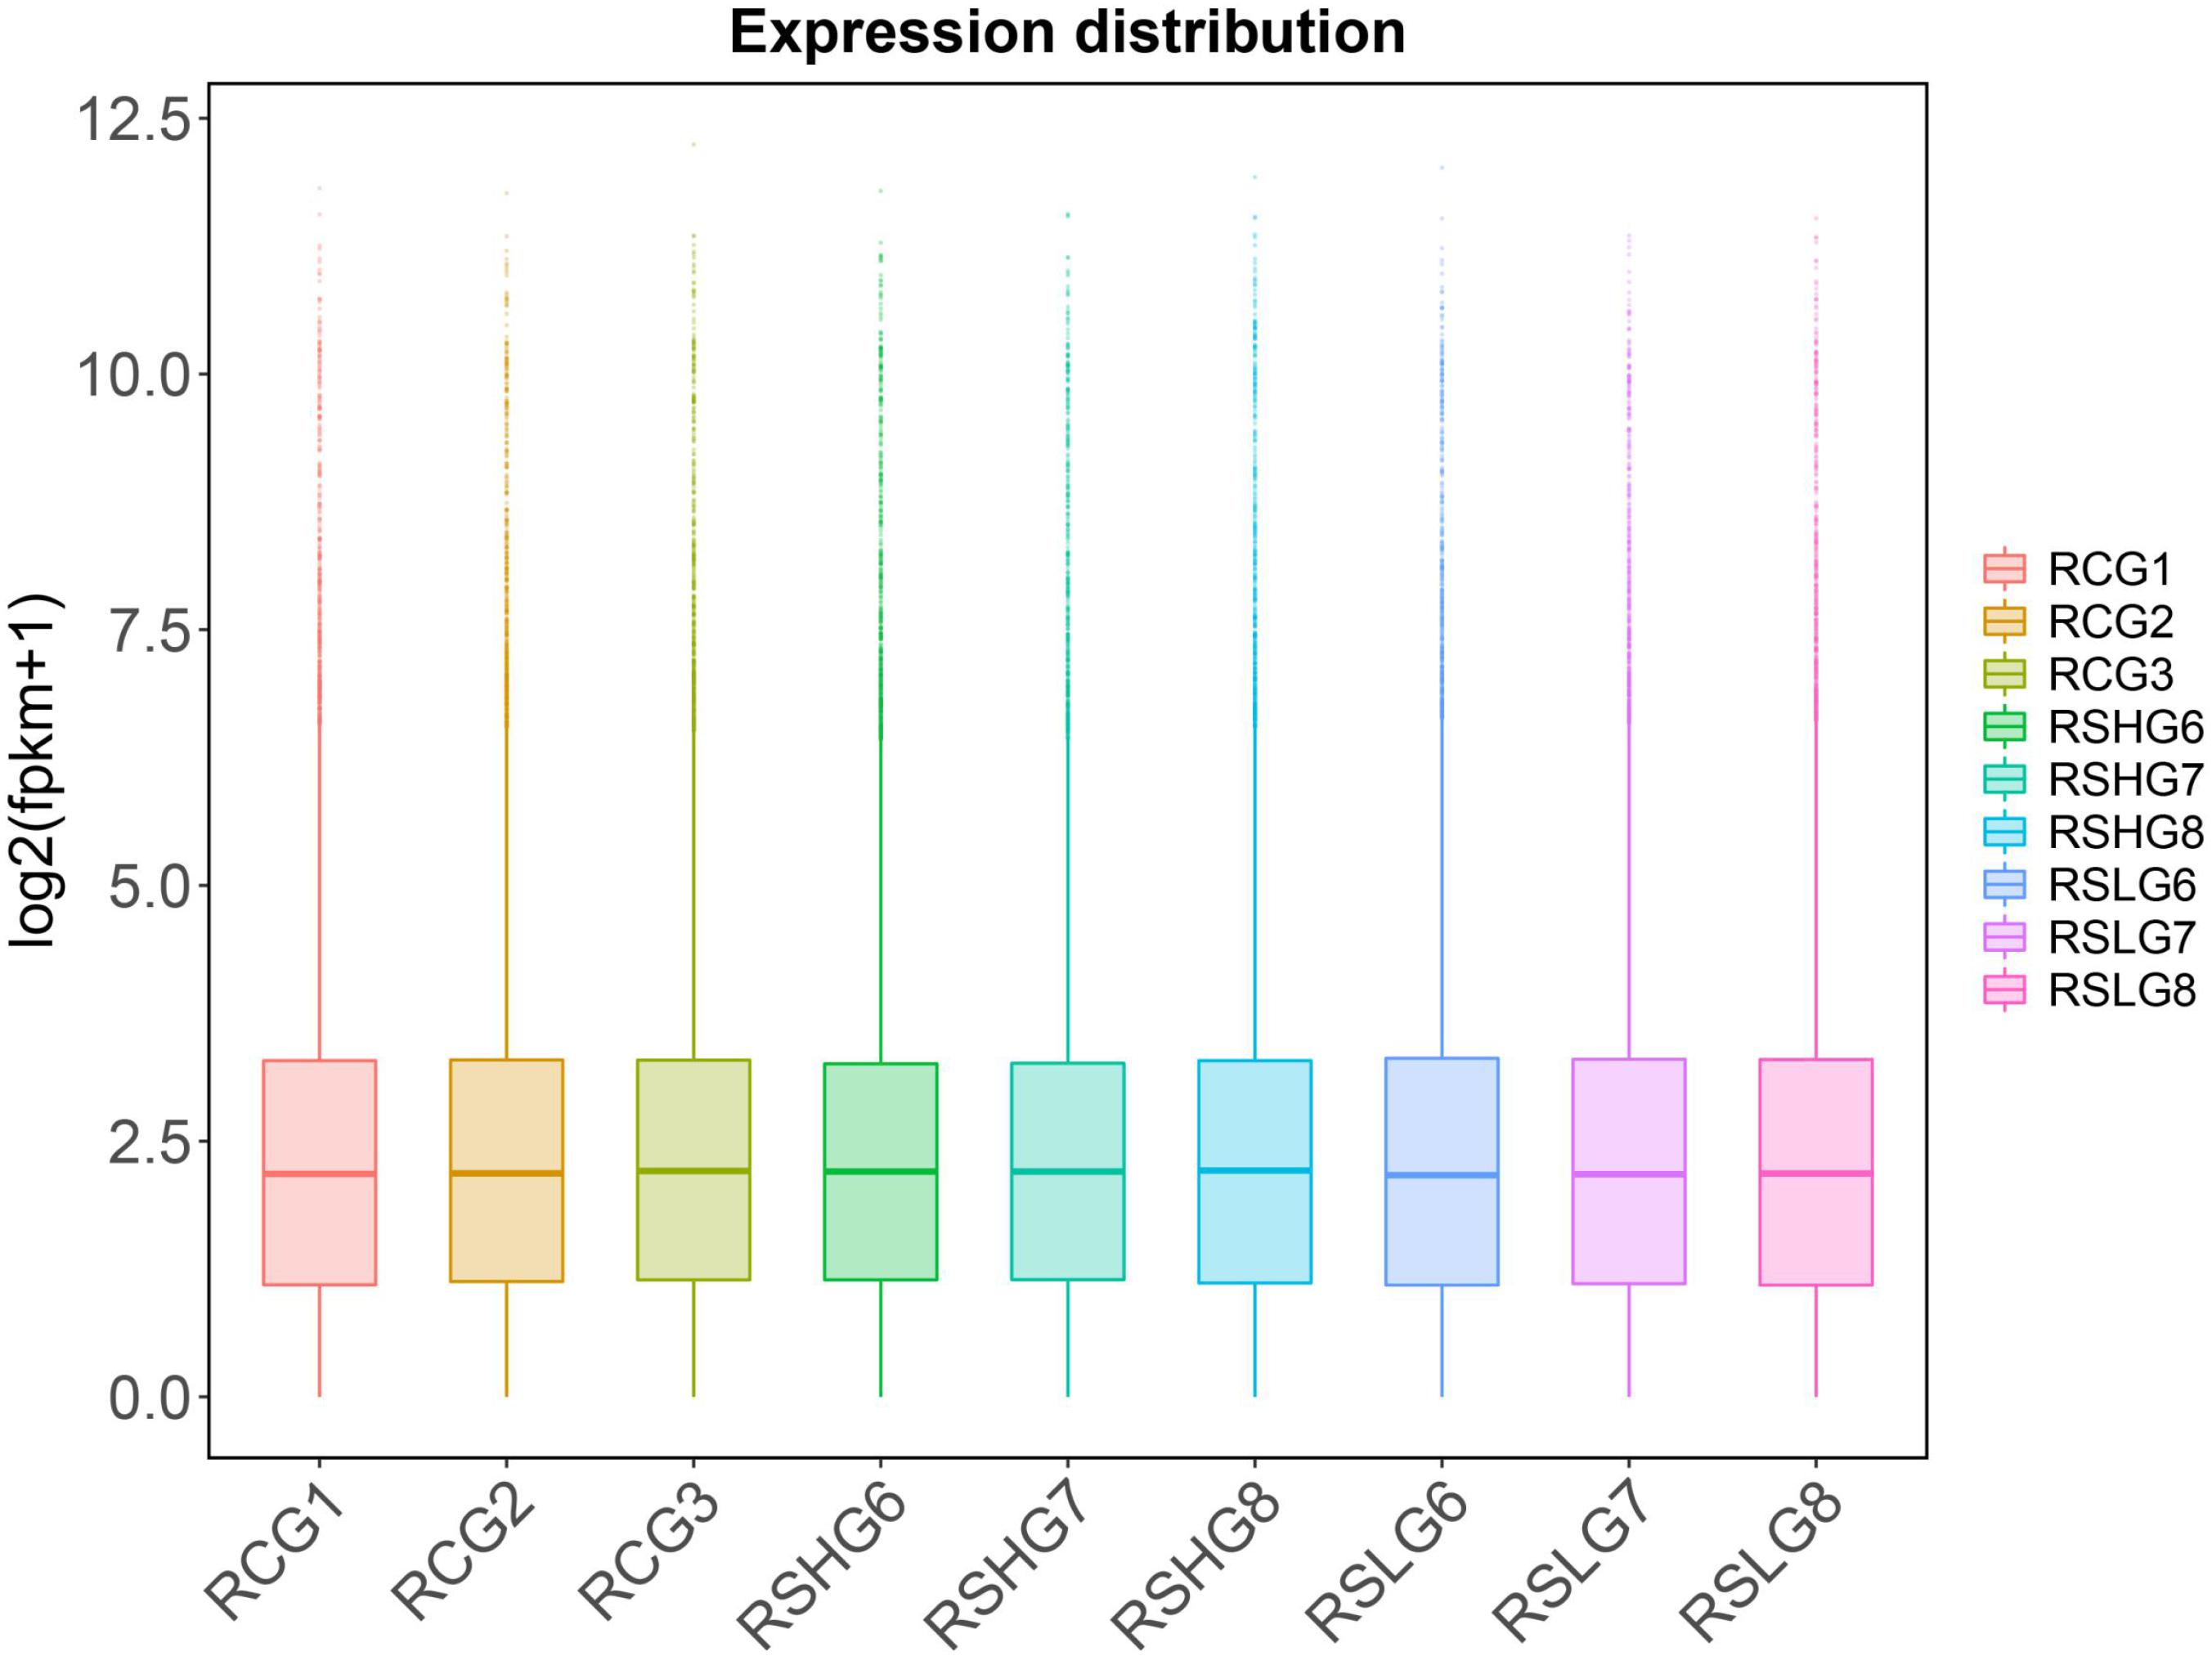
Figure 2. Gene expression levels in different treatment groups.
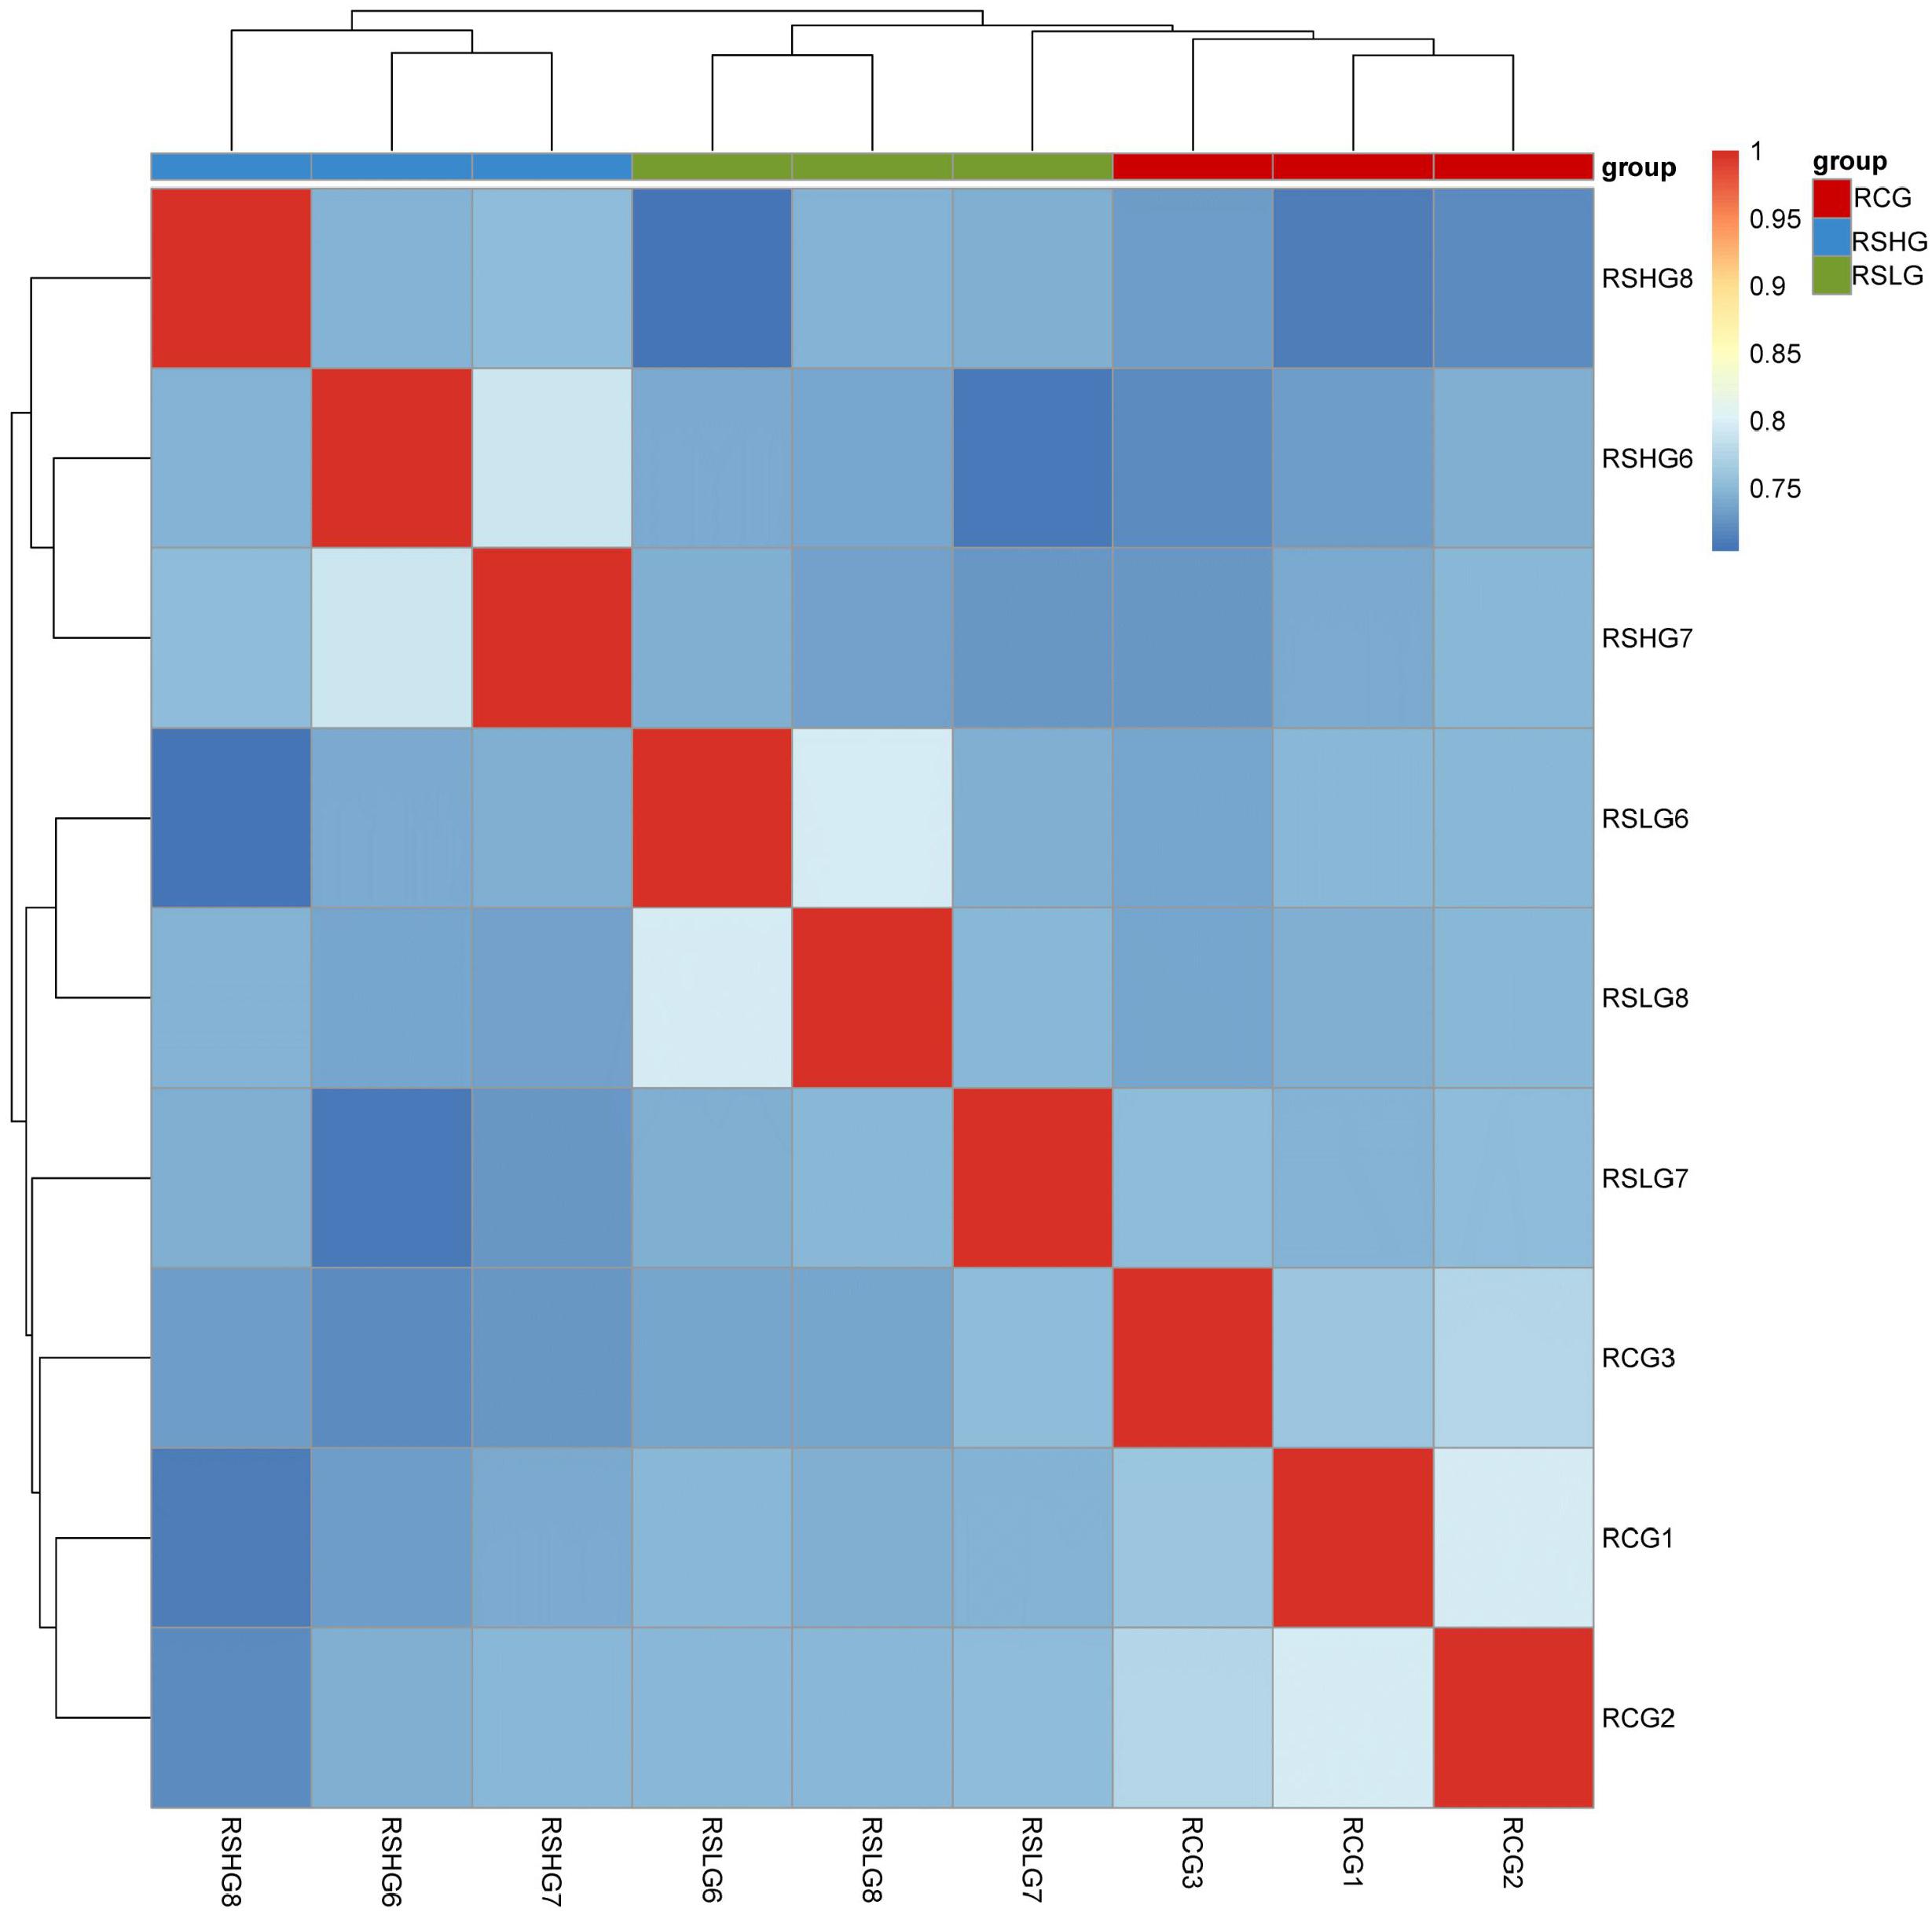
Figure 3. Sample correlation heatmap of gene expression.
The transcripts of the two experimental groups and the control group were analyzed. Figure 4A shows that the low-salt group had 695 DEGs, among which 305 were significantly up-regulated and 390 were significantly down-regulated. Figure 4B shows that the high-salt group had 1,731 DEGs, among which 847 were significantly up-regulated and 884 were significantly down-regulated. The number of significantly up-regulated and down-regulated DEGs in the high-salt group was higher than that in the low-salt group.
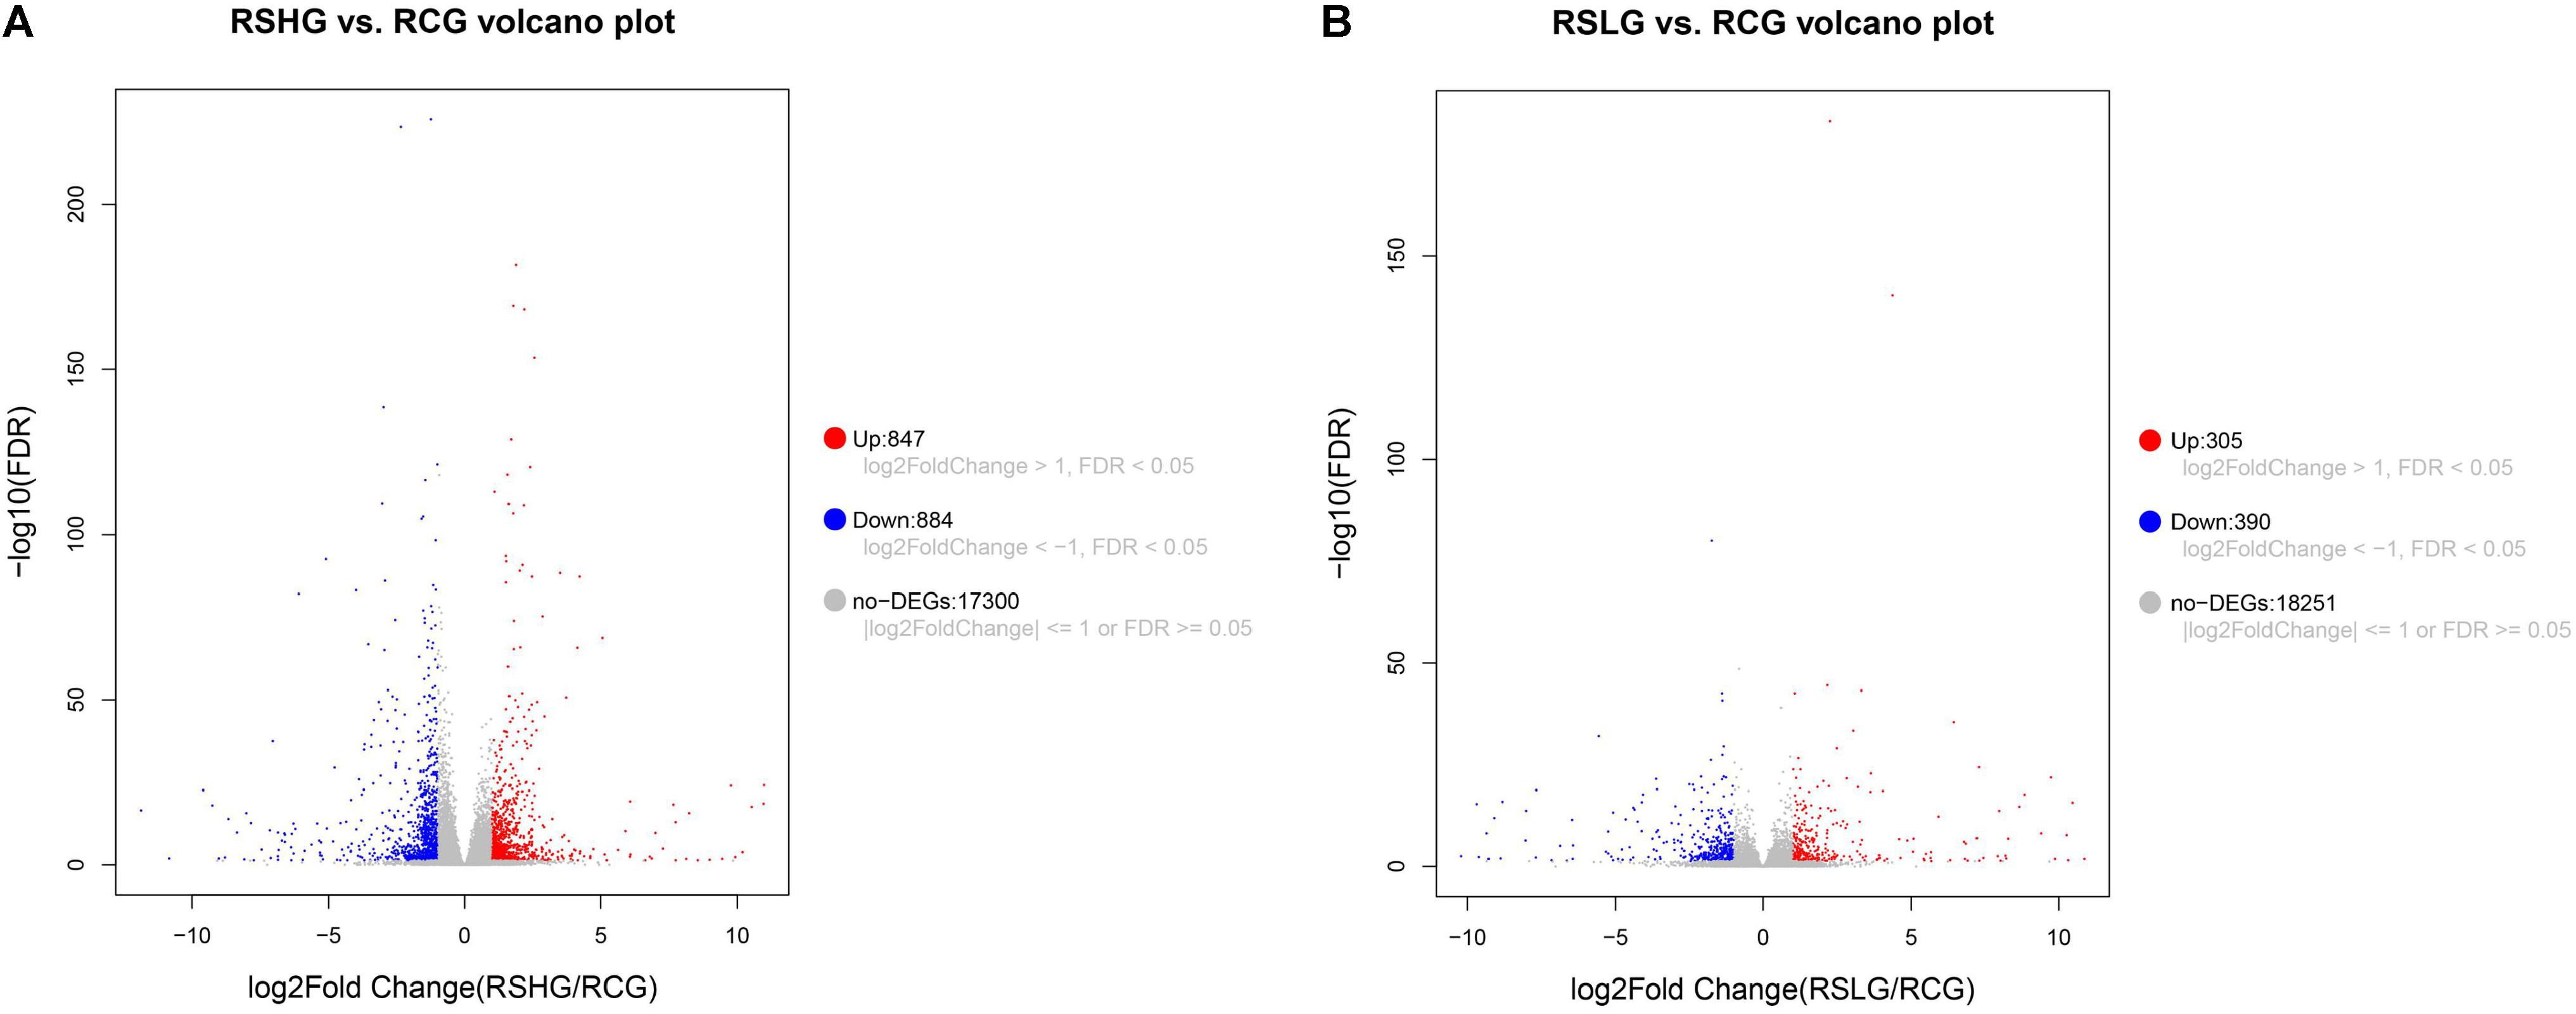
Figure 4. Volcano plot of DEGs. (A) RSHG versus RCG volcano plot; (B) RSLG versus RCG volcano plot.
Co-expressed Differentially Expressed Genes
A Venn diagram was prepared to quantify the number of differentially expressed unigenes, and results showed that 22 unigenes were differentially expressed in the hyper- and hypo-salinity environments (Figure 5). As shown in Table 5, eight (EDC3; CYLD, USLP2; NCAM, CD56; PLA2G, SPLA2; KCNJ16; SLC9A3, NHE3; KRT1; E4.1.1.17, ODC1, speC, and speF) out of the 22 co-expressed genes were annotated to some specific KEGG pathways, which mainly involved RNA degradation, some immune-related signaling pathways, and substance metabolism and absorption. The result suggest that physiological processes, such as immunity response, signal transduction, substance metabolism, and osmotic pressure regulation, are part of the adaptation mechanism of A. japonicus to salinity fluctuations.
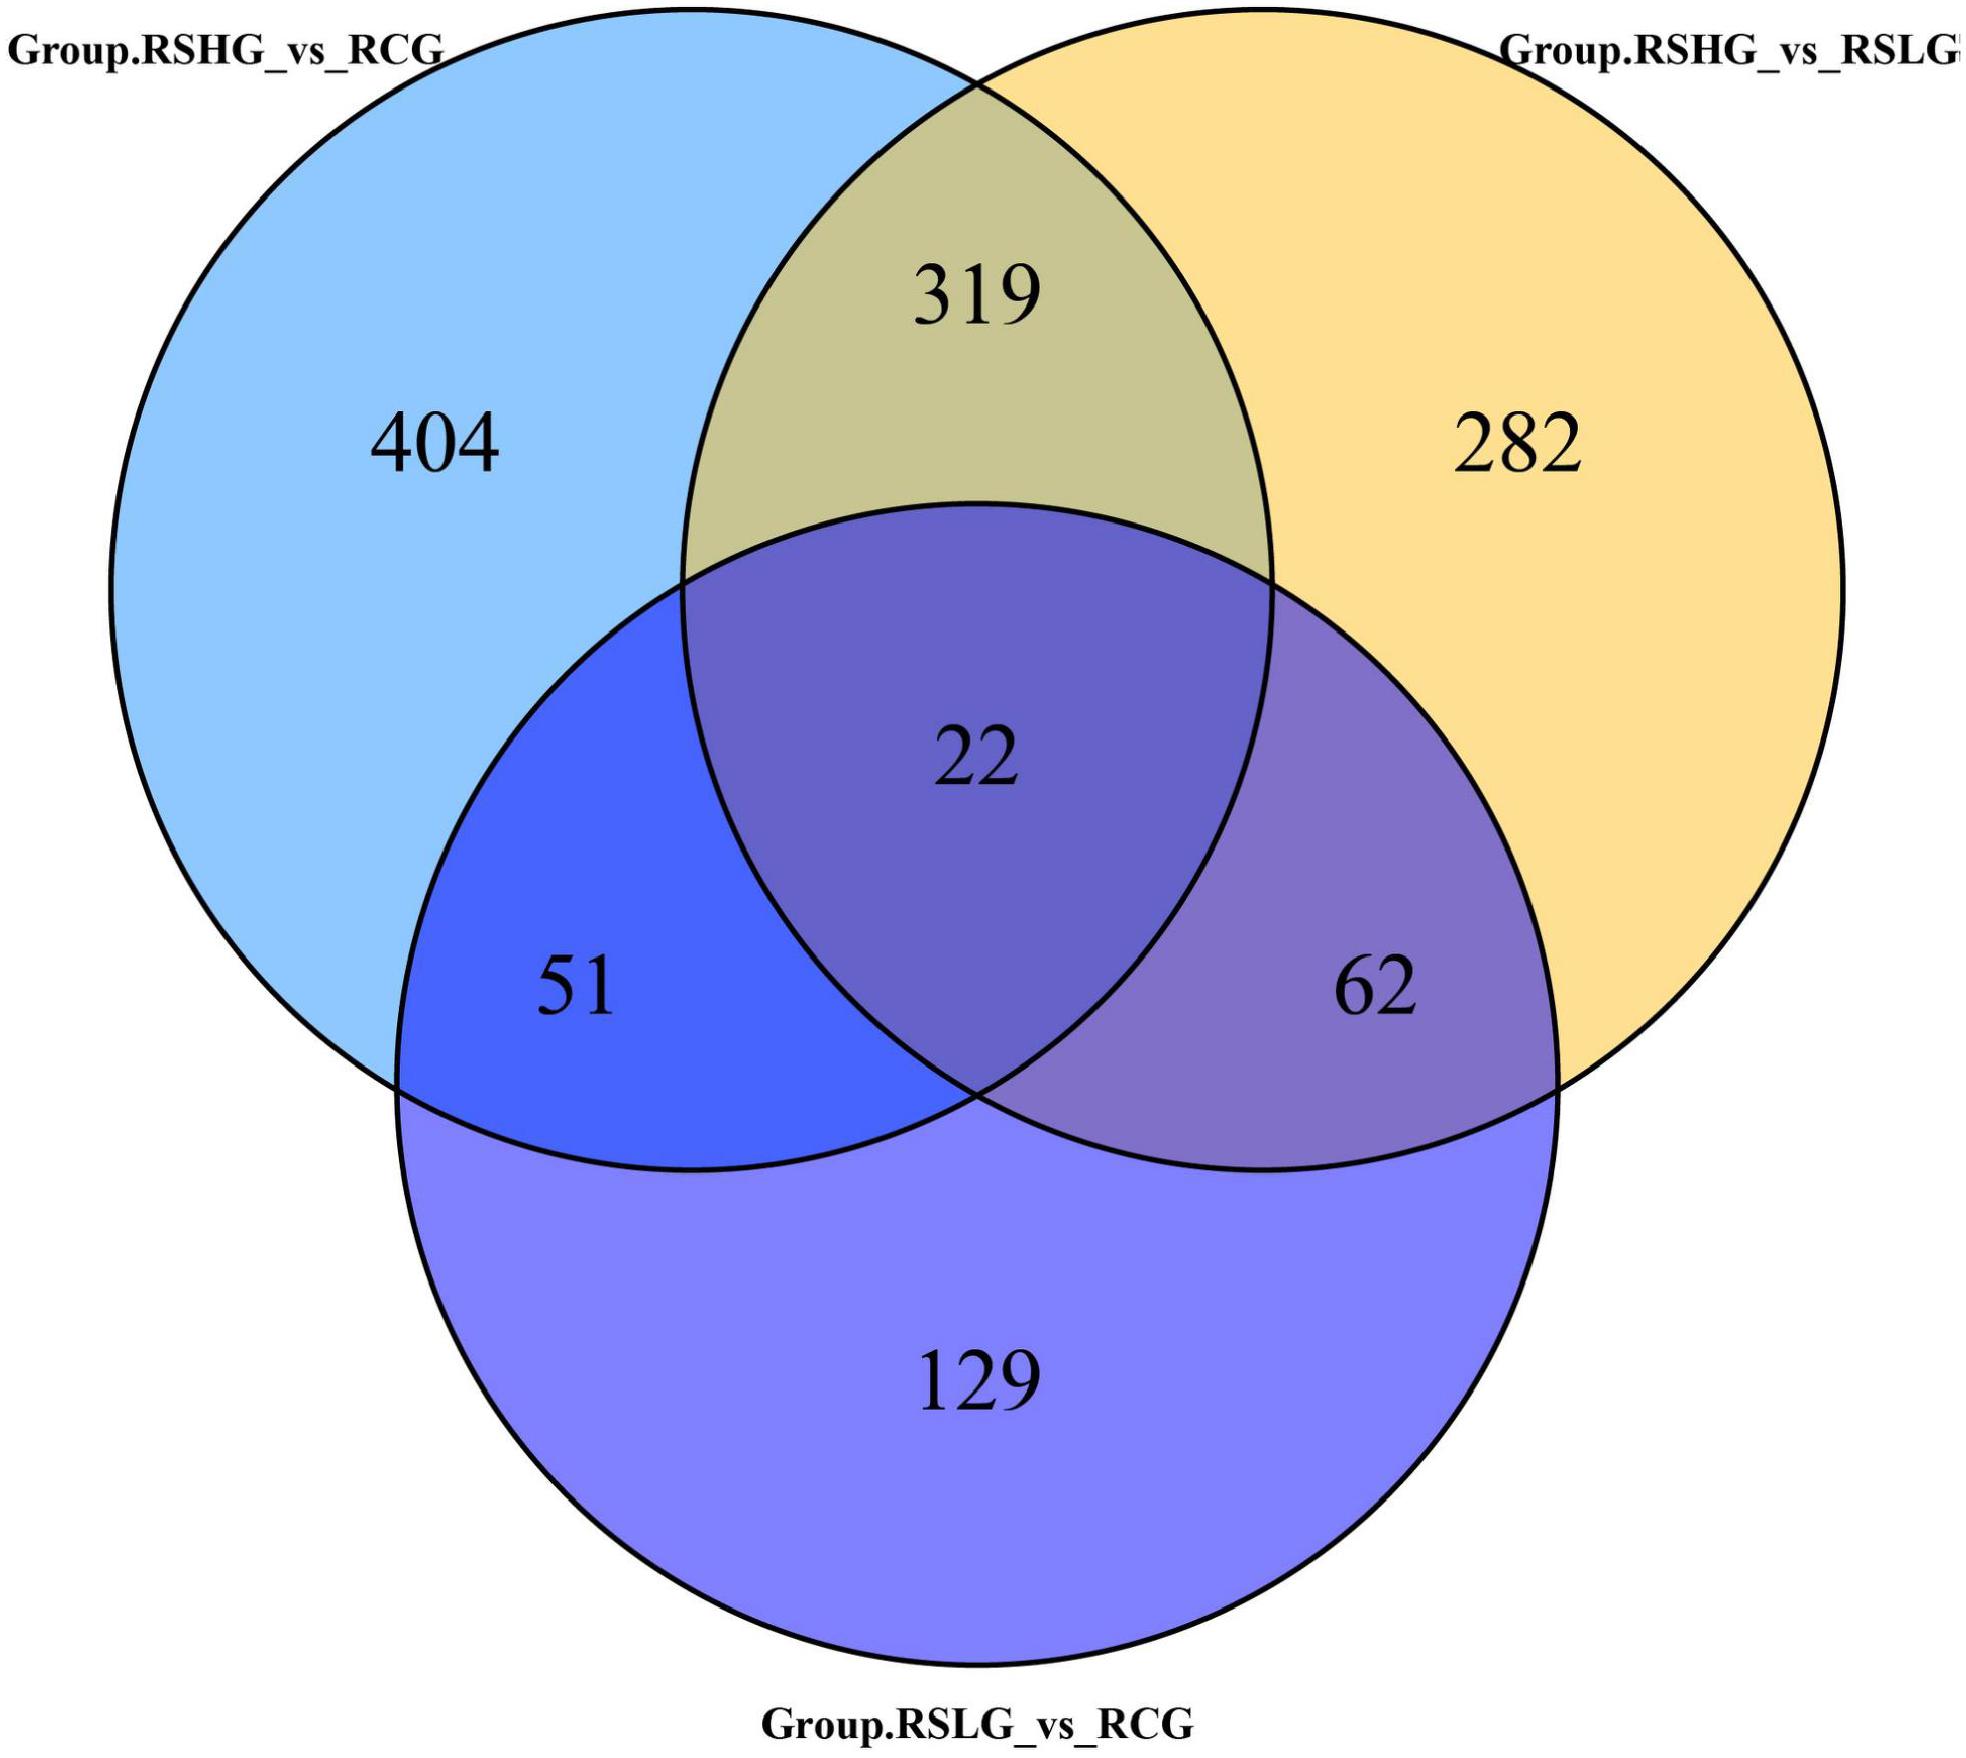
Figure 5. Venn diagram of DEGs.
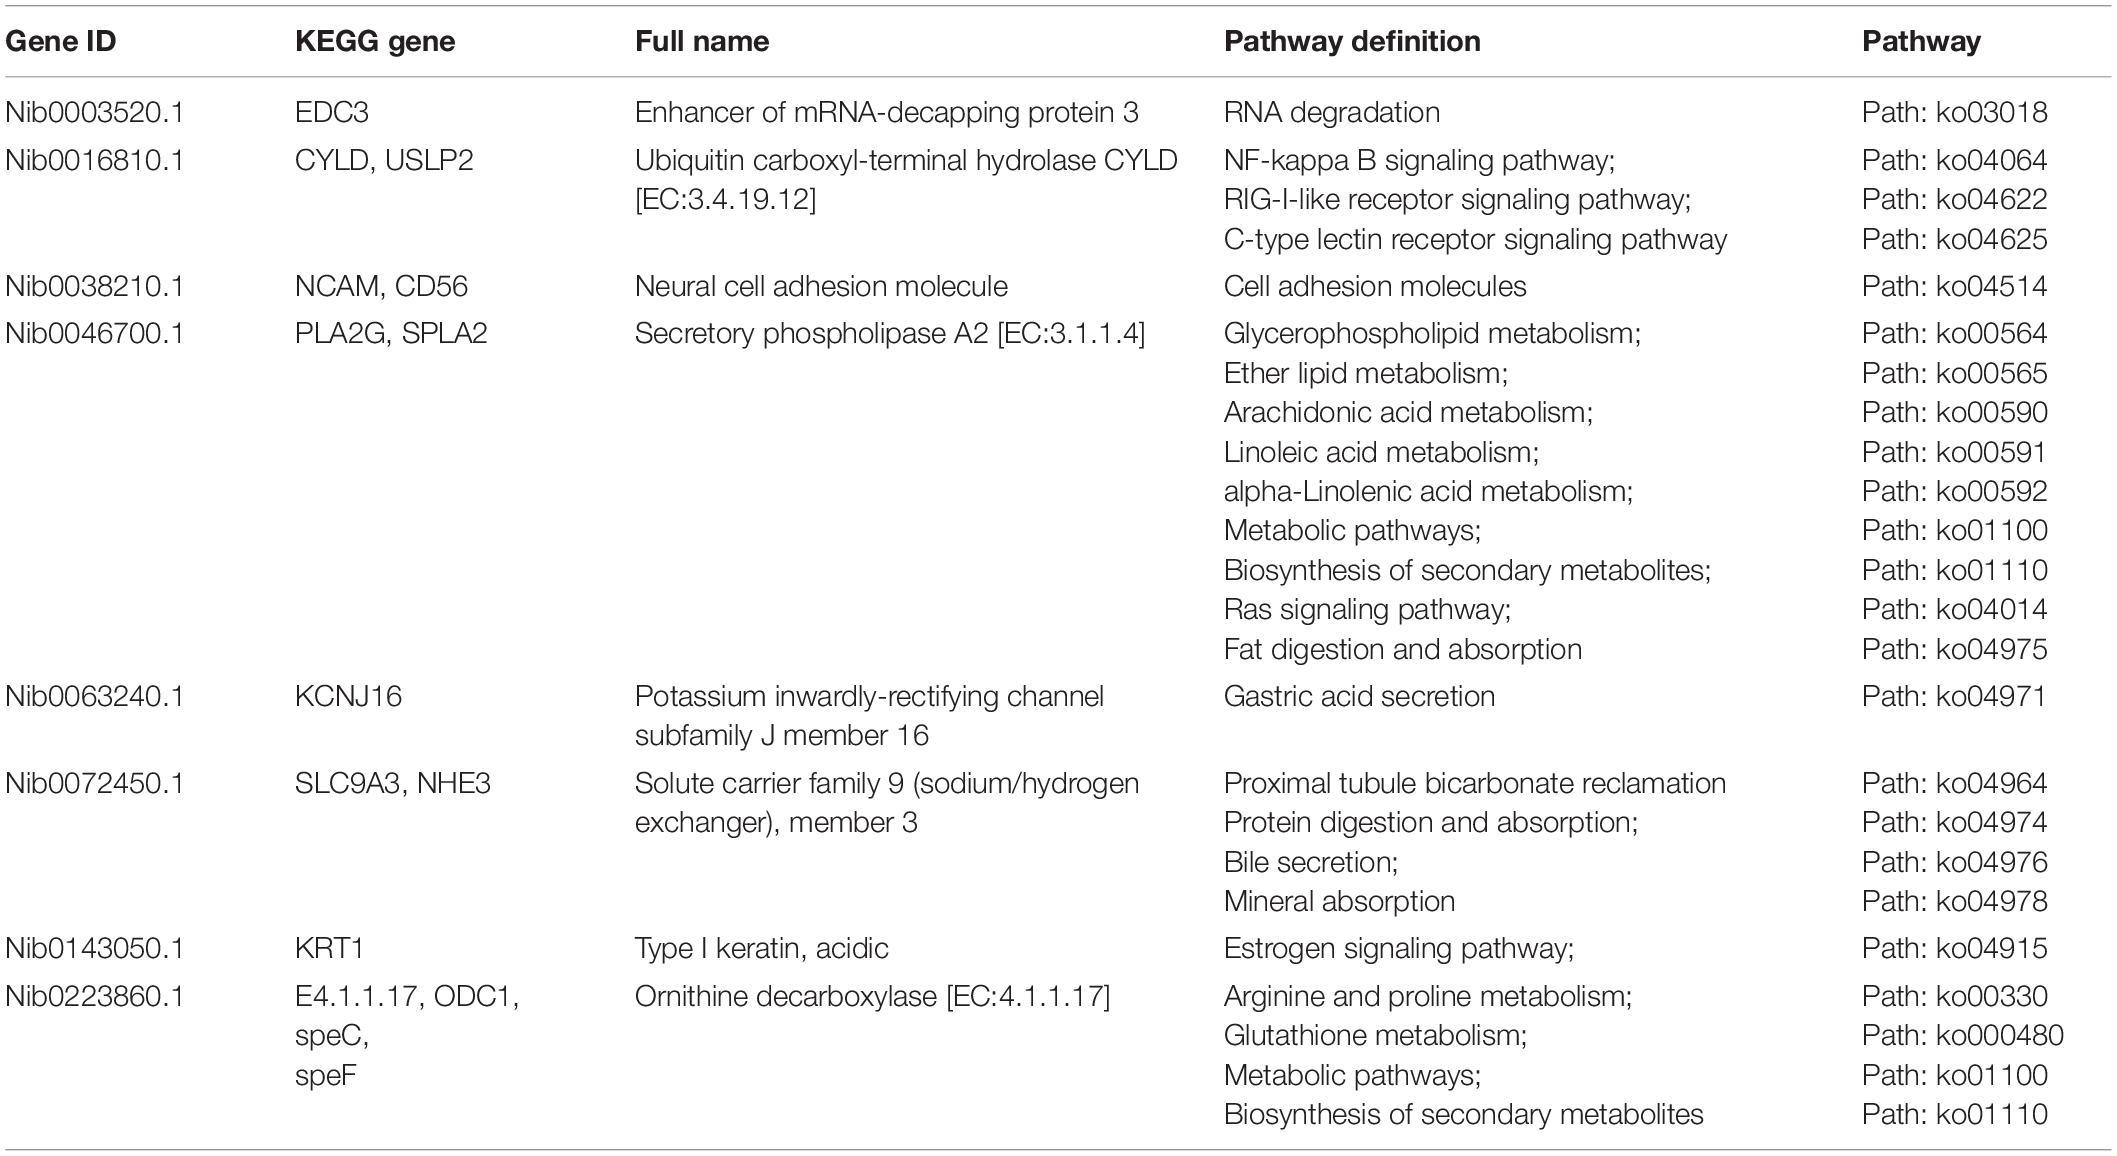
Table 5. Twenty-two co-expressed DEGs.
Gene Ontology Function Annotation and Enrichment Analysis of Differentially Expressed Genes
The main biological functions of DEGs could be determined by GO enrichment analysis. Under hyper-salinity, the GO enrichment results showed that the up-regulated DEGs were significantly enriched in transporter activity (GO: 0005215), transmembrane transporter activity (GO: 0022857), ion transmembrane transporter activity (GO: 0015075), chemical homeostasis (GO: 0048878), ion transport (GO: 0006811), transmembrane transport (GO: 0055085), anion transmembrane transporter activity (GO: 0008509), membrane part (GO: 0044425), intrinsic component of membrane (GO: 0031224), integral component of membrane (GO: 0016021), and multicellular organismal process (GO: 0032501) GO terms (Figure 6A). The down-regulated DEGs were significantly enriched in the DNA metabolic process (GO: 0006259), DNA repair (GO: 0006281), cell response to DNA damage stimulus (GO: 0006974), cell cycle process (GO: 0022402), and chromosomal part (GO: 0044427) GO terms (Figure 6C).
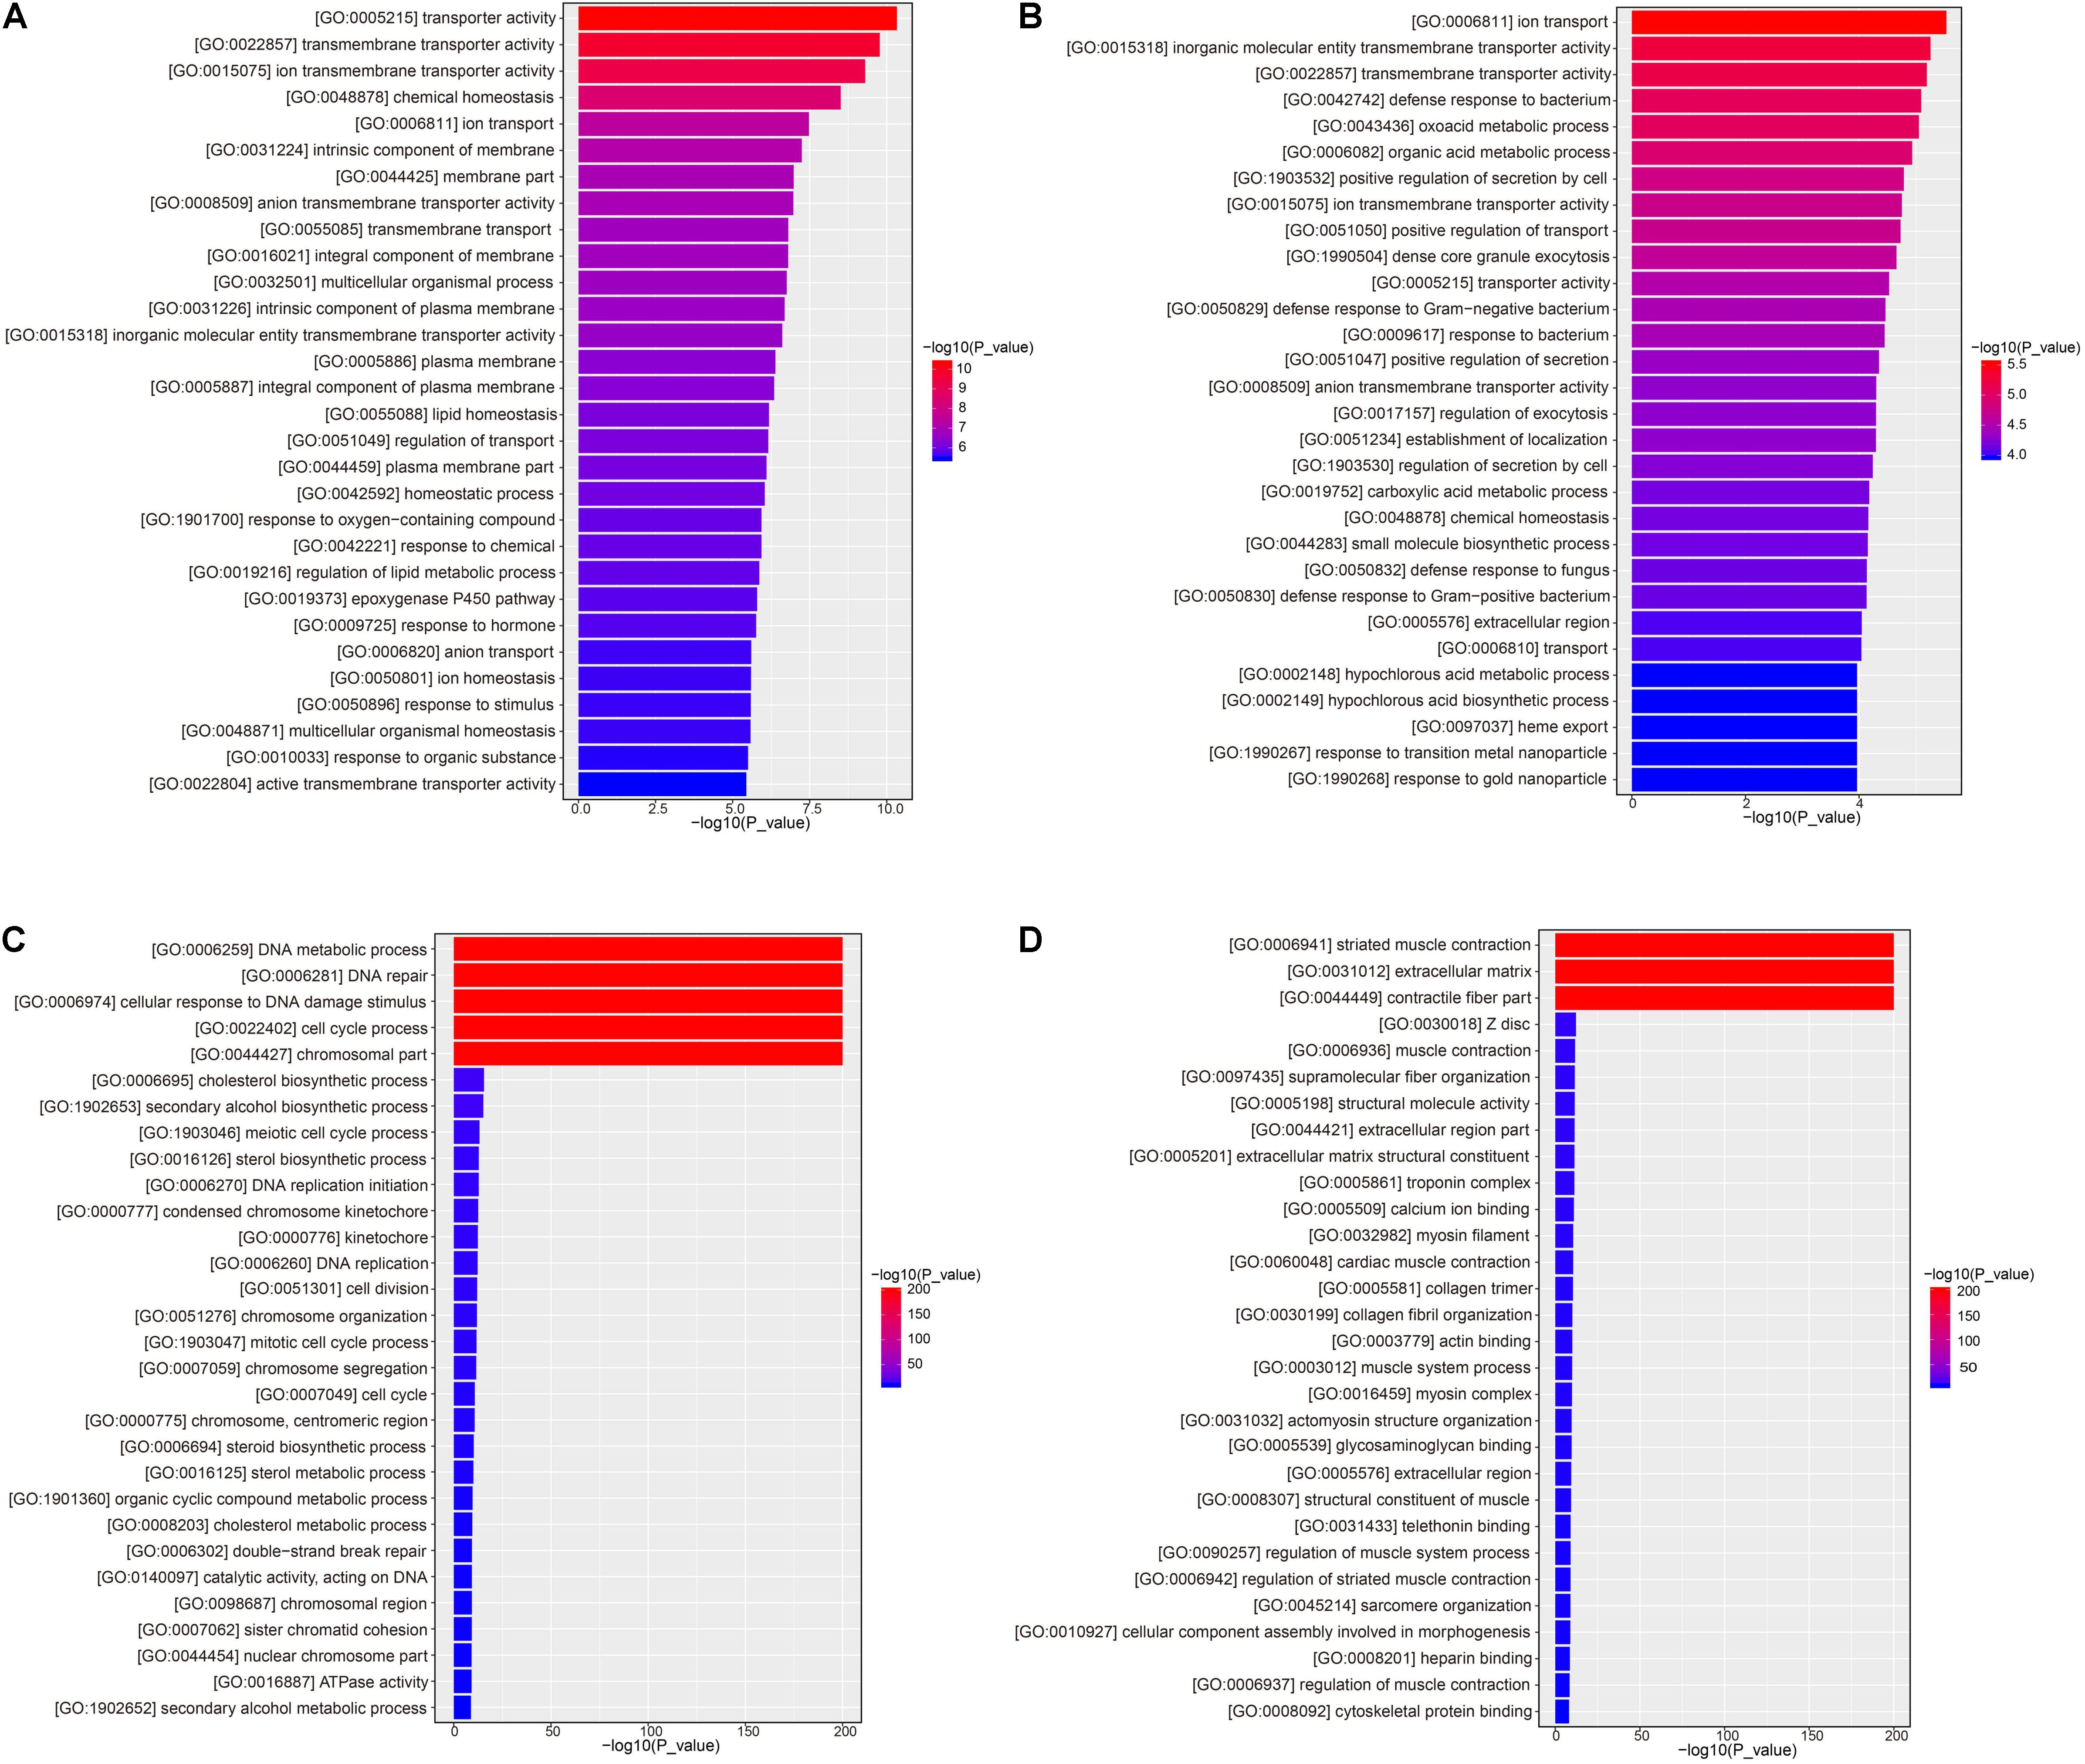
Figure 6. Bar plot of GO function enrichment of DEGs. (A) RSHG versus RCG bar plot of up-regulated DEGs; (B) RSLG versus RCG bar plot of up-regulated DEGs; (C) RSHG versus RCG bar plot of down-regulated DEGs; and (D) RSLG versus RCG bar plot of down-regulated DEGs.
Under hypo-salinity, the up-regulated DEGs were significantly enriched in ion transport (GO: 0006811), inorganic molecular entity transmembrane transporter activity (GO: 0015318), transmembrane transporter activity (GO: 0022857), defense response to bacterium (GO: 0042742), oxoacid metabolic process (GO: 0043436), organic acid metabolic process (GO: 0006082), and positive regulation of secretion by cell (GO: 1903532) GO terms (Figure 6B); the down-regulated DEGs were significantly enriched in striated muscle contraction (GO: 0006941), extracellular matrix (GO: 0031012), and contractile fiber part (GO: 0044449) GO terms (Figure 6D).
Kyoto Encyclopedia of Genes and Genomes Pathway Enrichment Analysis of Differentially Expressed Genes
Kyoto Encyclopedia of Genes and Genomes analysis showed that 14,724 unigenes were annotated and DEGs were enriched in 322 pathways. A large number of DEGs were involved in the regulation of the metabolic pathways (ko01100), pathways in cancer (ko05200), biosynthesis of secondary metabolites (ko01110), PI3K-Akt signaling pathway (ko04151), endocytosis (ko04144), MAPK signaling pathway (ko04010), HTLV-I infection (ko05166), neuroactive ligand-receptor interaction (ko04080), Ras signaling pathway (ko04014), proteoglycans in cancer (ko05205), Rap1 signaling pathways (ko04015), Focal adhesion (ko04510), cAMP signal pathway (ko04024), and regulation of actin cytoskeleton and axon guidance (ko04810), as shown in Table 6.
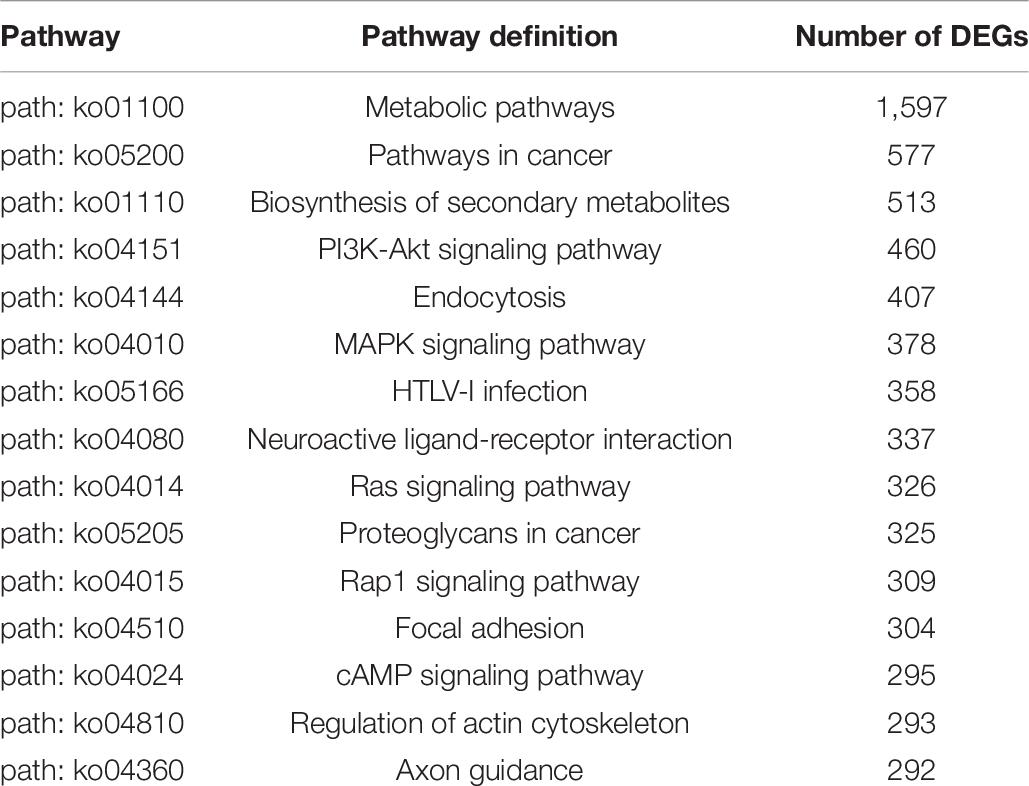
Table 6. KEGG pathway annotation of DEGs (top 15).
In accordance with the KEGG pathway enrichment analysis, the KEGG pathways involved in KEGG were divided into six categories: metabolism, cellular process, environmental information processing, genetic information processing, organismal systems, and human disease. Under hyper-salinity, the DEGs were mainly involved in circadian rhythm (ko04710), cGMP-PKG signaling pathway (ko04022), insulin resistance (ko04931), cAMP signaling pathway (ko04024), calcium signaling pathway (ko04020), and metabolic pathways (ko01100). When A. japonicus encountered hypo-salinity, the DEGs were mainly involved in the biosynthesis of amino acids (ko01230), proximal tubule bicarbonate reclamation (ko04964), IL-17 signaling pathway (ko04657), focal adhesion (ko04510), protein digestion and absorption (ko04974), rheumatoid arthritis (ko05323), ECM-receptor interaction (ko04512), and proteoglycans in cancer (ko05205), as shown in Figure 7.
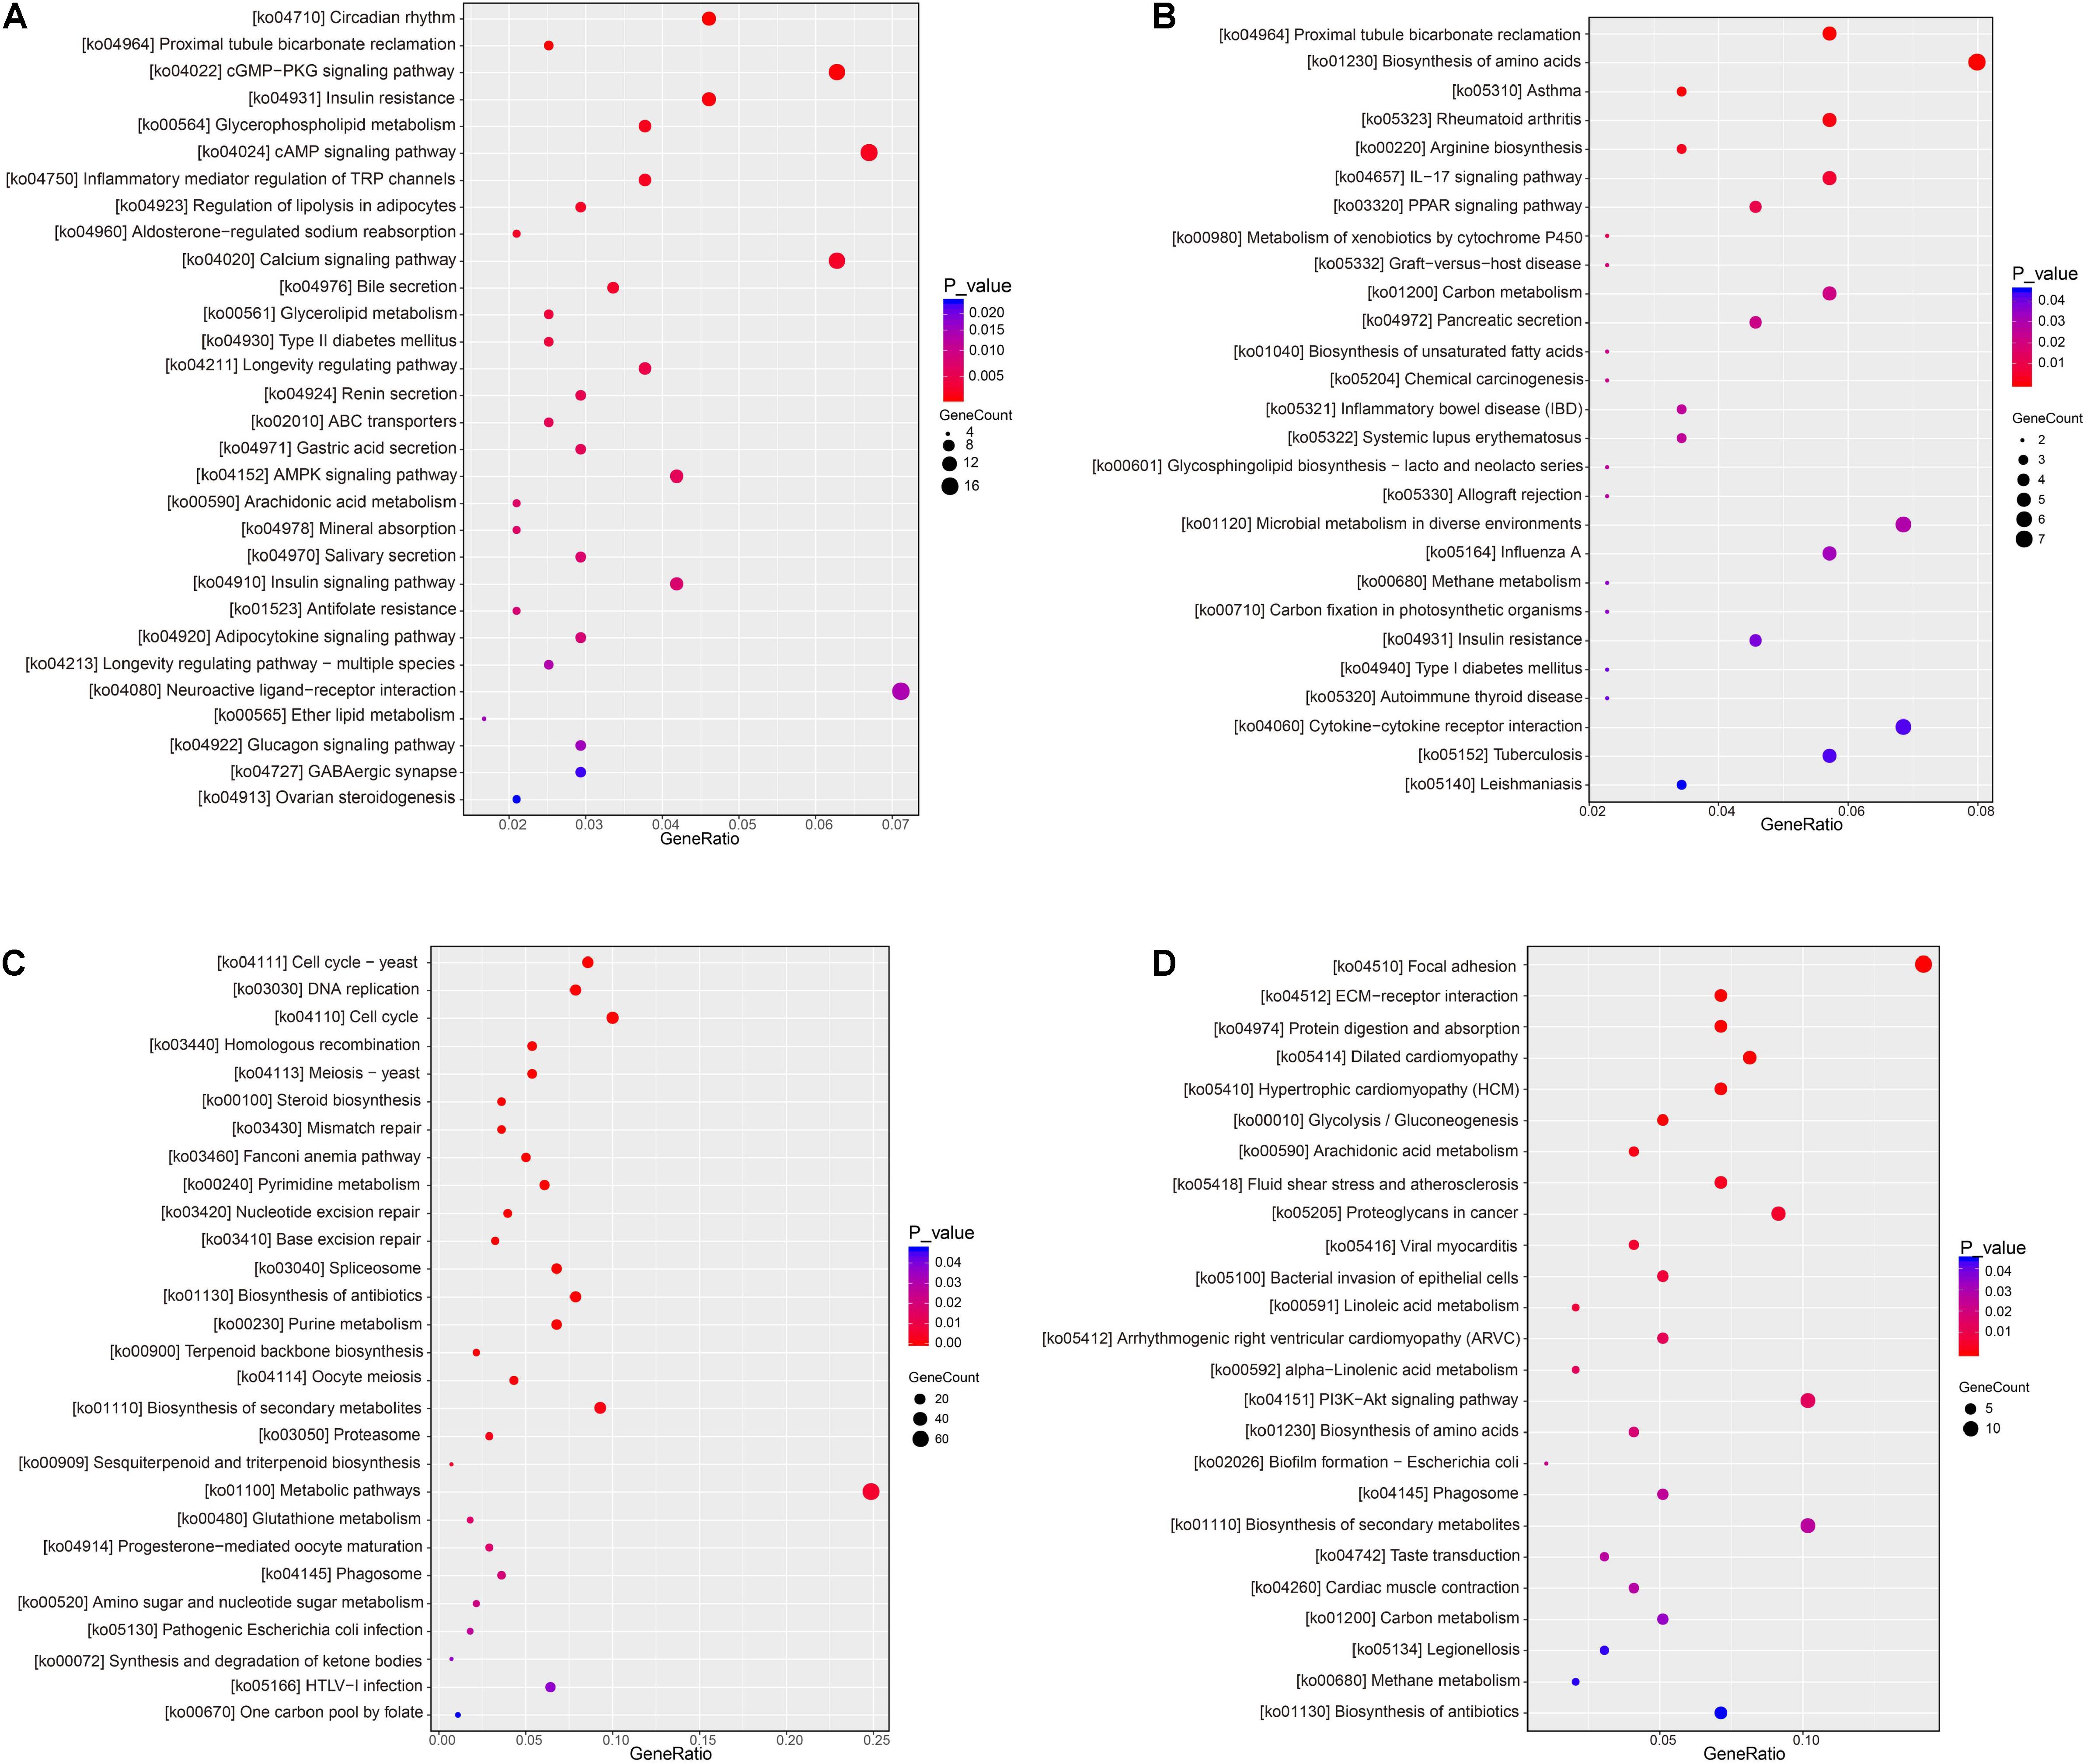
Figure 7. Dot plot of KEGG pathway enrichment of DEGs. (A) RSHG versus RCG dot plot of up-regulated DEGs; (B) RSLG versus RCG dot plot of up-regulated DEGs; (C) RSHG versus RCG dot plot of down-regulated DEGs; and (D) RSLG versus RCG dot plot of down-regulated DEGs.
Validation of Transcriptomic Data by Quantitative Real-Time PCR
Five target unigenes were selected to evaluate the transcriptome data of each experimental pair on the basis of qRT-PCR analysis. For these candidate unigenes, the variation trend in expression was identical between the qRT-PCR and transcriptome data, although the values derived from both analytical methods did not perfectly match (Figure 8). Consequently, the results indicated that the gene expression analysis based on high-throughput sequencing data was credible. The difference between the transcriptome and qRT-PCR results may be associated with the sequencing and mapping processes of transcriptome reads.
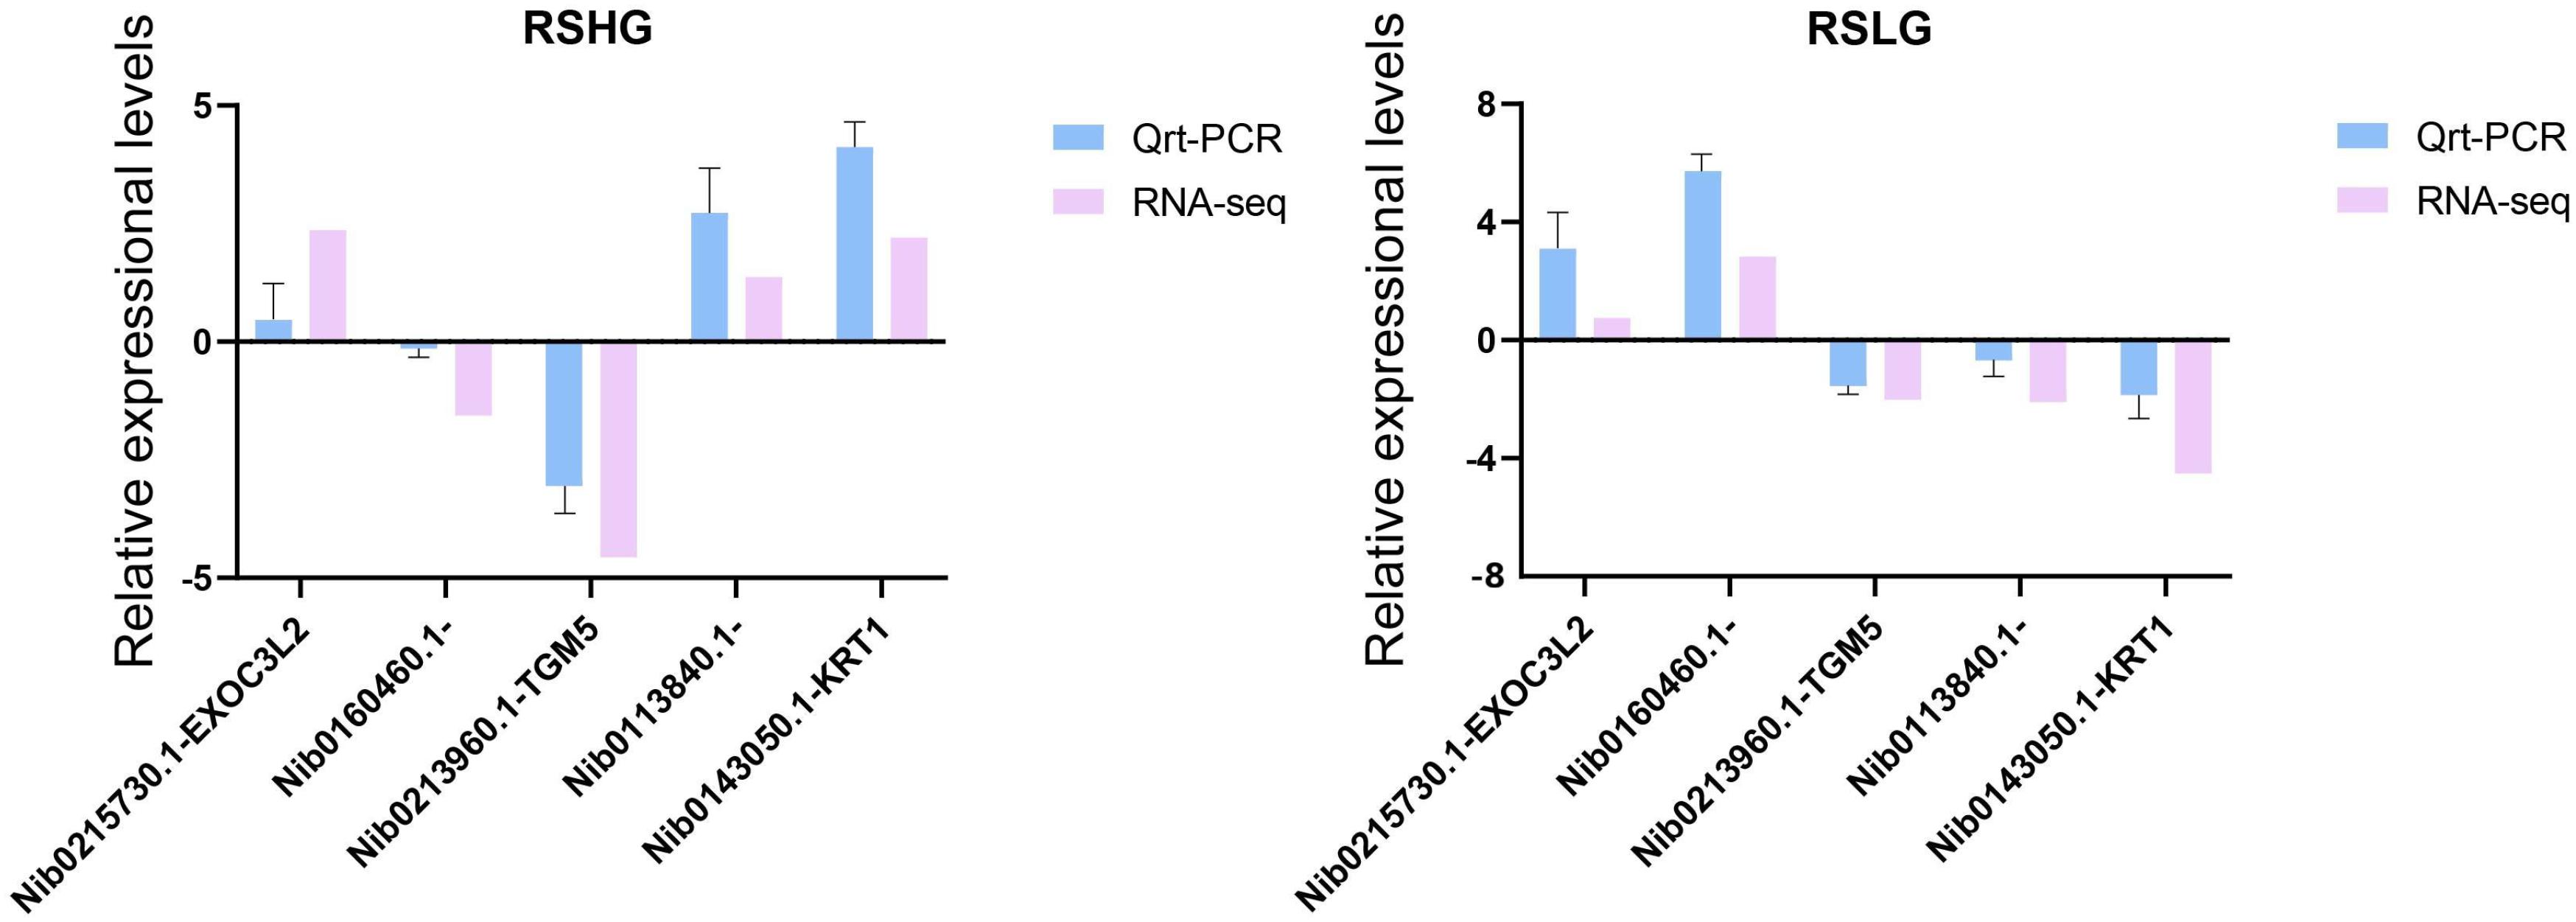
Figure 8. Validation of differentially expressed genes in RNA-seq by real-time PCR.
Discussion
In recent years, RNA-seq has been increasingly used in the study of transcriptome of many model and non-model plant and animal species, and remarkable results have been achieved (Hu Y. C. et al., 2015). With the continuous development of high-throughput RNA-seq, this technology has been widely used in the study of various aquatic animals. In the study of fish transcriptome, the main work is to screen DEGs and discover candidate genes. Transcriptomic analysis could probe gene expression and function at a genome-wide scale, which is likely to be useful for elucidating and analyzing the mechanisms underlying salinity stress adaptation in A. japonicus. In this study, the genes involved in osmoregulation environmental changes usually induce physiological responses in organisms, and the main response of organisms to external stress is gene expression (Evans and Hofmann, 2012; Wolf, 2013; Chen et al., 2015). RNA-seq is a suitable method to identify the underlying molecular mechanisms associated with the regulation of osmotic pressure and immunity, and RNA-seq analysis related to osmotic pressure has been achieved in some aquatic vertebrates and invertebrates, such as Oreochromis mossambicus (Lam et al., 2014), Acipenser baerii (Guo et al., 2018), Oryzias latipes (Marty et al., 2014), Litopenaeus vannamei (Hu D. G. et al., 2015), E. sinensis (Li et al., 2014), Ostrea gigas tnunb (Zhao et al., 2012), and Mytilus edulis (Lockwood and Somero, 2011). In the present study, the RNA-seq of A. japonicus showed that the differential gene expression levels in the transcriptome of A. japonicus under hyper-salinity were higher than those under hypo-salinity, indicating that more genes were involved in regulating the adaptation mechanism of A. japonicus exposed to hyper-salinity. The varied expression of genes indicated that many transcripts are differentially regulated in response to salinity acclimation. In principle, salinity changes may influence immunity, osmotic pressure, metabolism, and other physiological processes by changing the cellular physiological pathways. In fact, these cellular physiological pathways are regulated by some functional genes. Therefore, a close attention was paid to the functional genes associated with the osmotic pressure, immunity, and metabolism of A. japonicus exposed to salinity changes (Table 7 and Figure 9).
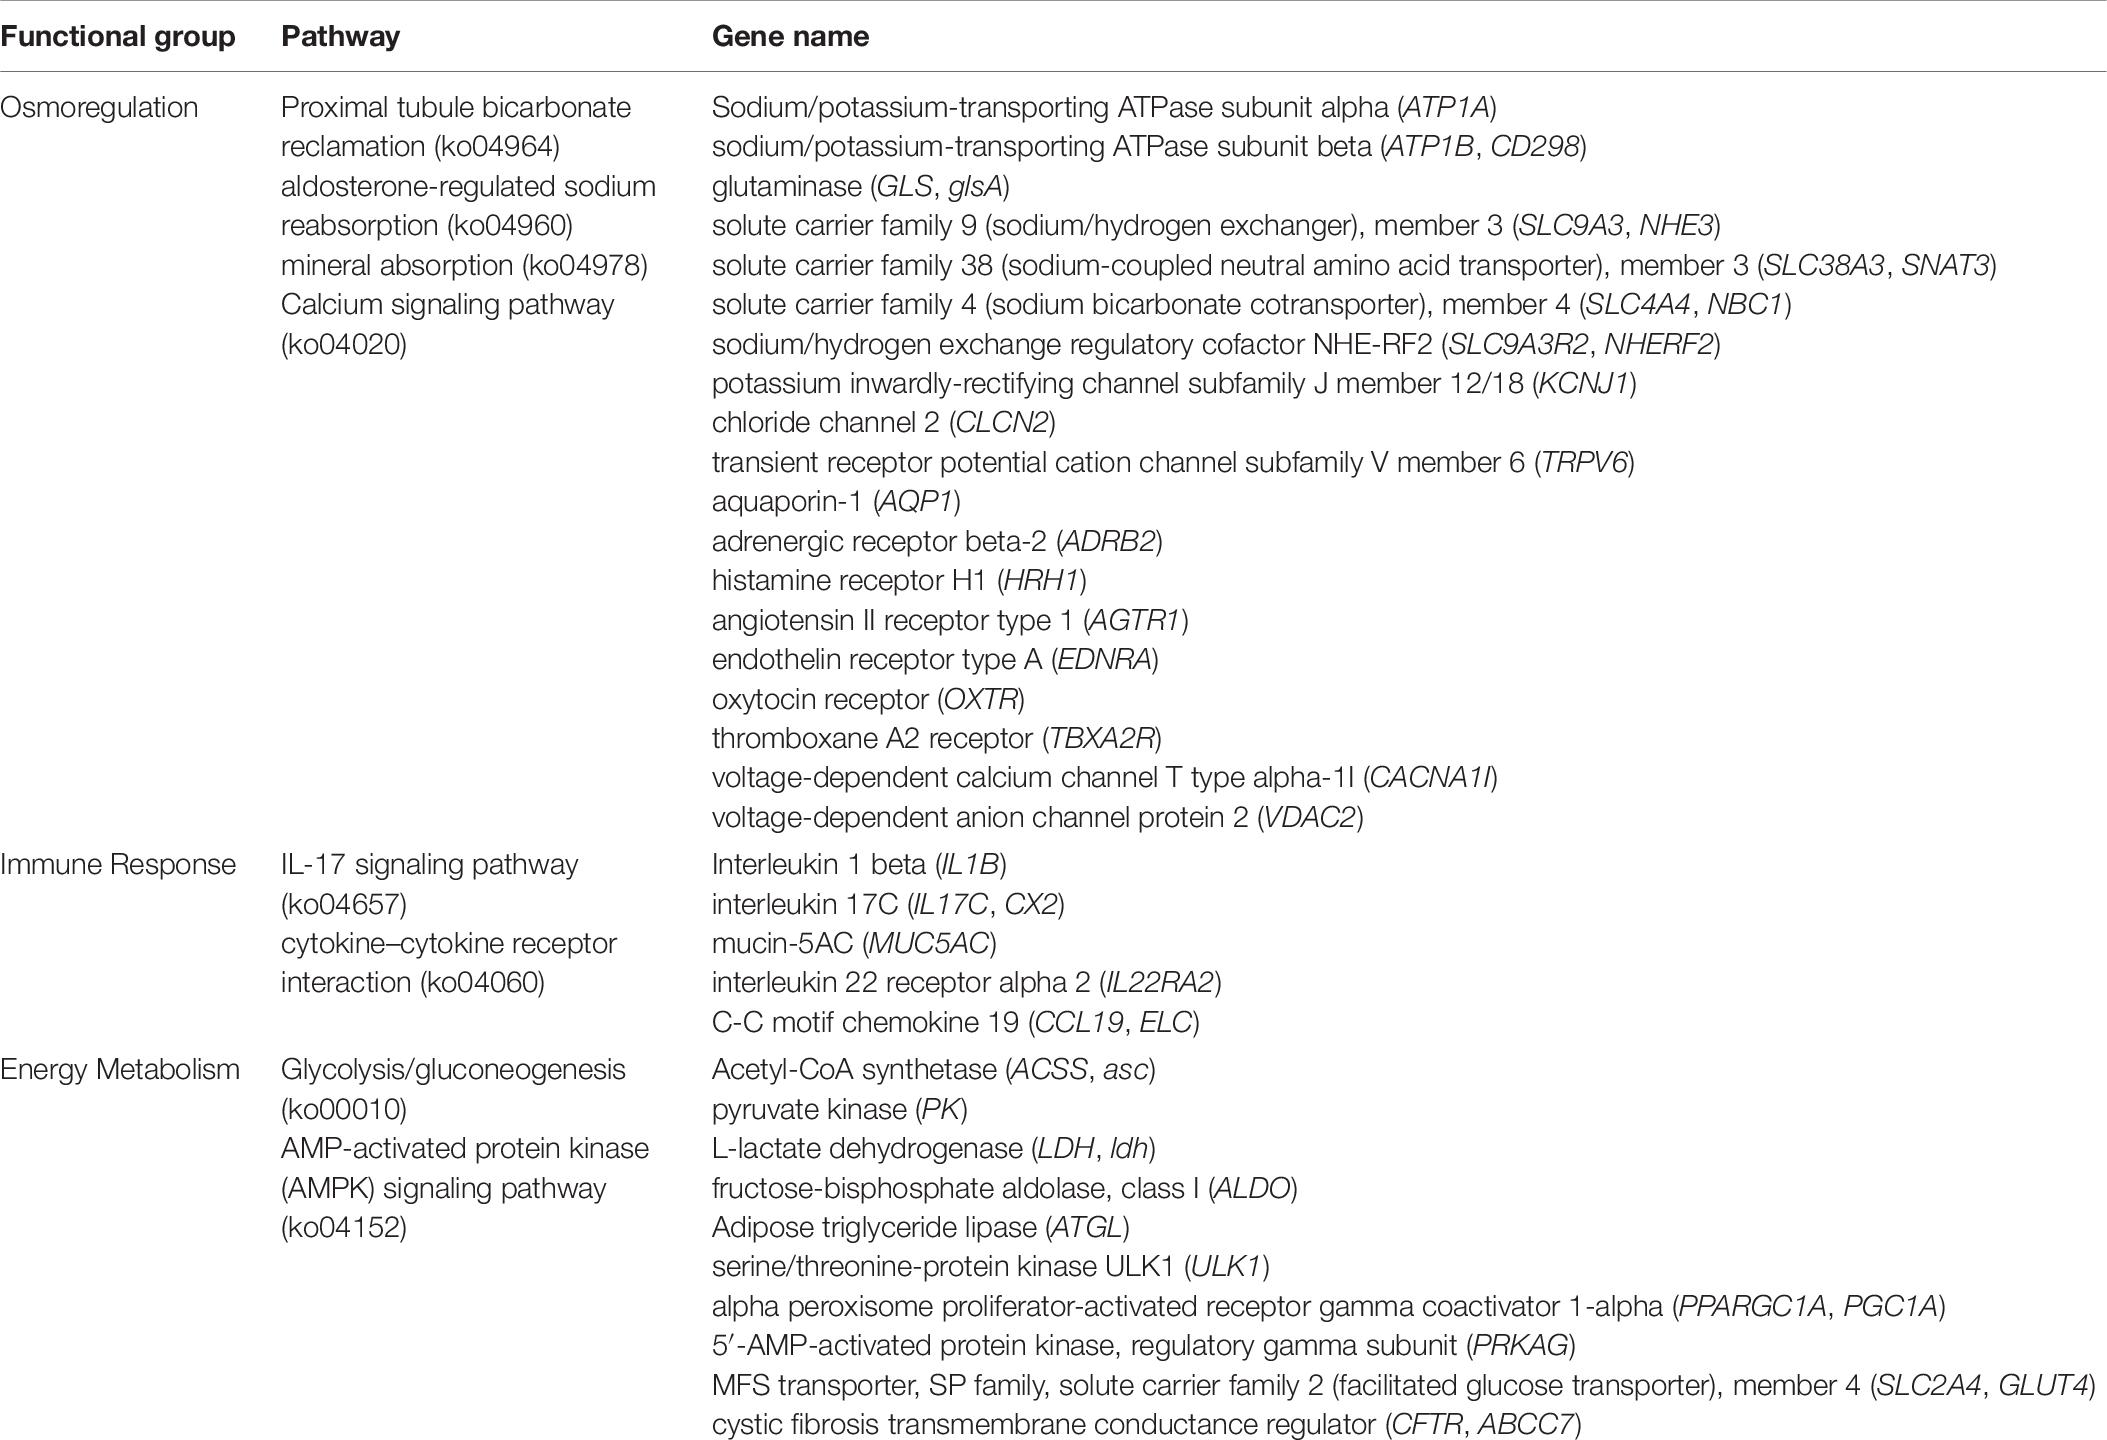
Table 7. Enriched DEGs may be related to osmotic adjustment, immunity, and energy metabolism.
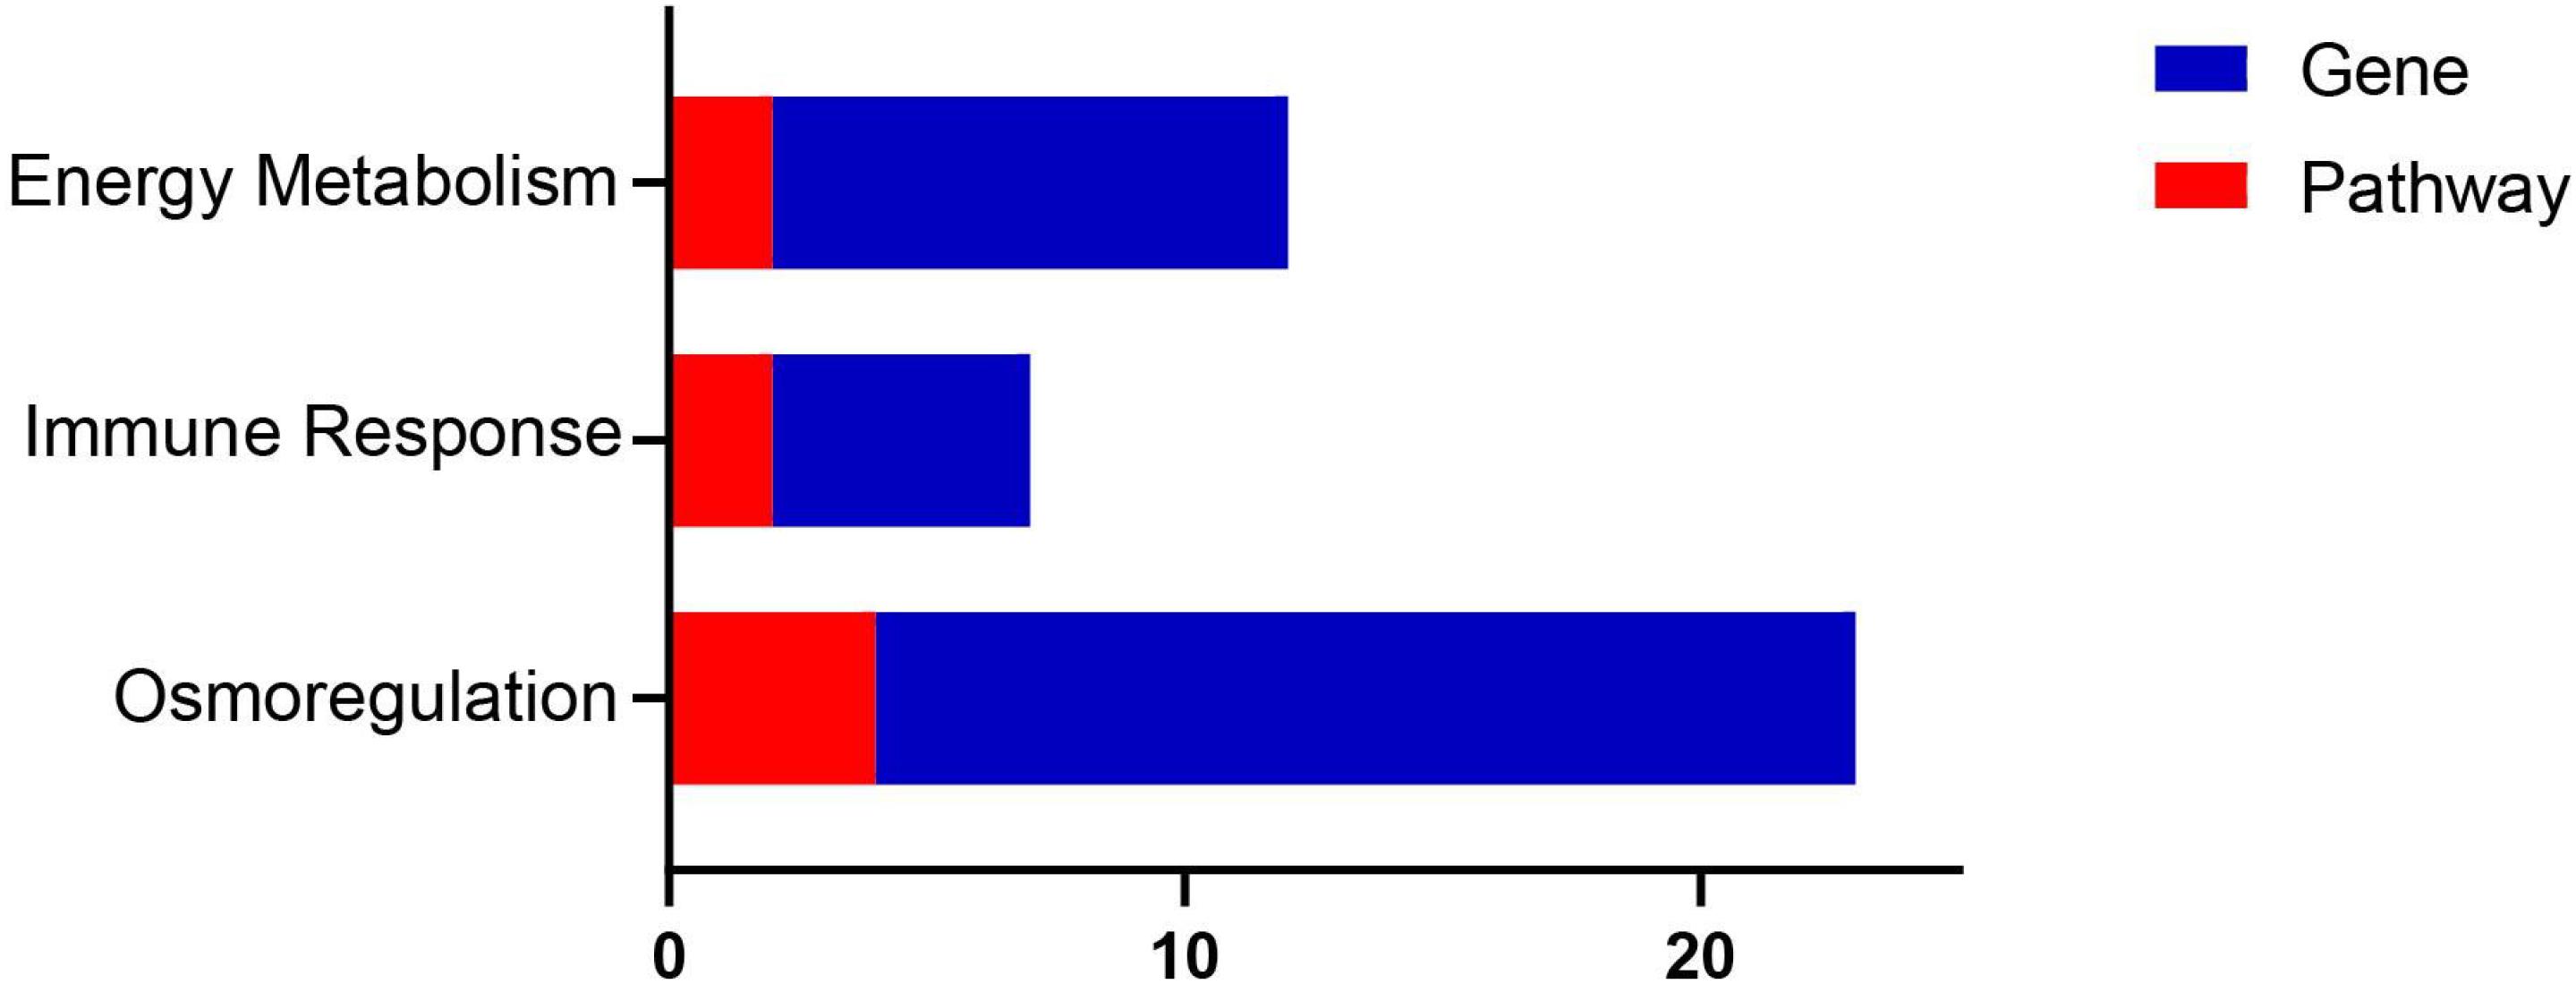
Figure 9. Enriched DEGs may be related to osmotic adjustment, immunity, and energy metabolism.
Genes Involved in Osmoregulation
Salinity changes could directly affect the gene expression of osmotic pressure regulation. In this study, the pathways related to osmoregulation were mainly enriched when adapted to hyper-salinity. These pathways included proximal tubule bicarbonate reclamation (ko04964), aldosterone-regulated sodium reabsorption (ko04960), and mineral absorption (ko04978). ATP1A, ATP1B, GLS, NHE3, SNAT3, SLC4A4, SLC9A3R2, KCNJ1, CLCN2, and TRPV6 were significantly up-regulated, showing that they play a regulatory function in osmoregulation. When adapted to hypo-salinity, the proximal tubule bicarbonate reclamation (ko04964) related to osmoregulation was mainly enriched. SNAT3, NHE3, and AQP1 were significantly up-regulated, indicating that they participate in osmotic pressure regulation when salinity is reduced.
Sodium/potassium-transporting ATPase regulates K+ transmembrane input and Na+ transmembrane output to maintain osmotic pressure balance (Bloor et al., 2003). Na+/H+ exchanger, a transmembrane protein that exists in all vertebrate cells, is involved in the regulation of intracellular pH value, the control of cell volume, and ion transport (Pavel and Larry, 1998). Alexander et al. (2013) confirmed that NHE3 is involved in the reabsorption of Na+, bicarbonate, and water in the proximal tubules. Chloride channel participates in various physiological processes, including cell volume and membrane potential stabilization, ransepithelial transport, and signal transduction (Liu et al., 2015). Solute carriers, a family of membrane transport proteins, play important roles in physiological activities, such as material transportation, energy transfer, and signal transduction between cells (Wang et al., 2017). Aquaporins constitute a small hydrophobic family that allows osmotic driving water and small solutes to pass through biofilms, and they are found in all living organisms (Calvanese et al., 2013). By adjusting the plasma concentrations of Na+, K+, and Cl– inside and outside the cell and the reabsorption of Na+, bicarbonate and water, A. japonicus adjusts its own osmotic pressure to maintain its balance with the fluctuation of salinity.
Analysis showed that the calcium signaling pathway was also enriched, and certain genes related to the calcium signaling pathway were identified. In particular, ADRB2, HRH1, AGTR1, EDNRA, OXTR, TBXA2R, CACNA1I, and VDAC2 were up-regulated under hyper-salinity. The calcium signaling pathway is the most researched signaling pathway at present. Fiol et al. (2006) proposed that the calcium signal transduction in fish gills is an important signal transduction mechanism for fish gills to respond to osmotic stress. Marshall et al. (2000) confirmed the importance of the calcium signaling pathway in fish corresponding to salinity changes. However, the specific signal transduction mechanism in the regulation of osmotic pressure needs to be further studied.
In the present study, the genes related to ornithine transcarbamylase, argininosuccinate synthetase, and carbamoyl phosphate synthetase-I were up-regulated at hypo-salinity, and they regulated osmotic pressure by participating in urea production.
Genes Involved in Immune Response
Salinity changes disrupt the immune system, causing weakness in the organism defense of bacteria and diseases. Immune responses are important in adaptation to salinity changes. The present research showed that DEGs were enriched in some immune pathways under hypo-salinity, including IL-17 signaling pathway (ko04657) and cytokine–cytokine receptor interaction (ko04060). The related IL1B, IL17C, MUC5AC, IL22RA2, and CCL19 were up-regulated.
Fish are ectotherms, and their innate immune response mechanism plays a major role in immune response (Bai et al., 2017). Some immune-related cytokines were associated with salinity reduction. Cytokines are only secreted in large quantities when the body enters the stage of immune response (Secombes et al., 1996). The cytokines identified in fish are interleukins (ILs), chemokines, interferon, and transforming growth factor-β (Bai et al., 2017). IL plays an irreplaceable role in fish innate immunity and adaptive immunity, and the pro-inflammatory activities of IL-1 cytokines are crucial during the activation of the innate immune system (Iwasaki and Medzhitov, 2015; Bai et al., 2017). Chemokines could activate chemotactic leukocytes in inflammation (Baoprasertkul et al., 2005). C-C chemokines are an important part of the innate immune system, and they recruit white blood cells and enhance innate immune response (Hu and Zhang, 2015).
Given their high expression, some cytokines and chemokines at hypo-salinity activate the innate immune system of A. japonicus to suppress inflammation and disease. All immune-related genes could work together to trigger complex defense mechanisms.
Genes Involved in Energy Metabolism
The mechanisms involved in environmental stress are energy consuming, and they ultimately influence the future life characteristics of the response of organisms (Verslycke and Janssen, 2002). When salinity changes, osmotic pressure regulation is an energy-consuming process. Therefore, an essential prerequisite for successful salinity adaptation is the activation of energy metabolism. In the present study, some pathways related to energy metabolism were significantly enriched under hyper-salinity.
In multicellular organisms, ATP, the major energy source in the body, is predominantly supplied by a series of metabolic pathways, including glycolysis, the citric acid cycle, and the electron transport chain (Nelson and Cox, 2008). Glycolysis occurs with variations in nearly all organisms, aerobic and anaerobic. The wide occurrence of glycolysis indicates that it is an important energy metabolic pathway (Romano and Conway, 1996). In the present study, glycolysis/gluconeogenesis (ko00010) related to energy metabolism was enriched. The present study showed that the ACSS, PK, LDH, and ALDO related to glycolysis were up-regulated. Lactate dehydrogenase (LDH) is an important enzyme for glycolysis in anaerobic environment. Pyruvate kinase (PK) regulates ATP, ADP, and glycolysis intermediate products in cells, and it plays a key role in the control of glycolysis rate (Wang et al., 2005). Acetyl-coenzyme A synthetase provides the cell with two carbon metabolites used in many anabolic and energy generation processes (Starai and Escalante-Semerena, 2004). ACSS catalyzes the ligation of acetate with CoA to produce acetyl-CoA, which plays important roles in fatty acid and cholesterol synthesis and tricarboxylic acid cycle (Fujino et al., 2001). Thus, to maintain the osmotic and ionic homeostasis under hyper-salinity, the high expression levels of ACSS ensure that more acetyl-CoA from energy substance metabolism can enter the Krebs cycle and promote the reaction continuously. In addition, the high expression levels of LDH and PK promote glycolysis and provide more energy support.
In the present study, the genes with high expression may be related to lipid metabolism. For example, adipose triglyceride lipase is a major rate-limiting enzyme that regulates lipid storage and release in adipocytes (Miyoshi et al., 2008). Previous works discussed lipid metabolism in terms of fish osmoregulation because lipids are an important energy source in fish. Previous studies demonstrated the importance of lipids for meeting the requirement of metabolism in Centropomus parallelus after long-term seawater (30 psu) acclimation (Rocha et al., 2005, 2007). The DEGs were also enriched in the AMP-activated protein kinase (AMPK) signaling pathway (ko04152). AMPK is allosterically activated by AMP, and AMPK is necessary to regulate whole-body energy balance (Hardie and Sakamoto, 2006; Towler and Hardie, 2007). The present study showed that A. japonicus needs energy to regulate a series of physiological changes caused by hyper-salinity.
Conclusion
Genes related to stress, immunity, ion transport, and metabolism in the gill tissue of A. japonicus were sensitive to salinity changes. When the salinity of the external environment changes, the osmotic pressure could be regulated by adjusting the transport of substances and ions to maintain the balance of the internal environment. Salt resistance is not determined by a single gene; it requires many genes to work together. In this experiment, the transcriptome data of A. japonicus were obtained, and the sequence assembly, functional annotation, and various pathways of the expressed genes were analyzed. Genes related to salinity changes were obtained, which enhanced the transcriptome database of A. japonicus. The results could provide a scientific basis for the further study on the physiological mechanism of salinity changes and the in-depth study of key DEGs in A. japonicus. However, the specific molecular adaptation mechanism of A. japonicus under external salinity changes still needs to be further studied.
Data Availability Statement
The datasets presented in this study can be found in online repositories. The names of the repository/repositories and accession number(s) can be found below: NBI SRA BioProject, accession no: PRJNA778869.
Ethics Statement
The animal study was reviewed and approved by Animal Care and Use Committee of Zhejiang Ocean University.
Author Contributions
ZH and TG conceptualized the study and conducted the analyses. ZL and ZH analyzed the data and wrote and revised the manuscript. All authors contributed to the article and approved the submitted version.
Funding
This research was funded by Zhejiang Provincial Natural Science Foundation of China (LR21D060003).
Conflict of Interest
The authors declare that the research was conducted in the absence of any commercial or financial relationships that could be construed as a potential conflict of interest.
Publisher’s Note
All claims expressed in this article are solely those of the authors and do not necessarily represent those of their affiliated organizations, or those of the publisher, the editors and the reviewers. Any product that may be evaluated in this article, or claim that may be made by its manufacturer, is not guaranteed or endorsed by the publisher.
Footnotes
References
Alexander, R. T., Dimke, H., and Cordat, E. (2013). Proximal tubular NHEs: sodium protons and calcium? Renal Physiol. 305, F229–F236. doi: 10.1152/ajprenal.00065.2013
Bai, S. S., Jia, Z. Y., and Shi, L. Y. (2017). Research progress of immune response mechanisms in fish. Chin. J. Fish. 30, 59–67.
Baoprasertkul, P., He, C., Peatman, E., Zhang, S. Z., Li, P., and Liu, Z. J. (2005). Constitutive expression of three novel catfish CXC chemokines: homeostatic chemokines in teleost fish. Mole. Immunol. 42, 1355–1366. doi: 10.1016/j.molimm.2004.12.012
Bloor, B. K., Tidman, N., Leigh, I. M., Odell, E., Dogan, B., Wollina, U., et al. (2003). Expression of keratin K2e in cutaneous and oral lesions: association with keratinocyte activation proliferation and keratinization. Am. J. Pathol. 162, 963–975. doi: 10.1016/S0002-9440(10)63891-6
Boeuf, G., and Payan, P. (2001). How should salinity influence fish growth? Comparat. Biochem. Physiol. Toxicol. Pharm. CBP 130, 411–423. doi: 10.1016/S1532-0456(01)00268-X
Calvanese, L., Pellegrini-Calace, M., and Oliva, R. (2013). In silico study of human aquaporin AQP11 and AQP12 channels. Protein Sci. 22, 455–466. doi: 10.1002/pro.2227
Cao, D. Y., Li, J. F., Huang, B. S., Zhang, J. D., Pan, C. H., Huang, J. S., et al. (2020). RNA-seq analysis reveals divergent adaptive response to hyper- and hypo-salinity in cobia, Rachycentron canadum. Fish Physiol. Biochem. 2020, 1–15. doi: 10.1007/s10695-020-00823-7
Chen, D. G., and Zhang, M. Z. (2015). Maeine Fishes of China. China: China Ocean University Press, 1247.
Chen, K., Li, E., Li, T. Y., Xu, C., Wang, X. D., Lin, H. Z., et al. (2015). Transcriptome and molecular pathway analysis of the hepatopancreas in the Pacific White Shrimp Litopenaeus vannamei under chronic low-salinity stress. PLoS One 10:e0131503. doi: 10.1371/journal.pone.0131503
Chen, X. H., Zeng, D. G., Chen, X. L., Xie, D. X., Zhao, Y. Z., Yang, C. L., et al. (2014). Transcriptome Analysis of Litopenaeus vannamei in Response to White Spot Syndrome Virus Infection. PLoS One 8:e73218. doi: 10.1371/journal.pone.0073218
Evans, T. G., and Hofmann, G. E. (2012). Defining the limits of physiological plasticity: how gene expression can assess and predict the consequences of ocean change. Philosoph. Trans. R. Soc. Lon. Series B: Biolog. Sci. 367, 1733–1745. doi: 10.1098/rstb.2012.0019
Fiol, D. F., Chan, S. Y., and Kültz, D. (2006). Identification and pathway analysis of immediate hyperosmotic stress responsive molecular mechanisms in tilapia (Oreochromis mossambicus) gill. Comparat. Biochem. Physiol. Part D Genom. Prot. 1, 344–356. doi: 10.1016/j.cbd.2006.08.002
Fitzgibbon, Q. P., Strawbridge, A., and Seymour, R. S. (2007). Metabolic scope, swimming performance and the effects of hypoxia in the mulloway, Argyrosomus japonicus (Pisces: Sciaenidae). Aquaculture 270, 358–368. doi: 10.1016/j.aquaculture.2007.04.038
Fujino, T., Kondo, J., Ishikawa, M., Morikawa, K., and Yamamoto, T. T. (2001). Acetyl-CoA synthetase 2, a mitochondrial matrix enzyme involved in the oxidation of acetate. J. Biol. Inorg. Chem. 276, 11420–11426. doi: 10.1074/jbc.M008782200
Guo, B. Y., Tang, Z. R., Wu, C. G., Xu, K. D., and Qi, P. Z. (2018). Transcriptomic analysis reveals an efficient osmoregulatory system in siberian sturgeon Acipenser baeri in response to salinity stress. Scient. Rep. 8:14353. doi: 10.1038/s41598-018-32771-x
Han, F., Zhang, Y., Qin, G., Wang, X. Y., Song, N., and Gao, T. X. (2021). Genome-wide characterization of Toll-like receptors in Japanese meagre Argyrosomus japonicus and their response to poly (I:C) injection. Aquaculture 542:736907. doi: 10.1016/j.aquaculture.2021.736907
Hardie, D. G., and Sakamoto, K. (2006). AMPK: a key sensor of fuel and energy status in skeletal muscle. Physiology 21, 48–60. doi: 10.1152/physiol.00044.2005
Higashimoto, Y., Nakao, N., Ohkubo, T., Tanaka, M., and Nakashima, K. (2001). Structure and tissue distribution of prolactin receptor mRNA in Japanese flounder (Paralichtys olivaceus): conserved and preferential expression in osmoregulatory organs. Gen. Comp. Endocrinol. 123, 170–179. doi: 10.1006/gcen.2001.7660
Hu, D. G., Pan, L. Q., Zhao, Q., and Qin, R. (2015). Transcriptomic response to low salinity stress in gills of the Pacific white shrimp, Litopenaeus vannamei. Mar. Genom. 24, 297–304. doi: 10.1016/j.margen.2015.07.003
Hu, Y. C., Kang, C. K., Tang, C. H., Tsung-Han, L., and Chen, T. Y. (2015). Transcriptomic analysis of metabolic pathways in milkfish that respond to salinity and temperature changes. PLoS One 10:e0134959. doi: 10.1371/journal.pone.0134959
Hu, Y. H., and Zhang, J. (2015). CsCCL17 a CC chemokine of Cynoglossus semilaevis induces leukocyte trafficking and promotes immune defense against viral infection. Fish Shell. Immunol. 45, 771–779. doi: 10.1016/j.fsi.2015.05.043
Iwasaki, A., and Medzhitov, R. (2015). Control of adaptive immunity by the innate immune system. Nat. Immunol. 16, 343–353. doi: 10.1038/ni.3123
Kim, D., Langmead, B., and Salzberg, S. L. (2015). HISAT: A fast spliced aligner with low memory requirements. Nat. Methods 12, 357–360. doi: 10.1038/nmeth.3317
Kultz, D. (2015). Physiological mechanisms used by fish to cope with salinity stress. J. Exp. Biol. 218, 1907–1914. doi: 10.1242/jeb.118695
Lam, S. H., Lui, E. Y., Li, Z. J., Cai, S. J., Sung, W., Mathavan, S., et al. (2014). Differential transcriptomic analyses revealed genes and signaling pathways involved in iono-osmoregulation and cellular remodeling in the gills of euryhaline Mozambique tilapia, Oreochromis mossambicus. BMC Genom. 15:921–943. doi: 10.1186/1471-2164-15-921
Li, C., Zhang, Y., Wang, R., Lu, J., Nandi, S., Mohanty, S., et al. (2012). RNA-seq analysis of mucosal immune responses reveals signatures of intestinal barrier disruption and pathogen entry following Edwardsiella ictaluri infection in channel catfish, Ictalurus punctatus. Fish Shellfish Immunol. 32, 816–827. doi: 10.1016/j.fsi.2012.02.004
Li, E. C., Wang, S. L., Li, C., Wang, X. D., Chen, K., and Chen, L. Q. (2014). Transcriptome sequencing revealed the genes and pathways involved in salinity stress of Chinese mitten crab, Eriocheir sinensis. Physiolog. Genom. 46, 177–190. doi: 10.1152/physiolgenomics.00191.2013
Liu, Y. N., Zhang, H. R., Zhao, C., Huang, D. Y., Du, Y. W., and Zhang, H. L. (2015). The progress on studies of chloride channels. Acta Neuropharm. 5, 33–42.
Livak, K. J., and Schmittgen, T. D. (2002). Analysis of relative gene expression data using real-time quantitative PCR and the 2ΔΔCT Method. Methods 25, 402–408. doi: 10.1006/meth.2001.1262
Lockwood, B. L., and Somero, G. N. (2011). Transcriptomic responses to salinity stress in invasive and native blue mussels (genus Mytilus). Mole. Ecol. 20, 517–529. doi: 10.1111/j.1365-294X.2010.04973.x
Lou, F. R., Gao, T. X., and Han, Z. Q. (2019). Effect of salinity fluctuation on the transcriptome of the Japanese mantis shrimp Oratosquilla oratoria. Intern. J. Biol. Macromole. 140, 1202–1213. doi: 10.1016/j.ijbiomac.2019.08.223
Love, M. I., Huber, W., and Anders, S. (2014). Moderated estimation of fold change and dispersion for RNA-seq data with DESeq2. Gen. Biol. 15:550. doi: 10.1186/s13059-014-0550-8
Marshall, W. S., Bryson, S. E., and Luby, T. (2000). Control of epithelial Cl (-) secretion by basolateral osmolality in the euryhaline teleost Fundulus heteroclitus. J. Exp. Biol. 203, 1897–1905.
Marty, K. S. W., Ozak, I. H., Suzuki, Y., Wataru, L., and Takei, Y. (2014). Discovery of osmotic sensitive transcription factors in fish intestine via a transcriptomic Approach. BMC Genom. 15:1134. doi: 10.1186/1471-2164-15-1134
Meng, W., Xu, K. D., Li, Z. H., Shi, H. L., and Zhou, Y. D. (2020). Transcriptome analysis of Nibea japonica under acute salinity stress. J. Fish. China 2020, 1–11.
Miyoshi, H., Obin, M. S., and Greenberg, A. S. (2008). Adipose triglyceride lipase regulates basal lipolysis and lipid droplet size in adipocytes. J. Cell. Biochem. 105, 1430–1436. doi: 10.1002/jcb.21964
Mohamed, S., Vallejo, R. L., Leeds, T. D., Yniv, P., Liu, S., Annas, S., et al. (2012). RNA-Seq Identifies SNP Markers for Growth Traits in Rainbow Trout. PLoS One 7:e36264. doi: 10.1371/journal.pone.0036264
Mortazavi, A., Williams, B. A., McCue, K., Schaeffer, L., and Wold, B. (2008). Mapping and quantifying mammalian transcriptomes by RNA-Seq. Nat. Methods 5, 621–628. doi: 10.1038/nmeth.1226
Nelson, D. L., and Cox, M. M. (2008). Lehninger Principles of Biochemistry. 5thed. New York, NY: W. H. Freeman and Company.
Pavel, D., and Larry, F. (1998). Comparative molecular analysis of Na+/H+ exchangers: aunified model for Na+/H+ antiport? FEBS Lett. 424, 1–5. doi: 10.1016/S0014-5793(98)00119-7
Pertea, M., Pertea, G. M., Antonescu, C. M., Chang, T. C., Mendell, J. T., and Salzberg, S. L. (2015). StringTie enables improved reconstruction of a transcriptome from RNA-seq reads. Nat. Biotech. 33, 290–295. doi: 10.1038/nbt.3122
Philippart, C. J. M., Anado’n, R., Danovaro, R., Dippner, J. W., and Drinkwater, K. F. (2011). Impacts of climate change on European marine ecosystems: observations, expectations and indicators. J. Exp. Mar. Biol. Ecol. 400, 52–69. doi: 10.1016/j.jembe.2011.02.023
Qian, X., Yi, B., Zhuang, Q. F., and Zhong, G. F. (2014). RNA-Seq technology and its application in fish transcriptomics. Omics A J. Integr. Biol. 18, 98–110. doi: 10.1089/omi.2013.0110
Rocha, A. J., Gomes, V., Ngan, P. V., Passos, M. J., and Furia, R. R. (2007). Effects of anionic surfactant and salinity on the bioenergetics of juveniles of Centropomus parallelus (Poey). Ecotoxicol. Env. Safety 68, 397–404. doi: 10.1016/j.ecoenv.2006.10.007
Rocha, A. J. D. S., Gomes, V., Van, N. P., Rocha, M. J. D. A. C., and Furia, R. R. (2005). Metabolic demand and growth of juveniles of Centropomus parallelus as function of salinity. J. Exp. Mar. Biol. Ecol. 316, 157–165. doi: 10.1016/j.jembe.2004.11.006
Romano, A. H., and Conway, T. (1996). Evolution of carbohydrate metabolic pathways. Res. Microbiol. 147, 448–455. doi: 10.1016/0923-2508(96)83998-2
Romano, N., and Zeng, C. (2006). The effects of salinity on the survival, growth and haemolym0ph osmolality of early juvenile blue swimmer crabs, Portunus pelagicus. Aquaculture 260, 151–162. doi: 10.1016/j.aquaculture.2006.06.019
Scott, M. G., and Madden, T. L. (2004). BLAST: at the core of a powerful and diverse set of sequence analysis tools. Nucleic Acids Res. 32, W20–W25. doi: 10.1093/nar/gkh435
Secombes, C. J., Hardie, L. J., and Daniels, G. (1996). Cytokines in fish: an update. Fish Shellfish Immunol. 6, 291–304. doi: 10.1006/fsim.1996.0030
Shen, Y., Wang, X. Q., Cao, M., Zheng, N. H., Chen, B. R., and Qin, C. X. (2020). Transcriptome analysis of Exopalaemon carinicauda under low salinity stress. South China Fish. Sci. 16, 19–32. doi: 10.12131/20190267
Smith, S., Bernatchez, L., and Beheregaray, L. B. (2013). RNA-seq analysis reveals extensive transcriptional plasticity to temperature stress in a freshwater fish species. BMC Genomics 14:375–375. doi: 10.1186/1471-2164-14-375
Starai, V. J., and Escalante-Semerena, J. C. (2004). Acetyl-coenzyme A synthetase (AMP forming). Cell. Mole. Life Sci. CMLS 61, 2020–2030. doi: 10.1007/s00018-004-3448-
Towler, M. C., and Hardie, D. G. (2007). AMP-activated protein kinase in metabolic control and insulin signaling. Circ. Res. 100, 328–341. doi: 10.1161/01.RES.0000256090.42690.05
Verslycke, T., and Janssen, C. R. (2002). Effects of a changing abiotic environment on the energy metabolism in the estuarine mysid shrimp Neomysis integer (Crustacea: Mysidacea). J. Exp. Mar. Biol. Ecol. 279, 61–72. doi: 10.1016/S0022-0981(02)00339-8
Wang, Y., Xu, B. H., Liu, H., Ji, C. G., and Yan, H. C. (2017). Research progress on the function and structure of solute carrier superfamily transporters. Prog. Mod. Biomed. 17, 4775–4783+4793.
Wang, Y. F., and Zhu, X. H. (2002). A review on impact of salinity on patterns of fish ecophysiology. Studia Mar. Sci. 2002, 151–158.
Wang, Y. S., Zou, S. X., and Zhang, Y. J. (2005). Modern animal biochemistry. 3thed. Beijing: Higher Education Press.
Wolf, J. B. (2013). Principles of transcriptome analysis and gene expression quantification: an RNA-seq tutorial. Mole. Ecol. Resour. 13, 559–572. doi: 10.1111/1755-0998.12109
Ye, L., Jiang, S. G., Zhu, X., Zhu, X. M., Yang, Q. B., Wen, W. G., et al. (2009). Effects of salinity on growth and energy budget of juvenile Penaeus monodon. Aquaculture 290, 140–144. doi: 10.1016/j.aquaculture.2009.01.028
Keywords: Argyrosomus japonicus, salinity changes, gill, RNA-seq, differentially expressed genes
Citation: Li Z, Gao T and Han Z (2021) RNA-seq and Analysis of Argyrosomus japonicus Under Different Salinities. Front. Mar. Sci. 8:790065. doi: 10.3389/fmars.2021.790065
Received: 06 October 2021; Accepted: 12 November 2021;
Published: 30 November 2021.
Edited by:
Carlo C. Lazado, Norwegian Institute of Food, Fisheries and Aquaculture Research (Nofima), NorwayReviewed by:
Liandong Yang, State Key Laboratory of Freshwater Ecology and Biotechnology, Institute of Hydrobiology, Chinese Academy of Sciences (CAS), ChinaQiong Shi, Beijing Genomics Institute (BGI), China
Copyright © 2021 Li, Gao and Han. This is an open-access article distributed under the terms of the Creative Commons Attribution License (CC BY). The use, distribution or reproduction in other forums is permitted, provided the original author(s) and the copyright owner(s) are credited and that the original publication in this journal is cited, in accordance with accepted academic practice. No use, distribution or reproduction is permitted which does not comply with these terms.
*Correspondence: Zhiqiang Han, ZDYzMzkxMjRAMTYzLmNvbQ==