
94% of researchers rate our articles as excellent or good
Learn more about the work of our research integrity team to safeguard the quality of each article we publish.
Find out more
ORIGINAL RESEARCH article
Front. Mar. Sci., 02 December 2021
Sec. Marine Evolutionary Biology, Biogeography and Species Diversity
Volume 8 - 2021 | https://doi.org/10.3389/fmars.2021.785763
 Peter von Dassow1,2*
 Paula Valentina Muñoz Farías1,3
 Sarah Pinon2
 Esther Velasco-Senovilla2,4,5
 Simon Anguita-Salinas6,7
The cosmopolitan phytoplankter Emiliania huxleyi contrasts with its closest relatives that are restricted to narrower latitudinal bands, making it interesting for exploring how alternative outcomes in phytoplankton range distributions arise. Mitochondrial and chloroplast haplogroups within E. huxleyi are shared with their closest relatives: Some E. huxleyi share organelle haplogroups with Gephyrocapsa parvula and G. ericsonii which inhabit lower latitudes, while other E. huxleyi share organelle haplogroups with G. muellerae, which inhabit high latitudes. We investigated whether the phylogeny of E. huxleyi organelles reflects environmental gradients, focusing on the Southeast Pacific where the different haplogroups and species co-occur. There was a high congruence between mitochondrial and chloroplast haplogroups within E. huxleyi. Haplogroup II of E. huxleyi is negatively associated with cooler less saline waters, compared to haplogroup I, both when analyzed globally and across temporal variability at the small special scale of a center of coastal upwelling at 30° S. A new mitochondrial haplogroup Ib detected in coastal Chile was associated with warmer waters. In an experiment focused on inter-species comparisons, laboratory-determined thermal reaction norms were consistent with latitudinal/thermal distributions of species, with G. oceanica exhibiting warm thermal optima and tolerance and G. muellerae exhibiting cooler thermal optima and tolerances. Emiliania huxleyi haplogroups I and II tended to exhibit a wider thermal niche compared to the other Gephyrocapsa, but no differences among haplogroups within E. huxleyi were found. A second experiment, controlling for local adaptation and time in culture, found a significant difference between E. huxleyi haplogroups. The difference between I and II was of the expected sign, but not the difference between I and Ib. The differences were small (≤1°C) compared to differences reported previously within E. huxleyi by local adaptation and even in-culture evolution. Haplogroup Ib showed a narrower thermal niche. The cosmopolitanism of E. huxleyi might result from both wide-spread generalist phenotypes and specialist phenotypes, as well as a capacity for local adaptation. Thermal reaction norm differences can well explain the species distributions but poorly explain distributions among mitochondrial haplogroups within E. huxleyi. Perhaps organelle haplogroup distributions reflect historical rather than selective processes.
Rising atmospheric CO2 is driving rapid changes in the ocean, including ocean acidification, increased stratification, and an increase in average surface temperature (Hoegh-Guldberg and Bruno, 2010; Gattuso et al., 2015; Pörtner et al., 2019). Temperature is a key factor in determining the productivity (Laws et al., 2000) as well as the biochemical and elemental composition of marine phytoplankton (Toseland et al., 2013), microorganisms responsible for roughly half of global photosynthesis (Field et al., 1998). Likewise, temperature is frequently identified as a key variable related to differences in community composition. At a global scale, phytoplankton exhibit thermal optima for growth that vary with habitat temperature (Thomas et al., 2012). It has been postulated that there should be trade-offs limiting the ability to adapt to a wide range of temperatures. First, adaptation to higher temperature decreases performance at lower temperature, and vice versa (Norberg, 2004). Second, a generalist-vs-specialist trade-off is expected, where an increasing width of the thermal reaction norm (niche width) may come at the cost of reduced maximal performance under optimal conditions (Izem and Kingsolver, 2005). Thus, temperature is expected to be an important determinant in the distributions of phytoplankton species and perhaps genotypes within species.
However, thermal widths for growth in phytoplankton are quite broad in comparison to their oceanographic distributions (Thomas et al., 2012; Boyd et al., 2013; Anderson and Rynearson, 2020). In fact, in those studies the upper thermal limits and even optima for growth in the lab can far exceed temperatures experienced in the environment from which organisms are isolated. Further, it has been difficult to measure thermal niche width in phytoplankton (Boyd et al., 2013), so a generalist-vs-specialist trade-off in phytoplankton has not been demonstrated. Finally, in the lab, selection can shift thermal optima of marine phytoplankton in only a few hundred asexual generations (Listmann et al., 2016; O’Donnell et al., 2018).
The eukaryotic phytoplankter Emiliania huxleyi is exceptional in the breadth of its distribution, being the dominant or co-dominant member of its functional group, coccolithophores, in most of the global surface ocean, from the tropics to the sub-polar (and now even polar) regions, and from highly productive coastal and estuarine environments to the oligotrophic central gyres (Paasche, 2001; Winter et al., 2014). The taxon appeared in the fossil record only 291000 years ago (Raffi et al., 2006), and became a globally dominant coccolithophore within the last 100000 years with fluctuations in its relative abundance associated with global climate shifts (Bendif et al., 2019). Despite high morphological (Young and Westbroek, 1991), physiological (Meyer and Riebesell, 2015; Feng et al., 2017; Echeveste et al., 2018), and even genome content variability (Read et al., 2013; von Dassow et al., 2015) among E. huxleyi strains, phylogenomic analysis suggested that the recent evolution of E. huxleyi is as a single species (Filatov, 2019). In addition, this species is comparatively easy to isolate and maintain in culture, and isolates seem to reflect natural populations in terms of morphotypes (von Dassow et al., 2018) and possibly in genetic markers as well (Beaufort et al., 2011).
At the LSU and SSU rRNA genes, markers classically used at species-level identification, E. huxleyi is identical or nearly identical to close relatives taxonomically classed in the genus Gephyrocapsa, distinguished morphologically from E. huxleyi principally by the presence of a bridge over the coccolith central area in most Gephyrocapsa (with the exception of those previously classified as Reticulofenestra) (Medlin et al., 1996; Young et al., 2003; Bendif et al., 2016). Based on organellar and nuclear 18S and 28S single gene phylogenies, and on phylogenomics analysis, Emiliania and Gephyrocapsa should more appropriately be considered as congenerics (Bendif et al., 2016, 2019), however we retain the traditional taxonomic genus name Emiliania here awaiting formal re-assignment. The mitochondrial cytochrome oxidase (cox) genes consistently separate E. huxleyi from G. oceanica (Hagino et al., 2011; Bendif et al., 2014). However, E. huxleyi contains two mitochondrial haplogroups based on cytochrome oxidase (cox) genes, of which Haplogroup I (also called alpha) is shared with the species G. ericsonii and G. parvula (which are not separated by organelle or nuclear phylogenetic markers or phylogenomics), while the Haplogroup II (also called beta) is shared with G. muellerae (Bendif et al., 2016).
Curiously, the broad, apparently generalist, distribution of E. huxleyi is contrasted with the much narrower latitudinal distributions of its closest relatives which appear to occupy narrower niches. G. oceanica appears to be roughly restricted to temperatures above about 15°C in the Atlantic and 19°C in the Pacific (McIntyre et al., 1970; Okada and McIntyre, 1977; Bollmann, 1997; Bollmann and Klaas, 2008; Beaufort et al., 2011), and corresponds to Haplogroup III (Hagino et al., 2011). Both G. ericsonii and G. parvula (formerly Reticulofenestra parvula) represent the smallest members of the genus and appear to be associated with sub-tropical and tropical waters, whereas, in contrast, G. muellerae is restricted to cooler waters below 21°C (McIntyre et al., 1970; Okada and McIntyre, 1977; Bollmann, 1997; Bollmann and Klaas, 2008; Bendif et al., 2016). Emiliania huxleyi which share Haplogroup I with G. ericsonii/parvula exhibit a lower latitude, warm-water distribution, while E. huxleyi which share Haplogroup II with G. muellerae exhibited a higher latitude, cool-water distribution (Hagino et al., 2011; Bendif et al., 2016). Latitudinal gradients in mitochondrial haplotypes are common in animals including humans (Mishmar et al., 2003; Camus et al., 2017) and the mitochondrial genome was reported to impact thermal tolerance by on the order of 5°C in yeast in crosses of closely related cold-tolerant and warm-tolerant species (Baker et al., 2019). Thus, the principal genetic separation within E. huxleyi, which might represent introgression among closely related species or incomplete lineage sorting from a common ancestor, corresponds to an ecological separation along latitudinal gradients implying a role for temperature. This makes the Emiliania/Gephyrocapsa group particularly interesting for exploring how temperature affects both species and genotype distributions.
Previous studies have suggested that E. huxleyi exhibits thermal adaptations to its local habitat. An influential study published almost four decades ago reported that the ratio of growth rates at 26° to 16° was lower for five strains from the Gulf of Maine compared to 68 strains from the Sargasso Sea (Brand, 1982). A study reported that two strains from high latitudes grew at 6°C but not 27°C, while one strain from low latitude grew at 27°C but not 6°C (Conte et al., 1998). More recently, comparison of six sub-tropical central Atlantic (Azores) isolates and five sub-polar isolates from Bergen revealed that Bergen isolates could grow faster at 8°C, while central Atlantic (Azores) isolates could grow at 28°C, a temperature which did not permit growth of Bergen isolates, and the thermal optima averaged 1°C higher in Azores isolates (Zhang et al., 2014). Meanwhile, in asexually reproducing populations originating from the same original clone, the optimum growth temperature was reported to change by 0.7°C and the maximum persistence temperature to change by nearly 2°C after growth in the lab at 26.3 vs. 15°C for 1200 generations, which was interpreted to reflect in-culture adaptive evolution (Listmann et al., 2016). That is, a few hundred generations of asexual growth could produce nearly the same thermal performance differences as seen over the thousands of km between Bergen and the Azores.
Here we focused on testing the latitudinal distributions and thermal habitats of mitochondrial haplogroups on the regional scale. We chose the Southeast Pacific. The G. ericsonii/parvula group, which shares the cox haplogroup I, occurs with E. huxleyi in the warmer northern waters of this zone, while G. muellerae, which shares the cox haplogroup II, is found in the south-central Chilean upwelling zone (Bendif et al., 2016; von Dassow et al., 2018), and E. huxleyi of both haplogroups co-exist to the west of central Chile (Beaufort et al., 2011). Previous studies have also documented incongruence of mitochondrial phylogenies and chloroplast phylogenies (e.g., based on tufA) (Bendif et al., 2014, 2016). If mitochondrial and chloroplast histories are very distinct, this would need to be taken into account in interpretations of environmental patterns and experimental design, as well as having implications for the recent evolutionary diversification of E. huxleyi. A total of 407 strains from this region were isolated and genotyped for cox haplogroup, of which 161 were also genotyped for tufA haplotype.
We also experimentally tested the following specific hypotheses, aiming to control for possible effects of local adaptation and in-culture evolution in one set of tests focused on within-species comparisons:
1. Inter-specific differences in thermal reaction norms among species in the Emiliania-Gephyrocapsa genus account for latitudinal range distributions.
2. Intra-specific differences in the thermal reaction norms between the two E. huxleyi mitochondrial haplogroups account for their latitudinal range distributions.
The broader latitudinal distribution of E. huxleyi reflects either.
3. A thermal niche that is wider than closely related species of narrower latitudinal distributions, or, alternatively,
4. Different genotypes that have similar niche widths that are shifted to warmer or cooler temperatures by phylogenetic history and/or thermal adaptation.
Isolation of strains from coastal Chile, the Juan Fernandez Archipelago, and oceanic waters west of Peru between 2011 and 2013 was previously described (Bendif et al., 2016; von Dassow et al., 2018). In November-December 2015, strains were isolated from 3 stations during the LowpHOx 1 cruise aboard the R/V Cabo de Hornos. To be able to compare to previous strains collected from near the Punta Lengua de Vaca upwelling at 30°S, water was collected from the onboard continuous seawater system as the ship passed this latitude, and temperature and salinity were recorded from the ships thermosalinometer. At two other stations, water was sampled from 5 m from the CTD rosette equipped with 10L Niskin bottles. In August 2016 a one-day field campaign was conducted on the R/V Stella Maris II from Coquimbo to south of Punta Lengua de Vaca, and water was collected from beside the boat using a torpedo system connected to a CTD pump as previously described. Following previously described protocols, water samples (100 ml) were concentrated to 1–2 ml by gentle centrifugation and coccolith-bearing cells were individually isolated based on depolarization of forward scatter light by an InFlux Mariner Cell Sorter flow cytometer (von Dassow et al., 2012, 2018; Bendif et al., 2016). In the LowpHOx 1 cruise, the flow cytometer was onboard and samples were processed immediately. In 2016, samples were carried in coolers to the lab in Santiago for processing the next day. Details of strain origins are provided in Supplementary File 1.
Once established, strains were identified by scanning electron microscopy (SEM) to species-level (E. huxleyi or Gephyrocapsa species) and morphotype (E. huxleyi) and classified (von Dassow et al., 2018). Strains were then maintained in L1 medium in an environmental chamber on a 12:12 light-dark cycle where temperature fluctuated from 14 (lights off) to 15°C (lights on). Cultures were maintained by transfer to fresh medium every 3–4 weeks.
Cultures were collected by filtration or centrifugation and DNA was extracted using either a DNeasy Plant Mini kit (Qiagen) or following a modified CTAB protocol: Cells pelleted by centrifugation were extracted in 700 μl of 100 mM Tris-HCl (pH 7.5), 25 mM EDTA, 1.5 M NaCl, 2% (w/v) CTAB, and 0.3% (v/v) β-mercaptoethanol, ground with acid-washed glass beads, and 3 μl of proteinase K (20 mg ml–1) was added. Subsequent steps followed a protocol for recalcitrant plants (Healey et al., 2014). PCR and partial sequencing of cox1, cox3, and tufA were performed as described previously (Bendif et al., 2016). Additionally, partial cox1 and cox3 sequences were downloaded from Genbank and those that could be aligned over sections of 1375 (cox1) or 810 bp (cox3) were kept for analysis. Sequences were aligned with ClustalW. Haplotype networks were constructed individually for all three markers, as well as on the concatenated cox1–cox3 alignment, by median joining (Bandelt et al., 1999) using PopART (Leigh and Bryant, 2015). Genetic groups were determined for all three alignments using Automatic Barcode Gap Discovery (ABGD) (Puillandre et al., 2012). Gene trees were constructed using Maximum Likelihood using RaxMLGUI 2.0 (Bootstrap = 1000, GTR+I+G) on CIPRES, and in parallel with Bayesian Inference on Mr. Bayes (HKY+I+G, 50M of generations, sample frequency every 1000, temperature 0.30, burning 25%).
For most strains for which cox1 and/or cox3 sequences are available in Genbank, location and month of isolation, but not associated environmental data, is available as meta-data either from the source literature or from public data provided by culture collections (see Supplementary Files 1, 2). Reconstructed ocean environmental parameters sea surface temperature (SST), sea surface salinity (SSS) and mixed layer depth (MLD) was assigned to all strains isolated after 1993 (from which cox1 and/or cox3 sequences were used here) using the Multi Observation Global Ocean ARMOR3D L4 analysis and multi-year reprocessing (Guinehut et al., 2012; Mulet et al., 2012) actualized from the Copernicus Marine Services website1 on 20 Feb 2020. Minimum distance to mainland coast of strain origins was estimated using Google Earth. In that analysis, the mainland coast was the nearest continent or coast of large islands (>100,000 km2, e.g., Iceland or Japan). For each strain origin location and date, the monthly mean SST, SSS, and MLD was extracted. Multinomial logistic regression was performed using the nnet package (Rippley and Venebles, 2021) in R (R Core Team, 2020). For strains isolated from the Southeast Pacific by the lead author or lab members for which direct measurements of SST and SSS are available (Supplementary File 2), an additional analysis was performed using these data.
These experiments were begun in July 2015. Growth experiments were conducted at 8, 12, 15, 18, 21, 24, 27, and 30°C in transparent tanks filled with water maintained at specified temperatures through a recirculating chiller (SunSun HYH-0.25D-D), coupled with an aquarium heater for higher temperatures. To allow physiological acclimation but minimize the possibility of in-culture evolution, strains were first acclimated to each temperature condition for a minimum of two transfers to fresh medium (corresponding to a minimum of 7 asexual generations). Additionally, to minimize thermal shocks, acclimation was progressive to temperatures above 18°C or below 15°C. That is, strains would be acclimated to a new temperature (further from their temperature of maintenance) only after acclimating to the previous temperature. For example, strains tested at 27°C were first acclimated at 24°C. This means, for example, that strains which grew poorly or not at all at 24°C were not tested at higher temperatures. Light was maintained at 150 μmol phot m–2 s–1 by cool-white fluorescent tubes. Acclimation and experimental cultures were in sealed 5 ml transparent polystyrene culture tubes (Falcon 352003, Corning). Fluorescence was read directly in the culture tubes with an AquaFluor fluorometer (Turner), a strategy commonly used in such studies to avoid opening and sampling repeatedly for counting (Brand et al., 1981; Brand, 1982; Anderson and Rynearson, 2020). Initial experiments showed that patterns of growth at different temperatures were similar in tubes and in larger 50 ml experimental cultures in flasks, and also that fluorescence tracked cell abundance counted with a Neubauer haemocytometer in acclimated cultures before cultures entered stationary phase (data not shown). After the first acclimation culture, acclimation and experimental cultures were inoculated from cultures that were in active, near exponential growth (fluorescence <20% of maximum yield, corresponding to cell abundances of <2 × 10⁵ ml–1 for the smallest species), and exponential growth rate was measured only from points where fluorescence was <10% of typical final growth yield. When cultures failed to acclimate to a new temperature, growth rate at that temperature was recorded as 0 as negative growth rates could not be confidently measured with this approach.
Because of the dearth of strains (in any culture collection) for some haplogroups and species, Experiment 1 had an unbalanced study design among E. huxleyi haplogroups and closely related species: There were six strains of E. huxleyi haplogroup I, four of E. huxleyi haplogroup II, five of G. parvula/ericsonii (considered con-specifics by single gene phylogenies as well as phylogenomics, so grouped here; see Bendif et al., 2016, 2019), three of G. muellerae, and six of G. oceanica (Table 1). All E. huxleyi strains were obtained from the original SEPA collection2, while the clonal duplicates of some G. parvula/ericsonii and G. muellerae strains were obtained from the Roscoff Culture Collection (RCC3). One of the three original G. muellerae strains to be isolated (Bendif et al., 2015) did not survive transport from the RCC back to Chile, so when we realized that we had isolated a new G. muellerae strain from the LowpHOx I cruise, this strain was included in Experiment 1, to have three strains of this species to permit statistical tests among species. Originally, six strains of haplogroup I and six of haplogroup II were selected arbitrarily, but adequate data to evaluate growth at 27°C were not obtained from two strains of haplogroup II despite max. growth at 24°C, meaning that thermal performance curves were fit for only four haplogroup II strains. The single strain of haplogroup Ib isolated before 2015 (SEPA118) was also analyzed, to allow qualitative comparison, but results from that single strain were excluded from statistical tests in Experiment 1. To our knowledge, the only G. muellerae and G. parvula/ericsonii strains currently available in culture collections all come from the Chilean coast, but G. oceanica isolates from this region were not available, so six G. oceanica strains from different global origins were obtained from the RCC. As all G. oceanica survived transport to Chile, all were included.
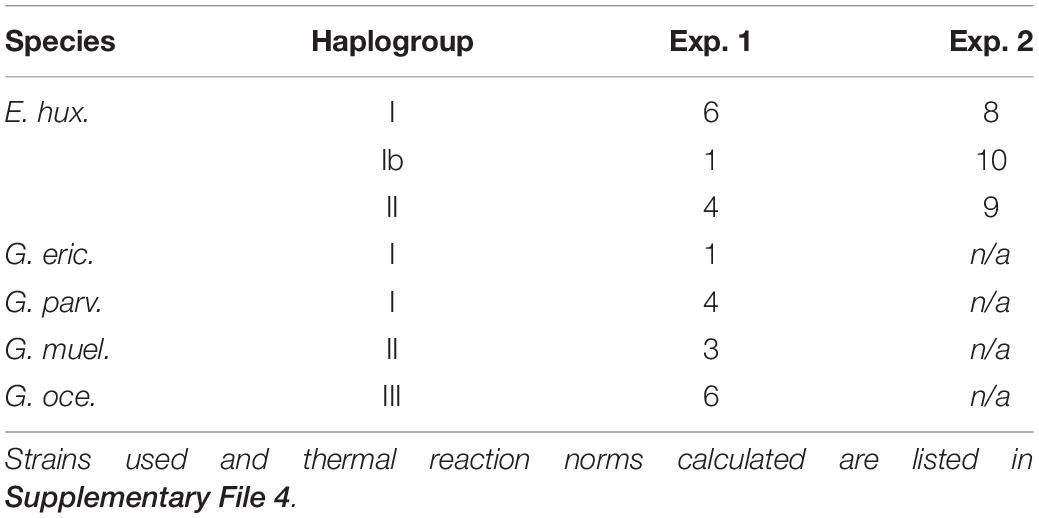
Table 1. Numbers of strains of each species or haplogroup used in each experiment.
We originally aimed to include seven strains of E. huxleyi isolated from the LowpHOx I cruise in each genetic group in order to have at least a similar power to discriminate differences among genetic groups as the ability by Zhang et al. (2014) to distinguish differences among geographic locations. However, since we also aimed to complete growth experiments within 18 months after initial isolation (to minimize in-culture evolution), it was necessary to begin experiments before genetic data was complete. Therefore we arbitrarily selected 15 strains in March 2016, once cultures had been established. When first molecular and SEM data became available, a further 12 strains of E. huxleyi were added in July 2016 to make a larger total of 27 strains. 25 of these strains come from the same water sample at 27° S. To ensure that we would have the chance to compare an adequate number of haplogroup II strains when genetic data was not complete, 2 strains were arbitrarily selected also from the site at 30° S where this haplogroup was dominant in previous samplings. As we initiated growth acclimations before having completed analysis of genetic data, the groups are not of the same size: 8 were in mitochondrial haplogroup I, 9 in haplogroup II, and 10 in the newly observed (see below) haplogroup Ib (Table 1).
Thermal reaction norms here are based on fitting Thermal Performance Curves (TPCs) for growth. Two parallel TPC analyses were performed. Recent comparative work analyzing or re-analyzing published TPC data in diverse phytoplankton (Thomas et al., 2012; Boyd et al., 2013; Anderson and Rynearson, 2020) have fit such data to the Norberg equation (Norberg, 2004), a general function for a temperature response for growth based on the Eppley curve, an envelope function proposed to describe an evolutionary limit to maximum growth rate vs. temperature (Eppley, 1972). Such an approach has also been used for investigating asexual evolution of thermal reaction norms in clonal populations of E. huxleyi subject to selection in the lab at different temperatures (Listmann et al., 2016). For comparison with this literature base, it is our primary analysis. The general Norberg equation gives growth rate μi as a function of temperature T for individual or species i as:
where the trait Zi is the temperature at which growth approaches the Eppley curve optimum, and Wi is the thermal niche width (in °C). Thus Zi is not the temperature of maximal growth but the temperature at which maximal growth is closest to the maximum exhibited by phytoplankton generally at that temperature, a represents a competitive optimum. Norberg’s derivation fixed the Eppley curve coefficient a at 0.59 and the exponent b at 0.0633 (Norberg, 2004). Both a and b have been considered by other authors to be free parameters to fit in published analysis of experimental TPC curves (Thomas et al., 2012; Boyd et al., 2013; Listmann et al., 2016). We returned to the original interpretations of Norberg and Eppley (Eppley, 1972; Norberg, 2004), that the envelope represents a constant shape defining the observed upper limits of phytoplankton performance with temperature across all species, and kept b fixed at 0.0633 while letting ai vary among strains. In this way, ai has a simple biological interpretation: ai/0.59 is the degree to which strain i reaches the envelope maximum at T = Zi. In fact, for many strains it was not possible to obtain adequate fits, or reasonable values of Zi, when b was free. Also, Thomas et al. (2012) used b = 0.0631 as a theoretical value, but we found slightly better fits keeping b = 0.0633 (not shown). Curve fitting for the Norberg equation was performed in Prism 9 (GraphPad Software). We note that previous studies have derived Topt,i, the temperature of maximum growth, from the Norberg equation and reported this. We were interested in comparing the both thermal niche width Wi and Topt,i. Topt,i was derived numerically in R from both both Z_i and W_i, so is not independent, and only Z_i and W_i were used for statistical testing.
A key previous study on E. huxleyi thermal reaction norms (Zhang et al., 2014) instead used the Template Mode of Variation (TMV) approach, so we also performed TMV analysis in order to compare differences among groups most directly to what was observed in that study. The TMV approach also has the advantage of accommodating more complex TPC shapes (Izem and Kingsolver, 2005). This involves finding a common curve shape f(x) to the individuals to be compared, and then for each individual i an individual curve is fitted:
Here, mi is the temperature of maximal growth (from here on referred to as Topt), hi is the height parameter (average growth rate), and wi is the non-dimensional width parameter. Here a polynomial of degree 4 was fit for f(x), following Zhang et al. (2014). The fit was performed in Matlab using the scripts provided by Izem and Kingsolver (2005). A large number of strains (most E. huxleyi, all G. oceanica, and most G. parvula) grew positively at 27°C and it was necessary to include this point to ensure a value of μi(T) at a temperature higher than the temperature of maximum growth, while no G. muellerae grew at 24°C and so could not be tested at 27°C using the progressive acclimation approach. The TMV scripts require at least one data point at all temperatures tested, so G. muellerae had to be analyzed separately. By visual inspection, we detected isolated cases where the TMV analysis appeared to strongly over-estimate max growth rate (and therefore the height parameter hi) compared to the Norberg curve fits. This might relate in part to the fact that we could not measure negative growth rates. The empirical minimum growth rate was constrained at 0 but the fit polynomial in TMV analysis could go below 0, which would affect the weighted sum-of-squares error in the fitting procedure. Therefore, we used the TMV analysis only to compare differences in Topt observed here to those reported by Zhang et al. (2014).
For E. huxleyi haplogroups I and II in the first experiment and all groups of E. huxleyi strains in the second experiment, the number of strains was sufficient to allow normality testing. The distributions of a, Z and W from the Norberg fits and the w, h, and Topt from TMV fit were all consistent with normality according to the Kolmogorov-Smirnov and Shapiro-Wilkox tests. For these parameters, significance of differences among groups was evaluated using 1-way ANOVA tests with Tukey’s multiple comparison test to identify significant pairwise differences. The distribution of w from TMV fits did not pass normality tests for E. huxleyi haplogroup I from either experiment, so this parameter was compared using the Kruskal-Wallis test with Dunn’s test for determining significances of pairwise differences. These tests were performed in Prism 9 (GraphPad Software).
A haplotype network was constructed for the concatenated cox1–cox3 alignments of 186 strains for which both mitochondrial markers were available (Figure 1), a number which includes 163 strains newly sequenced here (119 new strains from 2015 and 2016 campaigns, 44 strains isolated by the same methods between 2011 and 2013), and 23 sequences from Genbank. ABGD analysis supported three or four separate haplogroups (see Supplementary Figures 1–3). The three group separations corresponded to the clades I, II and III previously defined (Hagino et al., 2011; Bendif et al., 2014, 2016; although termed α, β and γ, respectively, in the latter two studies, we revert to the roman numeral designation to avoid confusion with morphotype classifications A, B, and C, and adopt the term haplogroup). No haplogroup III (G. oceanica) strains were isolated by this study in the Southeast Pacific, but both haplogroups previously documented for E. huxleyi were present. However, with the four group separation proposed by ABGD, clade I was separated into two haplogroups, with haplogroup Ib composed only of strains isolated from the Southeast Pacific. Both Maximum Likelihood and Bayesian trees (Figure 2) agreed with the placement of haplogroup Ib as basal to haplogroup I, but with only moderate support (77% bootstrap support and 75% posterior probability).
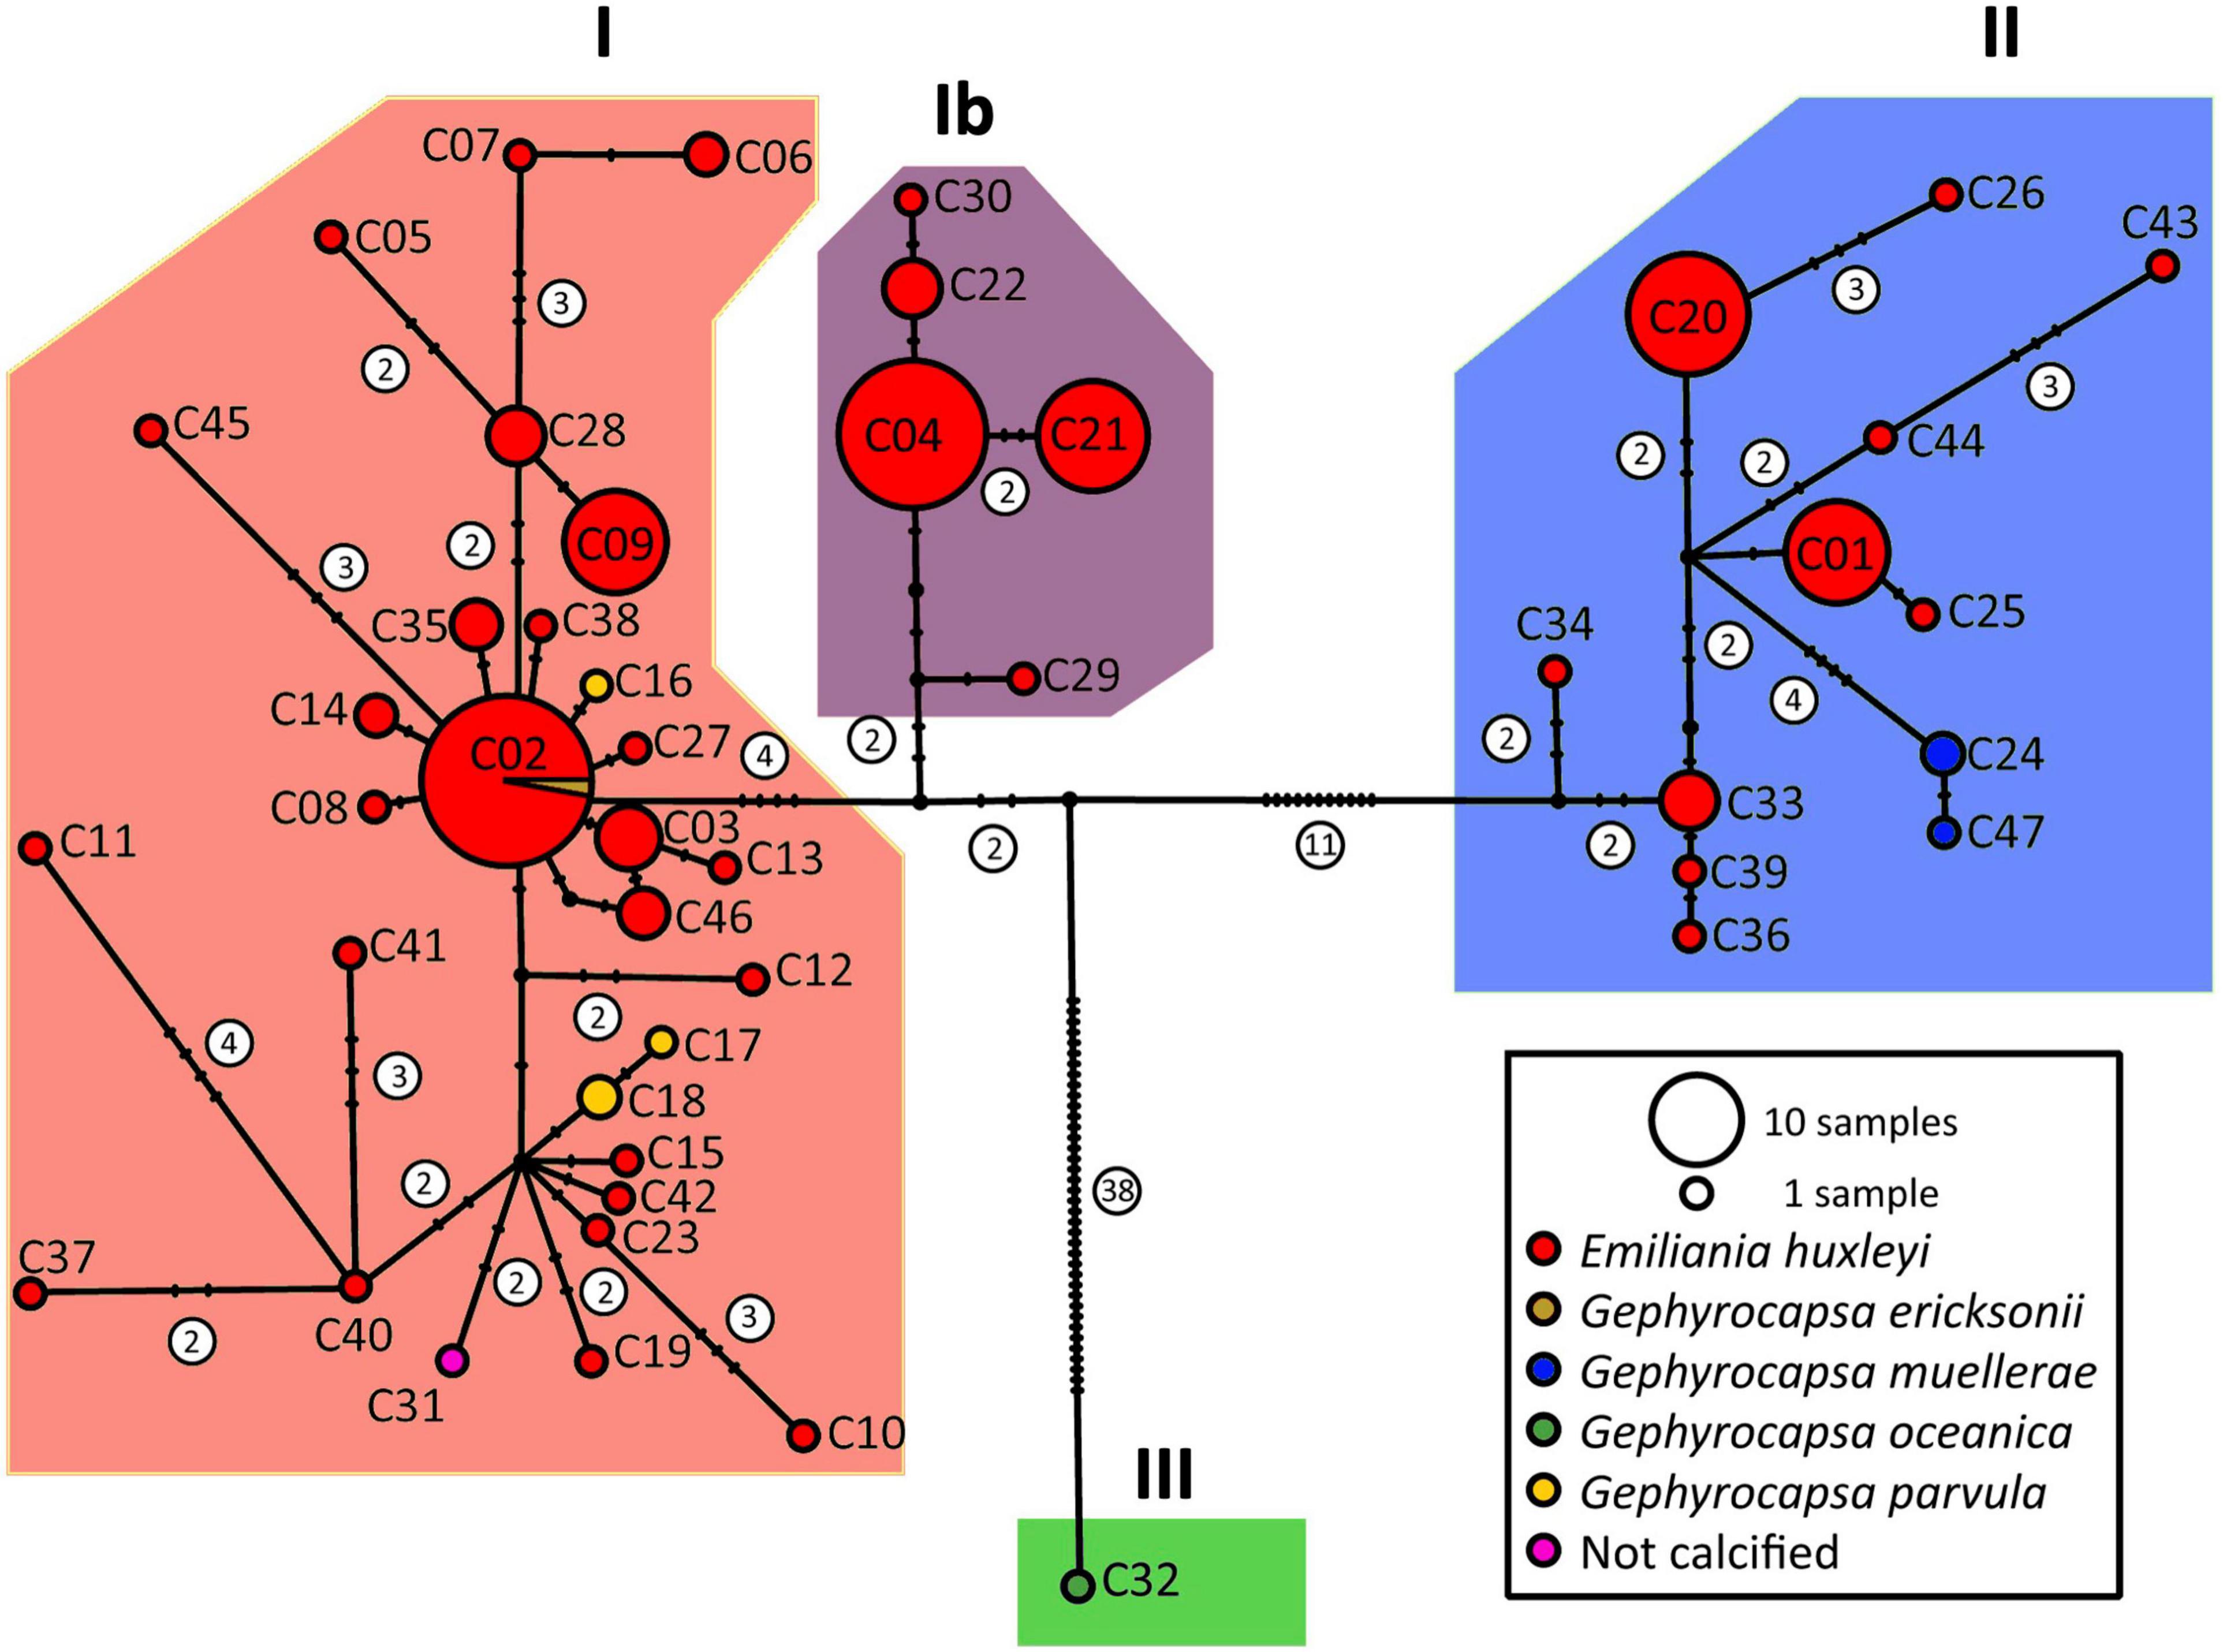
Figure 1. Haplotype network based on concatenated alignment of cox1–cox3. Diagnostic graphs for the ABGD analysis are in Supplementary Figure 1. The same network is re-plotted with key strains in Supplementary Figure 2, haplogroups are given in Supplementary Figure 3 and Supplementary File 1. The latter file also associates strains and haplotypes. ABGD analysis and haplotype networks for cox1 and cox3 separately are in Supplementary Figures 4–9.
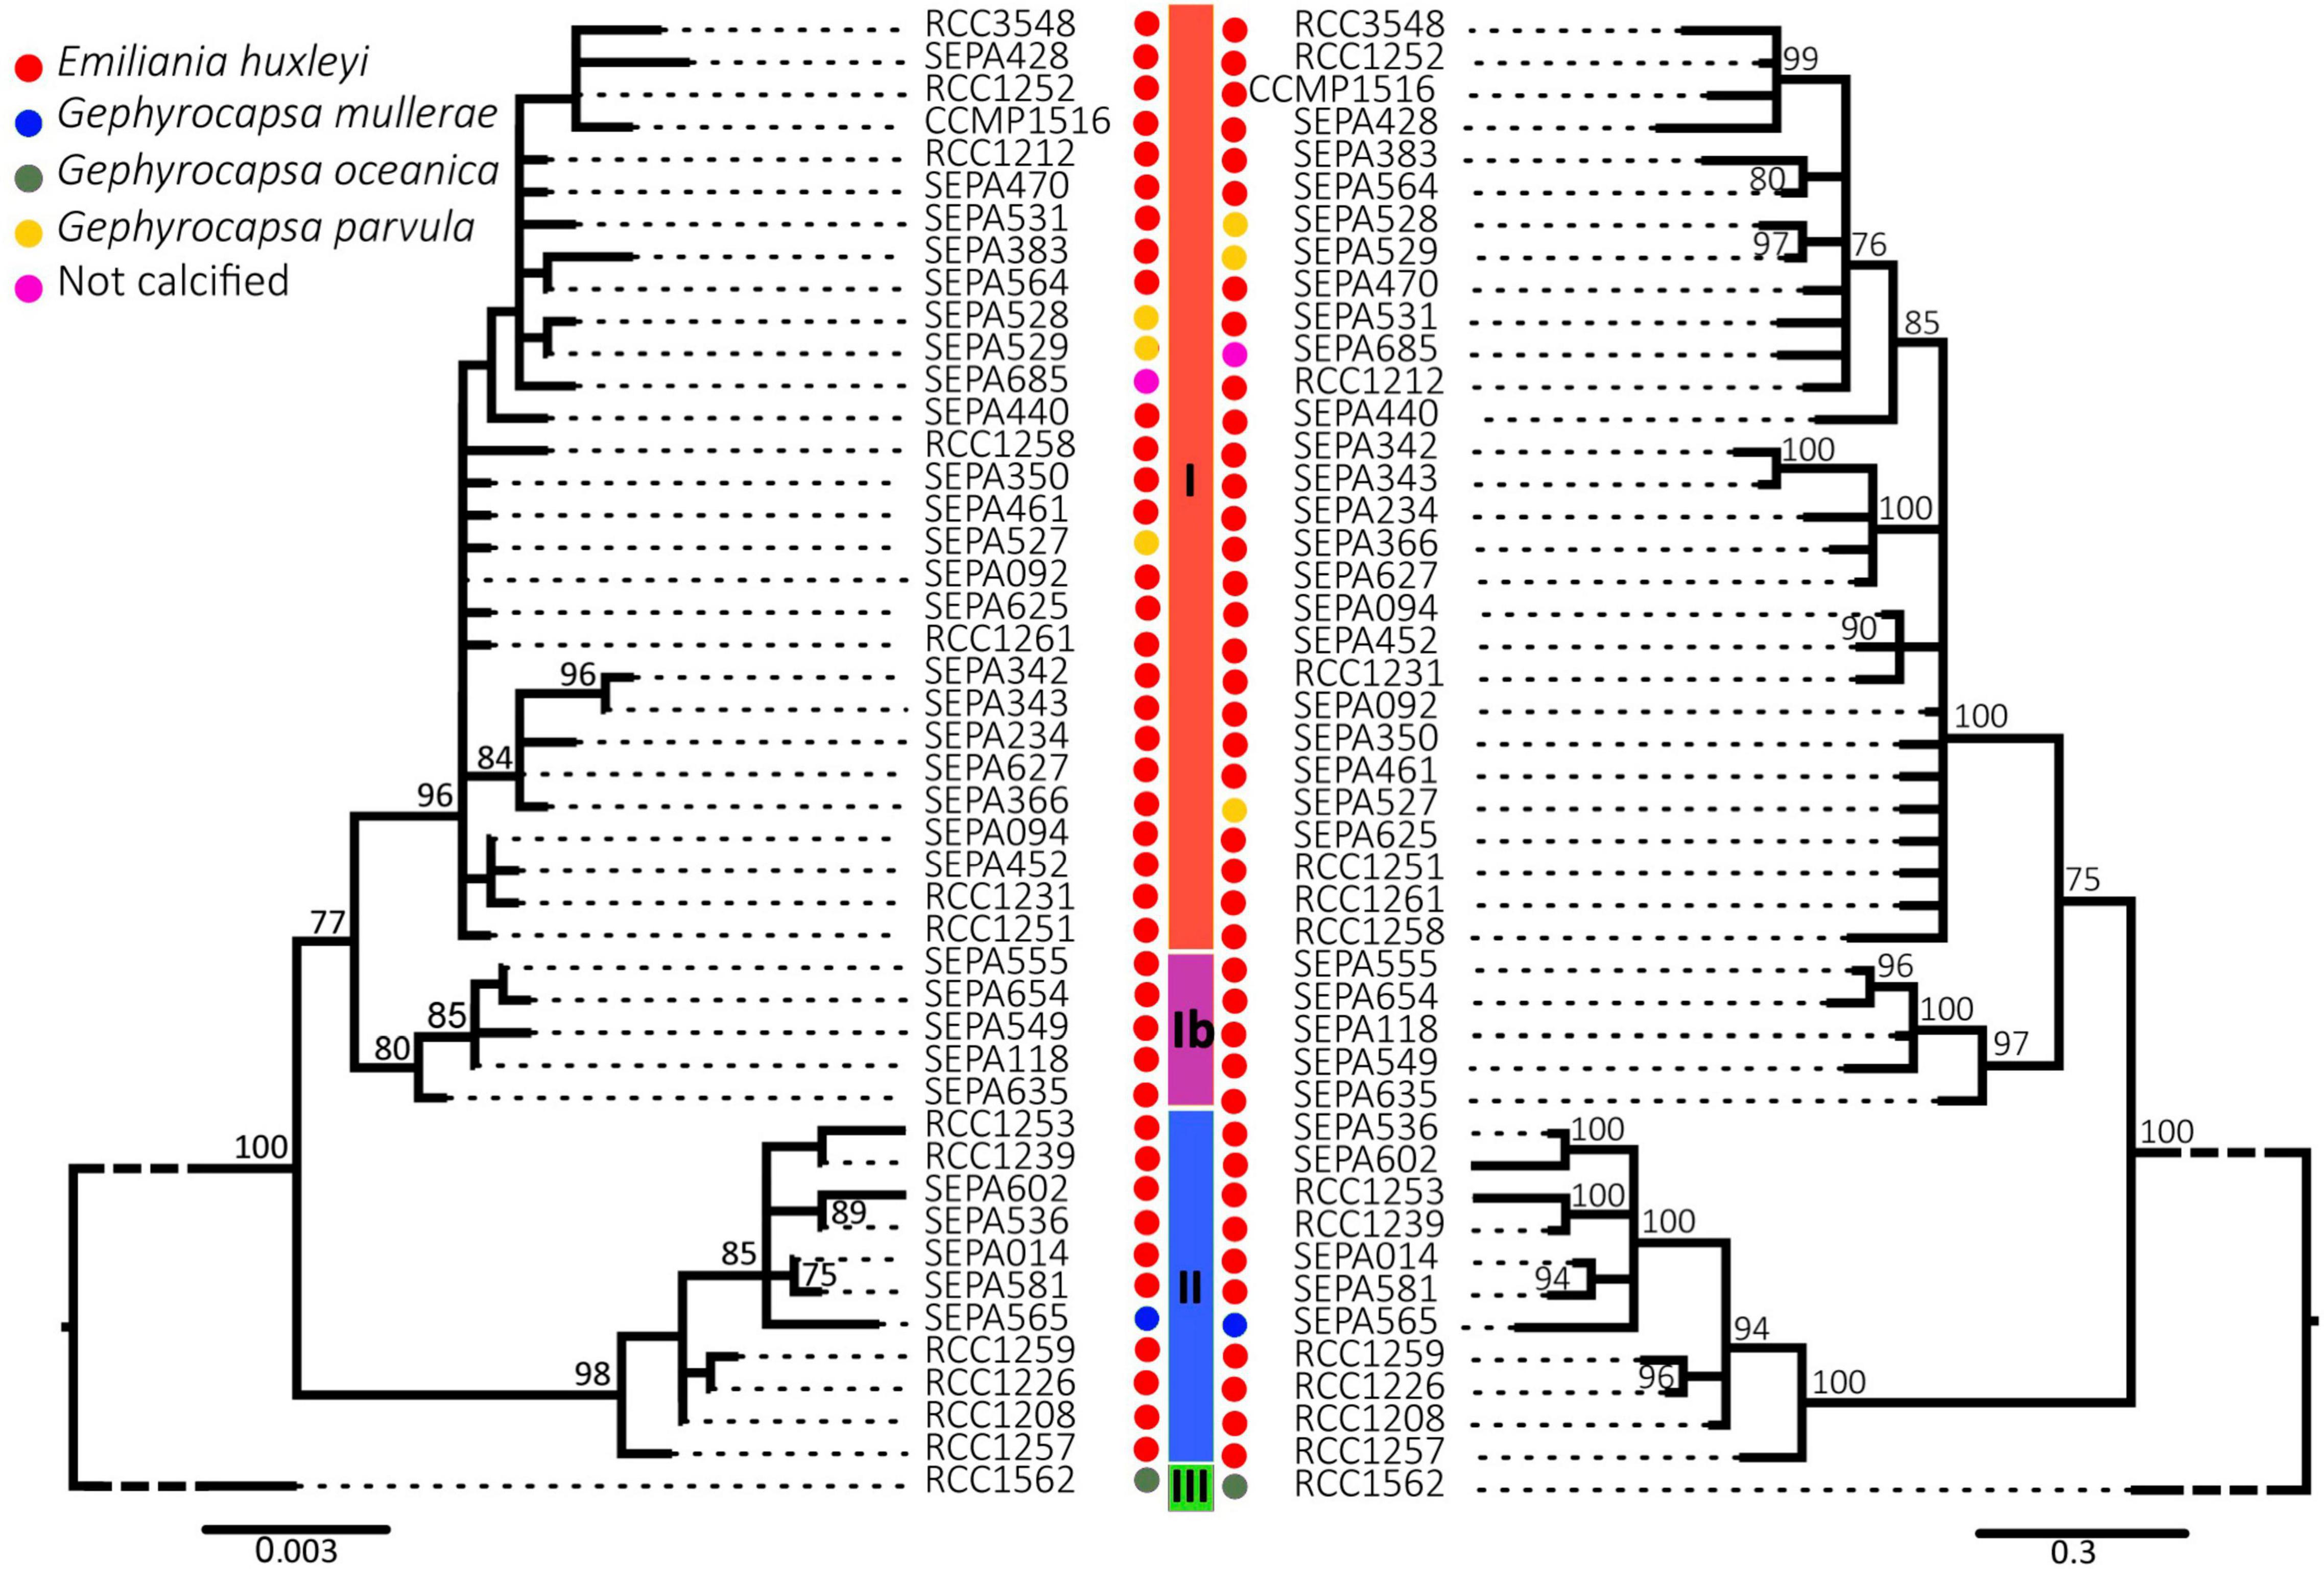
Figure 2. Phylogenetic tree of constructed from concatenated cox1–cox3 alignment. At nodes are shown bootstrap (Maximum Likelihood, left tree) or posterior probability support (Bayesian Inference, right tree) values above 75%.
Sequences were available only for the shorter cox3 from 324 strains, while only cox1 was available for 17 strains in Genbank and 3 strains sequenced here. To extend the study to include these 344 strains, haplotype networks for cox1 and cox3 were analyzed separately (Supplementary Figures 4–9). ABGD analysis assigned the four G. oceanica strains for which cox1 sequences were available (clade III) to two distinct haplogroups. More importantly, cox1 and cox3 haplotype networks were congruent in the assignation into haplogroup I composed of G. parvula, and G. ericsonii, and some strains of E. huxleyi, and haplogroup II composed of G. muellerae and the other strains of E. huxleyi. Additionally, although ABGD analysis did not provide support for separating haplogroup Ib from I based on the shorter cox1 or cox3 sequences alone, strains could be assigned to cox1–cox3 haplogroup Ib based on the haplotypes assigned from networks built with either cox1 or cox3 separately, so there was no evidence for haplogroup 1b outside of the 412 strains from the Southeast Pacific.
A tufA haplotype network was constructed from the alignment of 172 total sequences, including 161 sequences from our Southeast Pacific isolates and 11 sequences that could be included in the alignment that were obtained from Genbank from other strains. The tufA network was divided into 4 groups by ABGD analysis (Figure 3 and Supplementary Figures 10–12). One group was populated by sequences from only two E. huxleyi strains from the Southeast (SEPA25 and SEPA584) and another group by a single sequence of G. oceanica (RCC1316). Within the strains from the Southeast Pacific, there was a very strong association between mitochondrial and chloroplast haplogroups (c2 = 184.8, df = 4, p < 0.0001) (Table 2). Only a single cox haplogroup Ib isolate was assigned to tufA haplogroup II rather than I (of 48 sequenced for both mitochondrial and chloroplast markers), only a single cox haplogroup II isolate was assigned to tufA haplogroup I (out of 29). Thus, for the rest of the analysis we focus only on cox haplogroups.
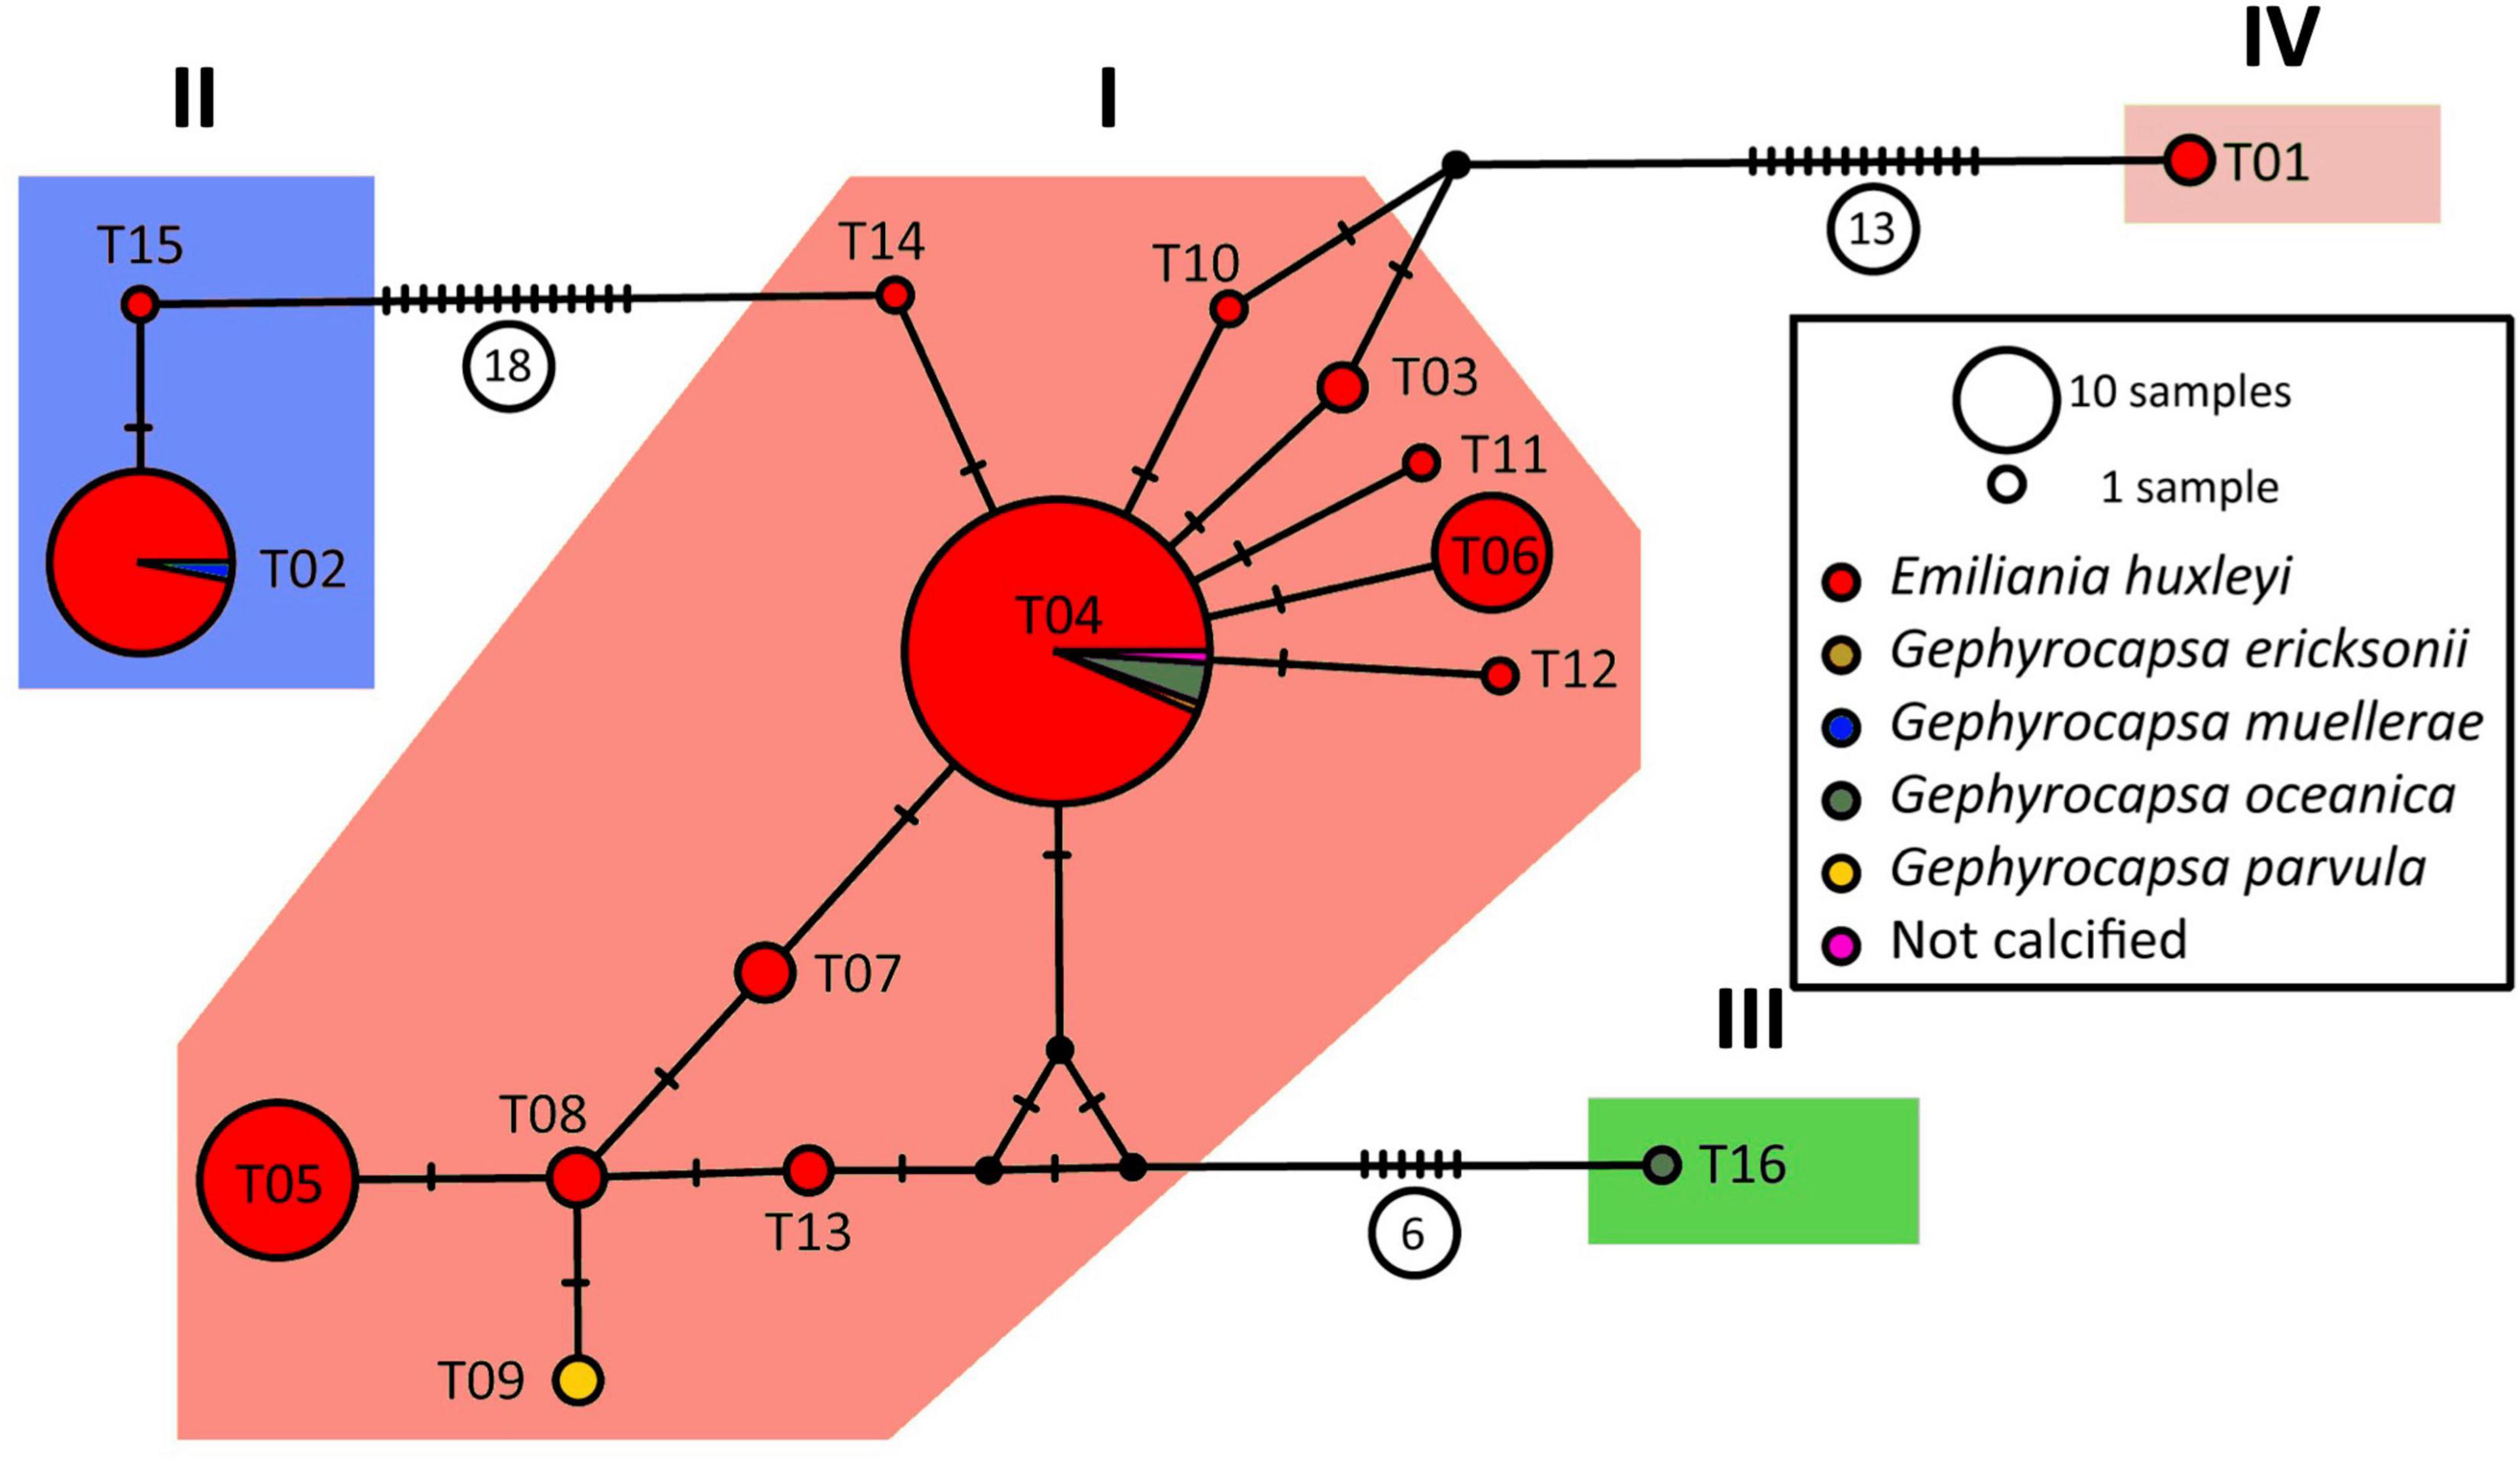
Figure 3. Haplotype network of tufA. Diagnostic graphs for the ABGD analysis are provided in Supplementary Figures 10, 11, while strains associated to each haplogroup are shown in Supplementary Figure 12 and Supplementary File 1. The latter file also associates strains and haplotypes.
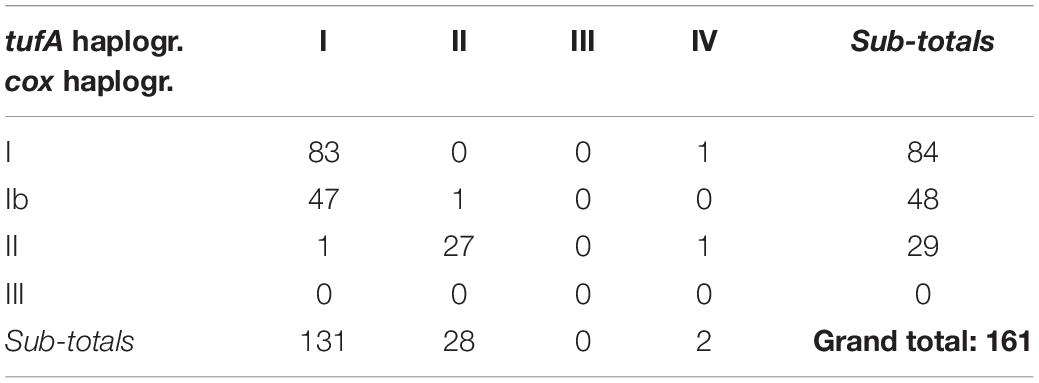
Table 2. Correspondence among cox haplogroups and tufA haplogroups from SE Pacific.
Morphological classification was obtained or previously available for a total of 181 strains isolated from the Southeast Pacific between 2011 and 2015. Examples of each morphotype from 2015 to 2016 are shown in Supplementary Figure 13 and morphological analysis identifying SEPA565 as a new isolate of G. muellerae by comparison to Bendif et al. (2015, 2016) is provided in Supplementary Table 1. There was a significant difference among haplogroups in the distribution of morphotypes (c2 = 135.5, df = 2, p < 0.0001) (Table 3). Substantial numbers of all three haplogroups were in the broad B morphotype class, which here may include B, B/C, and O morphotypes that were not distinguished here. Almost all of the haplogroup Ib strains were B morphotype. The A-OC morphotype included substantial numbers of both haplogroups I than II. The two morphotypes with over or hypercalcification (closed central area or fusion of distal shield elements) showed contrasting distributions among haplogroups: The A-CC morphotype, with closed central area but separated distal shield elements, was almost exclusively haplogroup I, while the HC/R morphotype (with fused distal shield elements) was almost exclusively haplogroup II. Nevertheless, there was no case where a morphotype was exclusively populated by one mitochondrial haplogroup.
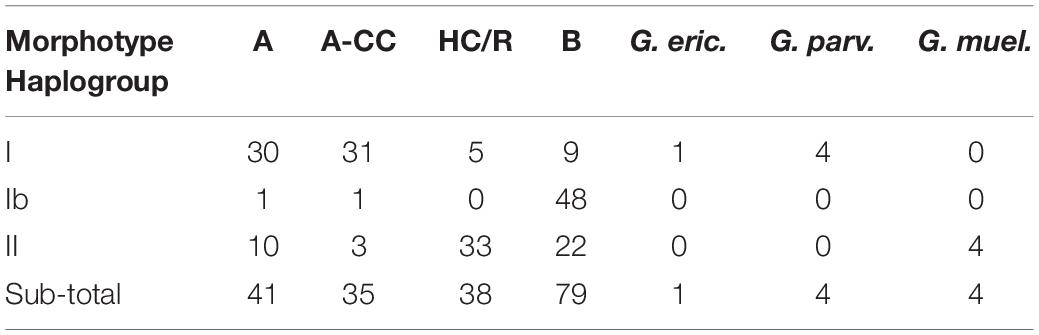
Table 3. Correspondence among morphotypes and cox haplogroups of E. huxleyi from SE Pacific.
At a global scale, haplogroup I (without separating off Ib, detected only in Chilean waters) was the most widespread (Figure 4A). Haplogroup II became more prevalent at higher latitudes in both hemispheres. All 10 strains originating from latitude >55° were haplogroup II (5 North Sea, 1 Baltic Sea, 2 northern central Atlantic, 1 northern central Pacific, 1 northwestern Pacific), whereas haplogroup II was mostly excluded from latitudes less than 30° N or S. Haplogroup III (G. oceanica) strains came from sub-tropical and tropical latitudes.
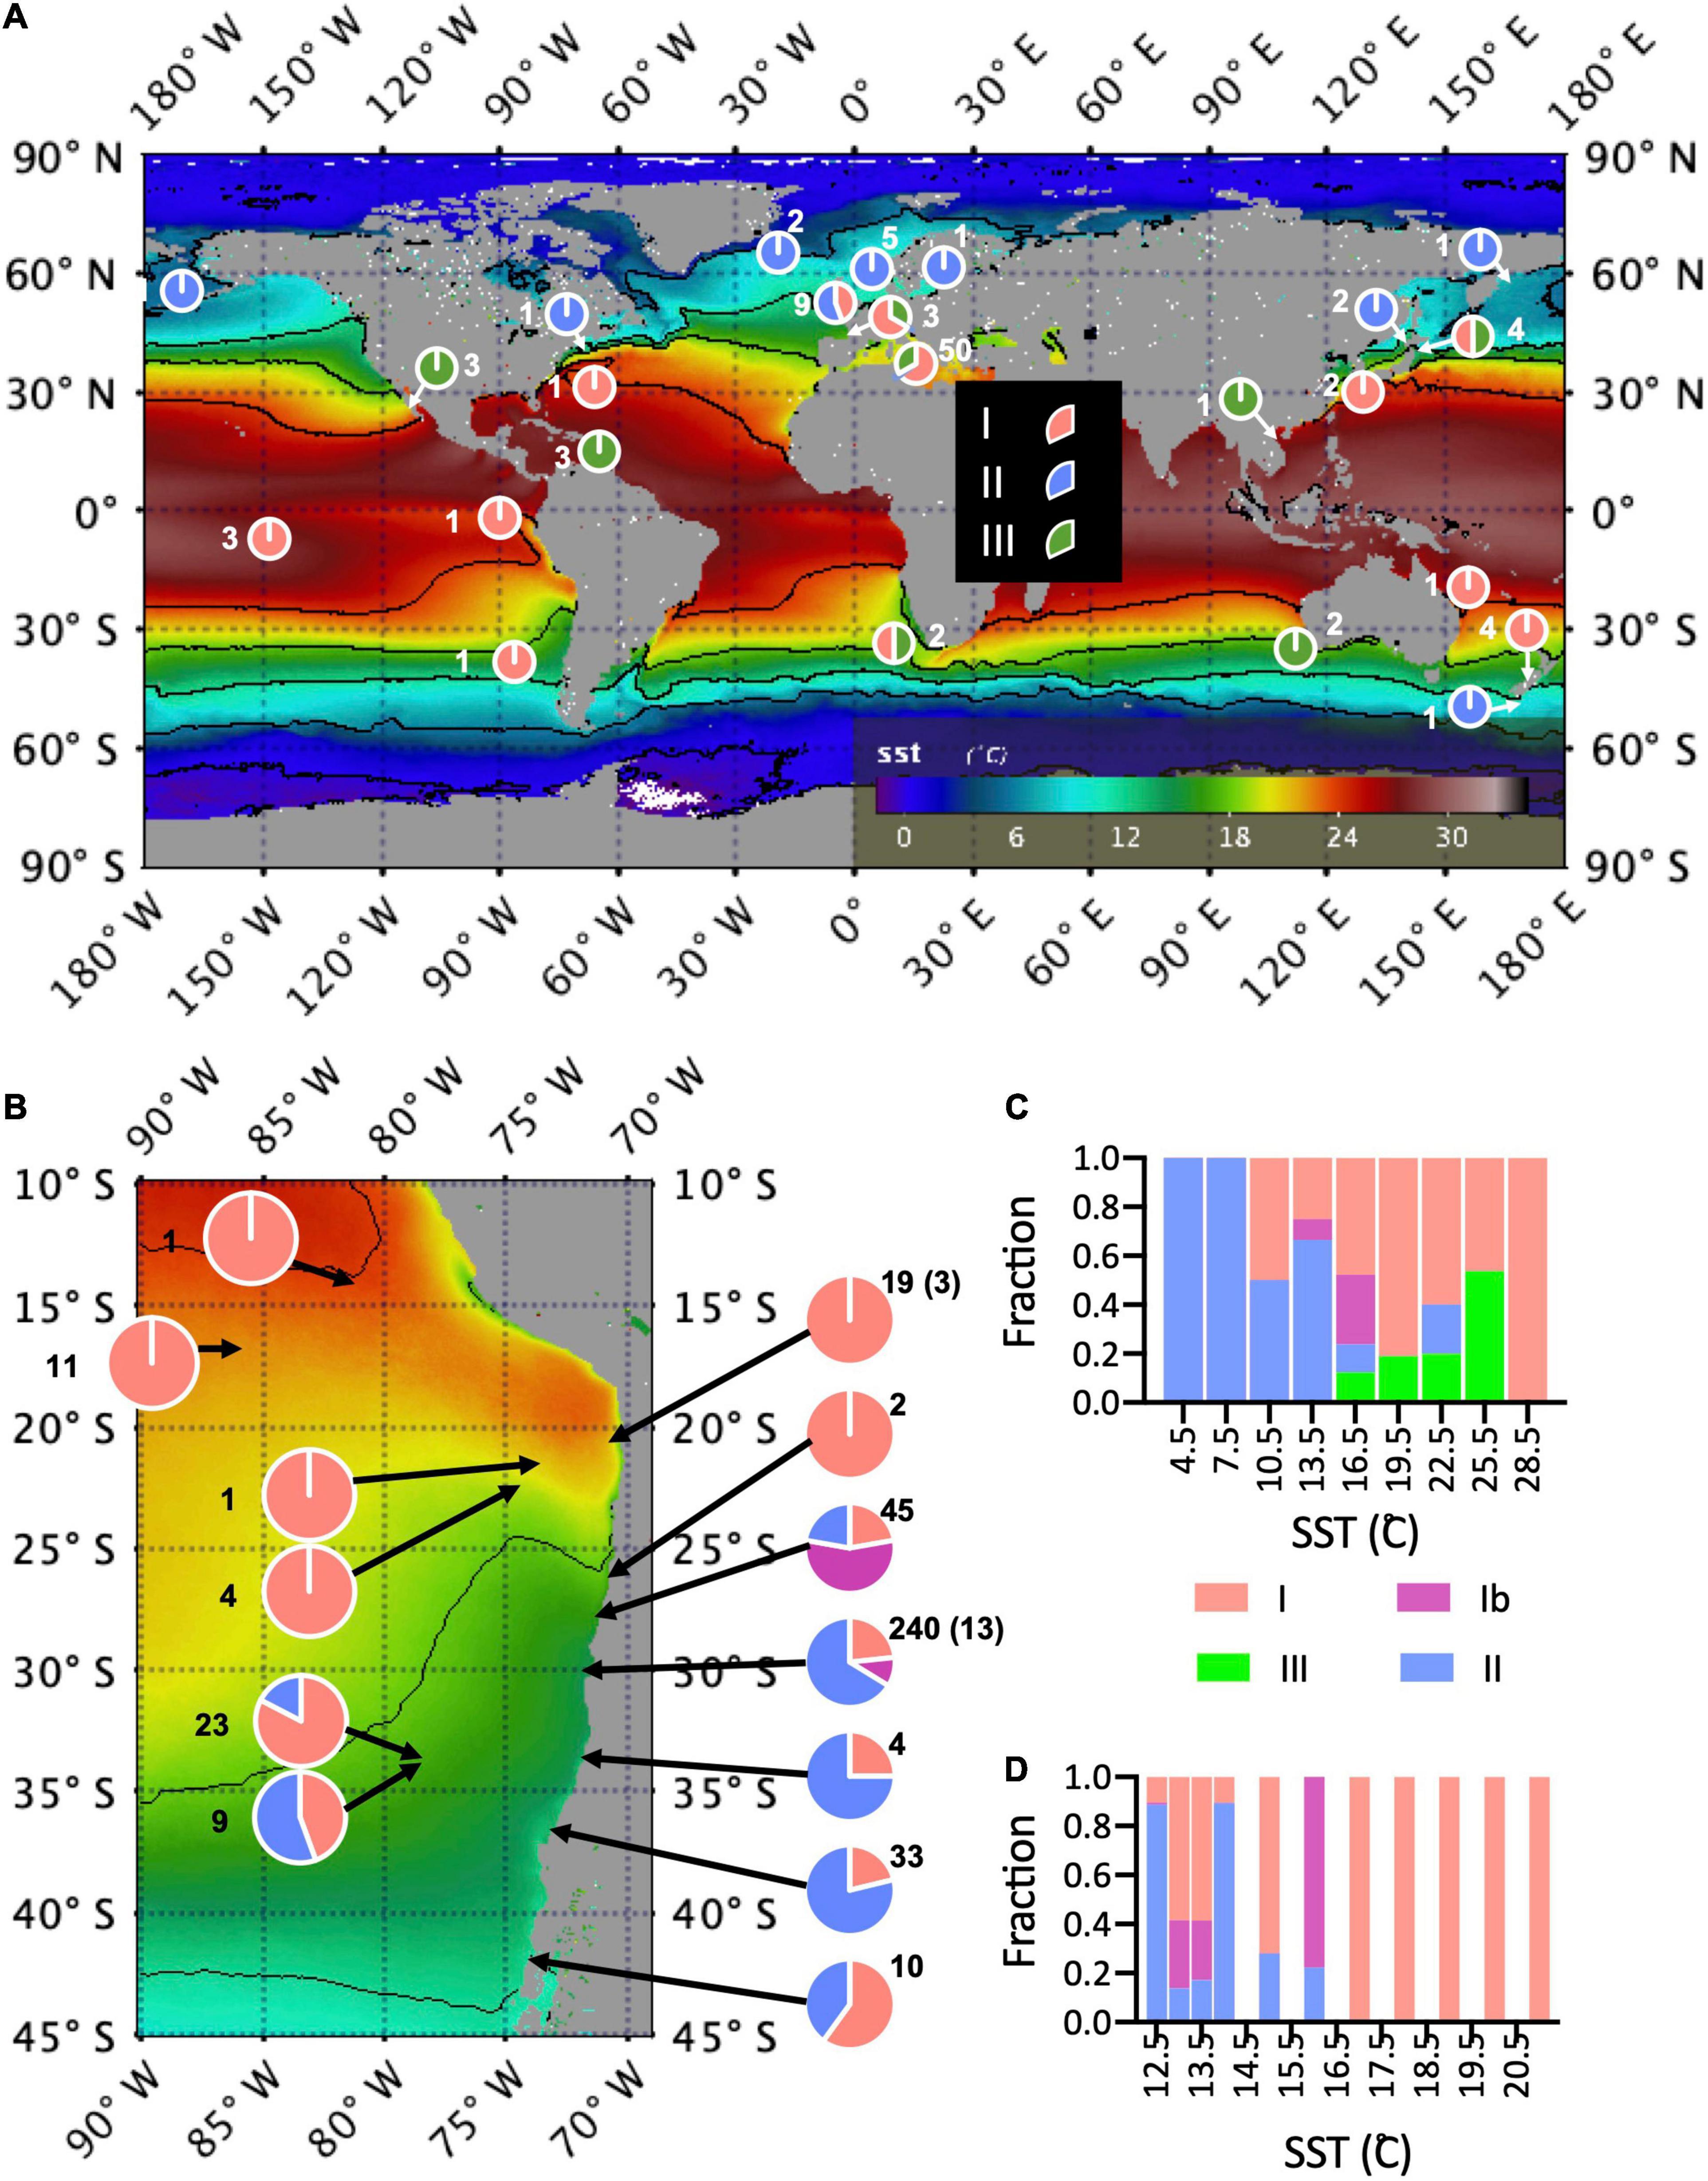
Figure 4. (A) Global distribution of strains each haplogroup at sites of origin. Pie charts show proportions of strains in each haplogroup at each site of origin, overlayed on map of mission average SST from MODIS Terra. Numbers of strains are indicated by each pie chart. Sites that are very close are consolidated. (B) The same map of SST, but zoomed into the Southeast Pacific. (C) The proportion of each haplogroup in temperature bins, including all strains. Here temperature was extracted for each month/year and site of origin from the Multi Observation Global Ocean ARMOR3D L4 analysis and multi-year reprocessing. (D) The proportion of each haplogroup in temperature bins for strains from the Southeast Pacific for which direct measurements of surface (5 m) temperature and salinity are available.
This latitudinal pattern held within the regional scale in the Southeast Pacific (Figure 4B) but appeared to be modified in relationship to patterns of upwelling. Haplogroup II dominated in the cooler nearshore waters from the strong coastal upwelling center north of Punta Lavapie (37°–36° S) to the strong upwelling center near Punta Lengua de Vaca (30° S), but was represented only 9 out of 33 strains isolated from the oceanic waters near the Juan Fernandez Archipelago (33° S, 78° W), and only 4 of 10 strains from the northern Chiloe outer coast at 42° S, south of the region where coastal upwelling is dominant.
There was a significant negative association of haplogroup II (vs. haplogroup I) with increasing SST (Figure 4C), SSS and minimum distance from mainland coast (MDMC), while MLD was not significant (Tables 4, 5). In contrast, haplogroup Ib was not significantly associated with SST but was significantly associated negatively with SSS and MDMC and positively with MLD, but this group was only found in a small subset of locations in coastal Chile and nowhere else. Haplogroup III (vs. haplogroup I) was positively correlated with SST and SSS and negatively with MLD and MDMC, but the p-value for SST was just above the a-threshold for significance (p = 0.055). Also, SST was significantly correlated with SSS and MDMC.
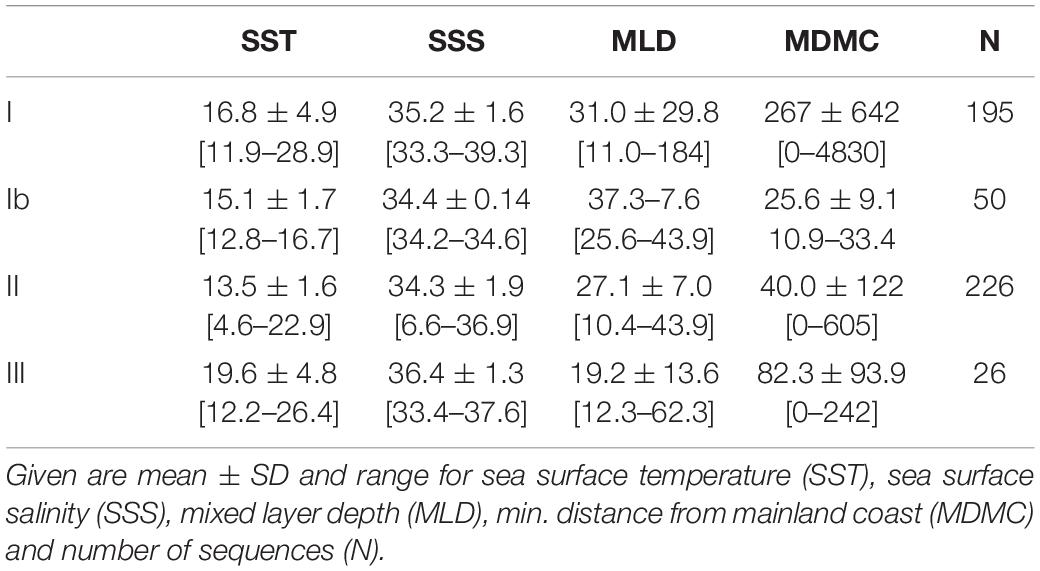
Table 4. Mean reconstructed environmental characteristics for all strains for which cox haplogroup is available (from 1993).
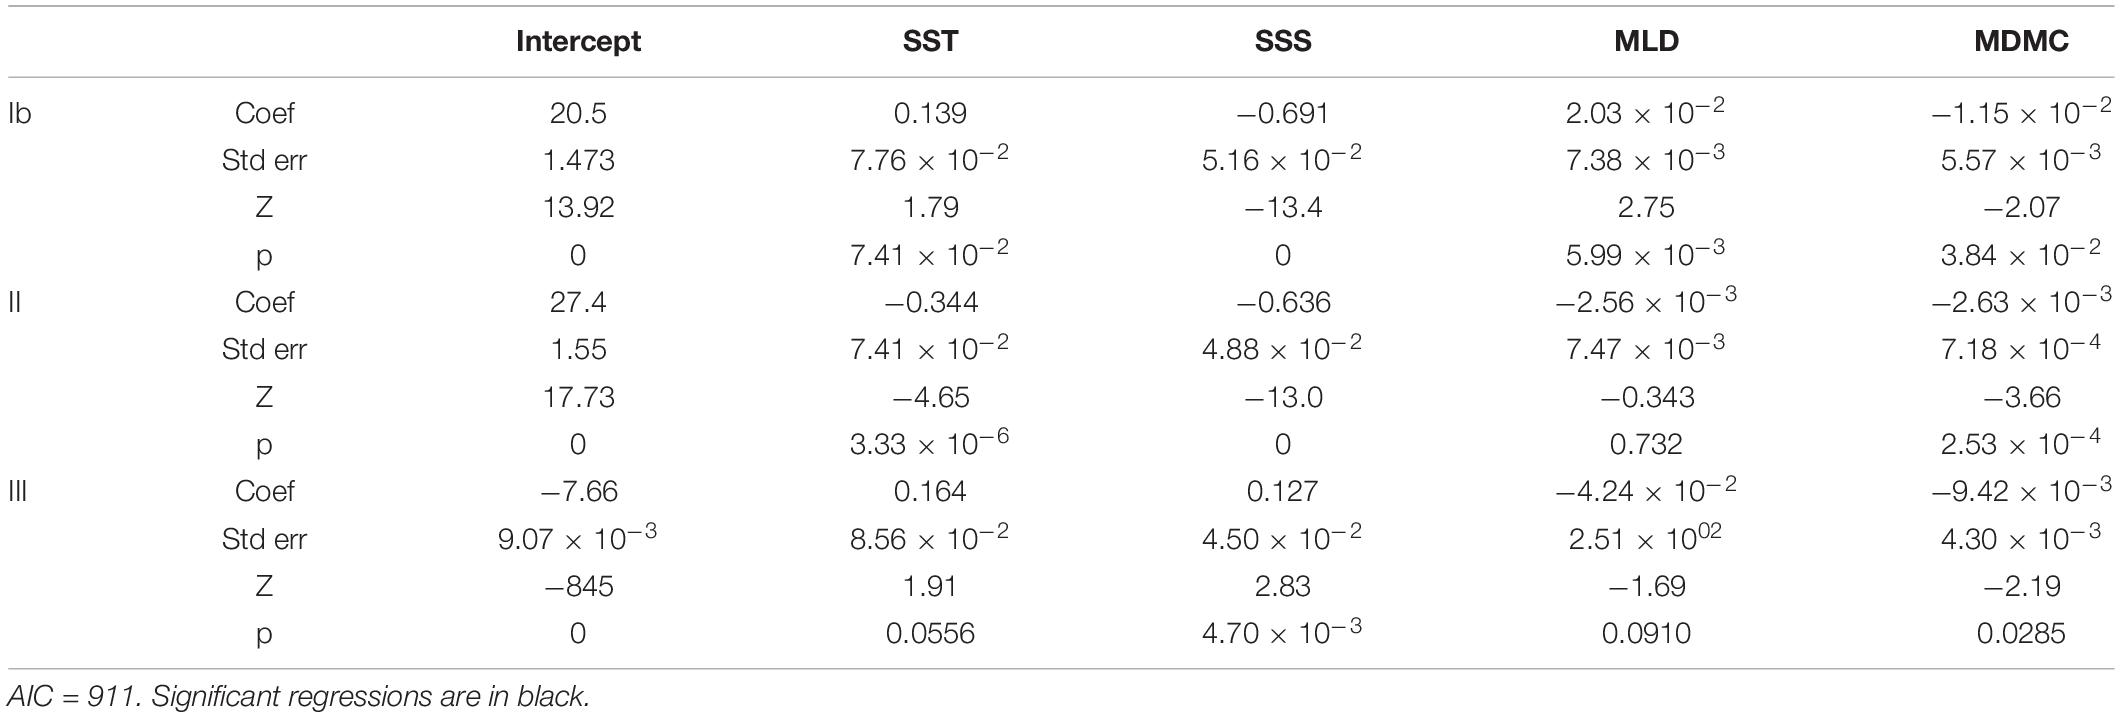
Table 5. Results of multinomial regression for cox haplogroup (rel. to haplogroup I) against reconstructed environmental parameters, for all strains for which cox haplogroup is available (from 1993).
When only strains from the SE Pacific isolated after 2011 were considered, haplogroup II (vs. haplogroup I) was significantly negatively associated with both SST and SSS from direct measurements of the surface water of origin (Figure 4D and Tables 6, 7).
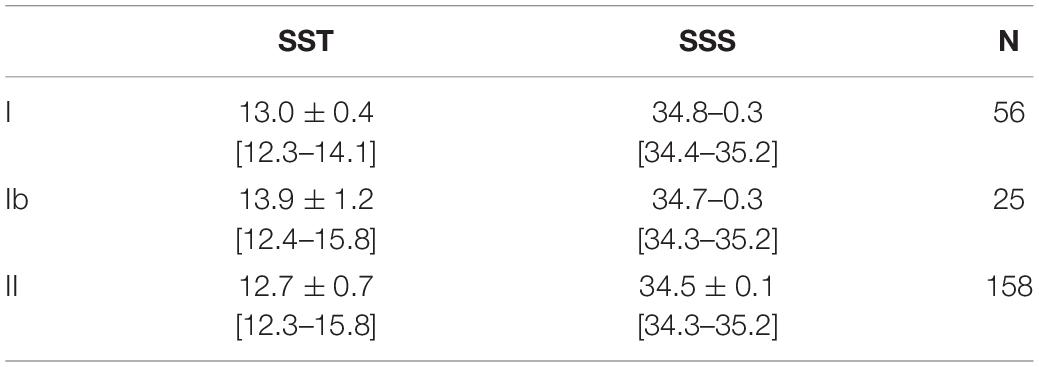
Table 6. Mean SST and SSS for strains in each cox haplogroup originating exclusively from the upwelling center near 30° S.
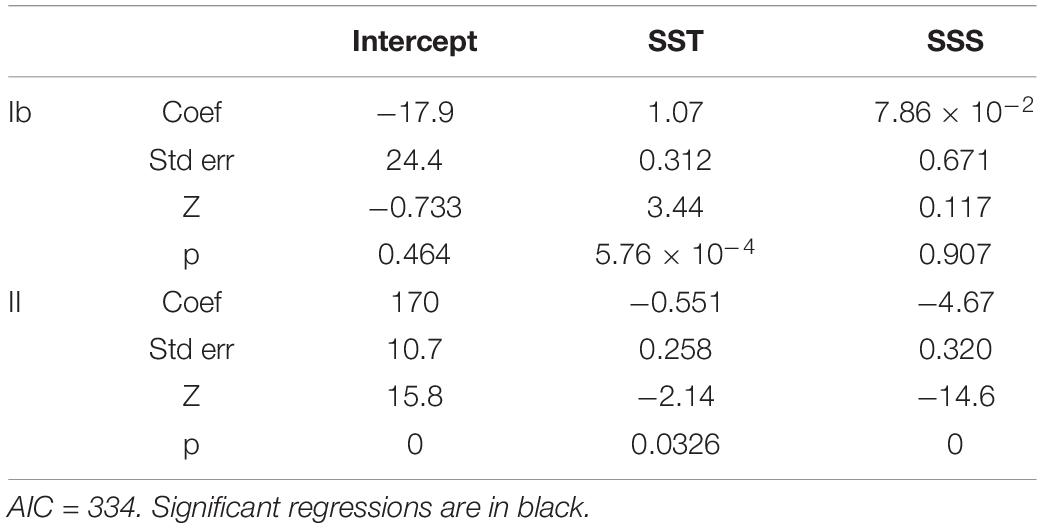
Table 7. Results of multinomial regression for cox haplogroup (rel. to haplogroup I) against direct measures of SST and SSS for strains from near the 30° S coastal upwelling.
In this first experiment, focused on the interspecies comparison, all analyses suggested that G. muellerae had the lower thermal optima while G. oceanica and G. parvula tended to have higher thermal optima, with E. huxleyi intermediate (Figures 5, 6). In thermal performance curves analysis from Experiment 1, E. huxleyi haplogroups I and II were not significantly different (Figure 6), and so tests were repeated consolidating E. huxleyi haplogroups to provide more confidence in analysis of interspecific differences. None of the G. muellerae strains could grow at 24°C (Figure 5E), nor could the one strain of E. huxleyi Ib (SEPA118), whereas all of E. huxleyi haplogroups I and II, G. oceanica, G. parvula-ericsonii group grew at that temperature. Three of the five G. parvula-ericsonii, 9 of the 11 E. huxleyi tested, and all G. oceanica could also grow at 27°C, suggesting that G. oceanica is typically the most warm-tolerant (Figure 6A). All G. muellerae and all E. huxleyi grew at 8°C, while none of G. parvula-ericsonii or G. oceanica grew at that lower temperature (Figures 5, 6B). Three G. oceanica strains (RCC1562, RCC1803, and RCC3729) did not even grow at 12°C (Figure 5F). There was no difference detected among haplogroups or among species in the Norberg performance (height) parameter a (Figure 6C) except when E. huxleyi were consolidated, and G. oceanica had a significantly lower a than E. huxleyi. The TPC fits also indicated a lower thermal optima of G. muellerae, and higher optima of G. oceanica, compared to E. huxleyi and other Gephyrocapsa, whether measured as Norberg Z (competitive optimum temperature) (Figure 6D) or Topt (temp. of max. growth rate) from TMV analysis (Supplementary Figures 14, 15). Within the G. parvula-ericsonii genetic group, the single G. ericsonii strain (SEPA516) had lower Z and Topt fits than the four G. parvula. The mean separation between the thermal optima of G. muellerae and G. oceanica was 4.5°C for both Z and Topt.
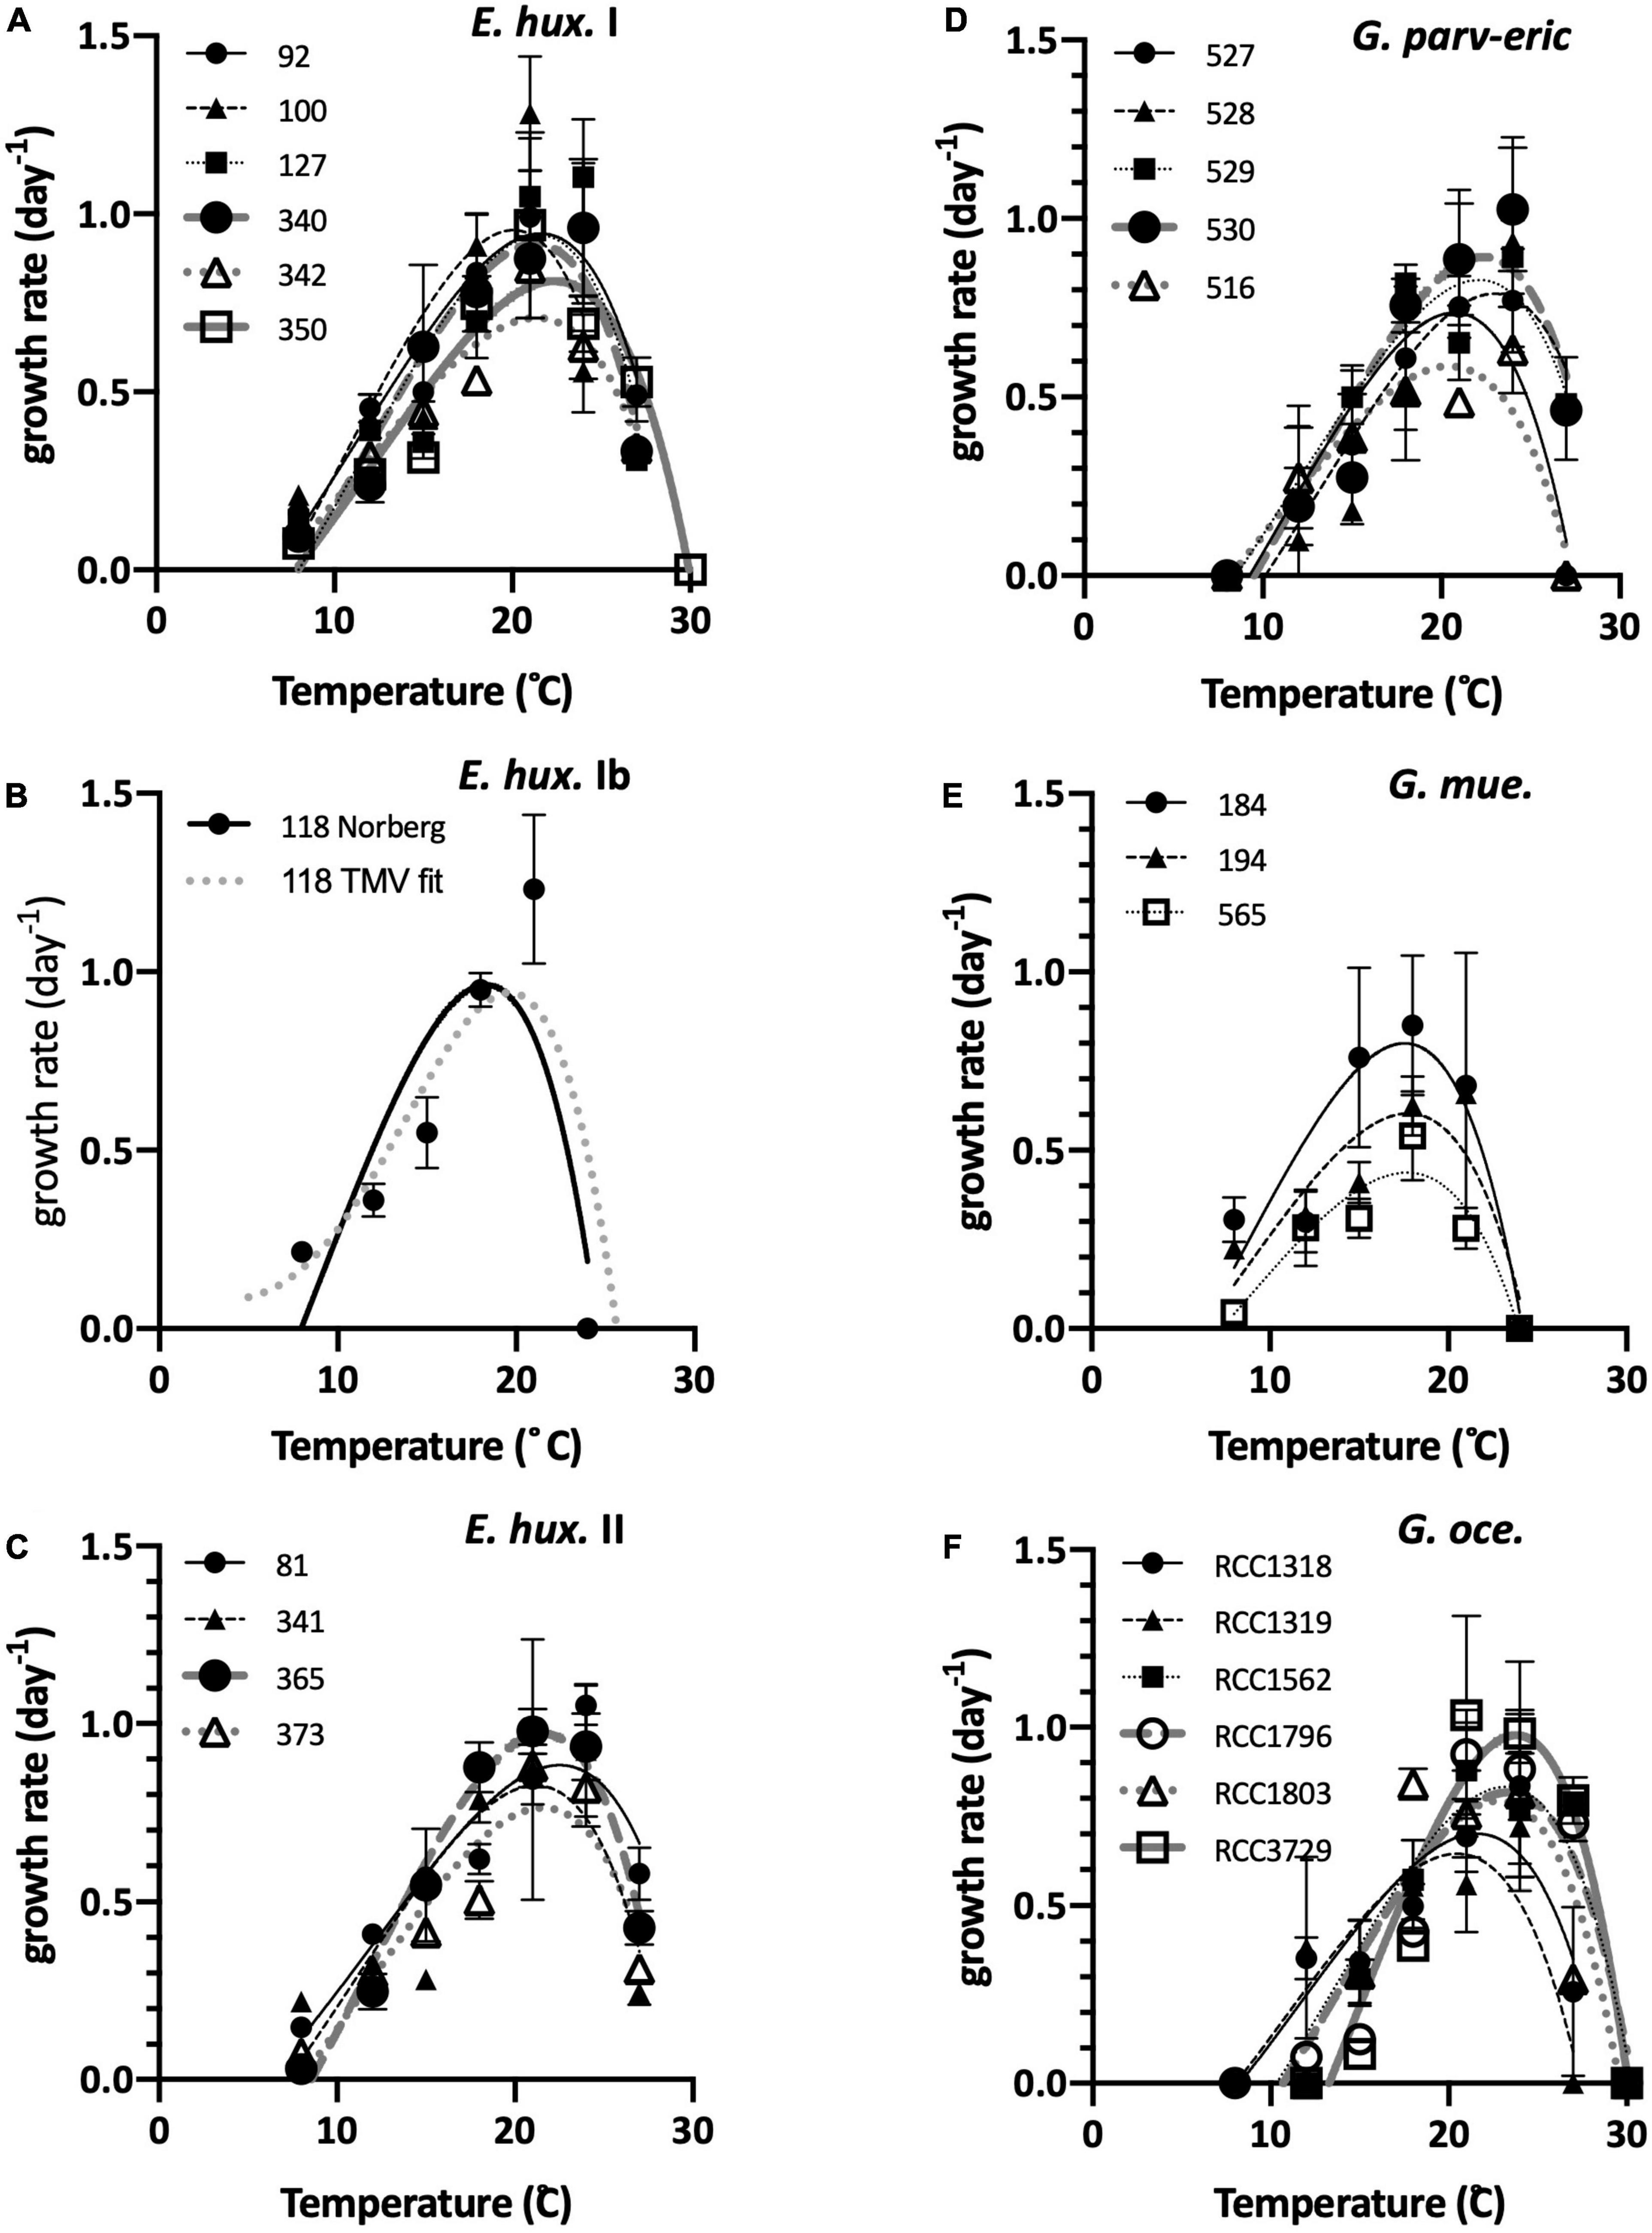
Figure 5. Thermal performance curves for growth for all strains in Experiment 1, with the corresponding fits to the Norberg equation overlaid. (A) E. huxleyi haplogroup I. (B) E. huxleyi haplogroup Ib. Here, both the Norberg and TMV fit are shown for comparison. (C) E. huxleyi haplogroup II. (D) The 4 G. parvula (527–530) and 1 G. ericsonii (516) strains. (E) G. muellerae strains. (F) G. oceanica strains.
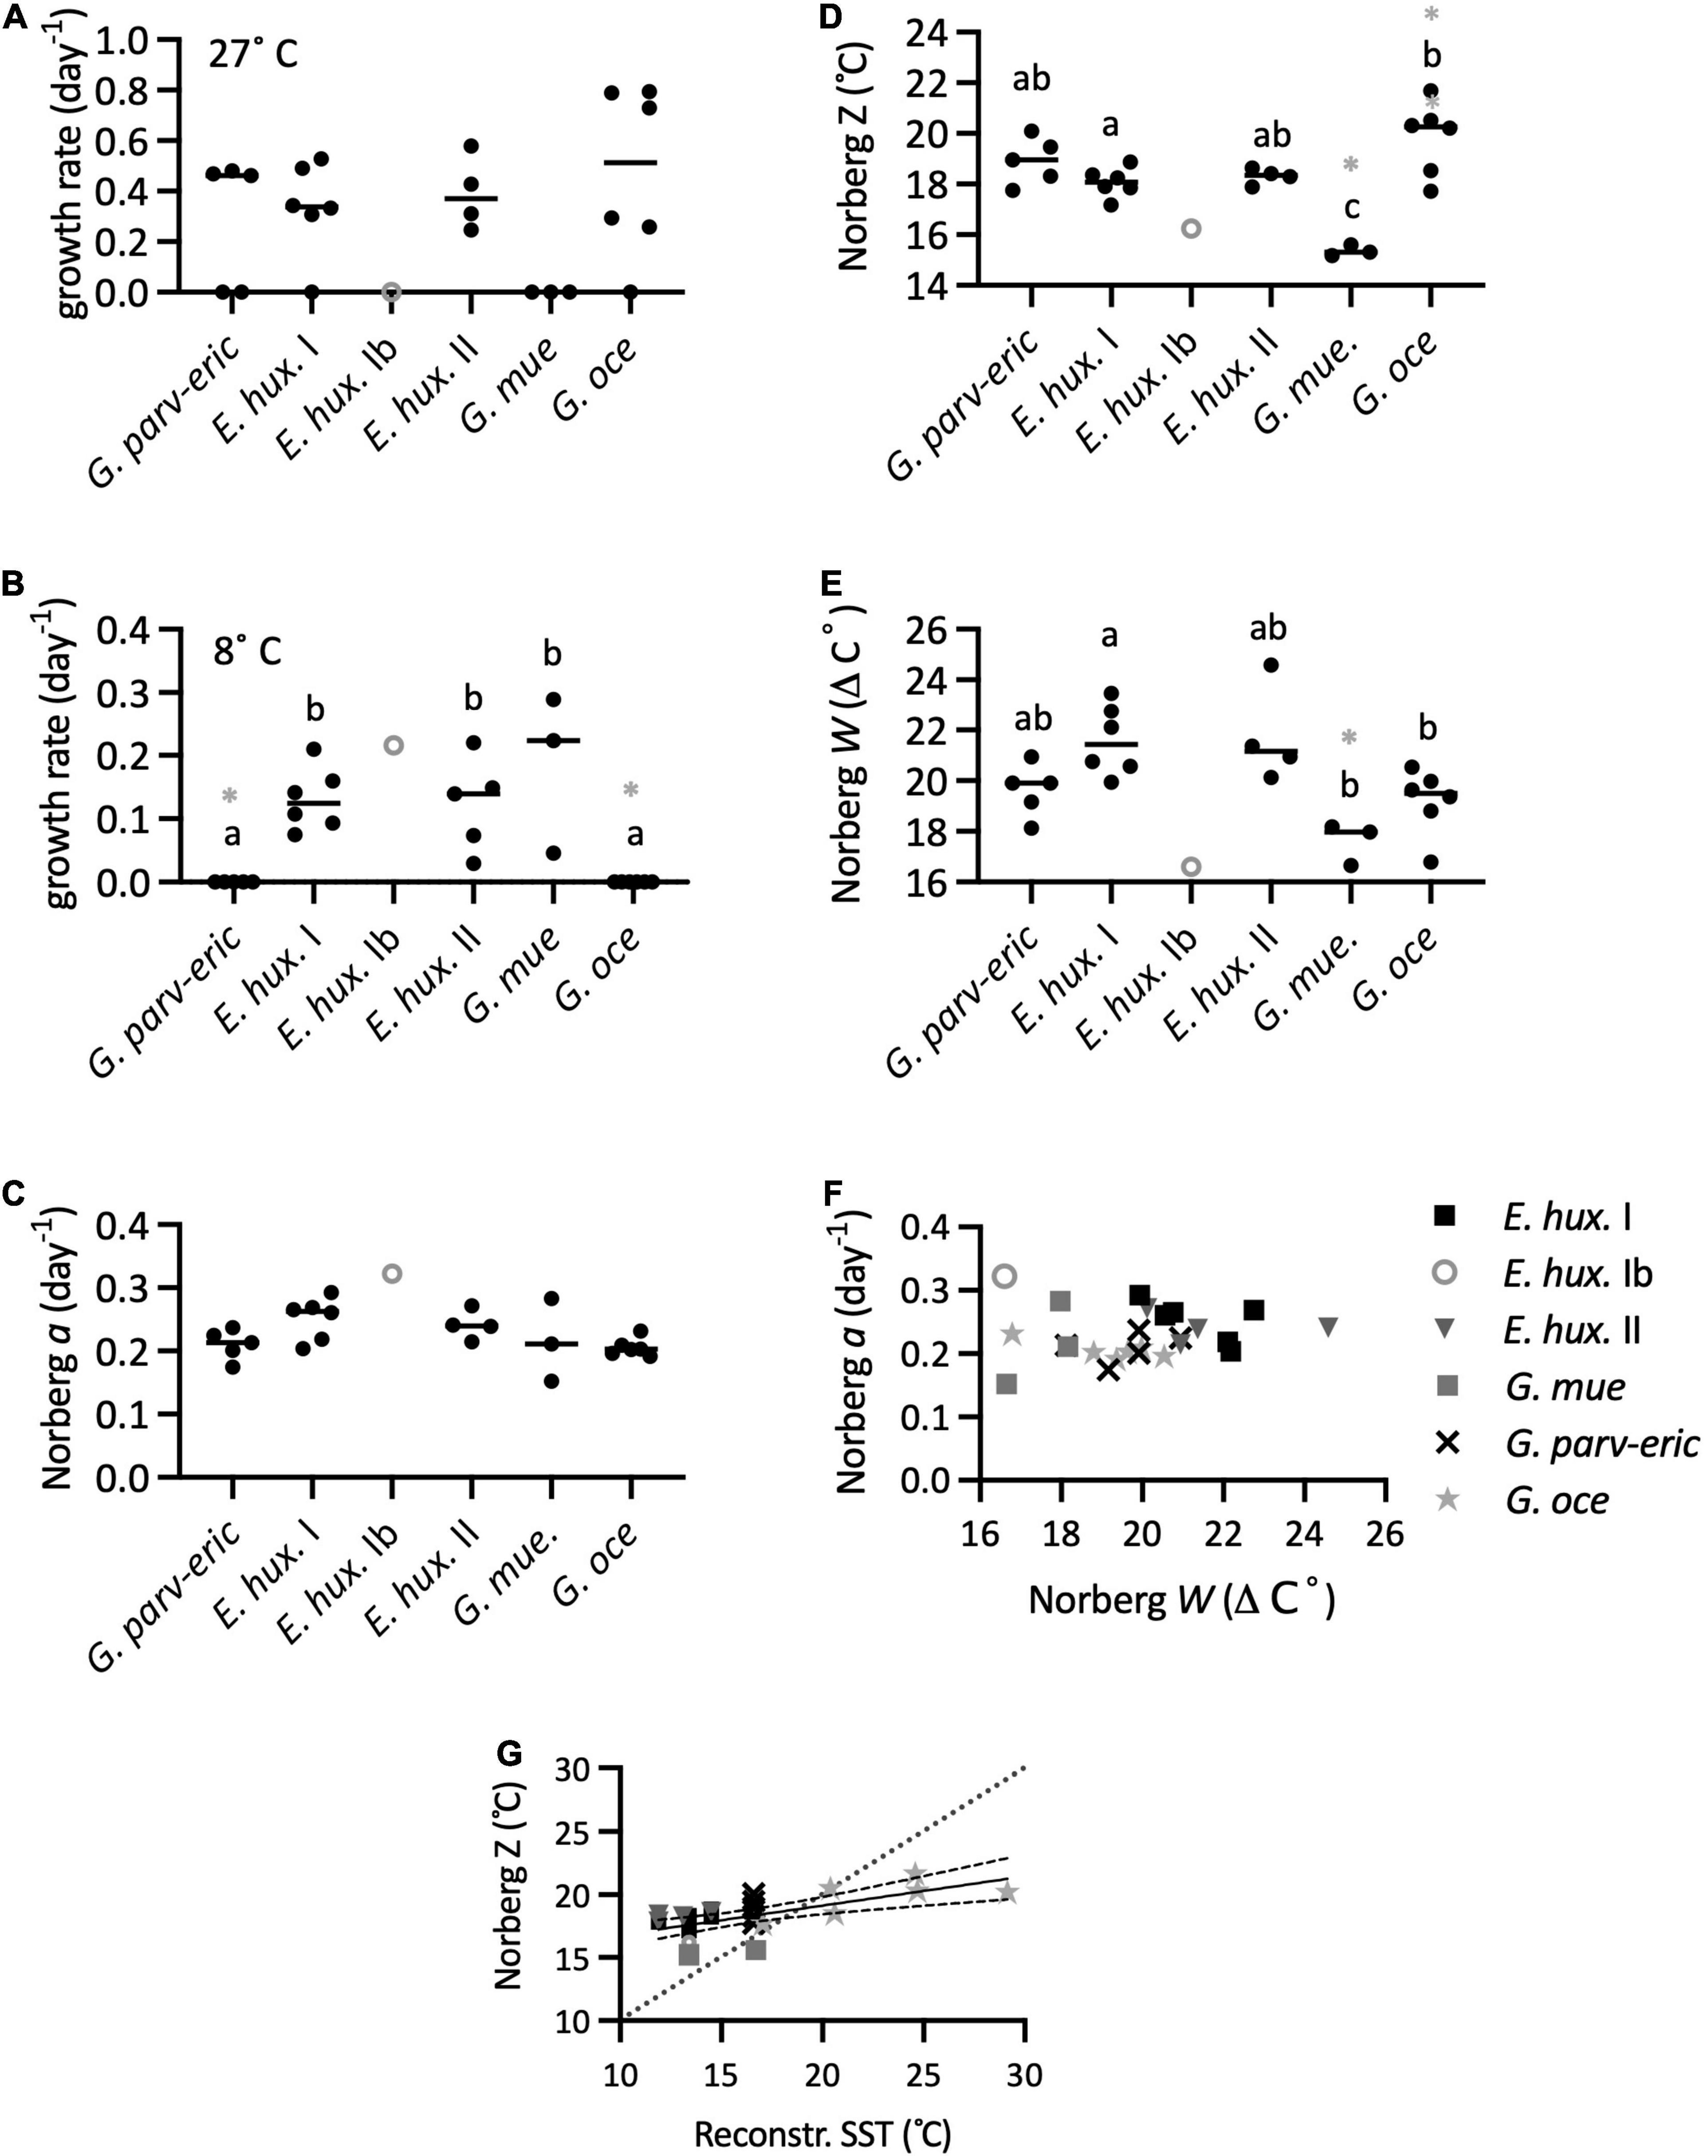
Figure 6. Thermal reaction norms calculated from TPCs in Experiment 1. (A) Growth at 27°C. (B) Growth at 8°C. (C) The Norberg a growth (height) parameter. (D) Norberg Z (competitive optimum temperature). (E) Norberg niche width W. Letters indicate significant differences among groups, and groups that share one or more letters were not significantly different in pairwise tests. The single strain of E. huxleyi Ib was excluded from ANOVA tests except when all E. huxleyi were consolidated. A gray + indicates groups which were significantly different from consolidated E. huxleyi, while a gray x indicates when either the G. parvula-ericsonii or G. oceanica differs from G. muellerae in tests with consolidated E. huxleyi. (F) Norberg growth (height) a vs. width W for Experiment 1. (G) Norberg Z vs. reconstructed SST at origin. The linear regression with 95% confidence bands is shown (F1,23 = 15.64, p = 0.0006, R2 = 0.4048; equation: Z = 0.2316 × SST + 14.51), and for comparison the 1:1 line is also shown.
The largest Norberg niche width parameter W was of an E. huxleyi SEPA81 (haplogroup II) while the narrowest was from E. huxleyi strain SEPA118 (the single member of haplogroup Ib in this experiment, not included in statistical tests except when E. huxleyi was consolidated) (Figure 6E). While both E. huxleyi I and II tended to have larger W’s than the other species, only the pairwise differences of E. huxleyi I with G. oceanica and G. muellerae were significant. When E. huxleyi was consolidated, the difference was only significant with G. muellerae.
There was no relationship between performance (a) and width W (Figure 6F). The TMV decomposition of the modes of variation, performed on all except G. muellerae indicated that only 6.9% of total variation was related to a generalist-vs-specialist mode, which, while we interpret with caution as explained in the Methods, was consistent with the results from reaction norms obtained with the Norberg curve fitting.
There was a significant relationship between Norberg Z and the reconstructed SST of the month of origin (Figure 6G). However, the relationship was also significantly less than 1, with most of the G. oceanica exhibiting Z’s below their SST of origin, whereas all of the Southeast Pacific strains, with the exception of a single G. muellerae strain, exhibited Z’s above the SST of origin.
All but two of the strains of E. huxleyi haplogroup I could grow at 27°C but most haplogroup Ib and II strains could not grow at that temperature (Figures 7, 8A). The differences between I vs. Ib and I vs. II were significant. All strains of the three haplogroups could grow at 8°C (Figures 7, 8B) and there were no significant differences in growth rates at that temperature. Both the Norberg model and TMV analysis produced adequate fits to TPC data. Visually, TMV analysis suggested that these strains might exhibit an inflection point in the rising portion of the TPC curves (Figure 7D). Norberg performance (a) was significantly lower in E. huxleyi Ib than in the other two haplogroups (Figure 8C). Both Z (Figure 8D) and Topt (Supplementary Figure 16) were significantly higher for haplogroup I compared to Ib and II. There were no differences between Ib and II. The mean difference between I and Ib was only 0.8°C, and only 0.7° between I and II.
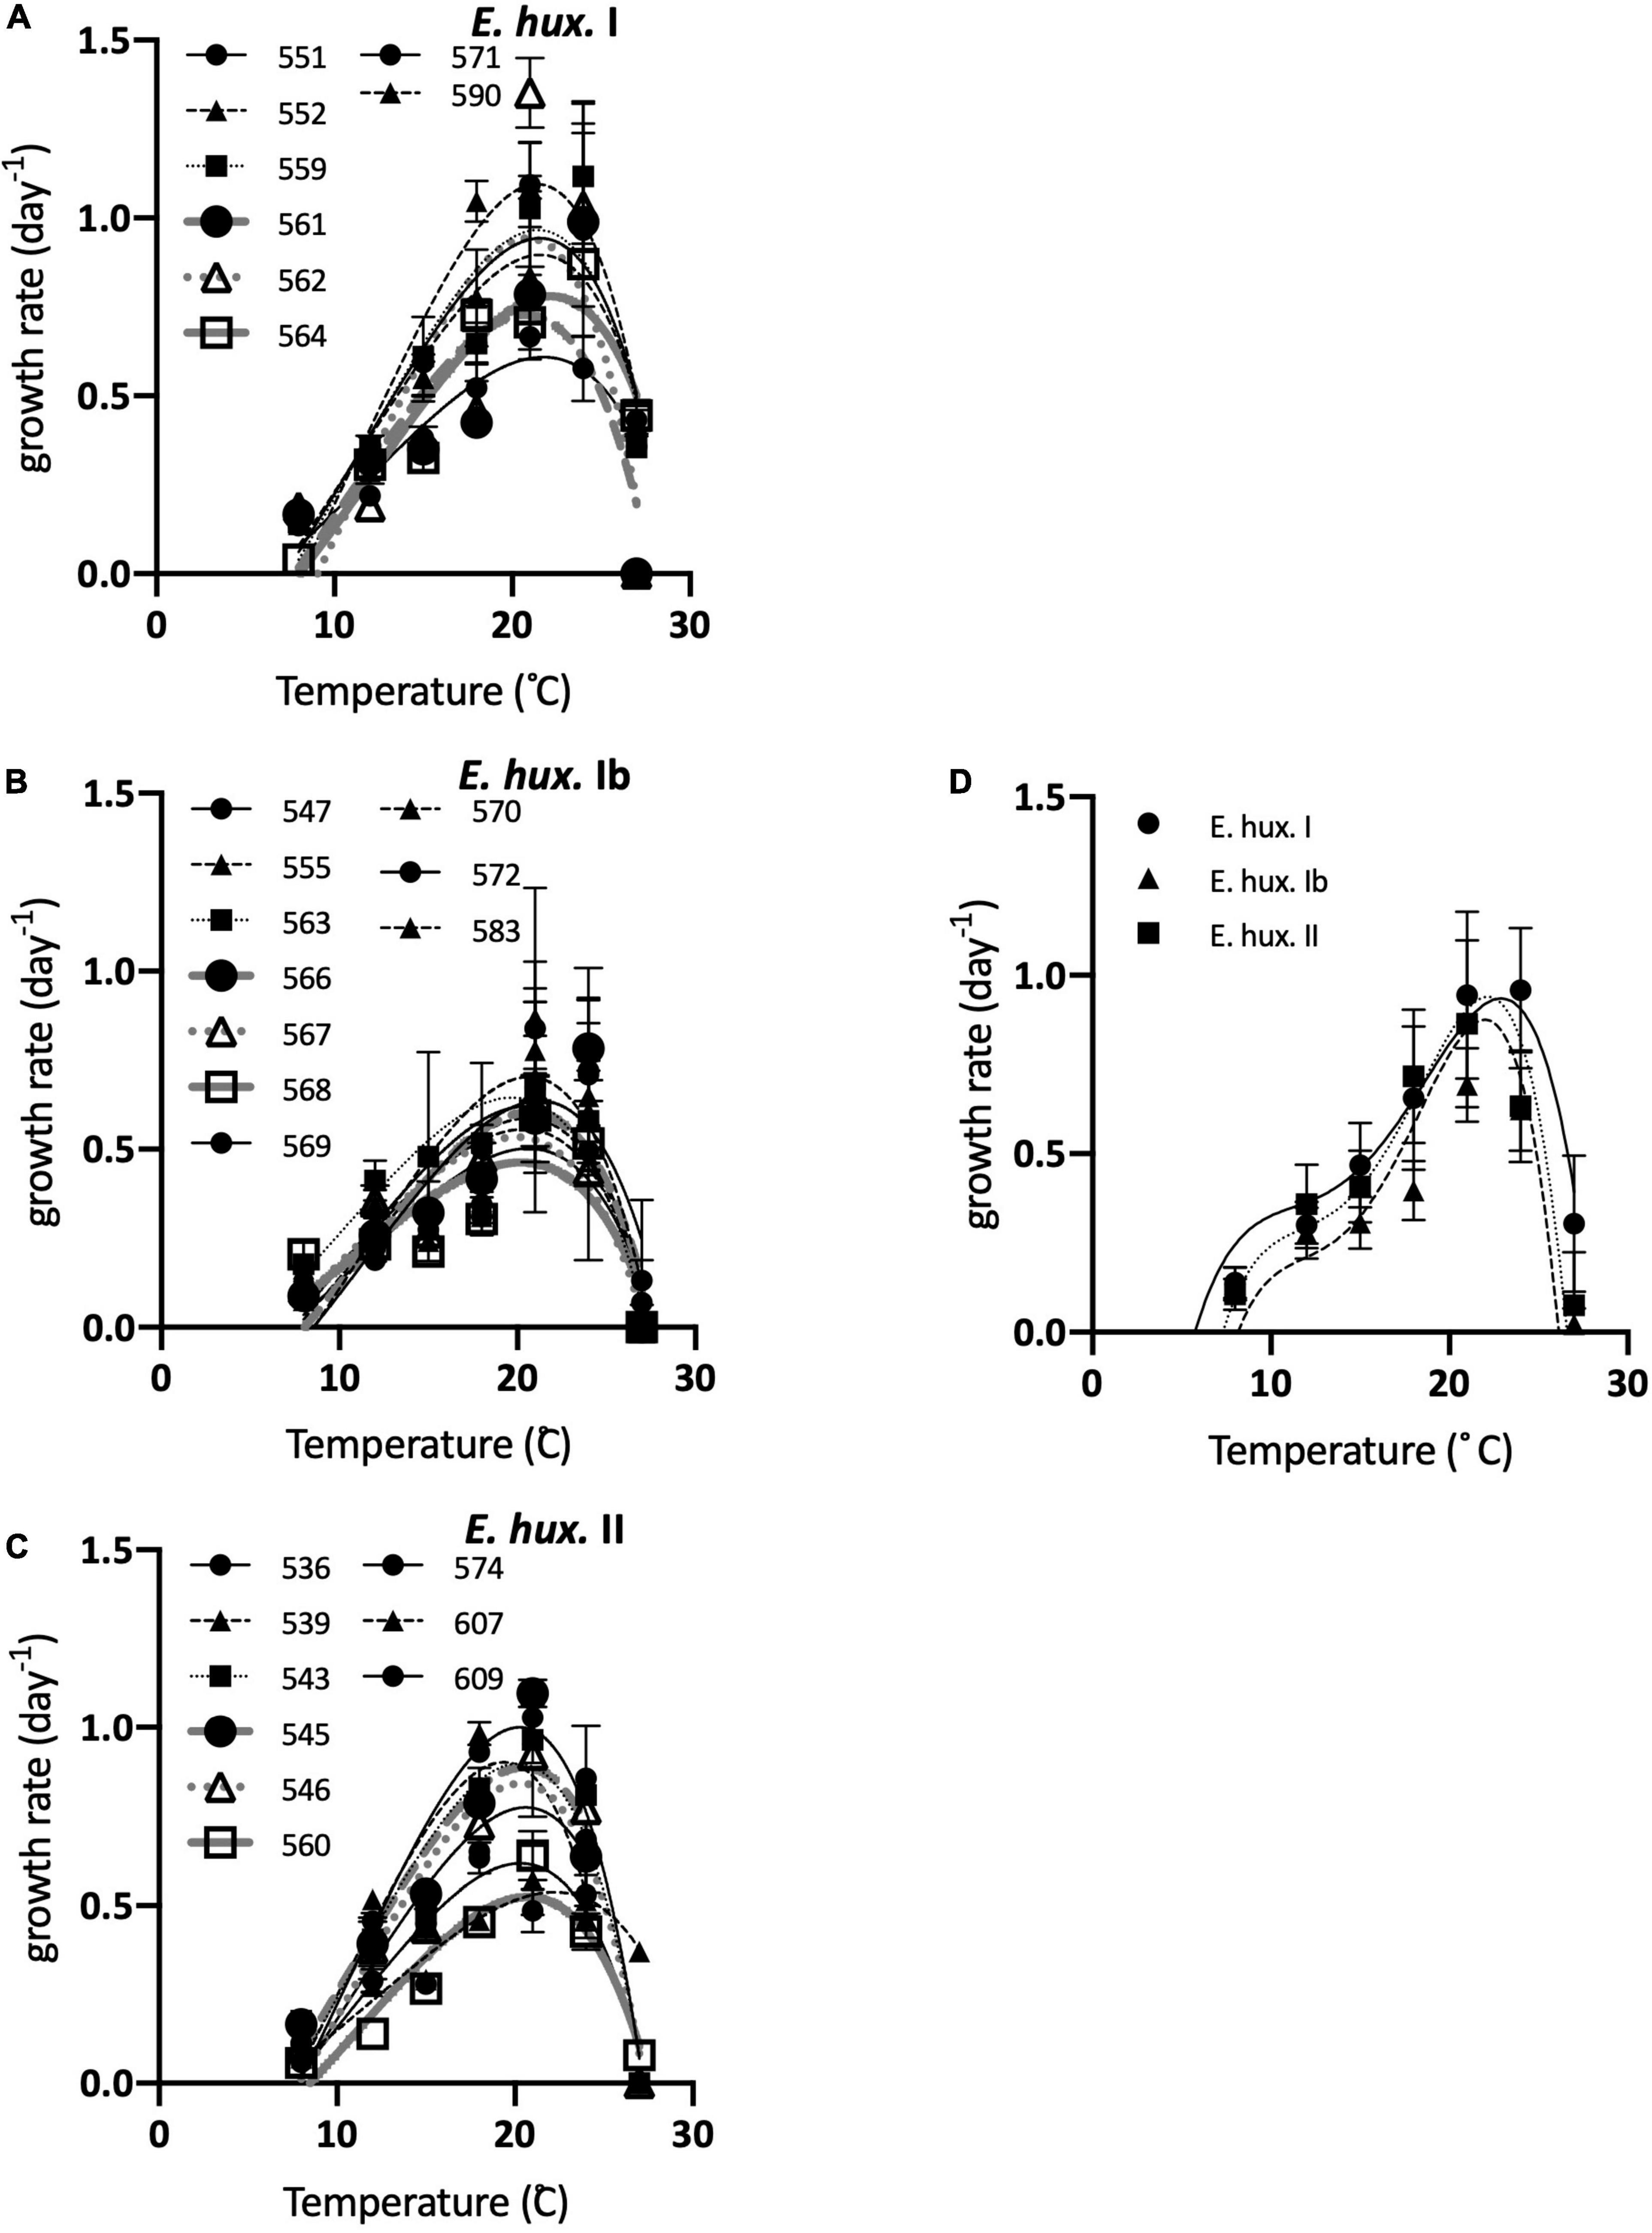
Figure 7. Thermal performance curves for growth for all strains in Experiment 2, with the corresponding fits to the Norberg equation overlaid. (A) Haplogroup I. (B) Haplogroup Ib (C) Haplogroups II. (D) The corresponding average TMV curves overlaying the haplogroup-specific average values of growth rate at each temperature (solid line is haplogroup I, dashed line is haplogroup Ib, dotted line is haplogroup 2).
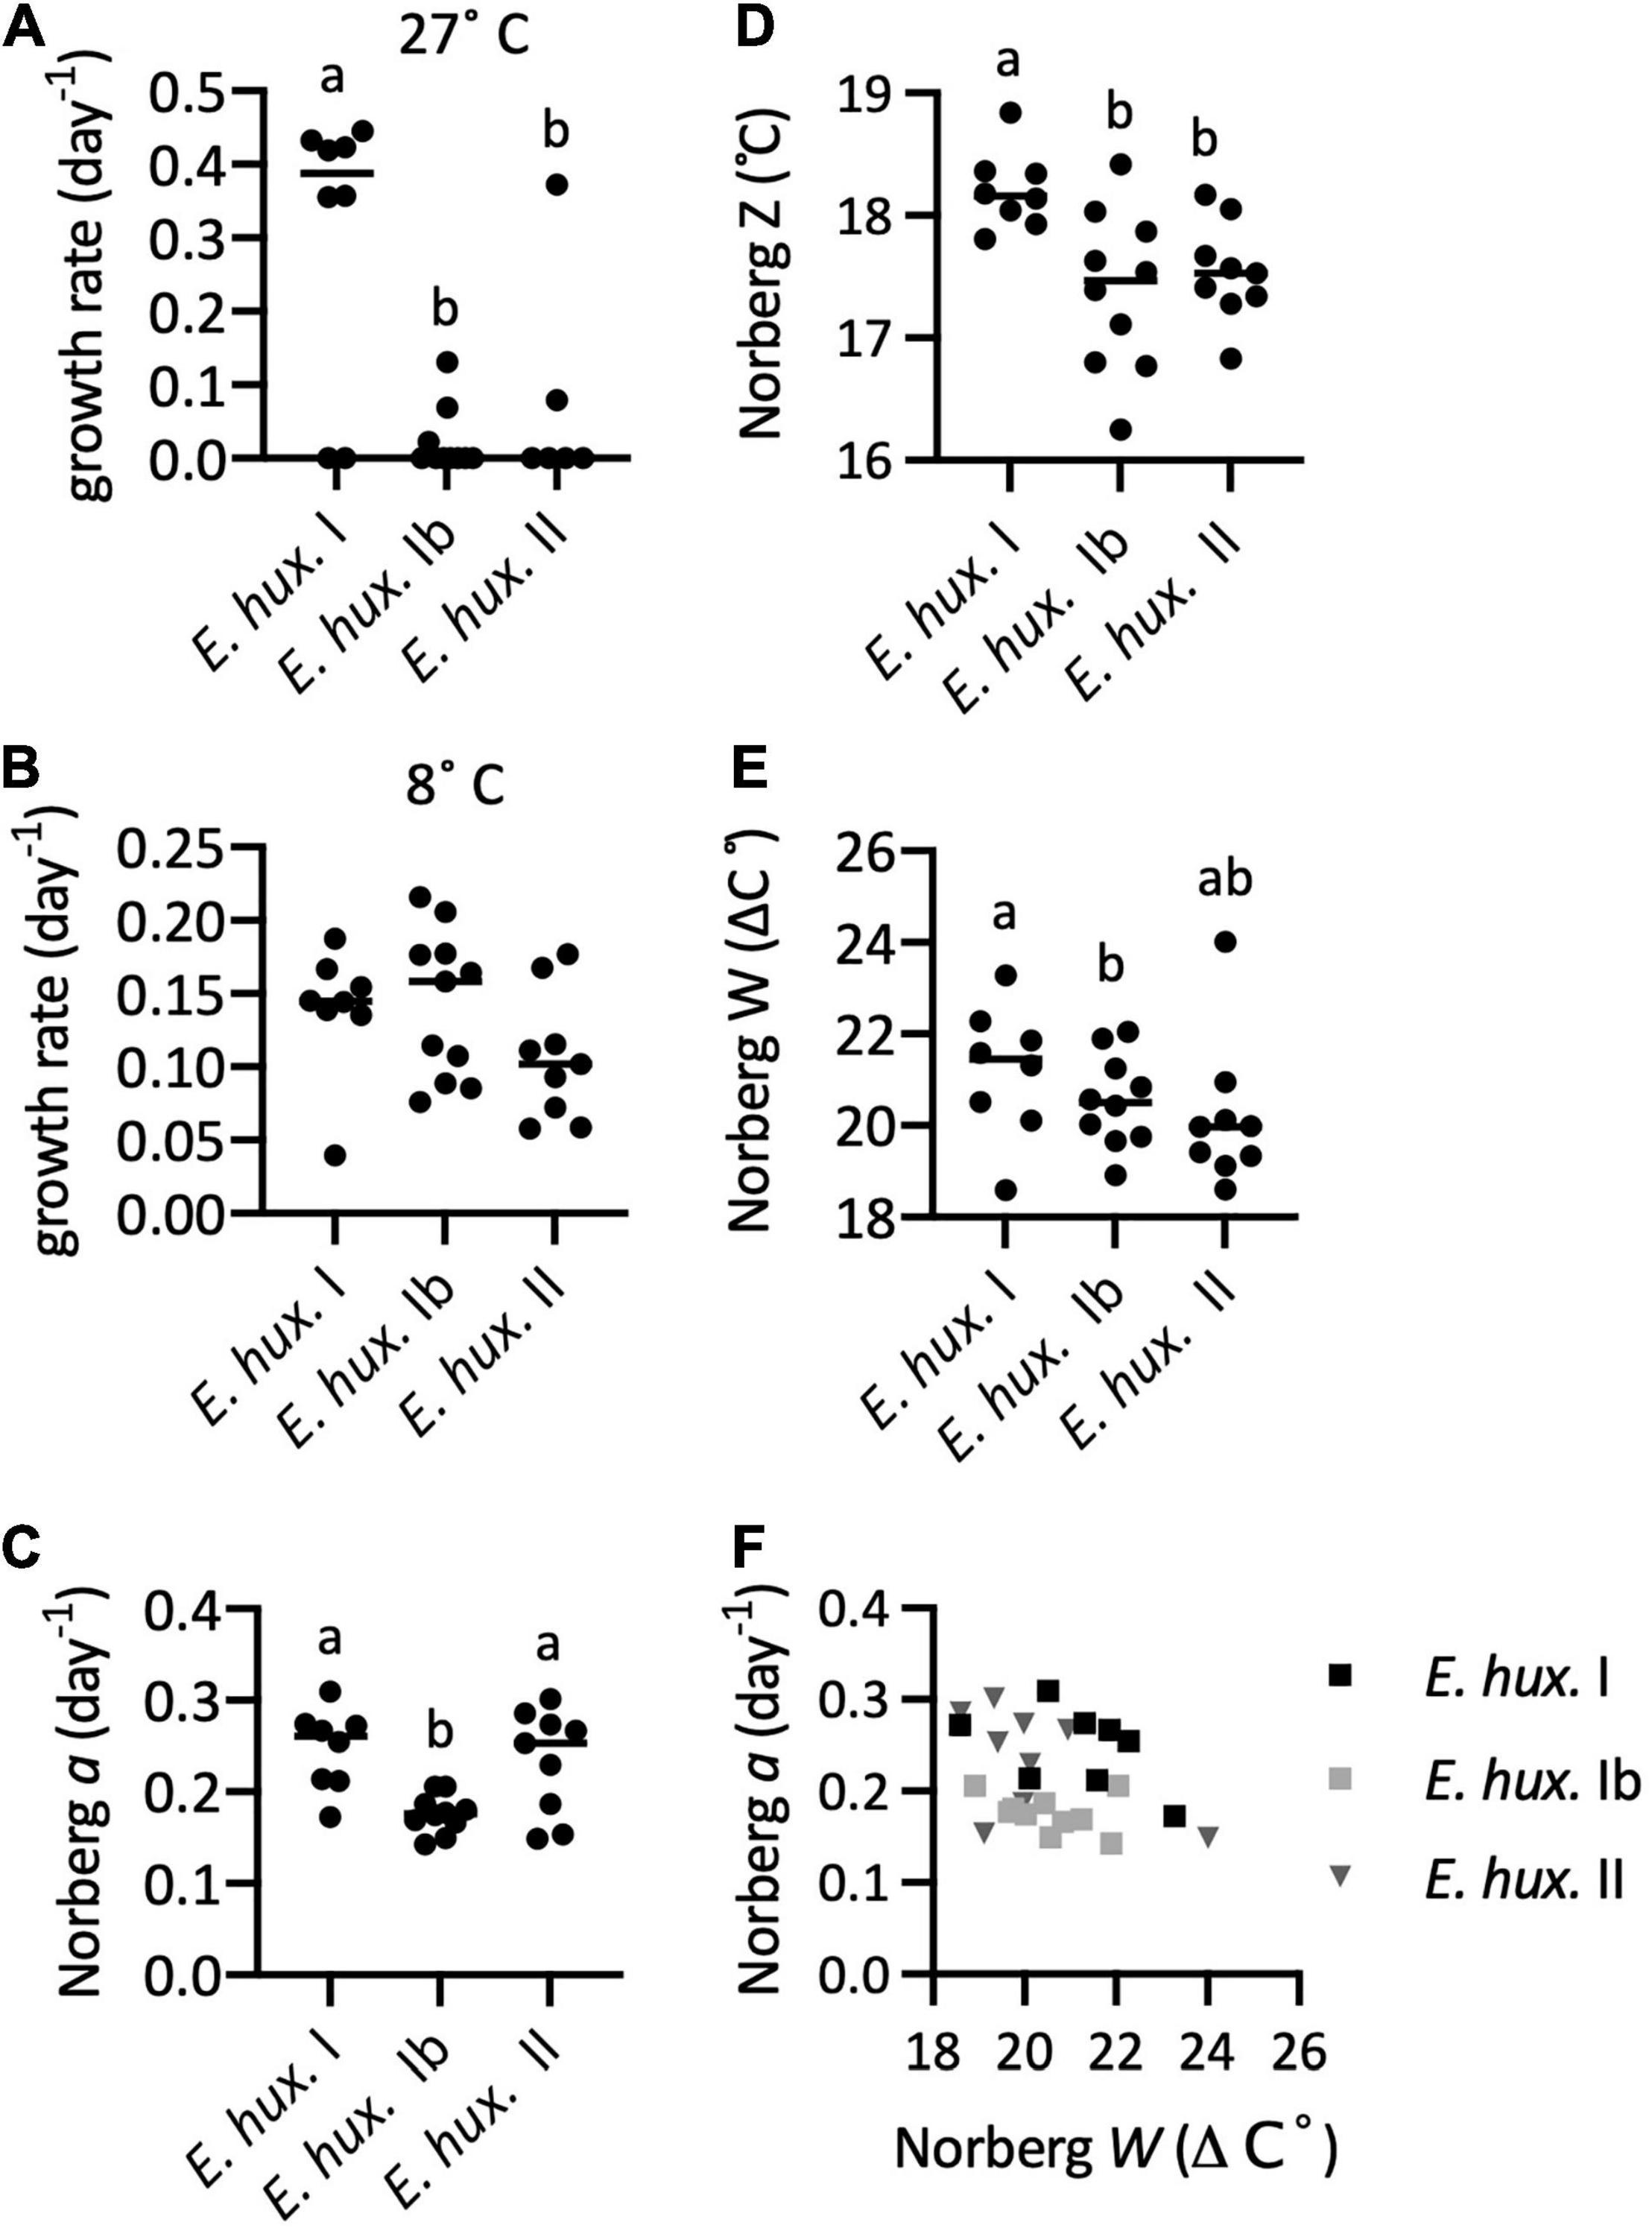
Figure 8. Thermal reaction norms calculated from TPCs in Experiment 2. (A) Growth rate at 27°C. (B) Growth rate at 8°C. (C–E) Reaction norms from Norberg fit. (C) The Norberg a performance (height) parameter. (D) Norberg Z (competitive optimum temperature). (E) Norberg niche width W. (F) Norberg growth (height) a vs width W for Experiment 2.
Haplogroup I had a higher average W from the Norberg fits (Figure 8E), but the difference was not significant. The w parameter from TMV analysis also tended to be largest in haplogroup I, and the difference was significant in the comparison with haplogroup Ib (Supplementary Figure 16C). This tendency was also interpreted when numerically estimating the full width at half max (FWHM) from the individual TMV curves (Supplementary Figure 16E). There were no significant trends in the Norberg height a vs. width W, either within haplogroups or considering all together (Figure 8F).
This study greatly increased the total number of E. huxleyi strains from which mitochondrial and plastid phylogenies are available. This permitted confirming the previously documented latitudinal pattern at global and regional scales, including both the Northern and Southern hemisphere, and it permitted testing whether the thermal associations of haplogroups hold within the dynamics at a regional scale. The culture-dependent approach allowed us to address how well mitochondrial haplogroups associate with chloroplast haplogroups as well as morphotypes. Most importantly, we could directly test hypotheses about whether thermal reaction norms for growth determine oceanographic distributions either among E. huxleyi and its closest relatives or with E. huxleyi, among mitochondrial haplogroups. We discuss each of these points in detail below.
The mitochondrial phylogenies generated in this study, both of cox1 and cox3 sequences separately and of concatenated cox1–3, were largely consistent with expectations from previous published mitochondrial phylogenies of the Emiliania-Gephyrocapsa complex (Hagino et al., 2011; Bendif et al., 2014, 2016). However, with the inclusion of a larger number of strains we detected a new mitochondrial sub-clade not observed in previously studies. We assigned this new clade as haplogroup Ib. Its phylogenetic association with haplogroup I was supported by the ABGD analysis of concatenated cox1–cox3 sequences in network analysis, which divided mitochondrial sequences into either three or four clades. When cox1–cox3 sequences were divided into only three clades, haplogroup Ib was within the clade of haplogroup I. Trees constructed by both Maximum Likelihood and Bayesian Inference also placed Ib as basal to haplogroup I, although with only moderate support, and the posterior probability for this placement in Bayesian Inference was low (0.75). Haplogroup Ib has not yet been observed in any strains isolated outside of Chilean coastal waters, and all but one of the Ib strains were isolated during or soon after the strong 2015–2016 El Niño event, when Ib was very common among strains isolated from 30° S and 27° S.
The culture-based approach here also allowed comparing mitochondrial and chloroplast phylogenies in a substantial set of strains. We were expecting to find a more complex relationship of mitochondrial (cox) and chloroplast (tufA) haplogroups based on the incongruence reported between organellar phylogenies (Bendif et al., 2016). Distinct mitochondrial haplogroups of E. huxleyi are expected to be able to interbreed or at least to have done so in the recent past, based on a phylogenomic study suggesting extensive mixing among nuclear genomes (Filatov, 2019), as well as the occurrence of strains where mitochondrial and chloroplast haplogroups contrast. However, such inter-organelle phylogenetic incongruence turned out to be rare in the E. huxleyi strains from the SE Pacific analyzed here. Patterns of organellar inheritance are not known in these organisms, so the pattern might imply inheritance of both organelles is preferentially from one parent following syngamy, or perhaps also a degree of post-zygotic cytonuclear incompatibility (Willett, 2011) could be important.
The fact that mitochondrial and chloroplast haplogroups mostly coincided permitted important simplifications in analysis with respect to environmental data and in experimental design. For example, as no strains exhibited cox haplogroup I with tufA haplogroup II, and only 1 strain (less than 1%) exhibited cox haplogroup II with tufA haplogroup I (Table 2), it was not possible or necessary to include such combinations in the experimental determination of thermal reaction norms.
There was only a partial correspondence between morphotype and haplogroup. All haplogroups exhibited morphotypes classed in the broader B morphotype class, although we did not attempt here to distinguish among B, B/C, C, and O in this class. Distinct A morphotypes are distinguished more easily, based on whether the distal shield central area is uncovered (the original A morphotype), or covered/closed by over-calcification (here termed A-CC) or whether the distal shield elements are fused (von Dassow et al., 2018; Díaz-Rosas et al., 2021). This last is considered to be a variant of the R morphotype (Beaufort et al., 2011), but which we term HC/R to indicate that the strains from this region have a tendency for variable overgrowth of the central area (von Dassow et al., 2018; Díaz-Rosas et al., 2021), a character distinct from the original description of the R morphotype (Young et al., 2003). All of these morphotypes contained both haplogroups I and II. The original study defining mitochondrial haplotypes in E. huxleyi found the R morphotypes only in haplogroup I (Hagino et al., 2011), but the HC/R morphotypes from Chilean waters were preferentially group II. Morphotype is likely nuclear-determined, and is tightly associated with the nuclear GPA gene that produces a protein related to coccolith-associated polysaccharides (Schroeder et al., 2005), however, morphotype and associated genetic polymorphisms in GPA do not correspond to microsatellite population genetics (Krueger-Hadfield et al., 2014), suggesting different morphotypes may interbreed. The imperfect correspondence between morphotypes and mitochondrial haplogroups observed here thus might also support the possibility of nuclear genetic exchange among E. huxleyi organelle haplogroups.
The global latitudinal pattern previously reported in E. huxleyi mitochondrial haplogroups was also reflected at the regional scale. The association of E. huxleyi II with decreasing SST, both on a global scale (using reconstructed SST) and on the regional and local scale (using direct SST measures), were consistent with temperature explaining the observed latitudinal patterns. However, the multinomial regression also detected significant associations with SSS and with distance from the coast in the global analysis. A caution is that salinity also shows a strong latitudinal gradient globally. Also, a large number of the E. huxleyi I cox1 or cox3 sequences are from the high salinity Mediterranean, but only one Mediterranean E. huxleyi strain was assigned as haplogroup II, and the strain origins that are farthest from continental shelves are in tropical and subtropical waters (with higher temperatures and salinities). Nevertheless, a statistically significant relationship with salinity was also suggested at the local scale, from direct measurements of salinity among samples collected near 30° S. Indeed, strain-specific variability in reaction norms with respect to salinity has been demonstrated (Gebühr et al., 2021). Temperature and salinity are the conservative tracers of water masses, and so other physiologically and ecologically important variables, such as nutrients or total chlorophyll, also tend to co-vary with temperature, salinity, and distance from the coast. This emphasizes the value in experimentally determining whether physiological reaction norms in fact are consistent with patterns of specific environmental parameters at ecological scales.
The environmental associations of the new haplogroup Ib are not yet clear. So far, it has only been identified from coastal waters of central Chile. It was almost exclusively observed during and immediately after an intense El Niño, when the northern Chilean coast typically experiences a tendency for deepening of the thermocline and warmer, more saline waters (Escribano et al., 2004; Aguilera et al., 2020). Measured SST at 30° S in Nov. 2015, when haplogroup Ib was most important, was 15.8°C, 1.7°C higher than the temperature in Nov. 2012, and 3.2°C higher than the average measured in Oct. 2011 (Supplementary File 2), but it was also prevalent at the end of Aug. 2016 when cooler temperatures were present, and was not found to the north in warmer waters. Continued sampling effort, both regionally and globally and using both cultures and culture-independent methods, would be necessary to determine the geographic distribution and oceanographic preferences of this clade.
Thermal reaction norms (or at least thermal performance curves for growth, when norms were not calculated) have previously been reported for two species studied here, including a total of 17 strains of E. huxleyi (Conte et al., 1998; Buitenhuis et al., 2008; Zhang et al., 2014; Listmann et al., 2016; Wang et al., 2019) and two strains of G. oceanica (Conte et al., 1998; Buitenhuis et al., 2008). The previous studies that included G. oceanica showed it to be less cold-tolerant than E. huxleyi, but did not permit estimating Topt as determined here. In the present study, E. huxleyi strains exhibited similar thermal reaction norms to those previously reported for this species, with the exception of one strain from the SW Indian ocean previously reported to show relative cold-intolerance and two strains from subpolar waters reported to show a much lower Topt, both by Conte et al. (1998). To these species we add data from G. muellerae and G. parvula/ericsonii, two species that were only recently isolated into culture.
Hypothesis 1, the possible role for ocean temperature in determining distributions among the different species in the Emiliania-Gephyrocapsa genus, was supported by the thermal reaction norms measured in the laboratory. The species restricted to cooler waters, G. muellerae, very clearly had lower temperature thermal reaction norms, both in terms of optimal temperatures and thermal limits for growth (although one of the three strains barely grew at 8°C). Consistent with their geographic distributions, the six strains of G. oceanica tended to show the highest optimal temperatures and thermal limits, closely followed by the five G. parvula/ericsonii strains. Finally, the norms for E. huxleyi were well above the norms for G. muellerae and overlapped with the lower end of the ranges exhibited by G. parvula/ericsonii and G. oceanica. Although the differences in thermal optima (both Norberg Z, the competitive optima, and Topt) between G. parvula/ericsonii and E. huxleyi were not significant, all E. huxleyi tested in both experiments could grow at 8°C whereas none of the G. parvula/ericsonii could grow at that temperature, supporting that G. parvula/ericsonii is less cold-tolerant.
The competitive optimum temperature Z related linearly with the SST of origin among the Emiliania/Gephyrocapsa species. However, the slope was less than 1. This may reflect the larger trend among phytoplankton to exhibit higher optimum temperatures for growth than their temperature of origin except at the highest temperatures (Thomas et al., 2012). We caution that the pattern observed might be modified if there is adaptation in the lab to temperatures at which cultures are maintained prior to experiments. Nevertheless, we did not observe trends of Z or difference of Z and SST of origin vs. time in culture either within each E. huxleyi haplogroup or among the G. oceanica strains. The recent study of Anderson and Rynearson (2020) did not find a relationship between thermal optima for growth and isolation temperature among isolates of the diatom genus Skeletonema, despite a wider range of isolation temperatures (0 to 20°C). That difference might partly be explained by the fact that Skeletonema is a neritic species, and that earlier study focused on strains isolated from the Narraganset Bay. Such neritic organisms may be retained within in the bay and exposed through the year to much greater changes in temperature than coccolithophores in the Emiliania/Gephyrocapsa genus with a more oceanic habitat and no known benthic resting stages.
To avoid local adaptation complicating the ability to detect differences among haplogroups, all but two strains tested in the Experiment 2 were from the same water sample (and the observed differences held when those two strains were excluded). Even in the same water sample, cells may have different histories, particularly in zones of intense upwelling where there is mixing of different water masses. We minimized this effect by focusing on a water sample that was well away from strong upwelling centers. The three strongest centers of upwelling along the Chilean coast are at 37° S, 30° S, and 23° S, with several weaker upwelling centers between 37° S and 30° S and at 29° S (Thiel et al., 2007), and the site at 27°S was therefore well away from these. We also attempted to minimize the possible effects of in-culture evolution on thermal reaction norms as TPCs were fully completed within 18 months of isolation for all the E huxleyi strains used in the second test.
The results presented weak support for Hypothesis 2: Among E. huxleyi haplogroups, the thermal reaction norms of haplogroups I and II exhibited significant differences of the expected directions only in the strains isolated in the same 2 week period and tested within 18 months of isolation. In this set, haplogroup II tended to show cold-shifted thermal reaction norms compared to haplogroup I, whether in terms of temperature of maximum growth Topt, the competitive optimal temperature (Norberg’s Z), or in growth at 27°C (but not in growth at 8°C).
Despite the phylogenetic association of E. huxleyi haplogroup Ib with haplogroup I, its thermal reaction norms were cold-shifted to be similar to haplogroup II in the second experiment. Although the environmental distribution of Ib remains to be defined, the narrower (more specialist) thermal reaction norms of this haplogroup suggests a more specialist type, which might explain its more sporadic occurrence and apparently more restricted distribution compared to E. huxleyi I and II.
The differences among E. huxleyi I, Ib and II in Experiment 2 were relatively small, on the order of 1°C. The differences were similar to the intra-specific differences in thermal optima reported in planktonic diatoms such as Skeletonema marinoi, S. pseudocostatum, and Thalassiosira rotula (Boyd et al., 2013; Anderson and Rynearson, 2020), but are much smaller than those reported within T. pseudonana or the dinoflagellate Akashiwo sanguinea (Boyd et al., 2013). In the study of E. huxleyi strains isolated from Bergen and the Azores, a 22 degree latitudinal difference, corresponding to a 6.3°C difference in maximum monthly mean temperature or a 9.6°C difference in minimum monthly temperatures, the mean difference among populations was only 1.1°C (Zhang et al., 2014). A higher difference was reported for strains from the Indian Ocean compared to subpolar North Atlantic and North Pacific (Conte et al., 1998). Clonal selection under asexual reproduction in the lab was reported to result in a 0.7°C shift in thermal optima in E. huxleyi within 1200 asexual generations (Listmann et al., 2016). In that study the selection temperature used, 26°C, was near the thermal limits and well outside the range of the environment from which that original strain was isolated (Bergen). Similarly, in the diatom T. pseudonana, selection at 31°C (vs. 16°C) was reported to drive a nearly 2°C change in Topt within 450 asexual generations (O’Donnell et al., 2018). Both of those evolution experiments imposed a very strong and constant selective pressure, both in terms of an extreme selection temperature and for maximizing growth rates (high r-selection) compared to that expected in nature, where temperatures are lower and selection for maximum growth rate (over other traits) is unlikely to be constant. Nevertheless, this emphasizes how small were the differences determined in this study among E. huxleyi haplogroups.
The lack of difference between E. huxleyi haplogroups I and II in the first experiment is unlikely to only reflect in-culture evolution, even though the strains used had been in culture for 3–4 years by the time the preliminary experiments had started, and up to nearly 6 years when completed. Any in-culture evolution was not enough to have abolished the larger differences observed among species, where it was necessary to compare strains isolated in many different years (and including with time in other culture collections), and the single haplogroup Ib strain from 2011 that was included in the first test showed lower temperature thermal reaction norms, similar to Ib strains from 2015. Also, Conte et al. (1998) observed larger differences among five E. huxleyi despite many years in culture. At regional scales, temperature and salinity correlate as conservative properties of water masses (for the case of the Southeast Pacific, see, e.g., Silva et al., 2009), which also can determine or be correlated with variables such as nutrients or mixed layer depth, which may in turn influence productivity and biomass. It is possible that perhaps adaptation to these other variables, or the interaction of one or more these variables with temperature, might also influence E. huxleyi mitochondrial haplogroup distributions. For example, variations among E. huxleyi strains have been seen in reaction norms to salinity (Paasche, 2001; Gebühr et al., 2021) and in utilization of different N-sources (Strom and Bright, 2009).
Another intriguing possibility is that thermal adaptation is important, but there is nuclear gene flow between mitochondrial haplogroups I and II within E. huxleyi, as discussed above. Although the mitochondrial genome might contribute to thermal adaptation in other eukaryotes (Baker et al., 2019), the results suggest that the dominant control is nuclear-encoded in Emiliania-Gephyrocapsa. In that case, the present latitudinal distributions of the haplogroups might represent a historical association between organelle haplogroups and thermal adaptations, perhaps dating from earlier introgression events between E. huxleyi and other Gephyrocapsa species as hypothesized by Bendif et al. (2016). In regions where the haplogroups overlap, exchange of nuclear genes among E. huxleyi as well as local adaptation might then be erasing the association of organellar history with thermal traits.
Generalists are species which can occupy broad niches (diverse habitats) while specialists occupy more narrow niches, which may reflect wider or narrower physiological tolerance ranges, respectively (Futuyma and Moreno, 1988; Sriswasdi et al., 2017). Based on the wide geographical distribution of E. huxleyi (Paasche, 2001; Winter et al., 2014) and the much more restricted distributions of its closest relatives (Gephyrocapsa) in the present ocean (McIntyre et al., 1970; Bollmann and Klaas, 2008), E. huxleyi would be considered a generalist while the Gephyrocapsa may be specialists. Although it is only one of the multiple abiotic and biotic dimensions over which niches are defined (Colwell and Rangel, 2009), temperature is a dominant variable controlling biochemistry and physiology so is expected to be fundamental in the distributions of organisms, ranging from microorganisms to ectothermic vertebrates (Eppley, 1972; Angilletta et al., 2003; Norberg, 2004; Logan and Cox, 2020). One of the principal classes of evolutionary trade-offs considered to underly species distributions is the generalist-vs.-specialist trade-off, and it has long been expected that this trade-off should be apparent as an inverse relationship between the height and width of thermal performance curves (Angilletta et al., 2003; Izem and Kingsolver, 2005; Buckley and Kingsolver, 2021). The width of the thermal niche has been speculated to play a key role in phytoplankton distributions (Boyd et al., 2013).
Some support was provided for Hypothesis 3 (wider thermal niche of E. huxleyi explaining its broader latitudinal distribution): Haplogroup I of E. huxleyi did exhibit a broader thermal (fundamental) niche in the laboratory in comparison to the Gephyrocapsa species and has the widest latitudinal range compared to the other E. huxleyi haplogroups and the other species. Nevertheless, the newly detected mitochondrial clade Ib of E. huxleyi exhibited a narrower thermal niche in both experiments (although only a single strain was available in the first experiment), and so far it has been identified only between 30 °S and 27 °S on the Chilean coast. Also, although all the E. huxleyi strains reported here (as well as in most other studies) grew at 8°C, Conte et al. (1998) reported that a strain from the SW Indian Ocean could not grow at 9°C, while strains from the subpolar Pacific and from Norway had an apparent Topt below 20°C and lower thermal tolerance compared to other E. huxleyi. That shows that some E. huxleyi strains can exhibit thermal reaction norms outside the ranges observed here and in the other studies cited, so regional thermal adaptation also contributes to the broad distribution of E. huxleyi. Likewise, some E. huxleyi, such as haplogroup Ib, do exhibit narrower thermal niche breadths. Thus, the broad latitudinal distribution of E. huxleyi can partly be explained by such thermal reaction norm variation within the species (Hypothesis 4).
There was no significant tendency for strains or species with narrower thermal performance curves (or narrower tolerances) to have higher maximum growth rates, either as absolute maximum growth rates (in units of 1/time), or normalized to the Eppley Curve to adjust for the fact that the highest possible maximum growth rates are expected to be higher at higher temperatures in the range of interest here (Eppley, 1972). Previous studies comparing phytoplankton thermal reaction norms across broad phylogenetic groups have also not detected such a relationship (Thomas et al., 2012; Boyd et al., 2013; Anderson and Rynearson, 2020). In part, it may be difficult to estimate well the width parameters (or difference between critical minimum and maximum temperatures), as discussed by Boyd et al. (2013). Nevertheless, as several studies have not detected such a tradeoff, temperature and thermal reaction norms alone may not be sufficient to explain wider or narrower species distributions in phytoplankton. Physiologically, interactions among temperature and other parameters such as salinity, light, nutrients or CO2 might be important (Feng et al., 2008). Analysis of distributions of E. huxleyi morphotypes and related Gephyrocapsa species in the Southeast Pacific showed that realized niches could be wide with respect to some parameters (e.g., pH and pCO2) but narrow with respect to others (e.g., temperature, salinity, and calcite saturation state) (Díaz-Rosas et al., 2021). Variable temperatures can negatively affect growth rate (Wang et al., 2019) and might be more important as a driver of adaptation in nature. Thus, although we did not detect a generalist-specialist trade-off in lab tests of reaction norms to a single parameter, such a trade-off in a multidimensional niche space might still be necessary to explain why there were times and locations where specialists appeared dominant, e.g., E. huxleyi haplogroup Ib at 27° S in 2015 (this study) or G. parvula at 20.7° S in 2013 (Bendif et al., 2016).
As the global ocean warms, the habitat thermally permissive for G. oceanica and G. parvula/ericsonii is expected to expand poleward. In the case of G. oceanica, its thermal optima are near or even below the SST at the warmer end of its range, so the low latitude end of its range should also move poleward. Gephyrocapsa parvula/ericsonii may partially follow the border of the South Pacific Gyre (McIntyre et al., 1970; Bollmann and Klaas, 2008), and this gyre is becoming larger (Polovina et al., 2008). In the case of G. muellerae, Eastern boundaries of ocean basins may experience intensification of upwelling-favorable coastal winds, resulting in lower temperatures (Sydeman et al., 2014), a phenomenon documented to be occurring in the Southeast Pacific (e.g., Schneider et al., 2017). This latter process might permit G. muellerae to maintain or even extend its range equatorward, confined to the narrow coastal zone with cooler upwelling water, while this trend continues. Nevertheless, in these waters, G. muellerae appears to exist in lower abundance compared to E. huxleyi (Díaz-Rosas et al., 2021). Overall, E. huxleyi behaves as a generalist and is capable of rapid adaptation, and the lack of evidence for strong differentiation in thermal niches between haplogroups suggest that gene flow may be high among E. huxleyi when populations with different adaptations mix. Thus, E. huxleyi might be expected to increase its dominance over its close relatives in the changing ocean.
Thermal reaction norms in culture did reflect the environmental distributions among closely related species of the Emiliania/Gephyrocapsa complex. Average thermal optima and tolerances, in order from coolest tolerant to warmest tolerant, were: G. muellerae, E. huxleyi, G. parvula/ericsonii, and G. oceanica, matching the reported environmental distributions of these species. However, within E. huxleyi, although the direction of the difference in thermal optima between haplogroups I and II matched the prediction, the effect was very small. Present differences in thermal reaction norms might not be sufficient to explain the differences in latitudinal distributions of organellar haplogroups within E. huxleyi. The cosmopolitan distribution of E. huxleyi appears to reflect that it contains both generalist (e.g., cox haplogroup I) and specialist (e.g., cox haplogroup Ib) types. No trade-off was detected between thermal niche width and maximum performance at optimal temperatures, but types with narrower thermal niches (thermal specialists) were occasionally more abundant compared to thermal generalists in some samples.
The sequences generated in this study have been deposited in GenBank and the accession numbers are available inthe Supplementary Material. The strains are in public algal culture collections (Roscoff Culture Collection inFrance and South East Pacific Algae in Chile) as indicated in Supplementary Files 1, 3.
PD designed and led the study, performed curve fitting and statistical analysis, performed morphological classification from scanning electron microscopy images, and wrote the manuscript. SP performed sequencing of cox1, cox3, and tufA markers as well as initial genetic analysis, as well as electron microscopy and morphological classification of strains collected in 2016. SA-S performed final phylogenetic analysis (ML and Bayesian trees, ABGD). EV-S performed initial TPC trials and testing of growth in flasks vs. tubes. PM performed TPC curves and initial curve fitting and statistical analysis. All authors contributed to the article and approved the submitted version.
The authors declare that the research was conducted in the absence of any commercial or financial relationships that could be construed as a potential conflict of interest.
All claims expressed in this article are solely those of the authors and do not necessarily represent those of their affiliated organizations, or those of the publisher, the editors and the reviewers. Any product that may be evaluated in this article, or claim that may be made by its manufacturer, is not guaranteed or endorsed by the publisher.
Funding was provided by the Agencia Nacional de Investigación y Desarrollo (Ministerio de Ciencia, Tecnología, Conocimiento, e Innovación, Chile) through grants FONDECYT 1141106, FONDECYT 1181614, and the Millennium Institute of Oceanography (ICN12_019-IMO). Additional funding (travel of SP and electron microscopy and sequencing of E. huxleyi strains collected in 2016) was provided by the Centre National de la Recherche Scientifique (France) through IRL 3614. FONDEQUIP EQM130267 provided funds for the purchase of the InFlux Cell Sorter. Some of the SEM work was performed in the CIEN-UC facility funded by Proyecto Fondequip EQM150101.
We thank V. Flores for processing many of the SEM samples and personnel of the SEPA collection for provision of or acquisition of biological resources (strains) used in this work. We also thank M. Valero for helpful comments on a draft of the manuscript. We graciously acknowledge the support of I. Probert and the RCC for providing strains, as well as the RCC website for information on origins of strains in the RCC.
The Supplementary Material for this article can be found online at: https://www.frontiersin.org/articles/10.3389/fmars.2021.785763/full#supplementary-material
Supplementary File 1 | Excel file relating the primary strain ID, alias (e.g., synonymous strain id), origin (site identifier used in Supplementary File 2, latitude, longitude), date, gene identifications, and cox and tufA haplotypes and haplogroups.
Supplementary File 2 | Excel file indicating sites or origin for which strains (or strain sequences) used in this study, as well as minimum distance from mainland coast, reconstructed SST, SSS, MLD (from MULTIOBS_GLO_PHY_TSUV_3D_MYNRT_015_012 product) and, when available, direct measurements of SST and SSS. (Excel format).
Supplementary File 3 | Excel file indicating strains from the Chilean collection deposited in the Roscoff Culture Collection, with corresponding RCC designation. Possible duplicates are indicated.
Supplementary File 4 | Excel file giving for each experiment, the average growth rates followed in the next column by standard deviations for each strain at each temperature. For many cases where the final growth rate is 0, there is no standard deviation registered because there ws insufficient biomass from the acclimation cultures (as they did not grow) to inoculate replicate experimental cultures.
Aguilera, V. M., Vargas, C. A., and Dewitte, B. (2020). Intraseasonal hydrographic variations and nearshore carbonates system off Northern Chile during the 2015 El Niño event. J. Geophys. Res. Biogeosci. 125:e2020JG005704. doi: 10.1029/2020JG005704
Anderson, S. I., and Rynearson, T. A. (2020). Variability approaching the thermal limits can drive diatom community dynamics. Limnol. Oceanogr. 65, 1961–1973. doi: 10.1002/lno.11430
Angilletta, M. J., Wilson, R. S., Navas, C. A., and James, R. S. (2003). Tradeoffs and the evolution of thermal reaction norms. Trends Ecol. Evol. 18, 234–240. doi: 10.1016/S0169-5347(03)00087-9
Baker, E. P., Peris, D., Moriarty, R. V., Li, X. C., Fay, J. C., and Hittinger, C. T. (2019). Mitochondrial DNA and temperature tolerance in lager yeasts. Sci. Adv. 5:eaav1869. doi: 10.1126/sciadv.aav1869
Bandelt, H. J., Forster, P., and Rohl, A. (1999). Median-joining networks for inferring intraspecific phylogenies. Mol. Biol. Evol. 16, 37–48. doi: 10.1093/oxfordjournals.molbev.a026036
Beaufort, L., Probert, I., de Garidel-Thoron, T., Bendif, E. M., Ruiz-Pino, D., Metzl, N., et al. (2011). Sensitivity of coccolithophores to carbonate chemistry and ocean acidification. Nature 476, 80–83.
Bendif, E. M., Nevado, B., Wong, E. L. Y., Hagino, K., Probert, I., Young, J. R., et al. (2019). Repeated species radiations in the recent evolution of the key marine phytoplankton lineage Gephyrocapsa. Nat. Commun. 10:4234. doi: 10.1038/s41467-019-12169-7
Bendif, E. M., Probert, I., Carmichael, M., Romac, S., Hagino, K., and de Vargas, C. (2014). Genetic delineation between and within the widespread coccolithophore morpho-species Emiliania huxleyi and Gephyrocapsa oceanica (Haptophyta). J. Phycol. 50, 140–148. doi: 10.1111/jpy.12147
Bendif, E. M., Probert, I., Díaz-Rosas, F., Thomas, D., van den Engh, G., Young, J. R., et al. (2016). Recent reticulate evolution in the ecologically dominant lineage of coccolithophores. Front. Microbiol. 7:784. doi: 10.3389/fmicb.2016.00784
Bendif, E. M., Probert, I., Young, J. R., and von Dassow, P. (2015). Morphological and Phylogenetic characterization of new Gephyrocapsa Isolates suggests introgressive hybridization in the Emiliania/Gephyrocapsa complex (Haptophyta). Protist 166, 323–336. doi: 10.1016/j.protis.2015.05.003
Bollmann, J. (1997). Morphology and biogeography of Gephyrocapsa coccoliths in Holocene sediments. Mar. Micropaleontol. 29, 319–350. doi: 10.1016/S0377-8398(96)00028-X
Bollmann, J., and Klaas, C. (2008). Morphological variation of Gephyrocapsa oceanica Kamptner 1943 in plankton samples: implications for ecologic and taxonomic interpretations. Protist 159, 369–381. doi: 10.1016/j.protis.2008.02.001
Boyd, P. W., Rynearson, T. A., Armstrong, E. A., Fu, F., Hayashi, K., Hu, Z., et al. (2013). Marine phytoplankton temperature versus growth responses from polar to tropical waters – Outcome of a scientific community-wide study. PLoS One 8:e63091. doi: 10.1371/journal.pone.0063091
Brand, L. E. (1982). Genetic variability and spatial patterns of genetic differentiation in the reproductive rates of the marine coccolithophores Emiliania huxleyi and Gephyrocapsa oceanica. Limnol. Oceanogr. 27, 236–245.
Brand, L. E., Guillard, R. R. L., and Murphy, L. S. (1981). A method for the rapid and precise determination of acclimated phytoplankton reproduction rates. J. Plankton Res. 3, 193–201.
Buckley, L. B., and Kingsolver, J. G. (2021). Evolution of thermal sensitivity in changing and variable climates. Annu. Rev. Ecol. Evol. Syst. 52, 563–586. doi: 10.1146/annurev-ecolsys-011521-102856
Buitenhuis, E. T., Pangerc, T., Franklin, D. J., Le Quéré, C., and Malin, G. (2008). Growth rates of six coccolithophorid strains as a function of temperature. Limnol. Oceanogr. 53, 1181–1185. doi: 10.4319/lo.2008.53.3.1181
Camus, M. F., Wolff, J. N., Sgrò, C. M., and Dowling, D. K. (2017). Experimental support that natural selection has shaped the latitudinal distribution of mitochondrial haplotypes in Australian Drosophila melanogaster. Mol. Biol. Evol. 34, 2600–2612. doi: 10.1093/molbev/msx184
Colwell, R. K., and Rangel, T. F. (2009). Hutchinson’s duality: the once and future niche. Proc. Natl. Acad. Sci. U.S.A. 106, 19651–19658. doi: 10.1073/pnas.0901650106
Conte, M. H., Thompson, A., Lesley, D., and Harris, R. P. (1998). Genetic and physiological influences on the alkenone/alkenoate versus vrowth temperature relationship in Emiliania huxleyi and Gephyrocapsa oceanica. Geochim. Cosmochim. Acta 62, 51–68. doi: 10.1016/S0016-7037(97)00327-X
Díaz-Rosas, F., Alves-de-Souza, C., Alarcón, E., Menschel, E., González, H. E., Torres, R., et al. (2021). Abundances and morphotypes of the coccolithophore Emiliania huxleyi; in southern Patagonia compared to neighboring oceans and northern-hemisphere fjords. Biogeosciences 18, 5465–5489. doi: 10.5194/bg-2020-449
Echeveste, P., Croot, P., and von Dassow, P. (2018). Differences in the sensitivity to Cu and ligand production of coastal vs offshore strains of Emiliania huxleyi. Sci. Total Environ. 625, 1673–1680. doi: 10.1016/j.scitotenv.2017.10.050
Escribano, R., Daneri, G., Farías, L., Gallardo, V. A., González, H. E., Gutiérrez, D., et al. (2004). Biological and chemical consequences of the 1997–1998 El Niño in the Chilean coastal upwelling system: a synthesis. Deep Sea Res. II Top. Stud. Oceanogr. 51, 2389–2411. doi: 10.1016/j.dsr2.2004.08.011
Feng, Y., Roleda, M. Y., Armstrong, E., Boyd, P. W., and Hurd, C. L. (2017). Environmental controls on the growth, photosynthetic and calcification rates of a Southern Hemisphere strain of the coccolithophore Emiliania huxleyi: environmental controls on E. huxleyi physiology. Limnol. Oceanogr. 62, 519–540. doi: 10.1002/lno.10442
Feng, Y., Warner, M. E., Zhang, Y., Sun, J., Fu, F. X., Rose, J. M., et al. (2008). Interactive effects of increased pCO2, temperature and irradiance on the marine coccolithophore Emiliania huxleyi (Prymnesiophyceae). Eur. J. Phycol. 43, 87–98.
Field, C. B., Behrenfeld, M. J., Randerson, J. T., and Falkowski, P. (1998). Primary production of the biosphere: integrating terrestrial and oceanic components. Science 281, 237–240. doi: 10.1126/science.281.5374.237
Filatov, D. A. (2019). Extreme Lewontin’s Paradox in ubiquitous marine phytoplankton Species. Mol. Biol. Evol. 36, 4–14. doi: 10.1093/molbev/msy195
Futuyma, D. J., and Moreno, G. (1988). The evolution of ecological specialization. Annu. Rev. Ecol. Syst. 19, 207–233. doi: 10.1146/annurev.es.19.110188.001231
Gattuso, J.-P., Magnan, A., Billé, R., Cheung, W. W. L., Howes, E. L., Joos, F., et al. (2015). Contrasting futures for ocean and society from different anthropogenic CO2 emissions scenarios. Science 349:aac4722. doi: 10.1126/science.aac4722
Gebühr, C., Sheward, R. M., Herrle, J. O., and Bollmann, J. (2021). Strain-specific morphological response of the dominant calcifying phytoplankton species Emiliania huxleyi to salinity change. PLoS One 16:e0246745. doi: 10.1371/journal.pone.0246745
Guinehut, S., Dhomps, A.-L., Larnicol, G., and Le Traon, P.-Y. (2012). High resolution 3-D temperature and salinity fields derived from in situ and satellite observations. Ocean Sci. 8, 845–857. doi: 10.5194/os-8-845-2012
Hagino, K., Bendif, E. M., Young, J. R., Kogame, K., Probert, I., Takano, Y., et al. (2011). New evidence for morphological and genetic variation in the cosmopolitan coccolithophore Emiliania huxleyi (Prymnesiophyceae) from the COX1B ATP4 genes. J. Phycol. 47, 164–176.
Healey, A., Furtado, A., Cooper, T., and Henry, R. J. (2014). Protocol: a simple method for extracting next-generation sequencing quality genomic DNA from recalcitrant plant species. Plant Methods 10:21. doi: 10.1186/1746-4811-10-21
Hoegh-Guldberg, O., and BRJJuno, J. F. (2010). The impact of climate change on the world’s marine ecosystems. Science 328, 1523–1528. doi: 10.1126/science.1189930
Izem, R., and Kingsolver, J. G. (2005). Variation in continuous reaction norms: quantifying directions of biological interest. Am. Nat. 166, 277–289. doi: 10.1086/431314
Krueger-Hadfield, S. A., Balestreri, C., Schroeder, J., Highfield, A., Helaouët, P., Allum, J., et al. (2014). Genotyping an Emiliania huxleyi; (Prymnesiophyceae) bloom event in the North Sea reveals evidence of asexual reproduction. Biogeosciences 11, 5215–5234. doi: 10.5194/bg-11-5215-2014
Laws, E. A., Falkowski, P. G., Smith, W. O., Ducklow, H., and McCarthy, J. J. (2000). Temperature effects on export production in the open ocean. Glob. Biogeochem. Cycles 14, 1231–1246. doi: 10.1029/1999GB001229
Leigh, J. W., and Bryant, D. (2015). POPART?: full-feature software for haplotype network construction. Methods Ecol. Evol. 6, 1110–1116. doi: 10.1111/2041-210X.12410
Listmann, L., LeRoch, M., Schlüter, L., Thomas, M. K., and Reusch, T. B. H. (2016). Swift thermal reaction norm evolution in a key marine phytoplankton species. Evol. Appl. 9, 1156–1164. doi: 10.1111/eva.12362
Logan, M. L., and Cox, C. L. (2020). genetic constraints, transcriptome plasticity, and the evolutionary response to climate change. Front. Genet. 11:538226. doi: 10.3389/fgene.2020.538226
McIntyre, A., Bé, A. W. H., and Roche, M. B. (1970). Modern Pacific Coccolithophorida: a paleontological thermometer. Trans. N. Y. Acad. Sci. 32, 720–731. doi: 10.1111/j.2164-0947.1970.tb02746.x
Medlin, L. K., Barker, G. L. A., Campbell, L., Green, J. C., Hayes, P. K., Marie, D., et al. (1996). Genetic characterisation of Emiliania huxleyi (Haptophyta). J. Mar. Syst. 9, 13–31.
Meyer, J., and Riebesell, U. (2015). Reviews and syntheses: responses of coccolithophores to ocean acidification: a meta-analysis. Biogeosciences 12, 1671–1682. doi: 10.5194/bg-12-1671-2015
Mishmar, D., Ruiz-Pesini, E., Golik, P., Macaulay, V., Clark, A. G., Hosseini, S., et al. (2003). Natural selection shaped regional mtDNA variation in humans. Proc. Nat. Acad. Sci. 100, 171–176. doi: 10.1073/pnas.0136972100
Mulet, S., Rio, M.-H., Mignot, A., Guinehut, S., and Morrow, R. (2012). A new estimate of the global 3D geostrophic ocean circulation based on satellite data and in-situ measurements. Deep Sea Res. Part II Top. Stud. Oceanogr. 7, 70–81. doi: 10.1016/j.dsr2.2012.04.012
Norberg, J. (2004). Biodiversity and ecosystem functioning: a complex adaptive systems approach. Limnol. Oceanogr. 49, 1269–1277. doi: 10.4319/lo.2004.49.4_part_2.1269
O’Donnell, D. R., Hamman, C. R., Johnson, E. C., Kremer, C. T., Klausmeier, C. A., and Litchman, E. (2018). Rapid thermal adaptation in a marine diatom reveals constraints and trade-offs. Glob. Change Biol. 24, 4554–4565. doi: 10.1111/gcb.14360
Okada, H., and McIntyre, A. (1977). Modern coccolithophores of the Pacific and North Atlantic Oceans. Micropaleontology 23, 1–55. doi: 10.2307/1485309
Paasche, E. (2001). A review of the coccolithophorid Emiliania huxleyi (Prymnesiophyceae), with particular reference to growth, coccolith formation, and calcification-photosynthesis interactions. Phycologia 40, 503–529.
Polovina, J. J., Howell, E. A., and Abecassis, M. (2008). Ocean’s least productive waters are expanding. Geophys. Res. Lett. 35:L03618. doi: 10.1029/2007GL031745
Pörtner, H.-O., Roberts, D. C., Masson-Delmotte, V., Zhai, P., Tignor, M., Poloczanska, E., et al. (2019). IPCC, 2019: IPCC Special Report on the Ocean and Cryosphere in a Changing Climate. Geneva: Intergovernmental Panel on Climate Change.
Puillandre, N., Lambert, A., Brouillet, S., and Achaz, G. (2012). ABGD, automatic barcode gap discovery for primary species delimitation: ABGD, AUTOMATIC BARCODE GAP DISCOVERY. Mol. Ecol. 21, 1864–1877. doi: 10.1111/j.1365-294X.2011.05239.x
Raffi, I., Backman, J., Fornaciari, E., Pälike, H., Rio, D., Lourens, L., et al. (2006). A review of calcareous nannofossil astrobiochronology encompassing the past 25 million years. Quat. Sci. Rev. 25, 3113–3137.
Read, B. A., Kegel, J., Klute, M. J., Kuo, A., Lefebvre, S. C., Maumus, F., et al. (2013). Pan genome of the phytoplankton Emiliania underpins its global distribution. Nature 499, 209–213. doi: 10.1038/nature12221
Rippley, B., and Venebles, W. (2021). Feed-Forward Neural Networks and Multinomial Log-Linear Models.
Schneider, W., Donoso, D., Garcés-Vargas, J., and Escribano, R. (2017). Water-column cooling and sea surface salinity increase in the upwelling region off central-south Chile driven by a poleward displacement of the South Pacific High. Prog. Oceanogr. 151, 38–48. doi: 10.1016/j.pocean.2016.11.004
Schroeder, D. C., Biggi, G. F., Hall, M., Davy, J., Martinez, J. M., Richardson, A. J., et al. (2005). A genetic marker to separate Emiliania huxleyi (Prymnesiophyceaee) morphotypes. J. Phycol. 41, 874–879. doi: 10.1111/j.1529-8817.2005.04188.x
Silva, N., Rojas, N., and Fedele, A. (2009). Water masses in the Humboldt Current System: properties, distribution, and the nitrate deficit as a chemical water mass tracer for Equatorial Subsurface Water off Chile. Deep Sea Res. Part II Top. Stud. Oceanogr. 56, 1004–1020. doi: 10.1016/j.dsr2.2008.12.013
Sriswasdi, S., Yang, C., and Iwasaki, W. (2017). Generalist species drive microbial dispersion and evolution. Nat. Commun. 8:1162. doi: 10.1038/s41467-017-01265-1
Strom, S. L., and Bright, K. J. (2009). Inter-strain differences in nitrogen use by the coccolithophore Emiliania huxleyi, and consequences for predation by a planktonic ciliate. Harmful Algae 8, 811–816.
Sydeman, W. J., García-Reyes, M., Schoeman, D. S., Rykaczewski, R. R., Thompson, S. A., Black, B. A., et al. (2014). Climate change and wind intensification in coastal upwelling ecosystems. Science 345, 77–80. doi: 10.1126/science.1251635
Thiel, M., Macaya, E., Acuña, E., Arntz, W., Bastias, H., Brokordt, K., et al. (2007). The Humboldt Current System of northern and central Chile: oceanographic processes, ecological interactions and socioeconomic feedback. Oceanogr. Mar. Biol. 45, 195–345. doi: 10.1201/9781420050943.ch6
Thomas, M. K., Kremer, C. T., Klausmeier, C. A., and Litchman, E. (2012). A Global Pattern of thermal adaptation in marine pytoplankton. Science 338, 1085–1088. doi: 10.1126/science.1224836
Toseland, A., Daines, S. J., Clark, J. R., Kirkham, A., Strauss, J., Uhlig, C., et al. (2013). The impact of temperature on marine phytoplankton resource allocation and metabolism. Nat. Clim. Change 3, 979–984. doi: 10.1038/nclimate1989
von Dassow, P., Díaz-Rosas, F., Bendif, E. M., Gaitán-Espitia, J.-D., Mella-Flores, D., Rokitta, S., et al. (2018). Over-calcified forms of the coccolithophore Emiliania huxleyi in high-CO2 waters are not preadapted to ocean acidification. Biogeosciences 15, 1515–1534. doi: 10.5194/bg-15-1515-2018
von Dassow, P., John, U., Ogata, H., Probert, I., Bendif, E. M., Kegel, J. U., et al. (2015). Life-cycle modification in open oceans accounts for genome variability in a cosmopolitan phytoplankton. ISME J. 9, 1365–1377. doi: 10.1038/ismej.2014.221
von Dassow, P., van den Engh, G., Iglesias-Rodriguez, M. D., and Gittins, J. R. (2012). Calcification state of coccolithophores can be assessed by light scatter depolarization measurements with flow cytometry. J. Plankton Res. 34, 1011–1027. doi: 10.1093/plankt/fbs061
Wang, X., Fu, F., Qu, P., Kling, J. D., Jiang, H., Gao, Y., et al. (2019). How will the key marine calcifier Emiliania huxleyi respond to a warmer and more thermally variable ocean? Biogeosciences 16, 4393–4409. doi: 10.5194/bg-16-4393-2019
Willett, C. S. (2011). The nature of interactions that contribute to postzygotic reproductive isolation in hybrid copepods. Genetica 139, 575–588. doi: 10.1007/s10709-010-9525-1
Winter, A., Henderiks, J., Beaufort, L., Rickaby, R. E. M., and Brown, C. W. (2014). Poleward expansion of the coccolithophore Emiliania huxleyi. J. Plankton Res. 36, 316–325. doi: 10.1093/plankt/fbt110
Young, J., Geisen, M., Cros, L., Kleijne, A., Sprengel, C., Probert, I., et al. (2003). A guide to extant coccolithophore taxonomy. J. Nannoplankton Res 1, 1–132.
Young, J. R., and Westbroek, P. (1991). Genotypic variation in the coccolithophorid species Emiliania huxleyi. Mar. Micropaleontol. 18, 5–23.
Keywords: Emiliania huxleyi, Gephyrocapsa, phytoplankton, thermal reaction norms, thermal performance curves, haplogroup, cytochrome oxidase
Citation: von Dassow P, Muñoz Farías PV, Pinon S, Velasco-Senovilla E and Anguita-Salinas S (2021) Do Differences in Latitudinal Distributions of Species and Organelle Haplotypes Reflect Thermal Reaction Norms Within the Emiliania/Gephyrocapsa Complex? Front. Mar. Sci. 8:785763. doi: 10.3389/fmars.2021.785763
Received: 29 September 2021; Accepted: 28 October 2021;
Published: 02 December 2021.
Edited by:
Gustavo Fonseca, Federal University of São Paulo, BrazilReviewed by:
Marco C. Brustolin, Norwegian Institute of Marine Research (IMR), NorwayCopyright © 2021 von Dassow, Muñoz Farías, Pinon, Velasco-Senovilla and Anguita-Salinas. This is an open-access article distributed under the terms of the Creative Commons Attribution License (CC BY). The use, distribution or reproduction in other forums is permitted, provided the original author(s) and the copyright owner(s) are credited and that the original publication in this journal is cited, in accordance with accepted academic practice. No use, distribution or reproduction is permitted which does not comply with these terms.
*Correspondence: Peter von Dassow, cHZvbmRhc3Nvd0BiaW8ucHVjLmNs
Disclaimer: All claims expressed in this article are solely those of the authors and do not necessarily represent those of their affiliated organizations, or those of the publisher, the editors and the reviewers. Any product that may be evaluated in this article or claim that may be made by its manufacturer is not guaranteed or endorsed by the publisher.
Research integrity at Frontiers
Learn more about the work of our research integrity team to safeguard the quality of each article we publish.