 Kelly A. Sloan
 David S. Addison
 Andrew T. Glinsky
 Allison M. Benscoter
 Kristen M. Hart
94% of researchers rate our articles as excellent or good
Learn more about the work of our research integrity team to safeguard the quality of each article we publish.
Find out more
ORIGINAL RESEARCH article
Front. Mar. Sci., 04 January 2022
Sec. Marine Megafauna
Volume 8 - 2021 | https://doi.org/10.3389/fmars.2021.775367
This article is part of the Research TopicAdvances in Understanding Sea Turtle Use of the Gulf of MexicoView all 17 articles
Globally, sea turtle research and conservation efforts are underway to identify important high-use areas where these imperiled individuals may be resident for weeks to months to years. In the southeastern Gulf of Mexico, recent telemetry studies highlighted post-nesting foraging sites for federally endangered green turtles (Chelonia mydas) around the Florida Keys. In order to delineate additional areas that may serve as inter-nesting, migratory, and foraging hotspots for reproductively active females nesting in peninsular southwest Florida, we satellite-tagged 14 green turtles that nested at two sites along the southeast Gulf of Mexico coastline between 2017 and 2019: Sanibel and Keewaydin Islands. Prior to this study, green turtles nesting in southwest Florida had not previously been tracked and their movements were unknown. We used switching state space modeling to show that an area off Cape Sable (Everglades), Florida Bay, and the Marquesas Keys are important foraging areas that support individuals that nest on southwest Florida mainland beaches. Turtles were tracked for 39–383 days, migrated for a mean of 4 days, and arrived at their respective foraging grounds in the months of July through September. Turtles remained resident in their respective foraging sites until tags failed, typically after several months, where they established mean home ranges (50% kernel density estimate) of 296 km2. Centroid locations for turtles at common foraging sites were 1.2–36.5 km apart. The area off southwest Florida Everglades appears to be a hotspot for these turtles during both inter-nesting and foraging; this location was also used by turtles that were previously satellite tagged in the Dry Tortugas after nesting. Further evaluation of this important habitat is warranted. Understanding where and when imperiled yet recovering green turtles forage and remain resident is key information for designing surveys of foraging resources and developing additional protection strategies intended to enhance population recovery trajectories.
Green turtles (Chelonia mydas) are widely distributed, nesting circumglobally in temperate and tropical waters. A 2004 study estimated that green turtle populations had declined by 37–61% worldwide over the previous 141 years (Seminoff, 2004) and consequently the species is classified as globally endangered (Baillie et al., 2004). However, a more recent assessment of global trends in green turtle nesting patterns indicated that four out of five regional management units (RMUs; Wallace et al., 2010) for the species are significantly increasing in abundance (Mazaris et al., 2017).
Although the green turtle is listed as federally endangered under the United States Endangered Species Act (Endangered Species Act [ESA], 1973, as amended), green turtles nesting in the Gulf of Mexico appear to be increasing in abundance. Modest increases in green turtle nest counts have been reported on northwestern Gulf of Mexico beaches in Texas (Shaver et al., 2020) and nest counts for Florida green turtles have risen at an exponential rate [Chaloupka et al., 2008; Valdivia et al., 2019; Florida Fish and Wildlife Conservation Commission (FWC) unpublished data]. Green turtle nesting activity is concentrated along the east-central and southeast coasts of Florida, but a marked increase was documented on the Gulf coast in recent years, including in Dry Tortugas National Park at the western end of the Florida Keys reef tract in the National Marine Sanctuary boundary (see text footnote 1). Green turtle nesting in southwest Florida was first documented in 1994 (Foley, 1997) and from 1994 to 2012, no more than 60 green nests were ever reported annually on the west coast of peninsular Florida during statewide nesting beach surveys. An exponential increase has been observed since 2013 and 841 green turtle nests were documented on the west coast of Florida in 2019 (FWC, unpublished data).
While decades of targeted conservation efforts have resulted in population recovery (Valdivia et al., 2019), optimizing strategies to protect sea turtles requires an in-depth understanding of their temporal and spatial distributions, migratory patterns, habitat utilization, trends and identification of source populations. International sharing of tracking data is becoming more common (Hays and Hawkes, 2018) and these large-scale datasets have proven to benefit conservation by creating management actions that successfully reduce fisheries by catch and vessel strikes, and establish marine protected areas (Hays et al., 2019). Documenting inter-nesting behavior, migratory routes, foraging grounds, and high-use areas is vital in assessing threats that coincide with turtles in the marine environment (e.g., incidental capture, oil spills, dredging, and red tide).
Because nighttime tagging operations are rare in southwest Florida, and extensive remote wilderness exists in this area, it is likely that many green turtles nesting in the region have never been encountered. This data gap creates complications in understanding the population structure as it is unknown if green turtles nesting on Gulf coast beaches represent a subset of the population that nests on Florida’s east coast or if the population source is instead elsewhere. Genetic analyses of mitochondrial DNA indicate that colonization of northwest and west-central Florida via the Atlantic Coast rookeries cannot be ruled out (Shamblin et al., 2020).
Satellite telemetry is a widely used tool to study movements and habitat use patterns of marine megafauna, and thousands of turtles have been tracked around the world (Hays and Hawkes, 2018). Data from satellite transmitters and dive sensors suggest that there is remarkable variability in the at-sea behavior of breeding green turtles. During the nesting season, turtles typically migrate from feeding grounds to nesting beaches where they lay several clutches of eggs. However, there can be a great deal of plasticity in each phase of this process, including migration strategy (Godley et al., 2002; Blumenthal et al., 2006; Seminoff et al., 2008; Baudouin et al., 2015; Hays et al., 2020), the extent of movement during the inter-nesting period (Hays et al., 1999); the number of days between nesting events, and foraging behavior (Hatase et al., 2006), with variability documented even within a single nesting beach. Currents (Chambault et al., 2015), learned behavior (Scott et al., 2014), water temperature (Godley et al., 2002; Hays et al., 2002; Santos et al., 2015), predator avoidance (Mettler et al., 2020), resource availability (Dalleau et al., 2019), and diel cycles (Hays et al., 1999) have been proposed to influence such behaviors.
Research using telemetry to track juvenile green turtles in the Gulf of Mexico has revealed that they generally use small core use areas in nearshore foraging habitats at this life stage (Hart and Fujisaki, 2010; Lamont et al., 2015; Wildermann et al., 2019), although seasonal differences in foraging ranges have been reported (Metz et al., 2020). Satellite tracking data for adult green turtles nesting on United States Gulf of Mexico beaches are currently limited to studies at Dry Tortugas, where post-nesting movements have been documented both within the park and the surrounding areas of the Florida Keys (Hart et al., 2013). In-water captures at Dry Tortugas (Fujisaki et al., 2016) and the Eastern Quicksands (Herren et al., 2018) have identified these sites as high-density foraging grounds for adult green turtles.
Movements and residence areas for green sea turtles nesting in peninsular southwest Florida have not been previously identified. Thus, our objectives were to document adult female green turtle inter-nesting behavior, delineate migratory corridors used, identify foraging sites selected, and spatially define home ranges and core use areas.
Keewaydin Island and Sanibel Island are coastal barrier islands located on the lower southwest coast of Florida (Figure 1; Sanibel – N 26.46481°, W 81.16714°, Keewaydin – N 26.04844°, and W 81.78139°). Sanibel Island is 21 km in length with a land area of 4,429 ha while the more linear Keewaydin Island is 12.5 km long and encompasses 526 ha. Eighty-five percent of Keewaydin is state-owned and is within Rookery Bay National Estuarine Research Reserve. Keewaydin is a relatively pristine island that can only be visited by boat, while the coastline of Sanibel is much more developed and readily accessible. The straight-line distance between the two sites is approximately 30 km.
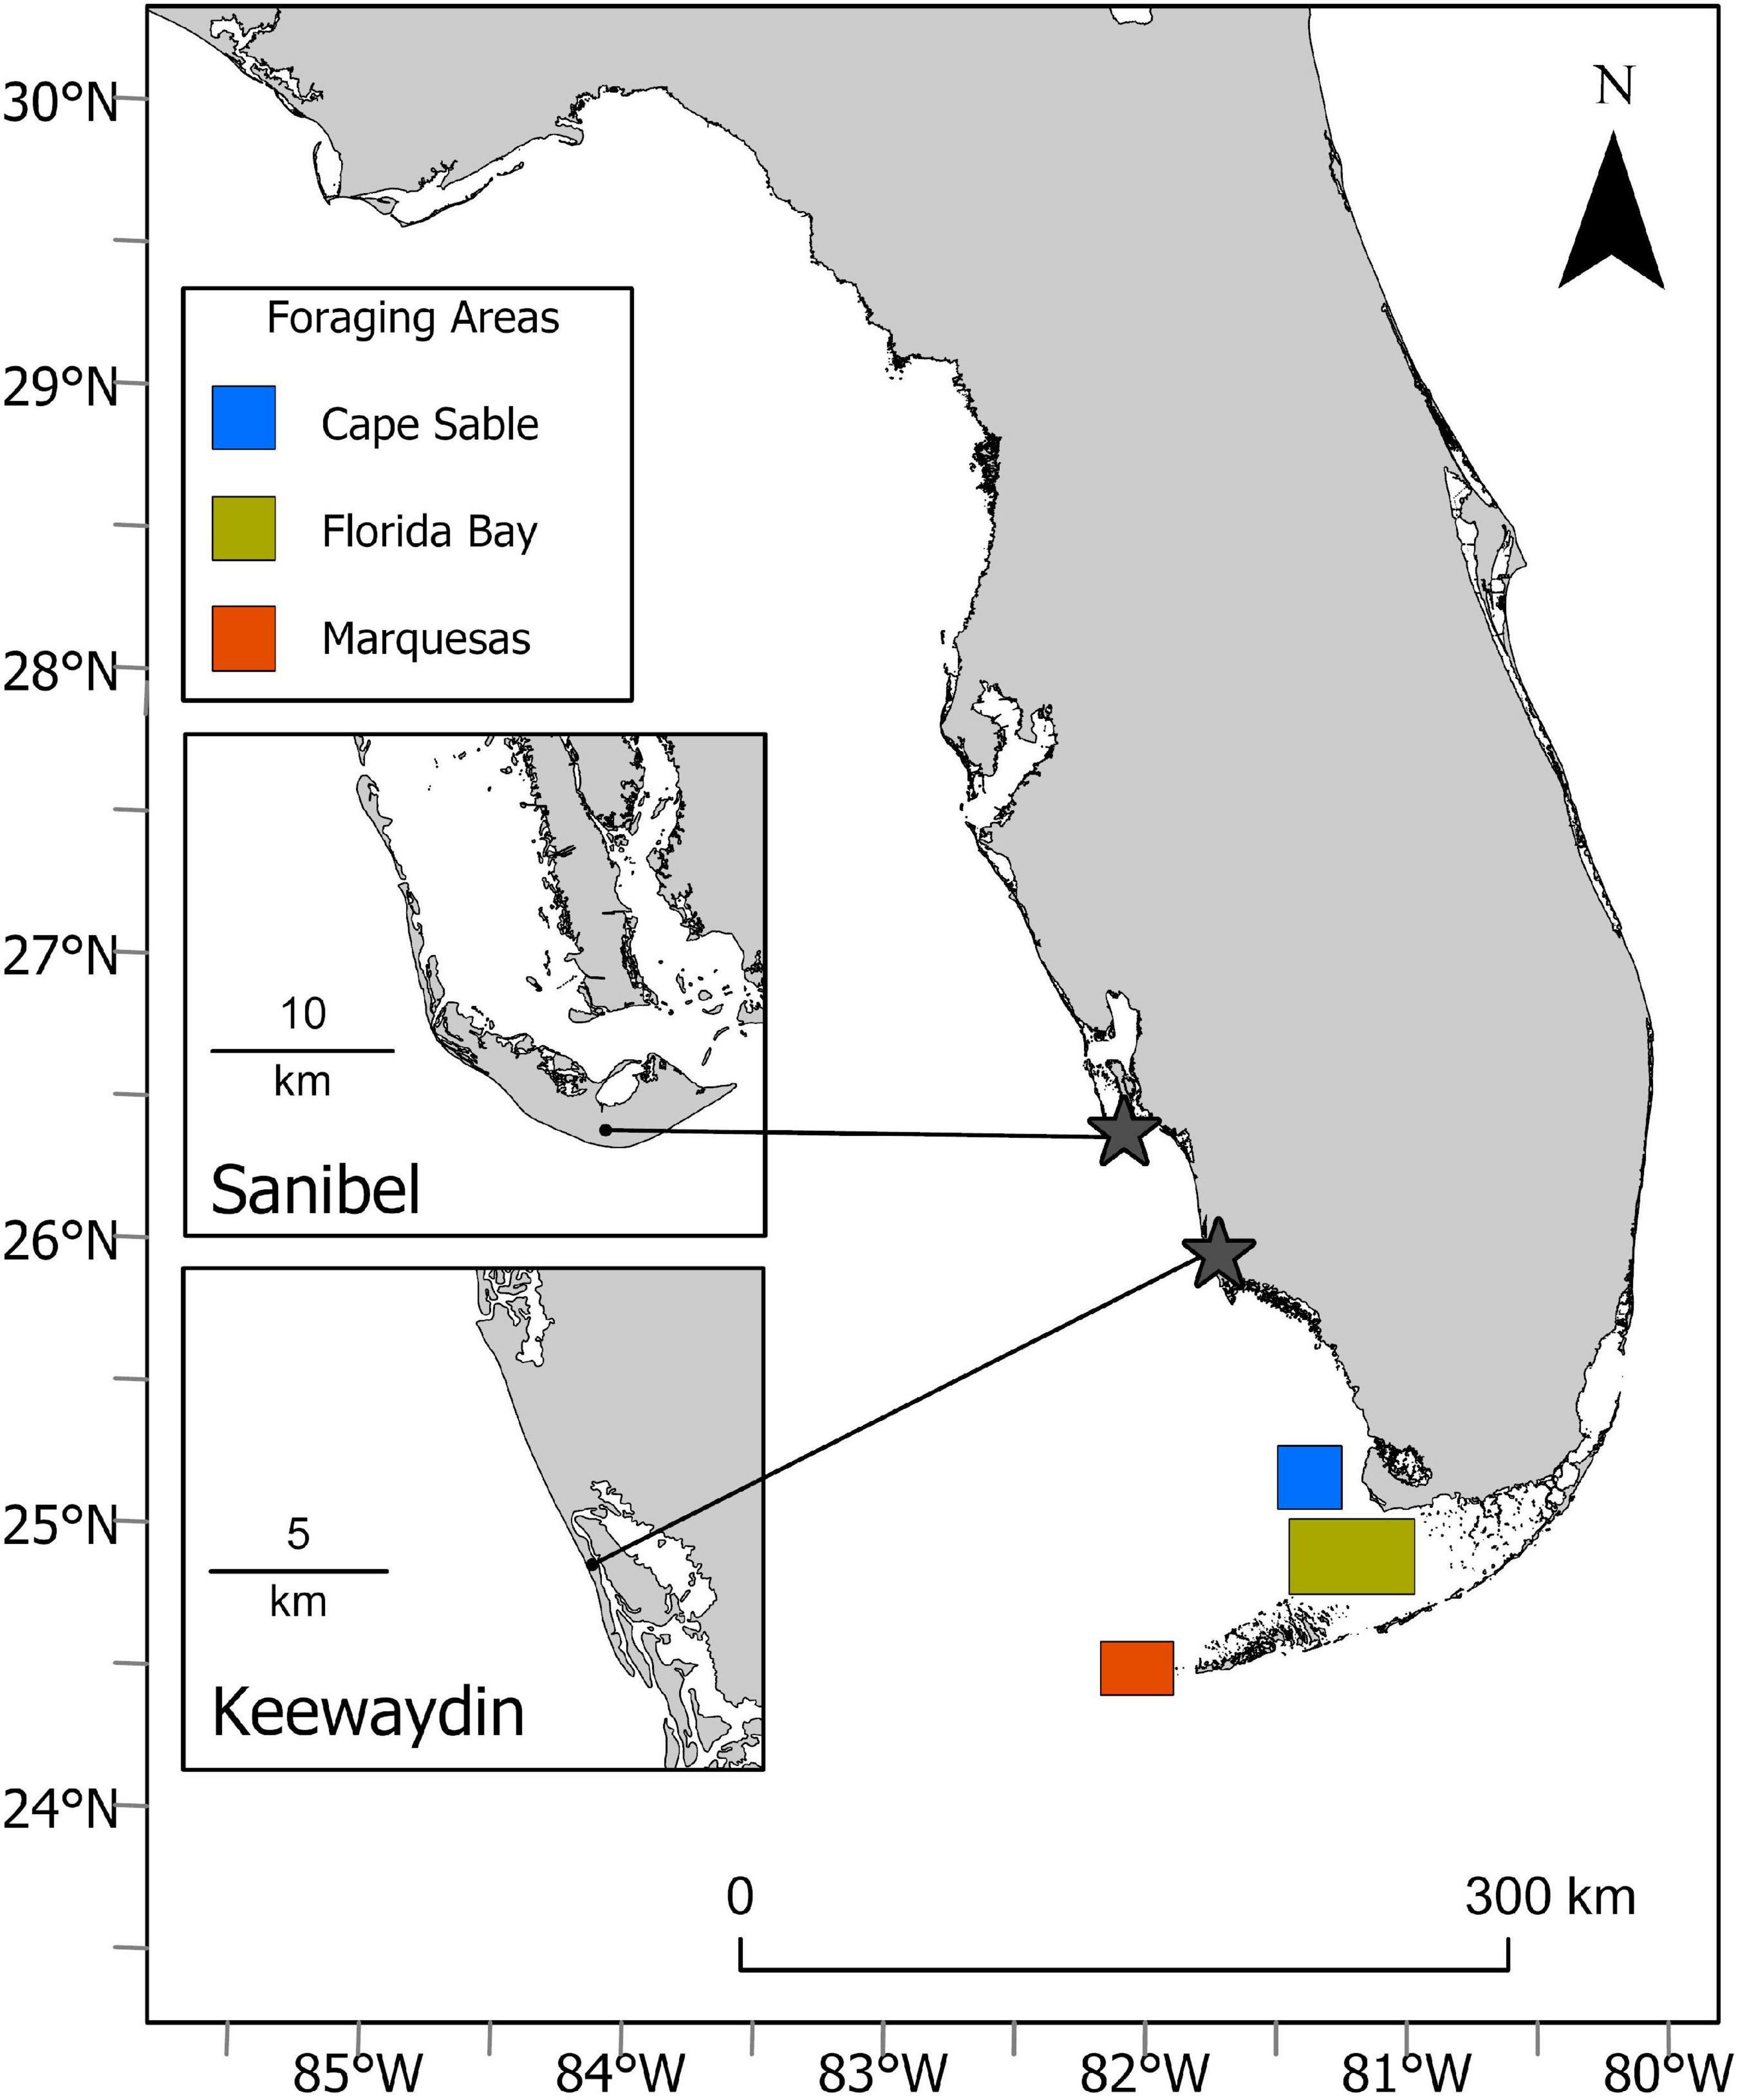
Figure 1. Study sites: stars indicate tagging beaches and squares indicate foraging grounds.
Nighttime tagging surveys run from May 1 to July 31 on Sanibel Island and May 15 to July 31 on Keewaydin Island. Staff patrol these two beaches on ATVs from sundown to sunrise seven nights per week. We captured turtles during night patrols by temporarily corralling them after nesting in an adjustable plywood box. We tagged the trailing edge of front flippers with 681/C Inconel self-piercing sea turtle tags (National Band and Tag Company, Newport, KY, United States) and inserted subcutaneous passive integrated transponder (PIT) tags (Biomark FDX-B HPT12 PIT) in the right front flipper (NMFS-SEFSC, 2008). We recorded morphometric data and took biopsies for genetics and stable isotope analysis for each individual. We used Sirtrack K2G 575E KiwiSat 202B Argos platform terminal transmitters (PTTs) that were adhered according to Mansfield et al. (2009). We cleaned the carapace, prepped it with a drying agent and attached the transmitter using a two-component adhesive (DeWalt Pure50+™) followed by a two-part steel reinforced epoxy putty (Sonic Weld ®). Additionally, we coated the transmitter and surrounding epoxy with antifouling paint. We released the turtles on site immediately after all attachment methods had dried or set. Sirtrack Argos PTTs were programmed by the manufacturer with a 24-h on/24-h off duty cycle to conserve battery life in 2017 and were continuously on in 2018 and 2019.
We used switching state space modeling (SSM) to characterize the movements of tagged turtles. The model was previously described in Jonsen et al. (2005) and has been applied to model movement of many marine animals (Bailey et al., 2009; Shillinger et al., 2010; Maxwell et al., 2011; Shaver et al., 2016; Iverson et al., 2020). Specifically, we applied a Bayesian hierarchical movement model with behavioral-state switching in the R package “bsam” (Jonsen et al., 2005, 2017; Jonsen, 2016; R Core Team, 2020) by calling JAGS (package rjags; Plummer, 2019) to run the Markov Chain Monte Carlo (MCMC) algorithm. The model was fit with the function “fit_ssm(),” using the “hDCRWS” specification (hierarchical first difference correlated random walk switching model); we applied a time step of 1 day. The MCMC parameters were set following Hart et al. (2020), using adaptive sampling for 7,000 draws, taking 10,000 samples from the posterior distribution, and thinning by 5 to reduce MCMC autocorrelation, resulting in 2,000 posterior samples for inference. The SSM estimates location and behavioral mode at regular time intervals, improving accuracy of tag data by accounting for positional errors and dynamics of animal movements. The SSM assigned either area restricted movement (ARS) or directed movement to a location based on the swimming speed and turning angle of the animal. The ARS movements corresponded to either inter-nesting or foraging behavior, and directed movement (transiting) corresponded to migration. Switching SSMs utilize raw track data to determine behavioral state in a bimodal context by providing a behavioral index between 1 and 2, referred to as a “b” value. Mode 1 (e.g., “migrating”) is represented by b values <1.5 and mode 2 (e.g., “resident/foraging”) is represented by b values >1.5 (Jonsen et al., 2005; Breed et al., 2009). We used the model to classify ARS and migratory behavior, determine the dates of migration, and identify the date of arrival at foraging grounds (i.e., when ARS behavior resumed post-migration).
To assess inter-nesting movements, we determined the mean distance traveled per day during inter-nesting for each turtle by calculating the distance traveled per day from the SSM points using the geosphere package (successive distance between points from 1 day to the next; Hijmans, 2019) in R (R Core Team, 2020), and then calculated the mean distance traveled per day for each turtle over their inter-nesting period. We calculated the inter-nesting interval (the number of days between nesting events) using recapture data when available, as telemetry locations that appeared on the beaches had high estimated error associated with points (i.e., spatial data were unreliable). Means were accompanied by ±SD.
We used the Optimized Hot Spot Analysis in ArcGIS Pro 2.4.3 to identify areas of high use during inter-nesting and migration (Environmental Systems Research Institute [ESRI], 2019). The program uses inter-nesting and migratory data from the SSM and the Getis-Ord Gi* statistic to generate a fishnet grid of 18 km squares, assigning them a color based on statistical significance (Getis and Ord, 1992). We calculated bathymetry from the “hotspot” grid cells comprising the migratory corridor where higher proportions migrated. We layered the NOAA National Geophysical Data Center (2001) United States Coastal Relief Model Vol.3 – Florida and East Gulf of Mexico in ArcGIS Pro to estimate depth associated with each migration grid cell (CRM, NOAA National Geophysical Data Center, 2001; Environmental Systems Research Institute [ESRI], 2019).
Post-migration ARS points were considered “foraging” and we used the first date of these ARS points to delineate the turtle’s date of arrival to the foraging area. We corroborated these dates using cumulative distance plots (not shown Hart et al., 2021). To determine core use areas upon arrival at foraging grounds, SSM locations for each turtle were used for kernel density estimation (KDE) analysis for all individuals. Kernel density is a tool used in spatial ecology to identify areas of heavy use (i.e., core areas) within a home range boundary. We used the (the adehabitatHR package via Home Range App created by Cyril Bernard, SIE, CEFE-CNRS) for each KDE. We used 95% KDEs to represent the home foraging range and the 50% KDEs to represent core areas of activity at foraging sites.
The 14 turtles tracked include 4 individuals that were instrumented twice to assess consistency of foraging site selection; one of these turtles nested in two consecutive years and three had a 2-year inter-nesting interval (Table 1). Turtles ranged in size from 93.1 to 109.3 cm SCL (straight carapace length, notch to tip), with a mean size of 102.9 ± 4.01 cm. Over the 3-year study period we tracked turtles for a total of 1,707 days, with individual tracking durations ranging from 39 to 383 days (mean = 122 ± 83 days).
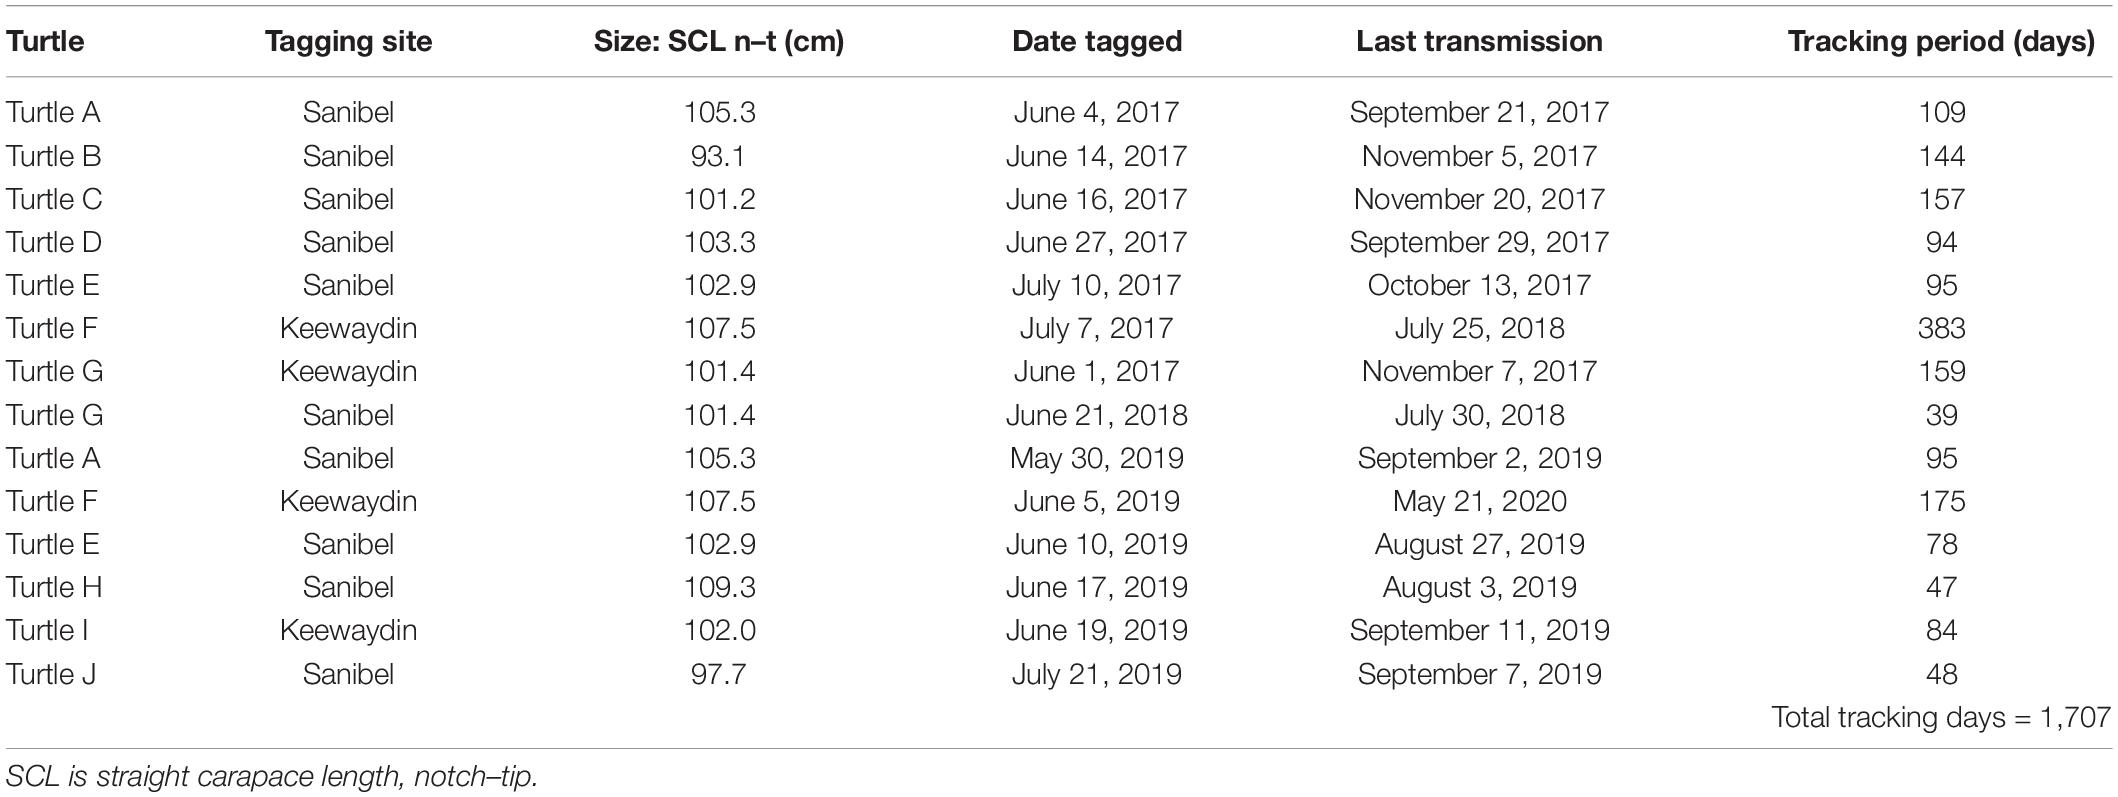
Table 1. Tracking summary for satellite-tagged green turtles.
Argos assigns location classes (LCs) 3, 2, 1, A, and B in order of descending accuracy to each location point. Argos (2016) states that the estimated accuracy in latitude and longitude is <250 m for LC 3, 250–500 m for LC 2, 500–1,500 m for LC 1, >1,500 m for LC 0, and unbounded accuracy for LC A and B. LC B represented the highest proportion of data (mean = 6.4 locations per day) followed by LC A (mean = 0.97 locations per day). Location data in classes 3, 2, and 1 were less common, with means of 0.17, 0.22, and 0.20 locations per day, respectively (see Supplementary Table 1).
Eight turtles had clear migrations identified by SSM (Figure 2), providing a well-defined end date for their nesting season and allowing us to characterize inter-nesting movements prior to initiation of migration. Turtle J was instrumented at her last nesting event of the season, which precluded any inter-nesting observations. Turtle A did not have a migration identified by SSM and therefore an end date for her nesting season was not defined, prohibiting the calculation of distance traveled per day. However, she clearly remained close to the Sanibel nesting beach throughout the tracking period. With the exception of this individual, all turtles were highly mobile between nesting events, exhibiting mean track lengths between 11 and 30 km/day during the nesting season (Table 2). For the eight turtles that had migrations identified by SSM, the mean distance traveled per day between the tagging date and the start of migration (i.e., the nesting season) was 21 km/day. Turtle C traveled the longest distance during the nesting season, logging 1,489 km between the tagging date and initiation of migration (June 16, 2017–August 22, 2017; Figure 2A). The mean water depth associated with inter-nesting movements was 6.3 m.

Figure 2. Daily switching state space modeling tracks throughout the tracking period for all individual adult female green turtles (Chelonia mydas) satellite-tagged in southwest Florida for (A) 2017, (B) 2018, and (C) 2019.
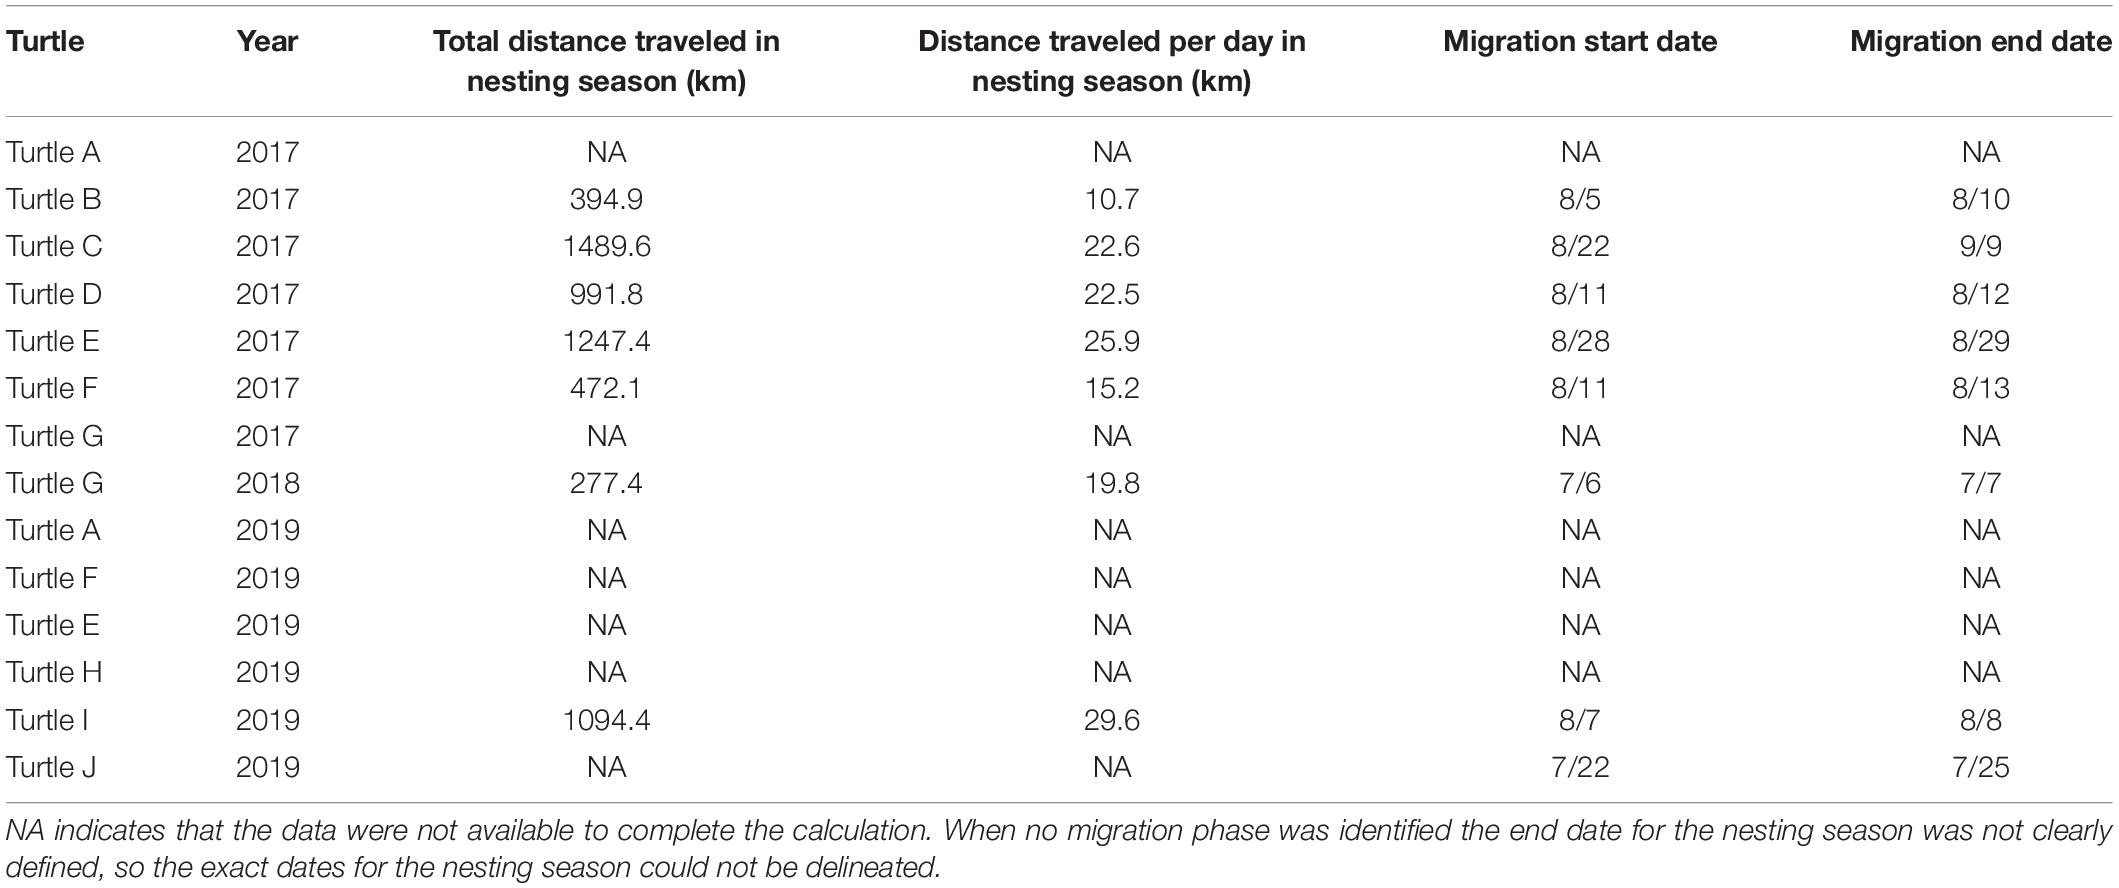
Table 2. Distance traveled during the nesting season and migration dates.
Six of the 14 turtles traveled between the nesting beach and a distinct in-water location ∼30 km west of Cape Sable, southwestern tip of Florida, between consecutive nesting events (Figure 3). These individuals traveled as far as 300 km roundtrip and spent 2–6 days at the site before returning to the nesting beach. Three of these tracks were documented in 2017, one in 2018, and two in 2019. Turtle E and Turtle G were satellite-tagged twice but only exhibited this behavior during one of the 2 years.

Figure 3. Inter-nesting hotspot for adult female green turtles satellite-tagged in southwest Florida, ∼25 km west of Cape Sable, Everglades, FL, United States.
Logistical limitations prevent a true saturation tagging project (in which every turtle is observed and tagged) at each of the study sites. As such, the satellite-tracked turtles in this study were not observed during every nesting event on Sanibel and Keewaydin Islands. However, on the 10 occasions when a satellite tagged turtle was seen during two consecutive nesting events, the inter-nesting interval ranged from 9 to 14 days (mean = 11 days; n = 5 turtles).
Eight turtles had migration periods (Table 2). Two turtles (Turtle G in 2017 and Turtle F in 2019) had well defined foraging grounds but SSM did not delineate a clear migratory phase. Each turtle traveled south after their presumed final nesting event. A nearshore migratory hotspot was identified along the coast of southwest Florida (Figure 4). Initiation of migration to foraging areas ranged from July 6 to August 28. Turtle G and Turtle J were the only individuals that departed for their foraging grounds in July. For the other turtles, migration start dates ranged from August 5 to August 28. The average time spent migrating to the foraging grounds was short, at 4 ± 5.7 days (range 1–18). Migratory movements identified through SSM took place in shallow waters (mean depth was 14.6, 8.3, and 8.0 m in 2017, 2018, and 2019, respectively) off the southwest coast of Florida, with the exception of two turtles: one who had a migratory phase to and from the Dry Tortugas prior to settling in Florida Bay, and another who traveled beside the continental shelf while migrating to Florida’s east coast as far north as the Patrick Space Force Base in Brevard County.

Figure 4. Migratory corridors of adult female green turtles (Chelonia mydas) nesting in southwest Florida with hotspots of high-use.
Of the four turtles that were tagged twice, there were no instances when migration data were identified in both seasons. Turtle F and Turtle E were not sending transmissions at the likely time of migration in 2019 and did not transmit long enough to determine foraging areas. Turtle G did not have migratory points defined by SSM in 2017. Turtle A did not migrate away from the coast of Sanibel either year (2017 or 2019) during the migratory period defined in this study and could be a resident turtle that forages and nests in the same area, but the dataset acquired during the presumed foraging period was too limited to make this assumption.
We tracked turtles to foraging grounds in the Marquesas Keys (n = 4), western Florida Bay (n = 4), and an area offshore Cape Sable (n = 2; Table 3 and Figures 5, 6). Turtles were tracked at resident foraging sites for 333–345 days (mean = 94 ± 90.5 days). The size of the 50% core use resident areas for each individual ranged from 8 to 904 km2 (mean = 296 ± 309.3 km2; Figures 5, 7). In every case the foraging period ended when the PTT stopped transmitting rather than the turtle leaving the location, and thus is not a true reflection of time spent at the foraging grounds. Nonetheless, the transmitter for Turtle F was sending high quality data until August 12 of the following nesting season.
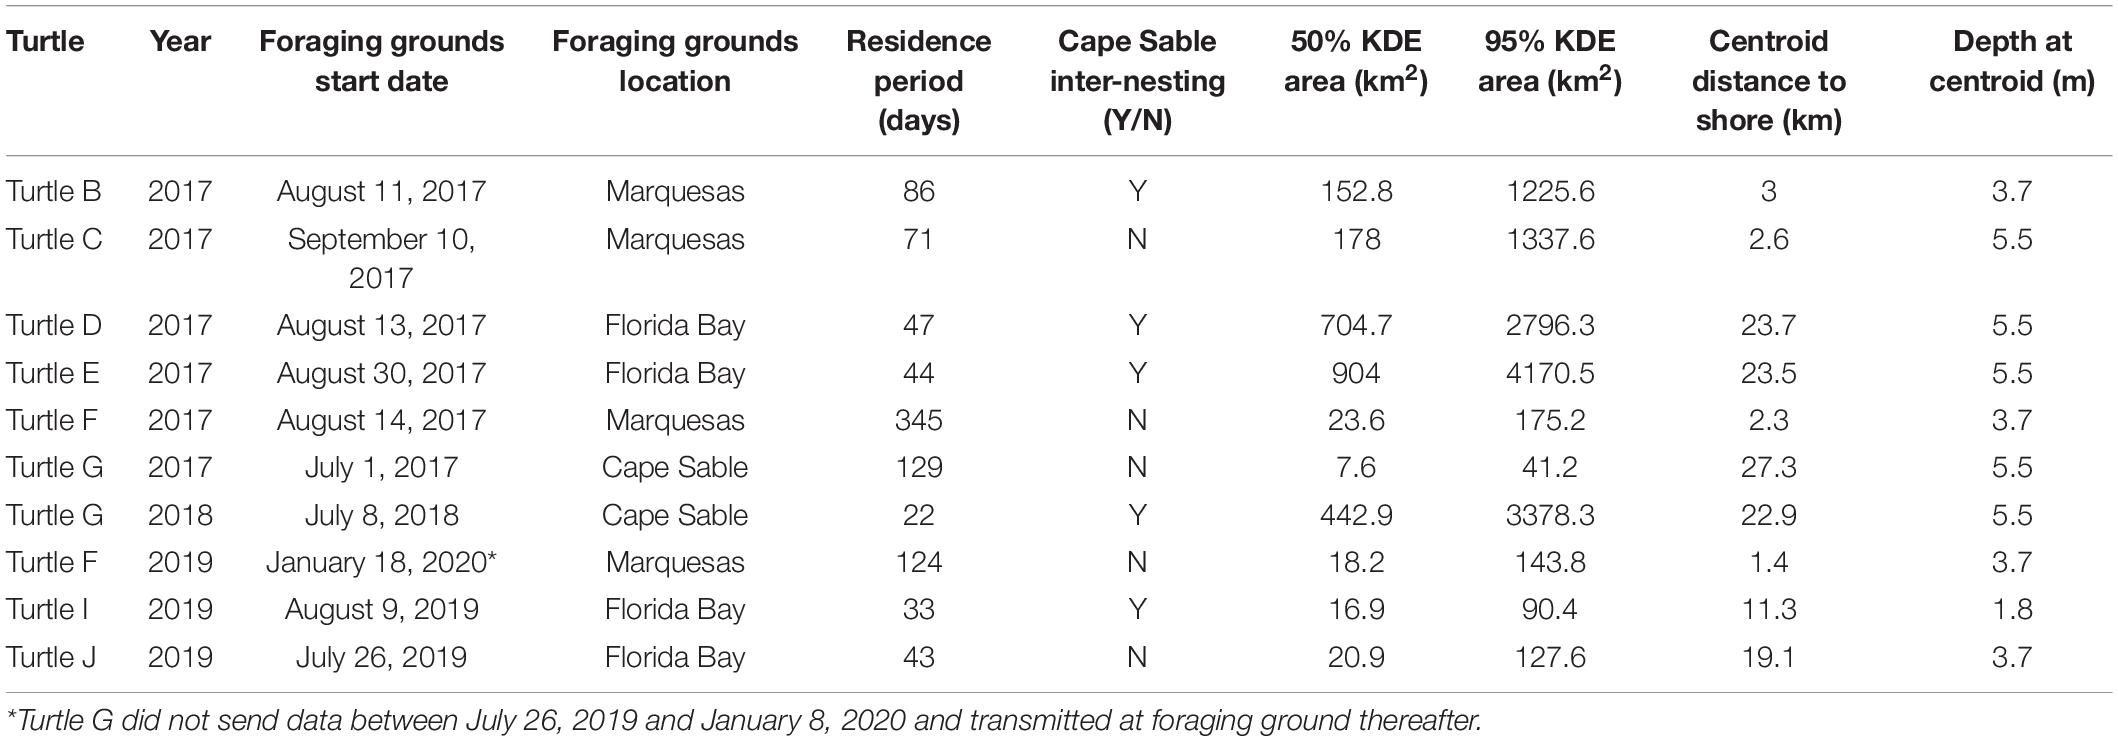
Table 3. Location, size, and depth of core use areas.

Figure 5. Kernel density estimates (KDE) for 50% core use areas and 95% home ranges, and centroid locations of core use areas during foraging for green turtles (Chelonia mydas; turtles A–J) that nested in southwest Florida. (A) Turtle A in 2017, (B) Turtle A in 2019, (C) Turtle B in 2017, (D) Turtle C in 2017, (E) Turtle D in 2017, (F) Turtle E in 2017, (G) Turtle E in 2019, (H) Turtle F in 2017, (I) Turtle F in 2019, (J) Turtle G in 2017, (K) Turtle G in 2018, (L) Turtle H in 2019, (M) Turtle I in 2019, and (N) Turtle J in 2019.

Figure 6. (A) Centroid locations and (B) Core use areas [50% kernel density estimation (KDE)] for all green (Chelonia mydas) turtles tracked from southwest Florida nesting beaches to their respective foraging grounds.
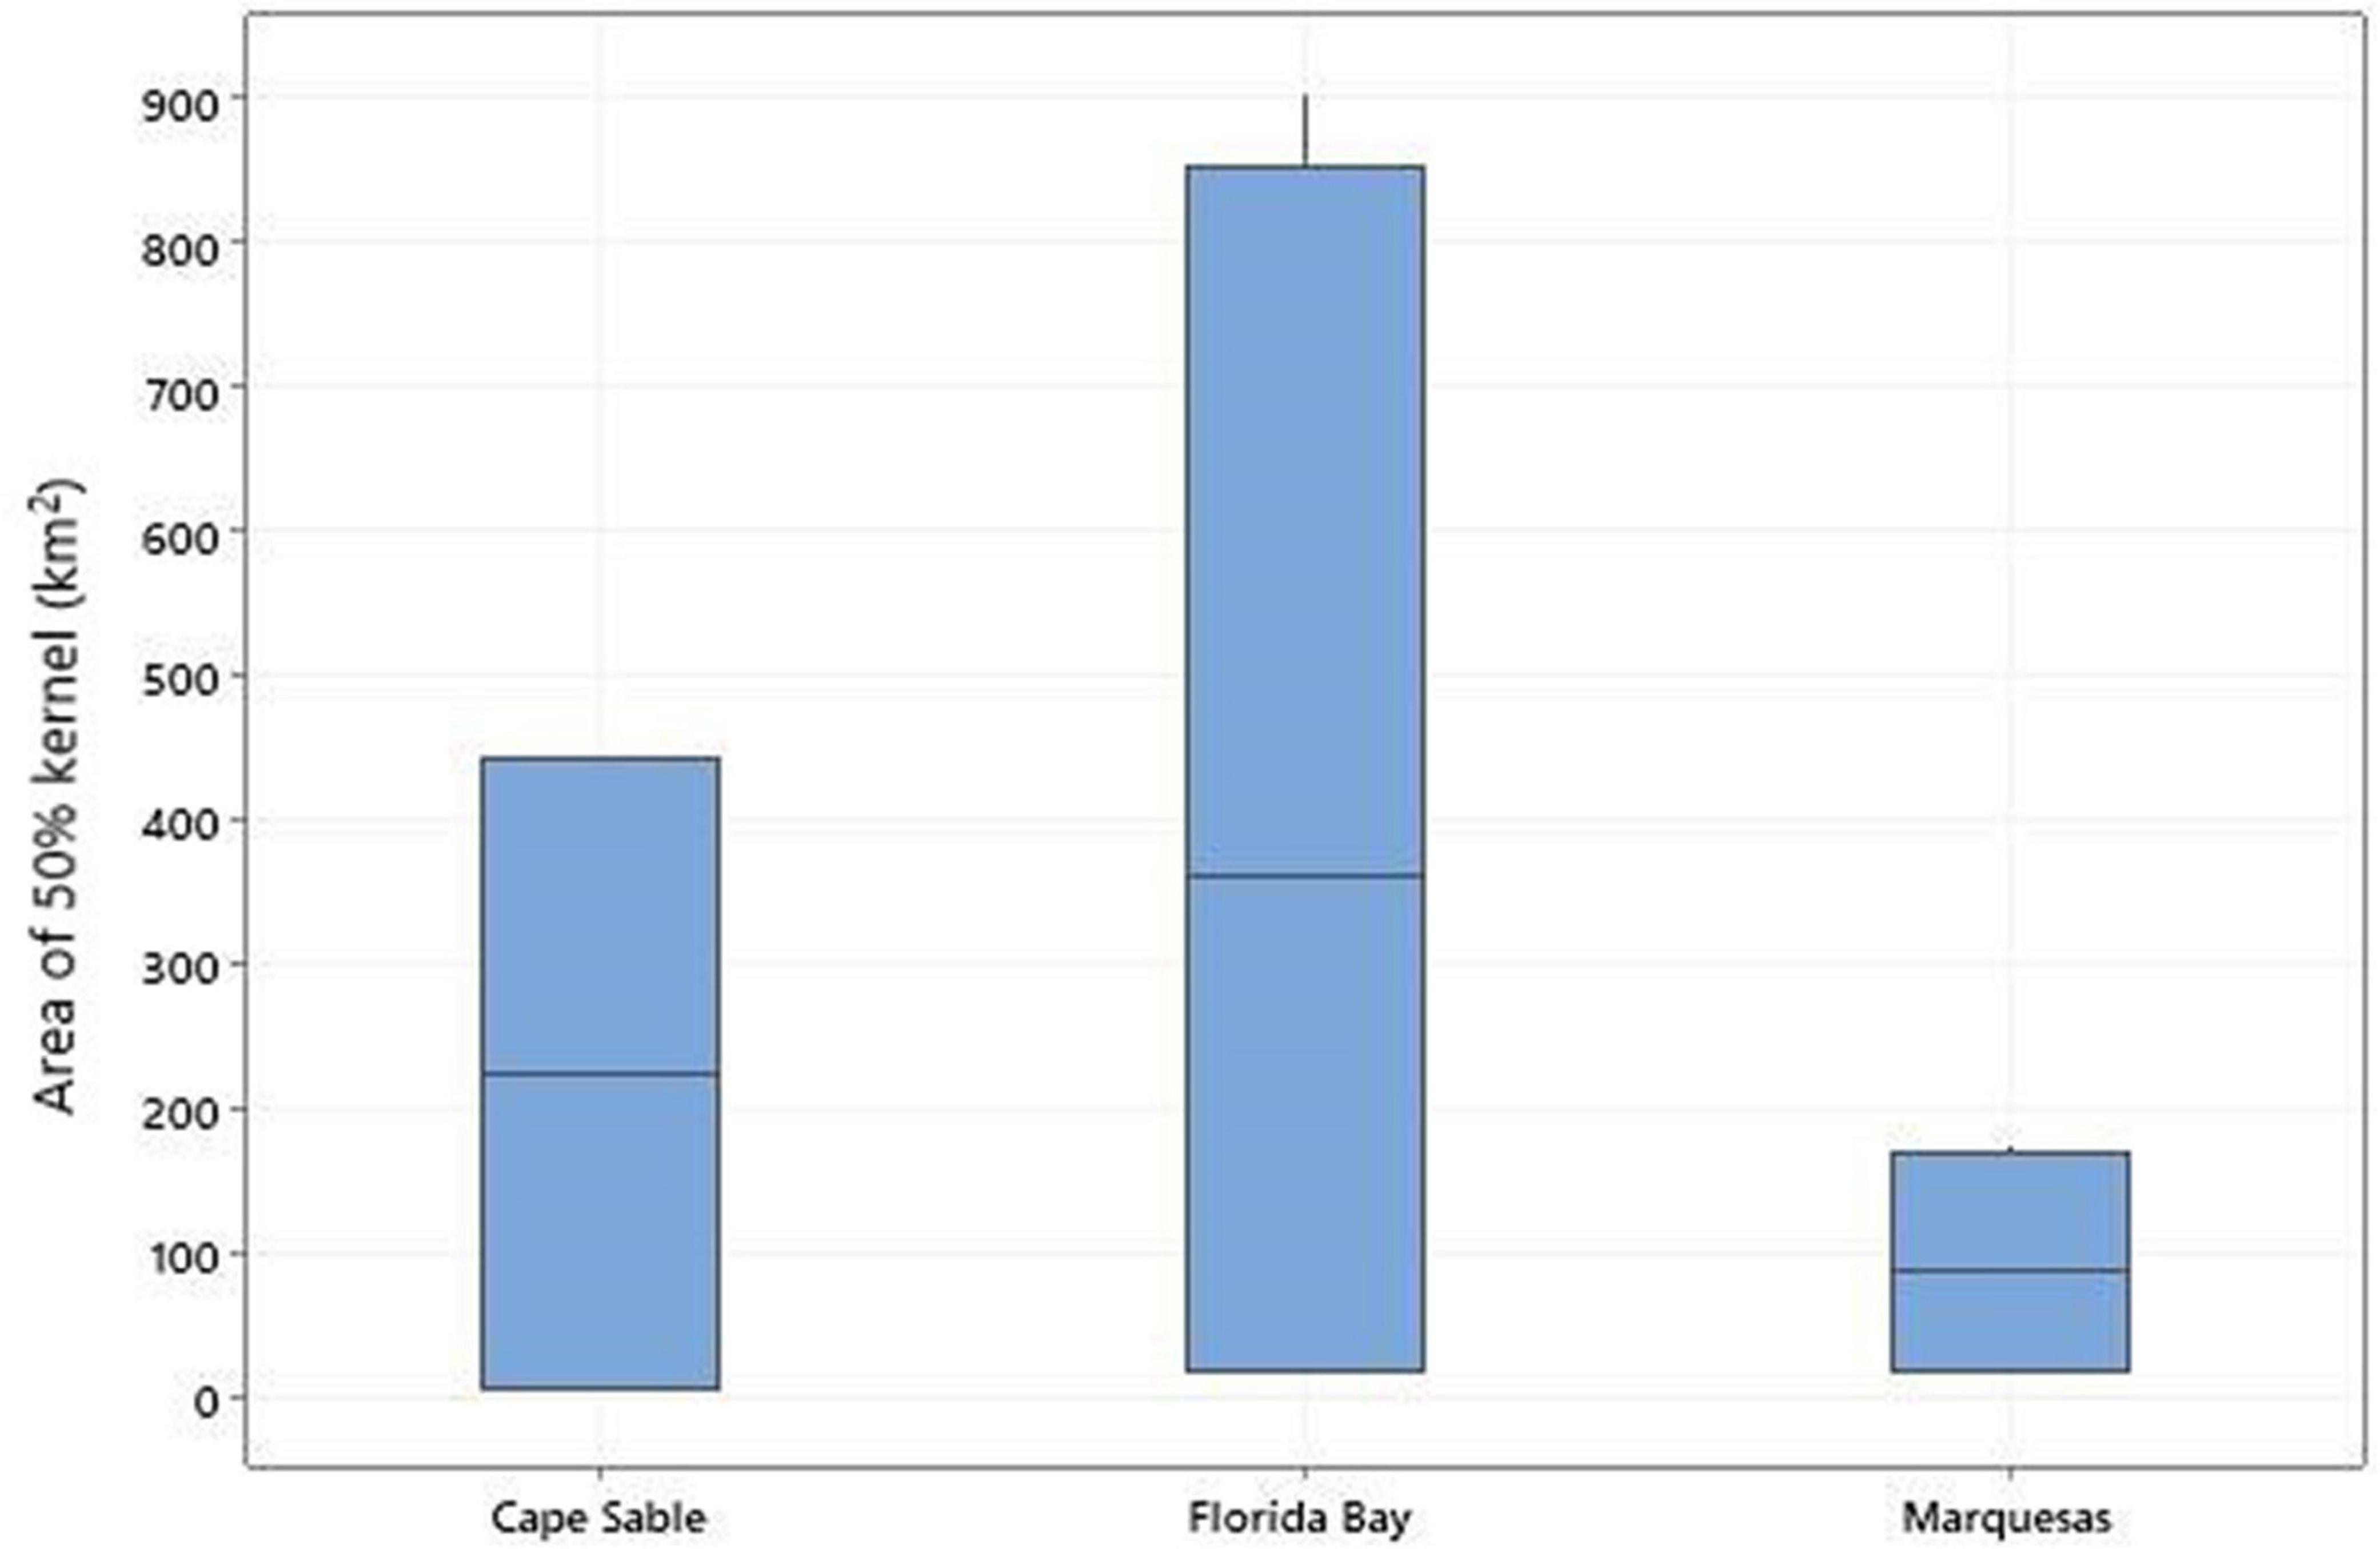
Figure 7. Box plots of the 50% kernel density areas (in km2) for turtles in each foraging ground.
Four individuals (Turtle D, Turtle E, Turtle I, and Turtle J) used a previously unidentified foraging hotspot in the western Florida Bay region (see Figure 6). The centroid locations for core use areas were very close to the shoreline for turtles foraging in the Marquesas Keys (mean = 2.3, range 1.4–3.0 km) compared to turtles foraging in western Florida Bay (mean = 21.4 km, range 11.3–23.7 km). The mean water depth at centroids in these two sites was comparable (4.2 and 4.1, respectively). The distance to shore for Turtle G that used the Cape Sable residence area in two separate years was 25 km, considerably farther than the other two sites, and the water depth at the foraging centroid was slightly deeper at 5.5 m.
For the foraging centroids, the mean distance to the closest foraging centroid was 3.1 km (range 1.1–5.5 km) for turtles foraging in the Marquesas Keys and was 19.6 km (range 4.2–36.5 km) for turtles foraging in western Florida Bay. Turtle G and Turtle F were tracked to their foraging grounds twice, and both turtles exhibited fidelity to the same foraging areas, one off Cape Sable and the other at Marquesas Keys. Turtle G’s centroid locations were 4.7 km apart and Turtle F’s centroid locations were 1.6 km apart (Figure 6). The other two turtles that were tracked twice (Turtle A and Turtle E) did not have defined foraging grounds for both tracking years and thus we could not assess the extent of their interannual site fidelity.
The 10 animals in the current study provided the first movement data for green turtles nesting on the west coast of the Florida peninsula. The inter-nesting behavior of the turtles in this study was highly variable, both among and within individuals. This behavioral plasticity may allow green turtles to adapt and survive in a dynamic environment that is exposed to frequent hurricanes, harmful algal blooms, seagrass die offs, and other shifts in food availability. Despite individualized behavior during the nesting season, there was strong site fidelity to core use areas.
Loggerhead (Caretta caretta) data suggest that the rookery on Sanibel may reflect dispersal of Sarasota County females, consistent with tag returns. Recapture data from loggerheads on Sanibel indicate nesting exchange between Casey Key (∼85 km), Manasota Key (∼60 km), and Keewaydin (∼50 km), with 23, 8, and 16 tag returns from each beach since 2016, respectively (Sanibel-Captiva Conservation Foundation [SCCF], unpublished data). Green turtle recapture data are very limited due to the relatively small number of individuals nesting on the west coast of Florida, telemetry locations during known nesting events had high associated error, preventing reliable identification of nesting events from satellite-derived data alone. In this study, the only exchange documented among green turtle nesting beaches on Florida’s west coast is Turtle H, who has been observed on Keewaydin, Sanibel, Englewood, and Manasota Key, and Turtle G, who has confirmed nests on both Sanibel and Keewaydin (SCCF, unpublished data). Natal homing to islands separated by more than 70 km can occur within a distinct subpopulation (Shamblin et al., 2020), and data showing exchange among these west coast beaches may provide insight into stock structure and population connectivity that complements genetic analysis.
The location data collected by Fastloc-GPS are more accurate than Argos, and thus home range estimates presented in this study are not directly comparable to those collected using other techniques (Thomson et al., 2017). When the transmitters were set to a 24-h on/24-h off duty cycle in 2017, 90% of the data collected were categorized as LC A or B (see Supplementary Table 1). The cycle was changed to collect data continuously in 2018 and the proportion of the less accurate A and B locations decreased to 70%. However, only one turtle was tracked this year for a total of 39 days, which may not provide a dataset robust enough for comparison. In 2019 the duty cycle remained continuously on, and the A and B location data totaled 87% of the total dataset. The similarity in location accuracy in 2017 and 2019 suggests the duty cycle may play a less important role than other variables, such as tracking equipment, in collecting highly accurate data. It is unclear why tags stopped transmitting, as sensor data for tags was not available at the time of analysis.
State space modeling model output did not produce discrete inter-nesting, migration, and foraging phases; instead, there were numerous ARS and migration points intermingled throughout the entire tracking period. It is likely that these turtles were foraging to some extent during the nesting and migration periods. While it was previously believed that turtles do not forage while nesting (Limpus, 1973; Carr, 1975), there is mounting evidence that foraging occurs in the inter-nesting period when forage is available. Dive data from nesting green turtles near Cyprus suggests that foraging behavior may occur between nesting events (Hochscheid et al., 1999) and studies analyzing gut contents have confirmed that opportunistic foraging occurs at nesting sites (Tucker and Read, 2001; Hays et al., 2002). These inter-nesting foraging sites are typically located in close proximity to the nesting beach, as nesting turtles generally limit their movement in order to minimize energy expenditure (Cheng, 2009). However, it appears that the six turtles in our study which made the 300 km trip to Cape Sable area may be exhibiting intentional food-seeking behavior rather than opportunistic feeding. Future studies are needed to determine why turtles are using this site in between nesting events.
We found considerable inter-annual variability in the relative importance of the Cape Sable area. The Cape Sable area was used all 3 years, but by different individuals each year, and never by the same animal twice. Seagrass beds are prevalent in this area and it is likely that these turtles used this site for feeding. Environmental conditions, including ocean currents, can influence turtle movements, but the use of this site each season suggests local conditions are favorable for these adult green turtles. The distribution and abundance of seagrasses in south Florida vary annually (Fourqurean et al., 2001), and the quality of the forage resources at this location may influence energy reserves available for turtles in the next non-breeding seasons.
Inter-nesting intervals lie within the general range reported for green turtles at other sites, with 9–18 day intervals between nests (Carr et al., 1974; Mortimer and Portier, 1989; Broderick et al., 2002; Van de Merwe et al., 2009; Hart et al., 2013). Cooler water temperatures can lengthen the number of days between nesting events for green turtles (Hays et al., 2002), but this phenomenon does not apply to the turtles in this study due to the consistently warm water temperatures in the Gulf of Mexico during the nesting season (Turner et al., 2017). Transiting behavior between nesting events was highly variable within and among individuals, but collectively the turtles exhibited more nomadic behavior than previously reported for nesting green turtles. Studies on inter-nesting behavior in green turtles suggest that turtles generally remain close to their nesting beach (Mortimer and Portier, 1989; Hays et al., 1999; Troeng et al., 2005; Blanco et al., 2013; Hart et al., 2013, 2017; Esteban et al., 2015; Chambault et al., 2016), although individual exceptions have been noted (i.e., Esteban et al., 2015; Chambault et al., 2016; Mettler et al., 2020). Overall, the individuals in our study had greater displacement in between nests than has been previously reported for green turtles, but they all used relatively shallow Gulf waters (mean 6.3 m) in between nesting events.
The mean migration distance using a compilation of tracks from adult green turtles worldwide was estimated at 806 ± 602 km (Hays and Scott, 2013). However, highly variable migration distances have been recorded for green turtles both among study sites and also within individuals from the same study site. The variation in migration distances for individual turtles nesting on a single beach can be over 1,000 km (Luschi et al., 1998; Godley et al., 2002; Hays et al., 2020). On a global scale, the range of distances reported for migration from nesting beach to foraging grounds can be less than 100 km (Whiting et al., 2007; Hart et al., 2017), while distances up to 4,619 km have been recorded in the Indian Ocean (Hays et al., 2020) and 5,278 km along the coast of French Guiana, Suriname, and Brazil (Baudouin et al., 2015).
Our findings are consistent with migration data for turtles nesting within the Gulf of Mexico at Dry Tortugas (5–282 km; Hart et al., 2013) and Buck Island (0.2–694 km; Hart et al., 2017), and also in the Indian Ocean (33–37 km; Whiting et al., 2007). Turtles in these studies traveled less than 200 km to shallow foraging areas after the breeding seasons. It has been hypothesized that these variable migration patterns may reflect the oceanic drift that individuals experienced in their early years as hatchlings or young turtles (Scott et al., 2014). The hatchling drift scenarios for Keewaydin, Sanibel, and Dry Tortugas are similar due to the relatively close proximity of the three sites within the Gulf of Mexico, and post-hatchling turtles from these beaches would likely encounter the same locations along their routes, possibly accounting for the similarity in consistent migration behavior among individuals at the three sites.
The mean migration depth in 2017 was deeper (14.6 m) compared to 2018 and 2019 (8.3 and 8.0 m, respectively). Turtle E migrated southbound along the east coast of Florida in 2017, using much deeper waters in the Atlantic Ocean. Migrations within the Gulf of Mexico were shallow and generally close to the shoreline. Some turtles in this study briefly visited the Cape Sable site along their migration route, and others remained in the area for longer periods of time before initiating migration. Foraging during migration has been reported in sea turtles (Baudouin et al., 2015; Shimada et al., 2020) and these animals may be maintaining foraging site fidelity to the Cape Sable area while en route to their final destinations.
The geographic locations of the three hotspots (Cape Sable, Florida Bay, and Marquesas Keys) determined by the model provided novel information on the foraging grounds for green turtles that nest on the west coast of Florida. Four turtles used the Marquesas Keys as foraging grounds. Turtle F returned to the same location in both 2017 and 2019 and remained there for 345 days in 2017, implying strong site fidelity to this area. High levels of fidelity to foraging grounds is common for both adult and juvenile green turtles (Broderick et al., 2007; Siegwalt et al., 2020).
Unpublished satellite telemetry data indicate that turtles nesting on the east coast also use the Marquesas Key as a foraging site (Bagley et al., 2021, Department of Biology, University of Central Florida, written communication, August 19, 2021). The Eastern Quicksands area is adjacent to the Marquesas Keys and provides important foraging grounds for green turtles that nest along the central Atlantic coast of Florida. Tag returns revealed that these turtles also nest in Quintana Roo, Mexico and Tortuguero, Costa Rica (Bresette et al., 2010), demonstrating that females from multiple nesting populations are using the area as their foraging grounds. Aggregations of foraging adults from multiple nesting beaches have also been reported in other areas such as Dry Tortugas National Park (Naro-Maciel et al., 2017), the Great Barrier Reef (Limpus et al., 2009; Jones et al., 2018), and Nicaragua (Bass et al., 1998). The source rookeries for the green turtles nesting on the west coast of Florida are unknown; genetic analyses of samples collected from nesting females will be required to assess relatedness to Florida east coast turtles.
Four turtles in this study used areas in western Florida Bay area as foraging grounds. The two turtles that foraged closer to shore (Turtle I and Turtle J) maintained much smaller core use areas compared to the turtles that used slightly deeper water into the Gulf of Mexico (Turtle D and Turtle E). This behavior may be a function of food availability, with higher density forage potentially located in shallower waters. One turtle tracked from Dry Tortugas used the Florida Bay area (Hart et al., 2013), and several turtles from an Atlantic coast nesting beach also foraged at this location during the non-nesting season (Bagley et al., 2021, Department of Biology, University of Central Florida, written communication, August 19, 2021), suggesting there could be individuals from multiple rookeries mixing at this foraging ground.
Foraging areas for the turtles in this study were located in relatively shallow habitats (2–6 m) that are likely to support seagrass beds. This is consistent with previous studies on green turtles nesting in Florida. The Eastern Quicksands was identified as a high-density adult green turtle foraging area by the Inwater Research Group (Herren et al., 2018). The depth of the waters at this location (3.1–6.0 m) are similar to those reported in this study and contain a bottom of shifting sand areas interspersed with seagrass beds of Thalassia testudinum and Syringodium filiforme, supporting a density of 58.5 green turtles/km2. Seagrasses are widespread and conspicuous in the marine waters surrounding the southern tip of the Florida peninsula (Schomer and Drew, 1982; Fourqurean et al., 2001; Carlson and Fourqurean, 2016). Future work to determine if the Florida Bay and Cape Sable sites identified in this study contain similar foraging habitat would be worthwhile.
In addition to its importance in the nesting season, the Cape Sable site is a previously unidentified foraging hotspot and core use area. One turtle tracked from Dry Tortugas also used the same areas after nesting (Hart et al., 2013), putting this location on the map, but it was not characterized as a true hotspot prior to this study. A comprehensive study that mapped seagrasses in South Florida revealed exceptionally high biomass of T. testudinum at this exact location (Fourqurean et al., 2001), but more research is needed to confirm current benthic cover. Juvenile green turtles have been reported near this area (Hart and Fujisaki, 2010), and adult turtles may remain faithful to this site as a known high-quality foraging habitat. Future work at this site that includes a combination of underwater video (e.g., Hart et al., 2010), direct observations, and benthic sampling would be valuable.
The results of this study are particularly relevant from a conservation standpoint because of the noteworthy contribution of these foraging grounds to Florida’s green turtle population. The high concentration of green turtles foraging in the neritic habitat in the Florida Keys and Florida Bay region indicates that conservation efforts focused in this region could be beneficial for these imperiled turtle populations. The additional knowledge provided by this study about the convergence of sea turtles found at these important at-sea sites can inform resource management strategies intended to protect turtles nesting in many different areas. Concerted management and restoration plans focused on protecting the turtles in these areas from threats posed by fisheries and watercraft interactions could augment plans in place that protect them from nesting habitat degradation.
The raw data supporting the conclusions of this article will be made available by the authors, without undue reservation.
The animal study was reviewed and approved by the Sanibel Captiva Conservation Foundation. All research was conducted in accordance with federal and state protected species guidelines as stipulated under permitted activities in Florida Marine Turtle Permit #116.
DA conceived the study. DA, KS, and AG contributed to the design of the study and completed the field components of the study. KS and AG organized the database. AB and AG performed the statistical analysis. KS wrote the first draft of the manuscript. KH, AG, DA, and AB wrote sections of the manuscript. All authors contributed to manuscript revision, read, and approved the submitted version.
This research project would not have been possible without the institutional support of the Conservancy of Southwest Florida and the Sanibel-Captiva Conservation Foundation. The Andrea Watts Carlton (AWC) Foundation provided funding for 10 satellite tags in 2019 and technician salary from 2017 to 2019 that contributed to the success of this project. We thank the supporters and friends of sea turtles from both organizations who generously donated the funds we needed to purchase the satellite tags and other equipment. In particular, we were indebted to the late Lavern Gaynor (Keewaydin) and Mark Banks (Sanibel) for their generous contributions to this project. We also acknowledge support toward KH and AB salary for time spent writing and editing from the United States Geological Survey Priority Ecosystem Science Program.
The authors declare that the research was conducted in the absence of any commercial or financial relationships that could be construed as a potential conflict of interest.
All claims expressed in this article are solely those of the authors and do not necessarily represent those of their affiliated organizations, or those of the publisher, the editors and the reviewers. Any product that may be evaluated in this article, or claim that may be made by its manufacturer, is not guaranteed or endorsed by the publisher.
We recognize the tireless efforts of the field staff and interns at the Sanibel Captiva Conservation Foundation and the Conservancy of Southwest Florida. They included at the Conservancy: K. Bashaw, A. Blanchard, L. Blessing, C. Denig, J. Gorges, E. Gross, E. Herberg, L. Johnson, M. Kenton, D. Morris, I. Lezcano-Sierra, M. Sparks, and J. Wissmann; at SCCF: R. Fisher, J. Book, E. Hardin, H. Shipp, J. Brzoza, C. Thomson, L. Kerkes, A. Gosset, E. Phillips, and M. Mills. L. Richardson also generously volunteered his time. We are indebted to the makers of all manner of insect repellents and the originators of bug jackets without which this study would have been more difficult. We thank D. Gregoire-Lucente for helping with formatting the manuscript. Any use of trade, firm, or product names is for descriptive purposes only and does not imply endorsement by the United States Government.
The Supplementary Material for this article can be found online at: https://www.frontiersin.org/articles/10.3389/fmars.2021.775367/full#supplementary-material
Supplementary Figure 1 | Area restricted movement and migration data assigned by SSM for all turtles (2017–2019).
Bailey, H., Mate, B. R., Palacios, D. M., Irvine, L., Bograd, S. J., and Costa, D. P. (2009). Behavioral estimation of blue whale movements in the Northeast Pacific from state-space model analysis of satellite tracks. Endanger. Species Res. 10, 93–106.
Baillie, J. E. M., Hilton-Taylor, C., and Stuart, S. N. (2004). 2004 IUCN Red List of Threatened Species. A Global Species Assessment. Gland, Switzerland and Cambridge, UK: IUCN.
Bass, A. L., Lagueux, C. J., and Bowen, B. W. (1998). Origin of Green Turtles, Chelonia mydas, at “Sleeping Rocks” off the Northeast Coast of Nicaragua. Copeia 4, 1064–1069.
Baudouin, M., Thoisy, B., Chambault, P., Berzins, R., Entraygues, M., Laurent, K., et al. (2015). Identification of key marine areas for conservation based on satellite tracking of post-nesting migrating green turtles (Chelonia mydas). Biol. Conserv. 184, 36–41.
Blanco, G. S., Morreale, S. J., Seminoff, J. A., Paladino, F. V., Piedra, R., and Spotila, J. R. (2013). Movements and diving behavior of internesting green turtles along Pacific Costa Rica. Integr. Zool. 8, 293–306. doi: 10.1111/j.1749-4877.2012.00298.x
Blumenthal, J. M., Solomon, J. L., Bell, C. D., Austin, T. J., Ebanks-Petrie, G., Coyne, M. S., et al. (2006). Satellite tracking highlights the need for international cooperation in marine turtle management. Endanger. Species Res. 2, 51–61.
Breed, G. A., Jonsen, I. D., Myers, R. A., Bowen, W. D., and Leonard, M. L. (2009). Sex-specific seasonal foraging tactics of adult grey seals (Halichoerus grypus) revealed by state-space analysis. Ecology 90, 3209–3221. doi: 10.1890/07-1483.1
Bresette, M. J., Witherington, B. E., Herren, R. M., Bagley, D. A., Gorham, J. C., Traxler, S. L., et al. (2010). Size-class partitioning and herding in a foraging ground of green turtles Chelonia mydas. Endanger. Species Res. 9, 105–116. doi: 10.3354/esr00245
Broderick, A. C., Coyne, M. S., Fuller, W. J., Fiona, G., and Godley, B. J. (2007). Fidelity and over-wintering of sea turtles. Proc. R. Soc. Lond. B 274, 1533–1538. doi: 10.1098/rspb.2007.0211
Broderick, A. C., Glen, F., Godley, B. J., and Hays, G. C. (2002). Estimating the size of nesting populations of green and loggerhead turtles in the Mediterranean. Oryx 36, 227–236. doi: 10.1017/s0030605302000431
Carlson, P. R. Jr., and Fourqurean, J. W. (2016). “Summary report for the Florida Keys National Marine Sanctuary,” in Seagrass Integrated Mapping and Monitoring Report No. 2. Fish and Wildlife Research Institute Technical Report TR-17, version 2, eds L. A. Yarbro and P. R. Carlson Jr. (St. Petersburg: Florida Fish and Wildlife Conservation Commission), 214–221. doi: 10.13140/RG.2.2.12366.05445
Carr, A., Ross, B., and Carr, S. (1974). Internesting behavior of the green sea turtle, Chelonia mydas, at a mid-ocean island breeding ground. Copeia 3, 703–706. doi: 10.2307/1442684
Chaloupka, M., Bjorndal, K., Balazs, G., Bolten, A., Ehrhart, L. M., Limpus, C. J., et al. (2008). Encouraging outlook for recovery of a once severely exploited marine megaherbivore. Glob. Ecol. Biogeogr. 17, 297–304. doi: 10.1111/j.1466-8238.2007.00367.x
Chambault, P., de Thoisy, B., Kelle, L., Berzins, R., Bonola, M., Delvaux, H., et al. (2016). Inter-nesting behavioural adjustments of green turtles to an estuarine habitat in French Guiana. Mar. Ecol. Prog. Ser. 555, 235–248.
Chambault, P., Pinaud, D., Vantrepotte, V., Kelle, L., Entraygues, M., Guinet, C., et al. (2015). Dispersal and Diving Adjustments of the Green Turtle Chelonia mydas in Response to Dynamic Environmental Conditions during Post-Nesting Migration. PLoS One 10:e0137340. doi: 10.1371/journal.pone.0137340
Cheng, I. J. (2009). Changes in diving behaviour during the internesting period by green turtles. J. Exp. Mar. Biol. Ecol. 381, 18–24. doi: 10.1016/j.jembe.2009.08.021
Dalleau, M., Kramer−Schadt, S., Gangat, Y., Bourjea, J., Lajoie, G., and Grimm, V. (2019). Modeling the emergence of migratory corridors and foraging hot spots of the green sea turtle. Ecol. Evol. 9, 10317–10342. doi: 10.1002/ece3.5552
Environmental Systems Research Institute [ESRI] (2019). ArcGIS Pro: 2.4.3. Redlands, CA: Environmental Systems Research Institute.
Esteban, N., van Dam, R. P., Harrison, E., Herrera, A., and Berkel, J. (2015). Green and hawksbill turtles in the Lesser Antilles demonstrate behavioral plasticity in inter-nesting behavior and post-nesting migration. Mar. Biol. 162, 1153–1163. doi: 10.1007/s00227-015-2656-2
Endangered Species Act [ESA] (1973). US Endangered Species Act of 1973, as amended, Pub. L. No. 93-205, 87 Stat. 884 (Dec. 28, 1973). Washington, D.C: U.S. Fish and Wildlife Service.
Foley, A. M. (1997). First documented nesting by the green turtle (Chelonia mydas) along the southwest coast of Florida. Fla. Sci. 4, 205–209.
Fourqurean, J. W., Willsie, A., Rose, C. D., and Rutten, L. M. (2001). Spatial and temporal pattern in seagrass community composition and productivity in south Florida. Mar. Biol. 138, 341–354.
Fujisaki, I., Hart, K. M., and Sartain-Iverson, A. R. (2016). Habitat selection by green turtles in a spatially heterogeneous benthic landscape in dry Tortugas National Park, Florida. Aquat. Biol. 24, 185–199. doi: 10.3354/ab00647
Getis, A., and Ord, J. K. (1992). The Analysis of Spatial Association by Use of Distance Statistics. Geogr. Anal. 24, 189–206. doi: 10.1111/j.1538-4632.1992.tb00261.x
Godley, B. J., Richardson, S., Broderick, A. C., Coyne, M. S., Glen, F., and Hays, G. C. (2002). Long-term satellite telemetry of the movements and habitat utilization by green turtles in the Mediterranean. Ecography 25, 352–362. doi: 10.1034/j.1600-0587.2002.250312.x
Hart, K. M., and Fujisaki, I. (2010). Satellite tracking reveals habitat use by juvenile green sea turtles (Chelonia mydas) in the Everglades, Florida, USA. Endanger. Species Res. 11, 221–232. doi: 10.3354/esr00284
Hart, K. M., Guzy, J. C., and Smith, B. J. (2021). Drivers of realized satellite tracking duration in marine turtles. Mov. Ecol. 9:1. doi: 10.1186/s40462-020-00237-3
Hart, K. M., Iverson, A. R., Benscoter, A. M., Fujisaki, I., Cherkiss, M. S., Pollock, C., et al. (2017). Resident areas and migrations of female green turtles nesting at Buck Island Reef National Monument, St. Croix, US Virgin Islands. Endanger. Species Res. 32, 9–101.
Hart, K. M., Lamont, M. M., Iverson, A. R., and Smith, B. J. (2020). The importance of the Northeastern Gulf of Mexico to foraging loggerhead sea turtles. Front. Mar. Sci. 7:330. doi: 10.3389/fmars.2020.00330
Hart, K. M., Zawada, D. G., Fujisaki, I., and Lidz, B. H. (2010). Inter-nesting habitat-use patterns of loggerhead sea turtles: enhancing satellite tracking with benthic mapping. Aquat. Biol. 11, 77–90. doi: 10.3354/ab00296
Hart, K. M., Zawada, D. G., Fujisaki, I., and Lidz, B. H. (2013). Habitat use of breeding green turtles (Chelonia mydas) tagged in Dry Tortugas National Park: making use of local and regional MPAs. Biol. Conserv. 161, 142–154. doi: 10.1016/j.biocon.2013.03.019
Hatase, H., Sato, K., Yamaguchi, M., Takahashi, K., and Tsukamoto, K. (2006). Individual variation in feeding habitat use by adult female green sea turtles (Chelonia mydas): are they obligately neritic herbivores? Oecologia 149, 52–64. doi: 10.1007/s00442-006-0431-2
Hays, G. C., Bailey, H., Bograd, S. J., Bowen, D., Campagna, C., Carmichael, R. H., et al. (2019). Translating marine animal tracking data into conservation policy and management. Trends Ecol. Evol. 34, 459–473. doi: 10.1016/j.tree.2019.01.009
Hays, G. C., Broderick, A. C., Glen, F., Godley, B. J., Houghton, J. D. R., and Mertcalfe, J. D. (2002). Water temperature and interesting intervals for loggerhead (Caretta caretta) and green (Chelonia mydas) sea turtles. J. Therm. Biol. 27, 429–432. doi: 10.1016/s0306-4565(02)00012-8
Hays, G. C., and Hawkes, L. A. (2018). Satellite tracking sea turtles: opportunities and challenges to address key questions. Front. Mar. Sci. 5:432. doi: 10.3389/fmars.2018.00432
Hays, G. C., Luschi, P., Papi, F., del Seppia, C., and Marsh, R. (1999). Changes in behavior during the interesting period and post-nesting migrations for Ascension Island green turtles. Mar. Ecol. Prog. Ser. 189, 263–273. doi: 10.3354/meps189263
Hays, G. C., Rattray, A., and Esteban, N. (2020). Addressing tagging location bias to assess space use by marine animals. J. App. Ecol. 57, 1981–1987. doi: 10.1111/1365-2664.13720
Hays, G. C., and Scott, R. (2013). Global patterns for upper ceilings on migration distance in sea turtles and comparisons with fish, birds and mammals. Funct. Ecol. 27, 748–756.
Herren, R. M., Bagley, D. A., Bresette, M. J., Hollaway-Adkins, K. G., Clark, D., and Witherington, B. E. (2018). Sea turtle abundance and demographic measurements in a marine protected area in the Florida Keys, USA. Herpetol. Conserv. Biol. 13, 224–239.
Hijmans, R. J. (2019). geosphere: spherical Trigonometry. R package version 1.5-10. Available online at: https://CRAN.R-project.org/package=geosphere (accessed May 20, 2021).
Hochscheid, S., Godley, B. J., Broderick, A. C., and Wilson, R. P. (1999). Reptilian diving: highly variable dive patterns in the green turtle Chelonia mydas. Mar. Ecol. Prog. Ser. 185, 101–112. doi: 10.3354/meps185101
Iverson, A. R., Benscoter, A. M., Fujisaki, I., Lamont, M. M., and Hart, K. M. (2020). Migration Corridors and Threats in the Gulf of Mexico and Florida Straits for Loggerhead Sea Turtles. Front. Mar. Sci. 7:208. doi: 10.3389/fmars.2020.00208
Jones, K., Jensen, M., Burgess, G., Leonhardt, J., van Herwerden, L., Hazel, J., et al. (2018). Closing the gap: mixed stock analysis of three foraging populations of green turtles (Chelonia mydas) on the Great Barrier Reef. PeerJ 6:e5651. doi: 10.7717/peerj.5651
Jonsen, I. (2016). Joint estimation over multiple individuals improves behavioural state inference from animal movement data. Sci. Rep. 6:20625. doi: 10.1038/srep20625
Jonsen, I., Bestley, S., Wotherspoon, S., Sumner, M., and Flemming, J. M. (2017). Bsam: bayesian State-Space Models for Animal Movement. Available Online at: https://cran.rproject.org/web/packages/bsam/index.html (Last accessed October 2, 2020).
Jonsen, I. D., Flemming, J. M., and Myers, R. A. (2005). Robust state-space modeling of animal movement data. Ecology 86, 3055–3063.
Lamont, M. M., Fujisaki, I., Stephens, B. S., and Hackett, C. (2015). Home range and habitat use of juvenile green turtles (Chelonia mydas) in the northern Gulf of Mexico. Anim. Biotelemetry 3:53. doi: 10.1186/s40317-015-0089-9
Limpus, C. (1973). Loggerhead turtles (Caretta caretta) in Australia: food sources while nesting. Herpetologica 29, 42–45.
Limpus, C. J., Bell, I. P., and Miller, J. D. (2009). Mixed stocks of green turtles foraging on Clack Reef, Northern Great Barrier Reef identified from long term tagging studies. Mar. Turtle Newsl. 123, 3–5.
Luschi, P., Hays, G. C., Del Seppia, C., Marsh, R., and Papi, F. (1998). The navigational feats of green sea turtles migrating from Ascension Island investigated by satellite telemetry. Proc. R. Soc. Lond. B 265, 2279–2284. doi: 10.1098/rspb.1998.0571
Mansfield, K. L., Saba, V. S., Keinath, J. A., and Musick, J. A. (2009). Satellite tracking reveals a dichotomy in migration strategies among juvenile loggerhead turtles in the Northwest Atlantic. Mar. Biol. 156, 2555–2570. doi: 10.1007/s00227-009-1279-x
Maxwell, S. M., Breed, G. A., Nickel, B. A., Makanga-Bahouna, J., Pemo-Makaya, E., Parnell, R. J., et al. (2011). Using satellite tracking to optimize protection of long-lived marine species: olive ridley sea turtle conservation in central Africa. PLoS One 6:e19905. doi: 10.1371/journal.pone.0019905
Mazaris, A. D., Schofield, G., Gkazinou, C., Almpanidou, V., and Hays, G. C. (2017). Global sea turtle conservation successes. Sci. Adv. 3:e1600730. doi: 10.1126/sciadv.1600730
Mettler, E. K., Clyde-Brockway, C. E., Sinclair, E. M., Paladino, F. V., and Honarvar, S. (2020). Determining critical inter-nesting, migratory, and foraging habitats for the conservation of East Atlantic green turtles (Chelonia mydas). Mar. Biol. 167:106.
Metz, T. L., Gordon, M., Mokrech, M., and Guillen, G. (2020). Movements of juvenile green turtles (Chelonia mydas) in the nearshore waters of the northwestern Gulf of Mexico. Front. Mar. Sci. 7:647. doi: 10.3389/fmars.2020.00647
Mortimer, J. A., and Portier, K. (1989). Reproductive homing and internesting behavior of the green turtle (Chelonia mydas) at Ascension Island, South Atlantic Ocean. Copeia 4, 962–977.
Naro-Maciel, E., Hart, K. M., Cruciata, R., and Putman, N. F. (2017). DNA and dispersal models highlight constrained connectivity in a migratory marine megavertebrate. Ecography 40, 586–597. doi: 10.1111/ecog.02056
NMFS-SEFSC. (2008). Sea Turtle Research Techniques Manual. NOAA Technical Memorandum. NMFS-SEFSCF-579. Panama City, FL: NMFS-SEFSC.
NOAA National Geophysical Data Center (2001). U.S. Coastal Relief Model Vol.3 - Florida and East Gulf of Mexico. Available Online at: https://doi.org/10.7289/V5W66HPP (accessed 2021/10/15).
Plummer, M. (2019). rjags: bayesian Graphical Models using MCMC. R package version 4–10. Available Online at: https://CRAN.R-project.org/package=rjags (Last accessed May 15, 2020).
R Core Team (2020). R: a language and environment for statistical computing. Vienna, Austria: R Foundation for Statistical Computing.
Santos, R. G., Martins, A. S., Batista, M. B., and Horta, P. A. (2015). Regional and local factors determining green turtle Chelonia mydas foraging relationships with the environment. Mar. Ecol. Prog. Ser. 529, 265–277. doi: 10.3354/meps11276
Schomer, N. S., and Drew, R. D. (1982). An ecological characterization of the lower Everglades, Florida Bay and the Florida Keys. Washington, DC: United States. Fish and Wildlife Service. Office of Biological Service.
Scott, R., Marsh, R., and Hays, G. C. (2014). Ontogeny of long distance migration. Ecology 95, 2840–2850.
Seminoff, J. A. (2004). Chelonia mydas. The IUCN Red List of Threatened Species 2004: e.T4615A11037468. Cambridge, UK: International Union for Conservation of Nature and Natural Resources.
Seminoff, J. A., Zarante, P., Coyne, M., Foley, D. G., Parker, D., Lyon, B. N., et al. (2008). Post-nesting migrations of Galápagos green turtles Chelonia mydas in relation to oceanographic conditions: integrating satellite telemetry with remotely sensed ocean data. Endanger. Species Res. 4, 57–72.
Shamblin, B. M., Hart, K. M., Martin, K. J., Ceriani, S. A., Bagley, D. A., Mansfield, K. L., et al. (2020). Green turtle mitochondrial microsatellites indicate finer scale natal homing to isolated islands than to continental nesting sites. Mar. Ecol. Prog. Ser. 643, 159–171.
Shaver, D. J., Frandsen, H. R., George, J. A., and Gredzens, C. (2020). Green Turtle (Chelonia mydas) Nesting Underscores the Importance of Protected Areas in the Northwestern Gulf of Mexico. Front. Mar. Sci. 7:673. doi: 10.3389/fmars.2020.00673
Shaver, D. J., Hart, K. M., Fujisaki, I., Rubio, I., Sartain-Iverson, A. R., Pena, J., et al. (2016). Migratory corridors of adult female Kemp’s ridley turtles in the Gulf of Mexico. Biol. Conserv. 194, 158–167. doi: 10.1002/ece3.594
Shillinger, G. O., Swithenbank, A. M., Bograd, S. J., Bailey, H., Castleton, M. R., Wallace, B. P., et al. (2010). Identification if high-use internesting habitats for eastern Pacific leatherback turtles: role of the environment and implications for conservation. Endanger. Species Res. 10, 215–232.
Shimada, T., Limpus, C. J., Hamann, M., Bell, I., Esteban, N., Groom, R., et al. (2020). Fidelity to foraging sites after long migrations. J. Anim. Ecol. 89, 1008–1016. doi: 10.1111/1365-2656.13157
Siegwalt, F., Benhamou, S., Girondot, M., Jeantet, L., Martin, J., Bonola, M., et al. (2020). High fidelity of sea turtles to their foraging grounds revealed by satellite tracking and capture-mark-recapture: new insights for the establishment of key marine conservation areas. Biol. Conserv. 250:108742. doi: 10.1016/j.biocon.2020.108742
Thomson, J. A., Börger, L., Christianen, M. J. A., Esteban, N., Laloë, J. O., and Hays, G. C. (2017). Implications of location accuracy and data volume for home range estimation and fine-scale movement analysis: comparing Argos and Fastloc-GPS tracking data. Mar. Biol. 164:204. doi: 10.1007/s00227-017-3225-7
Troeng, S., Evans, D. R., and Lagueux, C. J. (2005). Migration of green turtles Chelonia mydas from Tortuguero, Costa Rica. Mar. Biol. 148, 435–447. doi: 10.1007/s00227-005-0076-4
Tucker, A. D., and Read, M. A. (2001). Frequency of foraging by gravid green turtles (Chelonia mydas) at Raine Island, Great Barrier Reef. J. Herpetol. 35, 500–503.
Turner, R. E., Rabalaids, N. R., and Justiæ, R. (2017). Trends in summer bottom-water temperatures on the northern Gulf of Mexico continental shelf from 1985 to 2015. PLoS One 12:e0184350. doi: 10.1371/journal.pone.0184350
Valdivia, A., Wolf, S., and Suckling, K. (2019). Marine mammals and sea turtles listed under the U.S. Endangered Species Act are recovering. PLoS One 14:e0210164. doi: 10.1371/journal.pone.0210164
Van de Merwe, J. P., Ibrahim, K., Kee, S. Y., and Whittier, J. M. (2009). Habitat use by green turtles (Chelonia mydas) nesting in Peninsular Malaysia: local and regional conservation implications. Wildl. Res. 36, 637–645. doi: 10.1071/wr09099
Wallace, B. P., DiMatteo, A. D., Hurley, B. J., Finkbeiner, E. M., Bolten, A. B., Chaloupka, M. Y., et al. (2010). Regional management units for marine turtles: a novel framework for prioritizing conservation and research across multiple scales. PLoS One 5:e15465. doi: 10.1371/journal.pone.0015465
Whiting, S. D., Murray, W., Macrae, I., Thorn, R., Chongkin, M., and Kock, A. U. (2007). Non-migratory breeding by isolated green sea turtles (Chelonia mydas) in the Indian Ocean: biological and conservation implications. Naturwissenschaften 95, 355–360. doi: 10.1007/s00114-007-0327-y
Keywords: green turtle, home range, movement paths, satellite tracking, state space modeling
Citation: Sloan KA, Addison DS, Glinsky AT, Benscoter AM and Hart KM (2022) Inter-Nesting Movements, Migratory Pathways, and Resident Foraging Areas of Green Sea Turtles (Chelonia mydas) Satellite-Tagged in Southwest Florida. Front. Mar. Sci. 8:775367. doi: 10.3389/fmars.2021.775367
Received: 13 September 2021; Accepted: 10 November 2021;
Published: 04 January 2022.
Edited by:
Michael Paul Jensen, Southwest Fisheries Science Center (NOAA), United StatesReviewed by:
Graeme Clive Hays, Deakin University, AustraliaCopyright © 2022 At least a portion of this work is authored by Allison M. Benscoter and Kristen M. Hart on behalf of the U.S. Government and as regards Allison M. Benscoter, Kristen M. Hart, and the U.S. Government, is not subject to copyright protection in the United States. Foreign and other copyrights may apply. This is an open-access article distributed under the terms of the Creative Commons Attribution License (CC BY). The use, distribution or reproduction in other forums is permitted, provided the original author(s) and the copyright owner(s) are credited and that the original publication in this journal is cited, in accordance with accepted academic practice. No use, distribution or reproduction is permitted which does not comply with these terms.
*Correspondence: Kelly A. Sloan, a3Nsb2FuQHNjY2Yub3Jn
†ORCID: Kelly A. Sloan, orcid.org/0000-0003-3982-2733; Andrew T. Glinsky, orcid.org/0000-0001-6940-946X; Allison M. Benscoter, orcid.org/0000-0003-4205-3808; Kristen M. Hart, orcid.org/0000-0001-7520-6669
Disclaimer: All claims expressed in this article are solely those of the authors and do not necessarily represent those of their affiliated organizations, or those of the publisher, the editors and the reviewers. Any product that may be evaluated in this article or claim that may be made by its manufacturer is not guaranteed or endorsed by the publisher.
Research integrity at Frontiers
Learn more about the work of our research integrity team to safeguard the quality of each article we publish.