
94% of researchers rate our articles as excellent or good
Learn more about the work of our research integrity team to safeguard the quality of each article we publish.
Find out more
ORIGINAL RESEARCH article
Front. Mar. Sci., 06 January 2022
Sec. Marine Molecular Biology and Ecology
Volume 8 - 2021 | https://doi.org/10.3389/fmars.2021.773210
This article is part of the Research TopicMarine Biological Materials: Functional Mechanisms and Environmental Impacts from the Molecular to the Macro-ScaleView all 11 articles
Microbial plankton is essential for ocean biogeochemistry. As part of the prokaryotic phototrophic microbial community, both oxygenic phototrophs (OP) and anoxygenic phototrophs (AP) are widely distributed in the ocean and may play a significant role in carbon flow and oxygen production. However, comparative studies of microbial OP and AP have received very little attention, even though their different roles might be important in various marine environments, especially in oxygen minimum zones (OMZ). We explored the spatial distribution of the microbial community in the Baltic Sea, including an OMZ region, with a particular focus on the distribution and activity of OP and AP. We used 16S rRNA amplicon sequencing in combination with a qPCR-based quantification of photosynthesis marker genes. We found that specific bacterial groups dominated surface and intermediate depths, the OMZ, and deep waters, respectively. Salinity, temperature, oxygen, and depth were significant factors explaining the microbial community composition and distribution. A high diversity of OP and AP was observed, including OP-Chlorophyta, Diatoms, Cyanobacteria and Cryptomonads, and AP-Proteobacteria and Chloroflexota. OP were more abundant at most stations compared to AP. OP showed high photosynthetic activity and more photosynthesis activity in higher temperature and upper waters, while AP photosynthesis cannot be detected in most stations. Both, cyanobacterial and eukaryotic OP preferred to live in higher temperature and upper waters, but Cyanobacteria also preferred to live in oxic water while the whole OP community showed preference to live in higher salinity area. However, AP did not show any significant hydrochemical preference but prefer to live with OP community. The Baltic Sea is exposed to multiple climate change related stressors, such as warming, decreasing salinity, and deoxygenation. This study contributes to understanding and interpretation of how microbial community, especially phototrophic groups, might shift in their distribution and activity in a changing ocean like the Baltic Sea.
Microbial plankton has a global and major impact on ocean biogeochemistry (Falkowski et al., 2008), and its distribution and importance has been studied throughout many ocean areas (Brown et al., 2009; Alves Junior et al., 2015; Fernandes et al., 2020). However, there are still gaps in the fundamental ecological information about the biogeographical and spatial distributions of these organisms and their interaction with their environment. Among microbial plankton, oxygenic phototrophs (OP) are the key group to take up carbon and the main contributor to marine primary production (Raven, 2009). OP consist of two groups, Cyanobacteria and Eukaryotic algae (Liu et al., 2016), which carry out photosynthesis using chlorophyll (Chl) through photosystem I (PSI) and II (PSII) and release O2 during this process (Luuc et al., 1999). On the other hand, anoxygenic phototrophs (AP), especially aerobic anoxygenic phototrophs (AAP), have been considered to have a unique role in the ocean carbon cycle due to their ability to generate energy by capturing light and faster growth rates than other bacterioplankton (Koblížek et al., 2007; Ferrera et al., 2011; Garcia-Chaves et al., 2016). AAP are photoheterotrophs, while the other group of AP, anaerobic anoxygenic phototrophs (AnAP), are photoautotrophs under the presence of light and anoxic conditions (Yurkov and Beatty, 1998; Koblížek, 2015; Imhoff, 2017). Both AAP and AnAP could use bacteriochlorophyll (BChl) to capture light and produce ATP through either type-I or type-II photosystems without releasing O2 (Imhoff et al., 2018; Fecskeová et al., 2019). The major group of AP, belonging to Proteobacteria (such as orders Sphingomonadales and Rhodobacterales), have been shown to be abundant and diverse in the ocean, and may play an important but underestimated role in marine productivity and energy flow (Karl, 2002; Yutin et al., 2007; Boeuf et al., 2013). As both OP and AP could use light as an energy source, and play important roles in biogeochemical cycle and energy flow in the ocean, the relative distribution and activity of OP and AP shifting to different environment could influence carbon and oxygen dynamics vital for ocean ecology.
The diversity and abundance of AP, especially AAP, has been studied in many marine environments using different methods, such as qPCR and metagenomics using the AP photosynthesis specific marker gene pufM [encoding the Type-2 photosynthetic reaction center subunit M (Imhoff et al., 2018)], bchY (encoding both the Type-1 and Type-2 photosynthesis chlorophyllide oxidoreductase subunit Y) (Yutin et al., 2007, 2009; Salka et al., 2008; Bibiloni-Isaksson et al., 2016; Cuadrat et al., 2016), and BChl-based fluorescence detection (Cottrell et al., 2006; Lami et al., 2007; Zhang and Jiao, 2007). By screening the specific marker genes in the metagenome database from the Global Ocean Sampling Expedition, AAP account for 1–10% of total prokaryotes in the surface ocean (Yutin et al., 2007). Similar quantities were obtained when using fluorescence detection, with the average abundance 1–7% of total prokaryotes in oligotrophic ocean areas including the Mediterranean (1–4% in Hojerová et al., 2011), 2–15% of total prokaryotes in shelf seas (Koblížek, 2015), and 1–12% in a late spring bloom situation in the Baltic Sea (Montecchia et al., 2006). A substantially higher fraction of AAP of around 25% of total bacteria was detected in the oligotrophic South Pacific Ocean (Lami et al., 2007).
Modern approaches to quantify prokaryotic OP in parallel to AP included chlorophyll a (Chla) quantification (Koblížek et al., 2006, 2007; Hojerová et al., 2011), and flow cytometry to determine abundances of Cyanobacteria (Synechococcus and Prochlorococcus), but also autotrophic eukaryotes (Zhang and Jiao, 2007; Liu et al., 2010). Other approaches used metagenomics to target the OP photosynthesis-specific marker genes psbA (a PSII reaction center protein D1) and psaA (PSI P700 Chla apoprotein A1) (Alcamán-Arias et al., 2018; Sieradzki et al., 2018). By comparing specific marker gene abundances in a metagenome from the upper seawater (< 40 m) of the coastal area of the San Pedro Channel in the Pacific Ocean (Sieradzki et al., 2018), OP-PSI related genes were 2–3 times more abundant than AAP photosynthesis related genes. In surface waters of the Mediterranean coast, Synechococcus was substantially more abundant than AAP (2–14% vs. 0.2–6.3% of total prokaryotes) (Ferrera et al., 2014). In a depth profile of the Kuroshio Current water system of the East China Sea, various OP peaked in surface waters, while AAP reached a maximum abundance between 42 and 76 m water depth (Zhang and Jiao, 2007). Many environmental variables have been proposed to influence the abundance and distribution of OP and AP, respectively. These include temperature, salinity, light attenuation, and nutrient concentrations (Paerl, 2012; Ferrera et al., 2014; Liu et al., 2016). However, comparative studies of the ecology of OP and AP are still quite rare, and the role of AP is yet not well understood. Furthermore, most studies only focus on AAP in oxic environments, but AnAP in anoxic water may play an increasing role in the future while anoxic ocean water might expand to even reach euphotic zone, as oxygen-depleted ocean regions have already increased over the last 50–100 years, and are predicted to further expand and intensify (Van Cappellen et al., 2008; Levin, 2018).
The Baltic Sea is an example of a marine region with expanding oxygen depleted waters. It is characterized as a large semi-enclosed and shallow brackish sea affected by deoxygenation, acidification, and anthropogenic nutrient pollution. Over the last 115 years, the Baltic Sea has experienced a severe expansion of oxygen depleted waters, which today cover an area of 12,000–70,000 km2 (Rutgersson et al., 2014; Reusch et al., 2018). Coastal waters of the Baltic Sea are especially prone to increased nutrient pollution causing eutrophication, frequent events of anoxia and hypoxia, and shifts from benthic to pelagic primary production (Carstensen et al., 2014; Rutgersson et al., 2014; Breitburg et al., 2018; Reusch et al., 2018). Different conditions with regard to deoxygenation, acidification and nutrient status have been studied in the various sub-basins of the Baltic Sea, and steep gradients of salinity and overlapping gradients of biologically relevant elements introduce dramatic geographical and seasonal changes of the microbial community (Mašín et al., 2006; Conley et al., 2009; Bentzon-Tilia et al., 2015). Salinity has been described as a driving factor for community shifts in the Baltic Sea, e.g., Actinobacteria dominating low-salinity areas, while high-salinity areas are dominated by Proteobacteria and Bacteroidetes (Dupont et al., 2014). Typically, the Baltic Sea primary producer community is dominated by Diatoms and Dinophytes from March to May and by Cyanobacteria and to a lesser extent by Dinophytes and Chlorophytes from September to October (Stoń et al., 2002; Norbent and Steffen, 2003). In addition, AAP (∼12% of total bacteria) were identified in the Baltic Sea waters (< 50 m), with a maximum in summer and a minimum in winter (Mašín et al., 2006). Due to the combination of climate-related threats, the Baltic Sea has been described as a “time machine” for how future oceans could respond to climate change (Reusch et al., 2018). This makes it an interesting environment to investigate the pattern of microbes and different phototrophs in a future ocean analog, which, especially, in relation to oxygen-depleted areas requires further research.
To address this topic, we studied the spatial pattern of bacterial diversity and abundance in the Baltic Sea, with a specific focus on AP and OP (without eukaryotic algae), using 16S rRNA amplicon sequencing. An oxygen minimum zone (OMZ) was included in our sampling strategy. We also used qPCR targeting specific marker genes of AP and OP (including eukaryotic algae) to detect and compare their diversity and distribution. The most common used marker genes, pufM and bchY, were used for targeting AP. The psbA gene was used for targeting OP. We further used gene expression profiles of psbA and pufM genes (Sharon et al., 2007; Kong et al., 2014; Alcamán-Arias et al., 2018; Fecskeová et al., 2019), as well as carbon fixation rates to understand photosynthesis activity in the different basins of the Baltic Sea. Here, we investigate the spatial pattern of expression of psbA and pufM and compare their roles in different Baltic Sea environments to extend the understanding of how the role of those different groups of phototrophic groups in a changing ocean.
Samples were collected during a cruise from Sep. 17th to Sep. 28th, 2019, on the German research vessel RV Alkor (Alkor528). The Baltic Sea water was collected at depths between 3 and 115 m at the following locations: Kiel Fjord (K06), Arkona Basin (AB21, AB31), Bornholm Basin (BB23, BB15, BB08, BB31) and Gotland Basin (GB84, GB90a, GB107, GB108) (Figure 1). The samples were collected with a 10L Niskin bottle rosette water sampler, equipped with a conductivity-temperature-depth (CTD) sensor. pH was measured by the PHM210 standard pH meter (Radiometer Analytical, Meterlab). For Chla analysis, 0.5 L of seawater was collected and immediately filtered through 45 mm GF/F Whatman filters with a pore size of 0.7 μm and stored at −20°C for further later usage. Chla was extracted using 100% acetone from homogenized filters, and clear extracts were analyzed using trilogy laboratory fluorometer (Turner Designs). A serial dilution of a Chla standard (Sigma Aldrich, St Louis, United States) was used to calibrate for the fluorometer. For dissolved inorganic carbon (DIC) analysis, 12 ml water was filled bubble free in 12 ml exetainers, fixed immediately with 20 μl saturated mercury chloride solution and stored at room temperature. The analysis was carried out following the method described in Hall and Aller (1992) with a standard solution of 2 mM NaHCO3. For carbon fixation rates, water samples were filled bubble-free into 2.4 L glass bottles. Subsequently, 1 ml H13CO3 solution (1 g per 50 ml, Sigma-Aldrich, Saint Louis Missouri, United States) was added to each bottle through an air-tight septum and bottles were shaken to mix properly. After 24 h of incubation time in natural light conditions on the ship’s deck, samples were filtered through pre-combusted (450°C, 4–6 h) 45 mm 0.7 GF/F Whatman filters and then stored at −20°C until further analysis. Filters were acidified and dried before analysis on an Elemental Analyzer Flash EA 1112 series (Thermo Fisher) connected to an isotope ratio mass spectrometer (Finnigan Delta Plus XP, Thermo Fisher Scientific). Triplicate samples were measured for Chla, DIC and carbon fixation rates analysis.
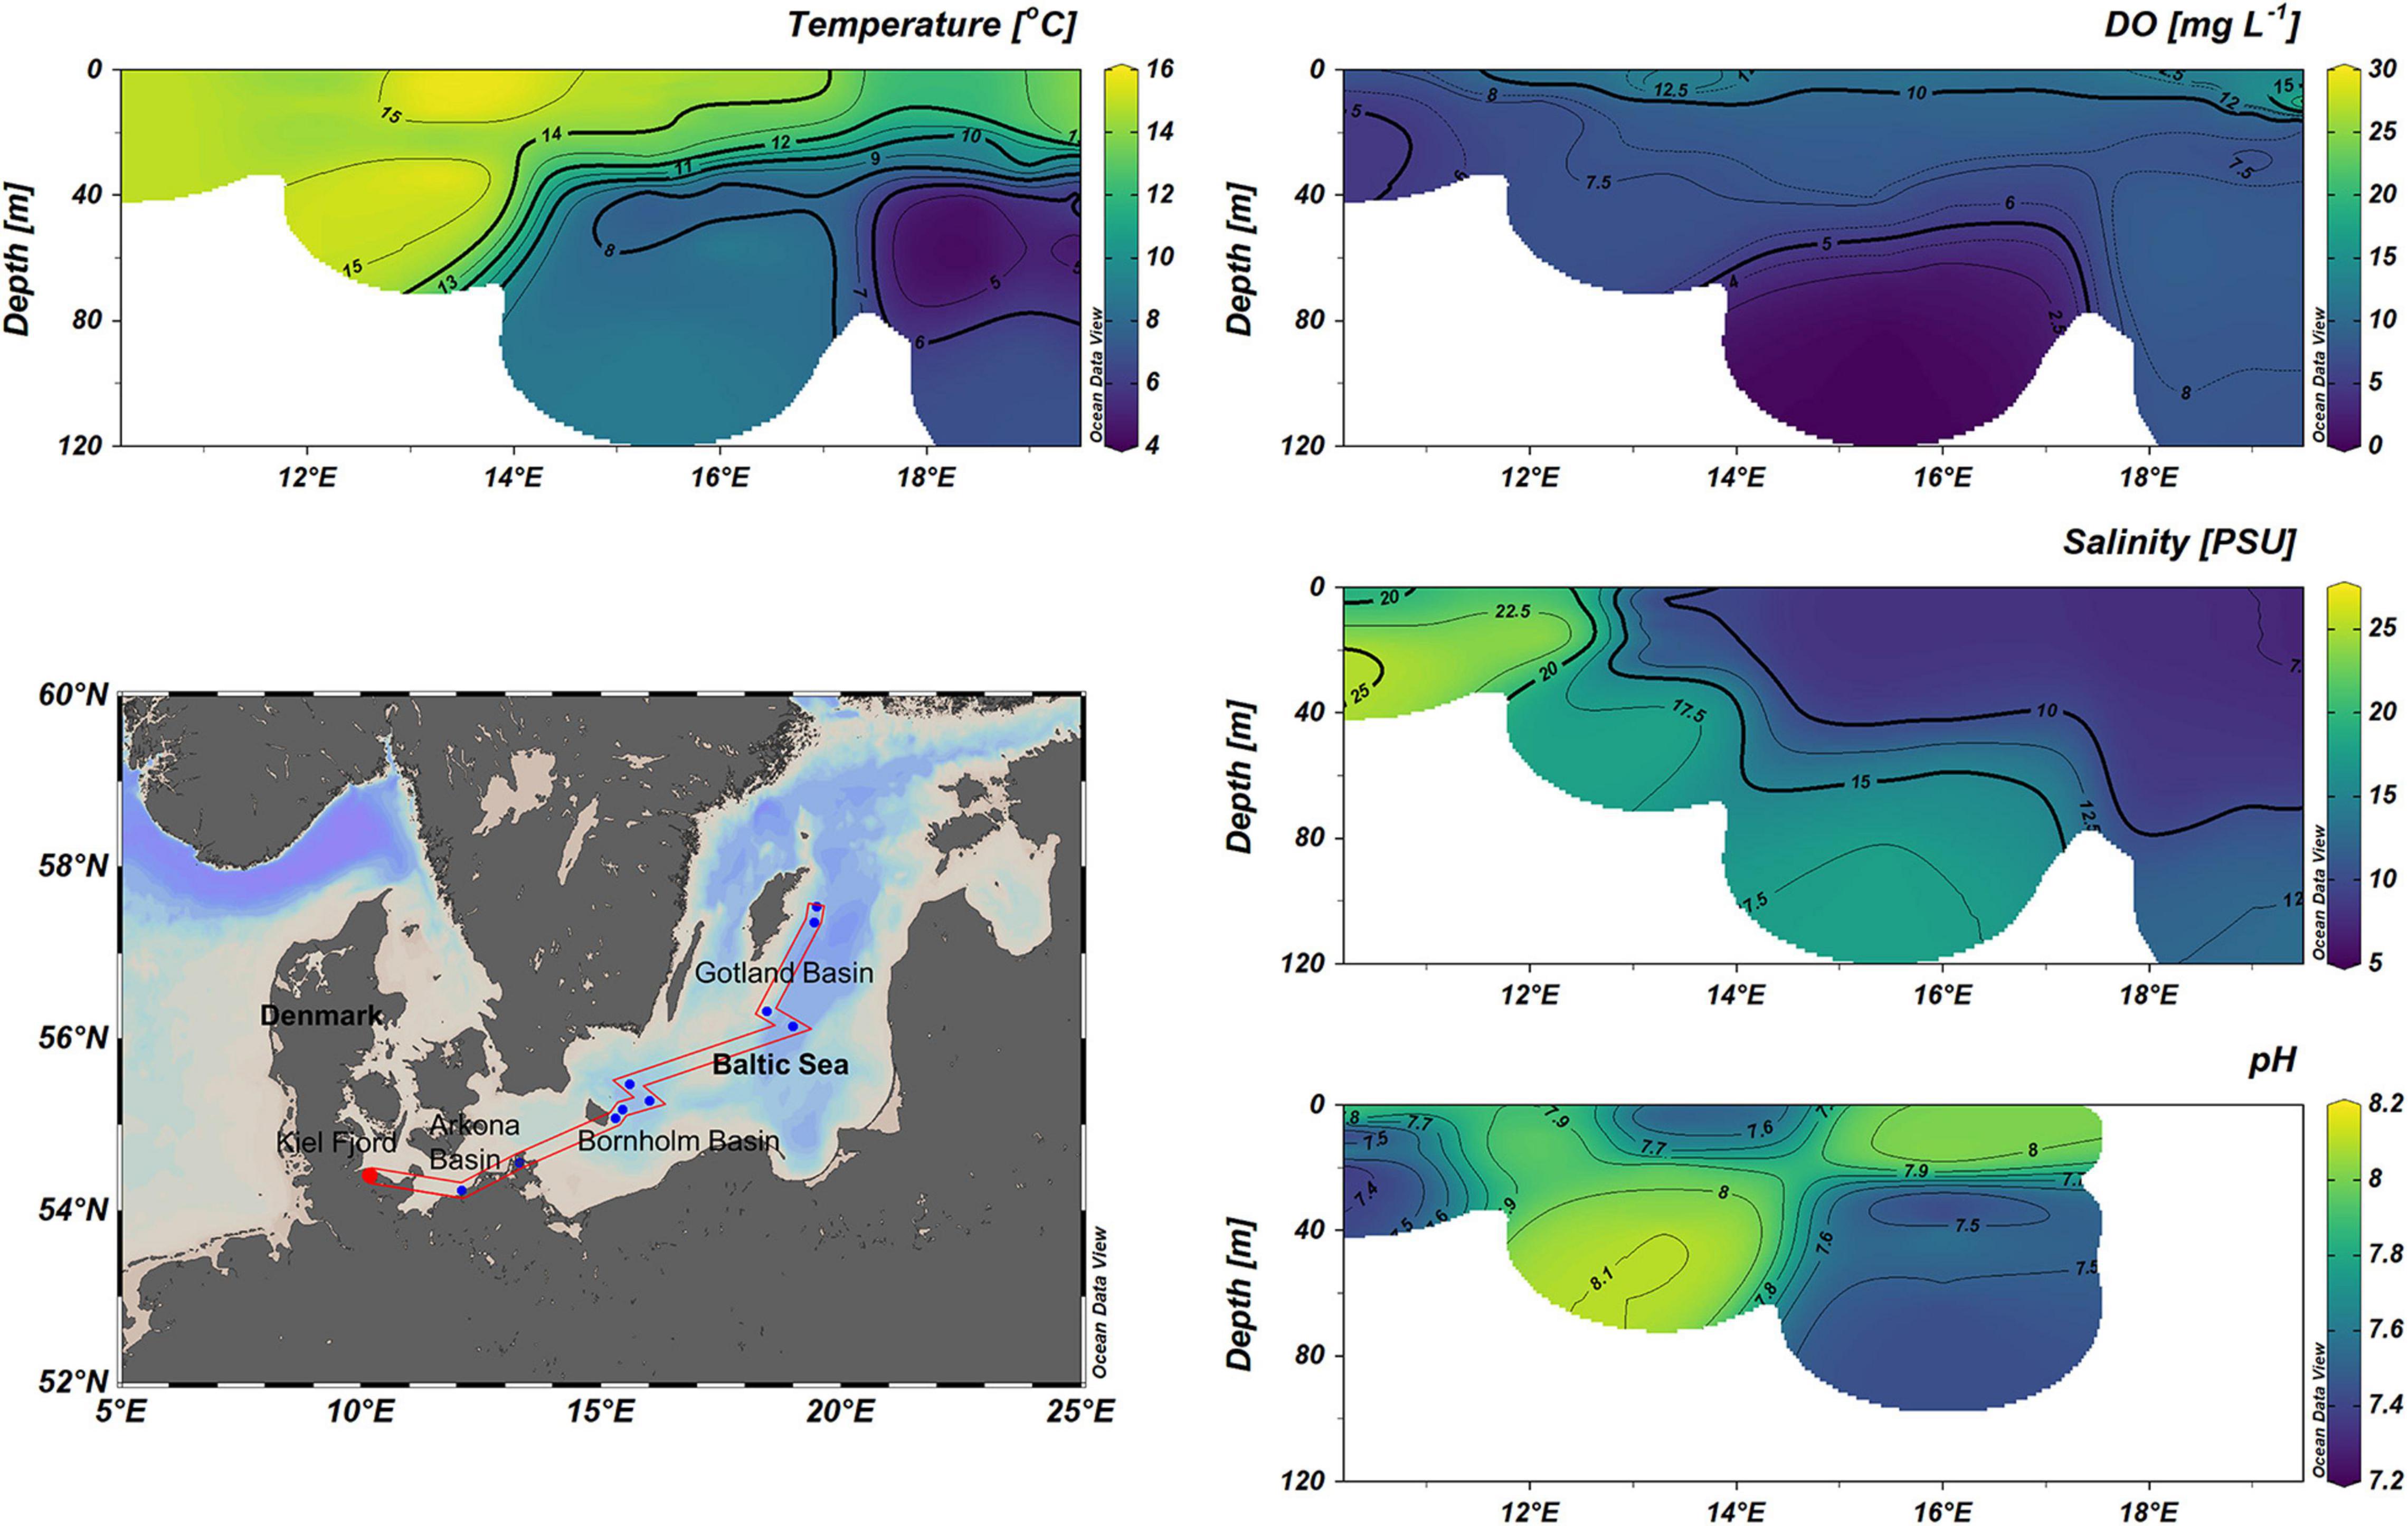
Figure 1. Sampling distributions and vertical profiles of temperature, salinity, pH, and concentrations of dissolved oxygen in the Baltic Sea.
For DNA and RNA analysis, 0.5–1 L of seawater was collected and immediately filtered onto a 0.22 μm MCE membrane filter (Merck Millipore Ltd., Ireland) and stored at −80°C for 10 months until further analysis. To extract the DNA and RNA, filters were flash-frozen in liquid nitrogen and crushed. DNA and RNA were extracted using the MasterPure Complete (MPC) DNA and RNA Purification Kit (Lucigen, United States), according to the manufacturer’s protocol. Nucleic acids were quality checked on a spectrofluorometer (MySpec, VWR, Radnor, United States). DNase I, Amplification Grade (Invitrogen, Thermo Fisher Scientific, United Kingdom), was used to digest DNA in all RNA samples before further analysis. The purity of RNA was checked via qPCR for pufM and psbA using RNA as a template. No amplification could be detected. Subsequently, cDNA was generated from the DNase I-treated RNA samples following the instructions of the QuantiTect Reverse Transcription Kit (Qiagen, Hilden, Germany). In total, 16 samples of DNA were sequenced using Illumina Miseq sequencing targeting the V1-2 regions of the 16S rRNA, which was amplified using the primer pair 27F (5′→ 3′ AGAGTTTGATCCTGGCTCAG) and 338R (5′→ 3′ TGCTGCCTCCCGTAGGAGT) (Peiffer et al., 2013). After an initial denaturation at 98°C for 30 s, 30 cycles of 98°C for 9 s, 55°C for 60 s, and 72°C for 90 s were run. PCRs were run using a Phusion Hot start II High-Fidelity DNA Polymerase (500U) according to the manufacturer’s instructions with the buffer provided. Library preparations and sequencing was carried out at the Institute for Clinical Molecular Biology (IKMB), University of Kiel (Germany). Sequences were submitted to the National Center for Biotechnology Information GenBank database under the accession number SAMN20309768-SAMN20309783. Bcl2fastq v2.18 (Illumina) was used to perform demultiplexing and adaptor cutting. Subsequently, the raw paired-end reads were put into DADA2 (v1.14.2) (Callahan et al., 2016) in R (R Core Team, 2020) (v 3.6.3) for quality filtering [truncLen = c(240,200), maxEE = c(2,2), truncQ = 2, rm.phix = TRUE], sequence variant calling and taxonomic assignment with SILVA (v138) (Quast et al., 2013).
An amplicon sequencing variant (ASV) table generated by DADA2 was used for downstream analysis. All reads of 16 samples were rarefied to the lowest final reads among the samples before further analysis. The ampvis2 package (v. 2.6.7) (Andersen et al., 2018) was used to assess the taxonomic richness (Shannon diversity, Observed ASVs) and plot heatmaps. Beta diversity of samples was plotted based on basins and depths using canonical correspondence analysis (CCA) in the ampvis2 package. The oxygen minimum zone (O2 < 0.5 mg L–1) was highlighted in the CCA plot. Distance-based redundancy analysis (db-RDA) was performed to explain the contribution of each environmental factor in driving the whole microbial community with the vegan package (v 2.5–7) (Oksanen et al., 2013). Furthermore, based on the taxonomic ASV table, phototrophic bacteria were extracted and used to compare the spatial distribution between AP and OP. The anoxygenic phototrophic purple bacteria belonging to Proteobacteria were extracted based on groups summarized by Imhoff (Imhoff et al., 2018). However, as many species cannot be diagnosed down to genus and species levels in an ASV table, all the families involving AP were extracted although it may contain non-phototrophic chemotrophs. Therefore, the AP group extracted from microbial community might be overestimated.
The pufM, bchY and psbA genes were amplified by PCR from environmental DNA samples. The pufM gene was targeted using the primer set pufM-557F and pufM-750R (forward: CGCACCTGGACTGGAC, reverse: CCATGGTCCAGCGCCAGAA), generating a product length of 229 bp (Ahn et al., 2014). The bchY primer set was bchY-F and bchY-R (forward: CCNCARACNATGTGYCCNGCNTTYGG, reverse: GGRTCNRCNGGRAANATYTCNCC), generating a product length of 510 bp (Yutin et al., 2009). The psbA gene was amplified with the primer set psbA-F and psbA-R (forward: GTITTYCARGCIGARCAYAAYATIYTIATGCAYCC, reverse: CCRTTIARRTTRAAIGCCATIGT), resulting in a product length of 344 bp (Kong et al., 2014). The PCR conditions are given in Supplementary Table 1. Each PCR reaction mixture contained 0.25 μl Taq-Polymerase (5 U μl–1), 1μl of each primer (20 pmol μl–1), 5μl dNTPs (2 mM), 5 μl Taq-buffer (10x) and 5 μl MgCl2 (25 mM), 1 μl DNA template, 1 μl BSA and distilled water in a final volume of 50 μl. All PCR products were purified using the E.Z.N.A. gel extraction kit (Omega Bio-Tek, Inc., United States), and then Topo TA cloned (Invitrogen, Life Technologies Grand Islands, NY, United States) Sanger Sequencing was carried out at the Institute for Clinical Molecular Biology (IKMB), University of Kiel (Germany). Trimmed and quality checked nucleotide sequences were aligned with closest references, and maximum likelihood trees were generated using the MEGA-X software (v 10.1.7) with the ClustalW alignment algorithm (Kumar et al., 2018) (Tamura-Nei Model, 500 bootstraps). Clone sequences generated in our study were submitted to the National Center for Biotechnology Information GenBank database and assigned accession numbers (MZ960574 to MZ960756).
Quantitative PCR were used to quantify pufM and psbA gene copy numbers (DNA) and gene expression abundance (mRNA). The primers used for pufM and psbA genes were the same set as described in clone library construction. The qPCR conditions for pufM amplification were set as following: an initial step at 95°C for 15 min, followed by 40 cycles of 95°C for 30 s, 58°C for 30 s, 72°C for 30 s. The qPCR conditions for psbA amplification were set as following: an initial step at 95°C for 15 min, followed by 45 cycles of 95°C for 30 s, 50°C for 50 s, 72°C for 50 s. Each qPCR reaction mixture was 25 μl, containing 1 μl of DNA template and 12.5 μl RealQ plus 2 × Master Mix (Amplicon PCR enzymes and reagents, Denmark), 0.5 μl BSA (20 mg ml–1) and 0.25 μl of each primer (20 pmol μl–1) and 10.5 μl distilled water. Known concentrations of plasmids containing pufM or psbA were used to make standard curves. Reactions with no template were running as negative control with each plate. All standards and samples were running in duplicate.
A Pearson correlation test was performed to analyze the correlation between photosynthesis gene abundances, photosynthesis transcript abundances, transcriptional activity, phototrophic abundances in the microbial community and environmental parameters. A one-way ANOVA was performed to analyze the significant difference between AP and OP photosynthesis gene groups. Both methods were conducted using GraphPad Prism (v 9.2.0, GraphPad Software, United States).
Our cruise took place in fall, and depth profiles from the Kiel Fjord, the Arkona Basin, the Bornholm Basin and the Gotland Basin varied between basins (Table 1 and Figure 1). In Kiel Fjord and west of the Arkona Basin, the water temperature and salinity were quite similar across all depths (< 20 m), ranging from 14 to 15°C, and from 18.74 to 25.8 PSU, respectively. From the east of Arkona Basin to the Bornholm and Gotland Basins, salinity was much lower (6.97–18.5 PSU) compared to the Kiel Fjord and west of the Arkona Basin, and it was higher in deep waters than other water depths. In Bornholm and Gotland Basins, water temperatures were generally higher in surface waters (12–15.6°C) and decreased in deeper waters (4–8.8°C). In all stations, dissolved oxygen (DO) profiles were similar, with higher DO level in surface waters comparing to other water depths. Oxygen-depleted waters were observed in the Bornholm Basin, especially at stations BB23 and BB15, with O2 concentrations below 0.4 mg L–1 in subsurface waters (around 65 ∼ 80 m). Chla concentrations were high in waters of the Kiel Fjord (< 20 m), ranging from 2.26 ± 1.31 μg L–1 and 3.39 ± 1.21 μg L–1. Generally, Chla concentrations were higher in surface waters (5 m) and decreased over depth (< 70 m, < 0.01 μg L–1) in Arkona Basin, Bornholm Basin and Gotland Basin. Except for an extremely low data point at a depth of 41 m at station BB15, the carbon fixation rate was similar at depth between 3 and 20 m across all stations, ranging from 0.027 to 0.068 μmol C L–1 d–1.
A total of 89 bacterial phyla were identified from all our 16 samples, involving 8 stations of three basins and 1–3 depths in each station (Supplementary Figure 1). Proteobacteria, Actinobacteriota and Bacteroidota dominated the bacterial community in all samples, accounting for 15.9–55.8%, 5.4–36.6%, and 9.9–27%, respectively. Campilobacterota or Desulfobacterota were prominent phyla only in deep waters of GB (32.8–38.2% and 9.5–14.4%, respectively). In contrast, Cyanobacteria were dominant in surface waters (< 8 m) and decreased dramatically to 0.5% in deep waters. In the level of order, except for deep samples from below 85 m, the SAR11 clade belonging to Proteobacteria was the top order in most samples (Figure 2). Flavobacteriales and Microtrichales belonging to Bacteroidota and Actinobacteriota, respectively, were also top orders in many samples (Figure 2). In oxygen depleted waters, especially at station BB23 at 85 m water depth, the dominant orders were substantially different compared to other samples, with Thiomicrospirales representing 15.9%, Rhodospirillales representing 10.6% and the SAR406 clade representing 17.1% (Figure 2).
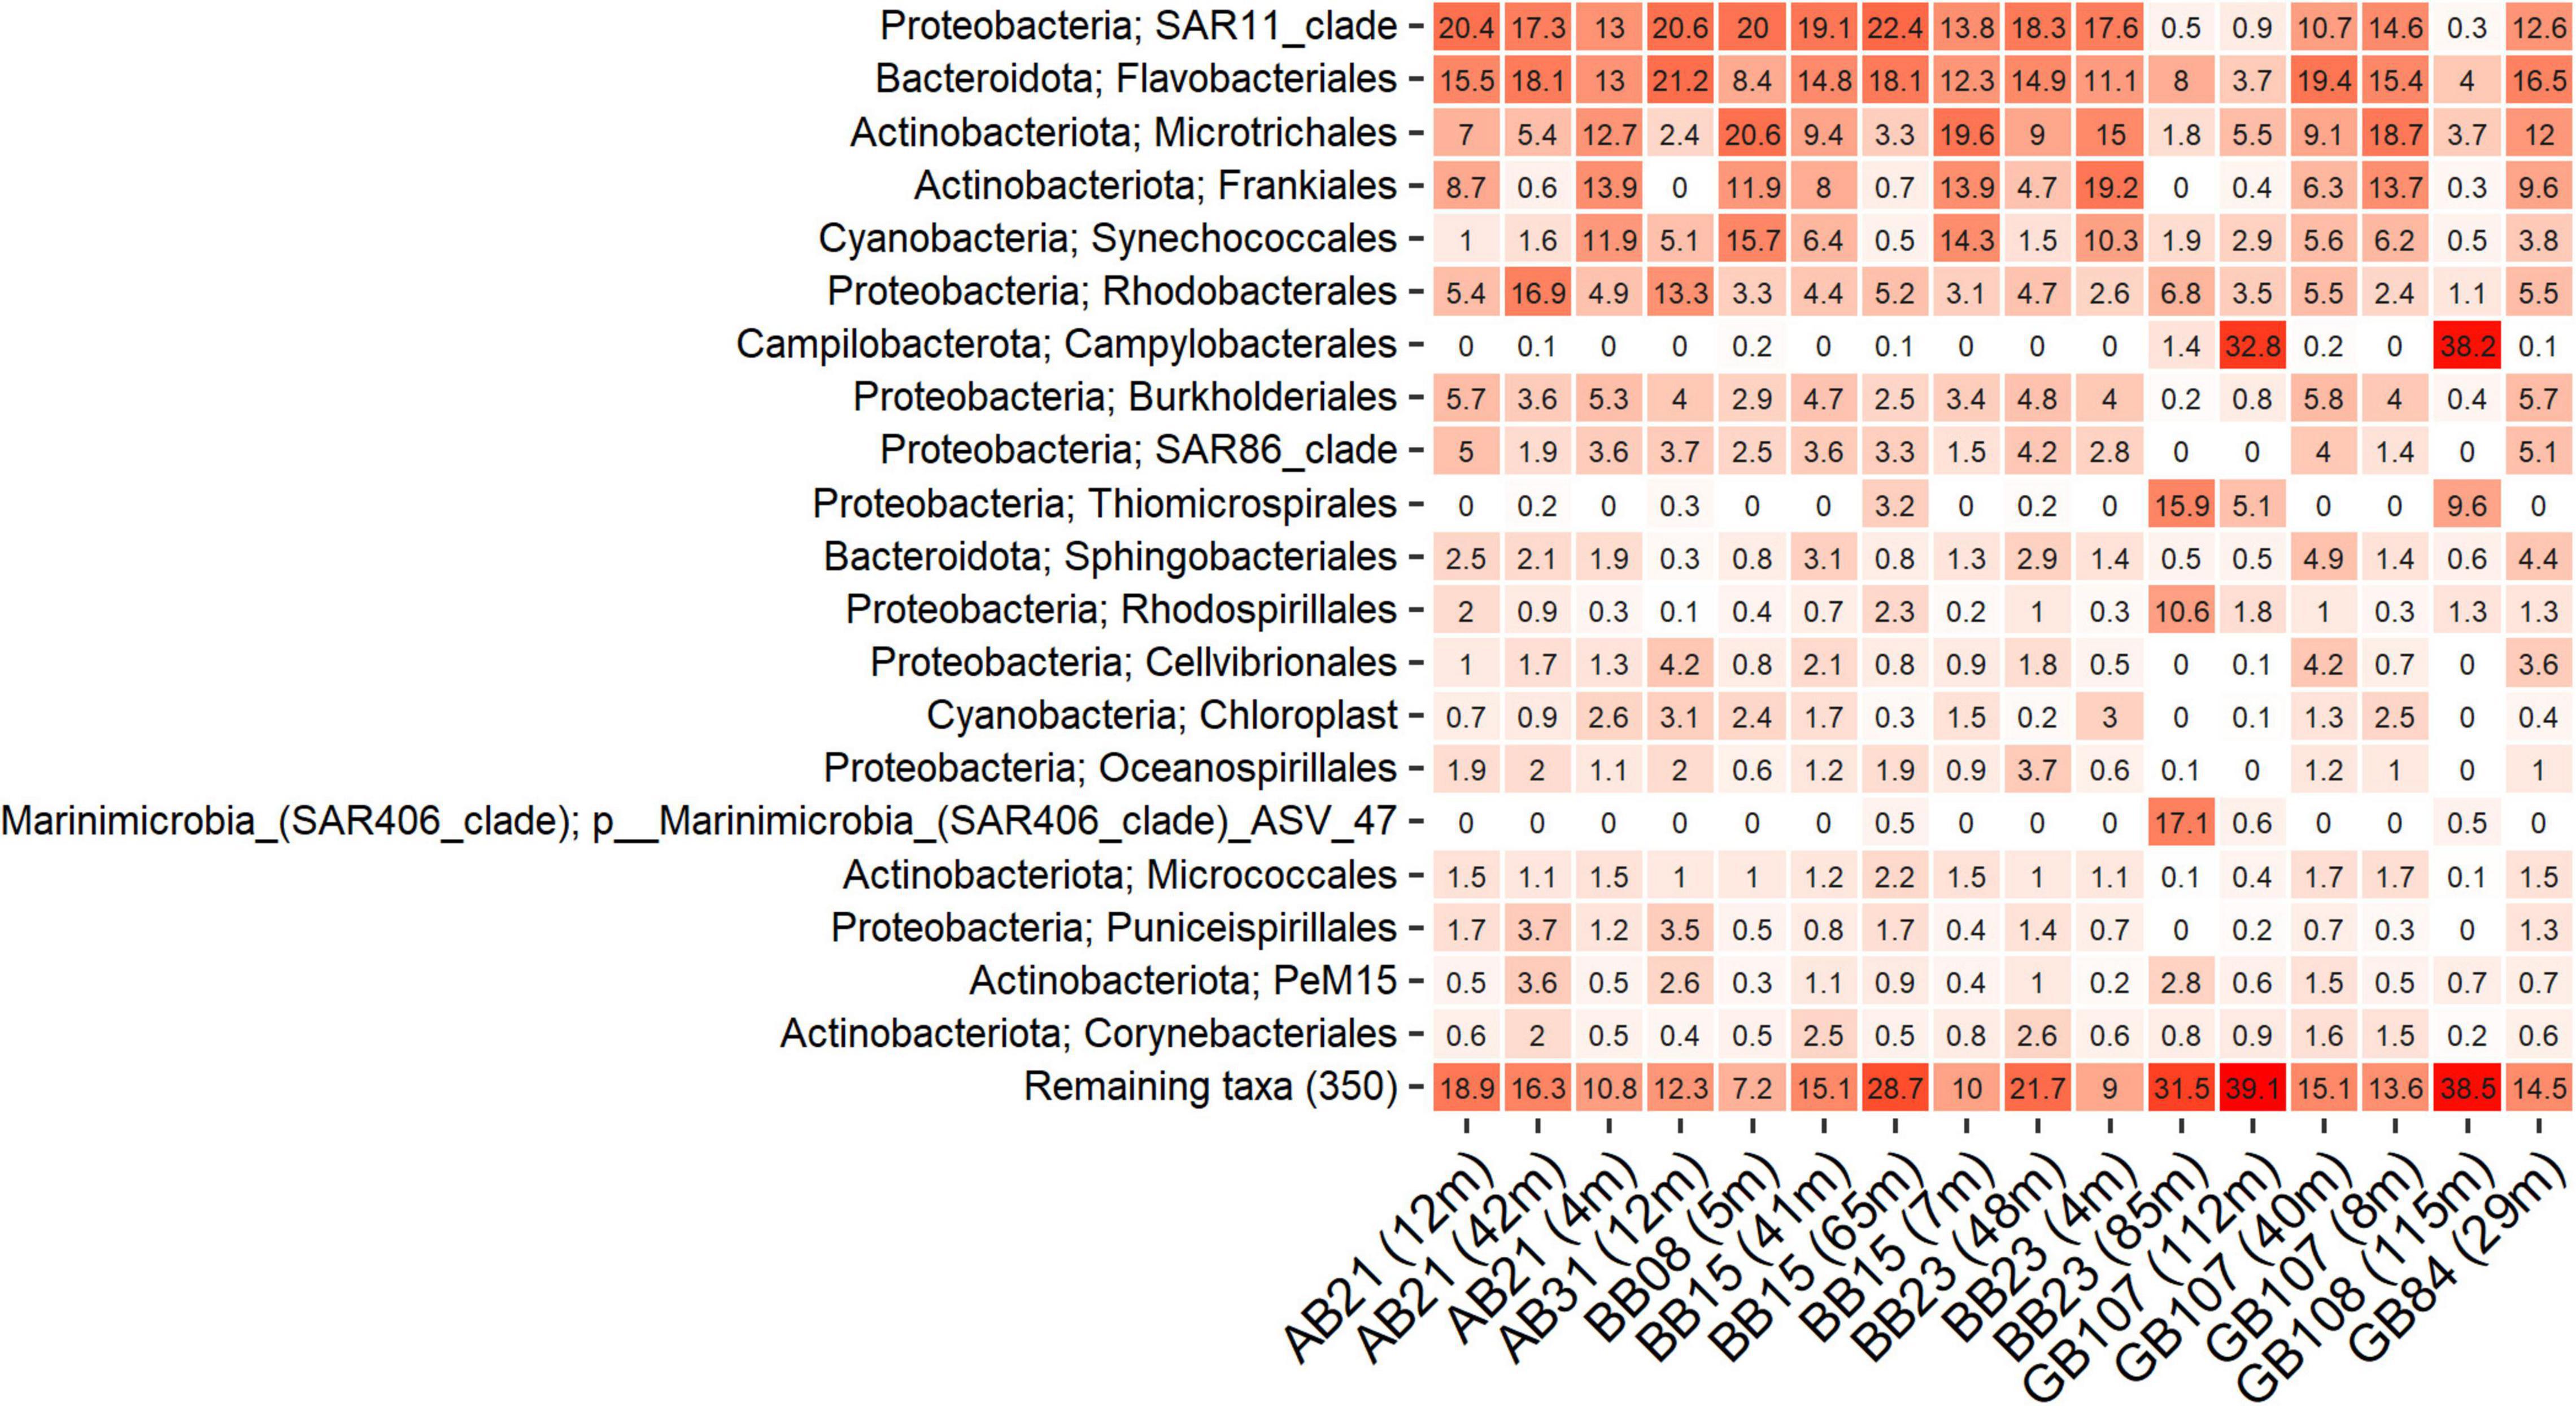
Figure 2. Percentage of relative abundance based on depth-wise stations of microbial order at three basins in the Baltic Sea.
In terms of the alpha diversity of bacterial communities present in the different samples, there were 167–406 ASVs identified across the three basins (AB, BB, and GB), and the Shannon indices ranged from 3.65 to 4.93 (Table 2). Moreover, the Shannon diversity of samples was low (< 4) in samples from deeper waters (BB23_85 m, GB107_112 m, GB108_115 m). Notably, the highest number of ASVs was observed in oxygen depleted waters (O2 = 0.08 mg L–1, BB15_65 m).
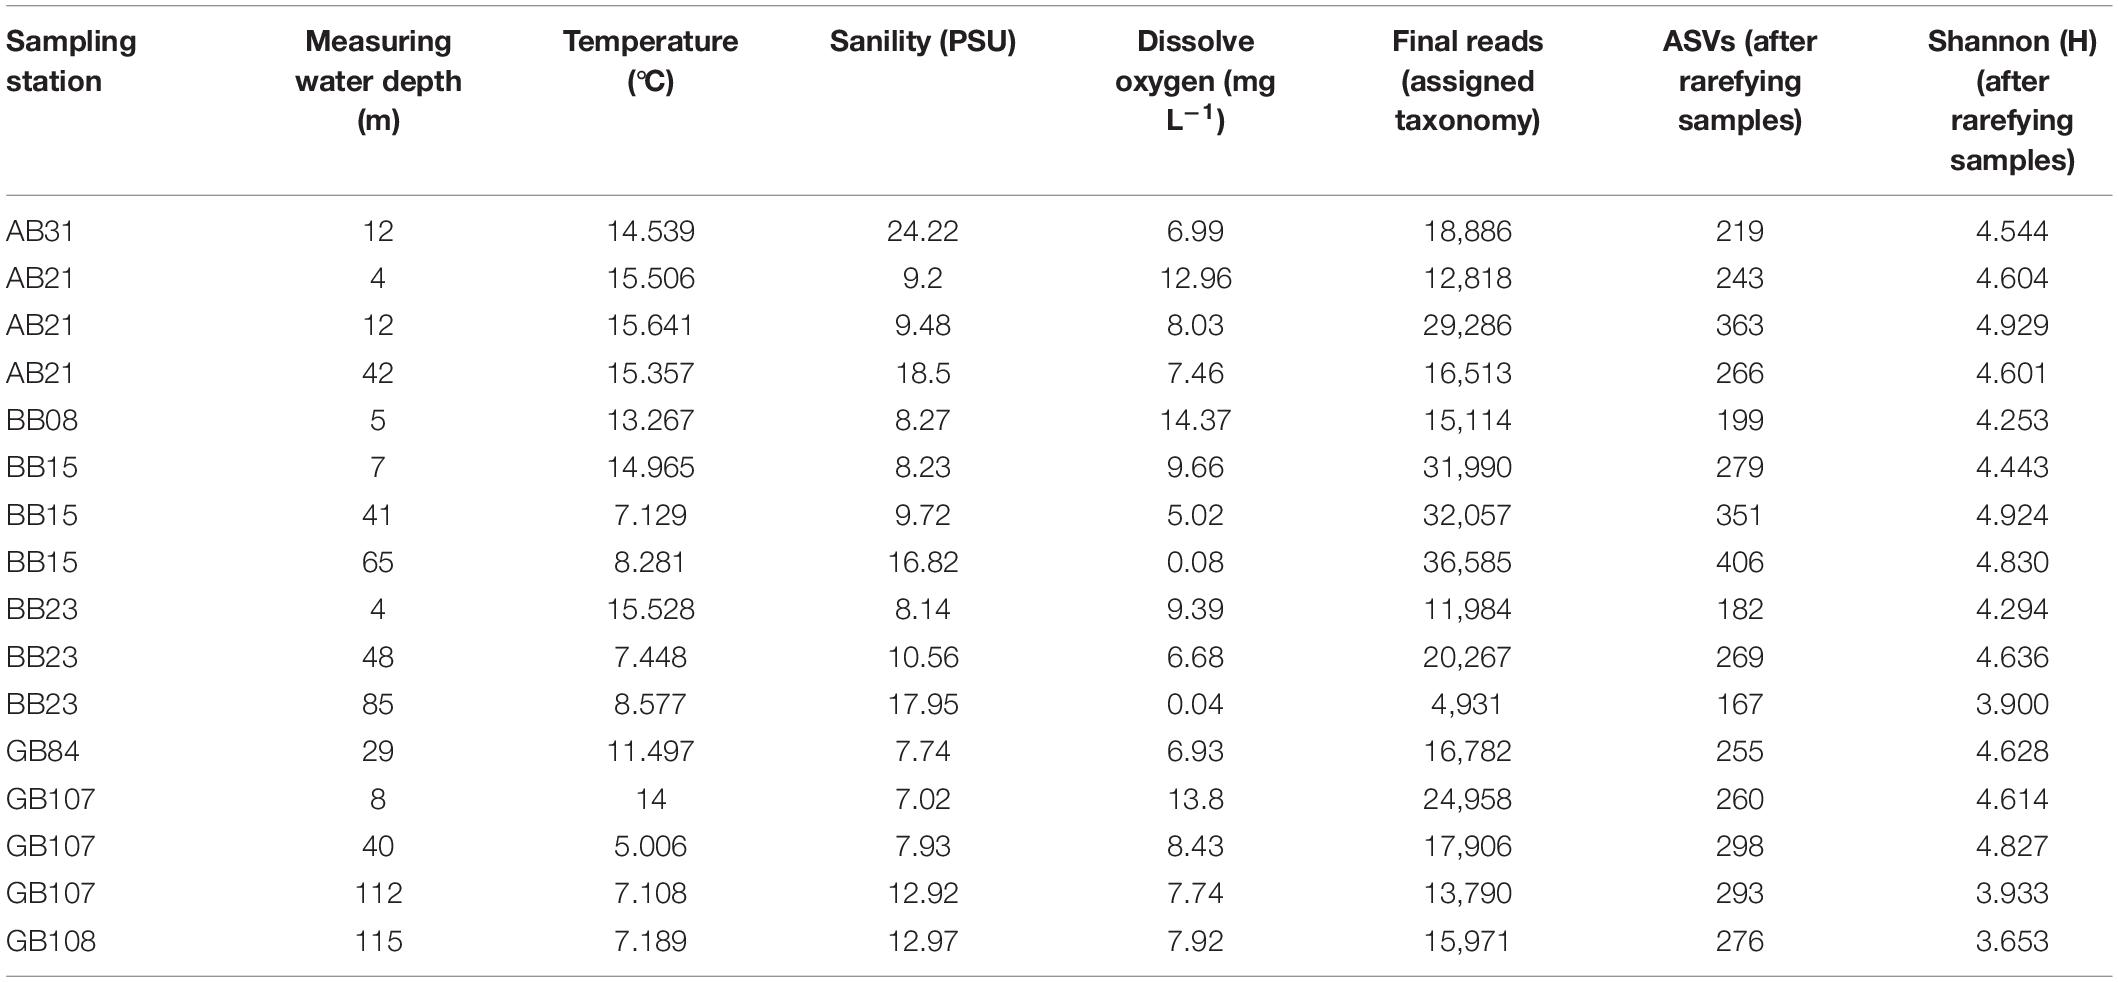
Table 2. Physical factors and bacterial diversity estimates for water collected from three basins in the Baltic Sea.
Canonical correspondence analysis (CCA) was used to analyze the beta diversity that separated the samples into abundance-based microbial community composition (Figure 3). Samples were grouped based on water depth, oxygen level, and location. For the profile for water depth and oxygen levels, the samples were grouped into surface water (0–12 m, DO: 7.5–14.4 mg L–1), intermediate water (20–48 m, DO: 5–8.4 mg L–1), OMZ (65–85 m, DO < 0.1 mg L–1) and deep water (112–115 m, DO: 7.7–7.9 mg L–1). The community structure showed substantial differences between OMZ, and deep water, compared to intermediate and surface waters. SAR11 clade and Flavobacteriales were the main groups dominating in surface and intermediate waters (Figure 2). Campilobacterota, Desulfobacterota, and Latescibacterota were only abundant in deep water, while SAR406 clade and Rhodospirillales only dominated in OMZ water. Thiomicrospirales was in a high abundance both in OMZ and deep water. The community structure differed less between surface and intermediate water samples, of which the abundances of Microtrichales, Frankiales and Synechococcales differed mostly. Using an dbRDA-based biplot, depth and oxygen concentration showed a significant impact on the microbial community structure and distribution (Figure 4). Likewise, salinity and temperature were strongly related to changes in the microbial community structure. Overall, 40% of variation in community structure could be constrained by these four variables.
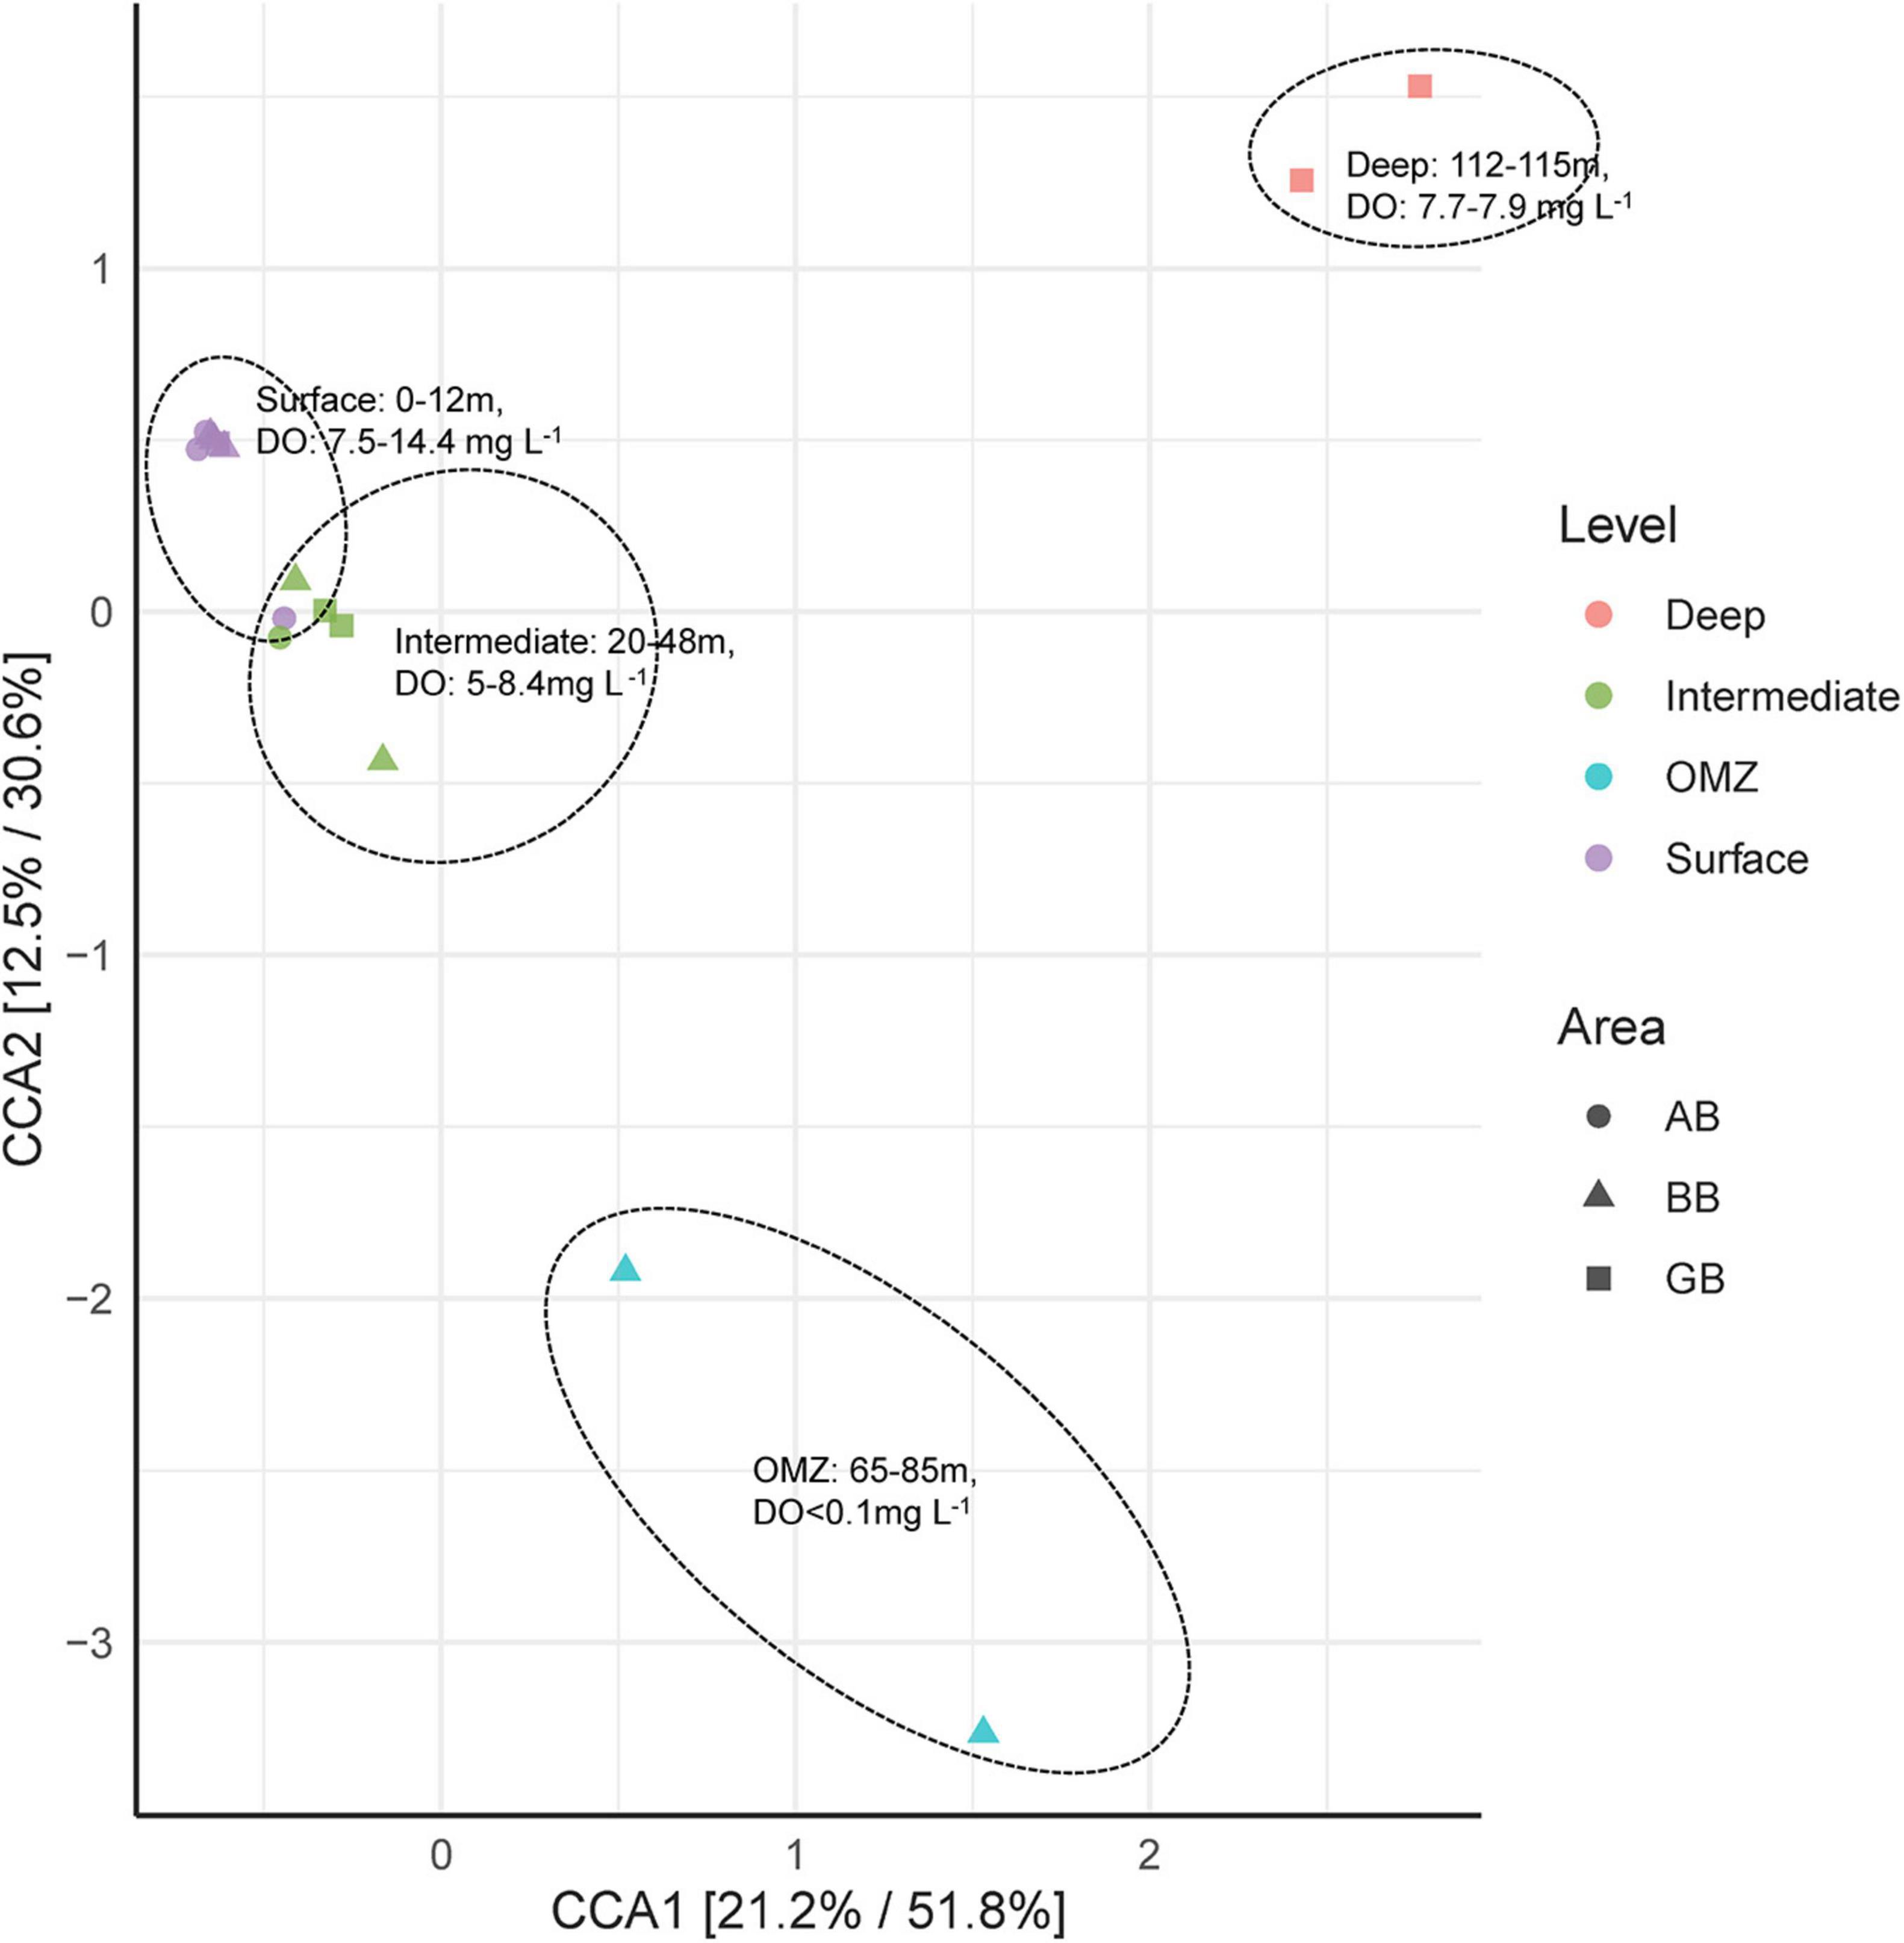
Figure 3. Canonical correspondence analysis (CCA) plot depicting microbial composition from four groups of water areas (surface; intermediate; OMZ; deep) across three basins (AB, BB, and GB) in the Baltic Sea.
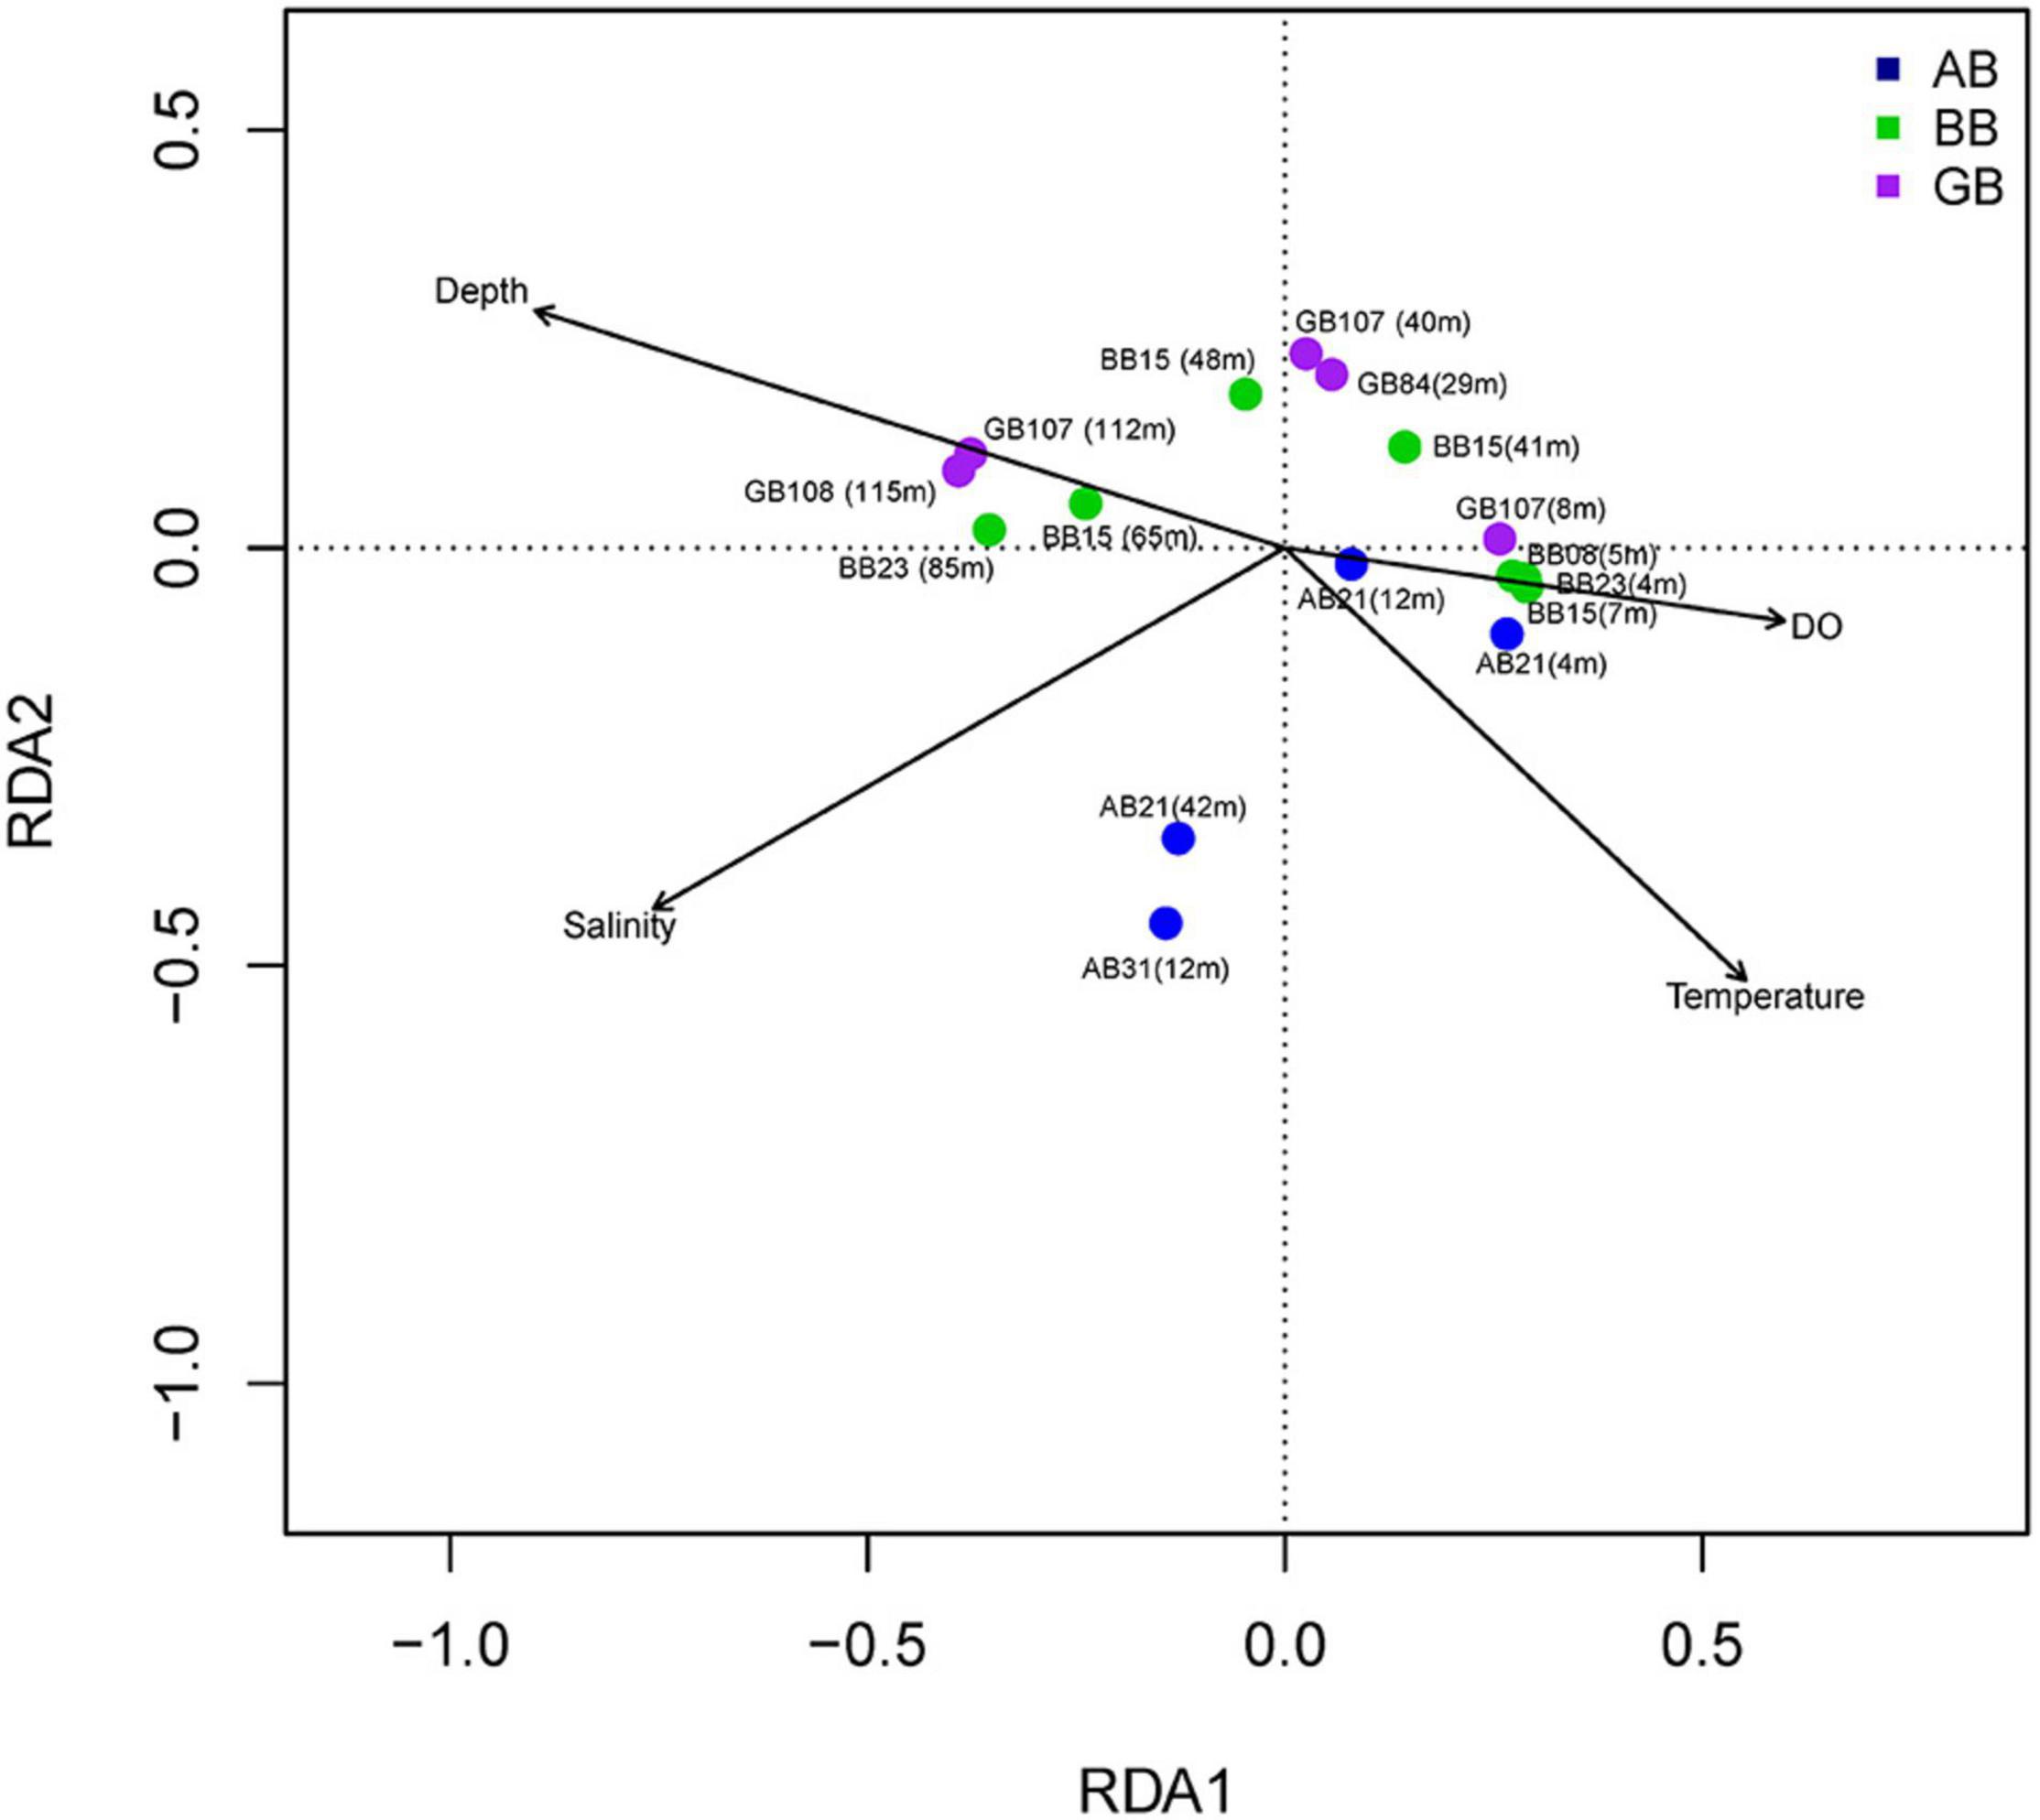
Figure 4. db-RDA biplot of environmental variables and microbial community in different samples. Different samples and environmental variables are plotted on RDA axes 1 and 2. Arrows denote biplot scores for the different constraining environmental variables.
We found similar relative abundances of AP and OP (Cyanobacteria) in all 16 amplicon datasets, with AP representing 1.58–18.11% (6.47% on average) and OP representing 0.47–20.18% (8.29% on average, Figure 5). OP outnumbered AP in surface waters shallower than 8 m, while AP were more abundant in waters below 8 m. Relative abundances of OP decreased from 16.04% ± 3.48% in surface waters to 4.77% ± 3.76% in waters below (< 8 m). Relative AP abundances did not vary only with depth but also along the cruise track with higher abundances in the Arkona Basin (11.21% ± 6.2%), followed by the Bornholm Basin (5.04% ± 1.3%), and the Gotland Basin (4.68% ± 2.37%). These different distributions may be due to their different adaptation to their environmental surroundings. OP abundances were negatively correlated with depth and positively correlated oxygen, and temperature, while AP abundances were positively correlated with salinity (Table 3).
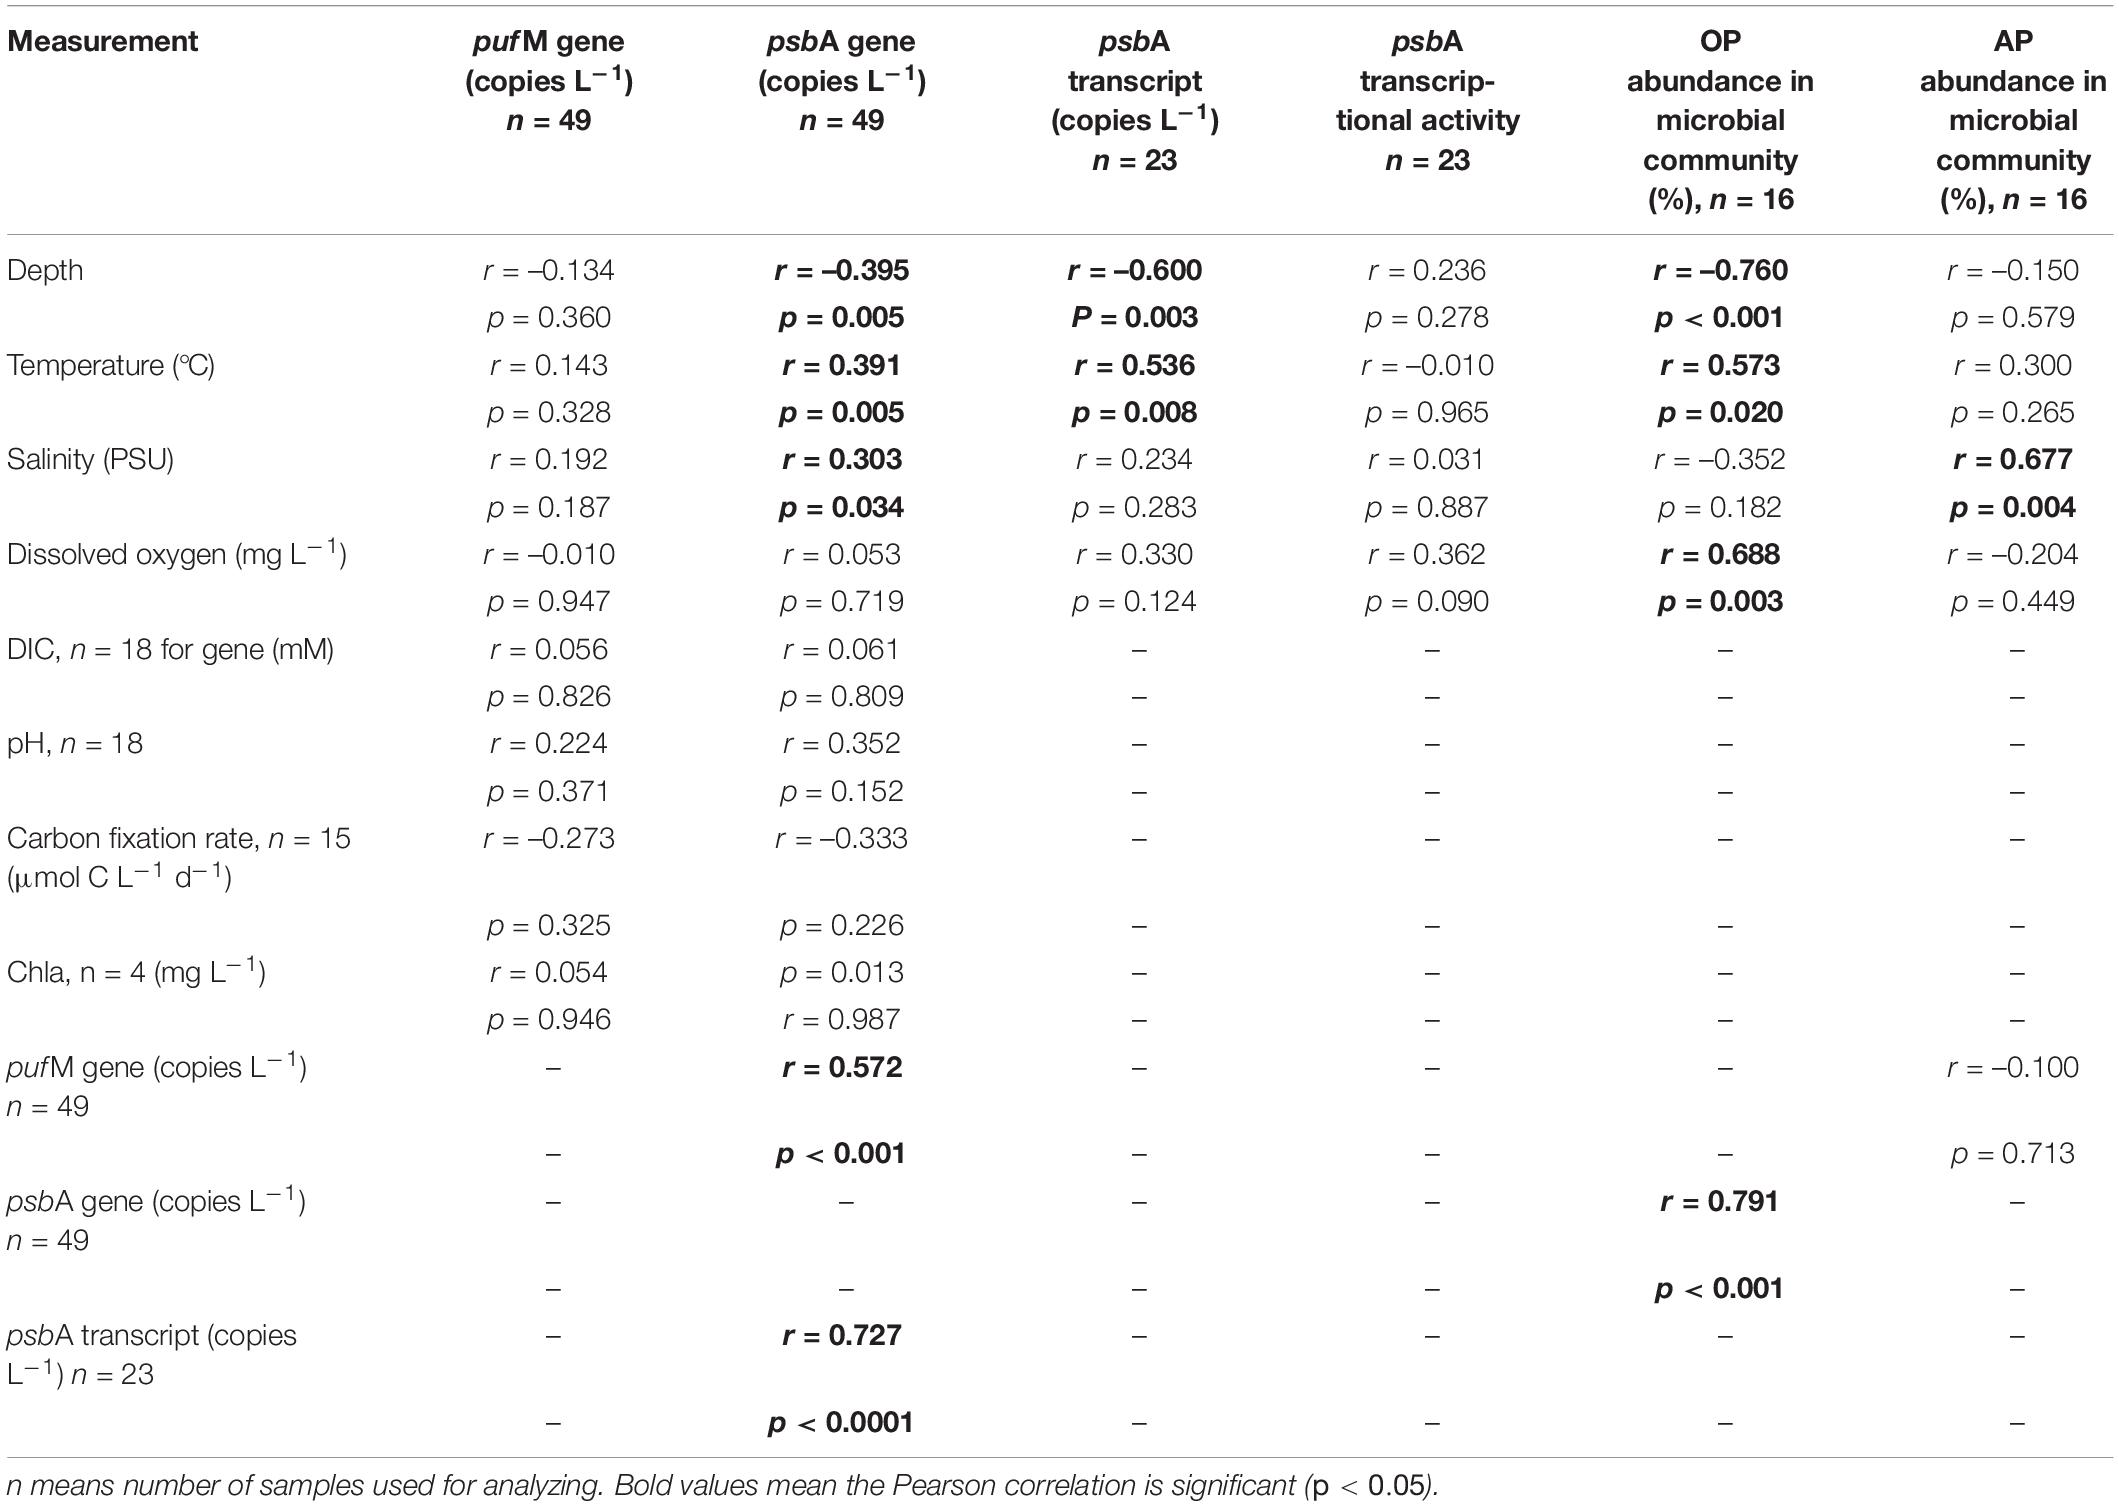
Table 3. Pearson correlations of the gene abundance, transcript abundance, and transcriptional activity of pufM and psbA with environmental variables, carbon fixation rate, and OP or AP abundance in microbial community.
The phototrophic bacterial community consisted mainly of three phyla, including OP-Cyanobacteria, AP-Proteobacteria and AP-Chloroflexota (Figure 6). In the AP community, Rhodobacterales which belong to Alphaproteobacteria was the main order out of 10, representing 1.14–16.89% of the total bacteria. The rest of Proteobacteria accounted for 0.06–1.70%, this includes Alphaproteobacteria (Rhodospirillales, Rhizobiales, Sphingomonadales, and Caulobacterales), Betaproteobacteria (Burkholderiales), and Gammaproteobacteria (Chromatiales, Cellvibrionales, and Methylococcales). We further found Chloroflexales as the only order in Chloroflexota, with an abundance of less than 0.34%. For the OP community, Synechococcales was the dominant order among six orders, representing 0.47–15.66%. Chloroplasts was also shown with a relative abundance of up to 3.1% in upper layers (< 12 m). The rest of OP accounted only for less than 1.78% of total bacteria except the unclassified Cyanobacteria, including Caenarcaniphilales, Vampirovibrionales, and Cyanobacteriales. It has to be noted that Caenarcaniphilales and Vampirovibrionales are non-photosynthetic Cyanobacteria (Soo et al., 2014, 2015). Generally, it is important to mention that a family-level description of the AP community based on 16S rRNA amplicon sequencing might include non-photosynthetic strains imposing a methodological limitation on this type of analysis (Kasalický et al., 2018). Therefore, we complemented our 16S rRNA-based approach with an analysis of functional genes of photosynthesis to clearly identify representatives of the AP and OP community.
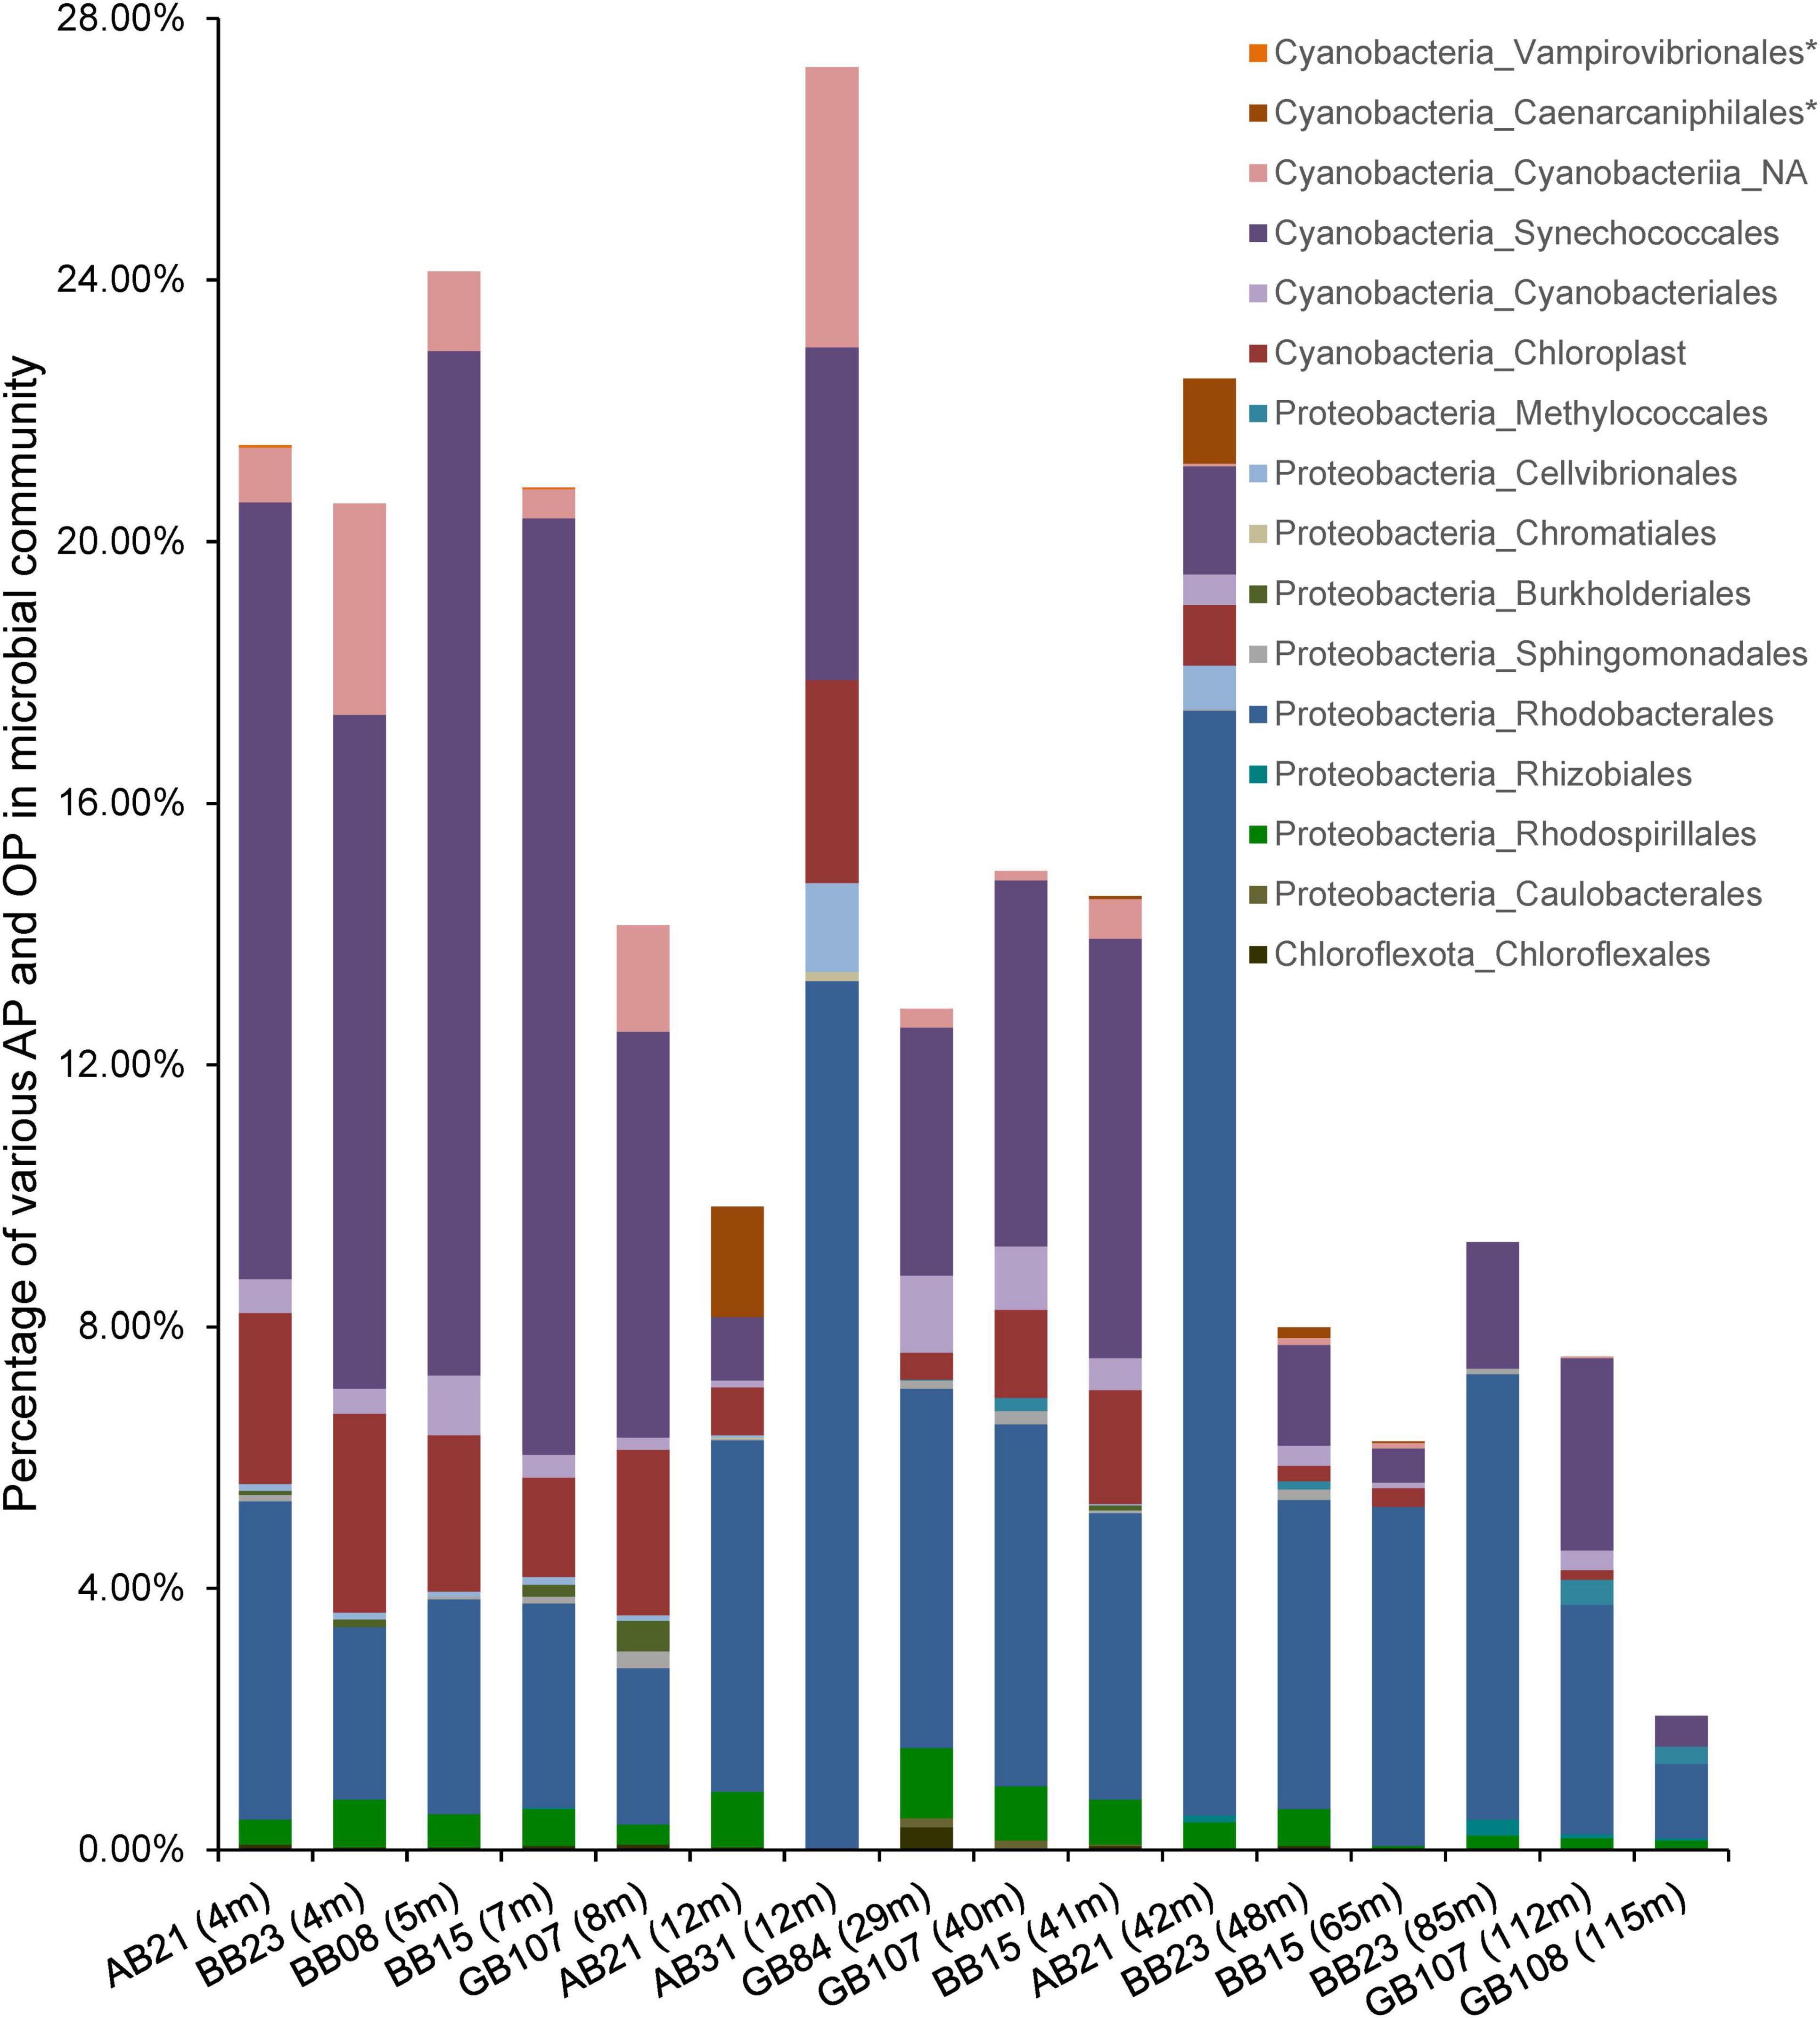
Figure 6. Percentage of various AP and OP (Cyanobacteria) in the microbial community in the Baltic Sea. * Means non-phototrophic Cyanobacteria.
OP belonging to nine groups were detected by psbA (Figure 7 and Supplementary Figure 2, 62 sequences in total). Besides uncultured organisms and uncultured cyanophages (19.4% each), the majority of psbA sequences belonged to Chlorophyta (green algae, 32.3%), and Cyanobacteria (17.7%). The rest of psbA sequences was affiliated with Diatoms (9.7%) and Cryptomonads (1.6%).
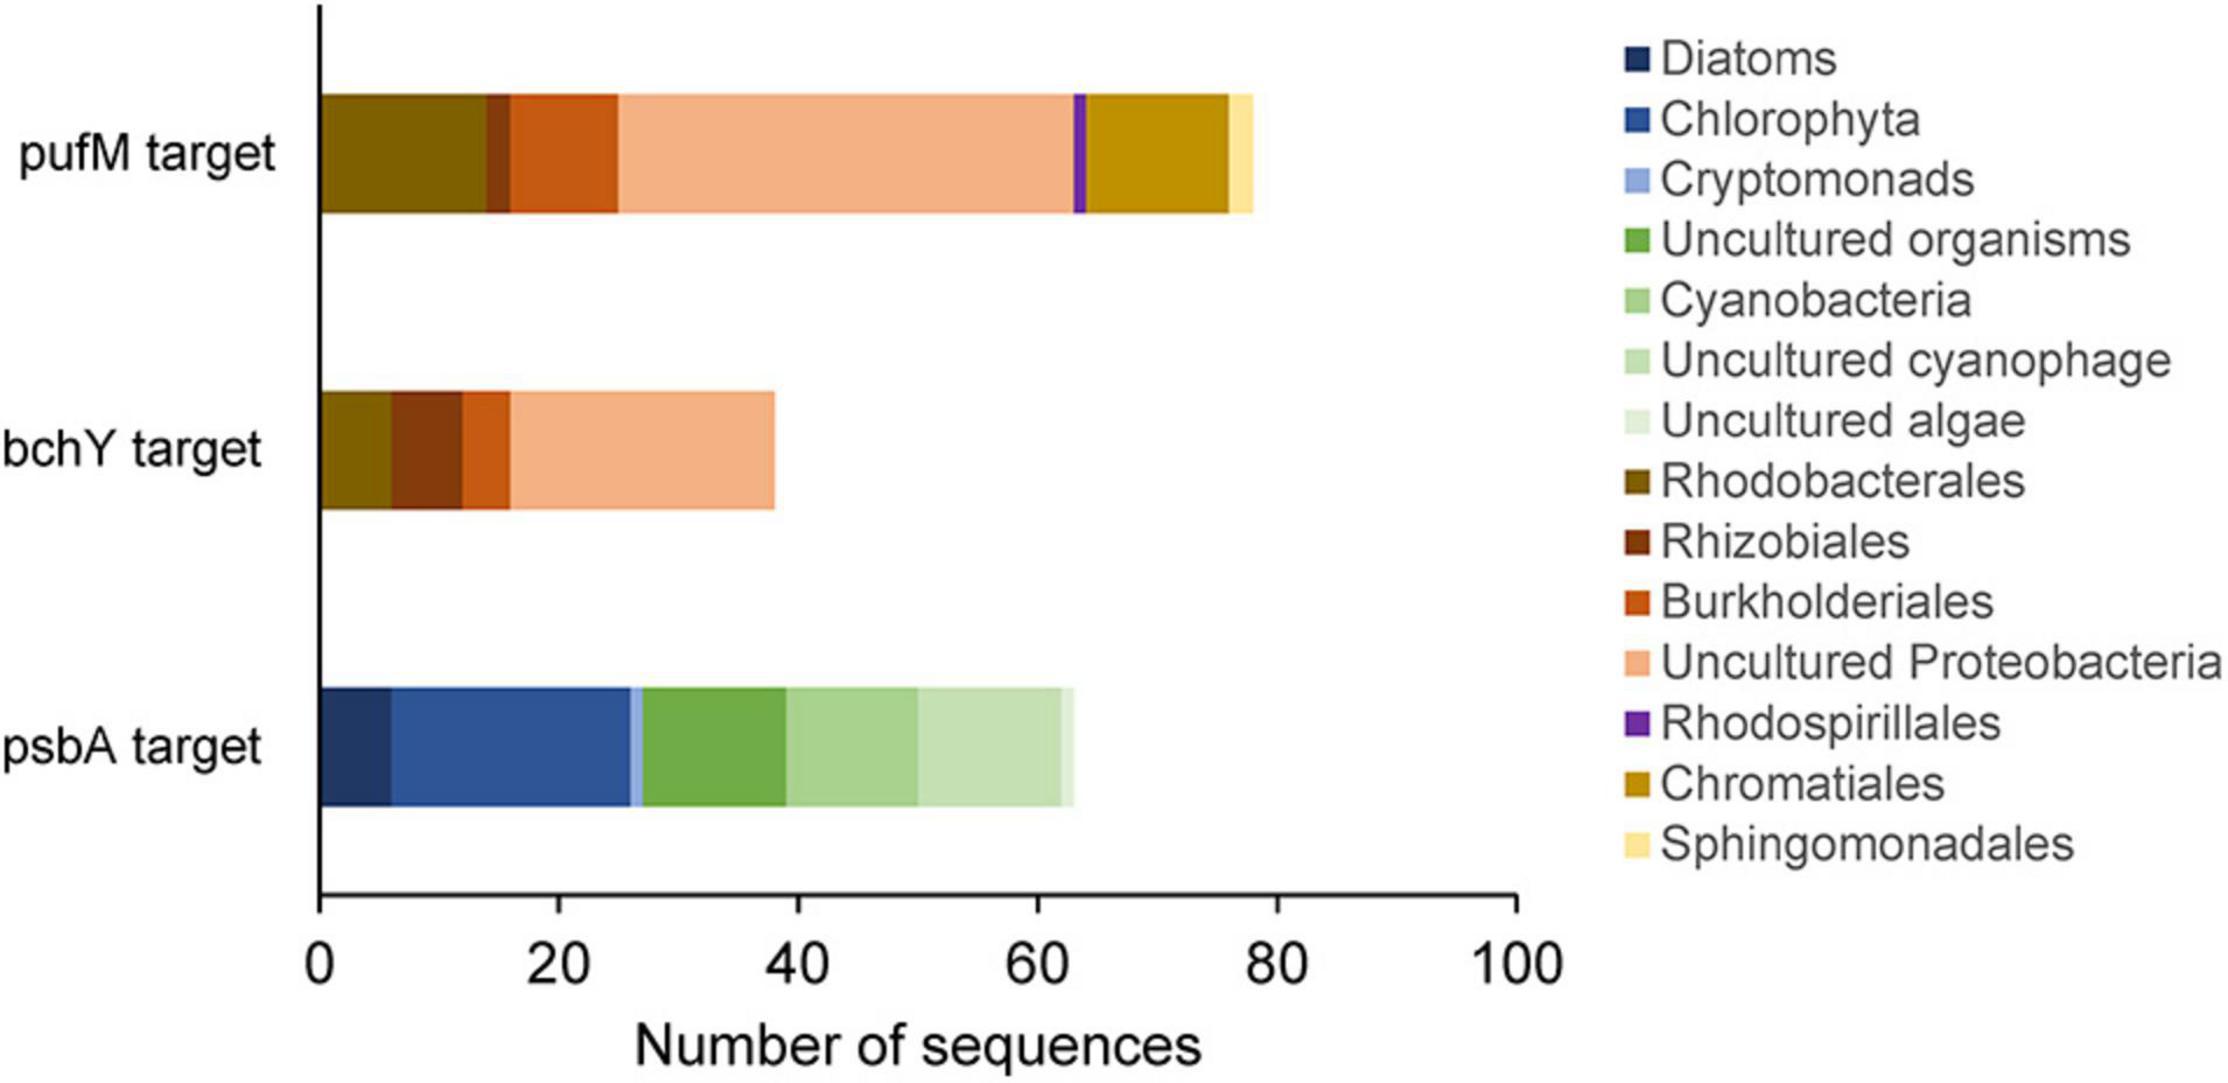
Figure 7. Taxonomic composition of all samples based on three marker genes targeted sequences, pufM, bchY, psbA.
In the AP community, phototrophic Proteobacteria was the only phyla that was detected by both bchY and pufM with 38 and 78 sequences in total, respectively (Figure 7 and Supplementary Figures 3, 4). We recovered a majority of uncultured Proteobacteria in both bchY and pufM sequence pools (57.9 and 48.7%). Among the characterizable sequences, a majority of bchY and pufM (31.6 and 24.4%) were affiliated with Alphaproteobacteria, with highest similarity to Rhodobacterales (15.8 and 17.9%). The rest of bchY sequences that were affiliated with Alphaproteobacteria belonged to Rhizobiales (15.8%). pufM sequences were affiliated with other Alphaproteobacteria, with 2.6, 2.6, and 1.3% belonging to the orders Sphingomonadales, Rhizobiales and Rhodospirillales, respectively. Further, we found bchY and pufM sequences affiliated with Betaproteobacteria, all belonging to Burkholderiales (10.5 and 11.5% in each). In addition, 15.4% of pufM sequences were affiliated with Gammaproteobacteria, belonging to Chromatiales.
A characterization of AP groups using pufM showed variations between surface waters (0–20 m), mixed layer (29–50 m) and deeper waters (50–115 m). The highest diversities of AP-pufM were found in the mixed layer, with 57 sequences belonging to 6 groups and the majority belonging to Rhodobacterales expect for uncultured Proteobacteria (Figure 8 and Supplementary Figure 5). Substantially less sequences could be recovered from surface and deep water samples, with only 7 and 19 sequences, respectively (Supplementary Figures 6, 7).
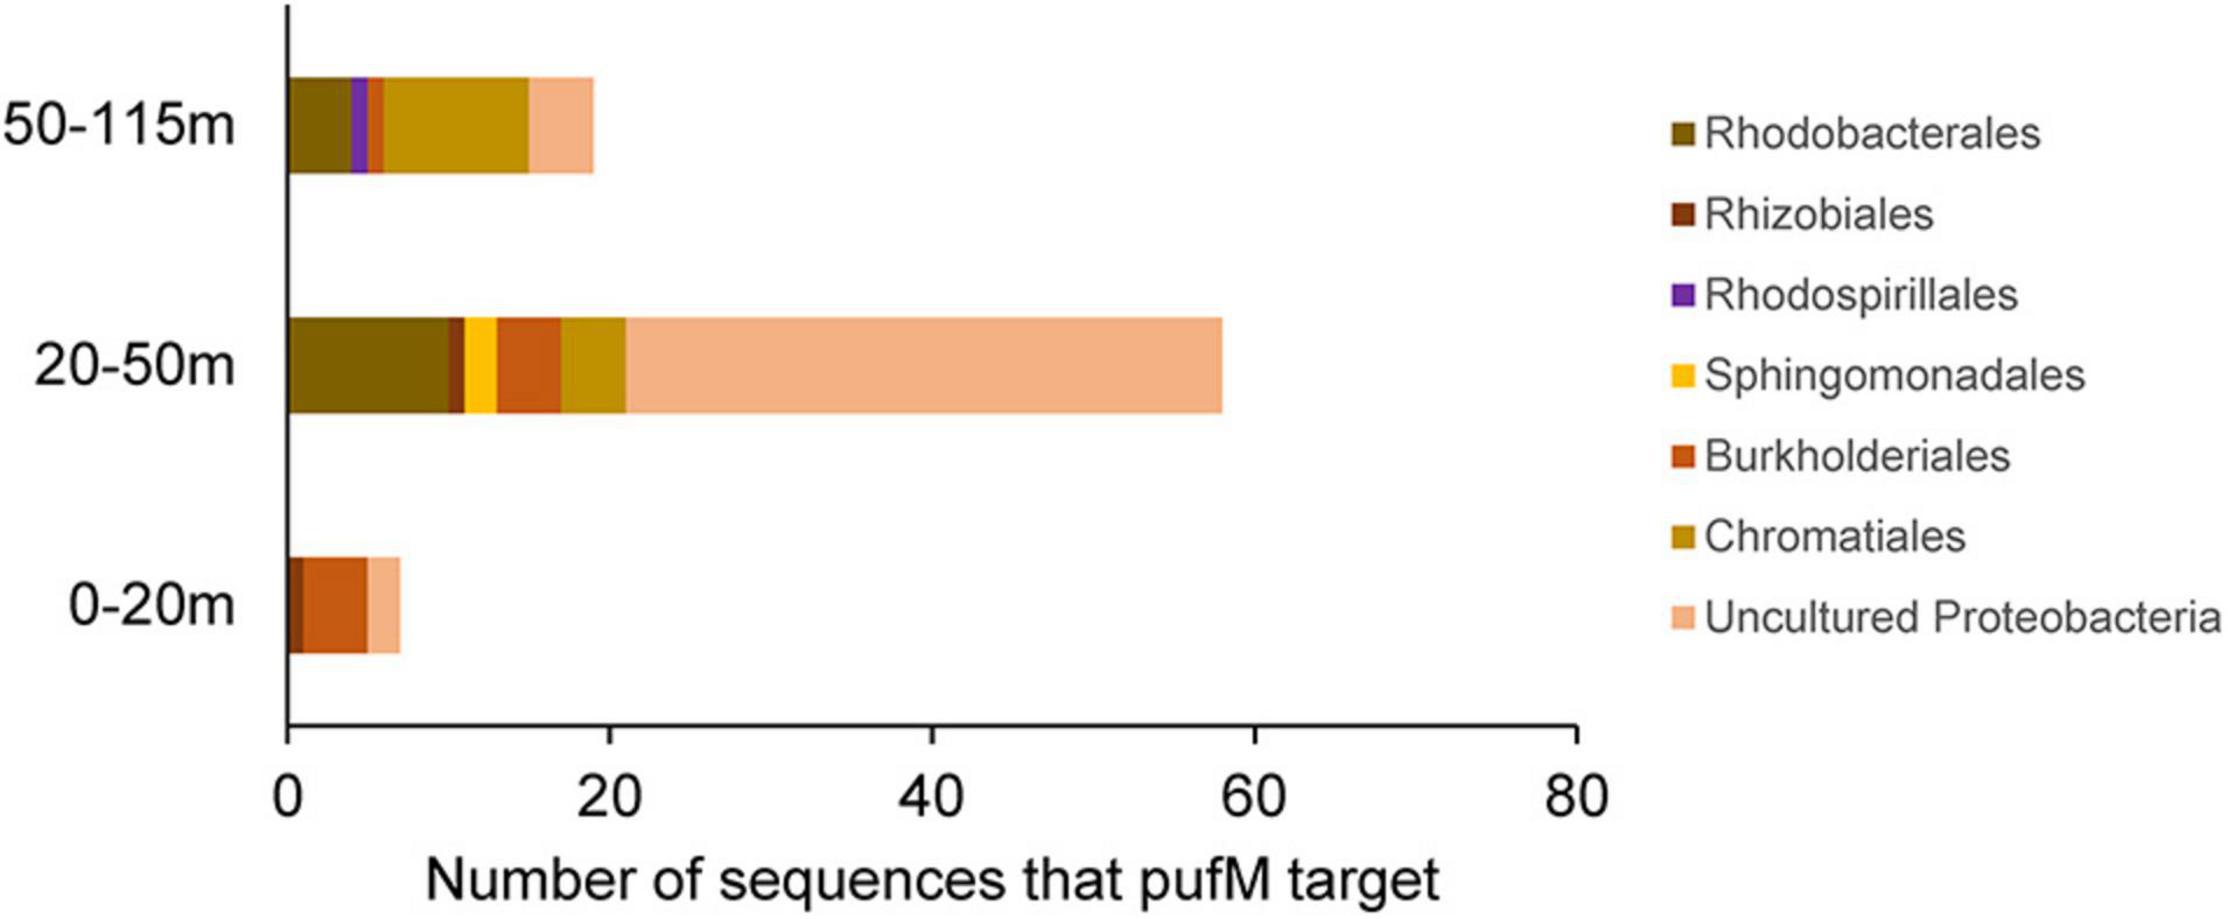
Figure 8. Taxonomic composition of three group of samples that collected from three depth profiles (0–20, 20–50, 50–115 m) based on pufM marker genes targeted sequences.
We explored the abundance and activity of AP and OP in the Baltic Sea using pufM and psbA relative gene abundances and transcript abundances (gene expression). The activity of OP was also explored using psbA transcriptional activity, which was estimated by the ratio of psbA in transcript abundance vs. gene abundance. The abundance of AP varied from 5.84*104 ± 2.06*104 to 3.72*107 ± 1.83*107 pufM gene copies L–1, with an exceptionally high abundance of 6.39*109 ± 3.55*109 pufM gene copies L–1 in the depth of 10 m in K06, and the abundance of OP varied from 5.13*105 ± 1.18*105 to 4.23 *108 ± 7.45*107 psbA gene copies L–1 (Figures 9, 10). The spatial distribution patterns of pufM and psbA relative gene abundances were similar, with highest abundances present in surface waters of station K06 and lowest abundances present in the deep waters of station GB108. Both, pufM and psbA relative gene abundances were frequently higher in surface waters and in the mixed layer (< 45 m), comparing to samples from deeper waters (Figures 11A,B). This was coherent with the Pearson correlation output, which showed the psbA gene abundance was positively correlated with the pufM gene abundance (Table 3). Similar to the vertical distribution of psbA gene abundance, psbA transcript abundance was higher in surface and mixed layer waters than in deeper waters, ranging from 2.2*105 ± 2.05*104 to 1.07*108 ± 1.21*107copies L–1 (Figures 10, 11C). Consequently, psbA transcriptional activity was similar across the basins and depths except for the Kiel Fjord (Figure 11D). For the pufM transcript abundance, however, only 5 samples out of 23 samples could be detected in the detection range of RT-qPCR. These five samples were from surface and mixed layer water (< 45 m), with highest pufM transcript abundance at 3.07*104 ± 5.3*103 copies L–1 in 45 m of GB108 station. Even this highest pufM transcript abundance was still around 1–4 orders of magnitude lower than psbA. Therefore, in general, the gene abundance and transcript abundance of psbA is higher than of pufM, except the extremely high gene abundance of pufM at station K06 (Figure 12).
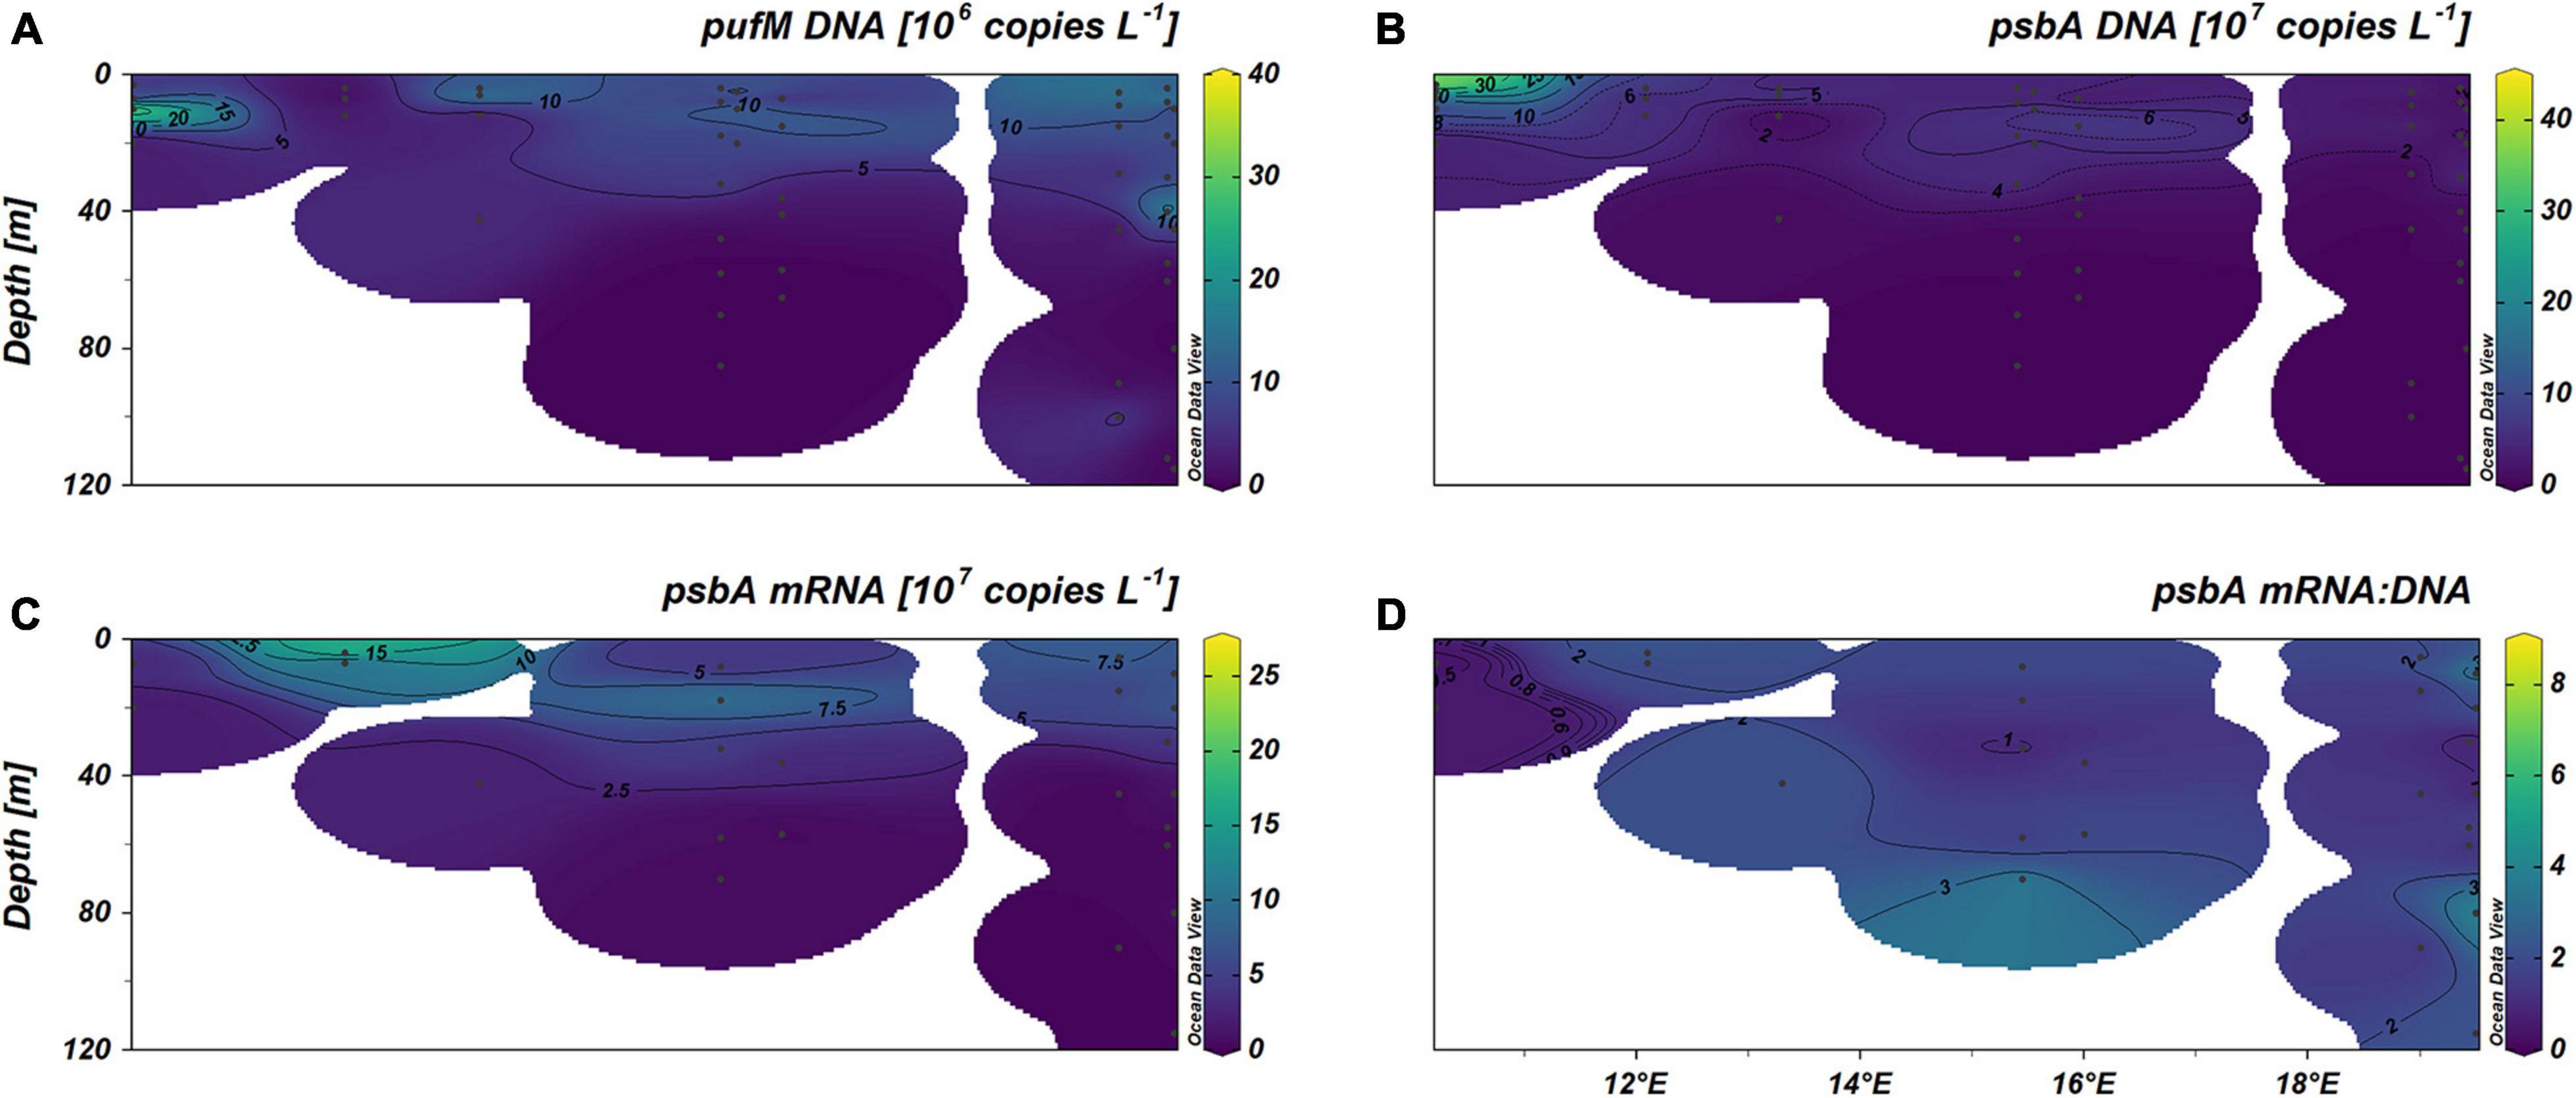
Figure 9. Spatial distribution patterns of gene copy number (DNA) of the AP photosynthetic gene, pufM.
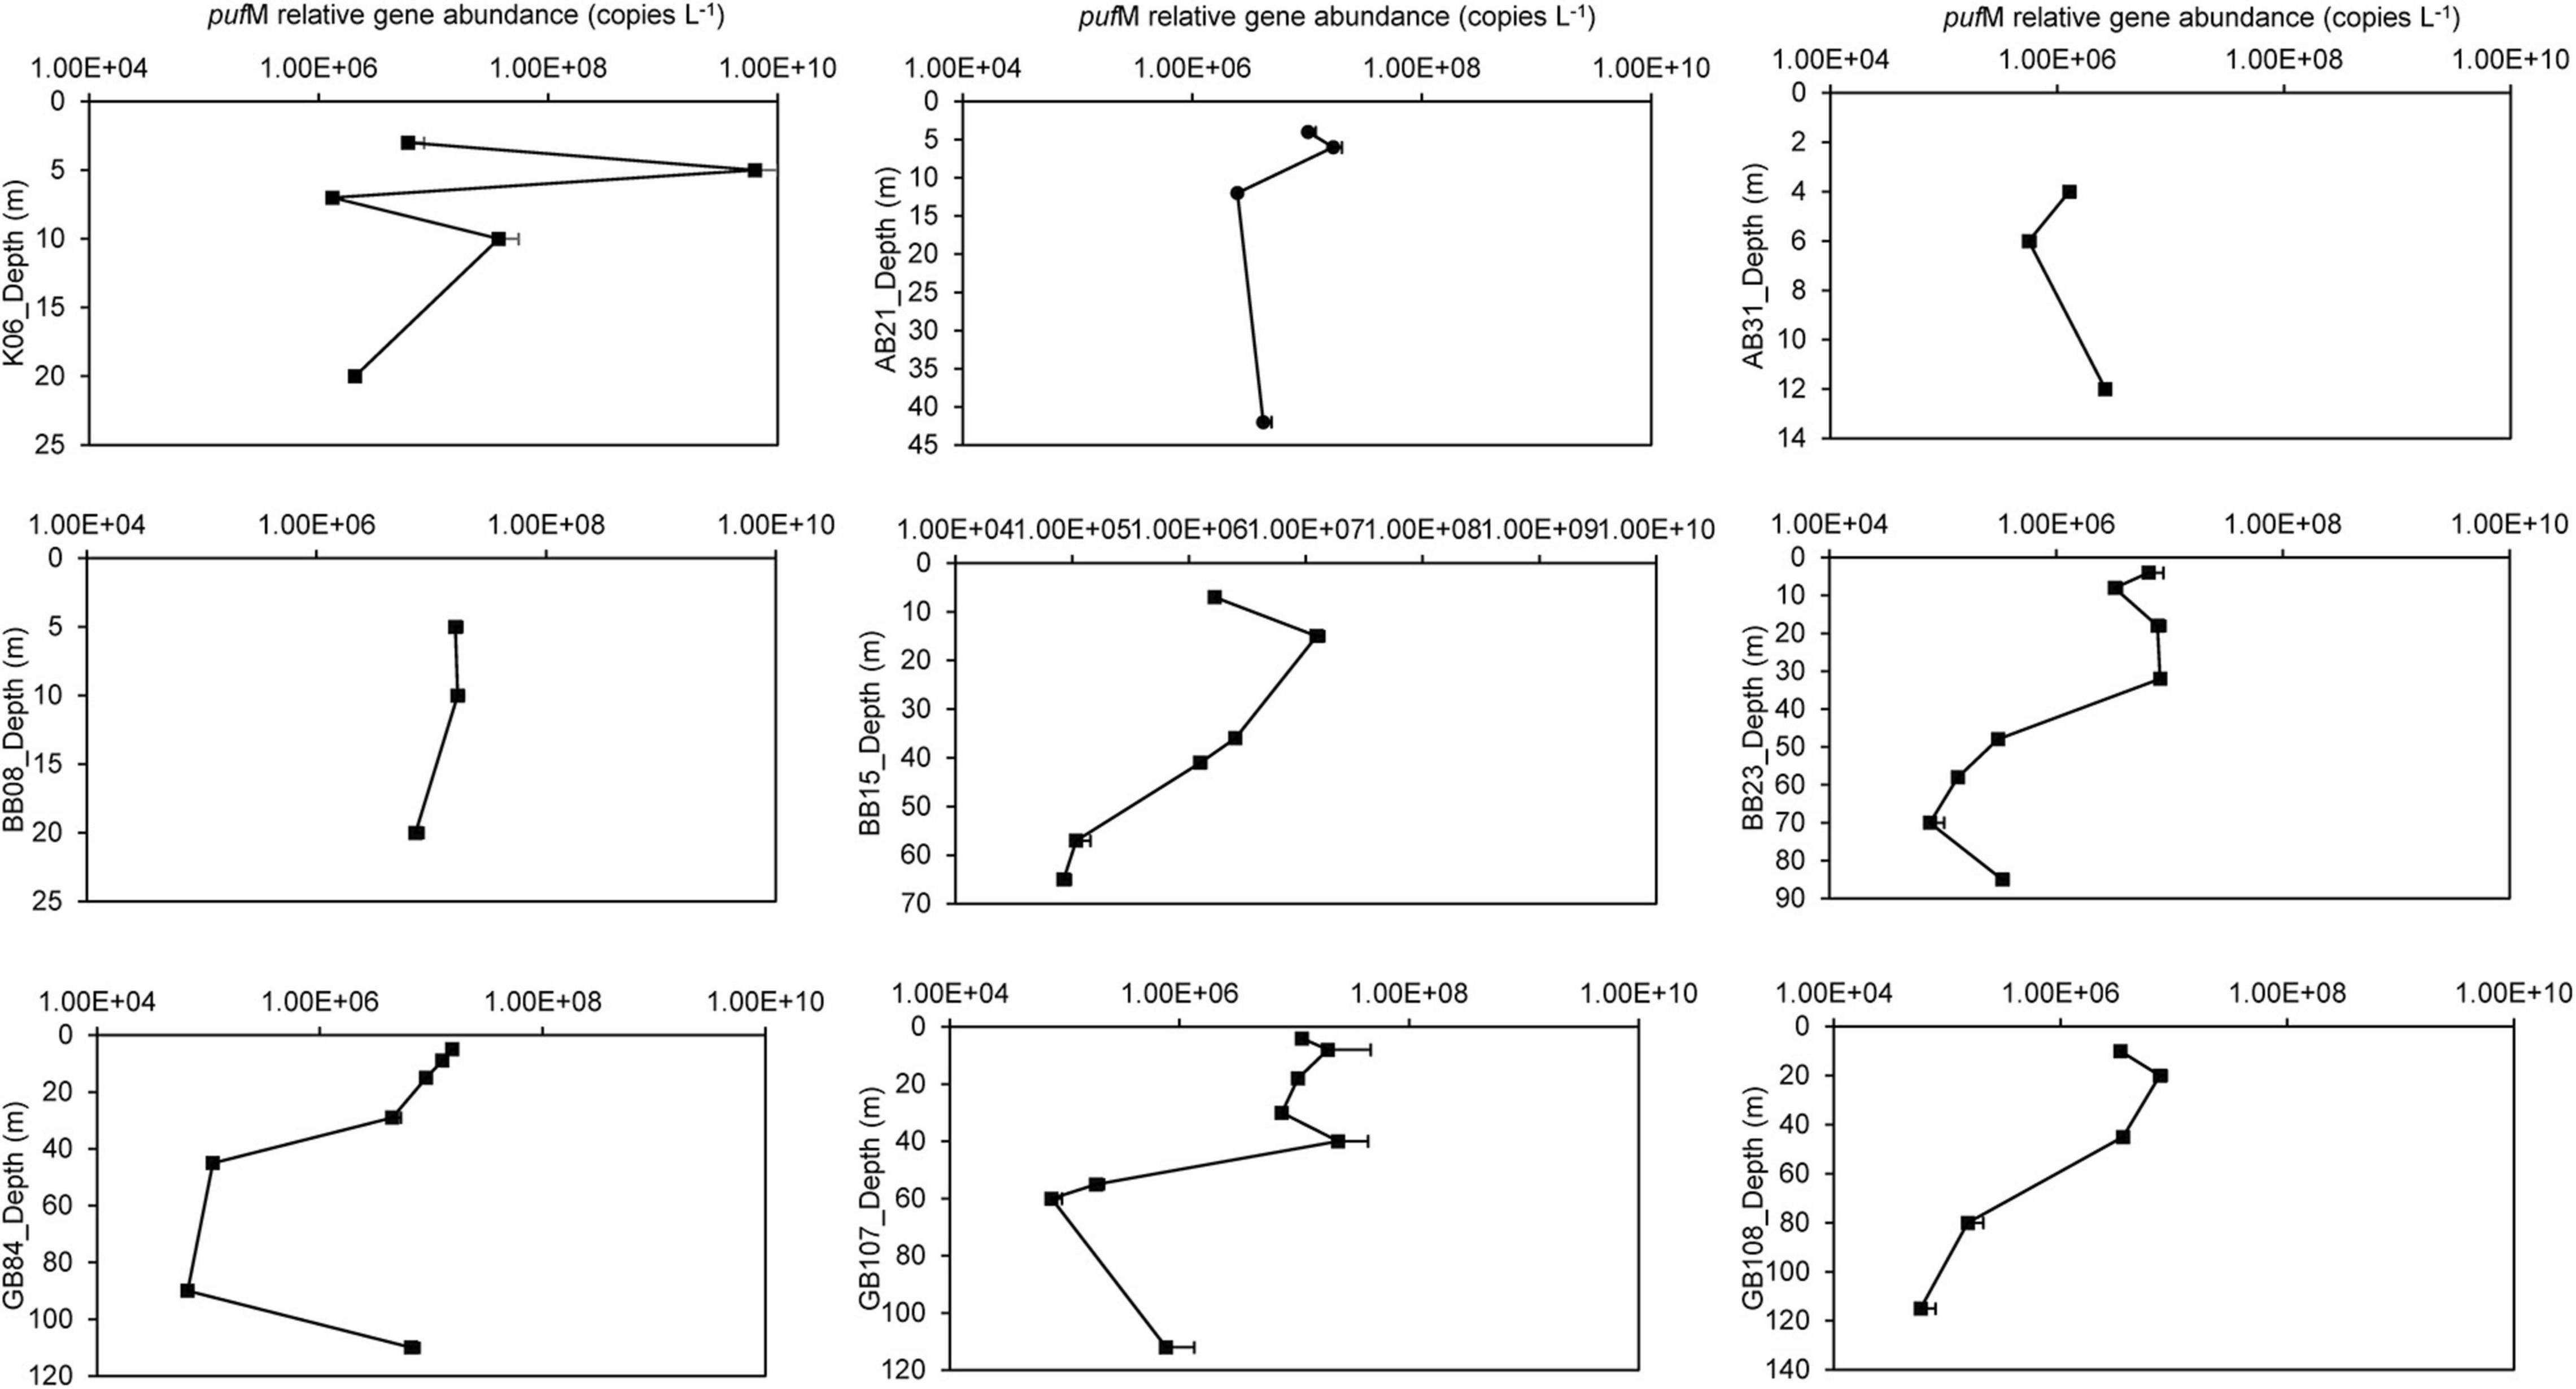
Figure 10. Spatial distribution patterns of gene copy number (DNA) and transcript (mRNA) abundance of the OP photosynthetic gene, psbA.
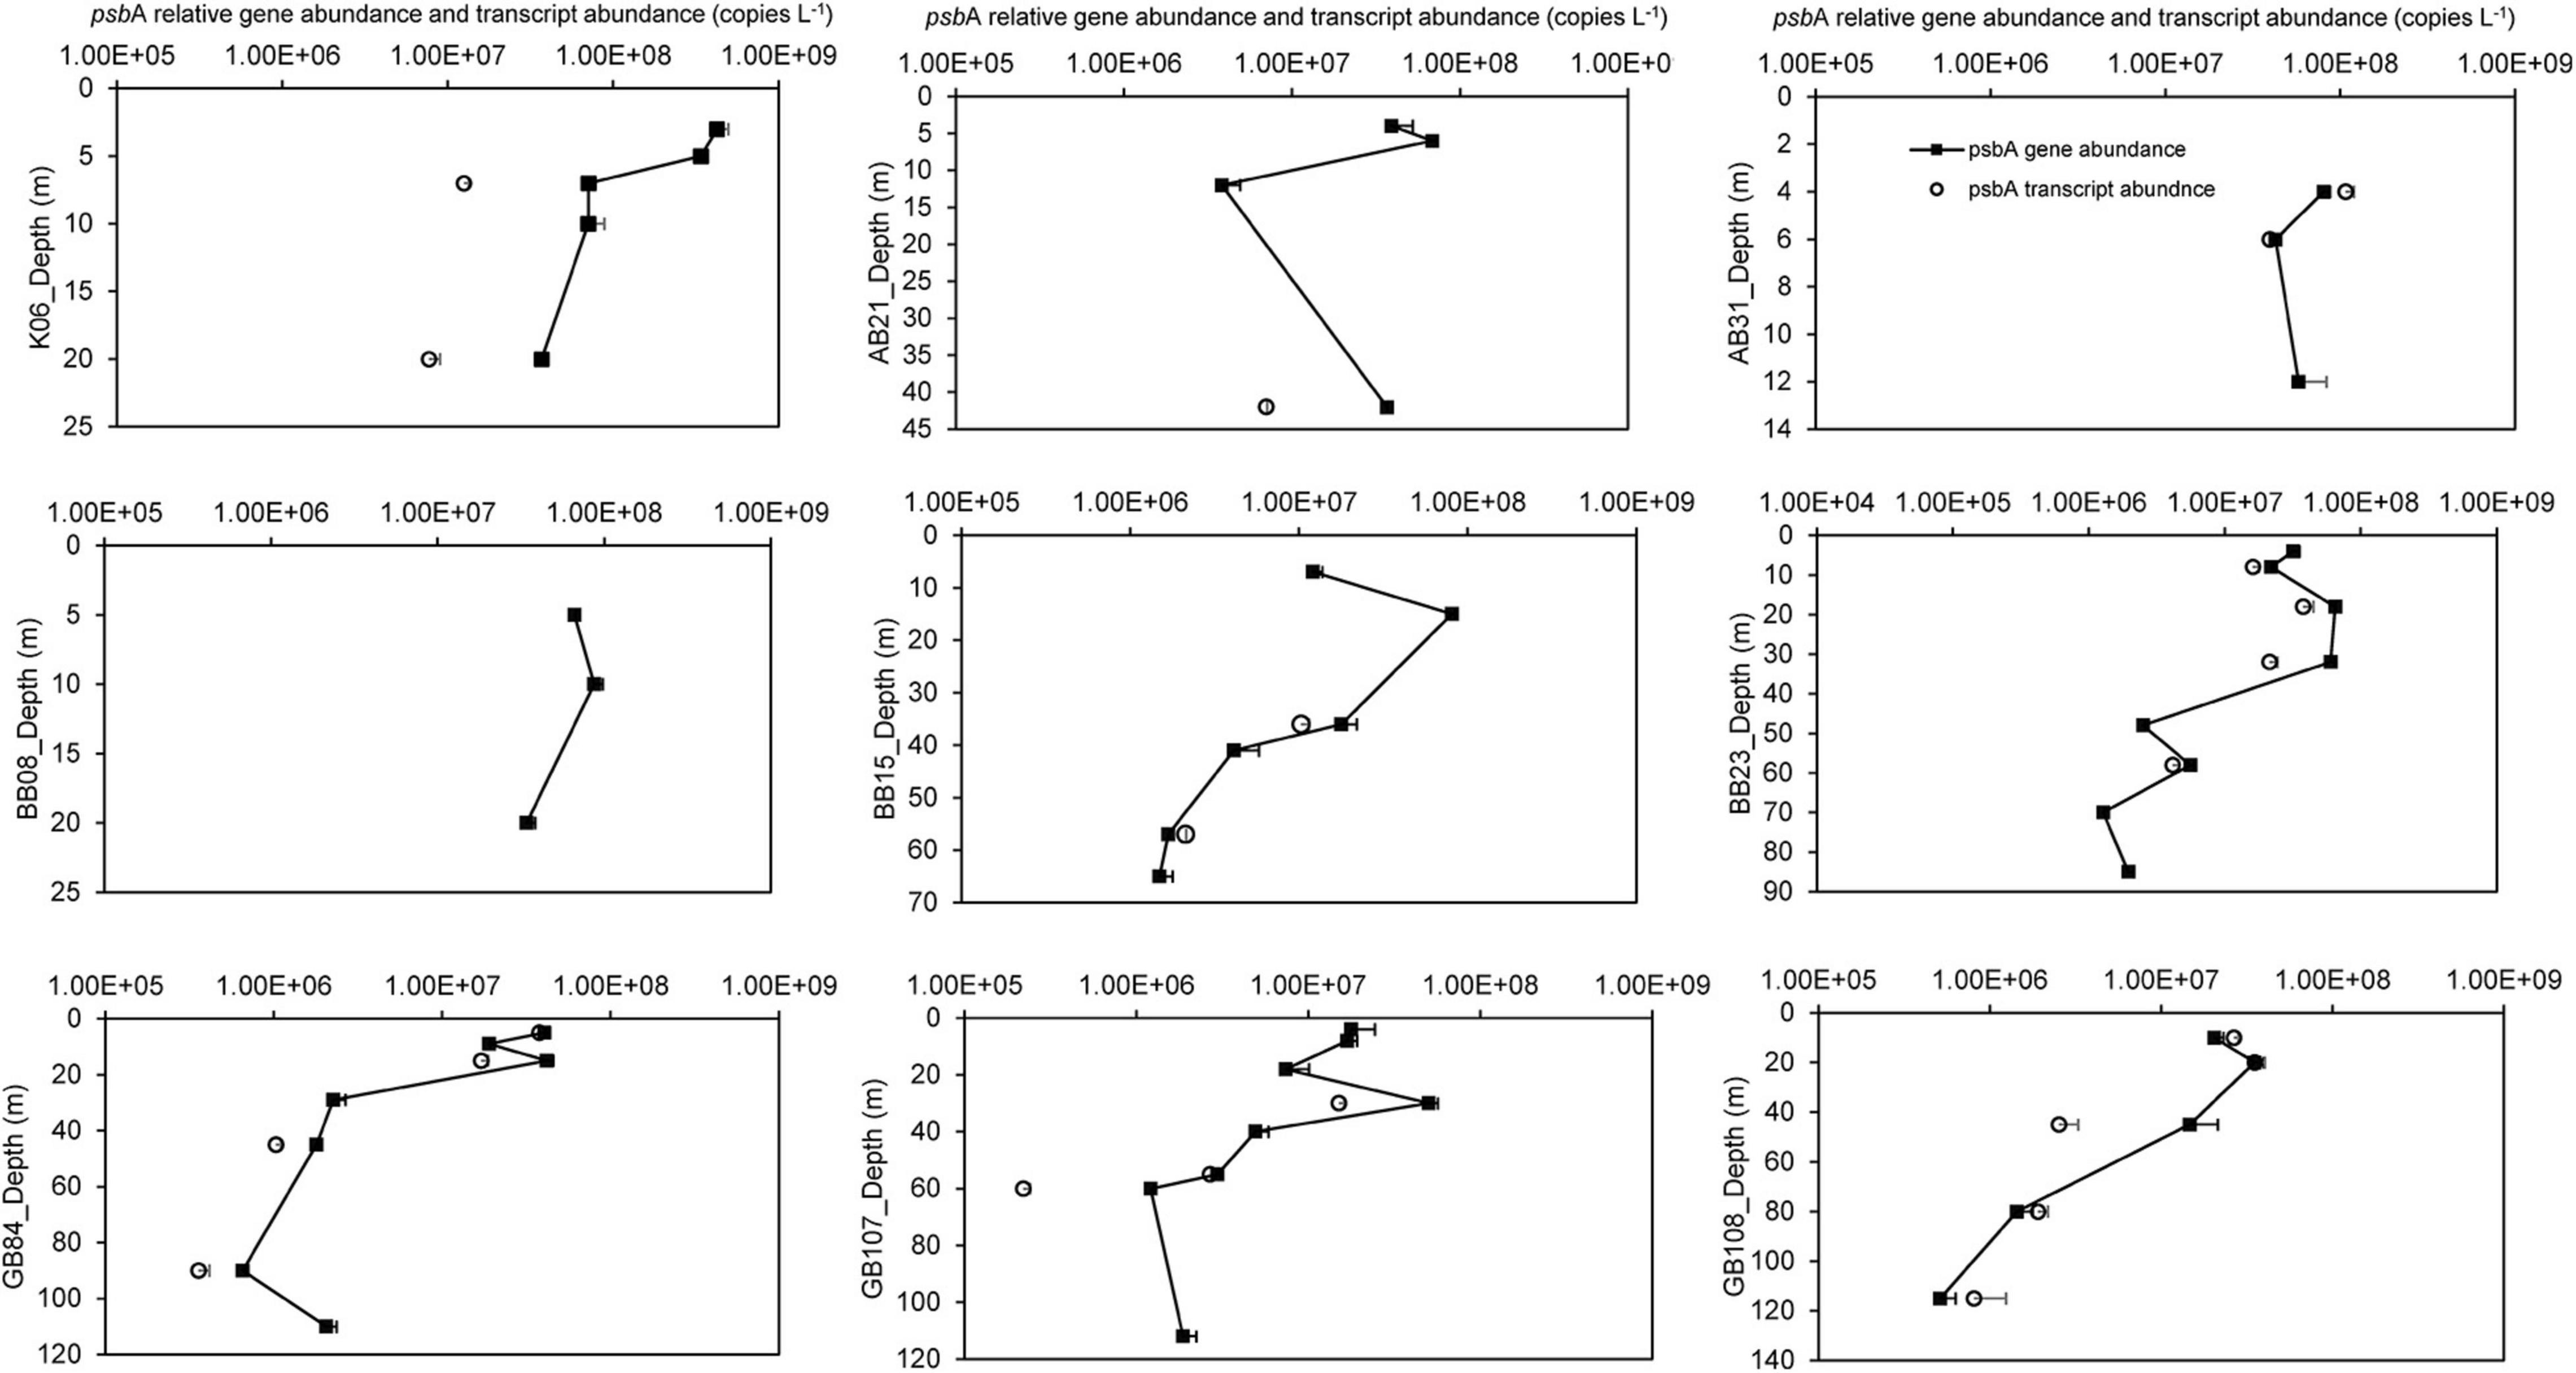
Figure 11. (A,B) Spatial distribution of gene copy number (DNA) of the AP and OP photosynthetic gene (pufM and psbA, respectively), (C) spatial distribution of transcript (mRNA) abundance of the OP photosynthetic gene (psbA), (D) transcriptional activity of psbA expressed as the ratio of mRNA to DNA.
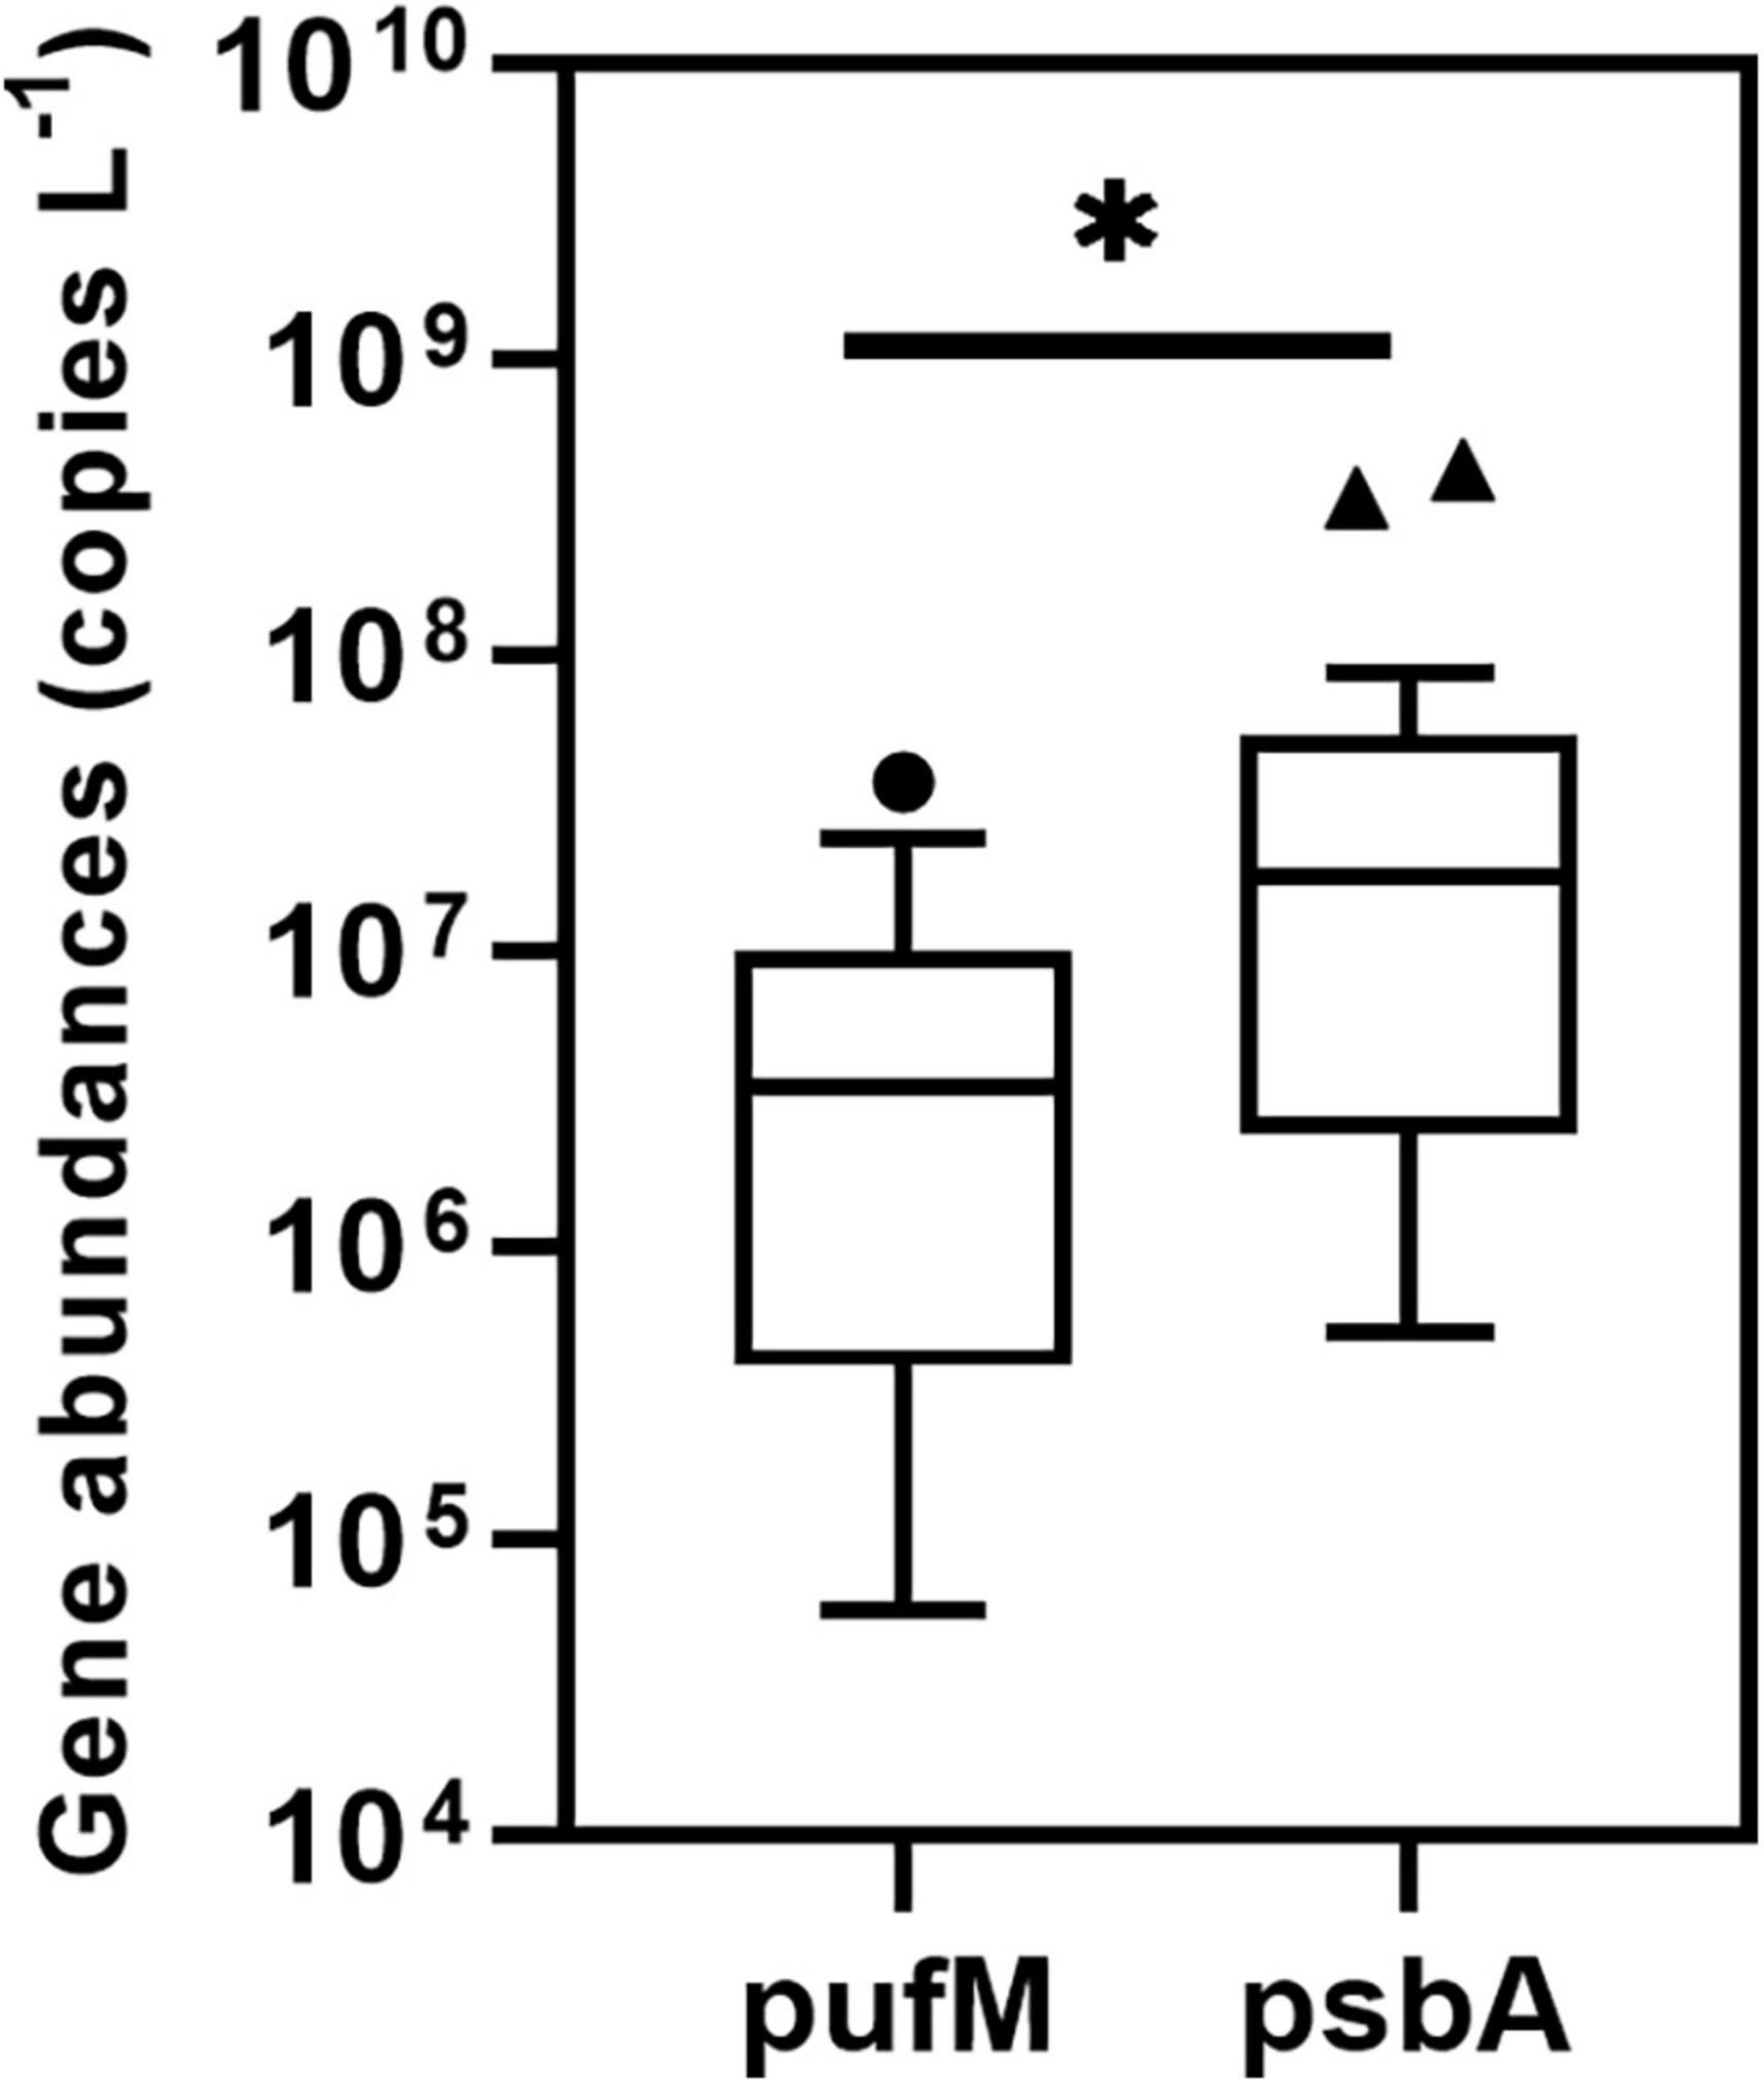
Figure 12. Gene abundance of anoxygenic photosynthesis (AP, pufM) and OP photosystem-II (OP-PSII, psbA) in 49 samples. Note: the pufM gene copy number in KO6_5 m is around 6.39*109copies L–1, which is not shown in the figure. * Means the significant difference between two groups (p < 0.05).
Overall, when considering all the environmental variables and carbon fixation rates, psbA gene abundance and psbA transcript abundances were negatively correlated with depth, and positively correlated with temperature (Table 3). PsbA gene abundance and AP abundance in the microbial community were positively correlated with salinity. Furthermore, OP-Cyanobacteria abundance in microbial community were all positively correlated with oxygen. In addition, psbA gene abundance was positively correlated with OP-Cyanobacteria abundance in the microbial community.
The Baltic Sea has been described as a time machine for the future coastal ocean due to its early history of multi-stressor disturbance related to climate change, such as warming waters, expanding of oxygen-depleted areas, acidification, nutrient pollution (Reusch et al., 2018). Previous studies have shown how some of these ambient factors impact the distribution of microbes (Herlemann et al., 2016; Lindh and Pinhassi, 2018). However, effects of these ambient factors on the Baltic Sea on microbial phototrophic groups, including both OP and AP, have not been explored systematically. Understanding the factors that drive the relative distribution and activity of OP and AP is, however, important as these functional groups use light as energy source and contribute to carbon flow and oxygen dynamics.
Stratified patterns of temperature, salinity and pH were clearly observed during our cruise, representing a typical situation in the Baltic Sea (Table 1 and Figure 1). Oxygen depletion is typically caused by benthic processes in the Baltic Sea, and anoxic waters continuously occurred and expanded over the last 100 years, which especially strong in summer due to stratification of water column (Koskinen et al., 2011; Reusch et al., 2018).
Dominant microbial groups play important roles in the biogeochemical cycles in the ocean, such as the uptake of dissolved organic materials (Kirchman, 2002) or nitrogen fixation (Farnelid et al., 2013). Their roles and interactions could change in different environments due to their diverse metabolisms (Thureborn et al., 2013; Broman et al., 2017). Our data show a high proportion of SAR11 bacteria in both oxic and anoxic waters in the upper and mixed water column (< 65 m), but not in deep waters (> 85 m) (Figure 2). The role of SAR11 in oxic waters is mainly related to aerobic organic carbon oxidation. However in anoxic waters, it is linked to the loss of nitrogen (Tsementzi et al., 2016). Due to the requirement of an unusual range of nutrients, the biochemical interactions between SAR11 and other plankton is complex (Giovannoni, 2017). This may lead to the extremely low abundance of SAR11 in deep waters, where the community composition radically changed. SAR406, Thiomicrospirales and Rhodospirillales, dominated in deep anoxic waters (Figure 2); those are groups with anaerobic or microaerophilic metabolisms (Pajares et al., 2020). In the deep and oxic Gotland Basin, high relative abundances of the sulfur-oxidizing Campylobacterales and the sulfate-reducing Desulfobacterota (Supplementary Figure 1) may suggest the possible occurrence of H2S in the deeper water column or sediment (Koskinen et al., 2011; Adam and Perner, 2018), which was detected below the depth of 140 m in previous studies (Salka et al., 2008). Flavobacteriales reached a relatively high abundance in all the samples (Figure 2), and, as those microbes can hydrolyze organic material from diverse sources, they are key for various carbon transformations (Thureborn et al., 2013).
Despite the variability of water conditions in the different basins, the pattern of microbial community along depth gradients was much clearer than with latitudinal gradients (Figure 3). The same phenomenon was also observed in the northern Baltic Sea (Gulf of Finland), in which pelagic samples clustered based on sampling depth instead of sampling site (Koskinen et al., 2011). In addition, temperature, salinity, and dissolved oxygen were significant in shaping the bacterial communities in the Baltic Sea (Figure 4). Previous studies have shown that salinity, temperature and seasonal differences (between July and February) were key factors shaping the bacterial community in the Baltic Sea, with a stronger impact of salinity (Herlemann et al., 2011, 2016). Dissolved oxygen was considered a crucial factor influencing microbial community composition in other OMZs, such as the Arabian Sea and the Gulf of Finland of the Baltic Sea (Koskinen et al., 2011; Fernandes et al., 2020). The dominant groups in other OMZs were, however, different, for example, SAR11 was present in high abundance in the OMZ of the Arabian Sea, the tropical Mexican Pacific, and in this study, but not in the Gulf of Finland of the Baltic Sea. SAR 406 and Thiomicrospirales abundant in the OMZ during this study and in the tropical Mexican Pacific were not abundant or even present in the other two OMZs (Koskinen et al., 2011; Fernandes et al., 2020; Pajares et al., 2020).
The highest diversity of microbial ASVs occurred in anoxic waters during our study (Table 2). A similar observation was made before in the Mexican Pacific, where a higher microbial diversity was detected in the oxygen minimum zone than in the euphotic zone (Pajares et al., 2020). A possible explanation might be that multiple electron acceptors could be used for microbial respiration, which increases the niche availability at anoxic conditions. In oxic waters, however, oxygen is mainly utilized and not restricted, resulting in a relatively lower niche availability (Stevens and Ulloa, 2008).
The diversity of AP was mostly consistent between both, 16S rRNA amplicon sequencing and pufM or bchY marker gene analyses (Figure 6 and Supplementary Figures 3, 4). Rhodobacterales, belonging to Alphaproteobacteria, have been shown to be the major group both in abundance and diversity (Figures 6, 7). Five other orders of AP, including Rhizobiales and Burkholderiales, were recovered by both methods. Four more orders of AP including Chloroflexales and Cellvibrionales were observed only by 16S rRNA amplicon sequencing. Some groups could taxonomically not be identified, possibly due to the lack of specific corresponding references in the database. The composition of AP was coherent with the previous study that investigated using pufM marker gene in four basins (< 40 m) of the Baltic Sea, which found the major group belonging to Rhodobacterales and the rest of them to Gammaproteobacteria (Salka et al., 2008). On the other hand, although pufM has been widely used to represent the abundance of AP, our data show that there was no significant correlation between the AP abundance in the microbial community based on 16S rRNA sequencing and pufM gene abundance (Table 3, p = 0.679). This may be due to the limitation of each technique, such as the primer bias of the real-time PCR (Yutin et al., 2005), a potentially unprecise affiliation caused by exporting short genomic regions and a bias of universal primers (Cariou et al., 2018). Also, an explanation could be a potential presence of multiple gene copies within one cell as found in a number of Cyanobacteria (Golden et al., 1986). The pufM gene abundance, ranging mostly from 104 to 107 copies L–1 (Figure 9), was a bit lower than in other previous studies conducted on the east coast of Australia and in subtropical karst catchments of southwest of China (Bibiloni-Isaksson et al., 2016; Li et al., 2017), where they were typically found ranging from 105 to 108 copies L–1.
Compared to AP diversity, the diversity of OP was higher, including eukaryotic algae, and Cyanobacteria (Figures 6, 7). In addition, Cyanophages were found by targeting the psbA photosynthesis gene (Figure 7 and Supplementary Figure 2), and Cyanophage photosynthesis genes were suggested to help support its host’s photosynthesis activity during its process of infection (Sharon et al., 2007). Although psbA gene abundance included not only Cyanobacteria but also eukaryotic algae and other groups, the abundance of Cyanobacteria in the microbial community (%) and OP-psbA were significantly correlated (Table 3, r = 0.791, p < 0.001). This indicated that either the distribution patterns of these OP groups were quite similar, or Cyanobacteria might be a dominant group in the OP pool. Some earlier studies used microscopy to investigate the abundance of either Cyanobacteria or specific eukaryotic algae groups, such as Diatoms and Dinoflagellates, mainly focusing on the surface waters of the Baltic Sea (Norbent and Steffen, 2003; Mašín et al., 2006; Salka et al., 2008; Camarena-Gómez et al., 2021). Those studies showed that Diatoms were the dominant group in phytoplankton spring bloom communities (Camarena-Gómez et al., 2021), and Synechococcus occurred in a high relative abundance in the surface water during summer time in the Baltic Sea (Herlemann et al., 2016). Previous studies have shown that Cyanobacterial blooms occurred almost every summer in the Baltic Sea, and the dominant species were Nodularia spumigena, Aphanizomenon flos-aquae, and Anabaena app., belonging to the order Nostocales (Vahtera et al., 2007; Kahru et al., 2020). The sampling time of our study was in September, and the summer blooms had already passed. But we still detected some of the typical bloom species, such as Nodularia spumigena, Aphanizomenon flos-aquae, and different Diatoms (Supplementary Figure 2). In addition to these species, other oxygenic phototrophs may also bloom as the Baltic Sea harbors a diversity of OP groups (Supplementary Figure 2), including Chlorophyta. Our study was the first investigating all OP groups and comparing their abundance and composition to AP using both 16S rRNA amplicon sequencing and photosynthesis marker genes in various depth profiles of the Baltic Sea.
Due to the metabolic dependence on light, both AP and OP are mostly detected in the photic zone, which is typically shallow in the Baltic Sea, reaching water depths of 20–30 m (Wasmund and Siegel, 2008). Several studies have shown that AP were more abundant in the mixed layer than in surface and deep waters, and different groups of OP preferred to be in surface layer, especially Synechococcus (Sieracki et al., 2006; Zhang and Jiao, 2007; Hojerová et al., 2011; Bibiloni-Isaksson et al., 2016). In line with this, the abundance of AP was found to have a maximum between 20 and 40 m also in the Mediterranean Sea (Hojerová et al., 2011). Also in the coastal waters of Australia, AP abundances were higher at depths between 20 and 50 m than at depth between 0 and 20 m and declined considerably below 50 m water depth (Bibiloni-Isaksson et al., 2016). In the Sargasso Sea, the maximum of AP abundance occurred from 15 to 60 m, with lower abundance in surface and deep waters, while OP groups—Synechococcus, Prochlorococcus and other eukaryotes—were most abundant at the surface, at 60 and 30 m (Sieracki et al., 2006). A similar pattern was observed in the east China Sea, with the OP components (Synechococcus, Prochlorococcus, and pico-sized eukaryotes) peaking in surface waters and AP peaking between 42 and 76 m (Zhang and Jiao, 2007). Our study also showed that OP-Cyanobacteria abundance was much higher than AP in surface waters shallower than 8 m, while the pattern was inverted below 8 m (Figure 5). Nevertheless, when comparing the specific marker gene abundance of OP and AP, OP-psbA gene abundance was higher than AP-pufM gene abundance in most samples (Figure 12), and both were higher in the photic zone than in deep water (Figures 11A,B). This was coherent with a previous study using metagenomic sequencing on samples from the mixed layer between 5 and 40 m at coastal stations of the San Pedro Channel in the Pacific Ocean, which showed the normalized abundance of OP (psaA) was 2 –3 times higher than AP (pufM) (Sieradzki et al., 2018). However, in surface waters of the South-Eastern Mediterranean Sea, the normalized abundance of OP-psaA, ranging from 2.4 to 14.2%, was not significantly different with AP-pufM, ranging from 3.5 to 10.4%, within the metagenomic database, even though the abundance of OP was much higher than AP as determined by epifluorescence microscopy (Dubinsky et al., 2017). The difference between those studies may be due to the different sampling depths, seasons, and environmental surroundings. Our data showed that depth had a significant impact on OP-Cyanobacteria and OP-psbA gene abundance (Table 3), and one of the main reasons could be light availability (Michelou et al., 2007). Several studies have shown that there was a significant positive correlation between AP abundance and chlorophyll (Jiao et al., 2007; Hojerová et al., 2011). Although our data did not have enough samples to analyze the precise correlation between Chla and AP abundance, the strong correlation (Table 3, r = 0.572, p < 0.001) between OP-psbA and AP-pufM gene abundances could indicate that the niche of AP was connected to OP, in more productive regions or shelf waters (Cottrell et al., 2006; Sieracki et al., 2006). OP community is the key group of contributor to primary productivity (Raven, 2009). Our data, however, did not indicate any solid correlation between OP photosynthesis gene abundances and carbon fixation rates in the seawater (Table 3), which might be due to the incomparability of gene abundance to activity in terms of rates. Another reason might be an insufficient sample size for carbon fixation rates. Further, as our sampling time was in September, it fell into a period with low primary productivity and might therefore not be fully representative.
Our DNA-based studies showed a detailed picture of the phototrophic community, but information about their activity remains elusive. Therefore, it is important to examine not only existence or abundance of the functional genes, but also gene expression. However, RNA-based studies exploring photosynthetic gene activity are rare. Data on the comparison of OP and AP gene expressions is even less available, and only found in a few metatranscriptomic studies (Vila-Costa et al., 2013; Sieradzki et al., 2018; Linz et al., 2020). The above mentioned study conducted in the San Pedro Channel in the Pacific Ocean showed the AP-pufM transcriptional activity (RNA: DNA ratio) was significantly lower than OP-psaA (Sieradzki et al., 2018). Our data show a similar pattern, with even the highest AP-pufM transcript abundance across all the samples still much lower than OP-psbA. The low level of pufM gene expression could be due to both the low gene abundance and the sampling time. It has been shown that the gene expressions of the puf cluster occurs mostly at night (Voget et al., 2015; Fecskeová et al., 2019) and our samples were all collected during daytime. During the daytime, light exposure could cause repression of photosynthesis gene expression, as shown for several AP species, e.g., Roseobacter denitrificans and Dinoroseobacter shibae (Nishimura et al., 1996; Tomasch et al., 2011). It is worth mentioning that in a recent diel study using metatranscriptomics, AP photosynthesis gene expression peaked during the night, while OP photosynthesis gene expression peaked during the day (Linz et al., 2020). The depth profiles of OP-psbA gene expression could also mainly be due to its gene abundances, as psbA transcript abundance was significantly related to psbA gene abundance (r = 0.727, p < 0.0001) (Table 3).
Not only light, but also factors, such as salinity, temperature, and nutrient status, have been explored as possible factors regulating the abundance and activity of OP and AP. In the Baltic Sea, water temperature was positively related to the blooming of both Cyanobacteria and filamentous algal species, especially green algae (Takolander et al., 2017; Kahru et al., 2020). For specific cyanobacterial species, e.g., Synechococcus sp., temperature was positively correlated to their psbA gene abundance under N-repleted conditions (Fernández-González et al., 2020). Our data also indicated that OP group in the Baltic Sea had a strong and positive correlation with temperature in the range between 4 and 16°C (Table 3). Furthermore, we found that OP photosynthetic metabolism is more active at warmer temperatures. On the other hand, seasonal studies showed temperature to also have a positive impact on AP abundance in seawater (Lamy et al., 2011; Ferrera et al., 2014; Auladell et al., 2019). A study about spatial distribution of AP conducted in the northwest Atlantic suggested low temperature may limit AP cell abundances, with a threshold at below 6°C and above 10°C (Sieracki et al., 2006). A recent microcosm study showed higher temperatures can enhance the net growth rate of AP by comparing three temperatures, 10, 20, and 30°C (Sato-Takabe et al., 2019). However, our data do not show a significant connection between temperature and AP-pufM abundance (Table 3, r = 0.143, p = 0.328). This inconsistency may be because of the differences of temperature range and grazers impacting the AP community. Ocean acidification has an impact on the abundance of both OP and AP groups (Sala et al., 2016; Li et al., 2017), and its impact related to the nutrient status. The available data points from the present study do not allow for a more precise investigation of the correlation between pH or DIC and AP or OP groups (Table 3).
On the other hand, abundance of OP groups, including phototrophic picoplankton and Cyanobacteria, were found to be strongly correlated with salinity in various areas (Šantić et al., 2017; Auladell et al., 2019). Our data also found that OP, but not OP-Cyanobacteria, showed a significantly positive correlation with salinity (Table 3). OP photosynthetic activity, however, does not have a strong correlation with salinity. Nonetheless, OP-Cyanobacteria preferred to live in higher oxygen waters (Table 3). However, DO did not have significant positive impacts on both OP (with eukaryotic algae) (p = 0.719) and AP (p = 0.947) communities, and OP photosynthetic activity (p = 0.09) (Table 3). Although there might be different demands for oxygen between OP and AP, and OP but not AP produce oxygen while they carry out photosynthesis, DO did not seem to be a key factor for phototrophic abundance and activity. Therefore, both OP and AP may not be negatively impacted by oxygen-depleted waters expanding in the Baltic Sea but might even benefit from an expanding niche. This suggestion has, however, a limitation as we did not cover the full oxygen range in our sampling and could therefore have missed a threshold in the low oxygen to anoxic range.
This study provides important insights for understanding the distribution and structure of both the microbial community and phototrophs, especially focusing on the comparison of the distribution and activity of AP and OP in the Baltic Sea which is exposed to multiple climate-related threats. Microbial community assemblages were correlated with environmental factors such as salinity, temperature, oxygen, and depth. Different dominant microbial groups were observed in the OMZ, deep, and surface and intermediate waters.
Both, AP and OP, displayed a high diversity. OP groups, including Eukaryotic algae and Cyanobacteria, were more abundant than AP in most areas. OP photosynthesis was quite active crossing all stations, while most AP photosynthesis cannot be detected that might be due to the daytime of sampling. Both OP (only Cyanobacteria) and OP (with Eukaryotic algae) preferred to live in higher temperature and upper waters, but Cyanobacteria had another preference of oxic water, while the whole OP community preferred to live in higher salinity area. AP did not show any significant physico-chemical preference but prefer to live with OP community. OP showed more photosynthesis activity in higher temperature and upper waters. As the changing Baltic Sea will see higher temperatures, lower salinity, expanding of deoxygenation, and other problems, this study could help to interpret how these phototrophic groups might shift in distribution and activity in a long-term analog.
The datasets presented in this study can be found in online repositories. The names of the repository/repositories and accession number(s) can be found below: NCBI (accession: SAMN20309768-SAMN20309783, MZ960574 to MZ960756).
CL designed the study. CR conducted the sampling, conducted experiments for biogeochemical parameters, and analyzed the data. PX conducted molecular experiments and performed all the statistical analysis with the contribution of CL and CR. PX wrote the manuscript. All authors contributed to manuscript revision, read, and approved the submitted version.
Financial support was provided by the Villum Foundation (grants no: #24911, to CL; grants no. #16518 to D. Canfield).
The authors declare that the research was conducted in the absence of any commercial or financial relationships that could be construed as a potential conflict of interest.
All claims expressed in this article are solely those of the authors and do not necessarily represent those of their affiliated organizations, or those of the publisher, the editors and the reviewers. Any product that may be evaluated in this article, or claim that may be made by its manufacturer, is not guaranteed or endorsed by the publisher.
We appreciate the support from the captain, crew and the chief scientist J. Süling for Alkor 528 during the Cruise. We are grateful for the financial support for the Cruise provided by the European Union’s Horizon 2020 Research and Innovation Program (Grant agreement no. 774499 to J. Javidpour, GoJelly project). We acknowledge E. Laursen and R. Orloff Holm for their technical assistance. We further acknowledge the Nordcee labs at SDU and the GEOMAR-Helmholtz Centre for Ocean Research Kiel for giving access to their research facilities. We are grateful to the China Scholarship Council, for granting a scholarship to PX (China Scholarship Council Studentship with the University of Southern Denmark (grant no. 201908440275) and to the Villum Foundation (grant no. 24911). We acknowledge D. Canfield for supporting experiment supplies [Villum Foundation (grants no. 16518)]. We thank the reviewers KP and EC, as well as the editor for their help with improving the manuscript.
The Supplementary Material for this article can be found online at: https://www.frontiersin.org/articles/10.3389/fmars.2021.773210/full#supplementary-material
Adam, N., and Perner, M. (2018). Microbially mediated hydrogen cycling in deep-sea hydrothermal vents. Front. Microbiol. 9:2873. doi: 10.3389/fmicb.2018.02873
Ahn, K., Lee, K. B., Kim, Y. J., and Koo, Y. M. (2014). Quantitative analysis of the three main genera in effective microorganisms using qPCR. Korean J. Chem. Eng. 31, 849–854. doi: 10.1007/s11814-013-0274-6
Alcamán-Arias, M. E., Pedrós-Alió, C., Tamames, J., Fernández, C., Pérez-Pantoja, D., Vásquez, M., et al. (2018). Diurnal changes in active carbon and nitrogen pathways along the temperature gradient in porcelana hot spring microbial mat. Front. Microbiol. 9:2353. doi: 10.3389/fmicb.2018.02353
Alves Junior, N., Meirelles, P. M., de Oliveira Santos, E., Dutilh, B., Silva, G. G. Z., Paranhos, R., et al. (2015). Microbial community diversity and physical–chemical features of the Southwestern Atlantic ocean. Arch. Microbiol. 197, 165–179. doi: 10.1007/s00203-014-1035-6
Andersen, K. S., Kirkegaard, R. H., Karst, S. M., and Albertsen, M. (2018). Ampvis2: an R package to analyse and visualise 16S rRNA amplicon data. bioRxiv [Preprint]. doi: 10.1101/299537
Auladell, A., Sánchez, P., Sánchez, O., Gasol, J. M., and Ferrera, I. (2019). Long-term seasonal and interannual variability of marine aerobic anoxygenic photoheterotrophic bacteria. ISME J. 13, 1975–1987. doi: 10.1038/s41396-019-0401-4
Bentzon-Tilia, M., Traving, S. J., Mantikci, M., Knudsen-Leerbeck, H., Hansen, J. L. S., Markager, S., et al. (2015). Significant N2 fixation by heterotrophs, photoheterotrophs and heterocystous cyanobacteria in two temperate estuaries. ISME J. 9, 273–285. doi: 10.1038/ismej.2014.119
Bibiloni-Isaksson, J., Seymour, J. R., Ingleton, T., van de Kamp, J., Bodrossy, L., and Brown, M. V. (2016). Spatial and temporal variability of aerobic anoxygenic photoheterotrophic bacteria along the east coast of Australia. Environ. Microbiol. 18, 4485–4500. doi: 10.1111/1462-2920.13436
Boeuf, D., Cottrell, M. T., Kirchman, D. L., Lebaron, P., and Jeanthon, C. (2013). Summer community structure of aerobic anoxygenic phototrophic bacteria in the western Arctic Ocean. FEMS Microbiol. Ecol. 85, 417–432. doi: 10.1111/1574-6941.12130
Breitburg, D., Levin, L. A., Oschlies, A., Grégoire, M., Chavez, F. P., Conley, D. J., et al. (2018). Declining oxygen in the global ocean and coastal waters. Science 359:eaam7240. doi: 10.1126/science.aam7240
Broman, E., Sachpazidou, V., Pinhassi, J., and Dopson, M. (2017). Oxygenation of hypoxic coastal Baltic sea sediments impacts on chemistry, microbial community composition, and metabolism. Front. Microbiol. 8:2453. doi: 10.3389/fmicb.2017.02453
Brown, M. V., Philip, G. K., Bunge, J. A., Smith, M. C., Bissett, A., Lauro, F. M., et al. (2009). Microbial community structure in the North Pacific ocean. ISME J. 3, 1374–1386. doi: 10.1038/ismej.2009.86
Callahan, B. J., McMurdie, P. J., Rosen, M. J., Han, A. W., Johnson, A. J. A., and Holmes, S. P. (2016). DADA2: High-resolution sample inference from Illumina amplicon data. Nat. Methods 13, 581–583. doi: 10.1038/nmeth.3869
Camarena-Gómez, M. T., Ruiz-González, C., Piiparinen, J., Lipsewers, T., Sobrino, C., Logares, R., et al. (2021). Bacterioplankton dynamics driven by interannual and spatial variation in diatom and dinoflagellate spring bloom communities in the Baltic Sea. Limnol. Oceanogr. 66, 255–271. doi: 10.1002/lno.11601
Cariou, M., Ribière, C., Morlière, S., Gauthier, J. P., Simon, J. C., Peyret, P., et al. (2018). Comparing 16S rDNA amplicon sequencing and hybridization capture for pea aphid microbiota diversity analysis. BMC Res. Notes 11:461. doi: 10.1186/s13104-018-3559-3
Carstensen, J., Andersen, J. H., Gustafsson, B. G., and Conley, D. J. (2014). Deoxygenation of the Baltic Sea during the last century. Proc. Natl. Acad. Sci. U.S.A. 111, 5628–5633. doi: 10.1073/pnas.1323156111
Conley, D. J., Bj̈orck, S., Bonsdorff, E., Carstensen, J., Destouni, G., Gustafsson, B. G., et al. (2009). Hypoxia-related processes in the Baltic Sea. Environ. Sci. Technol. 43, 3412–3420. doi: 10.1021/es802762a
Cottrell, M. T., Mannino, A., and Kirchman, D. L. (2006). Aerobic anoxygenic phototrophic bacteria in the mid-Atlantic bight and the north Pacific gyre. Appl. Environ. Microbiol. 72, 557–564. doi: 10.1128/AEM.72.1.557-564.2006
Cuadrat, R. R. C., Ferrera, I., Grossart, H. P., and Dávila, A. M. R. (2016). Picoplankton bloom in global south? A high fraction of aerobic anoxygenic phototrophic bacteria in metagenomes from a coastal bay (Arraial do Cabo-Brazil). OMICS 20, 76–87. doi: 10.1089/omi.2015.0142
Dubinsky, V., Haber, M., Burgsdorf, I., Saurav, K., Lehahn, Y., Malik, A., et al. (2017). Metagenomic analysis reveals unusually high incidence of proteorhodopsin genes in the ultraoligotrophic Eastern Mediterranean Sea. Environ. Microbiol. 19, 1077–1090. doi: 10.1111/1462-2920.13624
Dupont, C. L., Larsson, J., Yooseph, S., Ininbergs, K., Goll, J., Asplund-Samuelsson, J., et al. (2014). Functional tradeoffs underpin salinity-driven divergence in microbial community composition. PLoS One 9:e89549. doi: 10.1371/journal.pone.0089549
Falkowski, P. G., Fenchel, T., and Delong, E. F. (2008). The microbial engines that drive earth’s biogeochemical cycles. Science 320, 1034–1039. doi: 10.1126/science.1153213
Farnelid, H., Bentzon-Tilia, M., Andersson, A. F., Bertilsson, S., Nter Jost, G., Labrenz, M., et al. (2013). Active nitrogen-fixing heterotrophic bacteria at and below the chemocline of the central Baltic Sea. ISME J. 7, 1413–1423. doi: 10.1038/ismej.2013.26
Fecskeová, L. K., Piwosz, K., Hanusová, M., Nedoma, J., Znachor, P., and Koblížek, M. (2019). Diel changes and diversity of pufM expression in freshwater communities of anoxygenic phototrophic bacteria. Sci. Rep. 9:18766. doi: 10.1038/s41598-019-55210-x
Fernandes, G. L., Shenoy, B. D., and Damare, S. R. (2020). Diversity of bacterial community in the oxygen minimum zones of Arabian Sea and Bay of Bengal as deduced by Illumina sequencing. Front. Microbiol. 10:3153. doi: 10.3389/fmicb.2019.03153
Fernández-González, C., Pérez-Lorenzo, M., Pratt, N., Moore, C. M., Bibby, T. S., and Marañón, E. (2020). Effects of temperature and nutrient supply on resource allocation, photosynthetic strategy, and metabolic rates of Synechococcus sp. J. Phycol. 56, 818–829. doi: 10.1111/jpy.12983
Ferrera, I., Borrego, C. M., Salazar, G., and Gasol, J. M. (2014). Marked seasonality of aerobic anoxygenic phototrophic bacteria in the coastal NW Mediterranean Sea as revealed by cell abundance, pigment concentration and pyrosequencing of pufM gene. Environ. Microbiol. 16, 2953–2965. doi: 10.1111/1462-2920.12278
Ferrera, I., Gasol, J. M., Sebastián, M., Hojerová, E., and Kobížek, M. (2011). Comparison of growth rates of aerobic anoxygenic phototrophic bacteria and other bacterioplankton groups in coastal mediterranean waters. Appl. Environ. Microbiol. 77, 7451–7458. doi: 10.1128/AEM.00208-11
Garcia-Chaves, M. C., Cottrell, M. T., Kirchman, D. L., Ruiz-González, C., and Del Giorgio, P. A. (2016). Single-cell activity of freshwater aerobic anoxygenic phototrophic bacteria and their contribution to biomass production. ISME J. 10, 1579–1588. doi: 10.1038/ismej.2015.242
Giovannoni, S. J. (2017). SAR11 bacteria: the most abundant plankton in the oceans. Ann. Rev. Mar. Sci. 9, 231–255. doi: 10.1146/annurev-marine-010814-015934
Golden, S. S., Brusslan, J., and Haselkorn, R. (1986). Expression of a family of psbA genes encoding a photosystem II polypeptide in the cyanobacterium Anacystis nidulans R2. EMBO J. 5, 2789–2798. doi: 10.1002/j.1460-2075.1986.tb04569.x
Hall, P. O. J., and Aller, R. C. (1992). Rapid, small-volume, flow injection analysis for ∑CO2, and NH4+ in marine and freshwaters. Limnol. Oceanogr. 37, 1113–1119. doi: 10.4319/lo.1992.37.5.1113
Herlemann, D. P. R., Labrenz, M., Jürgens, K., Bertilsson, S., Waniek, J. J., and Andersson, A. F. (2011). Transitions in bacterial communities along the 2000 km salinity gradient of the Baltic Sea. ISME J. 5, 1571–1579. doi: 10.1038/ismej.2011.41
Herlemann, D. P. R., Lundin, D., Andersson, A. F., Labrenz, M., and Jürgens, K. (2016). Phylogenetic signals of salinity and season in bacterial community composition across the salinity gradient of the Baltic Sea. Front. Microbiol. 7:1883. doi: 10.3389/fmicb.2016.01883
Hojerová, E., Mašín, M., Brunet, C., Ferrera, I., Gasol, J. M., and Koblížek, M. (2011). Distribution and growth of aerobic anoxygenic phototrophs in the Mediterranean Sea. Environ. Microbiol. 13, 2717–2725. doi: 10.1111/j.1462-2920.2011.02540.x
Imhoff, J. F. (2017). Diversity of Anaerobic Anoxygenic Phototrophic Purple Bacteria, ed. P. C. Hallenbeck (Cham: Springer). doi: 10.1007/978-3-319-46261-5
Imhoff, J. F., Rahn, T., Künzel, S., and Neulinger, S. C. (2018). Photosynthesis is widely distributed among Proteobacteria as demonstrated by the phylogeny of pufLM reaction center proteins. Front. Microbiol. 8:2679. doi: 10.3389/fmicb.2017.02679
Jiao, N., Zhang, Y., Zeng, Y., Hong, N., Liu, R., Chen, F., et al. (2007). Distinct distribution pattern of abundance and diversity of aerobic anoxygenic phototrophic bacteria in the global ocean. Environ. Microbiol. 9, 3091–3099. doi: 10.1111/j.1462-2920.2007.01419.x
Kahru, M., Elmgren, R., Kaiser, J., Wasmund, N., and Savchuk, O. (2020). Cyanobacterial blooms in the Baltic Sea: correlations with environmental factors. Harmful Algae 92:101739. doi: 10.1016/j.hal.2019.101739
Kasalický, V., Zeng, Y., Piwosz, K., Šimek, K., Kratochvilová, H., and Koblížek, M. (2018). Aerobic anoxygenic photosynthesis is commonly present within the genus Limnohabitans. Appl. Environ. Microbiol. 84, e2116–e2117. doi: 10.1128/AEM.02116-17
Kirchman, D. L. (2002). The ecology of Cytophaga-Flavobacteria in aquatic environments. FEMS Microbiol. Ecol. 39, 91–100. doi: 10.1016/S0168-6496(01)00206-9
Koblížek, M. (2015). Ecology of aerobic anoxygenic phototrophs in aquatic environments. FEMS Microbiol. Rev. 39, 854–870. doi: 10.1093/femsre/fuv032
Koblížek, M., Falkowski, P. G., and Kolber, Z. S. (2006). Diversity and distribution of photosynthetic bacteria in the Black Sea. Deep. Res. Part II Top. Stud. Oceanogr. 53, 1934–1944. doi: 10.1016/j.dsr2.2006.03.019
Koblížek, M., Mašín, M., Ras, J., Poulton, A. J., and Prášil, O. (2007). Rapid growth rates of aerobic anoxygenic phototrophs in the ocean. Environ. Microbiol. 9, 2401–2406. doi: 10.1111/j.1462-2920.2007.01354.x
Kong, W., Li, W., Romancova, I., Prášil, O., and Morgan-Kiss, R. M. (2014). An integrated study of photochemical function and expression of a key photochemical gene (psbA) in photosynthetic communities of Lake Bonney (McMurdo Dry Valleys, Antarctica). FEMS Microbiol. Ecol. 89, 293–302. doi: 10.1111/1574-6941.12296
Koskinen, K., Hultman, J., Paulin, L., Auvinen, P., and Kankaanpää, H. (2011). Spatially differing bacterial communities in water columns of the northern Baltic Sea. FEMS Microbiol. Ecol. 75, 99–110. doi: 10.1111/j.1574-6941.2010.00987.x
Kumar, S., Stecher, G., Li, M., Knyaz, C., and Tamura, K. (2018). MEGA X: molecular evolutionary genetics analysis across computing platforms. Mol. Biol. Evol. 35, 1547–1549. doi: 10.1093/molbev/msy096
Lami, R., Cottrell, M. T., Ras, J., Ulloa, O., Obernosterer, I., Claustre, H., et al. (2007). High abundances of aerobic anoxygenic photosynthetic bacteria in the South Pacific ocean. Appl. Environ. Microbiol. 73, 4198–4205. doi: 10.1128/AEM.02652-06
Lamy, D., De Carvalho-Maalouf, P., Cottrell, M. T., Lami, R., Catala, P., Oriol, L., et al. (2011). Seasonal dynamics of aerobic anoxygenic phototrophs in a Mediterranean coastal lagoon. Aquat. Microb. Ecol. 62, 153–163. doi: 10.3354/ame01467
Levin, L. A. (2018). Manifestation, drivers, and emergence of open ocean deoxygenation. Ann. Rev. Mar. Sci. 10, 229–260. doi: 10.1146/annurev-marine-121916-063359
Li, Q., Song, A., Peng, W., Jin, Z., Müller, W. E. G., and Wang, X. (2017). Contribution of aerobic anoxygenic phototrophic bacteria to total organic carbon pool in aquatic system of subtropical karst catchments, Southwest China: evidence from hydrochemical and microbiological study. FEMS Microbiol. Ecol. 93, 1–8. doi: 10.1093/femsec/fix065
Lindh, M. V., and Pinhassi, J. (2018). Sensitivity of bacterioplankton to environmental disturbance: a review of Baltic Sea field studies and experiments. Front. Mar. Sci. 5:361. doi: 10.3389/fmars.2018.00361
Linz, A. M., Aylward, F. O., Bertilsson, S., McMahon, K. D., Grossart, H. P., Massana, R., et al. (2020). Time-series metatranscriptomes reveal conserved patterns between phototrophic and heterotrophic microbes in diverse freshwater systems. Limnol. Oceanogr. 65, 101–112. doi: 10.1002/lno.11306
Liu, R., Zhang, Y., and Jiao, N. (2010). Diel variations in frequency of dividing cells and abundance of aerobic anoxygenic phototrophic bacteria in a coral reef system of the South China Sea. Aquat. Microb. Ecol. 58, 303–310. doi: 10.3354/ame01371
Liu, X., Hou, W., Dong, H., Wang, S., Jiang, H., Wu, G., et al. (2016). Distribution and diversity of Cyanobacteria and eukaryotic algae in Qinghai-Tibetan lakes. Geomicrobiol. J. 33, 860–869. doi: 10.1080/01490451.2015.1120368
Luuc, R. M., Olav, M. S., and Hans, U. (1999). “Cyanobacteria in the environment,” in Toxic Cyanobacteria in Water: A guide to Their Public Health Consequences, Monitoring and Management, ed. J. Bartram (London: E&FN Spon), 15–40.
Mašín, M., Zdun, A., Stoń-Egiert, J., Nausch, M., Labrenz, M., Moulisová, V., et al. (2006). Seasonal changes and diversity of aerobic anoxygenic phototrophs in the Baltic Sea. Aquat. Microb. Ecol. 45, 247–254. doi: 10.3354/ame045247
Michelou, V. K., Cottrell, M. T., and Kirchman, D. L. (2007). Light-stimulated bacterial production and amino acid assimilation by Cyanobacteria and other microbes in the North Atlantic ocean. Appl. Environ. Microbiol. 73, 5539–5546. doi: 10.1128/AEM.00212-07
Montecchia, M. S., Pucheu, N. L., Kerber, N. L., and García, A. F. (2006). Oxygen and light effects on the expression of the photosynthetic apparatus in Bradyrhizobium sp. C7T1 strain. Photosynth. Res. 90, 215–222. doi: 10.1007/s11120-007-9129-5
Nishimura, K., Shimada, H., Ohta, H., Masuda, T., Shioi, Y., and Takamiya, K. I. (1996). Expression of the puf Operon in an aerobic photosynthetic bacterium, Roseobacter denitrificans. Plant Cell Physiol. 37, 153–159. doi: 10.1093/oxfordjournals.pcp.a028926
Norbent, W., and Steffen, U. (2003). Phytoplankton trends in the Baltic Sea. ICES J. Mar. Sci. 60, 177–186. doi: 10.1016/S1054
Oksanen, A. J., Blanchet, F. G., Friendly, M., Kindt, R., Legendre, P., Mcglinn, D., et al. (2013). Package “vegan.” Community Ecol. Packag. Available online at: https://cran.r-project.org/web/packages/vegan/vegan.pdf (accessed November 28, 2020).
Paerl, H. W. (2012). “Marine plankton,” in Ecology of Cyanobacteria II: Their Diversity in Space and Time, ed. B. A. Whitton (Dordrecht: Springer), 127–153. doi: 10.1007/978-94-007-3855-3_5
Pajares, S., Varona-Cordero, F., and Hernández-Becerril, D. U. (2020). Spatial distribution patterns of bacterioplankton in the oxygen minimum zone of the tropical Mexican Pacific. Microb. Ecol. 80, 519–536. doi: 10.1007/s00248-020-01508-7
Peiffer, J. A., Spor, A., Koren, O., Jin, Z., Tringe, S. G., Dangl, J. L., et al. (2013). Diversity and heritability of the maize rhizosphere microbiome under field conditions. Proc. Natl. Acad. Sci. U.S.A. 110, 6548–6553. doi: 10.1073/pnas.1302837110
Quast, C., Pruesse, E., Yilmaz, P., Gerken, J., Schweer, T., Yarza, P., et al. (2013). The SILVA ribosomal RNA gene database project: improved data processing and web-based tools. Nucleic Acids Res. 41, 590–596. doi: 10.1093/nar/gks1219
R Core Team (2020). R: A Language and Environment for Statistical Computing. Vienna: R Foundation Statistical Computing.
Raven, J. A. (2009). Contributions of anoxygenic and oxygenic phototrophy and chemolithotrophy to carbon and oxygen fluxes in aquatic environments. Aquat. Microb. Ecol. 56, 177–192. doi: 10.3354/ame01315
Reusch, T. B. H., Dierking, J., Andersson, H. C., Bonsdorff, E., Carstensen, J., Casini, M., et al. (2018). The Baltic Sea as a time machine for the future coastal ocean. Sci. Adv. 4:eaar8195. doi: 10.1126/sciadv.aar8195
Rutgersson, A., Jaagus, J., Schenk, F., and Stendel, M. (2014). Observed changes and variability of atmospheric parameters in the Baltic Sea region during the last 200 years. Clim. Res. 61, 177–190. doi: 10.3354/cr01244
Sala, M. M., Aparicio, F. L., Balague, V., Boras, J. A., Borrull, E., Cardelus, C., et al. (2016). Contrasting effects of ocean acidification on the microbial food web under different trophic conditions. ICES J. Mar. Sci. 73, 670–679. doi: 10.1093/icesjms/fsv130
Salka, I., Moulisová, V., Koblížek, M., Jost, G., Jürgens, K., and Labrenz, M. (2008). Abundance, depth distribution, and composition of aerobic bacteriochlorophyll a-producing bacteria in four basins of the central Baltic Sea. Appl. Environ. Microbiol. 74, 4398–4404. doi: 10.1128/AEM.02447-07
Šantić, D., Šestanović, S., Vrdoljak, A., Šolić, M., Kušpilić, G., Ninčević Gladan, Ž, et al. (2017). Distribution of aerobic anoxygenic phototrophs in the Eastern Adriatic Sea. Mar. Environ. Res 130, 134–141. doi: 10.1016/j.marenvres.2017.07.012
Sato-Takabe, Y., Hamasaki, K., and Suzuki, S. (2019). High temperature accelerates growth of aerobic anoxygenic phototrophic bacteria in seawater. Microbiologyopen 8:e00710. doi: 10.1002/mbo3.710
Sharon, I., Tzahor, S., Williamson, S., Shmoish, M., Man-Aharonovich, D., Rusch, D. B., et al. (2007). Viral photosynthetic reaction center genes and transcripts in the marine environment. ISME J. 1, 492–501. doi: 10.1038/ismej.2007.67
Sieracki, M. E., Gilg, I. C., Thier, E. C., Poulton, N. J., and Goericke, R. (2006). Distribution of planktonic aerobic anoxygenic photoheterotrophic bacteria in the northwest Atlantic. Limnol. Oceanogr. 51, 38–46. doi: 10.4319/lo.2006.51.1.0038
Sieradzki, E. T., Fuhrman, J. A., Rivero-Calle, S., and Gómez-Consarnau, L. (2018). Proteorhodopsins dominate the expression of phototrophic mechanisms in seasonal and dynamic marine picoplankton communities. PeerJ 6:e5798. doi: 10.7717/peerj.5798
Soo, R. M., Skennerton, C. T., Sekiguchi, Y., Imelfort, M., Paech, S. J., Dennis, P. G., et al. (2014). An expanded genomic representation of the phylum yanobacteria. Genome Biol. Evol. 6, 1031–1045. doi: 10.1093/gbe/evu073
Soo, R. M., Woodcroft, B. J., Parks, D. H., Tyson, G. W., and Hugenholtz, P. (2015). Back from the dead; the curious tale of the predatory cyanobacterium Vampirovibrio chlorellavorus. PeerJ 2015:e968. doi: 10.7717/peerj.968
Stevens, H., and Ulloa, O. (2008). Bacterial diversity in the oxygen minimum zone of the eastern tropical South Pacific. Environ. Microbiol. 10, 1244–1259. doi: 10.1111/j.1462-2920.2007.01539.x
Stoń, J., Kosakowska, A., Łotocka, M., and Łysiak-Pastuszak, E. (2002). Pigment composition in relation to phytoplankton community structure and nutrient content in the Baltic Sea. Oceanologia 44, 419–437.
Takolander, A., Cabeza, M., and Leskinen, E. (2017). Climate change can cause complex responses in Baltic Sea macroalgae: a systematic review. J. Sea Res. 123, 16–29. doi: 10.1016/j.seares.2017.03.007
Thureborn, P., Lundin, D., Plathan, J., Poole, A. M., Sjöberg, B. M., and Sjöling, S. (2013). A metagenomics transect into the deepest point of the Baltic Sea reveals clear stratification of microbial functional capacities. PLoS One 8:e74983. doi: 10.1371/journal.pone.0074983
Tomasch, J., Gohl, R., Bunk, B., Suarez Diez, M., and Wagner-Dö Bler, I. (2011). Transcriptional response of the photoheterotrophic marine bacterium Dinoroseobacter shibae to changing light regimes subject category: microbial ecosystem impacts. ISME J. 5, 1957–1968. doi: 10.1038/ismej.2011.68
Tsementzi, D., Wu, J., Deutsch, S., Nath, S., Rodriguez-R, L. M., Burns, A. S., et al. (2016). SAR11 bacteria linked to ocean anoxia and nitrogen loss. Nature 536, 179–183. doi: 10.1038/nature19068
Vahtera, E., Conley, D. J., Gustafsson, B. G., Kuosa, H., Pitkänen, H., Savchuk, O. P., et al. (2007). Internal ecosystem feedbacks enhance nitrogen-fixing cyanobacteria blooms and complicate management in the Baltic Sea. Ambio 36, 186–194. doi: 10.1579/0044-7447(2007)36[186:iefenc]2.0.co;2
Van Cappellen, P., Ingall, E. D., Paytan, A., Mclaughlin, K., Ruttenberg, K. C., Berner, R. A., et al. (2008). Expanding oxygen-minimum zones in the tropical oceans. Science 320, 655–658. doi: 10.1126/science.1153847
Vila-Costa, M., Sharma, S., Moran, M. A., and Casamayor, E. O. (2013). Diel gene expression profiles of a phosphorus limited mountain lake using metatranscriptomics. Environ. Microbiol. 15, 1190–1203. doi: 10.1111/1462-2920.12033
Voget, S., Wemheuer, B., Brinkhoff, T., Vollmers, J., Dietrich, S., Giebel, H. A., et al. (2015). Adaptation of an abundant Roseobacter RCA organism to pelagic systems revealed by genomic and transcriptomic analyses. ISME J. 9, 371–384. doi: 10.1038/ISMEJ.2014.134
Wasmund, N., and Siegel, H. (2008). “Phytoplankton,” in State and Evolution of the Baltic Sea 1952-2005, eds R. Feistel, G. Nausch, and N. Wasmund (Hobokon, NJ: Wiley and Sons Inc), doi: 10.1002/9780470283134.ch15
Yurkov, V. V., and Beatty, J. T. (1998). Aerobic anoxygenic phototrophic bacteria. Microbiol. Mol. Biol. Rev. 62, 695–724. doi: 10.1128/mmbr.62.3.695-724.1998
Yutin, N., Béjà, O., Yutin, N., and Béjà, O. (2005). Putative novel photosynthetic reaction centre organizations in marine aerobic anoxygenic photosynthetic bacteria: insights from metagenomics and environmental genomics. Environ. Microbiol. 7, 2027–2033. doi: 10.1111/j.1462-2920.2005.00843.x
Yutin, N., Suzuki, M. T., Rosenberg, M., Rotem, D., Madigan, M. T., Süling, J., et al. (2009). BchY-based degenerate primers target all types of anoxygenic photosynthetic bacteria in a single PCR. Appl. Environ. Microbiol. 75, 7556–7559. doi: 10.1128/AEM.01014-09
Yutin, N., Suzuki, M. T., Teeling, H., Weber, M., Venter, J. C., Rusch, D. B., et al. (2007). Assessing diversity and biogeography of aerobic anoxygenic phototrophic bacteria in surface waters of the Atlantic and Pacific Oceans using the global ocean sampling expedition metagenomes. Environ. Microbiol. 9, 1464–1475. doi: 10.1111/j.1462-2920.2007.01265.x
Keywords: microbial plankton, oxygenic phototrophs, anoxygenic phototrophs, photosynthesis activity, pufM, psbA, oxygen minimum zones, environmental factors
Citation: Xu P, Reeder CF and Löscher CR (2022) Spatial Distribution, Diversity, and Activity of Microbial Phototrophs in the Baltic Sea. Front. Mar. Sci. 8:773210. doi: 10.3389/fmars.2021.773210
Received: 09 September 2021; Accepted: 14 December 2021;
Published: 06 January 2022.
Edited by:
Rebecca Metzler, Colgate University, United StatesReviewed by:
Kasia Piwosz, National Marine Fisheries Research Institute, PolandCopyright © 2022 Xu, Reeder and Löscher. This is an open-access article distributed under the terms of the Creative Commons Attribution License (CC BY). The use, distribution or reproduction in other forums is permitted, provided the original author(s) and the copyright owner(s) are credited and that the original publication in this journal is cited, in accordance with accepted academic practice. No use, distribution or reproduction is permitted which does not comply with these terms.
*Correspondence: Peihang Xu, cGVpaGFuZ0BiaW9sb2d5LnNkdS5kaw==
Disclaimer: All claims expressed in this article are solely those of the authors and do not necessarily represent those of their affiliated organizations, or those of the publisher, the editors and the reviewers. Any product that may be evaluated in this article or claim that may be made by its manufacturer is not guaranteed or endorsed by the publisher.
Research integrity at Frontiers

Learn more about the work of our research integrity team to safeguard the quality of each article we publish.