 Yosuke Yamada
 Hideki Fukuda
 Yu Umezawa
 Toshi Nagata
- 1Okinawa Institute of Science and Technology Graduate University, Onna, Japan
- 2Atmosphere and Ocean Research Institute, University of Tokyo, Chiba, Japan
- 3Tokyo University of Agriculture and Technology, Tokyo, Japan
Particle size distribution (PSD) in the ocean is a fundamental property that influences carbon export and food webs; however, PSD variation and its causes in oligotrophic oceans are not entirely clear. Here, we used Laser In-Situ Scattering and Transmissometry to investigate PSD (size range 5.2–119 μm) and related variables at 11 stations in the surface layer (0–20 m) of the Kuroshio region of the western North Pacific, where strong current causes dynamic hydrographic and ecological conditions. PSD slopes (range –3.2 to –4.2), derived from the power law model, were steeper at onshore stations and flatter at oligotrophic stations located offshore and at lower latitudes. Notably, slopes tended to become steeper with increasing chlorophyll a concentration, opposing the generally observed relationship between the two variables, whereas they became flatter with increasing transparent exopolymer particle (TEP) concentration. Possible explanations of the above results are localized occurrence of nanophytoplankton and TEP facilitation of particle aggregation. The results support the hypothesis that PSD slopes are controlled by a multitude of factors, including phytoplankton community dynamics and aggregation processes. To determine whether TEP-induced particle aggregation enhances or suppresses carbon export, we need a better understanding of the nature (porosity, density, and sinking velocity) of aggregates in oligotrophic oceans.
Introduction
Particle size distribution (PSD) in the ocean is a fundamental property that influences oceanic carbon export mediated by sinking particles (biological carbon pump; Guidi et al., 2008; Cael and White, 2020; Maerz et al., 2020; Omand et al., 2020), which in turn affects the oceanic uptake of atmospheric CO2 and the earth’s climate (Kwon et al., 2009). Also PSD is an important determinant of oceanic food webs because physiological traits and trophic interactions of planktonic organisms are strongly constrained by relationships with cell size (Ward et al., 2012). Understanding PSD variation is essential for a better understanding of ocean biogeochemical cycles and food webs; yet its causes and controls are not well understood. This knowledge gap represents a major obstacle to improving ocean biogeochemical models with explicit representation of particle properties (Burd and Jackson, 2009; Maerz et al., 2020; Omand et al., 2020).
Among several techniques for determining PSD (Lombard et al., 2019; Giering et al., 2020), a laser diffraction analyzer measuring light scattered by particles (Laser In-Situ Scattering and Transmissometry; LISST) has been increasingly used to examine PSD in the upper oceans (Reynolds et al., 2010; Barone et al., 2015; Yamada et al., 2015; Leroux et al., 2018). The size range of particles determined by LISST is typically 3–200 μm. Because linear dimensions of the major phytoplankton groups (e.g., diatoms, coccoliths, haptophytes, and dinoflagellates), except for picocyanobacteria and picoeukaryotes, are within this size range, PSD determined by LISST provides information concerning phytoplankton size composition (Barone et al., 2015; White et al., 2015), although the particles detected by LISST also contain detrital particles and aggregates (Leroux et al., 2018).
Power law exponent (PSD slope) is a useful representation of the PSD (the steeper the slope, the higher the contribution of smaller particles) (Kostadinov et al., 2012; White et al., 2015). PSD slopes often become flatter with increasing chlorophyll a (Chl.a) concentration (Buonassissi and Dierssen, 2010; Xi et al., 2014), consistent with a general shift in phytoplankton communities from predominantly smaller to larger cells along a gradient of increasing biomass and productivity (Malone, 1971; Chisholm, 1992). However, in the western Arctic Ocean, Yamada et al. (2015) obtained apparently contradictory results. They found that PSD slopes in a productive shelf region were steeper than those in an oligotrophic basin area. They hypothesized that PSD slopes became flatter due to particle aggregation during lateral transport of particles. They also suggested that the aggregation process was promoted by transparent exopolymer particles (TEP; Alldredge et al., 1993; Passow, 2002), which are sticky and enhance particle aggregation (Engel, 2000; Jennings et al., 2017; Mari et al., 2017). These results suggest that PSD slopes may be influenced by multiple factors, including phytoplankton size composition and aggregation processes; however, factors controlling PSD slope in oceanic environments remain to be clarified.
We collected PSD data using LISST in the upper water column (<20 m) along the western boundary current of the North Pacific (Kuroshio), covering a latitudinal range from 22° to 34° North. The Kuroshio region is generally characterized by a warm, oligotrophic conditions, with phytoplankton communities generally dominated by pico- and nanophytoplankton (Endo and Suzuki, 2019) similar to the station ALOHA in the North Pacific subtropical gyre (White et al., 2015). However, along strong northward flows of the Kuroshio current, nutrient inputs to the euphotic zone are enhanced due to boundary exchange and diapycnal mixing (Nagai et al., 2019; Pelegrí et al., 2019), which leads to an increase in phytoplankton biomass and a shift in cell size composition toward larger phytoplankton, depending on season and location (Kobari et al., 2019; Nagai et al., 2019). Furthermore, since the Kuroshio current passes ridges with many small islands and seamounts, surface nutrification caused by a topographic flow disturbance (Island Mass Effect) appears to contribute to enhancing productivity in the region (Hasegawa, 2019; Nagai et al., 2021). Despite dynamic and unique hydrographic and ecological features of the Kuroshio region, which are distinct from those of the central North Pacific Subtropical Gyre, data are limited regarding export flux in the region (Oguri et al., 2003; Hung and Gong, 2007; Qu et al., 2018). To our knowledge, no studies have examined PSD slopes in the Kuroshio region. In order to gain insights into processes involved in regulation of particle dynamics in the Kuroshio region, we examined spatial variability of PSD slopes using LISST. We hypothesized that PSD slopes are influenced by multiple environmental factors, including concentrations of Chl.a, prokaryotic abundance, and exopolymer substances such as TEP and Coomassie stained particles (CSP).
Materials and Methods
Study Area
This study was carried out during the R/V Hakuho Maru KH-15-4 cruise in November 2015, as part of the project “The Study of Kuroshio Ecosystem Dynamics for Sustainable Fisheries: SKED” aimed at examining physical, chemical, and ecological characteristics of the Kuroshio region (Saito, 2013). Seawater sampling was conducted along three transect lines (150–185 km), each of which consisted of 3–4 sampling stations positioned across the Kuroshio axis (Figure 1 and Table 1). The axis of the current may shift over a wide distance (on the order of 100 km), toward onshore or offshore within weeks (Yamashiro and Kawabe, 1996). Therefore, the most recent current information [Quick Bulletin of Ocean Conditions (QBOC) of the Japan Coast Guard)] at the time of the cruise was used to determine geographic positions of sampling stations. In total, 11 stations were sampled from the three transect lines, which hereafter, are regarded to represent the upstream (U-line), midstream (M-line), and downstream (D-line) of the flow path (Figure 1 and Table 1).
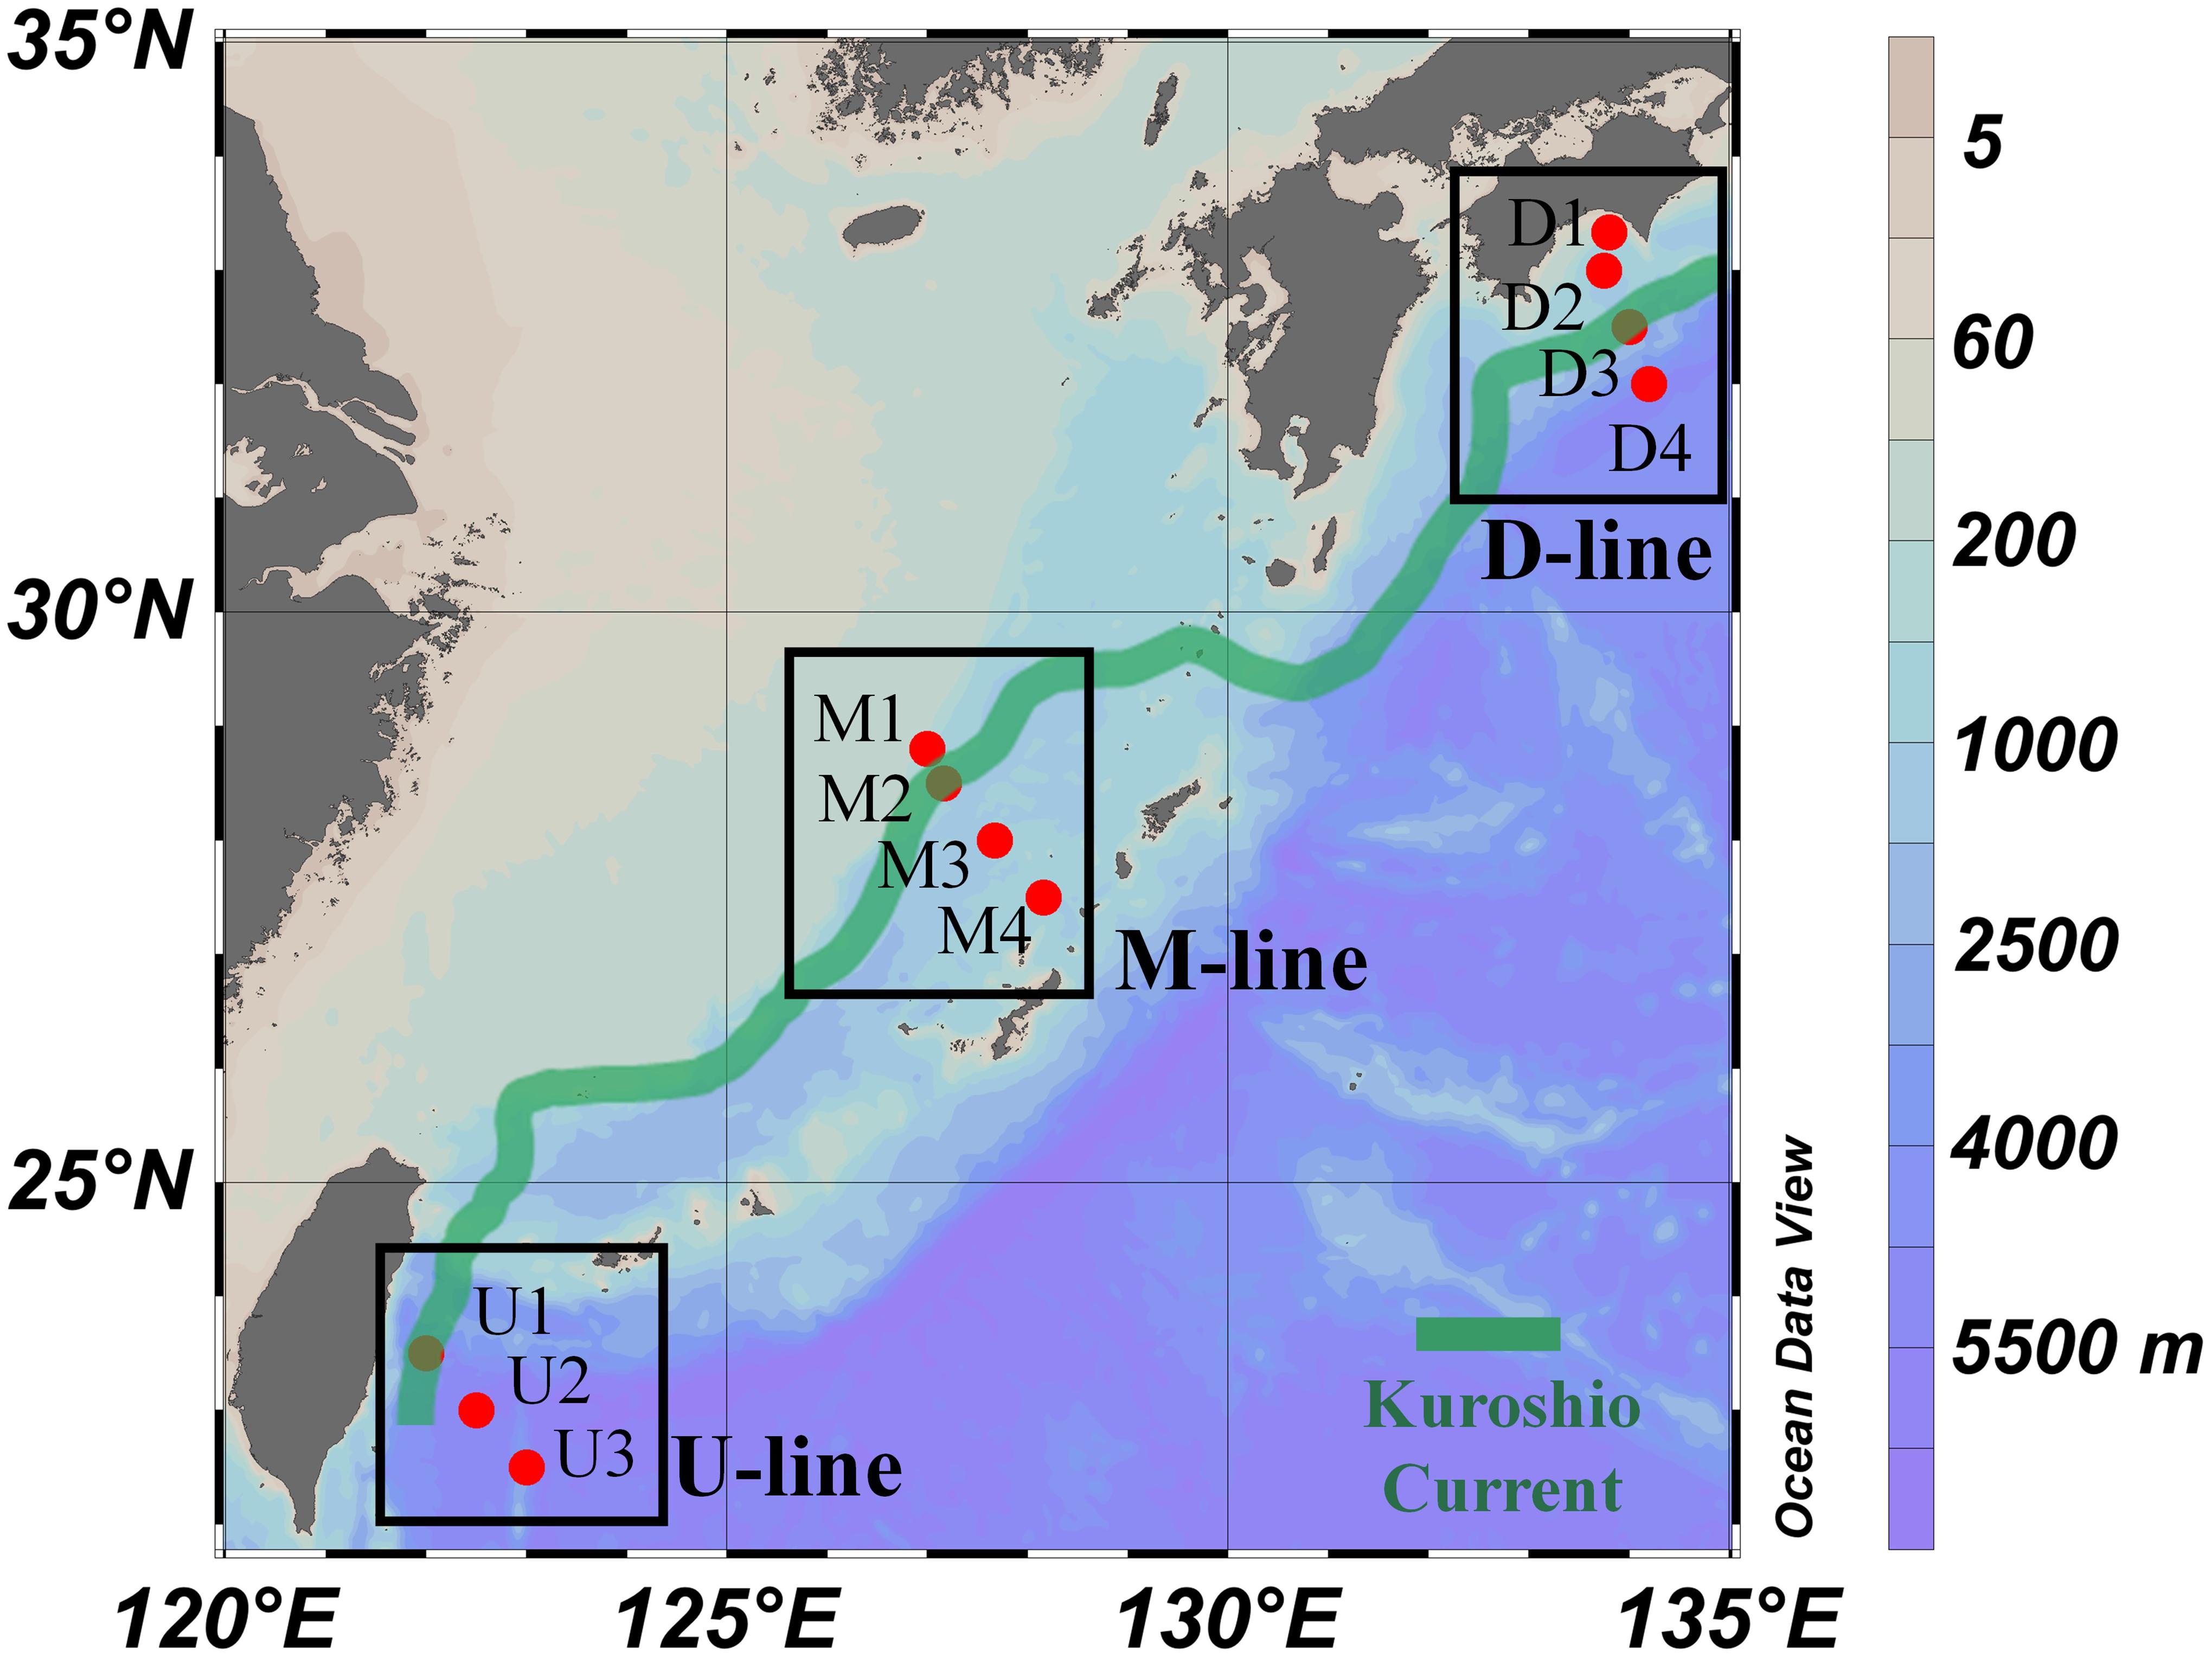
Figure 1. Locations of sampling stations during the KH-15-4 cruise. The map and contour graphs were created using Ocean Data View (http://odv.awi.de/). Detailed information for each station is given in Table 1. The location of the Kuroshio Current during the cruise was obtained from the Japan Coast Guard (see text) and is shown as a green line. Transect lines are also shown in black boxes.
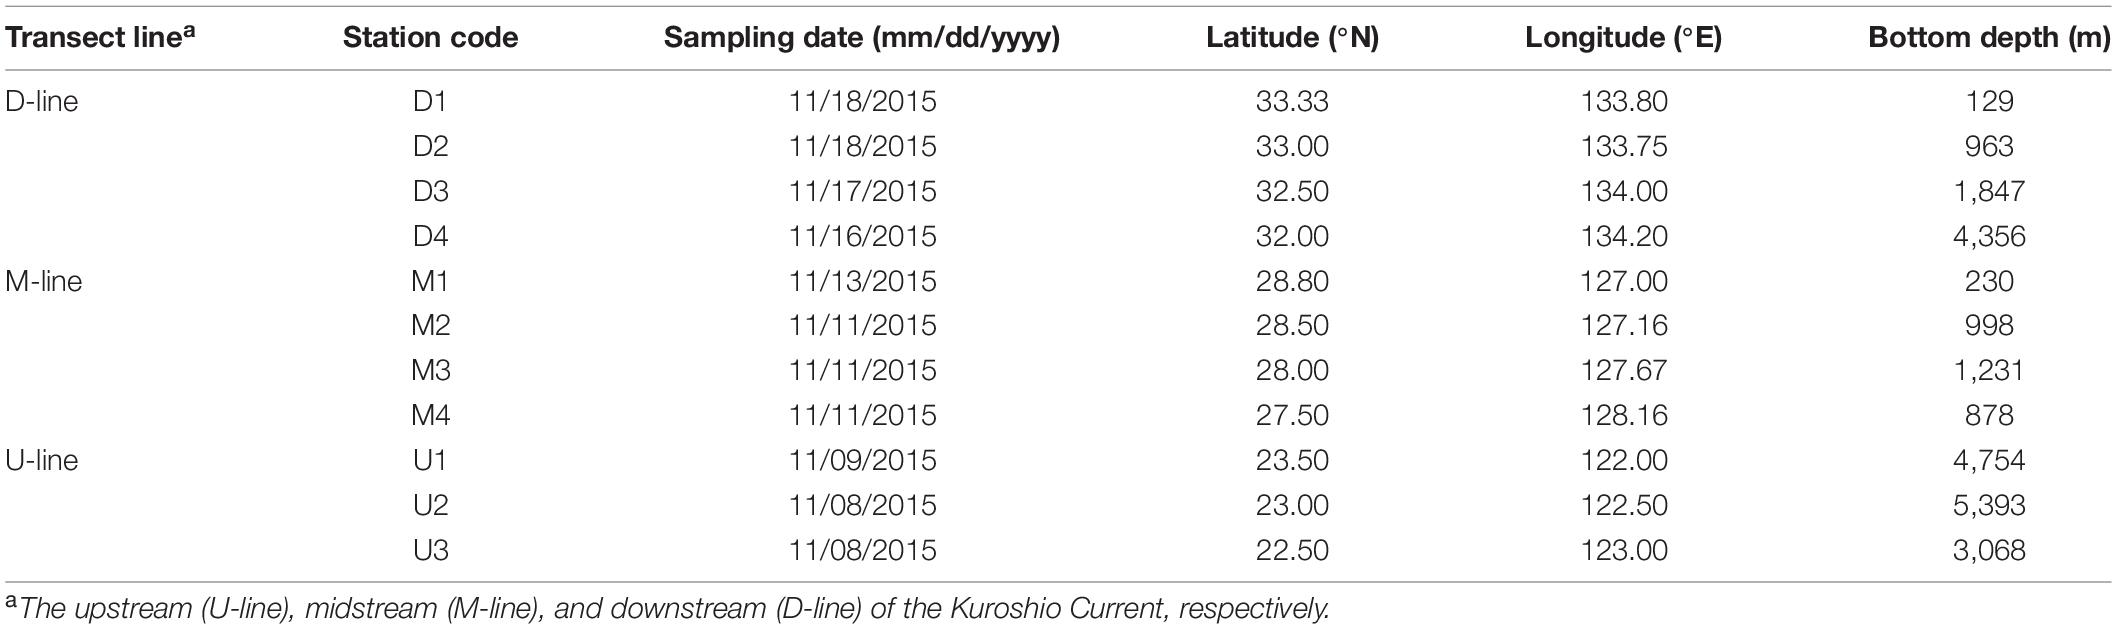
Table 1. Locations of sampling stations deployed during the KH-15-4 cruises.
Particle Volume, Abundance, and Particle Size Distribution Slope Calculations
Particle volume and PSD in seawater from the surface (0 m) to a depth of 20 m were measured using LISST (100X, Sequoia Scientific, Bellevue, WA, United States), following Agrawal and Pottsmith (2000). LISST is a laser diffraction analyzer used to measure light scattered by particles on 32 concentric, logarithmically spaced ring detectors. The volumetric particle concentration in each size class is estimated from inversion modeling based on the Mie theory (Agrawal and Pottsmith, 2000). The LISST instrument may overestimate particle volume in the upper LISST bins when salinity fluctuations occur in a stratified field (Styles, 2006) and may underestimate the lower LISST bins in environments with low particulate concentrations or high ambient light conditions (Andrews et al., 2011). To minimize these effects, we used a size class range of 5.2–119 μm (20 LISST bins). The LISST instrument was mounted on a winch wire and lowered slowly through the water column, at a mean winch speed of 0.15 m s–1 and with a 1 s data collection interval. A depth profiler (ACTD-CMP, JFE Advantech Co. Ltd., Hyogo, Japan) was attached to the protection frame of the LISST instrument.
Total particle volume (μL L–1) was calculated as an integral of the whole size window (5.2–119 μm). Volumetric size distribution data were used to calculate PSD (in abundance), assuming that particles are spheres. Then PSD was formulated by the following power-law equation (Bader, 1970; Kostadinov et al., 2009; Buonassissi and Dierssen, 2010):
Where N(D) is the number of particles per volume of seawater normalized by the size bin width (particles L–1 μm–1). D is the particle diameter (μm). D0 is a reference diameter, here 1 μm. N0 is the particle differential number concentration at D0 (particles L–1 μm–1), and ξ is the power-law slope of the PSD. We used a linear regression on log transformed data.
Seawater Sampling and Determination of Environmental Variables
Seawater samples were collected using clean 12-L Niskin bottles (Model 1010X; General Oceanics) mounted on a conductivity-temperature-depth, carousel, multi-sampling system (CTD/CMS) (SBE11Plus; Sea-Bird Electronics). Surface seawater (0 m) was collected using a clean bucket.
Nutrient concentrations [NO3–, NO2–, NH4+, PO43–, and Si(OH)4] were determined at an onshore laboratory by colorimetry (QuAAtro; BLTEC, Japan) using seawater samples stored frozen. For the Si(OH)4 measurement, after defrosting, samples were stirred and stored in the dark at 4°C for 24 h before measurement. Detection limits for these analyses were about 0.02 μM. In addition, we measured PO43– and NO3– + NO2– on board, using a highly sensitive method, at selected stations where nutrient concentrations were expected to be below the detection limit of the regular colorimetric method. We used a high sensitivity colorimetric system consisting of an autoanalyzer (AutoAnalyzer II, Technicon, United States), capillary cells (quid Waveguide Capillary Cells; 50 and 100-cm lengths for NO3– and NO2– and PO43–, respectively; World Precision Instruments, United States), and a spectrometer (USB4000, Ocean Optics, United States) (Hashihama et al., 2010). For these measurements, samples were stored at 4°C until analysis and measured on board within 3 h after sample collection. The detection limit was 0.002 μM. Dissolved inorganic nitrogen (DIN) was defined as the sum of NO3–, NO2–, and NH4+ concentrations. Concentrations below the detection limit were considered to be 0 μM.
Concentrations of two types of exopolymer particles, TEP (containing acidic polysaccharides) and CSP (containing proteins), were determined according to Passow and Alldredge (1995) for TEP and Cisternas-Novoa et al. (2014) for CSP. Surface and 10-m seawater samples (300 mL; duplicates for each depth) were filtered through 0.4-μm pore size polycarbonate filters (47 mm diameter; Whatman, Maidstone, United Kingdom) with a vacuum of less than 150 mmHg. TEP were stained with 1 mL of 0.02% w/v of a cationic dye, Alcian blue (8GX; Sigma-Aldrich), dissolved in 0.06% v/v acetic acid. CSP were stained with 1 mL of 0.04% Coomassie Brilliant Blue (G-250, SERVA electrophoresis), dissolved in 0.2-μm prefiltered seawater. Excess dyes were washed with Milli-Q water. Filters were frozen at −20°C prior to colorimetric determination in the onshore laboratory. For TEP measurements, filters were soaked in 6 mL of 80% sulfuric acid for 2 h, and the absorbance at 787 nm was measured using a spectrophotometer (UV-1800; Shimadzu, Kyoto, Japan). For measurement of filter blanks, 300 mL surface seawater samples were passed through a 0.2-μm prefilter before use. The absorbance of the blank value was on average 0.019 ± 0.004 (mean ± SD, n = 9) (a blank measurement was made at three selected stations of U1, M4, and D2). The mean absorbance of samples was at least three times higher than the blank value. For CSP measurements, filters were soaked in 4 mL of 50% isopropyl alcohol with 3% SDS. Tubes were sonicated in a water bath (50–60 kHz) for 2 h at 37°C and absorbance was measured at 615 nm using a spectrophotometer (UV-1800; Shimadzu). Blanks were treated in the same way as for TEP determination. The absorbance of the blank was on average 0.040 ± 0.009 (mean ± SD, n = 6) (a blank measurement was made at three selected stations of U1, M4, and D2). The mean absorbance of samples was at least 1.2 (generally > 2) times higher than the blank value.
To calculate TEP and CSP concentrations, the mean filter blank value was first subtracted from the absorbance for each sample. Then these concentrations were calculated using the calibration factor determined with xanthan gum (for TEP) or bovine serum albumin (BSA, for CSP). TEP and CSP concentrations were expressed in terms of μg xanthan gum equivalent per liter (μg Xeq. L–1) and μg BSA equivalent per liter (μg BSAeq. L–1), respectively.
Chlorophyll a concentrations were determined by fluorometry (model 10-AU; Turner Designs, Sunnyvale, CA, United States) after extraction of Chl.a with N,N-dimethylformamide from samples collected on glass fiber filters (GF/F, 25 mm, Whatman).
To determine prokaryote abundance, a 2 mL seawater sample was collected in a sterile cryogenic vial (Nalgene, MA, United States) and fixed by adding 100 μL of 20% glutaraldehyde (final concentration 1%). The fixed sample was frozen in liquid nitrogen and then stored in a freezer (−80°C) until analysis in the onshore laboratory. Following Yang et al. (2010), samples were stained with SYBR Green I (final concentration of 10–4 of commercial stock; Invitrogen, CA, United States). After addition of size reference beads (1 μm diameter; Molecular Probes, OR, United States), samples were analyzed using a flow cytometer (FACSVerse; Becton Dickinson, NJ, United States) equipped with a 15-mW, 488-nm, air-cooled laser and a standard filter set. Data were analyzed using FACSuite software (Becton Dickinson).
Data Averaging for the Depth Layer Between 0 and 20 m
Depth resolution differed depending on variables. To facilitate the comparison of PSD slope with other variables in the upper water column, we calculated the mean value of each variable over the depth layer between 0 and 20 m (Supplementary Table 1). PSD data (particle volume and abundance) were first obtained with a depth interval of 1 m, averaged for a depth range from 0 to 20 m, and then used for the calculations of particle volume and abundance for each station. For the calculation of PSD slope, all data obtained with a depth interval of 1 m were pooled for each station and then used for the calculation of the slope. This pooling procedure was used because, with a 1-m interval data acquisition, the particle signal was often undetectable in larger size bins (>50 μm). To make the size range of particles used for the PSD slope calculation consistent among stations (i.e., 5.2–119 μm), we pooled LISST data for the depth of 0–20 m. Temperature and salinity data determined with the CTD logger were first binned to 1 m, and then mean values from surface to a depth of 20 m were calculated. Seawater samples for determining concentrations of nutrients, TEP, CSP, and Chl.a as well as prokaryote abundance were sampled at 1–4 depths within 0–20 m (Supplementary Table 1).
Statistical Analysis
Spearman rank order correlation analysis among variables (because the normality assumption was not fulfilled for some variables) and linear regression analysis were performed using SigmaPlot 13.0 (Systat Software, Inc., San Jose, CA, United States).
Results
Data on PSD parameters (volume, abundance, and slope) and environmental variables were collected in the upper water column (0–20 m) at 11 stations (Table 1). Because depth resolution differed among PSD and environmental variables (Supplementary Table 1), depth-averaged values of these variables (except for the PSD slope which was calculated by pooling the data, see “Materials and Methods”) were calculated for each station and used to examine geographic variation of these variables and relationships among them. Although temperature and salinity varied little within the layer (0–20 m), other variables displayed vertical heterogeneities of variable extent (as indicated by mean and standard deviation in Table 2). Although this may introduce biases to the analysis of relationships among variables, we assumed that depth-averaged data capture major features characterizing geographic variation of PSD and environmental variables in the study region.

Table 2. Mean values of each variable in the depth of 0–20 ma.
Temperature and Salinity
Surface seawater temperature generally decreased from south to north with the maximum temperature (28.0°C) recorded at station U3 and the minimum (23.7°C) at station D1 (Figure 2A and Table 2). Salinity at stations located along the offshore transect of the current axis was 0.1–0.4 higher (34.8 at U3, M2, M3, M4, D3, and D4 except for U2; Figure 2B and Table 2) than stations located along the onshore transect of the current axis (34.4–34.7 at U1, M1, D1, and D2). The salinity was similarly low at stations located on the current axis (U1) and offshore (U2) (Figure 2B and Table 2).
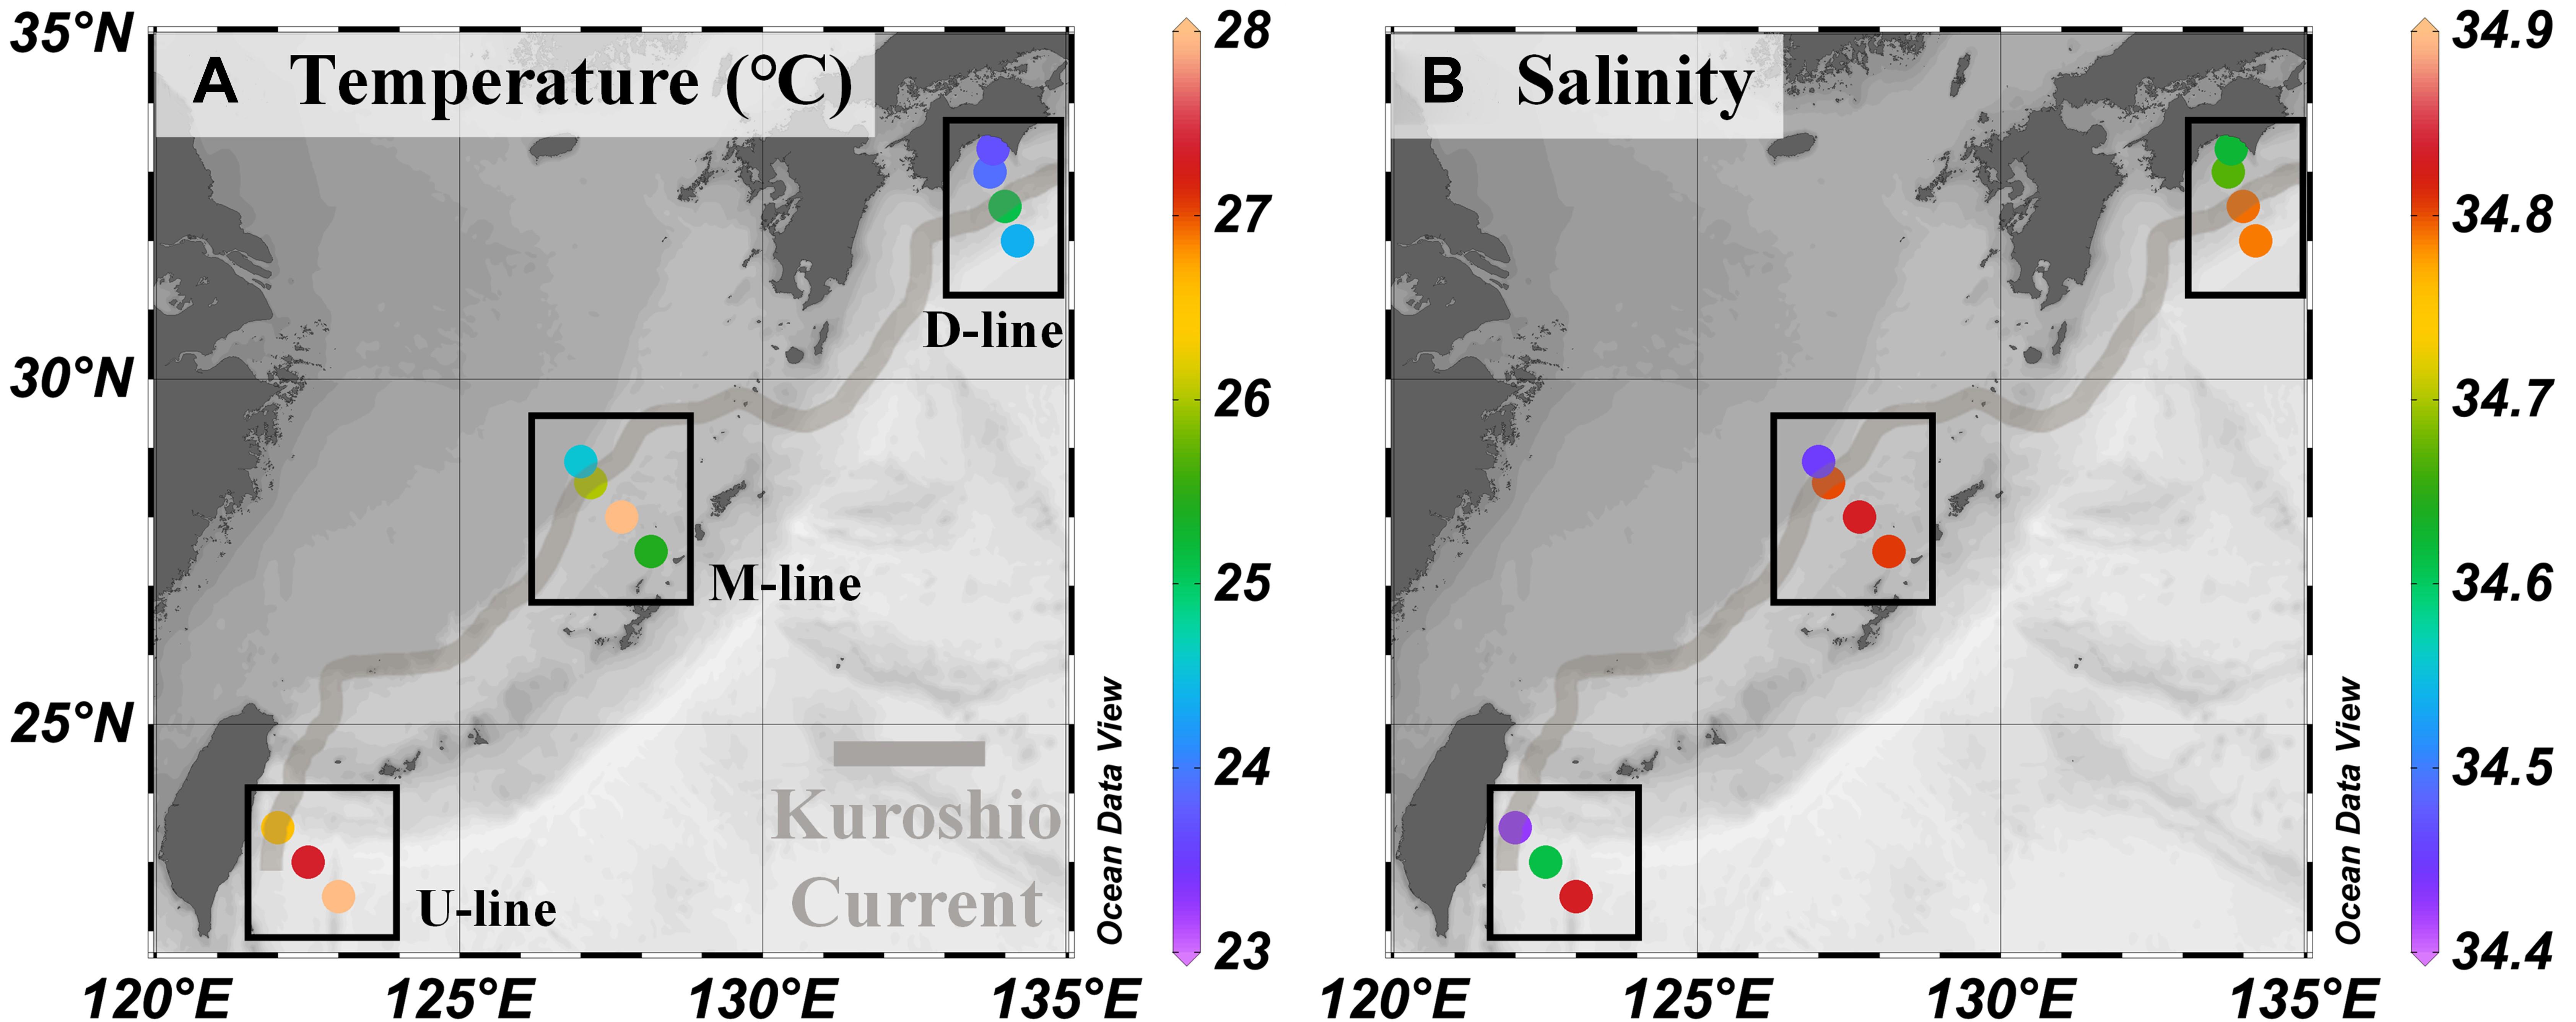
Figure 2. Environmental variables in the Kuroshio region observed during the KH-15-4 cruise. (A) Temperature, (B) Salinity. The location of the Kuroshio Current during the cruise and transect lines are shown as in Figure 1. Values for each parameter are shown in Table 2.
Nutrient, Chlorophyll a Concentrations, and Prokaryote Abundance
Concentrations of DIN, PO43–, and Si(OH)4 varied in the range of <0.02–0.28, <0.002–0.040, and 0.66–1.65 μM, respectively, with relatively high concentrations at three onshore stations of the D- and M-lines (D1, D2, and M1, Figures 3A–C and Table 2). Nanomolar-level determination of PO43– revealed that offshore stations were depleted in phosphorus with concentration ranges from <0.002 to 0.010 μM (Figure 3B and Table 2). Nutrient concentration was negatively correlated with temperature (Table 3). Chlorophyll a concentrations varied in the range of 0.06 and 0.89 μg L–1, with a tendency to increase with increasing latitude (Figure 3D and Table 2). Similar to nutrient distribution, the highest levels of Chl.a (0.82–0.89 μg L–1) were found at three onshore stations on the D- and M-lines (D1, D2, and M1). The most southerly stations on the U-line (U1, U2, and U3) are oligotrophic, characterized by low Chl.a (≦0.1 μg L–1) and low nutrient (DIN and PO43–) concentrations (Table 2). Prokaryote abundance (range 6.1 × 10⁸–12.0 × 10⁸ cells L–1) generally followed that of Chl.a concentration (Figure 3E and Table 2).
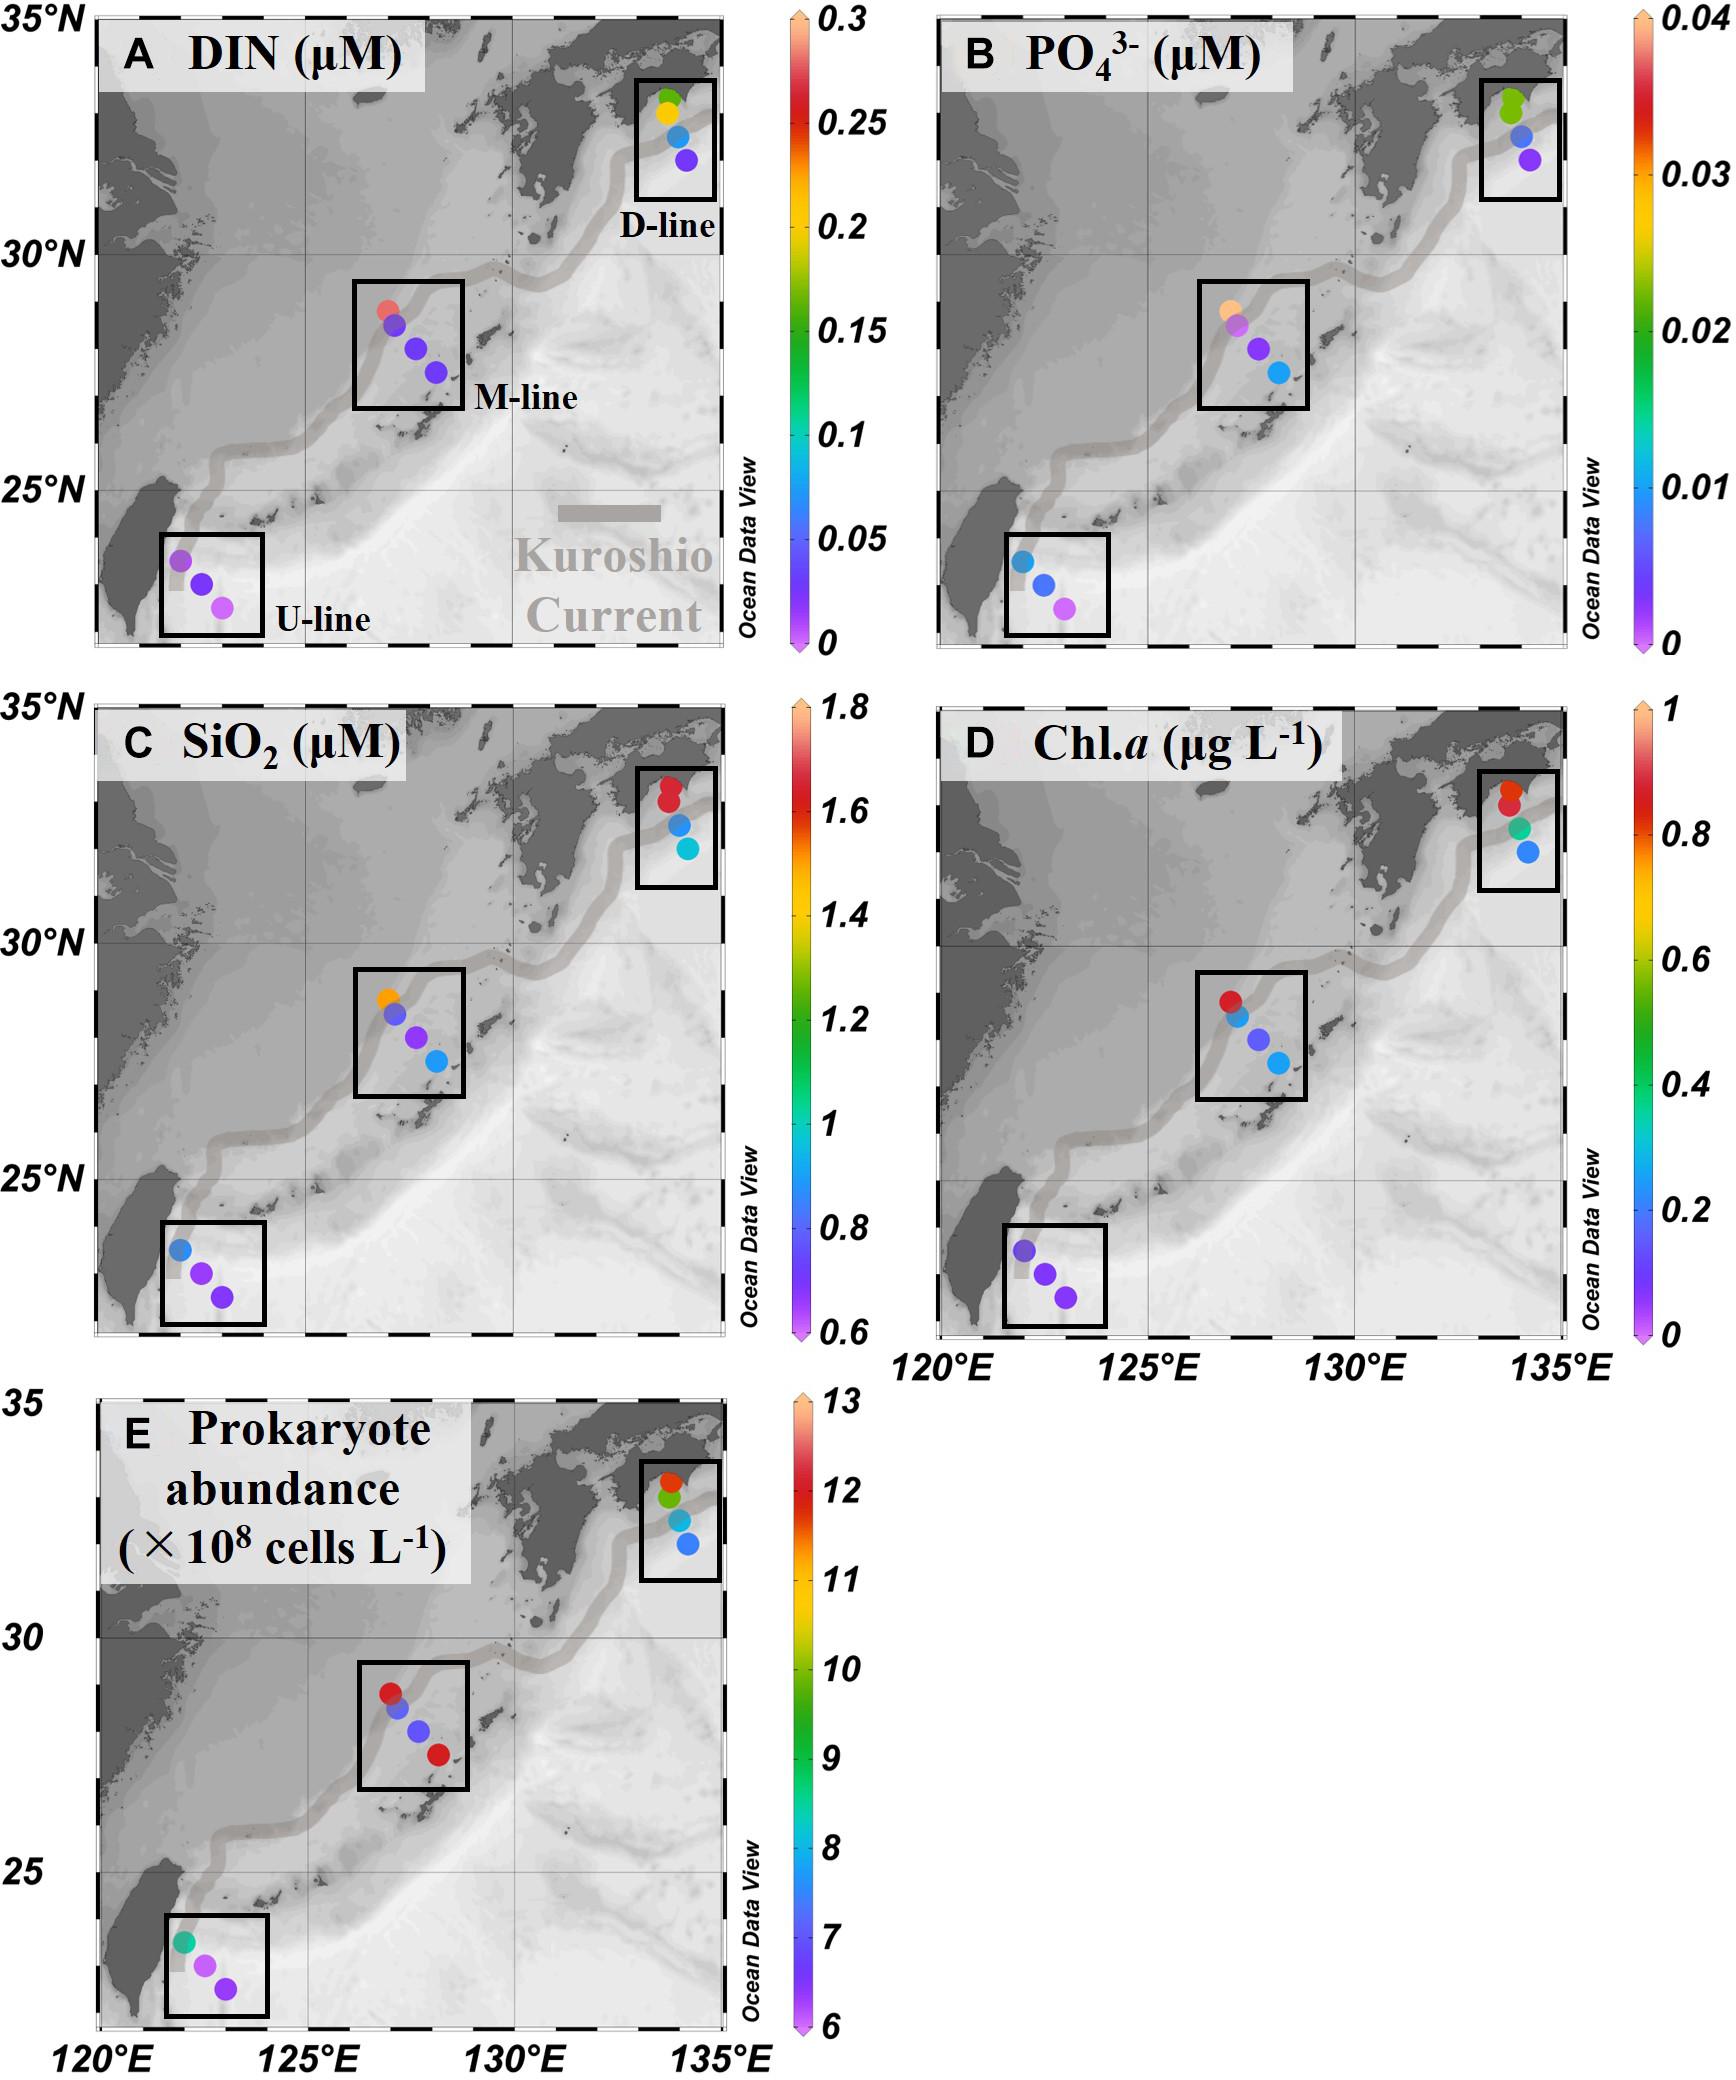
Figure 3. Chemical and biological variables in the Kuroshio region observed during the KH-15-4 cruise. (A–C) Nutrient [DIN: dissolved inorganic nitrogen, PO43– and Si(OH)4] concentrations, (D) chlorophyll a (Chl.a) concentration, (E) prokaryote abundance. Data are shown as in Figure 2 and values are also shown in Table 2.
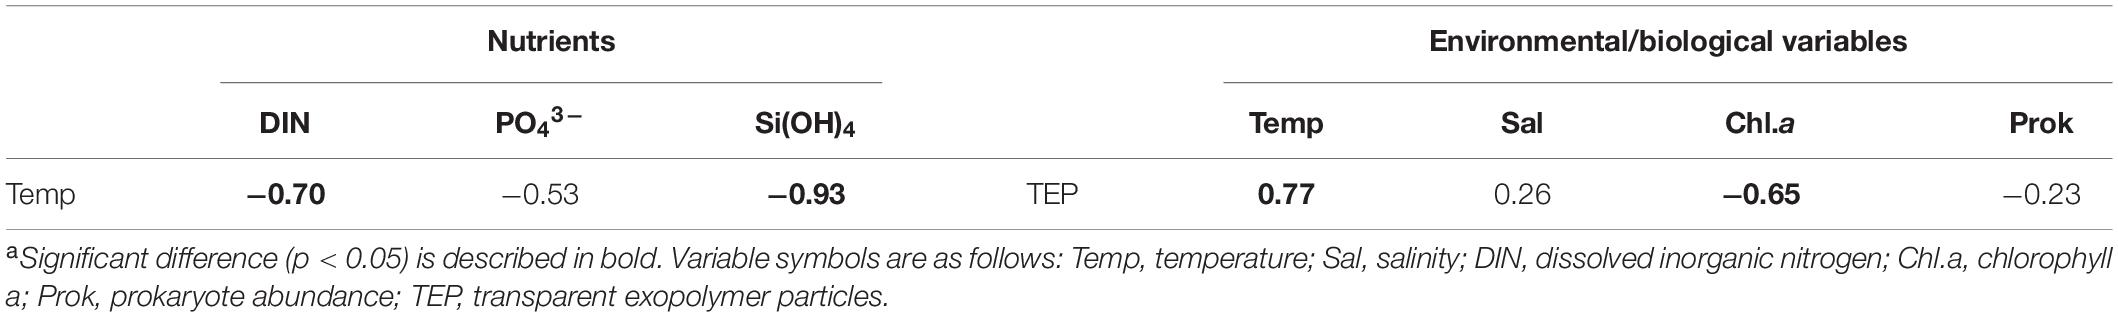
Table 3. Spearman rank order correlations (r) between temperature and nutrients, transparent exopolymer particles, and environmental/biological variablesa.
Transparent Exopolymer Particle and Coomassie Stained Particles
Transparent exopolymer particle concentrations (range 26–66 μg Xeq. L–1) displayed a latitudinal gradient, with the highest concentrations at stations on the U-line, followed by stations on the M- and D lines (Figure 4A and Table 2). The difference in TEP concentrations between onshore and offshore stations was less pronounced (Table 2). TEP concentration was significantly positively correlated with temperature (Table 3), and negatively with Chl.a concentration (Table 3). Correlations between TEP concentration and salinity and prokaryote abundance were insignificant (Table 3). Spearman rank order correlations for all variables are shown in Supplementary Table 2. The CSP distribution was complex (range 1.2–9.2 μg BSAeq. L–1), with no clear geographic pattern across latitude and locations relative to the Kuroshio axis (Figure 4B and Table 2).
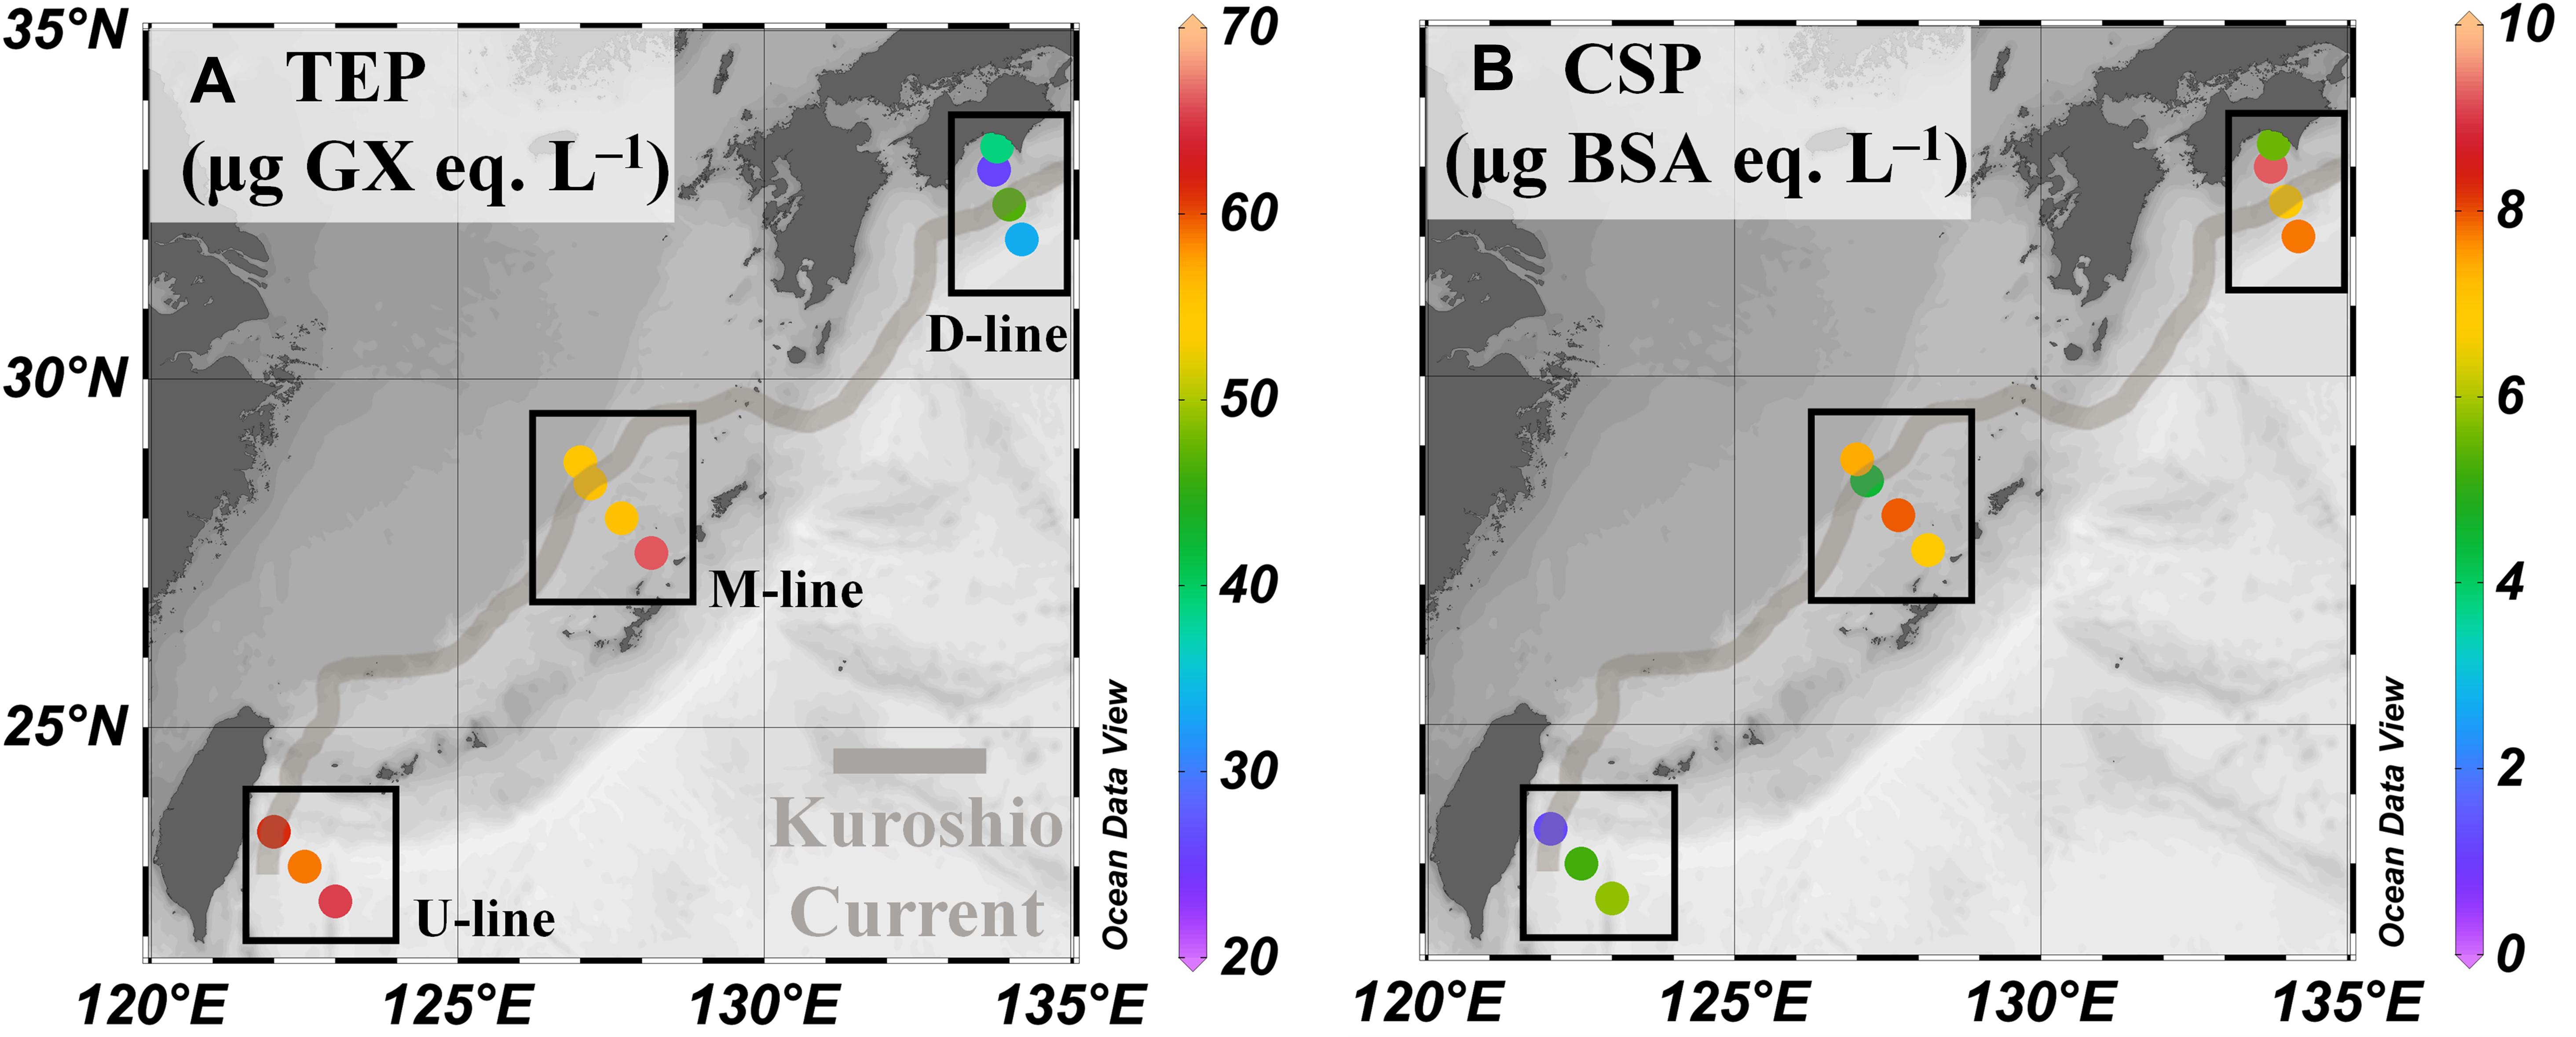
Figure 4. Exopolymeric particle variables in the Kuroshio region observed during the KH-15-4 cruise. (A,B) Concentrations of transparent exopolymer particles (TEP), and Coomassie stained particles (CSP), respectively. Data are shown as in Figure 2 and values are shown in Table 2.
Particle Volume, Abundance, and the Particle Size Distribution Slope
Particle volume (range 0.04–0.83 μL L–1) and abundance (0.1 × 10⁵–5.9 × 10⁵ particles L–1) increased from south (U-line) to north (D-line), whereas variability across the Kuroshio axis was less pronounced (Figures 5A,B and Table 2). The PSD slope was derived as the slope of the linear regression relating log N(D) against log D/D0 (Eq. 1). Data fitted the model well, with the determination coefficient, r2, between 0.90 and 1.00 and p value < 0.001 (Figure 6 and Table 4). The PSD slope (range –3.2 to –4.2) tended to become steeper from south to north, although the steepest slopes (–4.1 to –4.2) occurred at on-shore stations on the D- and M-lines (D1, D2, and M1) (Figure 5C and Table 2). The PSD slope was positively correlated with temperature and TEP (Figures 7A,B), whereas it was negatively correlated with Chl.a, particle abundance (Figures 7C,D) and nutrients (Supplementary Figures 1A–C). The PSD slope was not significantly correlated with either prokaryote abundance or CSP (Supplementary Figures 2A,B).
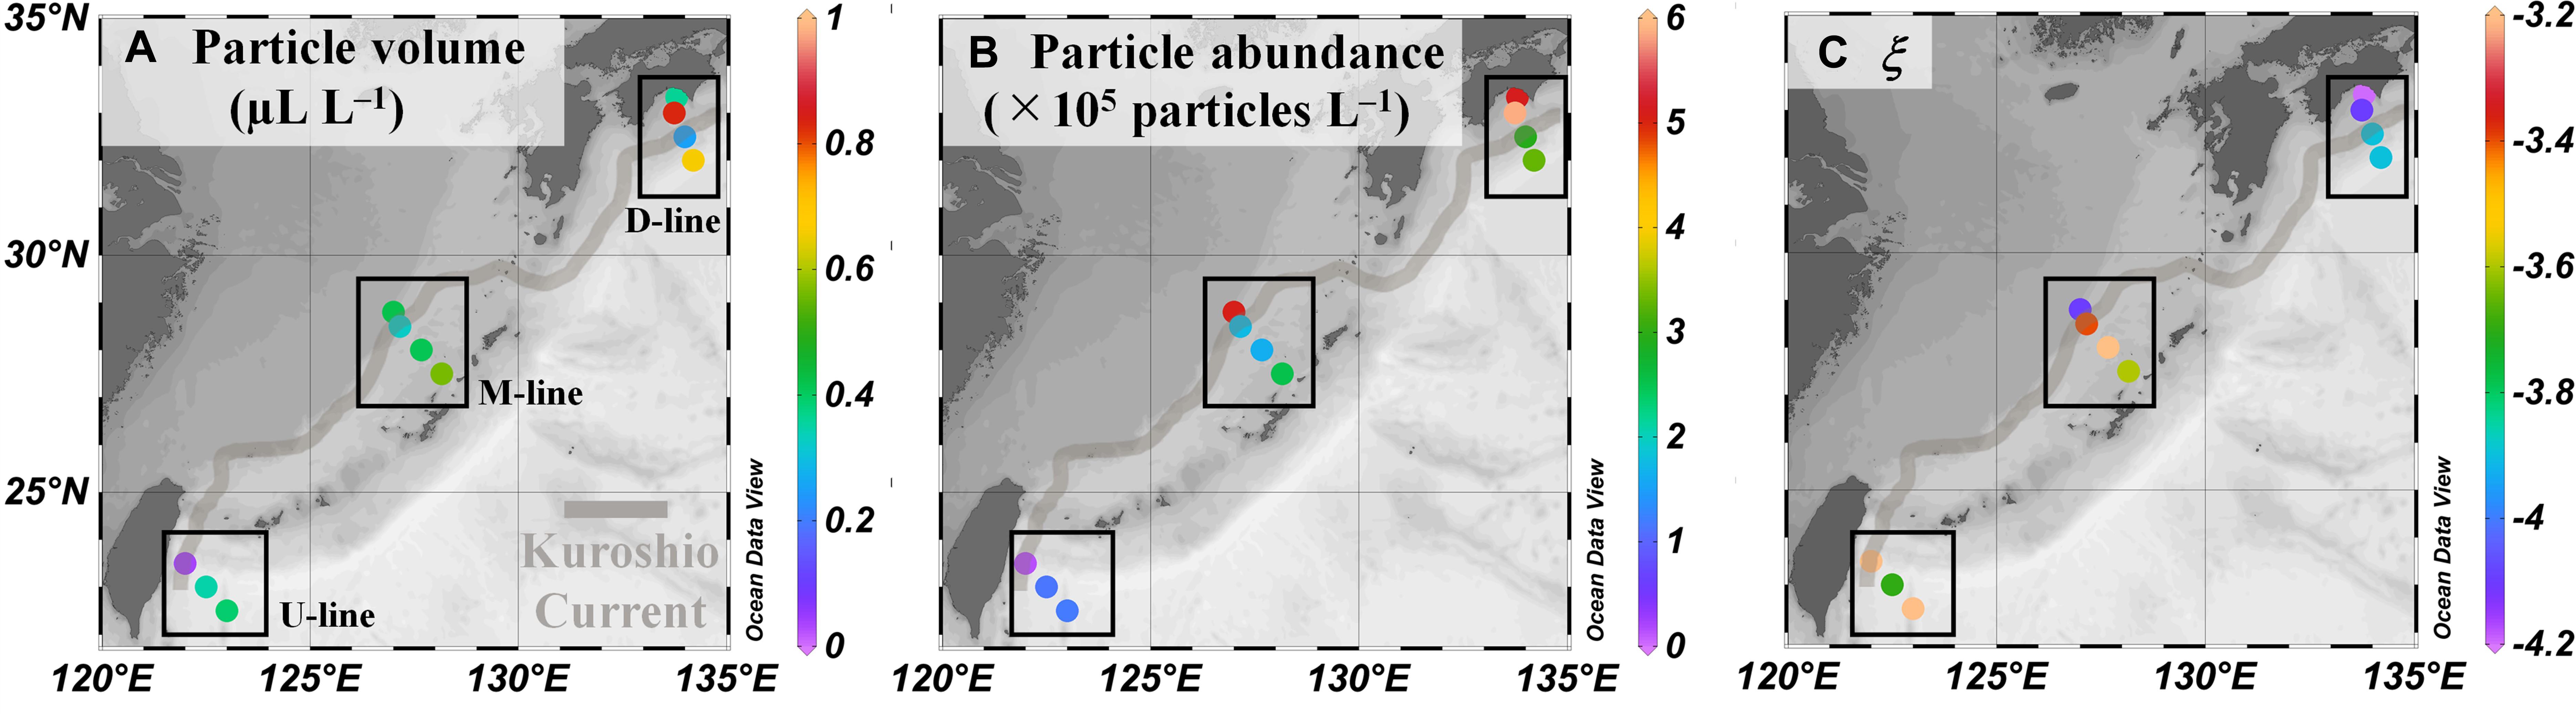
Figure 5. Particle parameters in the Kuroshio region observed by Laser In-Situ Scattering and Transmissometry (LISST) during the KH-15-4 cruise. (A–C) Total particle volumes, abundance, and the slope of the particle size distribution slope (ξ) in the size range of 5.2–119 μm, respectively. Data are shown as in Figure 2 and values are shown in Table 2.
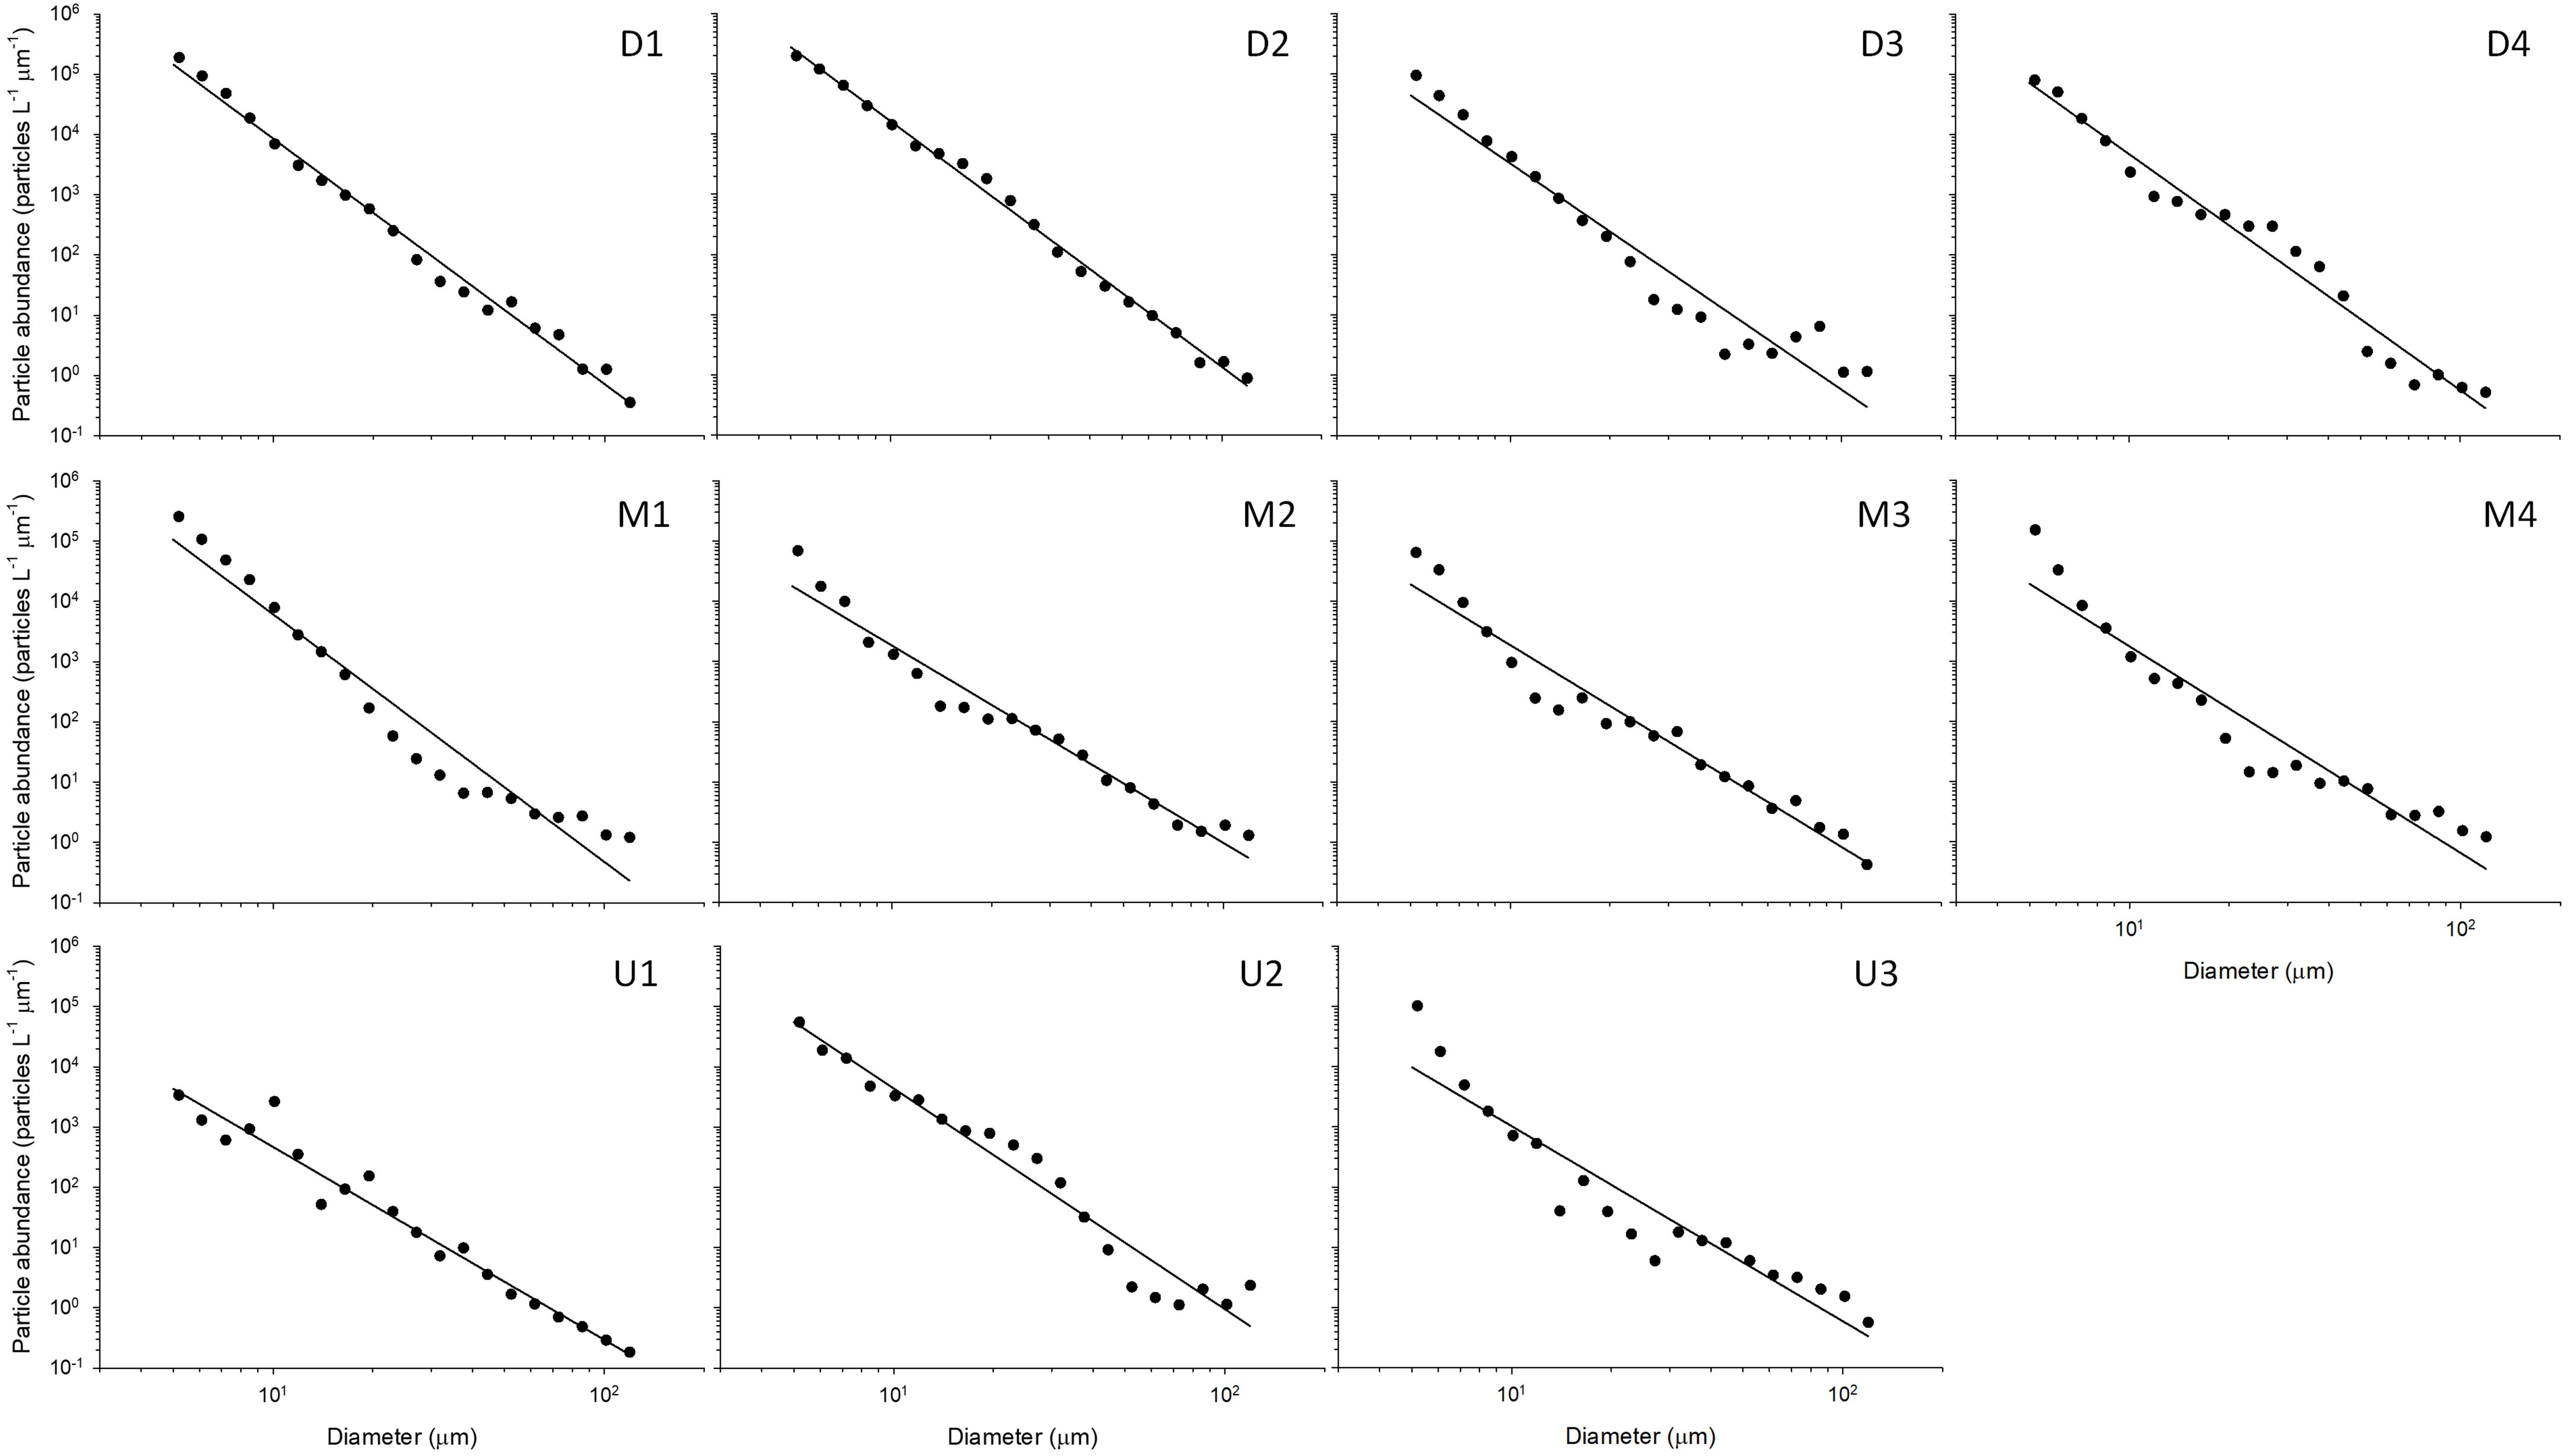
Figure 6. Particle size distribution, following the power-law model (Eq. 1) with double logarithmic transformation, in the size range of 5.2–119 μm. The data were averaged for a depth range of 0–20 m. The least squares linear regression line is given for each station. Statistical parameters of the regression are presented in Table 4.
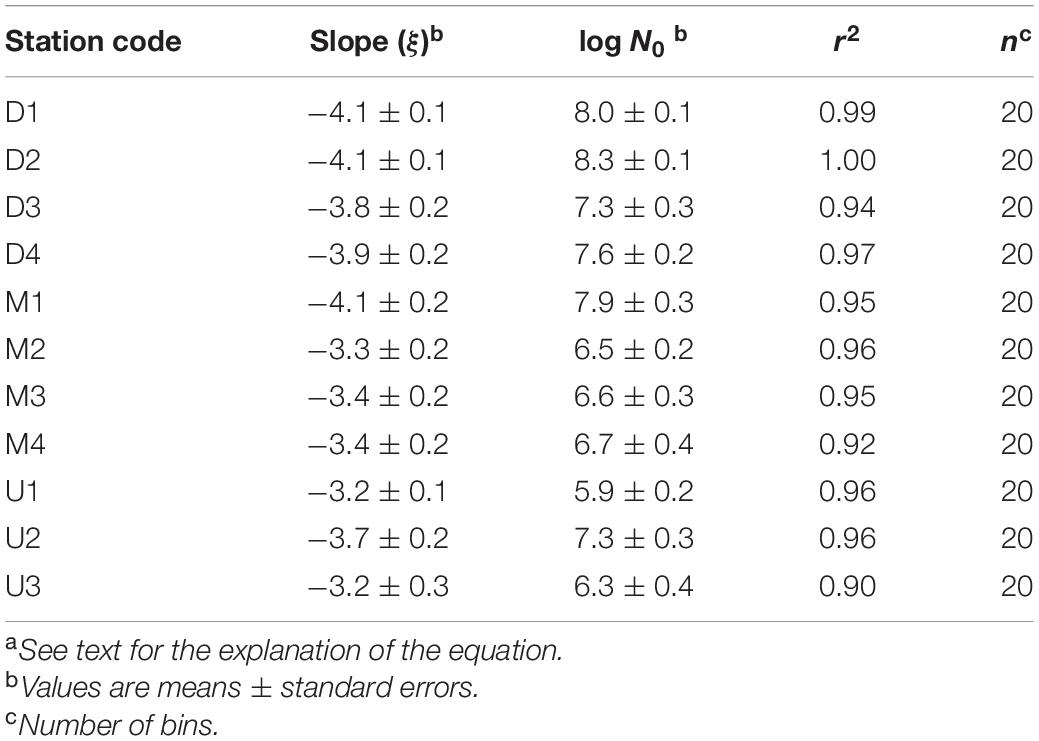
Table 4. Parameters of particle size distribution of each regression linea.
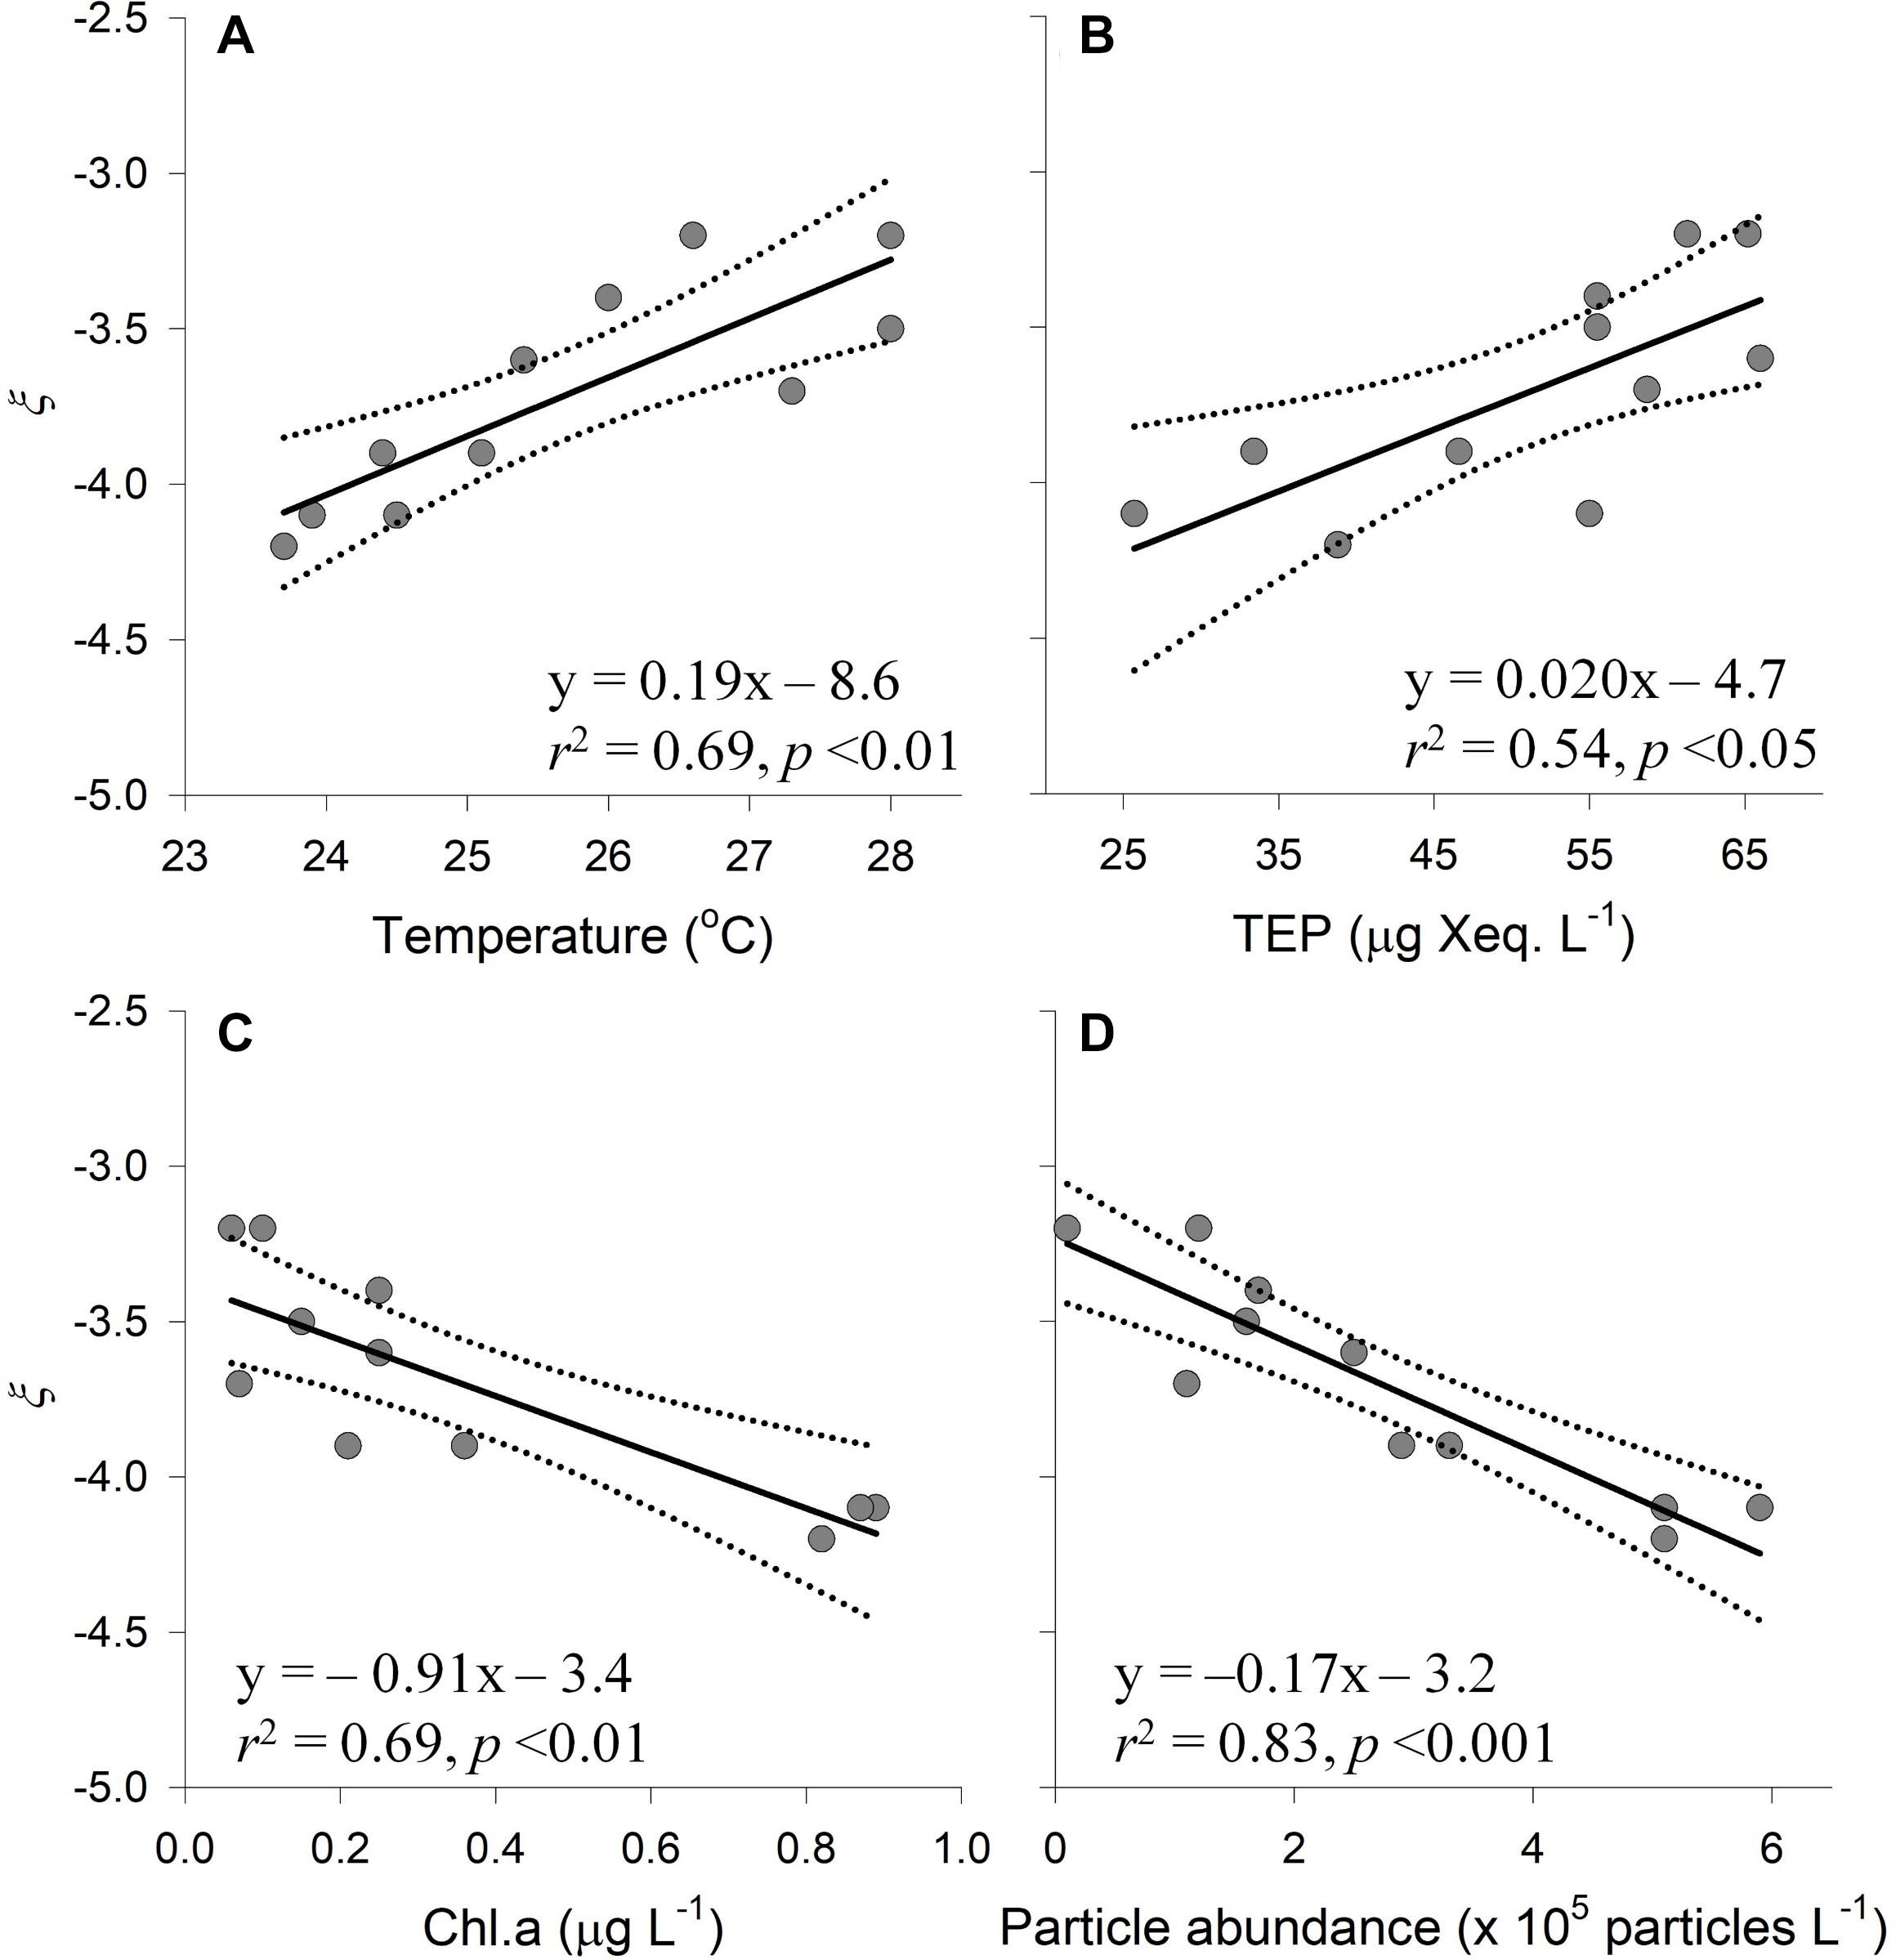
Figure 7. Relationships between the slope of particle size distribution (ξ) in the size range of 5.2–119 μm and other variables. Scatter plots of the PSD slope (ξ) against (A) temperature, (B) concentration of transparent exopolymer particles (TEP), (C) concentration of chlorophyll a (Chl.a), and (D) particle abundance in the size range of 5.2–119 μm. Linear regression line (solid line), 95% confidence interval (dotted line) and statistical parameters are given for each graph.
Discussion
Comparison of Particle Size Distribution Slopes in the Kuroshio Region With Those in the Gulf Stream and the Central Subtropical Gyre
The range of PSD slope that we obtained in the Kuroshio region was –3.2 to –4.2. Previous studies conducted in coastal and offshore of upper oceans ranged from –2.0 to –5.9 (Supplementary Table 3). Particle size distribution slope values obtained by different studies must be compared with caution, because the slope value may depend on size range and fitting method (Barone et al., 2015). Keeping this in mind, it is worthwhile to compare the PSD slope in the Kuroshio region to the study by Buonassissi and Dierssen (2010) who examined the PSD slope in the Gulf Stream (the western boundary current of the North Atlantic) and surrounding regions. They reported that the slope varied in the range of –2.9 to –4.1, with a gradual decrease from the shelf, across the Gulf Stream to the Sargasso Sea. This slope range agrees well with that which we obtained in the Kuroshio region. In contrast, at Station ALOHA in the North Pacific Subtropical Gyre, Barone et al. (2015) reported that the PSD slope varied in the range of –4.2 to –5.9 (data obtained after logarithmic transformation), steeper than those obtained in the Kuroshio region. Although PSD data based on the LISST determination are limited in oceanic environments, the above data suggest that there is a broad geographic gradient of PSD slope from the shelf (flatter slope) toward the central subtropical gyre (steeper slope) across western boundary current. However, as we discuss in the following sections, there was intriguing geographic variation in PSD slope in the Kuroshio region, providing a useful test of the hypothesis that PSD slopes are affected by multiple environmental factors.
Particle Size Distribution Slope Variation and Its Relationship With Chlorophyll a
A notable feature of PSD slope variation in the Kuroshio region is that it became steeper with increasing Chl.a concentration. This is remarkable since this opposes previous observations that PSD slope measured by LISST becomes flatter with increasing Chl.a concentration (Buonassissi and Dierssen, 2010; Xi et al., 2014). The latter is consistent with the notion that smaller phytoplankton generally prevail over larger phytoplankton under oligotrophic conditions (Chisholm, 1992; Irwin et al., 2006). Our results obtained in the Kuroshio region contradict this general trend because PSD slope was flattest at the most oligotrophic stations (U-line) and steepest at nutrient-rich onshore stations (D1, D2, and M1) where Chl.a concentrations were high.
One explanation of this apparent discrepancy is that the steeper PSD slope found at onshore stations on the D- and M-lines (D1, D2, and M1) may reflect an occurrence of nanophytoplankton at these stations. High particle abundance at these stations, accompanied by the steep PSD slope, is consistent with the idea that phytoplankton cells within size categories close to the lower limit of our LISST measurement (5.2 μm) were abundant in these samples. In fact, in the Kuroshio region, previous studies have found that nanophytoplankton, including Prymnesiophytes, became dominant in response to the mixing of oligotrophic Kuroshio water with continental shelf water (Xu et al., 2019). Also, microscopic analysis of coastal waters in Tosa Bay near stations D1 and D2 indicated that nanoplanktonic diatoms (Chaetoceros) often dominated communities following seasonal inputs of nutrients (Hirota et al., 2002; Ichikawa and Hirota, 2004). Although we lack the data of nanophytoplankton abundance at our sampling stations, we speculate that the occurrence of nanoplankton at three onshore stations (D1, D2, and M1) may have resulted in a steeper PSD slope than those at other stations. There are other potential factors that caused a steeper PSD slope at onshore stations. These factors include impacts of zooplankton grazing and fecal pellet production (Emerson and Roff, 1987; Stamieszkin et al., 2015, 2017; Kobari et al., 2019) and loadings of small particles from terrestrial and benthic sources (Tang et al., 2019).
Possible Impacts of Transparent Exopolymer Particle-Induced Aggregation on Particle Size Distribution Slope Variation
Another factor that may affect PSD variation in the Kuroshio region is particle aggregation. The aggregation rate is formulated as a product of particle abundance, encounter rate, and stickiness (Burd and Jackson, 2009). Therefore, aggregation is strongly enhanced by increasing particle stickiness. Although the shape and slope of PSD are determined by aggregation processes in a complex manner, particle stickiness represents one of factors affecting PSD slope through its influence on aggregate geometry (Li et al., 2004; Burd and Jackson, 2009). In fact, a microcosm study using diatoms revealed that, when the ratios of TEP amount to total solid volume were high, aggregates were more porous as indicated by their lower fractal dimensions (Engel and Schartau, 1999). Using a numerical simulation model, Li et al. (2004) suggested that, at steady state, the PSD slope becomes flatter when the aggregate fractal dimension is lower. Our data showing that the PSD slope tended to diminish with increasing TEP concentration are consistent with the hypothesis that PSD slope is diminished by TEP-induced formation of porous aggregates with low fractal dimension. This hypothesis explains the observation that PSD slope was flattest at the most oligotrophic stations (U-line) where TEP concentration was high.
The extent of the enhancement of stickiness due to the presence of TEP can be assessed by using an empirical model relating stickiness (α) to the ratio of TEP to Chl.a (TEP:Chl.a) (Engel, 2000); α = 6.38 × 10⁻⁴ (TEP:Chl.a) – 3.3 × 10⁻³. Using this model, we found that stickiness of particles varied widely (35-fold) among stations (range 0.02–0.69) and is significantly positively correlated with PSD slope (Spearman’s r = 0.86, p < 0.001; Supplementary Figure 3 and Supplementary Table 4). This result is consistent with the notion that TEP diminished the PSD slope via the enhancement of stickiness and its impacts on PSD slope (Li et al., 2004). We note that the derivation of the equation relating TEP:Chl.a to α is based on experimental results using diatom-dominated coastal seawater (Engel, 2000). Whether this equation applies to pico- and nanophytoplankton communities in the Kuroshio region needs to be verified in future studies.
High concentrations of TEP in oligotrophic environments with lower Chl.a concentrations are likely a consequence of physiological responses of phytoplankton to nutrient limitations. In fact, as revealed by the nanomolar-level determination of nutrients, DIN and PO43–, concentrations at stations located on the U-line were low, varying in the range of <0.02–0.02 and <0.002–0.010 μM, respectively. Bar-Zeev et al. (2011) observed high concentrations of TEP in the oligotrophic eastern Mediterranean Sea. They suggested that high solar irradiance combined with limited nutrient availability resulted in excretion of excess carbon as TEP.
The higher TEP concentration may have promoted aggregation not only of autotrophic cells such as Synechococcus and Prochlorococcus (Malfatti and Azam, 2009; Cruz and Neuer, 2019), but also detrital particles (both organic and inorganic) and hetetrorophic cells, including bacteria. In fact, TEP-induced aggregate formation may be enhanced by clay minerals (Deng et al., 2015) and bacteria (Yamada et al., 2016; Cruz and Neuer, 2019). Another class of exopolymer, CPS, can also enhance particle aggregation (Yamada et al., 2018). Although our data showed that neither bacterial abundance nor CPS concentration was significantly correlated with PSD slope in the Kuroshio region, their role in controlling aggregate formation in oligotrophic environments requires further scrutiny.
Stickiness is not a sole factor controlling particle aggregation. For particles within the size range of our LISST measurements (5.2–119 μm), the dominant collision mechanism of particles is turbulent sheer, which brings particles together, and in addition, may cause aggregates to break up (Burd and Jackson, 2009). The investigated region is characterized by high turbulence generated by energy originating from collision of the Kuroshio Current with the continental shelf or from its passage through straits and over seamounts and ridges (Island mass effect, Hasegawa, 2019; Nagai et al., 2021). Turbulence is also promoted by frequent passage of typhoons (Camargo et al., 2007; Kossin et al., 2016). The possibility that turbulence affects PSD slopes in the Kuroshio region, through its impact on particle aggregation and disaggregation, the latter being enhanced by physical disturbance caused by zooplankton (Alldredge et al., 1990; Kiorboe et al., 2014), deserves further investigation.
Biogeochemical Implications
Our data suggest that TEP-induced aggregation led to the diminishment of PSD slope at the most oligotrophic sites of the Kuroshio region. Aggregation of small particles, including pico- and nanoplankton, and the detritus derived from these organisms, may lead to formation of aggregates with high sinking velocity (Bach et al., 2016), which may represent a major mechanism driving carbon export in oligotrophic oceans (Richardson and Jackson, 2007; Guidi et al., 2016). A recent model study revealed that carbon transfer efficiency, defined as the fraction of carbon delivered to deep waters relative to carbon exported from the base of the euphotic zone, depends on the PSD slope: the flatter the slope, the higher the carbon transfer efficiency (Omand et al., 2020). These results imply that carbon is efficiently transferred to greater depths at oligotrophic sites of the Kuroshio region.
However, there is an alternative view with regard to the role of TEP-induced aggregation in carbon transfer in the oceans. The density and settling velocity of individual TEP is generally thought to be low, and TEP-induced aggregation may result in formation of less dense, porous aggregates (Engel and Schartau, 1999; Azetsu-Scott and Passow, 2004; Mari, 2008; Mari et al., 2017). Jennings et al. (2017) hypothesized that, in oligotrophic regions (Gulf Stream and Sargasso Sea), TEP without sufficiently dense (ballast) particles might ascend and accumulate in surface layers, leading to longer residence times in the upper ocean of aggregates containing large amounts of TEP. Nagata et al. (2021) compiled data on TEP distributions in deep oceanic water columns, suggesting that TEP-induced enhancement of particle export is potentially large only in marginal seas and coastal environments where ballast particles are supplied, whereas such an effect would be minimal in open ocean environments. Different views on the role of TEP in carbon transfer highlight a need of future research on variation and control of porosity, density, and sinking (or ascending) velocities of aggregates in oligotrophic oceanic environments.
Conclusion
From LISST observations carried out along the Kuroshio Current in southeast Japan, we found that PSD slopes tend to become steeper with increasing Chl.a concentration, contrary to the generally observed trend. We also found that they become flatter with increasing TEP concentrations. Possible explanations of these results include localized occurrence of nanophytoplankton and TEP facilitation of particle aggregation. The data support the hypothesis that PSD slopes in the Kuroshio region are controlled by a multitude of factors, including phytoplankton community dynamics and aggregation processes. Different scenarios are possible concerning biogeochemical consequence of PSD slope variation in the Kuroshio region. To determine whether TEP-induced particle aggregation enhances or suppresses carbon export, we need a better understanding of the nature of aggregates (porosity, density, and sinking velocity) in the Kuroshio region.
Data Availability Statement
The original contributions presented in the study are included in the article/Supplementary Material, further inquiries can be directed to the corresponding author.
Author Contributions
YY, HF, and TN contributed to the conception and design of the study. YY, HF, and YU collected the seawater samples and measured the parameters. YY wrote the first draft of the manuscript. All authors contributed to manuscript revision, read, and approved the submitted version.
Funding
This research was supported by SKED funded by MEXT (Grant Number JPMXD0511102330), JSPS KAKENHI (Grant Numbers JP19H05667, JP17H06294, JP21H03586, and JP20K19960), and the JST FOREST Program (Grant Number JPMJFR2070).
Conflict of Interest
The authors declare that the research was conducted in the absence of any commercial or financial relationships that could be construed as a potential conflict of interest.
Publisher’s Note
All claims expressed in this article are solely those of the authors and do not necessarily represent those of their affiliated organizations, or those of the publisher, the editors and the reviewers. Any product that may be evaluated in this article, or claim that may be made by its manufacturer, is not guaranteed or endorsed by the publisher.
Supplementary Material
The Supplementary Material for this article can be found online at: https://www.frontiersin.org/articles/10.3389/fmars.2021.768766/full#supplementary-material
References
Agrawal, Y. C., and Pottsmith, H. C. (2000). Instruments for particle size and settling velocity observations in sediment transport. Mar. Geol. 168, 89–114. doi: 10.1016/S0025-3227(00)00044-X
Alldredge, A. L., Granata, T. C., Gotschalk, C. C., and Dickey, T. D. (1990). The physical strength of marine snow and its implications for particle disaggregation in the ocean. Limnol. Oceanogr. 35, 1415–1428. doi: 10.4319/lo.1990.35.7.1415
Alldredge, A. L., Passow, U., and Logan, B. E. (1993). The abundance and significance of a class of large, transparent organic particles in the ocean. Deep Sea Res. 1 Oceanogr. Res. Pap. 40, 1131–1140. doi: 10.1016/0967-0637(93)90129-Q
Andrews, S. W., Nover, D. M., Reardon, K., Reuter, J. E., and Schladow, S. G. (2011). The influence of ambient light intensity on in situ laser diffractometers. Water Resour. Res. 47:W06509. doi: 10.1029/2010wr009841
Azetsu-Scott, K., and Passow, U. (2004). Ascending marine particles: significance of transparent exopolymer particles (TEP) in the upper ocean. Limnol. Oceanogr. 49, 741–748. doi: 10.4319/lo.2004.49.3.0741
Bach, L. T., Boxhammer, T., Larsen, A., Hildebrandt, N., Schulz, K. G., and Riebesell, U. (2016). Influence of plankton community structure on the sinking velocity of marine aggregates. Glob. Biogeochem. Cycles 30, 1145–1165. doi: 10.1002/2016gb005372
Bader, H. (1970). The hyperbolic distribution of particle sizes. J. Geophys. Res. 75, 2822–2830. doi: 10.1029/JC075i015p02822
Barone, B., Bidigare, R. R., Church, M. J., Karl, D. M., Letelier, R. M., and White, A. E. (2015). Particle distributions and dynamics in the euphotic zone of the North Pacific Subtropical Gyre. J. Geophys. Res. Oceans 120, 3229–3247. doi: 10.1002/2015jc010774
Bar-Zeev, E., Berman, T., Rahav, E., Dishon, G., Herut, B., and Berman-Frank, I. (2011). Transparent exopolymer particle (TEP) dynamics in the eastern Mediterranean Sea. Mar. Ecol. Prog. Ser. 431, 107–118. doi: 10.3354/meps09110
Buonassissi, C. J., and Dierssen, H. M. (2010). A regional comparison of particle size distributions and the power law approximation in oceanic and estuarine surface waters. J. Geophys. Res. 115:C10028. doi: 10.1029/2010jc006256
Burd, A. B., and Jackson, G. A. (2009). Particle aggregation. Ann. Rev. Mar. Sci. 1, 65–90. doi: 10.1146/annurev.marine.010908.163904
Cael, B. B., and White, A. E. (2020). Sinking versus suspended particle size distributions in the North Pacific Subtropical Gyre. Geophys. Res. Lett. 47:e2020GL087825. doi: 10.1029/2020gl087825
Camargo, S. J., Robertson, A. W., Gaffney, S. J., Smyth, P., and Ghil, M. (2007). Cluster analysis of typhoon tracks. Part I: general properties. J. Clim. 20, 3635–3653. doi: 10.1175/jcli4188.1
Chisholm, S. W. (1992). “Phytoplankton size,” in Primary Productivity and Biogeochemical Cycles in the Sea, eds P. G. Falkowski, A. D. Woodhead, and K. Vivirito (Boston, MA: Springer), 213–237.
Cisternas-Novoa, C., Lee, C., and Engel, A. (2014). A semi-quantitative spectrophotometric, dye-binding assay for determination of Coomassie Blue stainable particles. Limnol. Oceanogr. Methods 12, 604–616. doi: 10.4319/lom.2014.12.604
Cruz, B. N., and Neuer, S. (2019). Heterotrophic bacteria enhance the aggregation of the marine picocyanobacteria Prochlorococcus and Synechococcus. Front. Microbiol. 10:1864. doi: 10.3389/fmicb.2019.01864
Deng, W., Monks, L., and Neuer, S. (2015). Effects of clay minerals on the aggregation and subsequent settling of marine Synechococcus. Limnol. Oceanogr. 60, 805–816. doi: 10.1002/lno.10059
Emerson, C. W., and Roff, J. C. (1987). Implications of fecal pellet size and zooplankton behavior to estimates of pelagic-benthic carbon flux. Mar. Ecol. Prog. Ser. 35, 251–257. doi: 10.3354/meps035251
Endo, H., and Suzuki, K. (2019). “Spatial variations in community structure of haptophytes across the Kuroshio Front in the Tokara Strait,” in Kuroshio Current, eds T. Nagai, H. Saito, K. Suzuki, and M. Takahashi (Washington, DC: JohnWiley & Sons), 207–221.
Engel, A. (2000). The role of transparent exopolymer particles (TEP) in the increase in apparent particle stickiness (α) during the decline of a diatom bloom. J. Plankton Res. 22, 485–497. doi: 10.1093/plankt/22.3.485
Engel, A., and Schartau, M. (1999). Influence of transparent exopolymer particles (TEP) on sinking velocity of Nitzschia closterium aggregates. Mar. Ecol. Prog. Ser. 182, 69–76. doi: 10.3354/meps182069
Giering, S. L. C., Cavan, E. L., Basedow, S. L., Briggs, N., Burd, A. B., Darroch, L. J., et al. (2020). Sinking organic particles in the ocean—flux estimates from in situ optical devices. Front. Mar. Sci. 6:834. doi: 10.3389/fmars.2019.00834
Guidi, L., Chaffron, S., Bittner, L., Eveillard, D., Larhlimi, A., Roux, S., et al. (2016). Plankton networks driving carbon export in the oligotrophic ocean. Nature 532, 465–470. doi: 10.1038/nature16942
Guidi, L., Jackson, G. A., Stemmann, L., Miquel, J. C., Picheral, M., and Gorsky, G. (2008). Relationship between particle size distribution and flux in the mesopelagic zone. Deep Sea Res. 1 Oceanogr. Res. Pap. 55, 1364–1374. doi: 10.1016/j.dsr.2008.05.014
Hasegawa, D. (2019). “Island mass effect,” in Kuroshio Current, eds T. Nagai, H. Saito, K. Suzuki, and M. Takahashi (Washington, DC: John Wiley & Sons), 163–174.
Hashihama, F., Sato, M., Takeda, S., Kanda, J., and Furuya, K. (2010). Mesoscale decrease of surface phosphate and associated phytoplankton dynamics in the vicinity of the subtropical South Pacific islands. Deep Sea Res. 1 Oceanogr. Res. Pap. 57, 338–350. doi: 10.1016/j.dsr.2009.12.005
Hirota, Y., Ichikawa, T., Morimoto, H., and Sakamoto, H. (2002). Temporal increase of phytoplankton in summer in Tosa Bay. Fish. Biol. Oceanogr. Kuroshio 3, 35–46 (in Japanese).
Hung, C. C., and Gong, G. C. (2007). Export flux of POC in the main stream of the Kuroshio. Geophys. Res. Lett. 34:L18606. doi: 10.1029/2007gl030236
Ichikawa, A., and Hirota, Y. (2004). Seasonal changes of primary productivity in Tosa Bay, Japan. Oceanogr. Jpn. 13, 259–269 (in Japanese with English abstract). doi: 10.5928/kaiyou.13.259
Irwin, A. J., Finkel, Z. V., Schofield, O. M. E., and Falkowski, P. G. (2006). Scaling-up from nutrient physiology to the size-structure of phytoplankton communities. J. Plankton Res. 28, 459–471. doi: 10.1093/plankt/fbi148
Jennings, M. K., Passow, U., Wozniak, A. S., and Hansell, D. A. (2017). Distribution of transparent exopolymer particles (TEP) across an organic carbon gradient in the western North Atlantic Ocean. Mar. Chem. 190, 1–12. doi: 10.1016/j.marchem.2017.01.002
Kiorboe, T., Jiang, H., Goncalves, R. J., Nielsen, L. T., and Wadhwa, N. (2014). Flow disturbances generated by feeding and swimming zooplankton. Proc. Natl. Acad. Sci. U.S.A. 111, 11738–11743. doi: 10.1073/pnas.1405260111
Kobari, T., Kobari, Y., Miyamoto, H., Okazaki, Y., Kume, G., Kondo, R., et al. (2019). “Variability in taxonomic composition, standing stock, and productivity of the plankton community in the Kuroshio and its neighboring waters,” in Kuroshio Current, eds T. Nagai, H. Saito, K. Suzuki, and M. Takahashi (Washington, DC: John Wiley & Sons), 223–243.
Kossin, J. P., Emanuel, K. A., and Camargo, S. J. (2016). Past and projected changes in western North Pacific tropical cyclone exposure. J. Clim. 29, 5725–5739. doi: 10.1175/jcli-d-16-0076.1
Kostadinov, T. S., Siegel, D. A., and Maritorena, S. (2009). Retrieval of the particle size distribution from satellite ocean color observations. J. Geophys. Res. 114:C09015. doi: 10.1029/2009jc005303
Kostadinov, T. S., Siegel, D. A., Maritorena, S., and Guillocheau, N. (2012). Optical assessment of particle size and composition in the Santa Barbara Channel, California. Appl. Opt. 51, 3171–3189. doi: 10.1364/AO.51.003171
Kwon, E. Y., Primeau, F., and Sarmiento, J. L. (2009). The impact of remineralization depth on the air–sea carbon balance. Nat. Geosci. 2, 630–635. doi: 10.1038/ngeo612
Leroux, R., Gregori, G., Leblanc, K., Carlotti, F., Thyssen, M., Dugenne, M., et al. (2018). Combining laser diffraction, flow cytometry and optical microscopy to characterize a nanophytoplankton bloom in the Northwestern Mediterranean. Prog. Oceanogr. 163, 248–259. doi: 10.1016/j.pocean.2017.10.010
Li, X. Y., Zhang, J. J., and Lee, J. H. (2004). Modelling particle size distribution dynamics in marine waters. Water Res. 38, 1305–1317. doi: 10.1016/j.watres.2003.11.010
Lombard, F., Boss, E., Waite, A. M., Vogt, M., Uitz, J., Stemmann, L., et al. (2019). Globally consistent quantitative observations of planktonic ecosystems. Front. Mar. Sci. 6:196. doi: 10.3389/fmars.2019.00196
Maerz, J., Six, K. D., Stemmler, I., Ahmerkamp, S., and Ilyina, T. (2020). Microstructure and composition of marine aggregates as co-determinants for vertical particulate organic carbon transfer in the global ocean. Biogeosciences 17, 1765–1803. doi: 10.5194/bg-17-1765-2020
Malfatti, F., and Azam, F. (2009). Atomic force microscopy reveals microscale networks and possible symbioses among pelagic marine bacteria. Aquat. Microb. Ecol. 58, 1–14. doi: 10.3354/ame01355
Malone, T. C. (1971). The relative importance of nanoplankton and netplankton as primary producers in tropical oceanic and neritic phytoplankton communities. Limnol. Oceanogr. 16, 633–639. doi: 10.4319/lo.1971.16.4.0633
Mari, X. (2008). Does ocean acidification induce an upward flux of marine aggregates? Biogeosci. Disc. 5, 1631–1654. doi: 10.5194/bg-5-1023-2008
Mari, X., Passow, U., Migon, C., Burd, A. B., and Legendre, L. (2017). Transparent exopolymer particles: effects on carbon cycling in the ocean. Prog. Oceanogr. 151, 13–37. doi: 10.1016/j.pocean.2016.11.002
Nagai, T., Durán, G. S., Otero, D. A., Mori, Y., Yoshie, N., Ohgi, K., et al. (2019). How the Kuroshio current delivers nutrients to sunlit layers on the continental shelves with aid of near-inertial waves and turbulence. Geophys. Res. Lett. 46, 6726–6735. doi: 10.1029/2019gl082680
Nagai, T., Hasegawa, D., Tsutsumi, E., Nakamura, H., Nishina, A., Senjyu, T., et al. (2021). The Kuroshio flowing over seamounts and associated submesoscale flows drive 100-km-wide 100-1000-fold enhancement of turbulence. Commun. Earth Environ. 2:170. doi: 10.1038/s43247-021-00230-7
Nagata, T., Yamada, Y., and Fukuda, H. (2021). Transparent exopolymer particles in deep oceans: synthesis and future challenges. Gels 7:75. doi: 10.3390/gels7030075
Oguri, K., Matsumoto, E., Yamada, M., Saito, Y., and Iseki, K. (2003). Sediment accumulation rates and budgets ofdepositing particles ofthe East China Sea. Deep Sea Res. 2 Top. Stud. Oceanogr. 50, 513–528. doi: 10.1016/S0967-0645(02)00465-4
Omand, M. M., Govindarajan, R., He, J., and Mahadevan, A. (2020). Sinking flux of particulate organic matter in the oceans: sensitivity to particle characteristics. Sci. Rep. 10:5582. doi: 10.1038/s41598-020-60424-5
Passow, U. (2002). Transparent exopolymer particles (TEP) in aquatic environments. Prog. Oceanogr. 55, 287–333. doi: 10.1016/S0079-6611(02)00138-6
Passow, U., and Alldredge, A. L. (1995). A dye-binding assay for the spectrophotometric measurement of transparent exopolymer particles (TEP). Limnol. Oceanogr. 40, 1326–1335. doi: 10.4319/lo.1995.40.7.1326
Pelegrí, J. L., Vallès-Casanova, I., and Orúe-Echevarría, D. (2019). “The gulf nutrient Stream,” in Kuroshio Current, eds T. Nagai, H. Saito, K. Suzuki, and M. Takahashi (Washington, DC: John Wiley & Sons), 23–50.
Qu, B., Song, J., Yuan, H., Li, X., and Li, N. (2018). Carbon chemistry in the mainstream of Kuroshio current in eastern Taiwan and its transport of carbon into the East China Sea shelf. Sustainability 10:791. doi: 10.3390/su10030791
Reynolds, R. A., Stramski, D., Wright, V. M., and Woźniak, S. B. (2010). Measurements and characterization of particle size distributions in coastal waters. J. Geophys. Res. 115:C08024. doi: 10.1029/2009jc005930
Richardson, T. L., and Jackson, G. A. (2007). Small phytoplankton and carbon export from the surface ocean. Science 315, 838–840. doi: 10.1126/science.1133471
Saito, H. (2013). The Kuroshio Paradox and Sustainable Use of Fisheries Production: Introduction to SKED (The Study of Kuroshio Ecosystem Dynamics for Sustainable Fisheries). Bergen: IMBER International Project Office.
Stamieszkin, K., Pershing, A. J., Record, N. R., Pilskaln, C. H., Dam, H. G., and Feinberg, L. R. (2015). Size as the master trait in modeled copepod fecal pellet carbon flux. Limnol. Oceanogr. 60, 2090–2107. doi: 10.1002/lno.10156
Stamieszkin, K., Poulton, N. J., and Pershing, A. J. (2017). Zooplankton grazing and egestion shifts particle size distribution in natural communities. Mar. Ecol. Prog. Ser. 575, 43–56. doi: 10.3354/meps12212
Styles, R. (2006). Laboratory evaluation of the LISST in a stratified fluid. Mar. Geol. 227, 151–162. doi: 10.1016/j.margeo.2005.11.011
Tang, Q., Wang, S., Qiu, Z., Sun, D., and Bilal, M. (2019). Variability of the suspended particle cross-sectional area in the Bohai Sea and Yellow Sea. Remote Sens. 11:1187. doi: 10.3390/rs11101187
Ward, B. A., Dutkiewicz, S., Jahn, O., and Follows, M. J. (2012). A size-structured food-web model for the global ocean. Limnol. Oceanogr. 57, 1877–1891. doi: 10.4319/lo.2012.57.6.1877
White, A. E., Letelier, R. M., Whitmire, A. L., Barone, B., Bidigare, R. R., Church, M. J., et al. (2015). Phenology of particle size distributions and primary productivity in the North Pacific subtropical gyre (Station ALOHA). J. Geophys. Res. Oceans 120, 7381–7399. doi: 10.1002/2015JC010897
Xi, H. Y., Larouche, P., Tang, S. L., and Michel, C. (2014). Characterization and variability of particle size distributions in Hudson Bay. Canada J. Geophys. Res. Oceans 119, 3392–3406. doi: 10.1002/2013jc009542
Xu, Q., Sukigara, C., Goes, J. I., do Rosario Gomes, H., Zhu, Y., Wang, S., et al. (2019). Interannual changes in summer phytoplankton community composition in relation to water mass variability in the East China Sea. J. Oceanogr. 75, 61–79. doi: 10.1007/s10872-018-0484-y
Yamada, Y., Fukuda, H., Tada, Y., Kogure, K., and Nagata, T. (2016). Bacterial enhancement of gel particle coagulation in seawater. Aquat. Microb. Ecol. 77, 11–22. doi: 10.3354/ame01784
Yamada, Y., Fukuda, H., Uchimiya, M., Motegi, C., Nishino, S., Kikuchi, T., et al. (2015). Localized accumulation and a shelf-basin gradient of particles in the Chukchi Sea and Canada Basin, western Arctic. J. Geophys. Res. Oceans 120, 4638–4653. doi: 10.1002/2015jc010794
Yamada, Y., Tomaru, Y., Fukuda, H., and Nagata, T. (2018). Aggregate formation during the viral lysis of a marine diatom. Front. Mar. Sci. 5:167. doi: 10.3389/fmars.2018.00167
Yamashiro, T., and Kawabe, M. (1996). Monitoring of position of the Kuroshio axis in the Tokara Strait using sea level data. J. Oceanogr. 52, 675–687. doi: 10.1007/BF02239459
Keywords: slope of particle size distribution, chlorophyll a, transparent exopolymer particles (TEP), Kuroshio, nanophytoplankton, particle aggregation
Citation: Yamada Y, Fukuda H, Umezawa Y and Nagata T (2021) Geographic Variation of Particle Size Distribution in the Kuroshio Region: Possible Causes in the Upper Water Column. Front. Mar. Sci. 8:768766. doi: 10.3389/fmars.2021.768766
Received: 01 September 2021; Accepted: 27 October 2021;
Published: 16 November 2021.
Edited by:
Christian Lønborg, Aarhus University, DenmarkReviewed by:
Kai Ziervogel, University of New Hampshire, United StatesYihua Cai, Xiamen University, China
Copyright © 2021 Yamada, Fukuda, Umezawa and Nagata. This is an open-access article distributed under the terms of the Creative Commons Attribution License (CC BY). The use, distribution or reproduction in other forums is permitted, provided the original author(s) and the copyright owner(s) are credited and that the original publication in this journal is cited, in accordance with accepted academic practice. No use, distribution or reproduction is permitted which does not comply with these terms.
*Correspondence: Yosuke Yamada, eW9zdWtlLnlhbWFkYUBvaXN0Lmpw