 Frode B. Vikebø1,2*
 Ole Jacob Broch3
 Clarissa Akemi Kajiya Endo1
 Håvard G. Frøysa1
 JoLynn Carroll4,5Jonas Juselius6Øystein Langangen7
- 1Institute of Marine Research, Bergen, Norway
- 2Geophysical Institute, University of Bergen, Bergen, Norway
- 3SINTEF Ocean AS, Trondheim, Norway
- 4Akvaplan-Niva, FRAM – High North Research Centre for Climate and the Environment, Tromsø, Norway
- 5Department of Geosciences, UiT The Arctic University of Norway, Tromsø, Norway
- 6High Performance Computing Group, IT Department, UiT The Arctic University of Norway, Tromsø, Norway
- 7Department of Biosciences, Centre for Ecological and Evolutionary Synthesis (CEES), University of Oslo, Oslo, Norway
By combining an ocean model, a nutrient-phytoplankton-zooplankton-detritus-model and an individual-based model for early life stages of Northeast Arctic cod we systematically investigate food limitations and growth performance for individual cod larvae drifting along the Norwegian coast from spawning grounds toward nursery areas in the Barents Sea. We hypothesize that there is food shortage for larvae spawned early and late in the 2-monthlong spawning period, and to a larger degree to the north and south of the main spawning grounds in the Lofoten. Model results for three contrasting years (1995, 2001, and 2002) show that spawning early in the season at spawning grounds in the Lofoten and farther north is favorable for larval growth close to their size- and temperature-dependent potential. Still, both early and late spawned larvae experience slower growth than individuals originating closer to the time of peak spawning late March/early April. The reasons are low temperatures and shortage in suitable prey, respectively, and this occurs more frequent in areas of strong currents about 1–2 months post hatching. In particular, late spawned larvae grow relatively slow despite higher temperatures later in the season because they are outgrown by their preferred prey.
Introduction
Early life stages of fish experience high mortality rates, associated with a range of potential drivers, that lead to high losses prior to recruitment to the stock (“recruitment-processes”). Hjort’s (1914) seminal work emphasizes the need for first-feeding larvae to match prey immediately after the yolk sac is absorbed (“critical period”) and being transported to favorable nursery grounds (“aberrant drift”). This has since been further developed by utilizing new observational data and methods (Cushing, 1990; Houde, 2008; Ottersen et al., 2014). After about 100 years of research on various recruitment processes there is today an understanding that a multitude of processes on various spatiotemporal scales may impact recruitment in fish and that the relative importance of these processes varies in both time and space (Gallego et al., 2012; Hare, 2014).
The typical recruitment pattern is many poor to average years with only a few highly successful years that contribute significantly to the sustainability of fish stocks (Bogstad et al., 2016). The stocks produce vast amounts of eggs, much more than what can survive to recruitment. The high egg production often leads to recruitment being more dependent on the influence of environmental conditions on the survival of young fish as compared to the size of the adult population. Several environmental factors typically play an important role in the recruitment process, including spatiotemporally varying temperatures, dispersal, light conditions, turbulence, prey availability, and predation (Ottersen et al., 2014).
The Northeast Arctic (NEA) stock of Atlantic cod (Gadus morhua) is a commercially exploited fish species with a typical recruitment pattern of sporadically occurring years of very high recruitment. The NEA cod stock has been subjected to moderate fishing pressure in recent years that combined with strong recruitment in 2004 and 2005 has resulted in a high spawning stock biomass and increased age diversity (Kjesbu et al., 2014). Still, only a tiny fraction of cod eggs survives to reach recruitment (Bogstad et al., 2016)—on average 6 per 1 million eggs. The highest mortality rates occur during the egg and larval stages (Houde, 2008). Recent estimates indicate that NEA cod larvae mortality rates range from 0.06 to 0.08 day–1 (Langangen et al., 2014a), which is on the low end of estimates previously reported by Sundby et al. (1989) of 0.08–0.15 day–1. In the context of overall mortality from eggs to recruits, the largest inter-annual variability is thought to occur at the 0-group stage (developmental stage at settlement around the age of 6 months) (Langangen et al., 2014a). Considerable variability in natural mortality also occurs between juvenile stages and recruitment that may affect recruitment strength (Bogstad et al., 2016). On the other hand, density-dependent processes (e.g., competition for food and cannibalism) dampen the high variability in natural mortality rates, reducing the inter-annual variation in survivors from egg production through the early life stages until recruitment (Ottersen et al., 2014).
Sampling sufficient data at sea to obtain direct estimates of natural mortality of planktonic life stages is challenging because cohorts are dispersed by ocean currents and are therefore very difficult to track and sample repeatedly. Alternative and complimentary approaches for estimating mortality rates are therefore needed (e.g., Langangen et al., 2014b). By utilizing experimental and in situ data to parametrize coupled biophysical models of various complexity (e.g., Siddon et al., 2013; Daewel et al., 2015) one may investigate the relative importance of trophodynamics and variations in physical forcing at various scales (Peck and Hufnagel, 2012). For example, models combining ocean physics with nutrient-phytoplankton-zooplankton-detritus (NPZD) dynamics may quantify availability of suitable prey for larval fish. Combined with models of fish eggs and larvae, typically represented by individual-based lagrangian models (IBMs) of early life stage (ELS) (Daewel et al., 2011, 2015), the combined models allow assessment of bottom-up processes affecting growth and survival. The main prey items have pelagic free drift and exhibit diurnal vertical migration and can therefore be explicitly incorporated into the models. Predator presence is more difficult to address because adult migration behavior is less predictable than simple pelagic drift and because of the multitude of potential predators (but see end-to-end models e.g., Rose et al., 2015; Akimova et al., 2019; Daewel et al., 2019).
The adult NEA cod migrate from feeding grounds in the Barents Sea upstream along the Norwegian Coast to spawn during March through April with a peak in early April at multiple well-known spawning grounds (SGs, Sundby and Nakken, 2008; see Figure 1). NEA cod is a batch spawner that spawn pelagic eggs during a 2-month period from early March until late April. Pelagic eggs drift with the ocean currents toward nursery grounds in the Barents Sea and hatch after 2–3 weeks depending on temperature (Ottersen et al., 2014). Newly hatched larvae need sufficient food to cover metabolic costs and energy requirements for growth, which are additionally dependent on ambient temperature and larval size (Folkvord, 2005). The Norwegian continental shelf is a typical spring-bloom system where light conditions and structuring of the water column trigger phytoplankton and zooplankton production (Stenevik et al., 2007; Vikebø et al., 2019). NEA cod larvae and early juveniles are found to mainly feed upon various stages of Calanus finmarchicus from hatching in mid-March to mid-May until after metamorphosis around June (Sundby, 1995). The extended spawning time (ST) is believed to be a strategy to increase the chance of offspring to match the C. finmarchicus under a highly variable bloom phenology (Cushing, 1990; Solemdal, 1997). However, early spawning hampers larval visual feeding because of inadequate light conditions and low prey abundance.
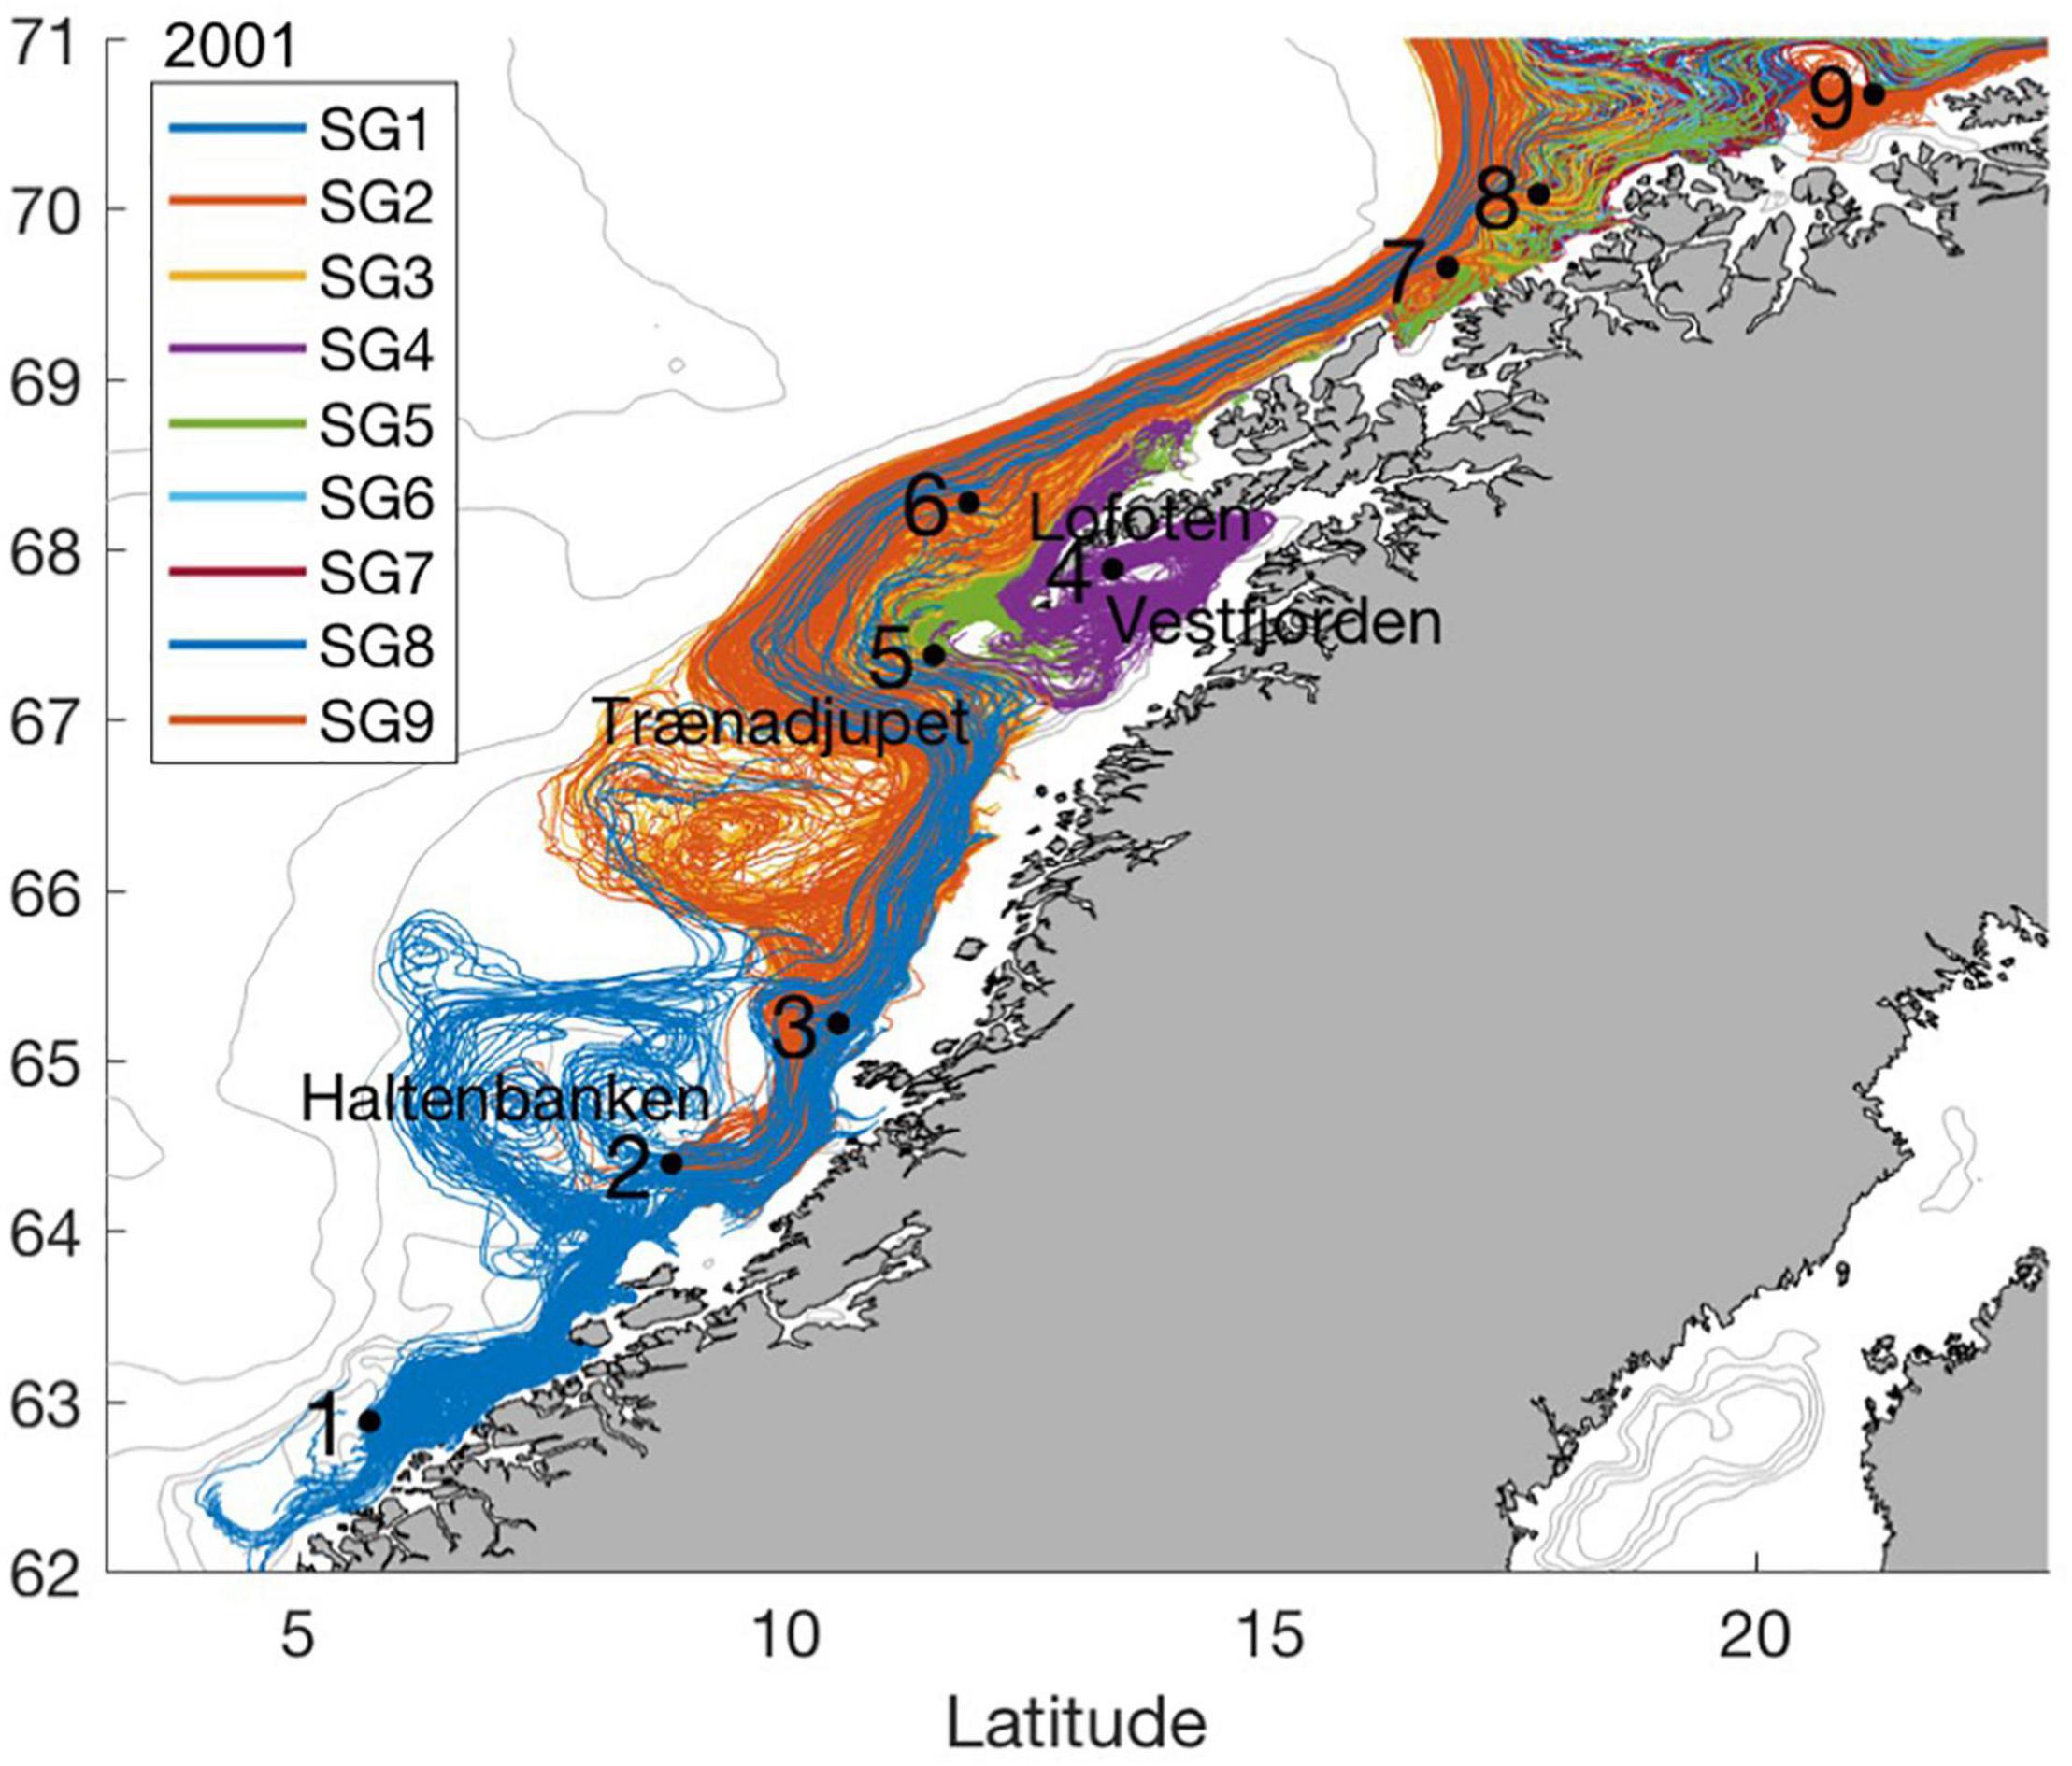
Figure 1. SGs (black stars) and every 100th drift trajectory of eggs/larvae from spawning until late July during 2001.
Quantification of spatiotemporal variability in survival is relevant for integrated ecosystem assessments designed to consider impacts of human activities on the resilience in fish stocks (Langangen et al., 2017). A fish stock with wide-spread spawning locations and times is considered to more easily buffer changing environmental conditions (Hixon et al., 2014; but see Stige et al., 2017) and human activities, such as accidental oil spills (Carroll et al., 2018; Stige et al., 2018). In this context, an important question to be addressed is whether the portion of offspring successfully recruiting is systematically narrowed through match-mismatch leading to a reduction in the intrinsic buffer capacity to varying environmental conditions.
Here, we quantify how the match-mismatch between NEA larval cod and their main prey, C. finmarchicus, are affected by the location and timing of spawning by combining a coupled ocean- and NPZD-model with an IBM ELS for three contrasting years 1995, 2001, and 2002. We analyze the model output to address our hypothesis of a systematic lack of sufficient and suitable prey available for larvae resulting from early and late spawning, and that this lack of overlap is more pronounced at SGs to the south and north of the main SGs in the Lofoten.
Methods and Data
We investigate individual growth in NEA cod larvae and pelagic juveniles as a function of SG and ST by providing stage-specific prey availability to an IBM of NEA cod ELS from the coupled open source SINMOD ocean and NPZD model thoroughly described in Alver et al. (2016). All data underlying this article will be shared on reasonable request to the corresponding author. We analyze 1995, 2001, and 2002 as these years represent contrasting conditions for NEA cod ELS development as compared to the average across 1983–2009 (Bogstad et al., 2016). In short, 1995 and 2002 had medium numbers of NEA cod eggs produced (about 102 and 103 trillion vs. a mean of 107 trillion), while 2001 only had about half of that. Subsequently, 1995 provided about 234 billion juveniles at the 0-group stage which is almost three times the long-term average of 85 billion, 2002 was close to the long-term average, and 2001 provided almost none.
SINMOD C. finmarchicus nauplii and copepodites are homogeneously distributed in the upper 40 and 50 m during dispersal, respectively, but only written to file as numbers per square meter surface for all 13 stages (eggs, nauplii I-VI and copepodites I-VI). When using this model output as prey for larvae, we therefore divide these numbers by 10 assuming that prey typically distribute across a 10 m water column and that larvae are able to stay within reach of their prey. We quantify which of the larvae that experience sufficient and suitable prey abundances to allow at least 90% food-unlimited growth during at least 90% of the time as a function of SG and ST. The reason why we choose to emphasize this is for two particular reasons; (i) past literature argues that the chance of survival through the early life stages is dependent on rapid growth (Houde, 1987), (ii) Folkvord (2005) reports that observed cod larvae at sea typically grow close to their size- and temperature-dependent potential, indicating that individuals unable to feed sufficiently to sustain such growth likely experience high mortality. Furthermore, we quantify ambient temperatures, larval length by the end of June and the number of days to reach 18 mm (same length used for evaluating fitness in Vikebø et al. (2007) as a function of SG and ST. The choice of 18 mm is because a major part of the individuals actually reaches this size by mid-summer, while at the same time acknowledging that mortality rates in general decrease with size. Furthermore, metamorphosis occur at lengths between 12 and 25–30 mm (Folkvord, 1997). Note that Daewel et al. (2011) used a size of 20 mm for a similar type of analysis. Finally, we investigate which areas and ages larvae grow below their growth potential and what temperature and prey conditions this occurs under. Note, that annual estimates of C. finmarchicus in the open ocean are based on annual survey measurements while abundance at the Norwegian shelf depends on cross-shelf transport (Opdal and Vikebø, 2015) or overwintering in the fjords and is reported to drop substantially around 2005 (Toresen et al., 2019). In general, the years in question here are considered medium to warm as compared to a long-term variability (Skagseth et al., 2015).
SINMOD Coupled Ocean and Nutrient-Phytoplankton-Zooplankton-Detritus Model
The ocean physics in SINMOD is computed by integrating the primitive Navier-Stokes equations on a grid with 4 by 4 km horizontal resolution covering the Norwegian and the Barents Sea with 34 vertical z-coordinates (Alver et al., 2016). Lateral boundary conditions from a 20 km SINMOD application covering the North Atlantic and the Arctic. Dynamics of basic nutrients and phytoplankton are described in Wassmann et al. (2006). Details of the zooplankton model representing C. finmarchicus can be found in Alver et al. (2016). In short, the NPZD component within SINMOD considers the basic nutrients nitrate, ammonium and silicate. The key trophic levels include compartments for bacteria, ciliates, heterotrophic nanoflagellates, diatoms and flagellates. Dissolved organic carbon and detritus are also considered. Finally, there is a stage-distributed C. finmarchicus model representing prey to the larval fish. C. finmarchicus is modeled using an Eularian stage-dependent model where growth, mortality and reproduction depends on the physical environment, food availability (modeled diatoms and ciliates), and the C. finmarchicus population structure. The individuals have a specified overwintering depth preference, initiated August 1st, and an ascent toward surface to spawn, initiated January 1st and ending April 1st. However, the ascent is advanced if high levels of chlorophyll appear early so that reproduction better match the peak phytoplankton bloom. The modeled abundance of C. finmarchicus from SINMOD is found to match well with measurements of copepodites stages at the Svinøy and Gimsøy cross-shelf sections, as well as at the weather station Mike in the Norwegian Sea (Alver et al., 2016). The oceanographic model has been shown to reproduce the circulation dynamics at the Norwegian Shelf off Northern Norway (Skarðhamar and Svendsen, 2005).
Key features of the circulation along the Norwegian Coast toward the Barents Sea are the wedge-shaped Norwegian Coastal Current (NCC) hugging the coast at about the 200-m isobath and the Norwegian Atlantic Slope Current (NASC) at the shelf edge (Skagseth et al., 2015). The former is the main carrier of fish plankton with typical velocities between 0.1 and 0.35 ms–1, while the latter is typically around 0.5 ms–1 but up to 1.0 ms–1 along the narrow shelf from Lofoten and northwards. At the surface the coastal waters may extend all the way to the shelf edge depending on wind directions and strength. Cross-shelf flow are guided by bottom topography with semi-permanent eddies above bank structures and troughs such as the Haltenbanken and the Traenadjupet, and anti-clockwise circulation inside Vestfjorden. At the entrance to the Barents Sea the NCC turn east while the NASC bifurcates with branches entering the Barents Sea or continuing toward the Fram Strait.
Note that the timing of C. finmarchicus egg production is found to be triggered by the phytoplankton spring bloom and that nauplii do not start feeding until stage 3 (Melle and Skjoldal, 1998). According to Head et al. (2015) stage duration from spawning to nauplii stage 3 varies from about 25.5 days at 0.36°C to 12.8 days at 4.8°C. Hence, at temperatures typical for the Norwegian continental shelf during spring, increasing from about 5°C close to the coast to about 8°C near the shelf edge and the NASC, the duration from spawning until the C. finmarchicus offspring require food is on the order of 10 days.
Larval Northeast Arctic Cod Individual-Based Lagrangian Model
We seed cod eggs evenly out over the spawning season by releasing 1,000 particles every 3rd day at 30 m depth at each of the 9 defined SGs covering 8 by 8 km through the spawning period from March 1st to April 30th (Figure 1; Ellertsen et al., 1989; Sundby and Nakken, 2008) amounting to 189,000 particles. Positioning of particles representing eggs and larvae are updated every 12 min, corresponding to twice the internal time step of SINMOD, according to modeled ocean currents and a 4th order Runge-Kutta advection scheme. Particles at first resemble eggs drifting at depths according to their individual buoyancies and modeled vertical mixing following the numerical scheme by Thygesen and Ådlandsvik (2007). The temporal varying individual buoyancies of eggs are quantified as the density difference between the eggs (individual random number drawn from a normally distributed salinity equivalent with mean and standard deviation 31.25 ± 0.69 unchanged through the egg stage; Myksvoll et al., 2011) and the ambient water. The eggs hatch according to individual modeled temperature exposures (Geffen et al., 2006) and continue as larvae (see Supplementary Information). The larvae migrate diurnally between 5 and 40 m depth according to their individual sizes and light conditions, i.e., seeking upwards whenever ambient light is below 1.0 μmol photons m–2s–1 and down if ambient light is equal or above this threshold (Opdal et al., 2011) with a swimming speed of 1.0 body length s–1. Surface light is calculated as a function of day of the year, time of the day and latitude (Skartveit et al., 1998). Individual ambient light for the larvae is a function of the surface light and the diffuse attenuation (see Supplementary Information).
Larvae are initiated at the size of 45 μg (Folkvord, 2005) corresponding to a length of about 4 mm. Gape size of cod larvae is set to 8% of larval length (Fiksen and MacKenzie, 2002). This allows first-feeding larvae to feed upon C. finmarchicus of sizes up to 0.32 mm, corresponding to nauplii stage 2 at most (see Kristiansen et al., 2007 for C. finmarchicus lengths). Larval cod growth is temperature-dependent according to growth models by Folkvord (2005) and Björnsson et al. (2007) combined at 400 mg (see Supplementary Information), if not limited by prey consumption (see Figure 2 for larval growth for 90 days under various fixed temperatures and SI for growth equations). From 75 days post hatch the growth is set to the temperature-dependent potential as the abundance of C. finmarchicus no longer is limiting alone due to a more complex diet. After about 3 days of food-unlimited growth past hatch the larvae are able to feed upon nauplii stage 3 if the ambient temperature is 5°C. At 12 days past hatch in the same temperature the larvae can even feed upon nauplii stage 4. Stage-dependent size categories of C. finmarchicus are taken from Kristiansen et al. (2007). Figure 2 shows the size of NEA cod larvae for fixed temperatures ranging from 1 to 11°C and the corresponding ranges of C. finmarchicus nauplii 2–6 and copepodites 7–12 available as prey limited by the gape size of cod. Under fixed temperatures larvae do not reach 18 mm within 90 days if not experiencing temperatures of above nearly 5°C (Figure 2). E.g., a larvae growing at 5°C requires about 85 days from hatching to reach 18 mm, while at 8°C this would only take about 50 days. Food is stored in the larval stomach (set to 6% of larval weight) and may to some degree buffer variable food conditions. The feeding process is formulated based on parameter values from laboratory experiments on cod in Fiksen and MacKenzie (2002) and repeated in a numerical sensitivity study in Kristiansen et al. (2007). It includes quantification of encounter and capture for each prey stage (see Supplementary Information). According to Fiksen and MacKenzie (2002), the capture probability is set to 1 for prey-predator length up to 0.3, thereafter decreasing linearly from 1 to 0 for ratios between 0.03 and 0.09 but set to 0 for all ratios above 0.08. Metabolic costs (see Supplementary Information) are calculated according to Lough et al. (2005) and increase with increasing light due to enhanced feeding activity and predator escape (Lough et al., 2005; Kristiansen et al., 2007).
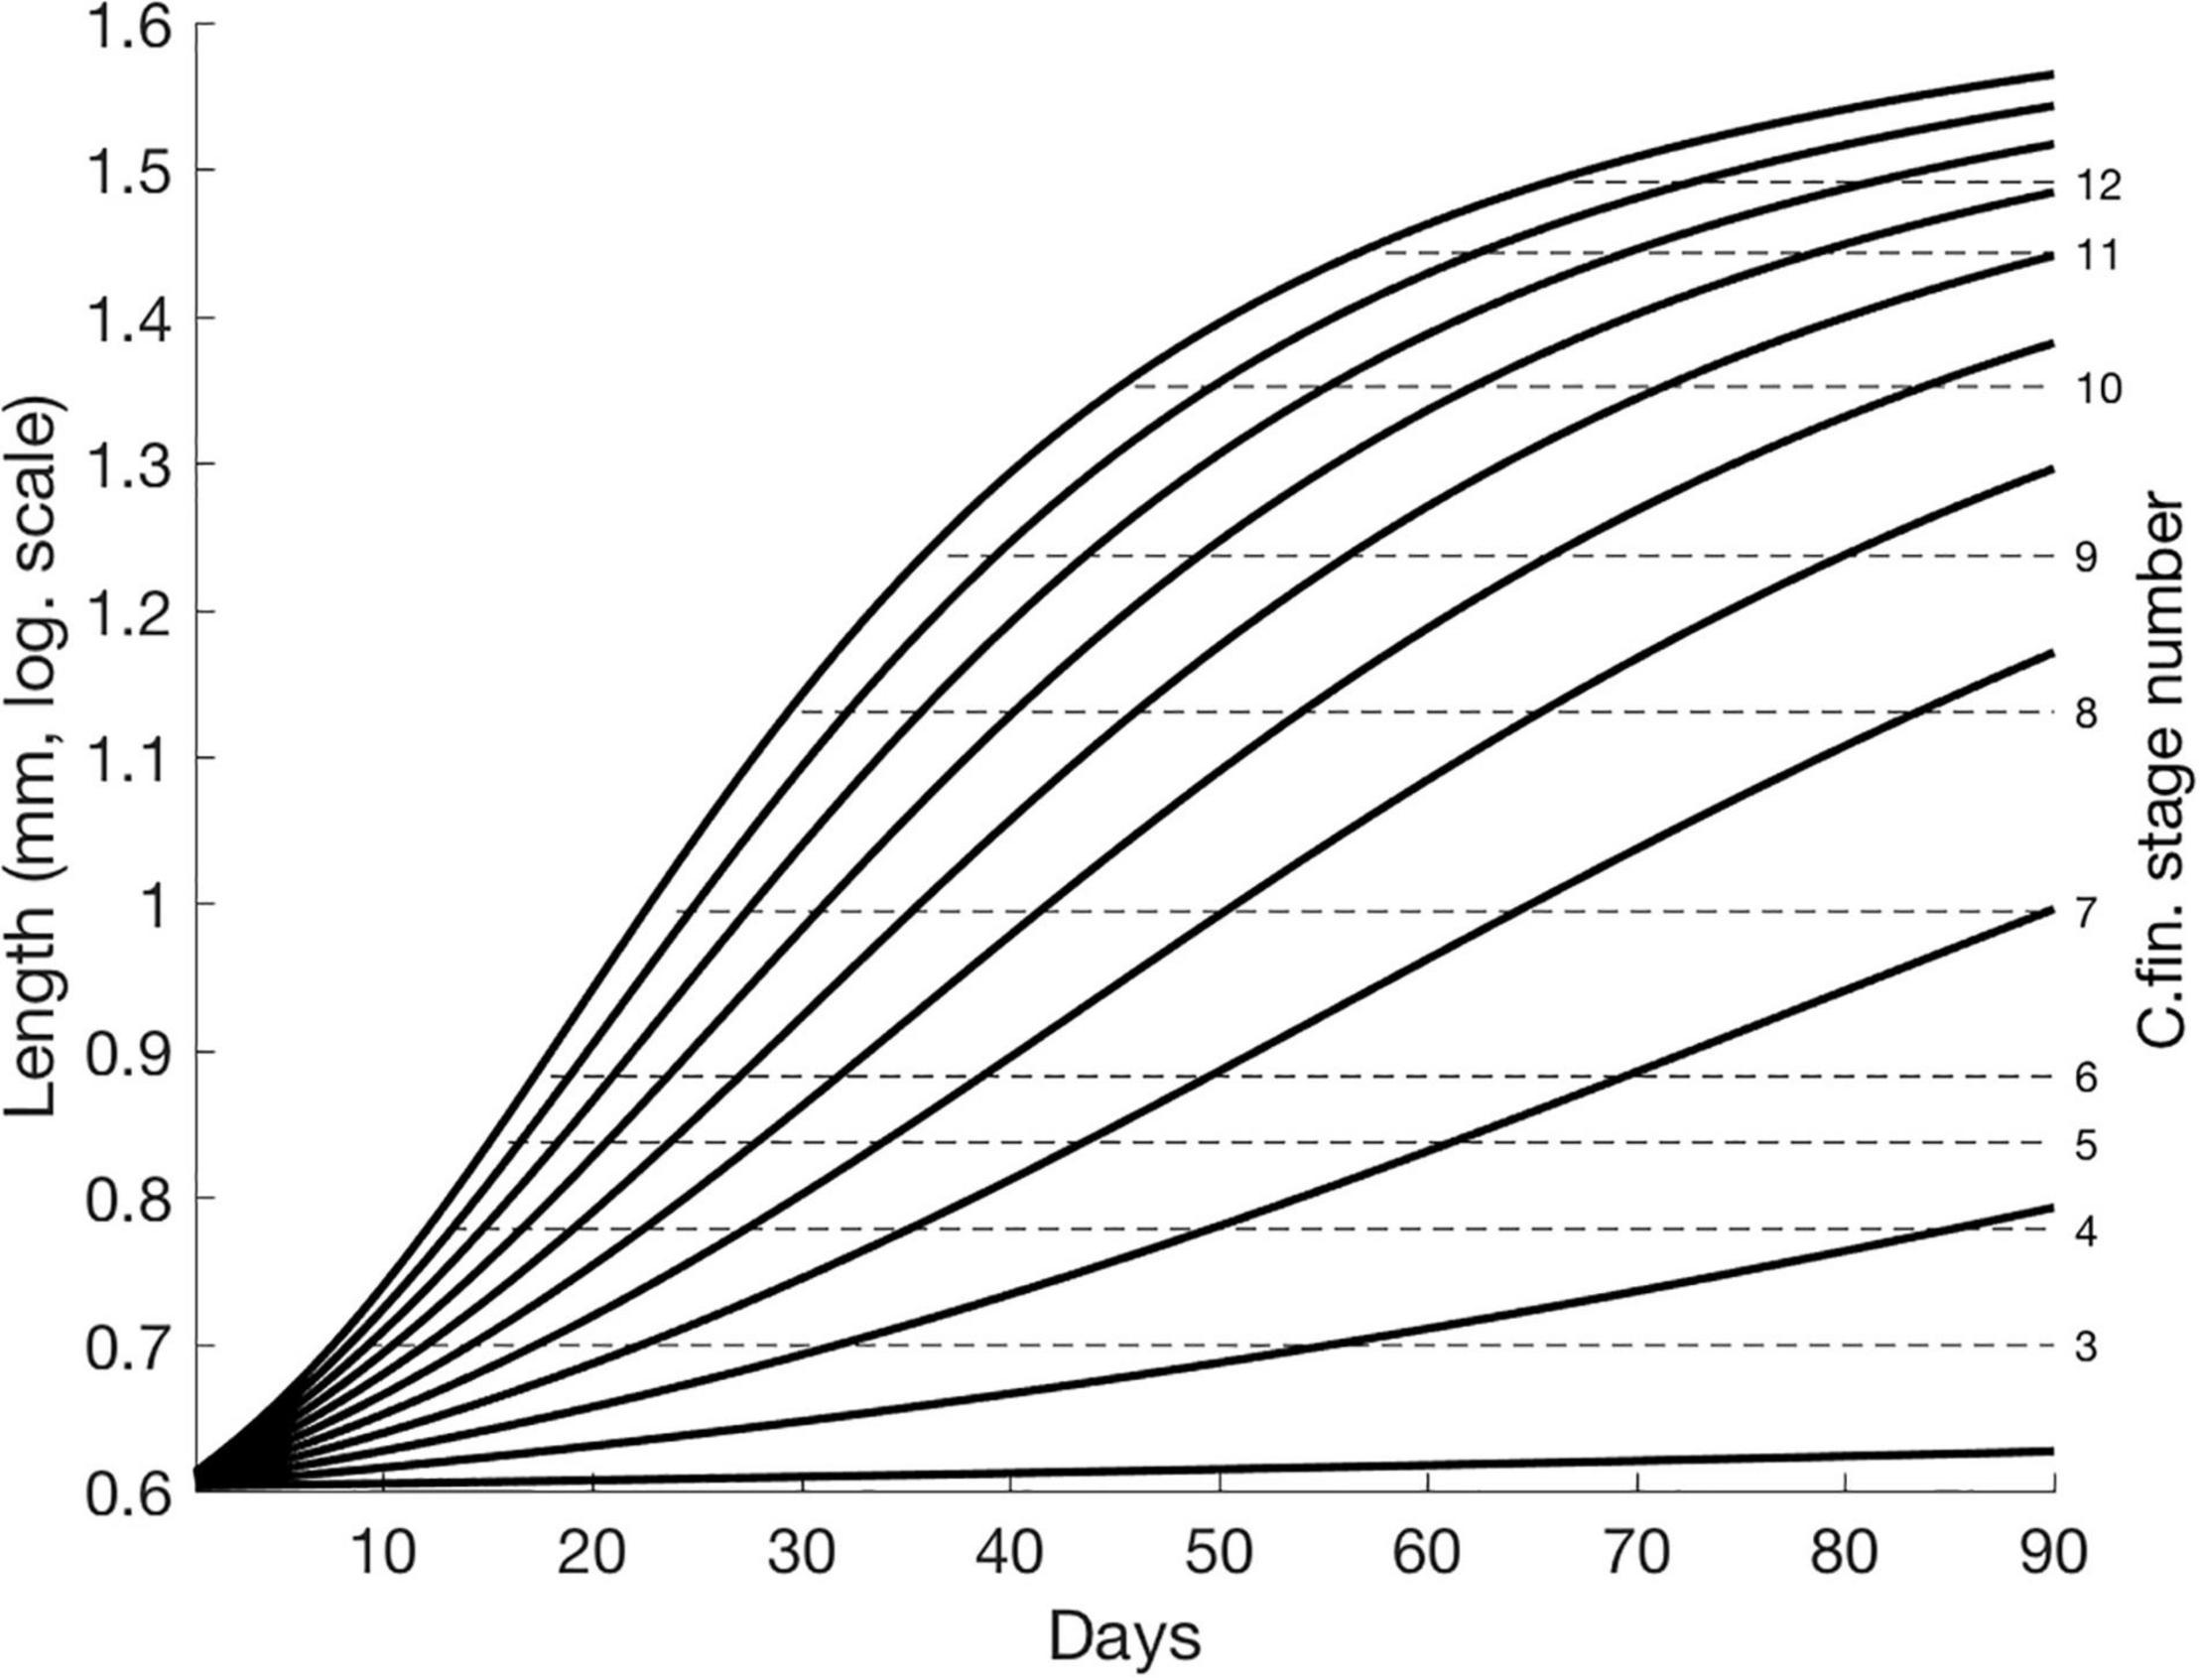
Figure 2. Larval growth (logarithmic scale) according to Folkvord (2005) for fixed temperatures ranging from 1–11°C and corresponding upper threshold of available C. finmarchicus nauplii (1–6) and copepodites (7–12) stages limited by the copepod size and larval gape size. Note that newly hatched larvae are here initiated at lengths of about 4 mm. Assuming their gape size is 8% of their length enable them to initially feed upon nauplii stage 2.
The NEA larval cod IBM has been assessed by comparing model and in situ measurements in the Vestfjord by Kristiansen et al. (2014). The larval IBM replicates vertical positioning of larvae and demonstrate the importance of turbulence-enhanced growth necessary to maintain net growth at depth with reduced prey and light availability.
Results
Drift Trajectories
Particles representing eggs/larvae drift according to the modeled currents from the SGs along the coast toward the nursery grounds in the Barents Sea (Figure 1, here only showing 2001, see Supplementary Information for additional years). Drift trajectories reflect well-known circulation features at the shelf flowing north along the coast with some cross-shelf dispersal and retention resulting from bank structures and troughs, and anti-clockwise circulation inside Vestfjorden. Dispersal from the Lofoten area and northwards features strong laminar flow on a narrow shelf, only about 10 km wide immediately downstream of Lofoten.
Spatial C. finmarchicus Abundance
Figure 3 shows smoothed modeled logarithmic abundances of nauplii stages 3 and 4 per grid cell along the Norwegian Coast in the drift routes of the NEA cod larvae at April 1st (upper panels) and May 1st (lower panels) for 1995, 2001, and 2002. The smoothing of abundances of nauplii 3 and 4 per grid cell is done by diving the number of nauplii in each grid cell across 5 by 5 grid cells according to a bell-shaped function. Abundances at April 1st, at the peak of NEA cod spawning, are mostly between 10 and 100 individuals per liter, though displaying strong horizontal gradients across eddies, filaments and fronts. North of 66°N the highest values are found in the core of the NCC and at the shelf edge, while farther south the C. finmarchicus are spread more out across the shelf. Downstream of the Lofoten, the elevated values coincide with a topographically steered rapid shelf edge current draining the wider upstream distributions. At May 1st, about 14 days after peak hatching of NEA cod eggs, there are still abundances up to an order of 100 per liter, but these now appear mostly off the shelf (and only to the northwest in 2001 and 2002). In particular, the areas to the south and close to the coast in the core of the NCC have low abundances of nauplii stages 3 and 4.
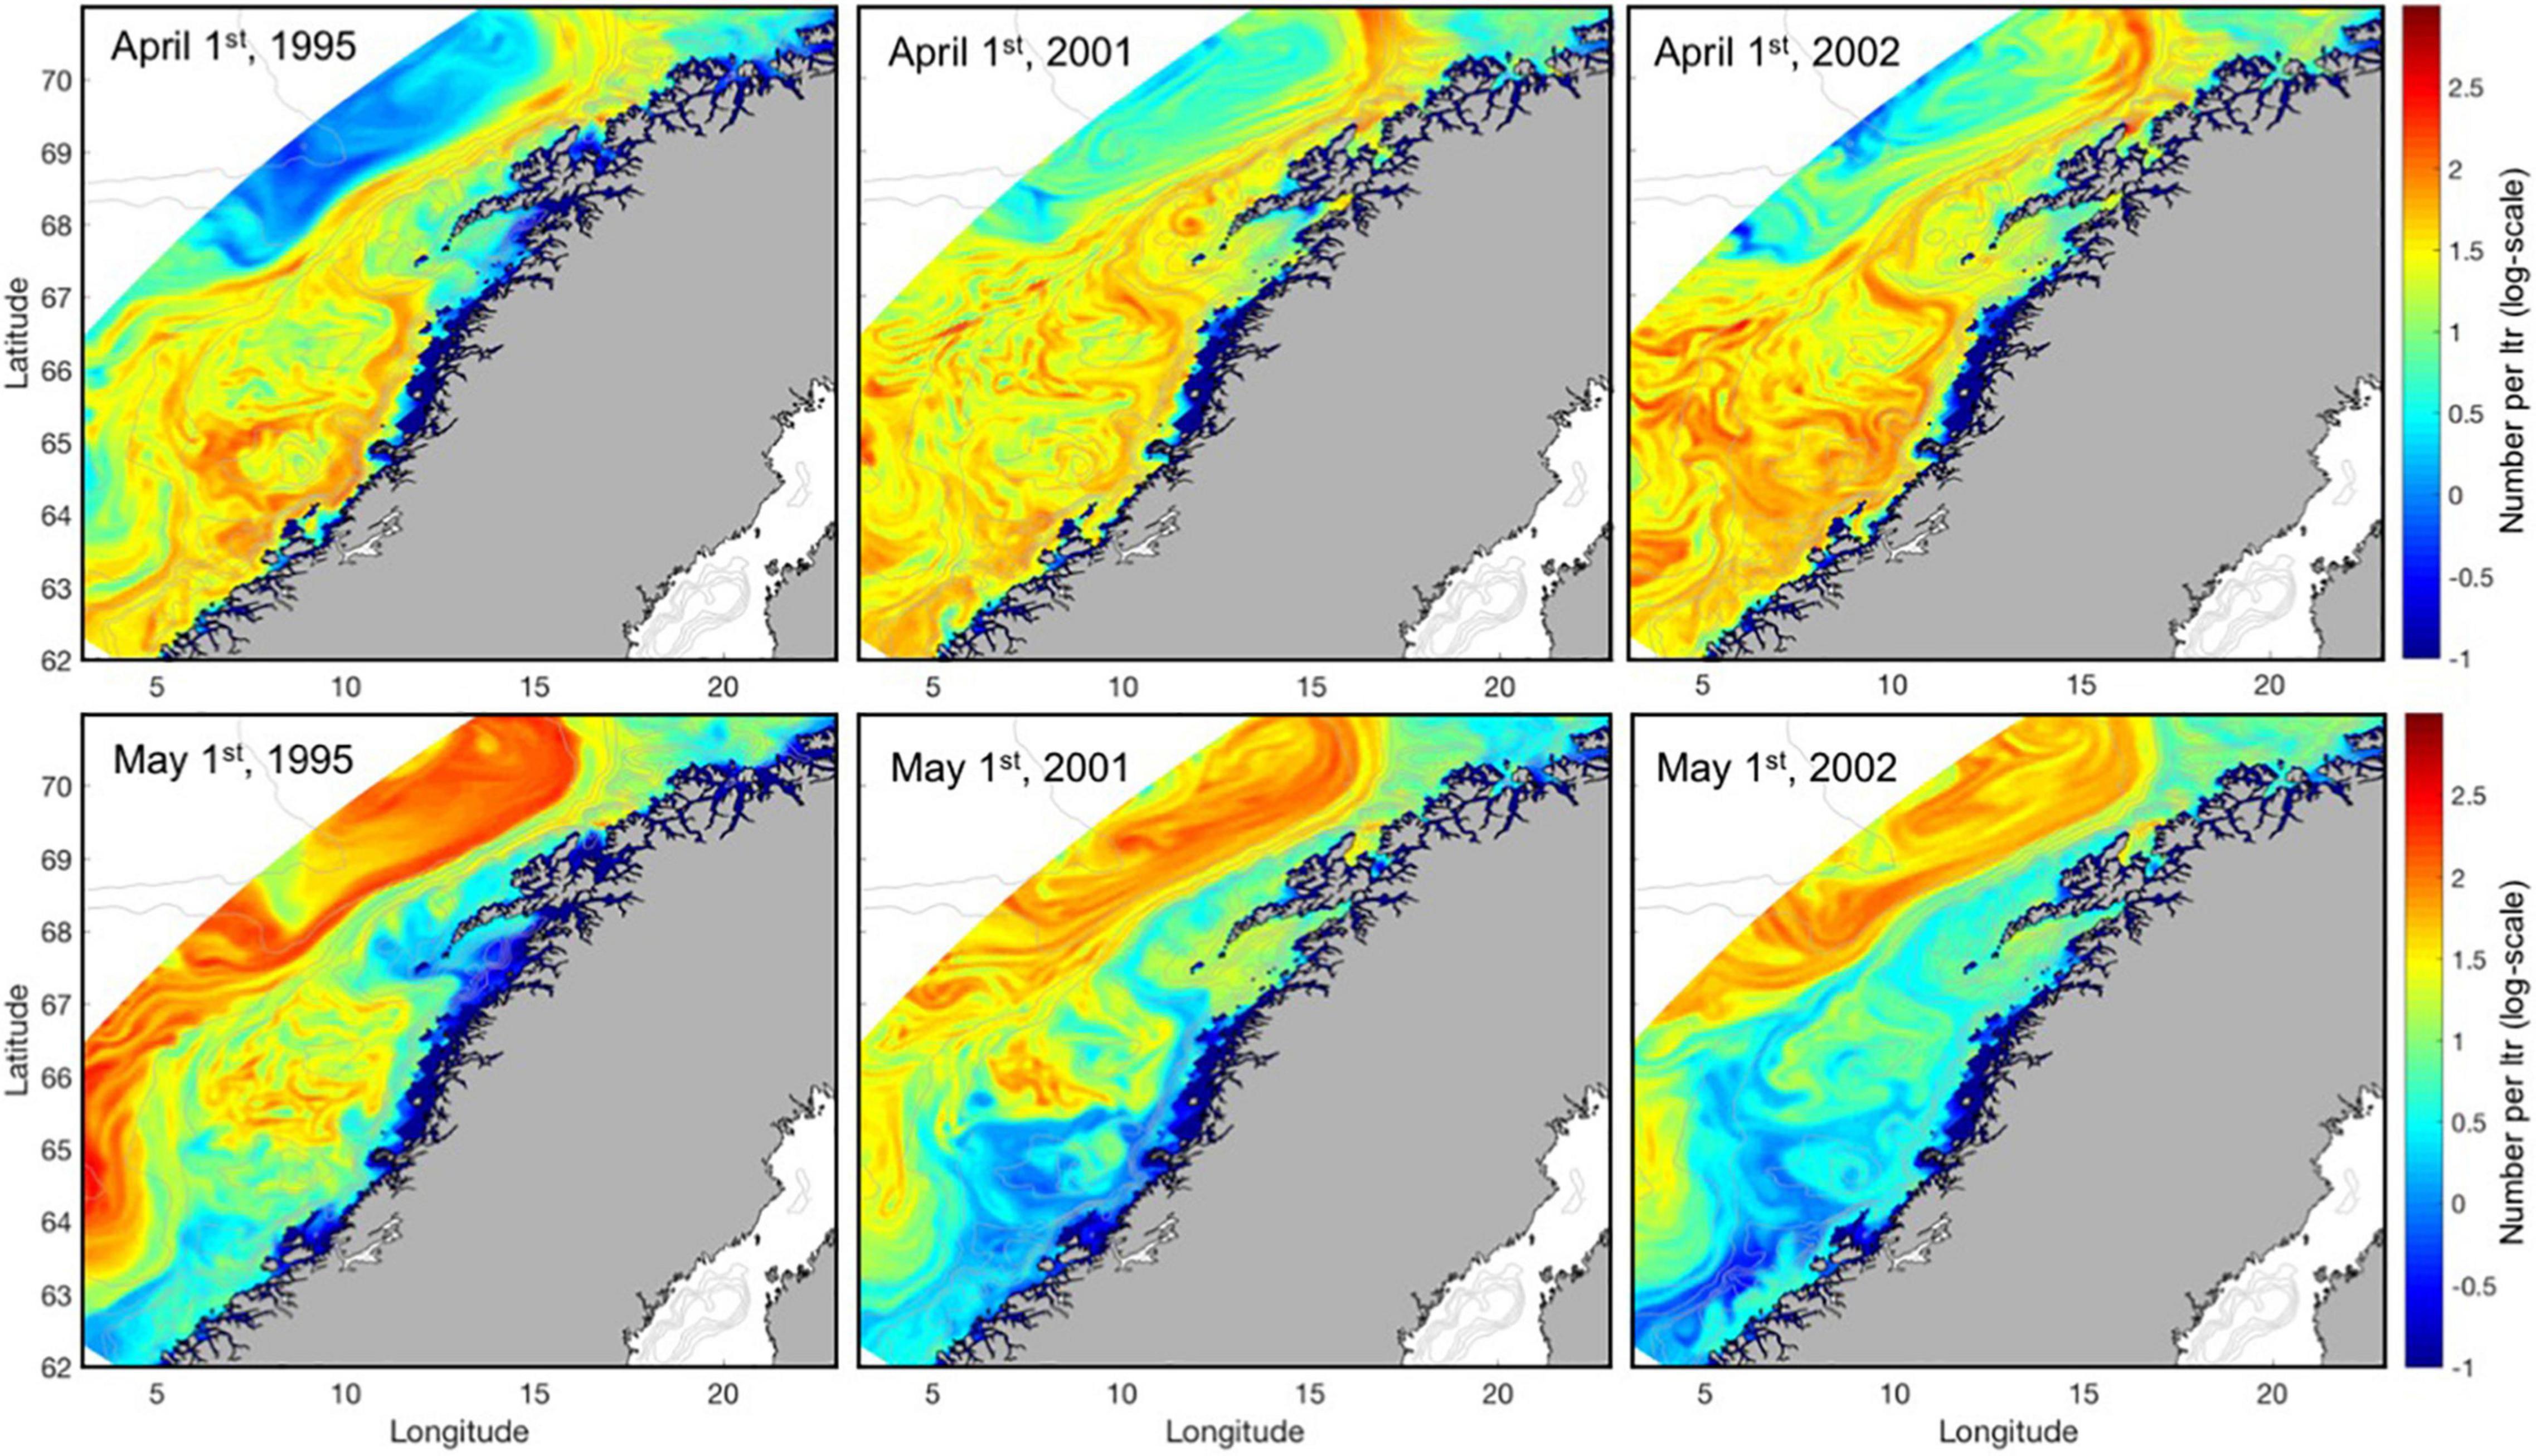
Figure 3. The logarithmic sum of C. finmarchicus nauplii abundance per liter for stages 3 and 4 when distributed homogeneously across a 10 m water column at April 1st (upper panels) and May 1st (lower panels) for 1995, 2001, and 2002 (left to right).
Temporal C. finmarchicus Abundance
At the SGs 2, 5 and 8 (here highlighted to contrast different latitudes) of NEA cod, the maximum abundances of stage-specific C. finmarchicus decrease with increasing size fractions from about 100 to 1 per liter (Figure 4, left panels, only showing 2001). Also, there is a clear delay in the peak of the larger size-classes of C. finmarchicus reflecting the time it takes to develop under the various temperature regimes, typically at a minimum around March-April before the seasonal heating starts. The single vertical lines in the panels indicate times of phytoplankton spring bloom as derived from remote sensing data (Vikebø et al., 2019). Generally, these indicate a delay in spring bloom along the coast, but the value far north (SG8) should be considered with care since it is only based on few data points due of the narrow shelf. The onsets of C. finmarchicus egg productions occur earlier than the phytoplankton spring bloom, but the peak of the nauplii stage 3 production is immediately after or concurrent except for SG 8.
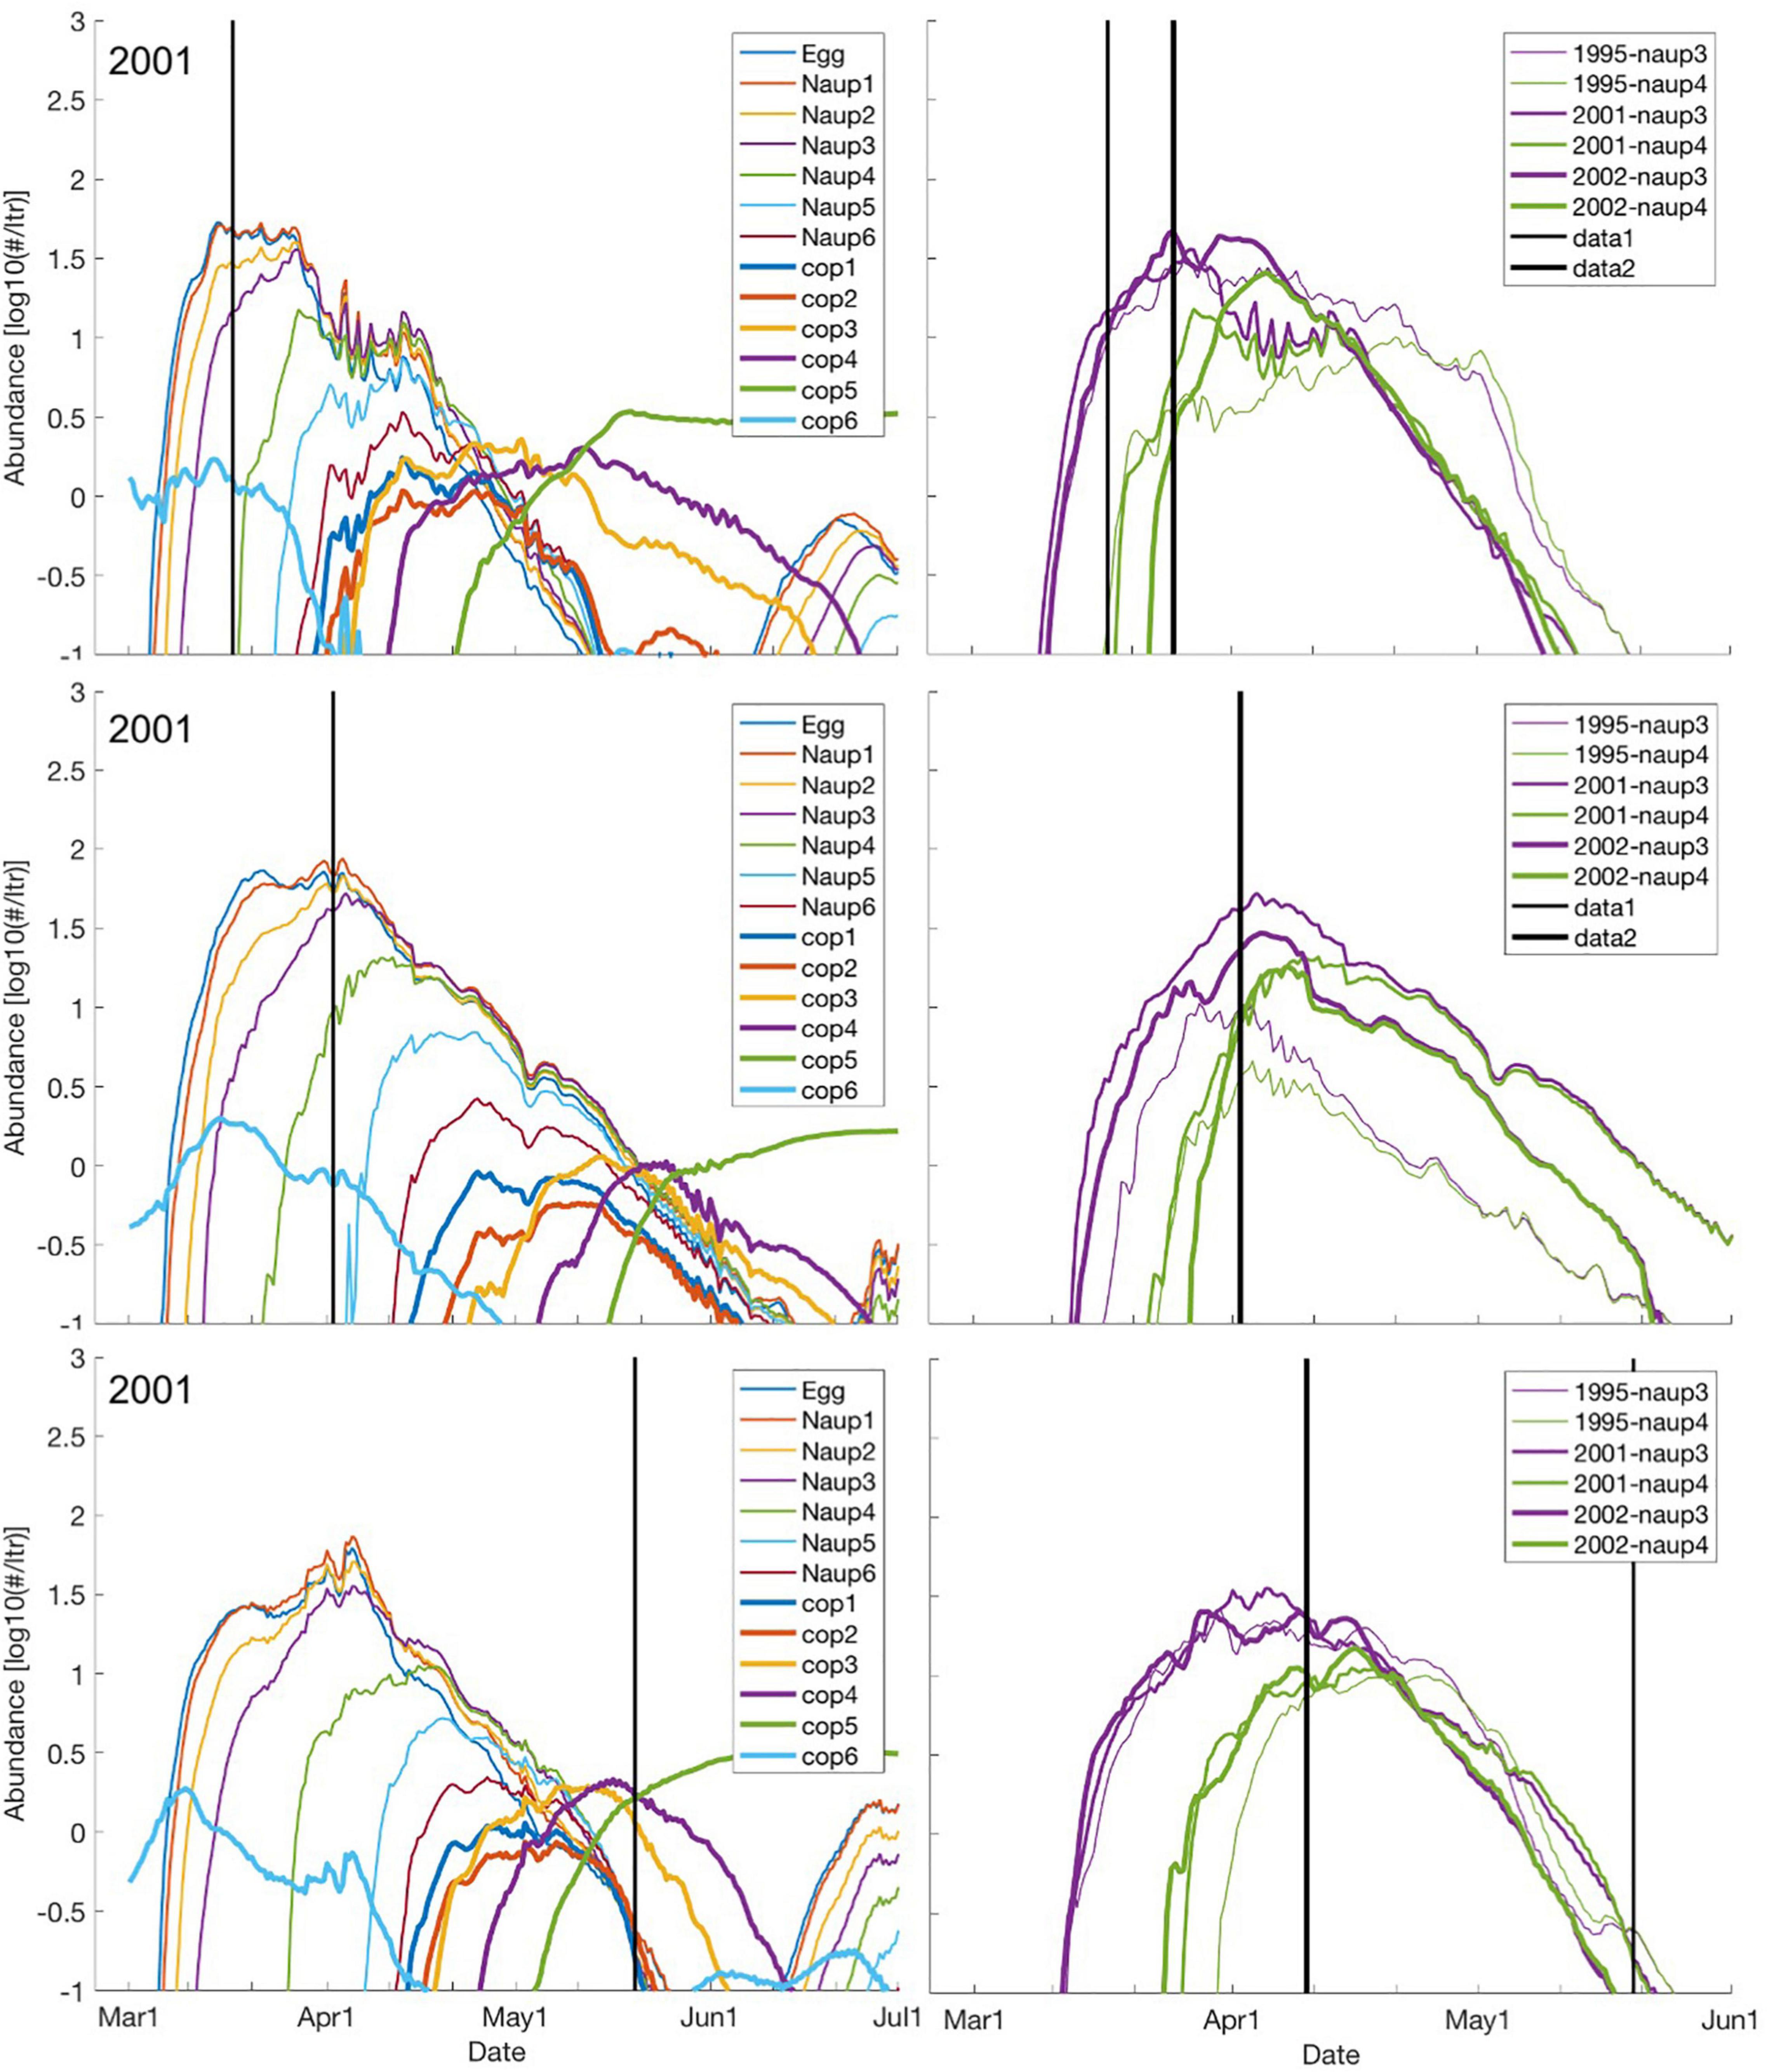
Figure 4. Abundance at each nauplii and copepod stages for the SGs 2, 5, and 8 (upper, mid, and lower panels) during March through June for 2001 (left panels) when distributing C. finmarchicus across a 10 m water column. The vertical lines indicate time of spring bloom onset according to remote sensing data (Vikebø et al., 2019). Corresponding abundances for nauplii stages 3 and 4 but for the years 1995, 2001, and 2002 (right panels). Note that the SeaWIFS or MODIS data used here do not cover 1995, the onset of spring bloom inferred from the remote sensing data is concurrent for 2001 and 2002 at SG 5 and that the onset of spring bloom is suspiciously late at SG 8 in 2001 likely due to a combination of few data points at the narrow shelf and cloudiness.
Contrasting SGs 2, 5, and 8 shows that; (i) initiation of egg production and time to reach 10 eggs per liter is only a few days earlier in the south, (ii) to the north the development into the various nauplii stages is more gradual and the length of the stage durations are prolonged compared to the south, (iii) in particular, the tail of the curves show that presence of the various size fractions endures much longer at SG 5 representing the key spawning area of NEA cod. In fact, egg and nauplii stages 1–5 endure at concentrations above 3–4 individuals per liter until early May, almost 3 weeks longer than farther south.
Comparing nauplii stages 3 and 4 (the most relevant to first-feeding larval fish) across all years confirms that the findings for 2001 are representative also for 1995 and 2002 (Figure 4, right panels). However, 1995 stands out, with both nauplii stages enduring longer than for the other years at SG2. Contrary, at SG5 the concentrations of nauplii stage 3 and 4 drop late March and provide at least 3–4 individuals per liter in 2–3 weeks shorter than for 2001 and 2002. At SG8 inter-annual differences are generally low. Note that the inter-annual differences in the time of initiation of the various stages are less than the inter-stage differences, while this is opposite for the termination of the various stages.
Growth Performance as Function of Spawning Location and Time
Growth at rates above 90% of the food-unlimited potential according to present size and ambient temperature in more than 90% of the time is mainly achieved by individual larvae and pelagic juveniles spawned until the end of March for SGs from Lofoten and northwards (Figure 5A). The years 1995 and 2001 seem to have better conditions to support such growth rates (combination of prey availability and prey demands as a function of time-varying size and ambient temperatures) as compared to 2002.
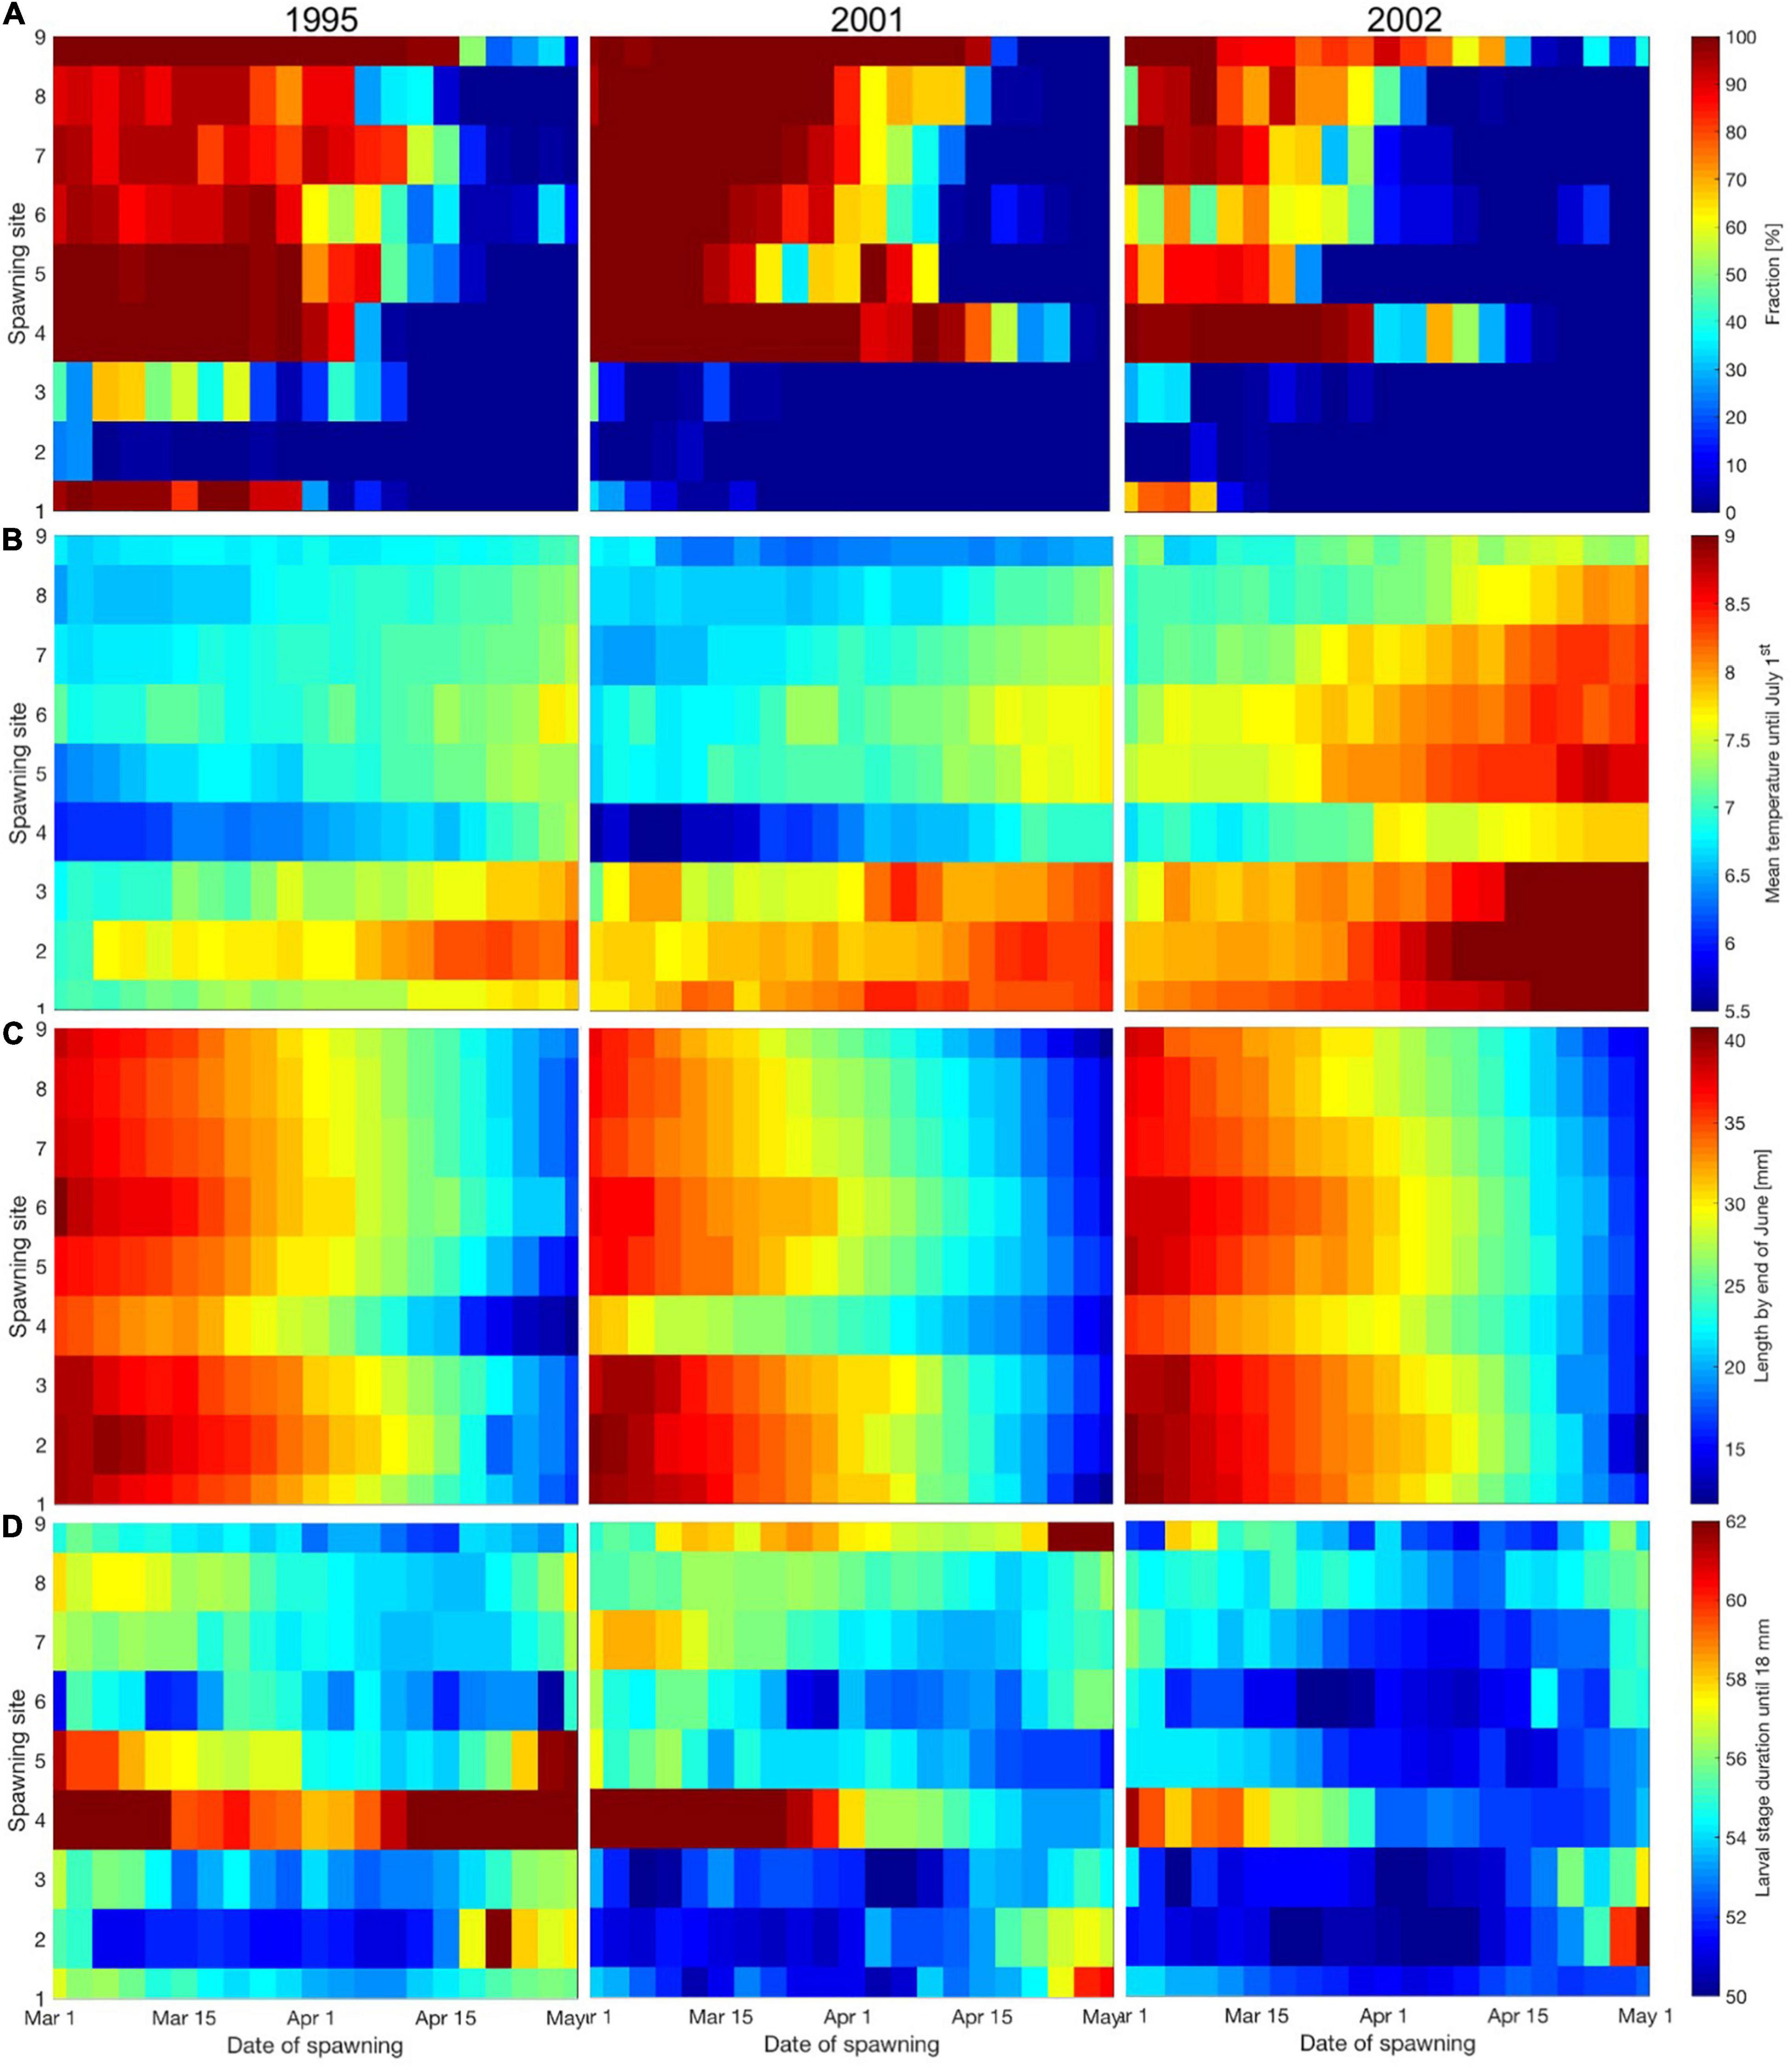
Figure 5. Average (1995, 2001, and 2002) percentages of individual larvae and pelagic juveniles from each SG and ST across 1995, 2001, and 2002 that grow at more than 90% of their food-unlimited potential in more than 90% of the time (A), mean larval ambient temperature (B), larval length (mm) by the end of June (C) and larval stage duration (days) until the size of 18 mm (D).
Mean ambient temperatures from hatching until July 1st in general increase from 1995 through 2001 to a maximum in 2002 (Figure 5B). Also, mean ambient temperatures increase through the spawning season while decreasing with increasing latitude.
Calculating length by the end of June shows that size depends to a larger degree on ST as compared to SG (Figure 5C). There is a minor latitudinal effect where individuals spawned farther south grow faster than individuals to the north. Furthermore, there are only minor differences between the three years investigated.
The time it takes to reach 18 mm (Figure 5D) depends on both the ST and the SG. The minimum time is around 50 days and is achieved by individuals spawned during the early to mid-spawning period in the south and gradually later for SGs farther north. Spawning early or late in the spawning period result in prolonged time to reach a larval size of 18 mm. In 2002 larvae reached 18 mm in fewer days than for 1995 and 2001.
Growth Performance as Function of Drift Trajectories, Temperature, and Prey Availability
The relative occurrences of prey-limited vs. prey-unlimited growth summarized within grid cells along the coast independent of larval size or time of event show that prey limitations are more frequent in areas of elevated current velocities (Figure 6). In such areas, there are up to 2 times more occurrences of prey-limited growth. Contrary, in areas of calmer waters, there are up to 5 times more occurrences of growth according to larval ambient temperature limitations. This is a general feature for all years though variation does occur.
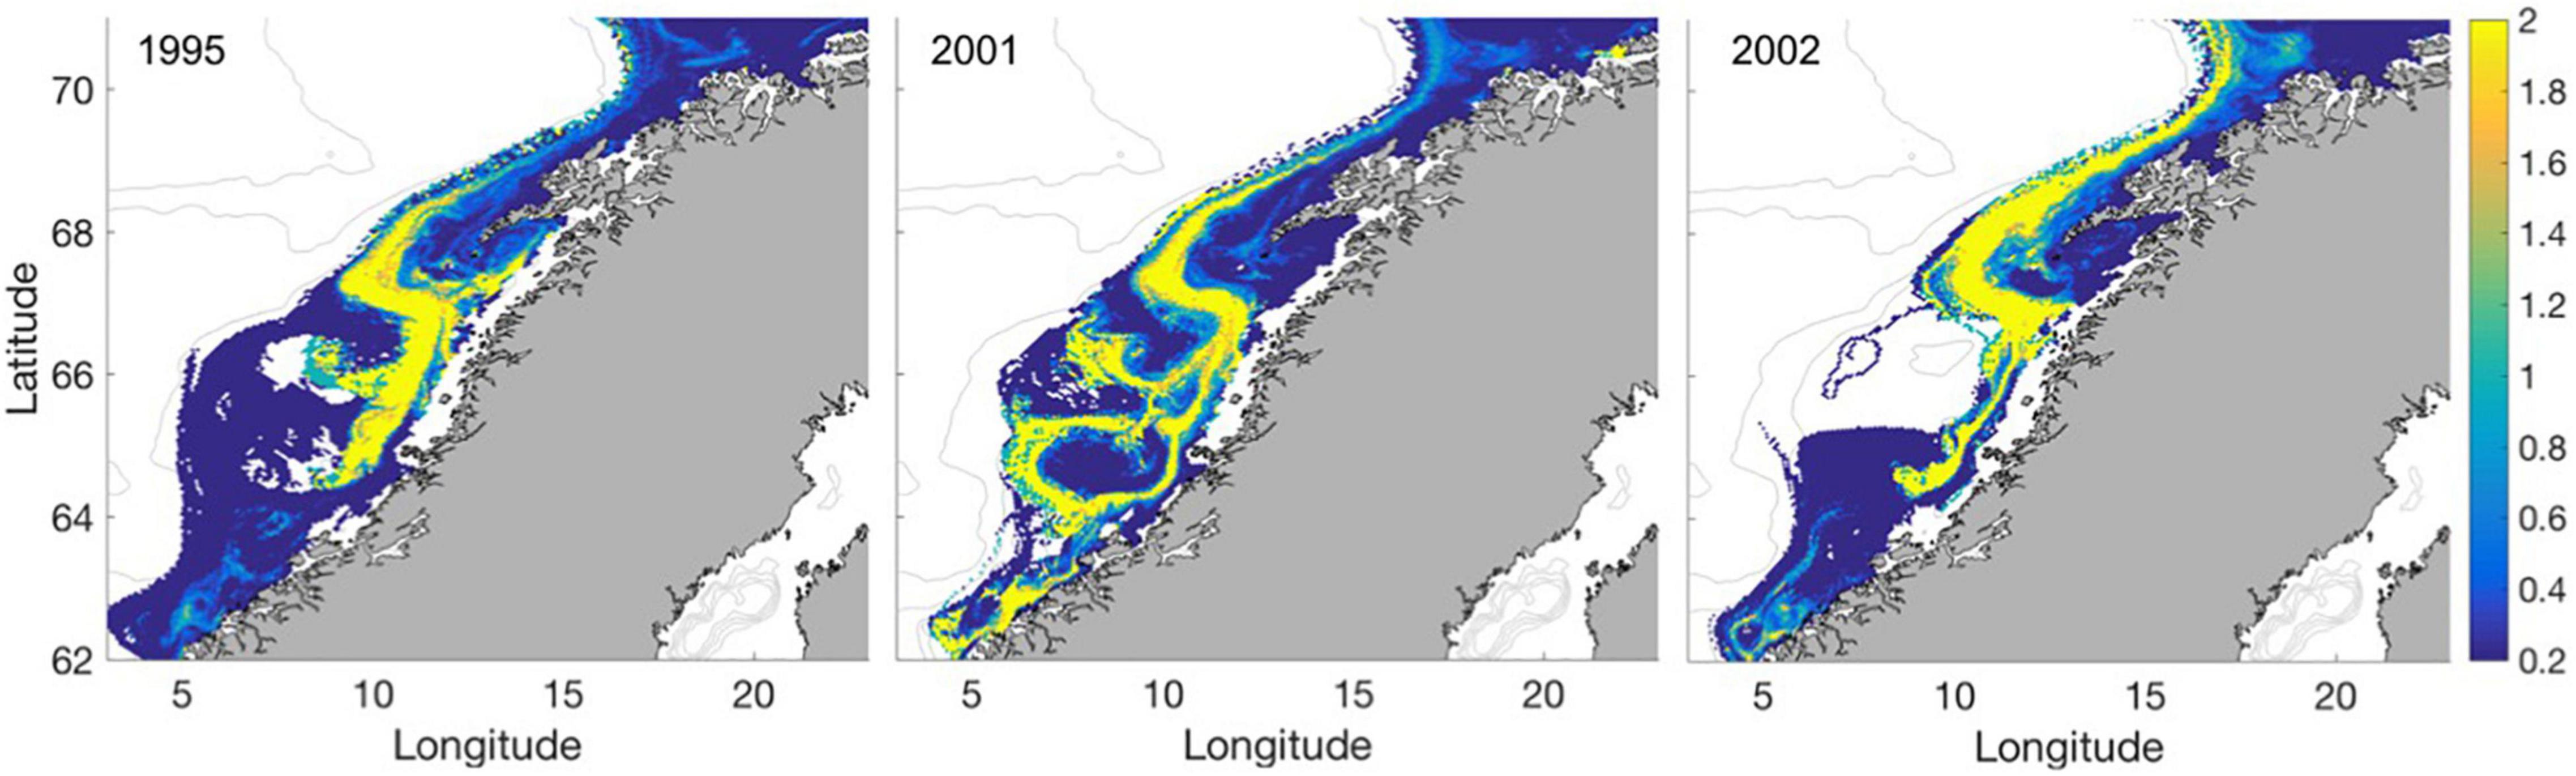
Figure 6. The area-specific fraction of prey-limited growth/non-prey-limited growth for the years 1995, 2001, and 2002. Numbers at 0.2 indicate that there are 5 times more individuals not limited by prey, while 2 indicates that there is 2 times more individuals suffering from prey limitations.
The typical larval ages when growth is prey-limited (Figure 7) in the areas where this is most frequent (Figure 6) are between 40 and 60 days since spawning, i.e., about 25–45 days post hatching (Figure 7). Contrary, individuals experiencing prey-limited growth in areas dominated by prey-unlimited growth are on average older.
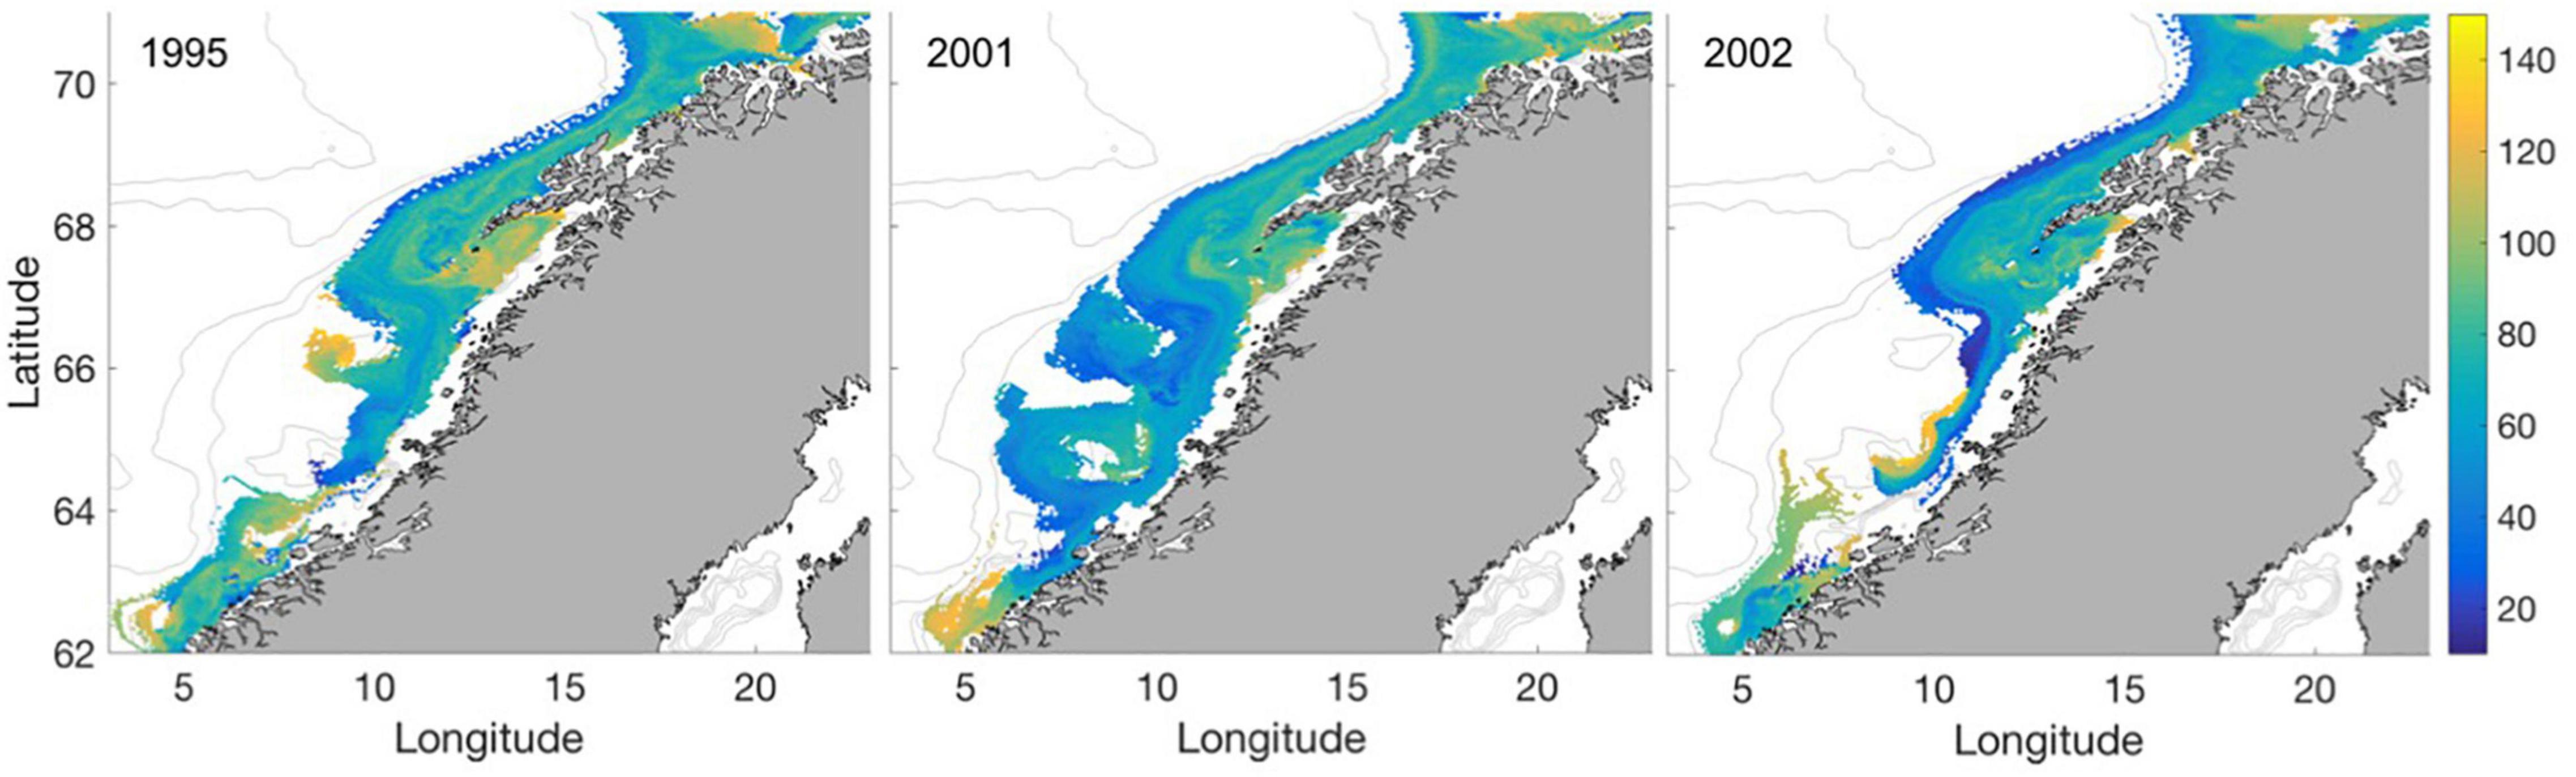
Figure 7. Mean number of days after spawning when growth is prey-limited for the years 1995, 2001, and 2002.
Still, most prey-limited larvae experience similar ambient temperatures as the larvae growing according to their temperature potential (Figure 8), though to a lesser degree in 2002 where it is on average lower. The ambient temperatures vary more for occurrences of prey-unlimited growth simply because this occurs more frequently.
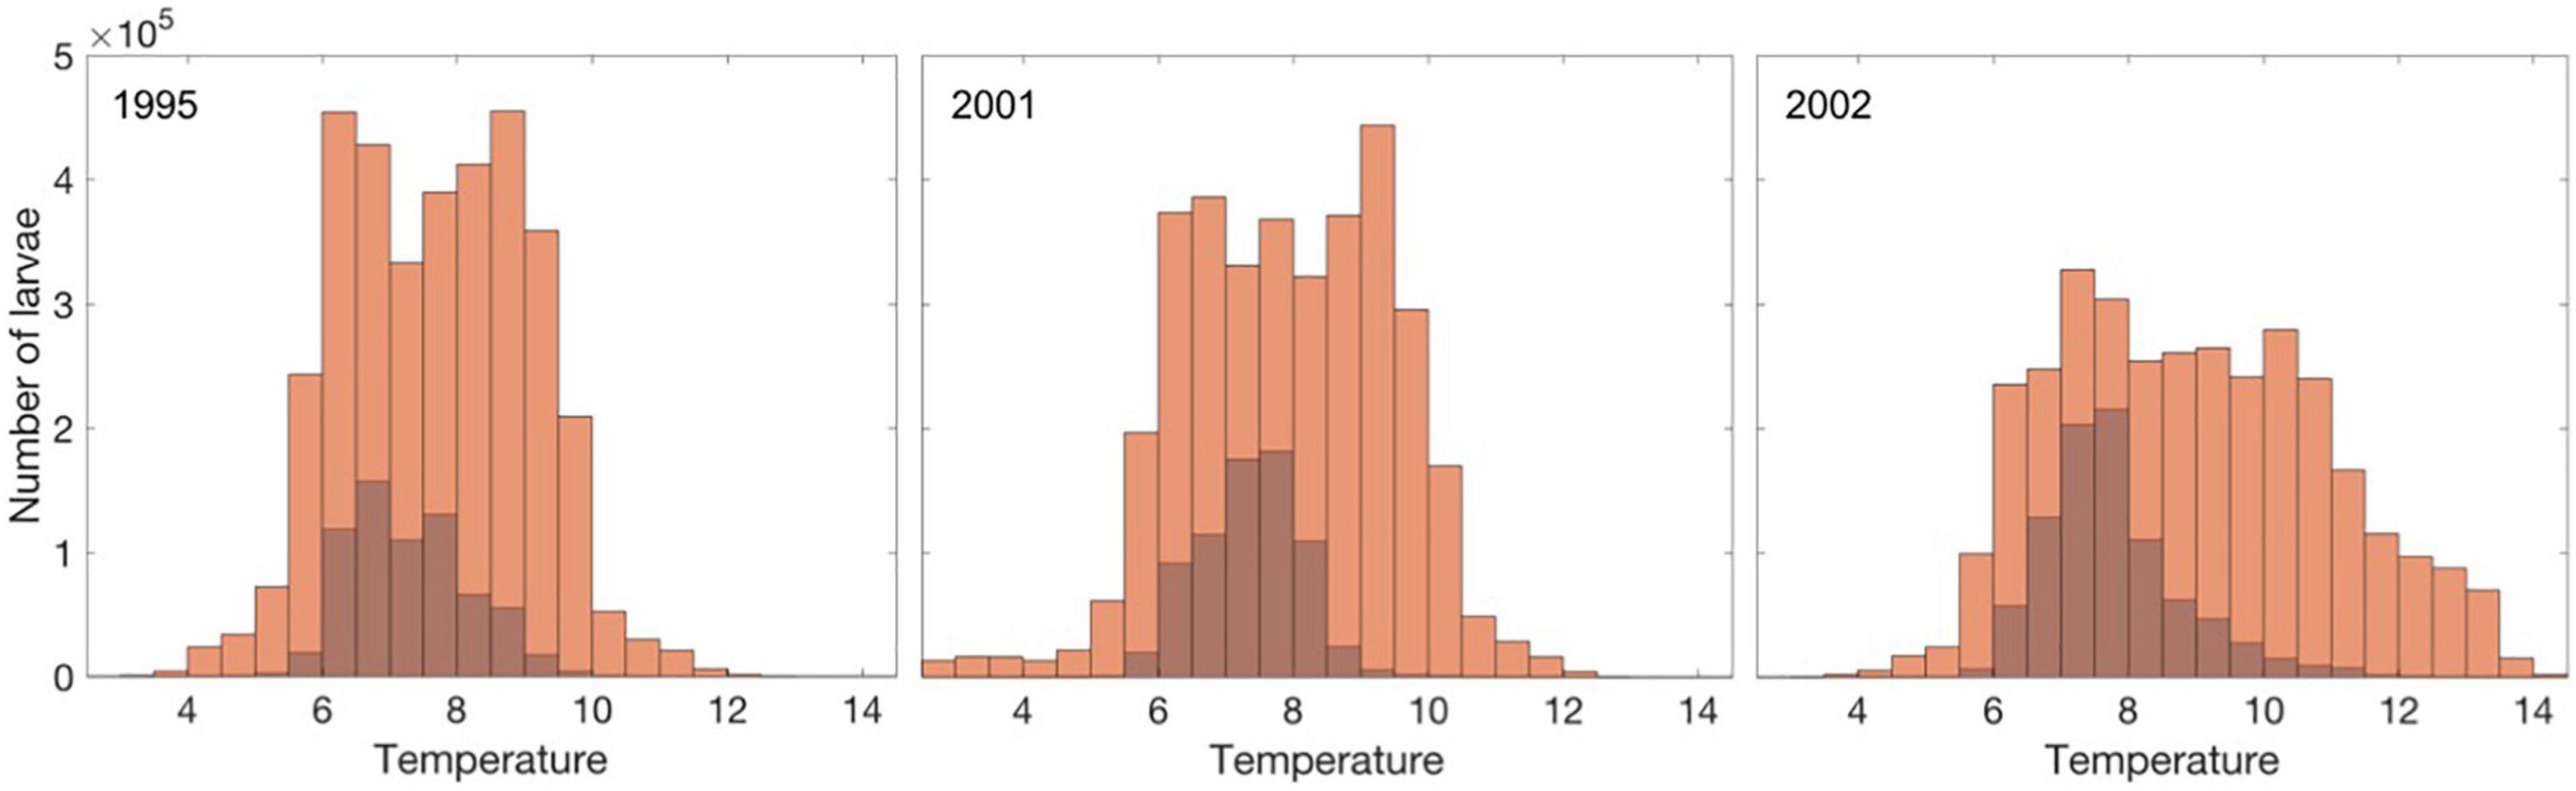
Figure 8. Ambient temperature for individuals growing according to their temperature potential (light brown) and when limited by prey (dark brown) for the year 1995, 2001, and 2002.
However, despite that larvae generally experience high ambient biomass of C. finmarchicus, the larvae growing below their temperature potential are exposed to calanus stages above the size they are able to feed upon (Figure 9, left panel). Hence, these larvae are floating in a sea rich in prey of their preferred type but are not able to fit them in their gapes. The prey is abundant but has outgrown the cod larvae. Larvae growing prey-unlimited are floating in waters of similar prey availability, but more of this prey fit in the larval gapes (Figure 9, right panel).
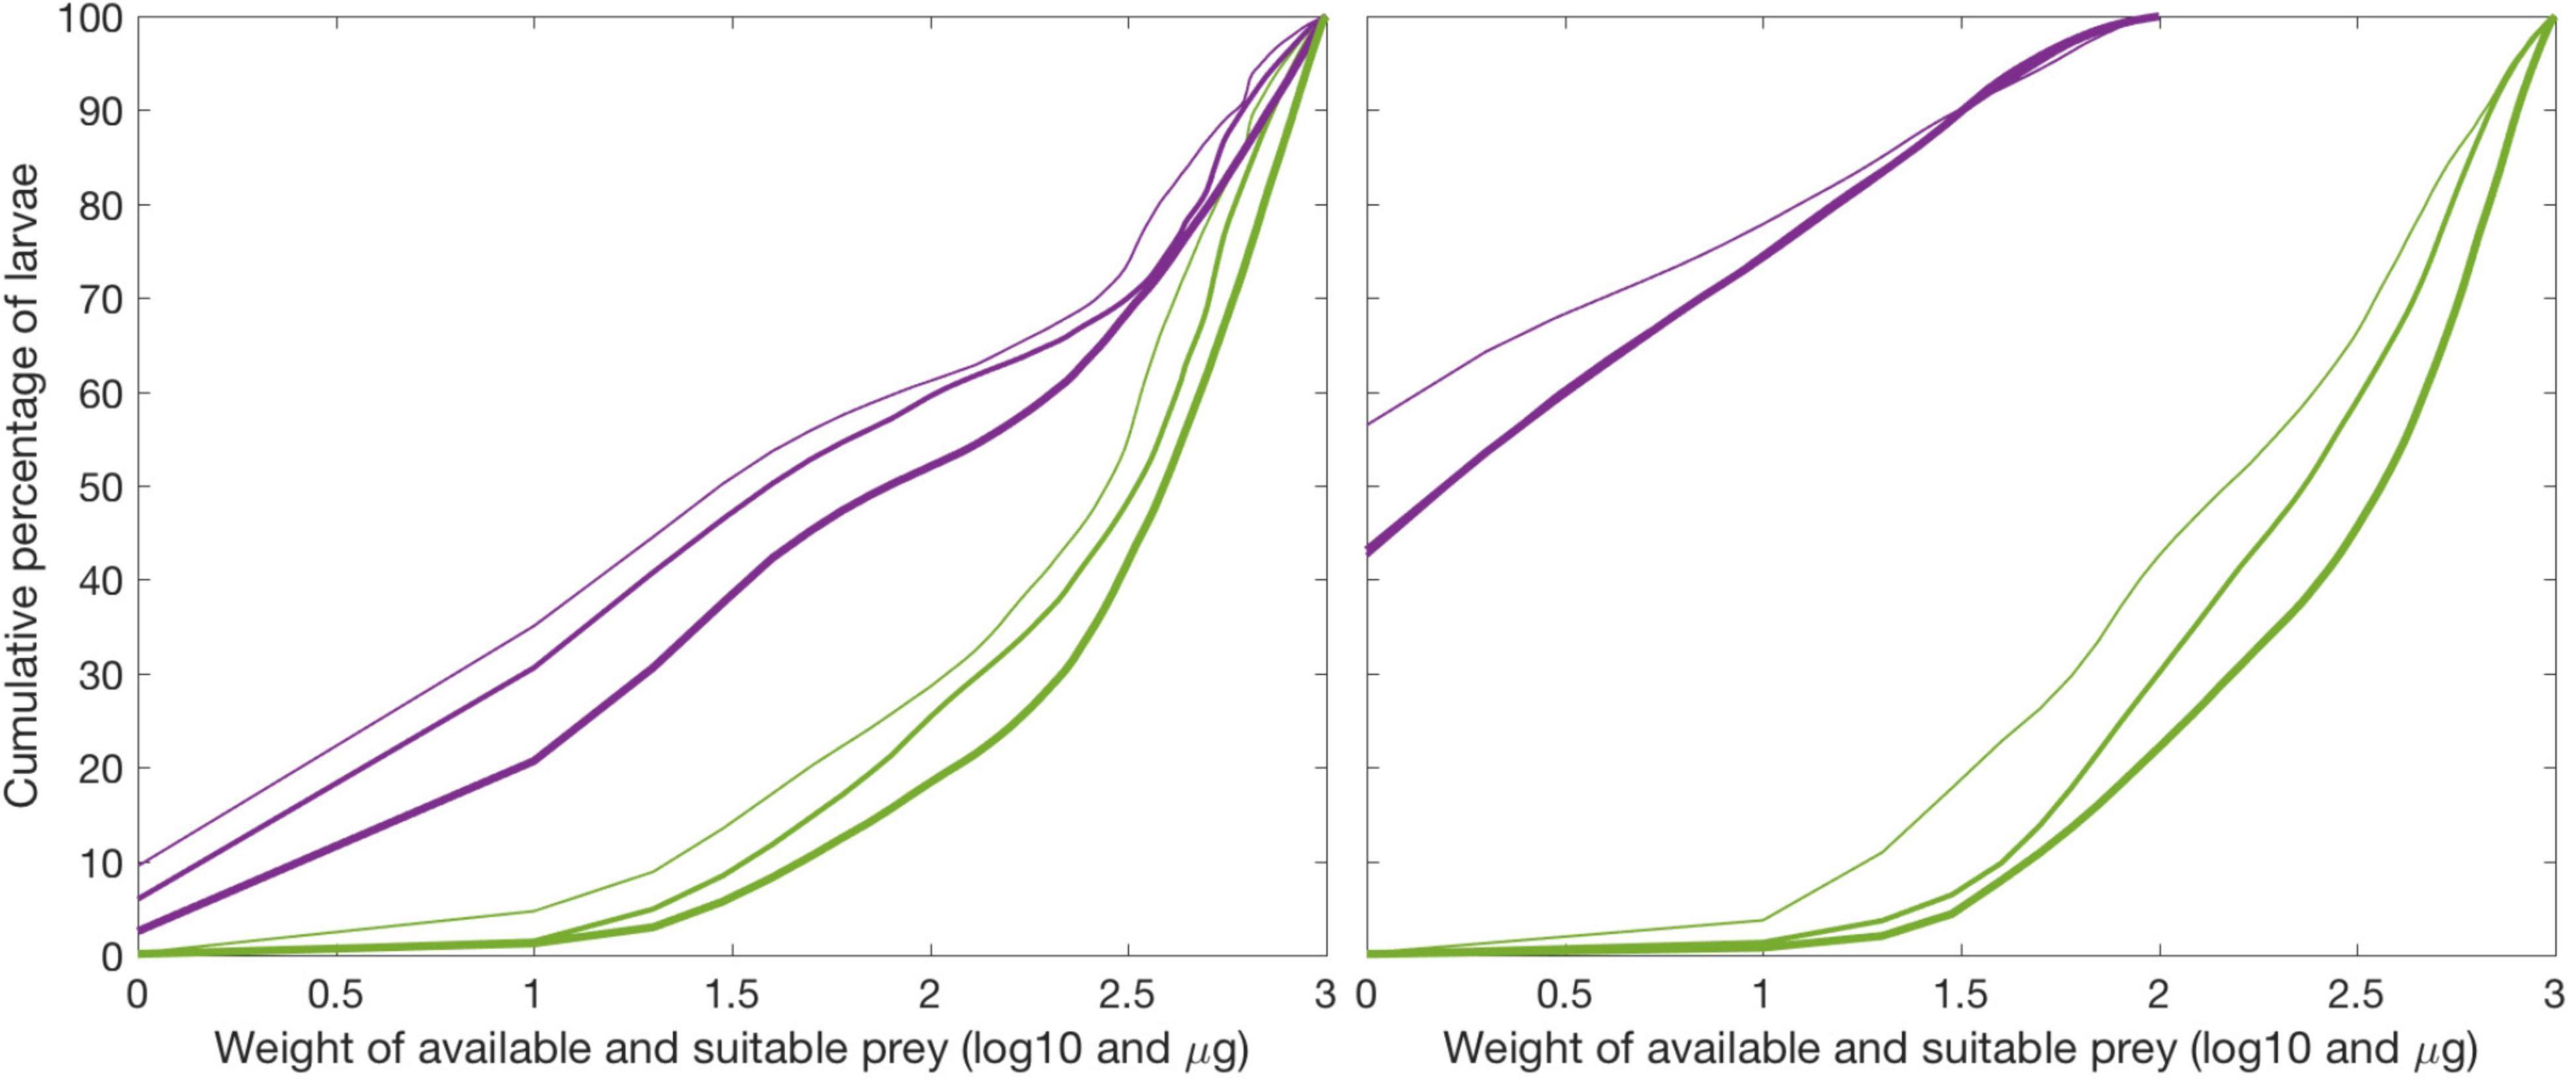
Figure 9. Prey availability for starving larvae (left panel) during 1995, 2001, and 2002 (thin, medium, and thick line) accounting for suitable (magenta) and all (green) prey. Correspondingly (right panel) for non-starving larvae. E.g., left panel shows that about 43% of the larvae experiencing prey-limited growth is surrounded by between about 10–300 μg per liter but none of these have suitable size for the larvae to enable feeding.
Discussion
By running a coupled ocean model, a NPZD-model, and an IBM of NEA cod ELS, we systematically investigate food limitations and growth performance for individual cod larvae drifting along the Norwegian coast for three selected years. The years represent contrasting conditions, but more years are required to generalize our findings. The cod ELS were initiated as pelagic eggs at well-known spawning grounds and drift toward nursery areas in the Barents Sea for the years 1995, 2001, and 2002. The model results confirm the expected seasonal development of C. finmarchicus into larger size fractions but at decreasing concentrations that drift north along the coast. The model indicates only minor delay in C. finmarchicus stage development across latitudes. Furthermore, the duration of stages is longer than the inter-annual variation in onset of each stage, indicating consistent feeding conditions across years. However, the latter may be an underestimate of the variability in phenology, especially since the C. finmarchicus egg production is reported to be tightly connected to the timing of phytoplankton spring bloom (e.g., Melle and Skjoldal, 1998) and the onset of spring bloom is shown to vary by up to a month along the Norwegian coast (Vikebø et al., 2019). More in situ measurements are needed to investigate this (Alver et al., 2016).
Across these years, we find that larval growth is less food-limited for spawning occurring from Lofoten and farther north for the first half of the spawning season and much less so in 1995 and 2001 than in 2002. But if rapid growth is crucial for survival (Houde, 2008) then our model results indicate that both early and late spawned larvae are performing more poorly; early spawned larvae because of low temperatures and late spawned larvae because of less suitable prey. Stige et al. (2019) in fact show that early life size in NEA cod is a better predictor for recruitment than abundance, underlining the importance of fast growth. Though larval size at summer reflects the age of the individual, the time available for predators to truncate the lower size-specter of the larvae is shorter for larvae spawned in the middle of the spawning period, but progressively later with increasing latitude, shifting from late March in the south to mid-April in the north.
Notably, the temperatures and thereby the growth potential is larger farther south but limited by food. Hence, additional energy spent during spawning migration is not rewarded for the offspring in stronger growth if compared to the Lofoten. Sundby and Nakken (2008) show that spawning shifts southwards only in cold periods. We have only tested years during a relatively warm period. But if prey conditions were similar during a cold period then a spawning migration to the more southern SGs could result in stronger growth than SGs farther north because prey requirements would be proportionally lower. That said, SG4 stands out with particularly low temperatures and growth rates. Strand et al. (2019) have previously shown that plankton dispersal is particularly challenging in Vestfjorden where SG 4 is located. This is due to a combination of semi-permanent eddies, tidal pumping through narrow straits, steep surrounding mountains guiding winds and freshwater runoff making it difficult to replicate transport out of the fjord.
Daewel et al. (2011, 2015) show that North Sea cod living at the southern limit of Atlantic cod with ambient temperatures close to its thermal tolerance match poorly with prey during warm years because of rapid egg and larval development and subsequent elevated food requirements while prey phenology is less affected by temperature changes and is therefore not available this early in the season. This is not the case for NEA cod according to the results here, as the model indicates that prey become available already during the first half of March, well in time to support newly hatched larvae also resulting from the earliest part of the spawning period. Contrary, in warm years late spawned cod lack food both because of higher demands under elevated temperatures and because they are partly outgrown by their prey. Hence, our results show that larval ambient temperatures increase across the years investigated here, but that NEA cod ELS are not able to utilize this through enhanced growth. As suitable prey availability does not increase proportionally to elevated temperatures a higher fraction of the larvae grows below their potential in 2002 as compared to the other 2 years.
Across years we see that areas of strong currents are less able to sustain larval growth according to the temperature potential. These areas include the core of the NCC, the shelf edge from the Lofoten and northwards, and occasionally flow around the grand bank structure of Haltenbanken. The prey-limited larvae growth occurs consistently 1–1.5 months after hatching. This shows that C. finmarchicus egg production has ceased and either these stages are washed out of the area or they have grown to older stages. The relatively high-water temperatures to the south will cause this transition through stages to be quicker than farther north. Results here indicate that there is sufficient prey in the waters of these larvae but not in sizes suitable for their gape size. Hence, as we know that prey-limited growth is more frequent to southern and late spawned larvae, the prey must have outgrown the larvae and is no longer available.
The study demonstrates how bottom-up processes can result in variable growth conditions of larvae, likely affecting survival, due to a mismatch in time with suitable prey resources. If survival is rather heterogeneous as compared to homogeneous, then we can expect a more pronounced impact from changes in the environment. This could be either from natural variability in ambient conditions or anthropogenic impacts that negatively affect ELS growth or survival in parts of the habitat. The current well-known spawning behavior of NEA cod (Sundby and Nakken, 2008) suggests that only low-frequency variation in environmental conditions affect spawning intensity, e.g., large-scale latitudinal shift in spawning with decadal variations in temperature. A wide temporal and spatial distribution in spawning could therefore serve the purpose of buffering high-frequency environmental variability. However, we are unable to generalize our findings further toward conclusions on the benefits of having a wide temporal and spatial distribution of spawning activities to buffer natural variability given that our results are for a limited number of years. Note though that Stige et al. (2017) have already shown that a high mean age and stock size in NEA cod result in a high abundance and wide distribution of eggs, but that this does not prove to buffer environmental variability and thereby securing strong recruitment.
The results must be interpreted with care as the models have limited resolution, especially in the spatial dimension, and simplifications of processes and ecosystem structure. These simplifications are due to lack of understanding, limitations in computational power and data to parameterize models. Predation on fish ELS might be important in areas where predators naturally aggregate, e.g., sea bird colonies (Sandvik et al., 2016). There are currently no density-dependent effects in fish ELS due to e.g., competition for C. finmarchicus included in the model used here. Especially at times and areas where prey become limited, here shown to be for early and late spawned individuals and in the areas of strong currents, this may result in even worse feeding conditions for the larvae. Initial conditions for eggs are based on a limited set of survey samples and though we believe this provides representative egg distributions it still introduces uncertainties. Also, we are aware that ocean models typically have challenges representing upper ocean density structures and mixing and that this affect plankton dispersal (Strand et al., 2019). Finally, we have added a diurnal vertical migration but no horizontal swimming behavior of the NEA cod ELS. Fiksen et al. (2007) have shown how dispersal may be affected by larval and juvenile behavior. However, while NEA cod larvae and juvenile diurnal behavior seems to be a feature in the ELS (e.g., Kristiansen et al., 2014), horizontal swimming in a specific direction long enough to significantly affect dispersal is yet not observed.
This work contributes to the further development of model systems for the exploration of fish population responses in connection with the impacts and outcomes of natural processes, anthropogenic stressors and their cumulative impacts (e.g., oil-spills, Langangen et al., 2017; Carroll et al., 2018). From a management perspective, the findings of the present work highlight the need for further process oriented as well as empirically based investigations of known NEA cod spawning areas, that combined with model hypothesis testing, can lead to a better understanding of why certain periods and places along the Norwegian continental shelf seem to be particularly favorable for pelagic drift stages. It is also of critical importance to focus on the role and influence of climate warming toward changing our current understanding of the patterns and processes affecting NEA cod spawning.
Data Availability Statement
The raw data supporting the conclusions of this article will be made available by the authors, without undue reservation.
Author Contributions
FV, OB, CE, and HF were responsible for formulating the hypothesis. FV, OB, CE, HF, and JJ prepared and performed most of the numerical calculations. FV, OB, CE, HF, JC, and ØL were responsible for synthesizing the literature. All authors have contributed to the discussions of hypothesis, methods and results, contributed to the work and approved it for publication.
Funding
Financial support for this project was provided by the Research Council of Norway (RCN# 255487/E40 and RCN #228107) and the industry-funded project—SYMBIOSES III (2019–2022).
Conflict of Interest
OB was employed by the company SINTEF Ocean AS.
The remaining authors declare that the research was conducted in the absence of any commercial or financial relationships that could be construed as a potential conflict of interest.
Publisher’s Note
All claims expressed in this article are solely those of the authors and do not necessarily represent those of their affiliated organizations, or those of the publisher, the editors and the reviewers. Any product that may be evaluated in this article, or claim that may be made by its manufacturer, is not guaranteed or endorsed by the publisher.
Acknowledgments
The simulations were performed on resources provided by UNINETT Sigma2—the National Infrastructure for High Performance Computing and Data Storage in Norway.
Supplementary Material
The Supplementary Material for this article can be found online at: https://www.frontiersin.org/articles/10.3389/fmars.2021.767191/full#supplementary-material
Supplementary Figure 1 | SGs (black stars) and every 100th drift trajectory of eggs/larvae from spawning until late July during 1995.
Supplementary Figure 2 | SGs (black stars) and every 100th drift trajectory of eggs/larvae from spawning until late July during 2002.
References
Akimova, A., Hufnagl, M., and Peck, M. A. (2019). Spatiotemporal dynamics of predators and survival of marine fish early life stages: Atlantic cod (Gadus morhua) in the North Sea. Prog. Oceanogr. 176:102121.
Alver, M., Broch, O. J., Melle, W., Bagøien, E., and Slagstad, D. (2016). Validation of an Eularian population model for the marine copepod Calanus finmarchicus in the Norwegian Sea. J. Mar. Syst. 160, 81–93. doi: 10.1016/jmarsys.2016.04.004
Björnsson, B., Steinarsson, A., and Árnason, T. (2007). Growth model for Atlantic cod (Gadus morhua): effects of temperature and body weight on growth rate. Aquaculture 271, 216–226.
Bogstad, B., Yaragina, N. A., and Nash, R. D. M. (2016). The early life-history dynamics of Northeast Arctic cod: levels of natural mortality and abundance during the first 3 years of life. Can. J. Fish. Aquat. Sci. 73, 246–256. doi: 10.1139/cjfas-2015-0093
Carroll, J., Vikebø, F., Howell, D., Broch, O.-J., Nepstad, R., Augustine, S., et al. (2018). Resiliency of a healthy fish stock to recruitment losses from oil spills. Mar. Pollut. Bull. 126, 63–73. doi: 10.1016/j.marpolbul.2017.10.069
Cushing, D. (1990). Plankton production and year class strength in fish populations: an update of the match/mismatch hypothesis. Adv. Mar. Biol. 26, 249–293.
Daewel, U., Peck, M., and Schrum, C. (2011). Life history strategy and impacts of environmental variability on early life stages of two marine fishes in the North Sea: and individual-based modelling approach. Can. J. Fish. Aquat. Sci. 68, 426–443. doi: 10.1139/F10-164
Daewel, U., Schrum, C., and Gupta, A. K. (2015). The predictive potential of early life stage individual-based models (IBMs): an example for Atlantic cod Gadus morhua in the North Sea. Mar. Ecol. Prog. Ser. 534, 199–219. doi: 10.3354/meps11367
Daewel, U., Schrum, C., and Macdonald, J. I. (2019). Towards end-to-end (E2E) modelling in a consistent NPZD-F modelling framework (ECOSMO E2E_v1.0): application to the North Sea and Baltic Sea. Geosci. Model Dev. 12, 1765–1789.
Ellertsen, B., Fossum, P., Solemdal, P., and Sundby, S. (1989). Relation between temperature and survival of eggs and first-feeding larvae of northeast Arctic cod (Gadus morhua L.). Rapp. P.-v. Reun. Cons. Int. Explor. Mer 191, 209–219.
Fiksen, Ø, and MacKenzie, B. R. (2002). Process-based models of feeding and prey selection in larval fish. Mar. Ecol. Prog. Ser. 243, 151–164. doi: 10.3354/meps243151
Fiksen, Ø, Jørgensen, C., Kristiansen, T., Vikebø, F., and Huse, G. (2007). Linking behavioural ecology and oceanography: larval behaviour determines growth, mortality and dispersal. Mar. Ecol. Prog. Ser. 347, 195–205.
Folkvord, A. (1997). “Ontogeny of cannibalism in larval and juvenile fishes with special emphasis on Atlantic cod,” in Early Life History and Recruitment in Fish Populations, eds R. C. Chambers and E. A. Trippel (Dordrecht: Springer), 251–278.
Folkvord, A. (2005). Comparison of size-at-age of larval Atlantic cod (Gadus morhua) from different populations based on size- and temperature-dependent growth models. Can. J. Fish. Aquat. Sci. 62, 1037–1052.
Gallego, A., North, E., and Houde, E. D. (2012). Understanding and quantifying mortality in pelagic, early life stages of marine organisms – Old challenges and new perspectives. J. Mar. Syst. 93, 1–3. doi: 10.1016/j.jmarsys.2011.10.012
Geffen, A. J., Foc, C. J., and Nash, R. D. M. (2006). Temperature-dependent development rates of cod Gadus morhua eggs. J. Fish Biol. 69, 1060–1080. doi: 10.111/j.1095-8649.2006.01181.x
Hare, J. A. (2014). The future of fisheries oceanography lies in the pursuit of multiple hypotheses. ICES J. Mar. Sci. 71, 2343–2356.
Head, E. J. H., Gentleman, W. C., and Ringuette, M. (2015). Variability of mortality rates for Calanus finmarchicus early life stages in the Labrador Sea and the significance of egg viability. J. Plankton Res. 37, 1149–1165. doi: 10.1093/plankt/fbv080
Hixon, M. A., Johnson, D. W., and Sogard, S. M. (2014). BOFFFFs: on the importance of conserving old-growth age structure in fishery populations. ICES J. Mar. Sci. 71, 2171–2185.
Hjort, J. (1914). Fluctuations in the great fisheries of Northern Europe viewed in the light of biological research. Rapp. P.-v. Reun. Cons. Int. Explor. Mer 20, 1–237.
Houde, E. D. (1987). Fish early life dynamics and recruitment variability. Am. Fish. Soc. Symp. 2, 17–29.
Kjesbu, O. S., Bogstad, B., Devine, J. A., Gjøsæter, H., Howell, D., Ingvaldsen, R. B., et al. (2014). Synergies between climate and management for Atlantic cod fisheries at high latitudes. Proc. Natl. Acad. Sci. U.S.A. 111, 3478–3483. doi: 10.1073/pnas.1316342111
Kristiansen, T., Fiksen, Ø., and Folkvord, A. (2007). Modelling feeding, growth, and habitat selection in larval Atlantic cod (Gadus morhua): observations and model predictions in a macrocosm environment. Can. J. Fish. Aquat. Sci. 64, 136–151.
Kristiansen, T., Vollset, K. W., Sundby, S., and Vikebø, F. (2014). Turbulence enhances feeding of larval cod at low prey densities. ICES J. Mar. Sci. 71, 2515–2529.
Langangen, Ø., Hjermann, D., Olsen, E., Stige, C., Ohlberger, J., Yaragina, N. A., et al. (2017). The effects of oil spills on marine fish: implications of spatial variation in natural mortality. Mar. Pollut. Bull. 119, 102–109. doi: 10.1016/j.marpolbul.2017.03.037
Langangen, Ø., Stige, L. C., Yaragina, N. A., Vikebø, F. B., Bogstad, B., and Gusdal, Y. (2014a). Egg mortality of northeast Arctic cod (Gadus morhua) and haddock (Melanogrammus aeglefinus). ICES J. Mar. Sci. 71, 1129–1136. doi: 10.1093/icesjms/fst007
Langangen, Ø., Stige, L. C., Yaragina, N. A., Ottersen, G., Vikebø, F. B., and Stenseth, N. C. (2014b). Spatial variations in mortality in pelagic early life stages of a marine fish (Gadus morhua). Prog. Oceanogr. 127, 96–107. doi: 10.1016/j.pocean.2014.06.003
Lough, R. G., Buckley, L. J., Werner, F. E., Quinlan, J. A., and Ed- wards, K. P. (2005). A general biophysical model of larval cod (Gadus morhua) growth applied to populations on Georges Bank. Fish. Oceanogr. 14, 241–262.
Melle, W., and Skjoldal, H. R. (1998). Reproduction and development of Calanus finmarchicus, C. glacialis and C. hyperboreus in the Barents Sea. Mar. Ecol. Prog. Ser. 169, 211–228.
Myksvoll, M. S., Sundby, S., Ådlandsvik, B., and Vikebø, F. B. (2011). Retention of coastal cod eggs in a fjord caused by interactions between egg buoyancy and circulation pattern. Mar. Coast. Fish. 3, 279–294. doi: 10.1080/19425120.2011.595258
Opdal, A. F., Vikebø, F. B., and Fiksen, Ø (2011). Parental migration, climate and thermal exposure of larvae: spawning in southern regions gives Northeast Arctic cod a warm start. Mar. Ecol. Prog. Ser. 439, 255–262.
Opdal, A., and Vikebø, F. B. (2015). Long-term stability in modelled zooplankton influx could uphold major fish spawning grounds on the Norwegian continental shelf. Can. J. Fish. Aquat. Sci. 73, 189–196. doi: 10.1139/cjfas-2014-0524
Ottersen, G., Bogstad, B., Yaragina, N. A., Stige, L. C., Vikebø, F., and Dalpadado, P. (2014). A review of early life history dynamics of Barents Sea cod (Gadus morhua). ICES J. Mar. Sci. 71, 2064–2087. doi: 10.1093/icesjms/fsu037
Peck, M., and Hufnagel, M. (2012). Can IBMs tell us why most larvae die in the sea? Model sensitivities and scenarios reveal research needs. J. Mar. Syst. 93, 77–93. doi: 10.1016/j.jmarsys.2011.08.005
Rose, K. A., Fiechter, J., Curchitser, E. N., Hedstrom, K., Bernal, M., Creekmore, S., et al. (2015). Demonstration of a fully-coupled end-to-end model for small pelagic fish using sardine and anchovy in the California current. Prog. Oceanogr. 138, 348–380.
Sandvik, H., Barrett, R. T., Erikstad, K. E., Myksvoll, M. S., Vikebø, F. B., Anker-Nilssen, T., et al. (2016). Drift patterns of fish larvae link coastal morphology to seabird colony distribution. Nat. Commun. 7:11599. doi: 10.1038/ncomms11599
Siddon, C. S., Kristiansen, T., Mueter, F. J., Holsman, K. K., Heintz, R. A., and Farley, E. V. (2013). Spatial match-mismatch between juvenile fish and prey provides a mechanism for recruitment variability across contrasting climate conditions in the eastern Bering Sea. PLoS One 8:e84526. doi: 10.1371/journal.pone.0084526
Skagseth, Ø, Slotte, A., Stenevik, E. K., and Nash, R. D. M. (2015). Characteristics of the Norwegian coastal current during years with high recruitment of Norwegian spring spawning herring (Clupea harengus, clupeidae). PLoS One 10:e0144117. doi: 10.1371/journal.pone.0144117
Skarðhamar, J., and Svendsen, H. (2005). Circulation and shelf–ocean interaction off North Norway. Cont. Shelf Res. 25, 1541–1560. doi: 10.1016/j.csr.2005.04.007
Skartveit, A., Olseth, J. A., and Tuft, M. E. (1998). An hourly diffuse frac- tion model with correction for variability and surface albedo. Sol. Energy 63, 173–183.
Solemdal, P. (1997). Maternal effects - a link between the past and the future. J. Sea Res. 37, 213–227.
Stenevik, E. K., Melle, W., Gaard, E., Gislason, A., Broms, C. T. A., Prokopchuk, I., et al. (2007). Egg production of Calanus finmarchicus—a basin-scale study. Deep Sea Res. II 54, 2672–2685.
Stige, L. C., Ottersen, G., Yaragina, N. Y., Vikebø, F. B., Stenseth, N. C., and Langangen, Ø (2018). Combined effects of fishing and oil spills on marine fish: role of stock demographic structure for offspring overlap with oil. Mar. Pollut. Bull. 129, 336–342. doi: 10.1016/j.marpolbul.2018.02.056
Stige, L. C., Roger, L. A., Neuheimer, A. B., Hunsicker, M. E., Yaragina, N. A., Ottersen, G., et al. (2019). Density- and size-dependent mortality in fish early life stages. Fish Fish. 20, 962–976. doi: 10.1111/faf.12391
Stige, L. C., Yaragina, N. A. Langangen, Ø., Bogstad, B., Stenseth, N. C., and Ottersen, G. (2017). Effect of a fish stock’s demographic structure on offspring survival and sensitivity to climate. Proc. Natl. Acad. Sci. 114, 1347–1352. doi: 10.1073/pnas.1621040114
Strand, K. O., Vikebø, F. B., Sundby, S., Sperrevik, A. K., and Breivik, Ø (2019). Subsurface maxima in buoyant fish eggs indicate vertical velocity shear and spatially limited spawning grounds. Limnol. Oceanogr. 64, 1239–1251.
Sundby, S. (1995). “Wind climate and foraging of larval and juvenile Arcto-Norwegian cod (Gadus morhua),” in Climate Change and Northern Fish Populations. Can. Spec. Publ. Fish. Aquat. Sci. 121, ed. R. J. Beamish (Ottawa, ON: National Research Council of Canada), 405–415.
Sundby, S., and Nakken, O. (2008). Spatial shifts in spawning habitats of Arcto-Norwegian cod related to multidecadal climate oscillations and climate change. ICES J. Mar. Sci. 65, 953–962.
Sundby, S., Bjørke, H., Soldal, A. V., and Olsen, S. (1989). Mortality rates during the early life stages and year class strength of the Arcto-Norwegian cod (Gadus morhua L.). Rapp. P.-v. Reun. Cons. Int. Explor. Mer 191, 351–358.
Thygesen, U. H., and Ådlandsvik, B. (2007). Simulating vertical turbulent dispersal with finite volumes and binned random walks. Mar. Ecol. Prog. Ser. 347, 145–153.
Toresen, R., Skjoldal, H. R., Vikebø, F., and Martinussen, M. B. (2019). Sudden change in long-term ocean climate fluctuations corresponds with ecosystem alterations and reduced recruitment in Norwegian spring-spawning herring (Clupea harengus, Clupeidae). Fish Fish. 20, 686–696. doi: 10.1111/faf.12369
Vikebø, F. B., Strand, K. O., and Sundby, S. (2019). Wind intensity is key to phytoplankton spring bloom under climate change. Front. Mar. Sci. 6:518. doi: 10.3389/fmars.2019.00518
Vikebø, F., Jørgensen, C., Kristiansen, T., and Fiksen, Ø (2007). Drift, growth, and survival of larval Northeast Arctic cod with simple rules of behaviour. Mar. Ecol. Prog. Ser. 347, 207–219.
Keywords: Atlantic cod, match-mismatch, fish larvae, starvation, Calanus finmarchicus, North Atlantic, Arctic
Citation: Vikebø FB, Broch OJ, Endo CAK, Frøysa HG, Carroll J, Juselius J and Langangen Ø (2021) Northeast Arctic Cod and Prey Match-Mismatch in a High-Latitude Spring-Bloom System. Front. Mar. Sci. 8:767191. doi: 10.3389/fmars.2021.767191
Received: 30 August 2021; Accepted: 30 November 2021;
Published: 20 December 2021.
Edited by:
Hui Zhang, Institute of Oceanology, Chinese Academy of Sciences (CAS), ChinaReviewed by:
Sophia N. Wassermann, University of Washington, United StatesGiovanni Daneri, Patagonian Ecosystems Investigation Research Center (CIEP), Chile
Copyright © 2021 Vikebø, Broch, Endo, Frøysa, Carroll, Juselius and Langangen. This is an open-access article distributed under the terms of the Creative Commons Attribution License (CC BY). The use, distribution or reproduction in other forums is permitted, provided the original author(s) and the copyright owner(s) are credited and that the original publication in this journal is cited, in accordance with accepted academic practice. No use, distribution or reproduction is permitted which does not comply with these terms.
*Correspondence: Frode B. Vikebø, ZnJvdmlrQGhpLm5v