 Kugako Sugimoto
 Hideki Fukuda
 Isao Koike
 Toshi Nagata
- Atmosphere and Ocean Research Institute, The University of Tokyo, Chiba, Japan
Transparent exopolymer particles (TEPs) play important roles in the regulation of carbon and pollutant (microplastics and spilled oils) transport in marine environments; however, the factors controlling TEP dynamics in coastal systems have yet to be fully clarified. A widely used colorimetric method quantifies TEPs as a homogeneous pool, which hampers the examination of internal TEP dynamics. Here, we used the microscopy to elucidate the seasonal dynamics of TEP subgroups and their controlling factors in Sagami Bay, Japan. TEPs were classified into three types: those not associated with other types of particles (Type I), those colonized by multiple types of particles (bacteria, algal cells, and detritus) (Type II), and those densely colonized by only bacterial clusters (Type III). Type II was generally the most dominant TEP component in terms of area, except in February, when Type I contributed substantially to the total TEP area. Type III was less abundant in terms of area but contributed substantially (up to 34%) to the total number of TEPs. The mean diameters were 14.0 ± 2.8 μm, 17.0 ± 5.8 μm, and 7.5 ± 0.9 μm for Type I, Type II, and Type III TEPs, respectively. Type I and Type III TEPs likely represent a transient phase of TEP development toward the formation of Type II, characterized by a high turnover and relatively low abundance in terms of area. The power-law slopes of the distributions of each TEP size, which reflected geometric features of the TEPs at steady state, changed dynamically over the seasons. The abundance of each type of TEP was significantly positively correlated with bacterial abundance, suggesting that bacteria are intimately involved in the regulation of internal TEP dynamics in Sagami Bay. Our results highlight the importance of investigating the internal dynamics of TEPs to improve current understanding of their roles in the regulation of carbon and pollutant transfer in marine environments.
Introduction
Transparent exopolymer particles (TEPs), a class of organic aggregates that can be stained with Alcian Blue (Alldredge et al., 1993; Passow, 2002a), are produced mainly by phytoplankton and bacteria in the upper ocean (Passow, 2002a). They play important roles in the regulation of material cycling, food webs, and the transport of pollutants, including spilled oils and microplastics (Passow, 2002a; Mari et al., 2017; Passow et al., 2017; Galgani et al., 2019; Nagata et al., 2021). Owing to their sticky nature (Rochelle-Newll et al., 2010), TEPs may act as a glue to facilitate the aggregation of living and non-living particles (Quigg et al., 2016; Mari et al., 2017), contributing to the formation of large, sinking aggregates that mediate the vertical transport of organic carbon in the ocean (Engel et al., 2004; Passow and Carlson, 2012). Transparent exopolymer particles may also accumulate in the sea-surface microlayer and influence air–sea gas exchange (Wurl and Holmes, 2008; Galgani et al., 2016; Jennings et al., 2017). Clarifying the dynamics of TEPs and its regulation in marine environments is fundamentally important for a better understanding of oceanic biogeochemical cycles.
The TEP dynamics in marine environments have been studied using colorimetric and microscopic methods (Harlay et al., 2009). Colorimetry is used to examine the distribution of bulk TEPs and its relationships with environmental variables. Such studies have revealed that bulk TEP distributions are affected by several factors, including primary production (Mari and Burd, 1998), chlorophyll a (Chl a) concentration (Ortega-Retuerta et al., 2017), phytoplankton community composition (Taylor et al., 2014), bacterial abundance (Busch et al., 2017), bacterial production (Ortega-Retuerta et al., 2017), and other physical and chemical conditions (e.g., temperature, pH, and salinity) (Piontek et al., 2009; Thornton, 2009; Najdek et al., 2011). Although these data are useful, colorimetry cannot resolve the distinctive dynamics of different types of TEPs. The TEPs in natural seawater are a complex mixture of various polymeric particles with different physicochemical characteristics (Gogou and Repeta, 2010), origins (Passow, 2002b; Bhaskar et al., 2005; Li et al., 2015), and development stages (Passow et al., 1994). In fact, early microscopy studies revealed that there are morphologically distinctive types of TEPs in seawater, including filaments, sheets, clumps, and amorphous blobs (Alldredge et al., 1993; Passow and Alldredge, 1994; Passow, 2002a; Berman, 2010). “Fresh” TEPs, assembled from freshly released TEP precursors, are barely associated with any other types of particles, such as living cells (Passow et al., 1994; Passow, 2002a), whereas “mature” TEPs are associated with various other types of particles (Kiørboe, 2003). Other studies have revealed that morphologically distinctive types of TEPs are produced during the incubation of natural bacterial assemblages (Sugimoto et al., 2007). In Sagami Bay, based on observations of TEP formation during bacterial growth in seawater, Sugimoto et al. (2007) found that the bacteria formed tightly packed TEPs composed of bacterial clusters and capsule-like polymers (Linley and Field, 1982; Radić et al., 2006). Different types of TEPs may play different roles in biogeochemical cycles and food webs. Fresh TEPs are C-rich with a high C:N ratio (Engel and Passow, 2001) and might contribute to the upward transport of organic carbon due to their low densities (Azetsu-Scott and Passow, 2004). In contrast, “matured” TEPs associated with high-density ballast particles may contribute to the downward transport of organic carbon (Nagata et al., 2021). Bacterial cluster-like TEPs can be a N-rich food for grazers due to low bacterial C:N ratio being around 6 (Fukuda et al., 1998). Thus, the microscopic examination of different types of TEPs may help to elucidate the complex behavior and internal dynamics of TEPs in marine environments. However, because microscopic analysis is labor intensive, data concerning the seasonal and vertical variations of different types of TEPs in marine water columns are limited (Sugimoto et al., 2007; Bar-Zeev et al., 2011; Busch et al., 2017; Engel et al., 2020).
Here, we examine the seasonal and vertical variability of the abundance and size distributions of different types of TEPs in Sagami Bay, Japan, to investigate the possible environmental factors controlling the dynamics of each type of TEP. Using the microscopy, we distinguished three types of TEPs. Type I: Polysaccharide matrices made of fibrillar TEP precursors without attached or embedded particles. Type II: Complex aggregates associated with biotic (algae and bacteria) and abiotic (detritus and minerals) particles. Type III: Bacterial clump-type TEPs characterized by densely packed bacterial assemblages embedded in polysaccharide matrices (Sugimoto et al., 2007). Our data demonstrate that the abundance and distribution of particle sizes among TEP subgroups are dynamic parameters that can help evaluate processes involved in regulating TEP dynamics in coastal environments.
Materials and Methods
Sampling
Eight times in 2006, seawater samples were collected on the research vessel Tachibana from the Manazuru Marine Center for Environmental Research and Education at Yokohama National University at predetermined depths (0, 10, 20, 30, 40, 60, and 100 m) in Sagami Bay, Japan (35°09′30″ N, 139°09′25″ E), which has a maximum water depth of 120 m (Supplementary Table 1). Seawater temperature and salinity were determined using a conductivity, temperature, depth sensor (CTD, Ocean Seven 31 S/N 1202287, Idronaut, Brugherio, Italy), except during June–September, when the temperature and salinity were measured on board using a mercury thermometer and a refractometer (S/Mill-E, Atago, Japan), respectively (because of a CTD sensor failure). A comparison of the data collected using CTD and those determined using the mercury thermometer and refractometer on board showed that the deviation between the two methods was generally < 0.7°C and < 0.3 for temperature and salinity, respectively. Transparency was determined using a Secchi disk. The euphotic zone depth was defined as twice the Secchi disk depth (Koenings and Edmundson, 1991). Seawater samples were collected using a 5-L Niskin sampler for the samples at 10 m-100 m or a plastic bucket washed with HCl and rinsed with Milli-Q water (Millipore, Billerica, MA, United States) before use for the samples at 0 m. Water samples were immediately refrigerated in a dark box and processed within 6 h.
Seawater Analysis
Nutrient concentrations (NO3–, NO2–, NH4+, and PO43–) were determined using an auto-analyzer (AACS III; Bran + Luebbe, Norderstedt, Germany) (Strickland and Parsons, 1972). The total dissolved inorganic N (DIN) concentration refers to the sum of the NO3–, NO2–, and NH4+ concentrations. The detection limits of the auto-analyzer were 0.02 μM for NO2– and PO43–, 0.03 μM for NO3–, and 0.05 μM for NH4+. Chl a concentrations were determined fluorometrically (10-AU; Turner Designs, Sunnyvale, CA, United States) (Suzuki and Ishimaru, 1990).
Bacterial Abundance
To count bacteria, 10-mL seawater samples were fixed with formaldehyde (2% final concentration), filtered through Nuclepore filters (0.2 μm pore size, 25 mm diameter; Whatman, Maidstone, Kent, United Kingdom) in a constant vacuum (<0.02 MPa), and then stained with SYBR Gold (final concentration, 0.025% v v–1, Invitrogen, Carlsbad, CA, United States) (Chen et al., 2001). The stained filters were observed under an epifluorescence microscope (1000×, BX51; Olympus, Tokyo, Japan). Duplicate slides were prepared for each sample, except in February when only a single slide was used. For each slide, at least 300 bacteria were counted in a minimum of 10 fields.
Transparent Exopolymer Particle Determination
To analyze the TEPs, seawater samples (5–200 mL) were fixed with formaldehyde (2% final concentration), stained with SYBR Gold (final concentration, 0.025% v v–1), and filtered through 2.0 μm pore-size polycarbonate filters (25 mm, Nuclepore filter, Whatman, Maidstone, Kent, United Kingdom) in a gentle vacuum (<0.02 MPa). The filters were then stained with Alcian Blue (0.02% at pH 2.5, Sigma-Aldrich, St. Louis, MO, United States) (Logan et al., 1994). Duplicate slides were prepared for each sample. For each slide, TEPs were observed under an epifluorescence microscope (200×, B×51; Olympus) equipped with a charged-coupled device camera (Olympus DP70) by alternately switching between UV light and visible light. The images captured by the camera were used to analyze the Alcian Blue-stained TEP area using image analysis software (Image Pro Plus, Media Cybernetics, Silver Spring, MD, United States). The particle diameter (D, in μm) of each TEP was calculated from the particle area (A, μm2): D = 2 × (A/π)0.5 assuming spherical particle geometry with no porosity (Engel and Passow, 2001). Although previous works generally used 0.2-μm or 0.4-μm pore-size filters for the examination of TEPs (Passow, 2002a), we used 2.0-μm pore-size filers to minimize the retention of free-living bacteria, which could lead to the underestimation of Type I TEPs (i.e., if free-living bacteria connect with Type I TEPs on the filters, they might be erroneously classified as Type III TEPs).
Transparent exopolymer particles (TEPs) in a 2–290-μm size range were counted and classified into three types. Type I TEPs consisted of TEP polysaccharide matrices (visualized with Alcian Blue) that were barely associated with any fluorescent particles (Supplementary Figure 1A). Transparent exopolymer particle matrices with algae (red or orange autofluorescence), bacteria (bright SYBR Gold fluorescence with blue light excitation), and detritus (dim SYBR Gold fluorescence with blue light excitation) were defined as Type II TEPs (Supplementary Figure 1B). The Type III TEPs were bacterial clumps with TEP matrices, densely colonized only by bacteria, with no indication of the presence of algae or detritus (Supplementary Figure 1C). Type III TEPs corresponds to the bacterial clusters that Sugimoto et al. (2007) identified during bacterial growth in seawater cultures and are thought to be of bacterial origin. These three types were distinguished manually by a single operator (the first author of this study) throughout the study. The numbers of Type I, II, and III TEPs examined each month were 363–1374, 1641–2783, and 432–1052, respectively.
The seasonal variability of the TEP size distributions was examined by pooling the data collected from different depths for each month. The size distributions of the TEP assemblages were analyzed for each TEP type and all types combined (Type I + II + III), using the power law (Mari and Burd, 1998). The number of TEPs per volume of seawater, normalized by the size bin width (Nd, particles L–1 μm–1), was related to D according to the following equation:
where the constant k depends on the TEP abundance and β is the particle size distribution slope (the smaller the β value, the smaller the fraction of small particles). β and k were estimated by linear regression of log Nd against log D.
Statistics
Regression analysis was conducted using Microsoft Excel (Microsoft 365 MSO). One-way analysis of variance (ANOVA) with Tukey’s multiple comparison test and correlation analysis were conducted using R version 2.14.1.
Results
Seasonal Variations of Chl a Concentration and Bacterial Abundance
The variations in physical (seawater temperature, salinity, seawater density), chemical (PO43–, DIN), and biological (Chl a concentration, bacterial abundance) variables are summarized in Table 1. The Chl a concentration was low throughout the water column in February and March (Figure 1C) when the seawater temperature and density (sigma-t) were vertically homogeneous (Figure 1A). The euphotic zone depth (Secchi disk depth × 2) varied between 2.6 and 46 m (Supplementary Table 1), with the lowest transparency found in April. A spring bloom occurred in April, with Chl a concentrations reaching 9.95 μg L–1 at 10 m. The development of water column stratification was likely partly intensified by the addition of freshwater (river water, precipitation) during this month, and the nutrient-rich conditions (high DIN and PO43– concentrations of 20.6 μM and 1.25 μM at the surface and > 3.32 μM and > 0.28 μM at 30 m, respectively; Figure 1B) were favorable for phytoplankton growth. Between June and October, thermal stratification was established (Figure 1A), and the upper water column was generally nutrient depleted (Figure 1B). During this period, the Chl a concentrations were highest in the surface layer (range, 1.08–11.0 μg L–1) and decreased with depth (Figure 1C). The seasonal cycle of bacterial abundance generally followed that of Chl a concentration, although the extent of variability was not as pronounced (Figure 1C and Table 1).
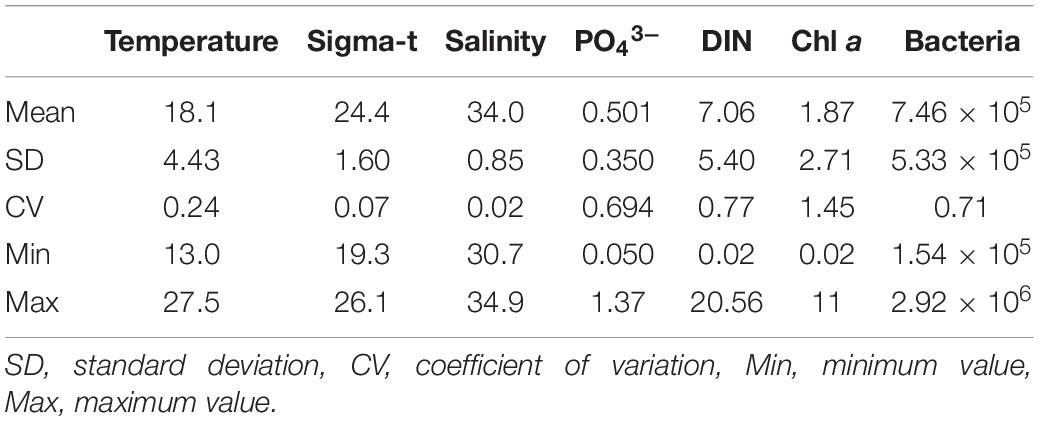
Table 1. Summary of the means and variability in temperature (°C), sigma-t, salinity, PO43– (μM), dissolved inorganic nitrogen (DIN, μM), bacterial abundance (cells mL–1), and Chl a concentration (μg L–1); n is 53 (salinity and sigma-t), 54 (temperature), or 56 (other variables).
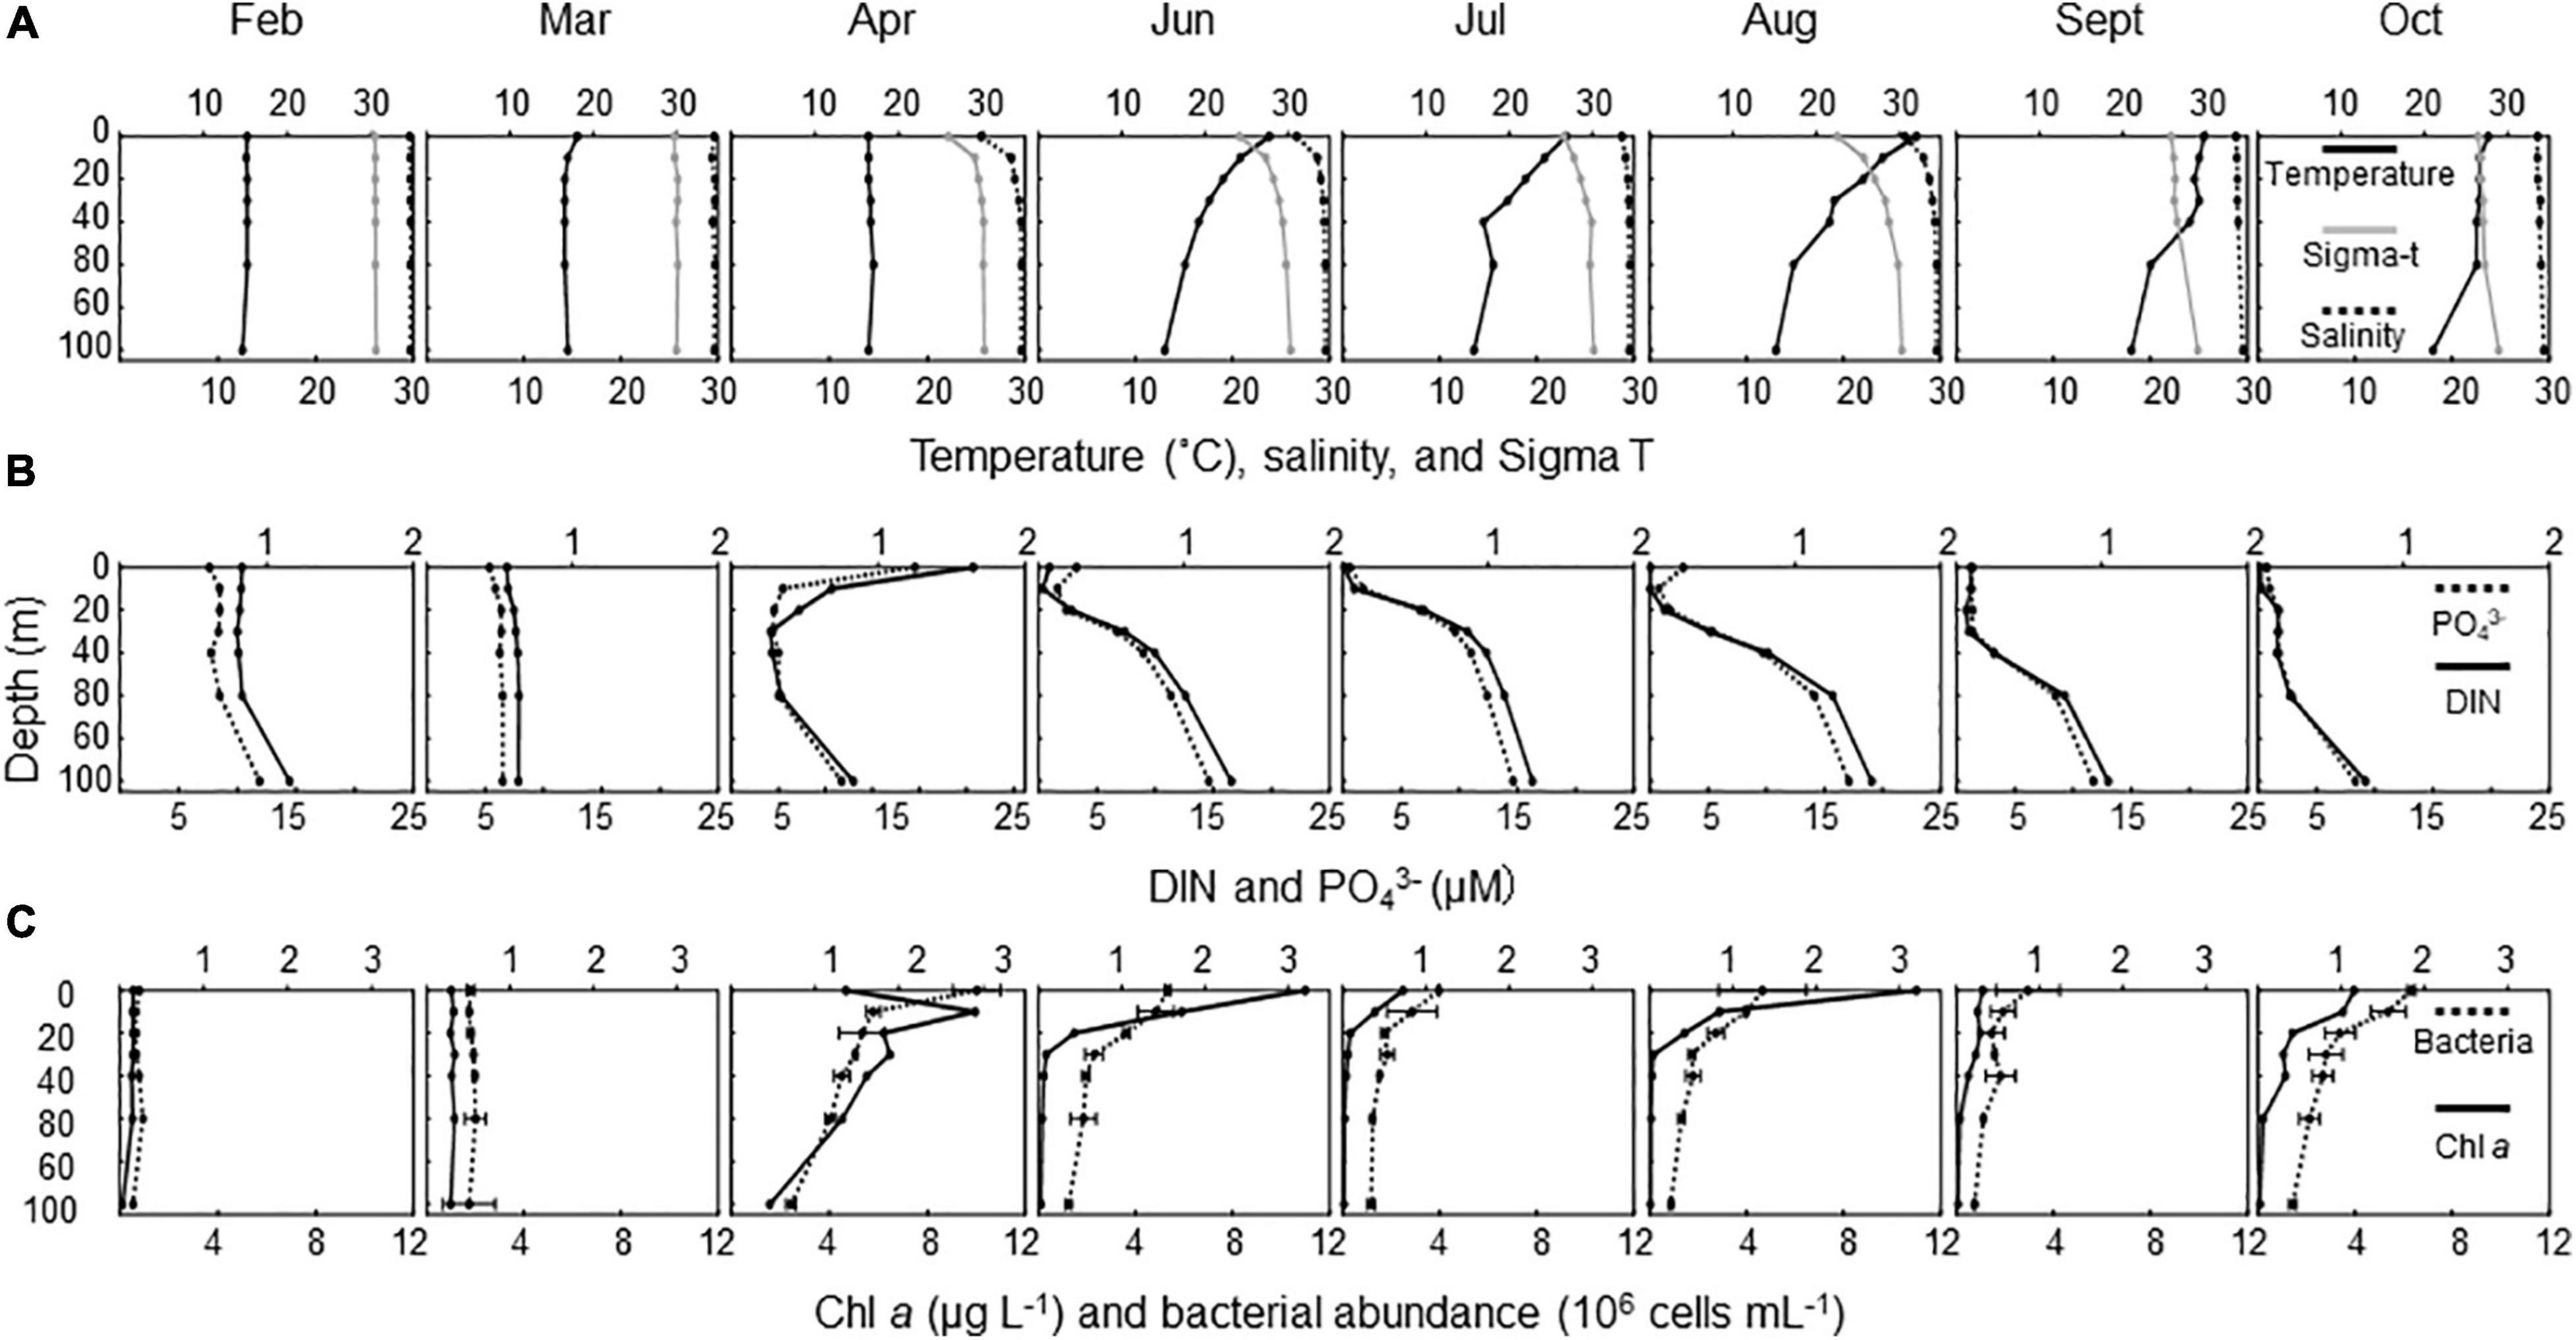
Figure 1. Seasonal changes in vertical distribution of environmental variables. (A) Temperature (°C, lower x-axis), salinity (upper x-axis), and sigma-t (lower x-axis); (B) dissolved inorganic nitrogen (DIN, μM, lower x-axis) and PO43– (μM, upper x-axis); and (C) Chl a (μg L–1, lower x-axis) and bacterial abundance (106 cells mL–1, upper x-axis). Errors for bacterial abundance are ranges of estimates obtained using duplicate microscopic slides (n = 2).
Number, Area, and Mean Size of Transparent Exopolymer Particles
The number and area of TEPs were low in February (Figures 2A,B). After a moderate increase in March, TEP abundance substantially increased in April, following the occurrence of a spring bloom. The most pronounced increases, in terms of both number and area, were found for Type II TEPs, although the other types of TEPs also increased to a certain extent, depending on depth. During the stratification period, the TEP number and area were higher in June and August than in other months. The number and area of Type II TEPs, and to a lesser extent the other TEP types, displayed peaks at 0 m, which coincided with high Chl a concentrations.
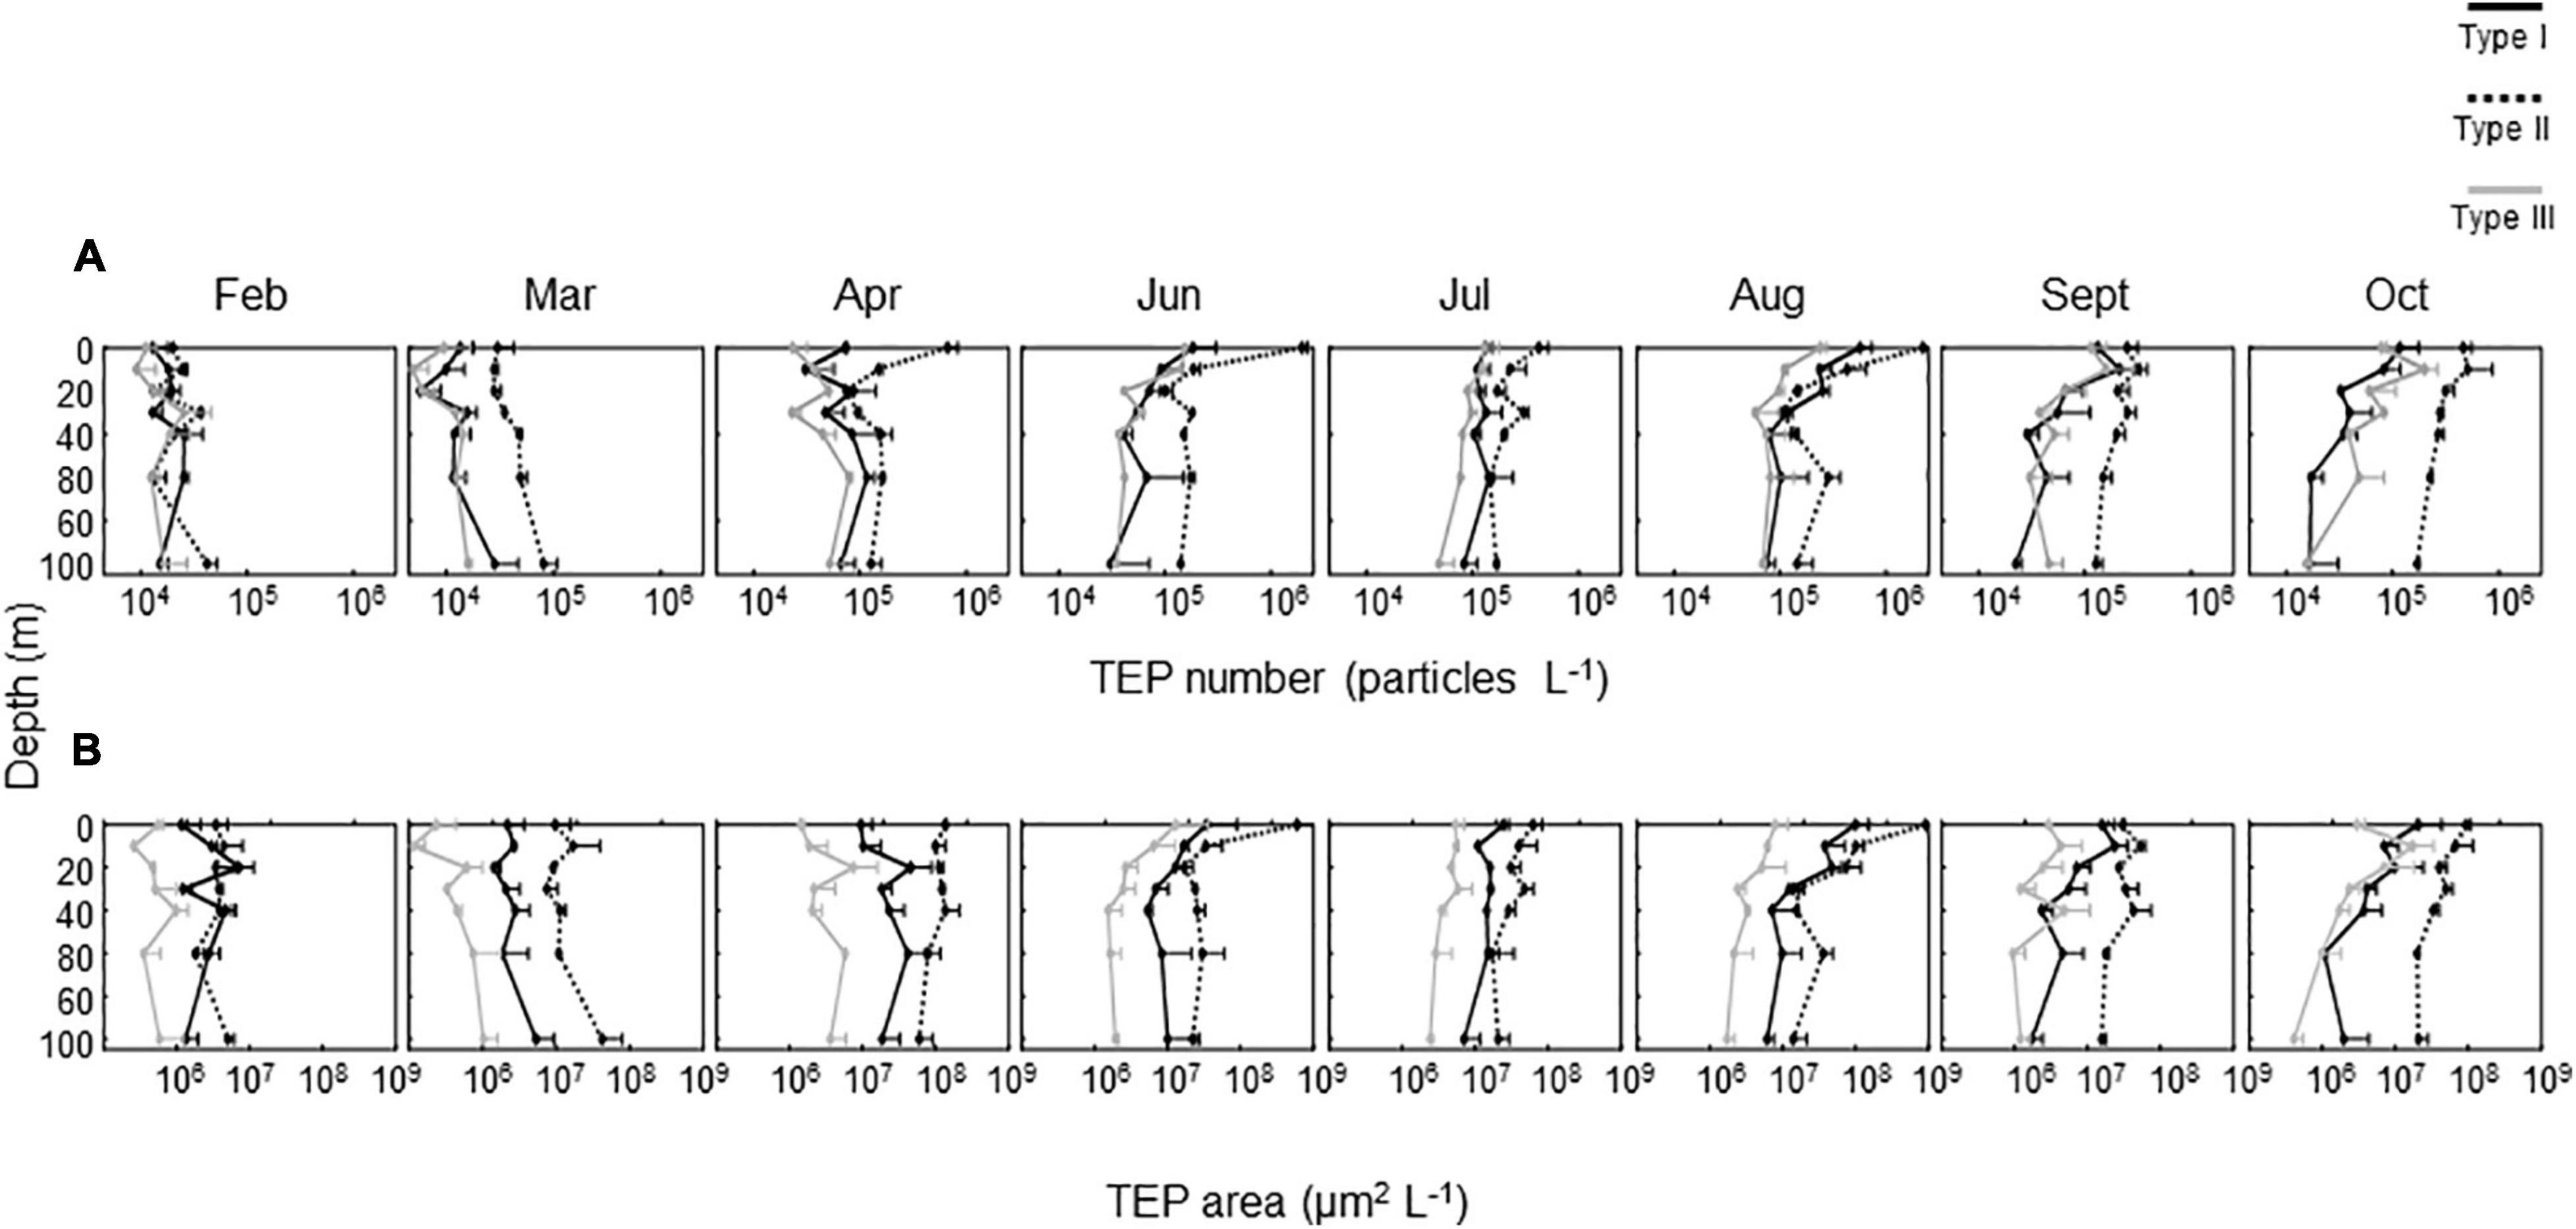
Figure 2. Seasonal changes in vertical distribution of transparent exopolymer particle (TEP) abundance, expressed as (A) number (particles L–1) and (B) area (μm2 L–1). Errors are ranges of estimates obtained using duplicate microscopic slides (n = 2). The top half of each error bar is given for clarity.
Regardless of depth and throughout the investigation period, Type II TEPs generally dominated the TEP samples in terms of area, with some exceptions (Figures 2A,B, 3A,B). A notable exception was observed in February, when Type I TEPs contributed substantially to the total TEP area (Figure 2A). Relatively high contributions (5–43%) of Type I TEPs, in terms of area, were also observed during the stratification period between June and September. Type III TEPs contributed significantly to the total TEP abundance in terms of number; the maximum contribution for each month varied in the range of 19–34% (Figure 3A). However, they did not make much of a contribution in terms of area because of their small size (see below) (Figure 3B).
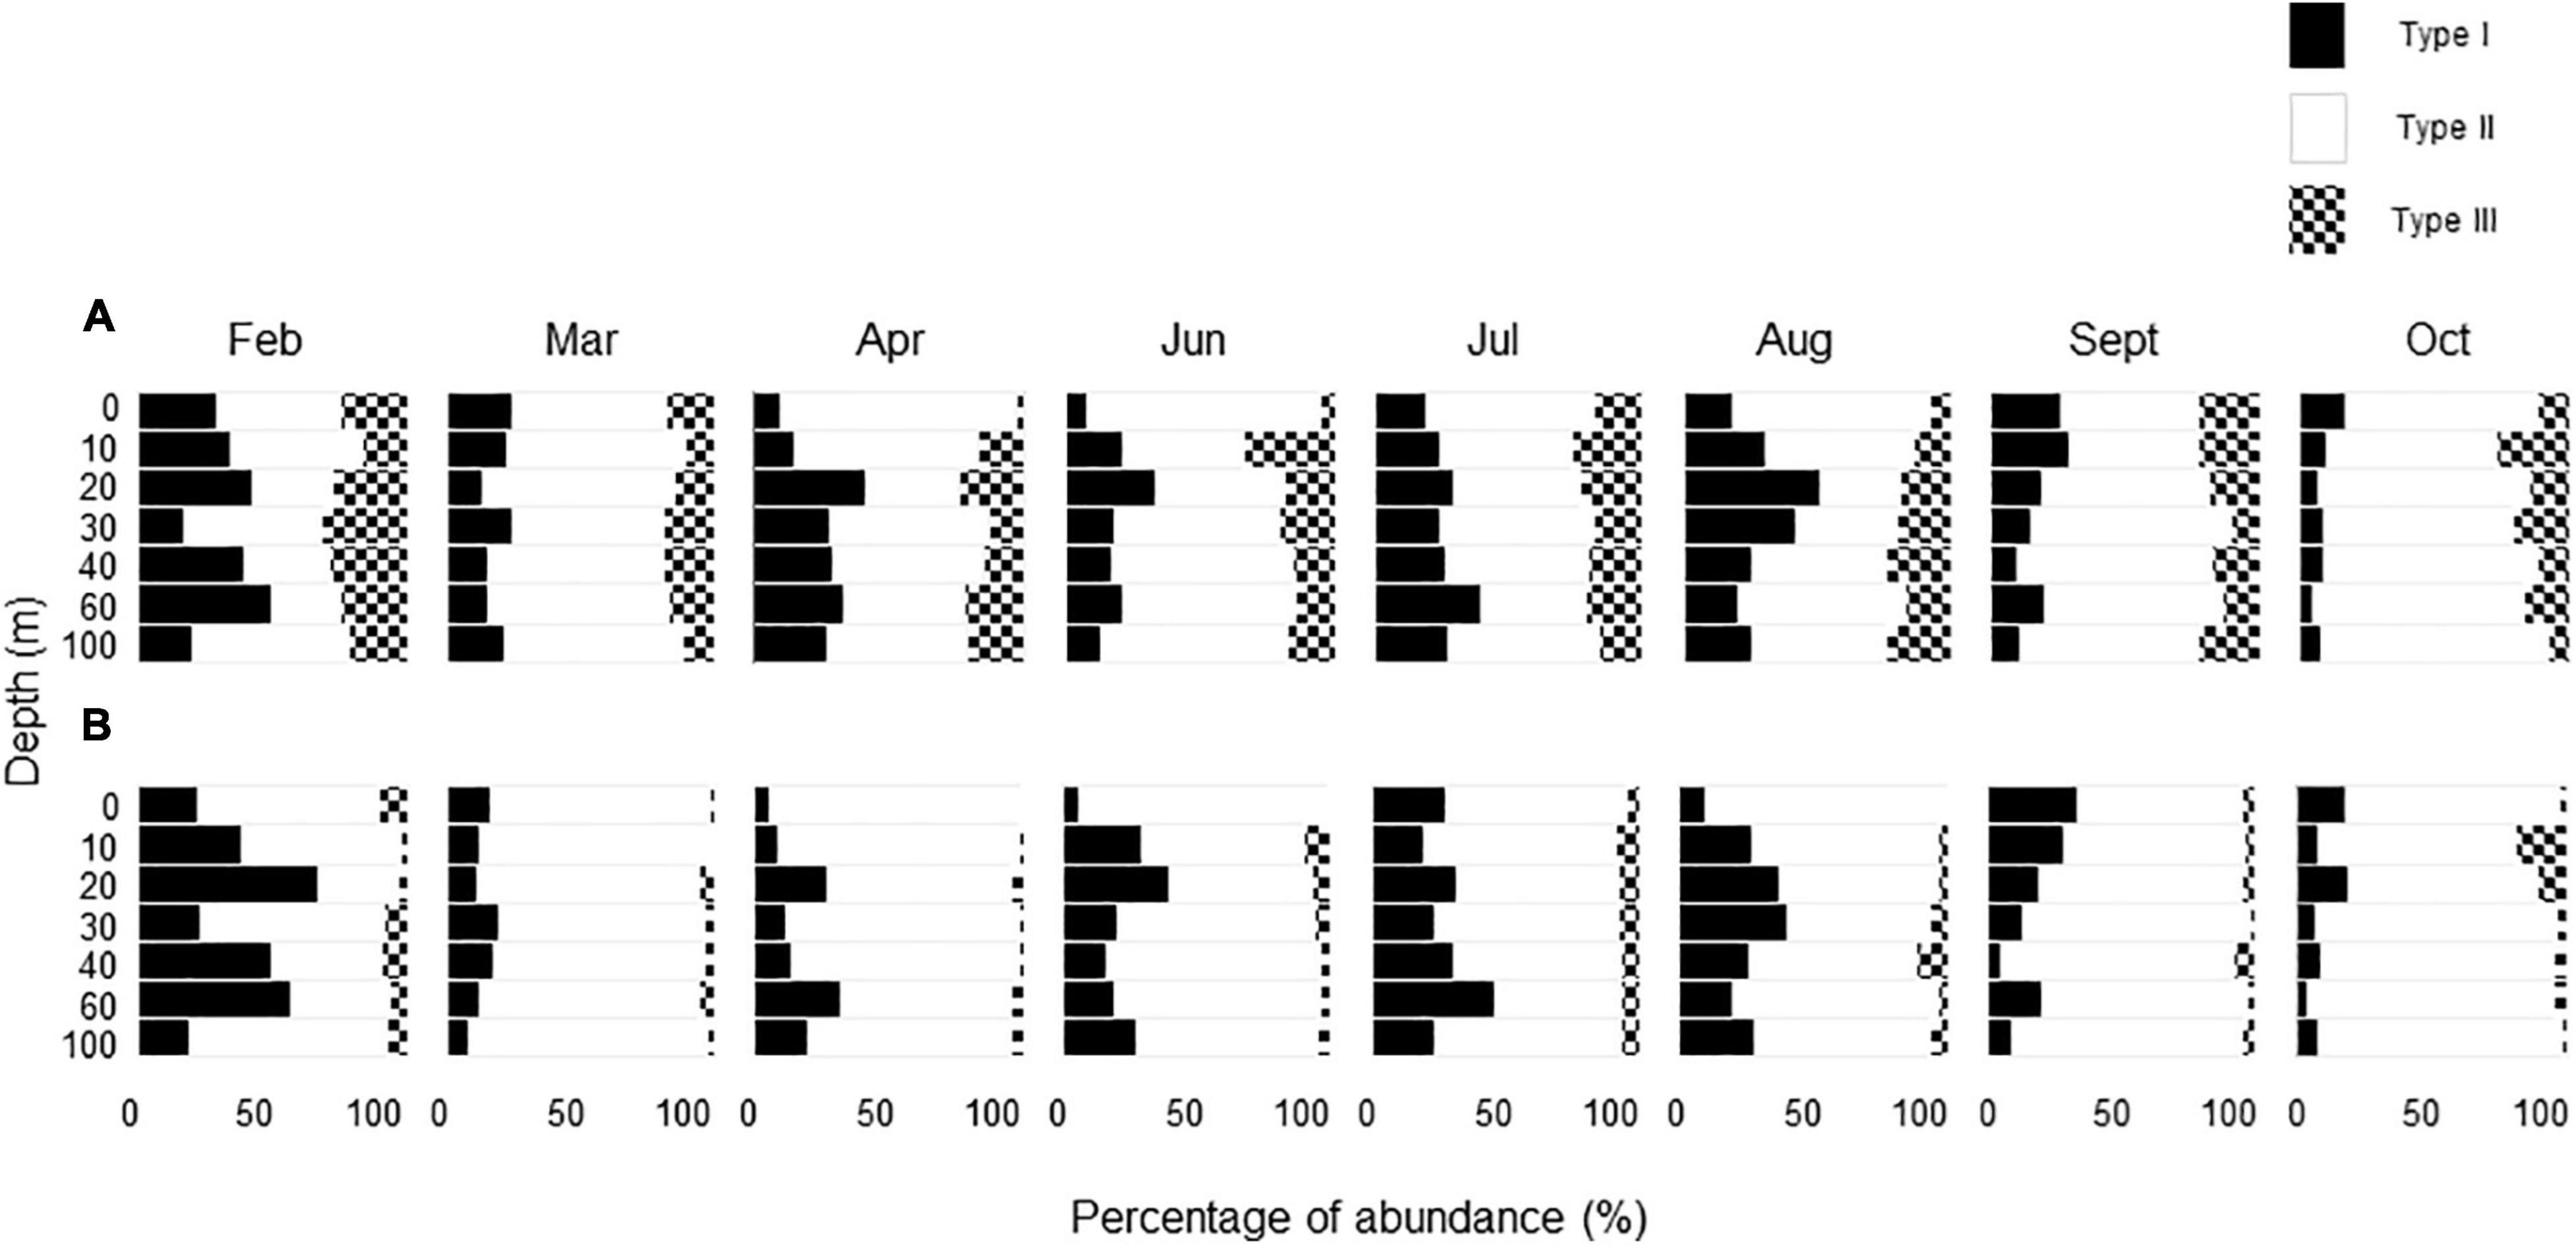
Figure 3. Seasonal changes in vertical distribution of the percentage of each transparent exopolymer particle (TEP) type to the total TEP in terms of (A) number and (B) area.
The seasonal variation in the mean TEP diameter for the entire water column is shown in Figure 4. The TEPs were larger in April than in other months. In this month, the largest mean TEP diameters were found at a depth of 20 m for all TEP types (Figure 5). In other months, there was no clear seasonal or vertical trend in mean TEP diameter. The mean TEP diameters for the whole investigation period were 14.2 ± 2.8 μm, 17.0 ± 5.8 μm, and 7.5 ± 0.9 μm for the Type I, Type II, and Type III TEPs, respectively (Table 2). Type III TEPs was smaller than Type I and Type II TEPs (ANOVA with Tukey multiple comparison, n = 8; with Type I, p < 0.01 and with Type II, p < 0.001) (Table 2).
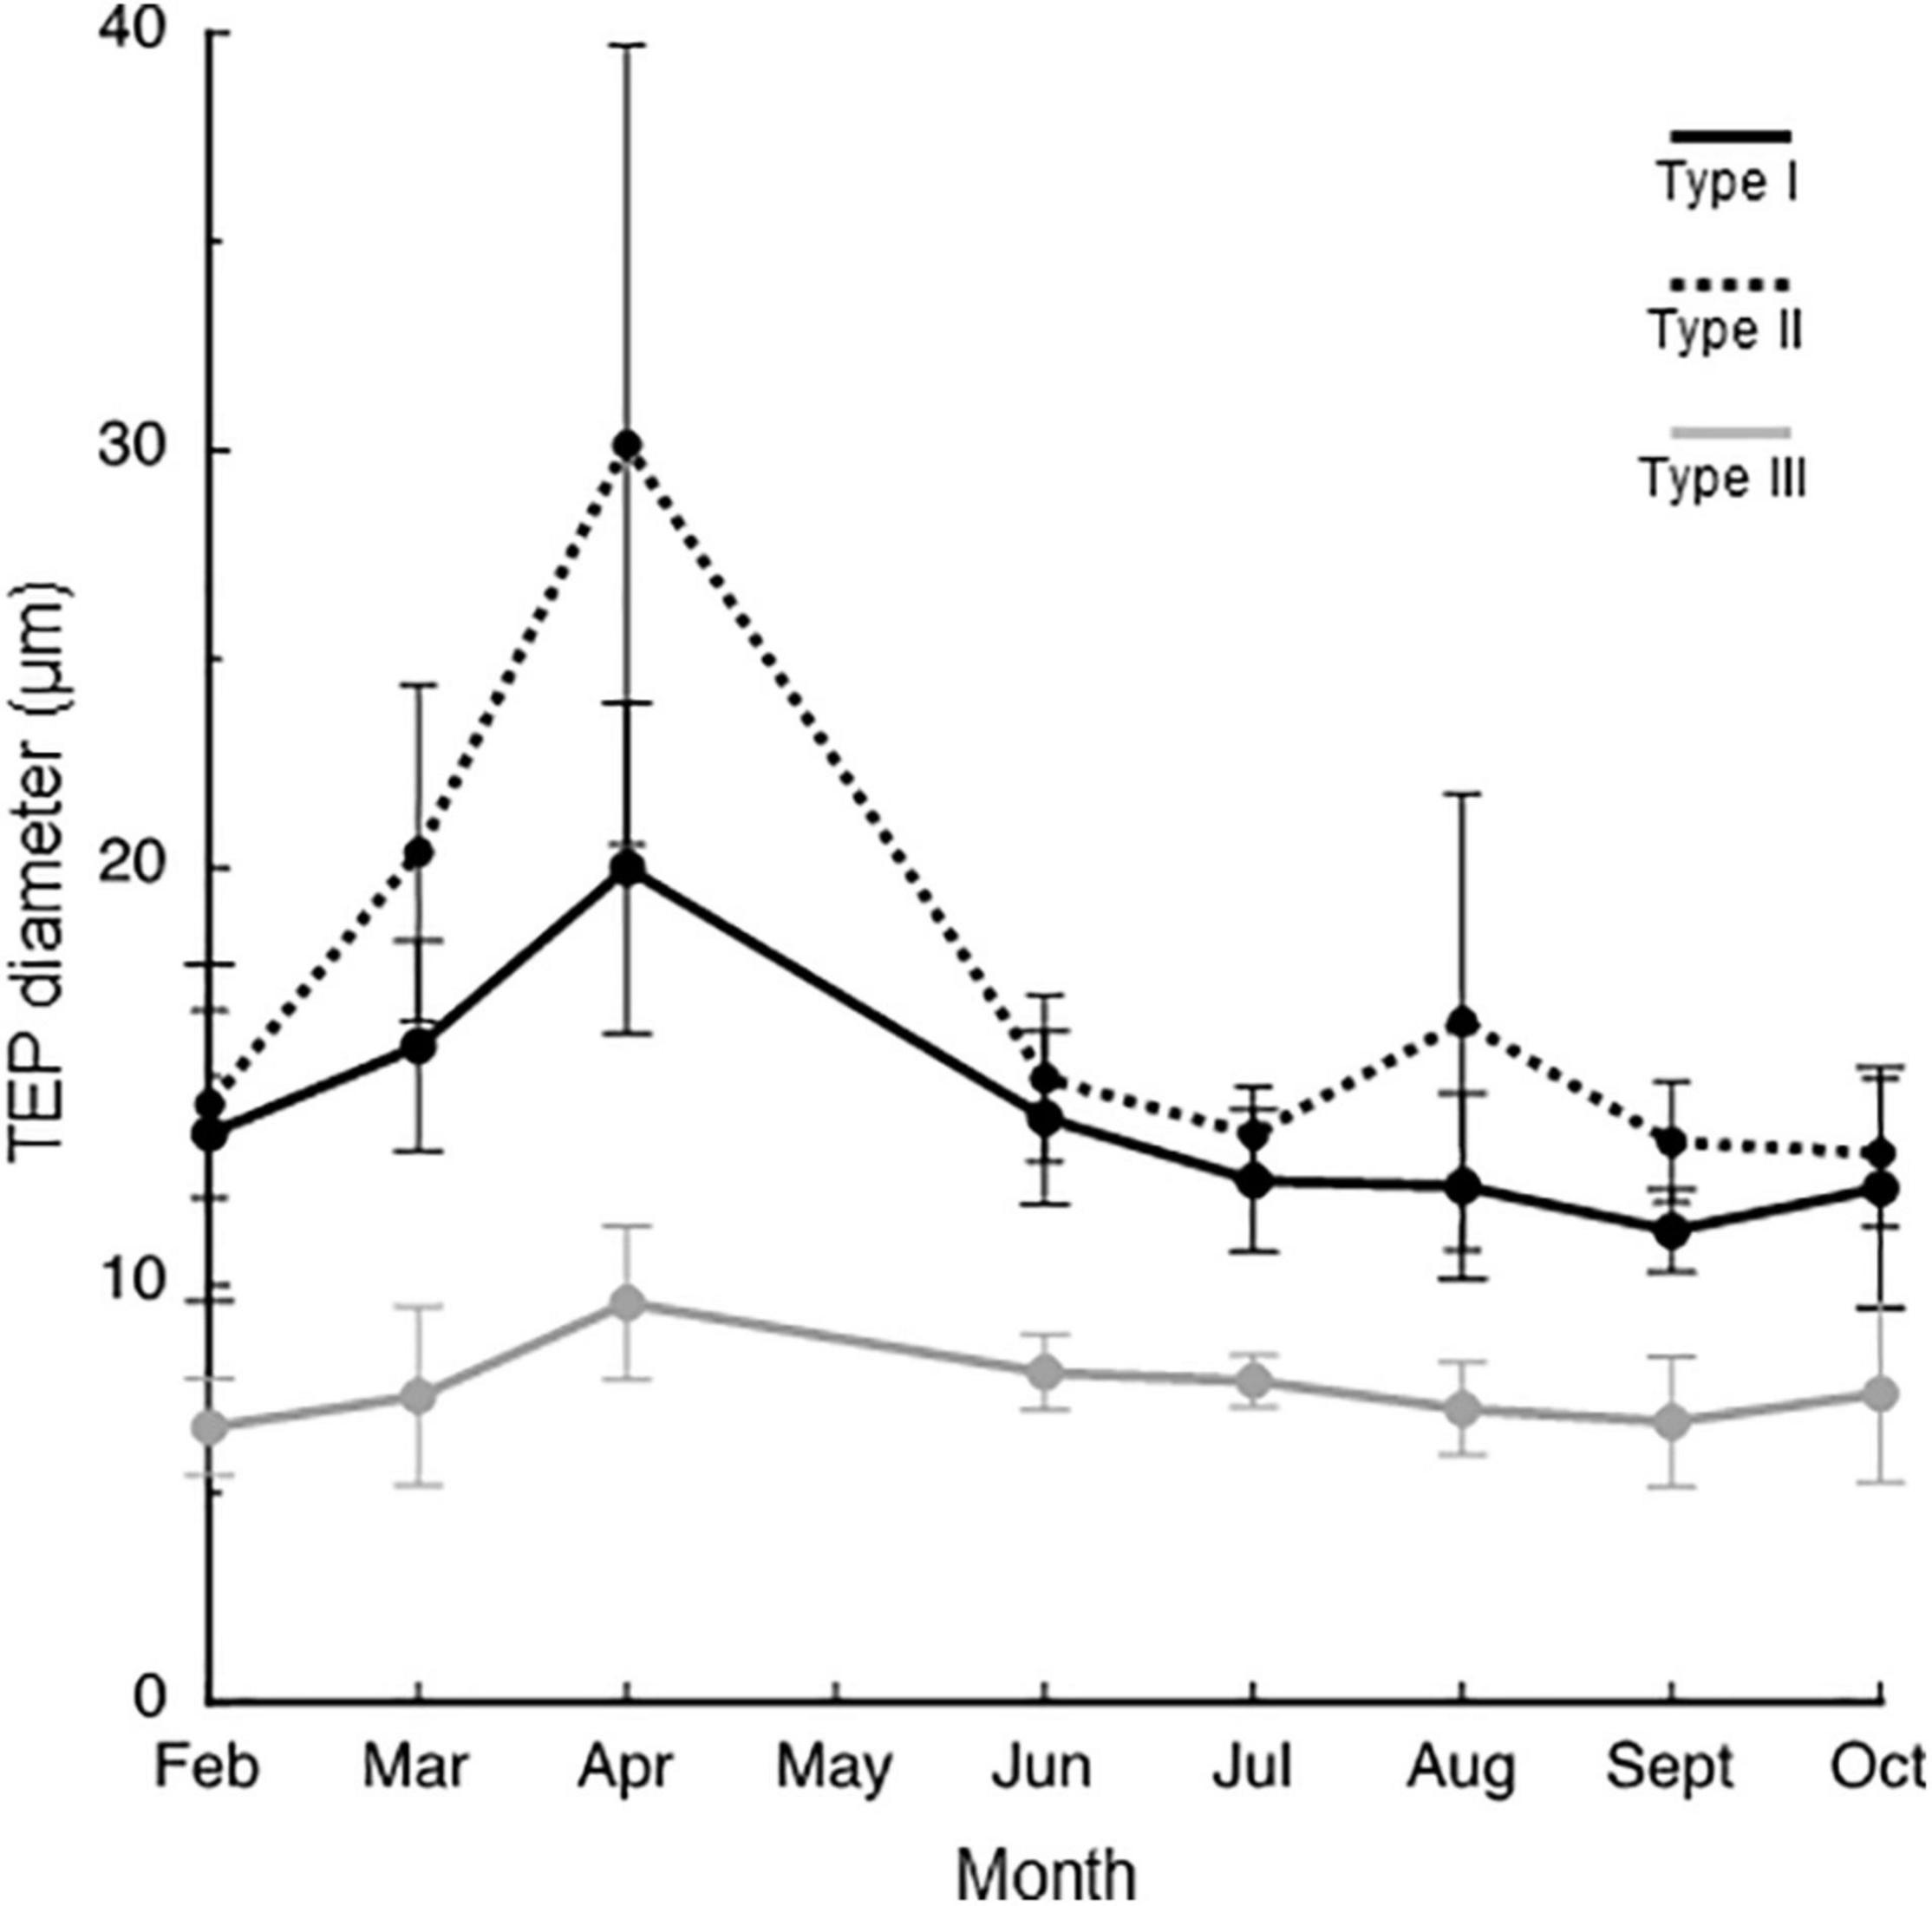
Figure 4. Seasonal changes in the diameter of transparent exopolymer particle (TEP) types. Means of the data collected at different depths are presented with errors (standard deviations, n = 7).
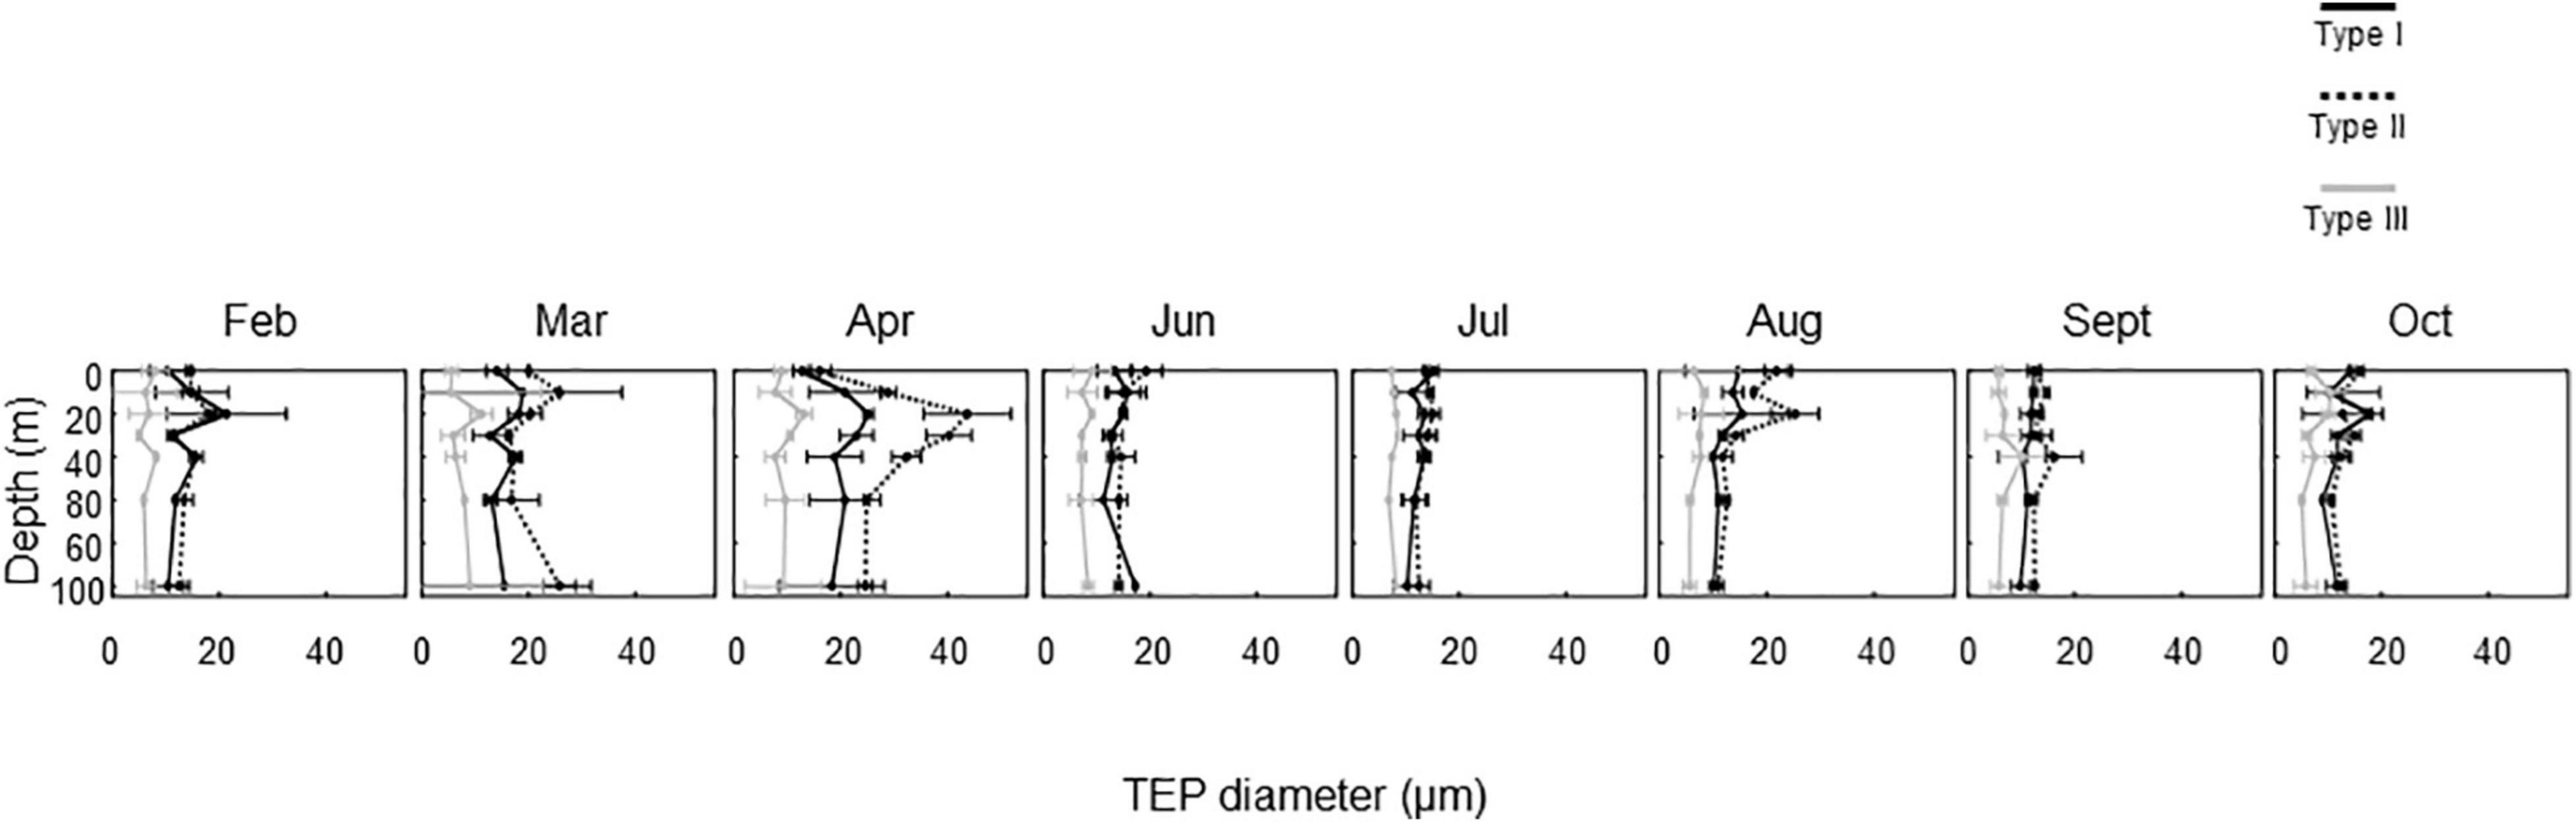
Figure 5. Seasonal changes in vertical distributions of the diameter of transparent exopolymer particle (TEP) types. Errors are ranges of estimates obtained using duplicate microscopic slides (n = 2).
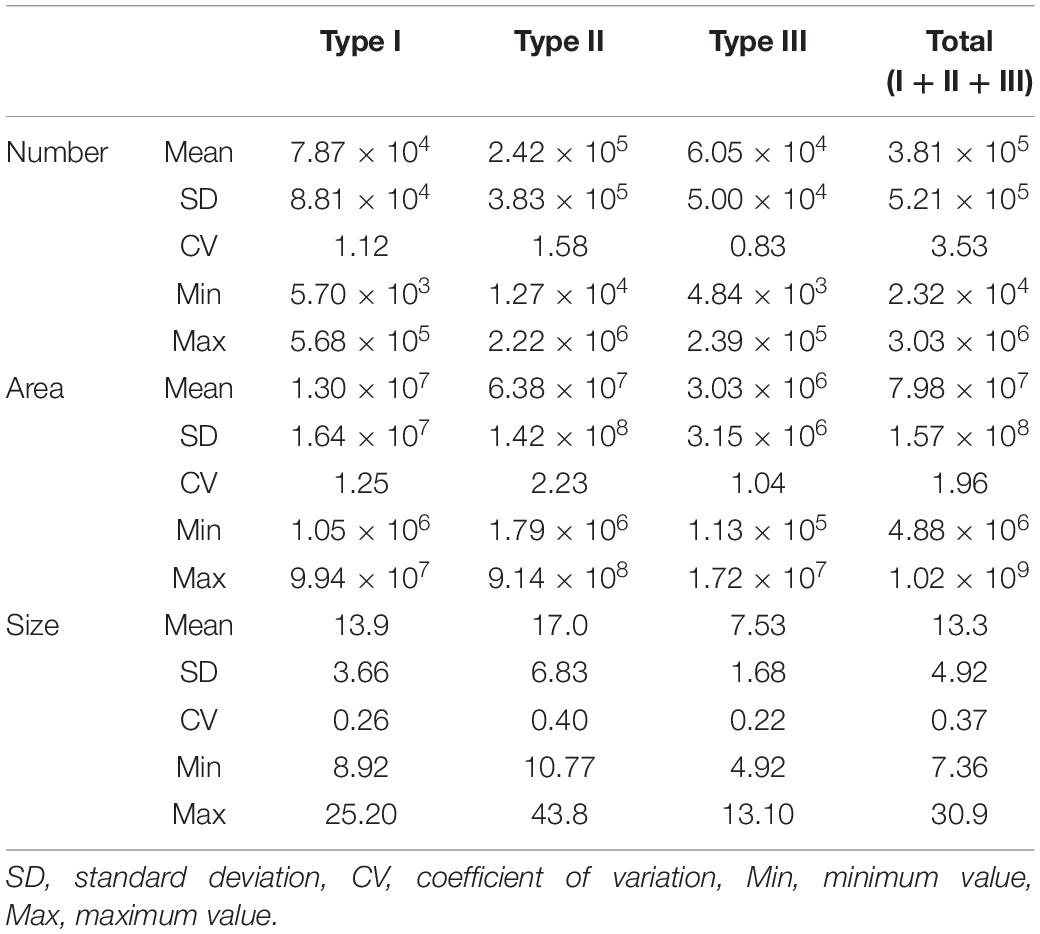
Table 2. Summary of the means and variability in transparent exopolymer particle (TEP) parameters [number (particles L–1), area (μm2 L–1), and mean diameter (μm)] for each TEP type and total TEPs; n = 56.
The TEP size distributions displayed unimodal patterns regardless of sampling month and TEP type (Supplementary Figure 2). This was probably owing to the underestimation of abundance for smaller-sized TEPs, because they could pass through the 2.0-μm pore-size filters (Mari and Kiørboe, 1996). After excluding the data in the smaller size ranges (Type I: < 4.23–5.93 μm, Type II: < 5.93–8.30 μm, Type III: < 3.02–4.23 μm, Type I + Type II + Type III: < 4.23–8.30 μm), the TEP size distributions generally fitted the power law model well (r2 = 0.90–0.99). β varied in the range of 2.644–3.688, 2.774–3.884, 2.819–3.801, and 2.744–4.222 for Types I, II, III, and Type I + II + III, respectively (Supplementary Figure 2 and Supplementary Table 2). There were no significant differences in the β values among the TEP types within each month (ANOVA). Correlations among the β values of the different types of TEPs were insignificant (p > 0.05, Pearson’s correlation analysis). To examine the relationship between β and the abundance of particles belonging to the smallest size range that we examined (10 μm), we calculated Pearson’s correlations between β and log Nd at D = 10 μm (Nd10μm), where Nd10μm is an indicator of particle load (Buonassissi and Dierssen, 2010). β was significantly positively correlated with log Nd10μm for Type I TEPs (r = 0.71, p < 0.05, n = 8), whereas the correlations were insignificant for other types of TEPs.
Correlations Between Transparent Exopolymer Particle Abundance and Environmental Variables
Pearson’s correlation analyses were conducted to examine the relationships between TEP abundance (number and area) and environmental variables (Chl a concentration, bacterial abundance, and seawater temperature) (Table 3). These variables were chosen because phytoplankton and bacteria are major TEP producers (Passow, 2002a), and TEP distribution is often shaped by the vertical temperature gradient of the water column (Bar-Zeev et al., 2009). Regardless of TEP type, the TEP number was significantly (p < 0.001) and positively correlated with bacterial abundance (Table 3), whereas the correlation between TEP number and Chl a was insignificant (p > 0.05). The TEP number was also significantly positively correlated with seawater temperature. The TEP area was significantly positively correlated with all the measured environmental variables, although the correlation coefficients for bacterial abundance (r = 0.585–0.807) were higher than those for Chl a (r = 0.307–0.563) and seawater temperature (r = 0.285–0.514). Among the pairs of variables, the highest correlation was found between Type II area and bacterial abundance (r = 0.807).
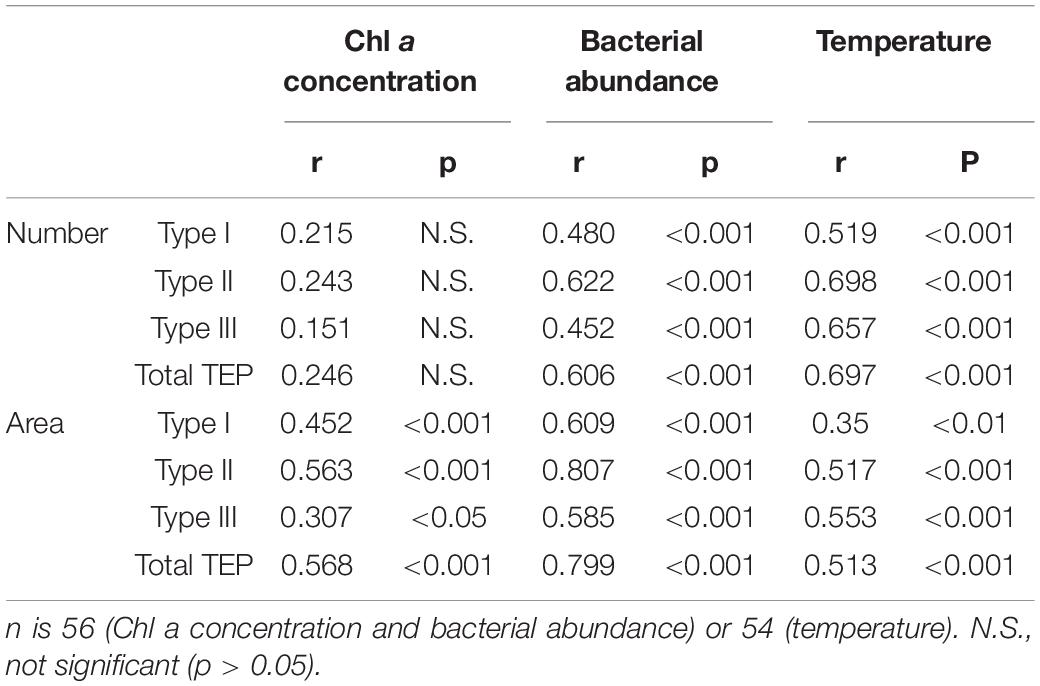
Table 3. Pearson’s correlation (r) between transparent exopolymer particle (TEP) abundance (number and area) and environmental variables (Chl a concentration, bacterial abundance, and temperature), after logarithmic transformation, except for temperature.
Discussion
Transparent exopolymer particle (TEP) number has been reported to be in the order of 105–107 particles L–1 in various marine environments, including in Monterey Bay, United States (Passow and Alldredge, 1994), off the coast of Peru (Engel and Galgani, 2016), in the Indian Ocean (Kumar et al., 1998), in Kattegat, Denmark (Mari and Kiørboe, 1996; Mari and Burd, 1998), and in Otsuchi Bay, Japan (Ramaiah et al., 2001). The TEP numbers in Sagami Bay (4.0 × 10⁴–3.0 × 10⁶ particles L–1) were generally within this range, except for some low values (104 particles L–1) found in winter (February and March). Because we used 2.0-μm pore-size filters instead of 0.2- or 0.4-μm pore-size filters, which have often been used in previous studies (Passow, 2002a), our estimates of TEP numbers are conservative.
Our results reveal the seasonal dynamics of TEPs in Sagami Bay. The high TEP abundance in April indicates that phytoplankton released a large amount of TEPs during a spring bloom. This result is consistent with previous observations in other coastal environments (Mari and Kiørboe, 1996; Ramaiah et al., 2001). Transparent exopolymer particle size (mean diameter) displayed seasonal variability, with the largest sizes being observed in April, especially in the subsurface layer (20 m) below the pycnocline. At the time of the April sampling, the low transparency (high turbidity) was associated with two consecutive days of precipitation preceding the sampling date (precipitation on April 11 and 12 was 42 and 66 mm, respectively; Odawara Weather Station, Japan Meteorological Agency, 2021). Conceivably, the loading of land-derived inorganic particles mediated by river runoff facilitated the coagulation and subsequent transfer of TEPs to the subsurface layers (Nagata et al., 2021). Our data also reveal that TEPs were abundantly produced during the stratification period in Sagami Bay. High TEP abundances were observed in June and August when nutrients were depleted in the mixing layer. This indicates that phytoplankton and bacteria under nutrient limitation actively produce TEPs and TEP precursors (Mari et al., 2005; Bar-Zeev et al., 2011; Deng et al., 2016).
The size distribution slopes (β values), which reflect the geometric features (fractal dimension, FD) of TEPs at steady state (Mari and Kiørboe, 1996), for individual TEP types and total TEPs were within the range of 2.6–4.2. Similar β ranges have been found in coastal environments in Denmark (Kattegat), where β values varied from 2.6–3.4 over a year (Mari and Burd, 1998). β did not display systematic variations among months and TEP types, except that there was a positive correlation between β and Nd10μm for Type I TEPs, the latter being an indicator of the extent of particle load (Buonassissi and Dierssen, 2010). The positive correlation partly reflects the fact that both β and Nd10μm were relatively low in winter (February and March) and high in summer (June and July) (Supplementary Figure 2 and Supplementary Table 2). Assuming a steady-state particle size distribution, the FD of Type I TEPs in winter (February and March) and summer (June and July) can be estimated to be 0.3–0.8 and 2.3–2.4, respectively, using an equation derived from dimensional analysis (FD = 2β− 5; for sheer coagulation; Jiang and Logan, 1991). Fractal dimension describes a geometric feature (the spatial structure) of the aggregates; a higher FD indicates more tightly packed aggregates (Logan and Wilkinson, 1990). Therefore, our results suggest that Type I TEPs were more tightly packed in summer (higher particle load) than in winter (lower particle load). Alternatively, the variability in β may reflect the non-steady-state conditions of the TEPs, involving processes other than coagulation (e.g., grazing), or both (Mari and Kiørboe, 1996).
In seawater culture experiments using samples collected in Sagami Bay, Sugimoto et al. (2007) found that TEPs densely colonized by bacteria, which correspond to the Type III TEPs in this study, accumulated abundantly during bacterial growth. Because the seawater was prefiltered through a 0.8-μm pore-size filter to eliminate phytoplankton and grazers, this accumulation of TEPs was ascribed to bacterial TEP production, bacterial enhancement of TEP precursor coagulation, or both. The authors suggested that bacteria-driven TEP production was potentially substantial in Sagami Bay, renewing 9–37% of TEP standing stocks per day. Despite the potentially high production rates of Type III TEPs in Sagami Bay, the results of the present study reveal that Type III TEPs generally only accounted for a small fraction of the total TEPs in terms of area, although their contribution in terms of number reached 19–34% of the total TEP number throughout the year. These results suggest that, in the natural environment of Sagami Bay, which differs from the conditions in the seawater cultures used by Sugimoto et al. (2007), Type III TEPs rapidly coagulate with other particles to form Type II TEPs. Similarly, Type I TEPs may also rapidly coagulate with other particles to form Type II TEPs. Thus, Type III and Type I TEPs likely represent transient phases of TEP development, characterized by high turnover and relatively low abundance in terms of area. This model is partly consistent with the results showing a decrease in the relative abundance of Type II TEPs (area) in February, when the Chl a concentration was low. It is likely that the particles, such as algae and detritus, available for coagulation with Type I and Type III TEPs were less abundant and that the frequency of collisions among all particles, including TEPs, decreased in February, leading to a decrease in the formation of Type II TEPs (i.e., the coagulation of Type I and Type III TEPs with other particles).
Our analysis of relationships between TEPs and environmental parameters revealed that the highest correlations were found between TEPs (number and area) and bacterial abundance for all types of TEPs, as well as for total TEPs. Of note, regardless of TEP type, the correlation coefficients between TEPs and bacteria were always higher than those between TEPs and Chl a (Table 3). This, combined with previous results showing active TEP production by bacteria in Sagami Bay (Sugimoto et al., 2007), suggests that our correlation results reflect the important role that bacteria play in the regulation of TEP dynamics in Sagami Bay. Consistent with our results, previous studies have found that TEP concentrations increase with increasing bacterial abundance and production in marine environments (Bar-Zeev et al., 2009; Ortega-Retuerta et al., 2009; Ortega-Retuerta et al., 2010; Yamada et al., 2017). Our results add to the previous proposition by demonstrating that such relationships hold for different types of TEPs. A conceptual model to explain bacterial roles as a driver of TEP dynamics is presented in Figure 6. Both bacteria and phytoplankton can produce TEP precursors (Passow, 2002a), which can drive the formation of Type I TEPs. This process is likely mediated by the spontaneous formation of nanogels (Chin et al., 1998; Verdugo et al., 2004) and their subsequent aggregation (Burd and Jackson, 2009). In addition to the role as a producer of TEP precursors, bacteria can also contribute to the formation of Type III TEPs (Sugimoto et al., 2007). Type I and Type III TEPs can aggregate with various particles suspended in seawater (phytoplankton, bacteria, and organic and inorganic detritus), leading to the formation of Type II TEPs. Although the largest pool of TEPs in Sagami Bay was usually Type II TEPs, Type I and Type III TEPs are considered to play pivotal roles as intermediate pools of TEP transitions. The low relative abundance of Type III TEPs, despite the fact that Type III TEPs were abundantly produced in seawater cultures at rates potentially able to replace the TEP standing stock in <10 days (Sugimoto et al., 2007), suggests that Type III TEPs are a transient component with a high turnover time. Obviously, our model does not capture the complexity of TEP dynamic regulation in marine environments. Bacterial production is fueled by dissolved organic matter produced by phytoplankton, mediated by grazer and virus activities (Cole et al., 1988; Nagata, 2000), implying that bacterial TEP production is ultimately limited by phytoplankton production. In fact, an experimental study revealed that TEP formation is intimately controlled by bacteria–phytoplankton interactions (Van Oostende et al., 2013). An additional level of complexity arises from the fact that bacteria might act not only as TEP producers but also as decomposers of TEPs (Ortega-Retuerta et al., 2017; Nagata et al., 2021). Furthermore, activities of grazers and viruses might affect TEP dynamics in a complex manner (Bhaskar and Bhosle, 2005; Yamada et al., 2018). Future studies are required to better understand the role of bacteria, phytoplankton, other food web components, as well as interactions among them, in the regulation of the internal dynamics of TEPs.
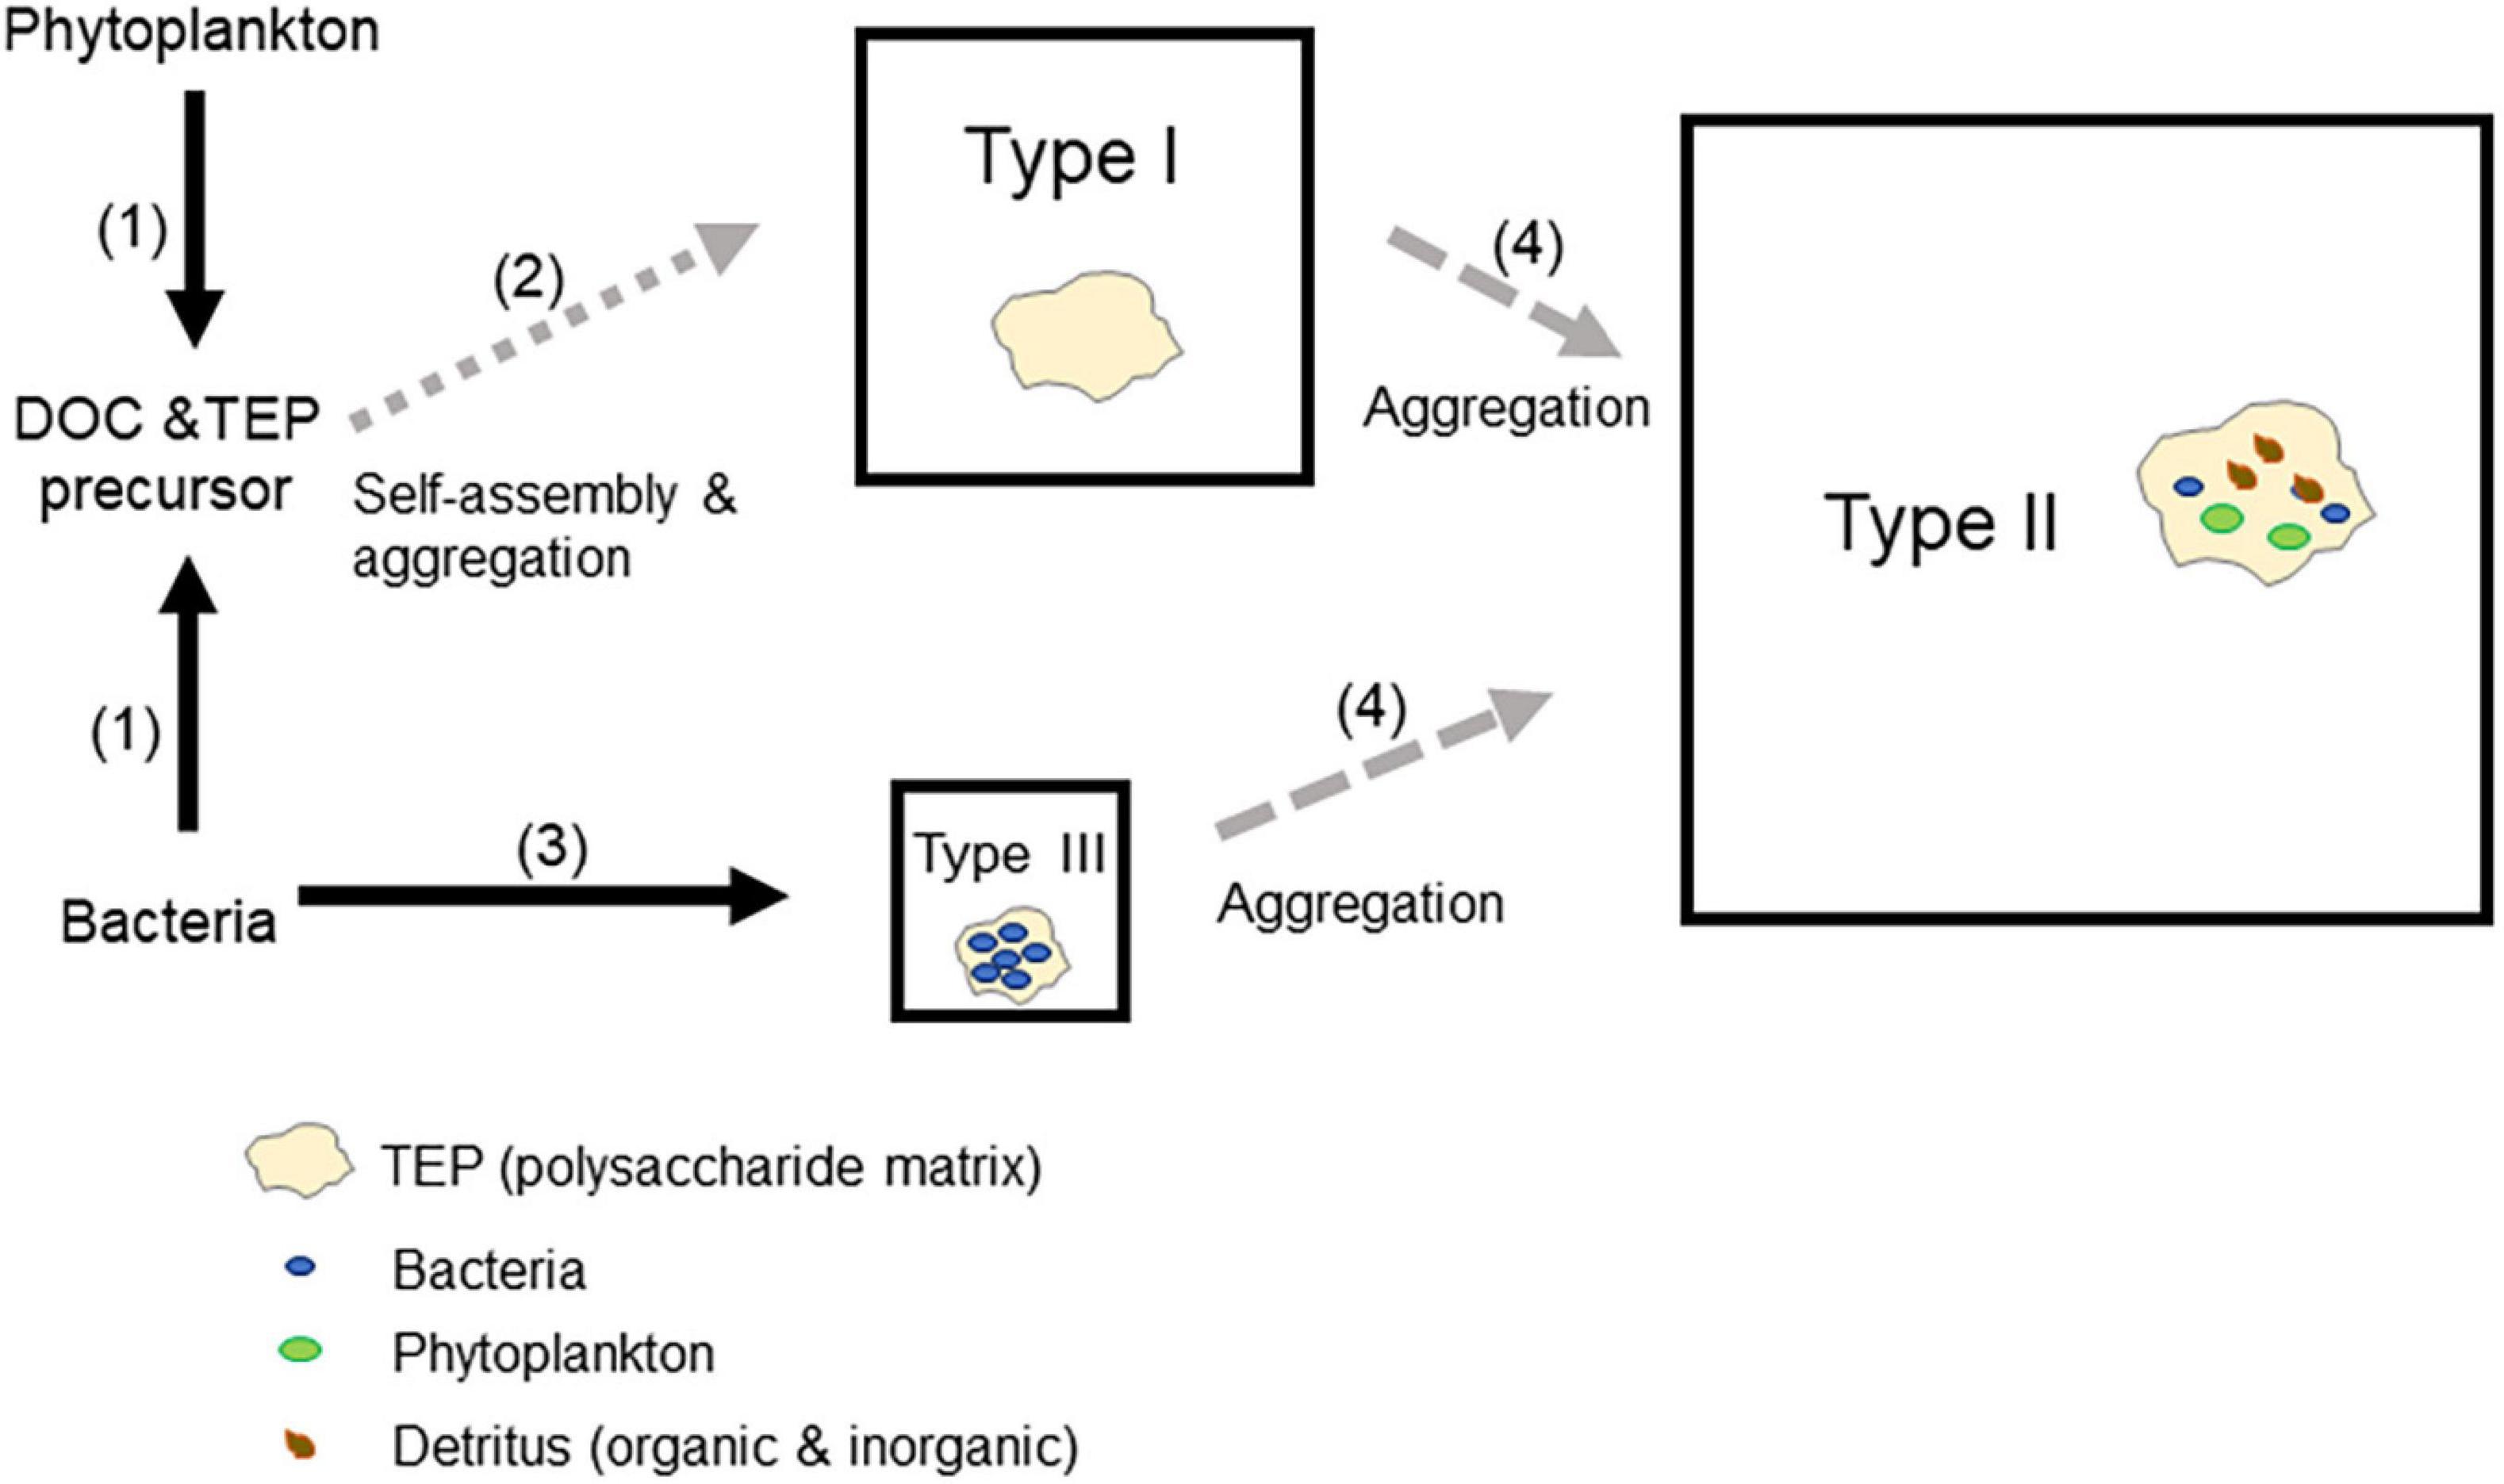
Figure 6. A conceptual model to explain bacterial roles as drivers of transparent exopolymer particle (TEP) dynamics. (1) Both bacteria and phytoplankton produce TEP precursors (Passow, 2002a). (2) Type I TEPs are formed via the spontaneous formation of nanogels (Chin et al., 1998; Verdugo et al., 2004) and their subsequent aggregation (Burd and Jackson, 2009). (3) Bacteria contribute to the formation of Type III TEPs (Sugimoto et al., 2007). (4) Type I and Type III TEPs aggregate with various particles suspended in seawater (phytoplankton, bacteria, and organic and inorganic detritus), leading to the formation of Type II TEPs. The area of a square representing a TEP type reflects the percentage contribution of each type of TEP to the total TEP in terms of area (an average of all months and depths). Note that this scheme emphasizes TEP production pathways. Loss processes (e.g., bacterial degradation and grazing) and fragmentation processes (e.g., disruption of TEPs owing to turbulence and grazer-induced disturbance) are not depicted for simplicity.
Concluding Remarks and Future Perspectives
We examined seasonal and vertical variations in the abundance of different types of TEPs in Sagami Bay. The TEP assemblages were generally dominated by Type II TEPs in terms of area, except in February, when the contribution of Type I TEPs was high. Type III TEPs contributed significantly to the total TEPs in terms of number, although their contributions in terms of area were low because of their small particle sizes. Apparently, Type I and Type III TEPs are rapidly incorporated into the Type II TEPs during the productive period in the bay. The results of our TEP size distribution analyses revealed that the size distribution slopes, which reflect the geometric features of TEPs, of each type of TEP changed dynamically with season. The abundance of each type of TEP was significantly positively correlated with bacterial abundance, suggesting that bacteria play an important role in the regulation of TEP dynamics in Sagami Bay. We proposed a conceptual model to explain the major role of bacteria as a driver of the internal dynamics of TEPs.
Important areas for future research include elucidation of the biogeochemical role of each type of TEP in marine systems. Currently, there are divergent views on the role of TEPs in the transfer of carbon and pollutants, such as microplastics, in marine environments. One view emphasizes that TEPs facilitate particle aggregation and enhance downward transport of materials, especially when TEPs are aggregated with dense particles (ballasts) (Passow, 2002a; Mari et al., 2017). The other perspective stresses that TEPs are porous and less dense and enhance the retention and ascending flux of TEPs in the upper water (Azetsu-Scott and Passow, 2004; Jennings et al., 2017; Mari et al., 2017). Although the current model generally assumes TEPs to be a homogeneous pool (Passow, 2002a; Wurl et al., 2011; Mari et al., 2017; Nagata et al., 2021), TEPs in fact consist of distinctive and interacting pools of TEP subgroups, as revealed by the present study (Figure 6). Models assuming TEPs to be a homogeneous pool might be compromised if different TEP subgroups behave differently in transfer processes. Therefore, our results highlight the importance of investigating TEP internal dynamics and controls to improve our understanding of the role of TEPs in carbon and pollutant transfer in marine environments.
Data Availability Statement
The original contributions presented in the study are included in the article/Supplementary Material, further inquiries can be directed to the corresponding author.
Author Contributions
KS, HF, and IK designed the study plan. HF collected samples. KS conducted TEP analyses. KS, HF, and TN analyzed the data. KS, HF, IK, and TN wrote the manuscript. All authors contributed to the article and approved the submitted version.
Funding
This study was supported by the JSPS KAKENHI grants No. JP19H05667, JP17H06294, and JP21H03586.
Conflict of Interest
The authors declare that the research was conducted in the absence of any commercial or financial relationships that could be construed as a potential conflict of interest.
Publisher’s Note
All claims expressed in this article are solely those of the authors and do not necessarily represent those of their affiliated organizations, or those of the publisher, the editors and the reviewers. Any product that may be evaluated in this article, or claim that may be made by its manufacturer, is not guaranteed or endorsed by the publisher.
Acknowledgments
We thank Tomohiko Kikuchi and the staff of Yokohama National University for help in conducting field sampling.
Supplementary Material
The Supplementary Material for this article can be found online at: https://www.frontiersin.org/articles/10.3389/fmars.2021.766771/full#supplementary-material
References
Alldredge, A. L., Passow, U., and Logan, B. E. (1993). The abundance and significance of a class of large, transparent organic particles in the ocean. Deep Sea Res. Part I 40, 1131–1140. doi: 10.1016/0967-0637(93)90129-Q
Azetsu-Scott, K., and Passow, U. (2004). Ascending marine particles: significance of transparent exopolymer particles (TEP) in the upper ocean. Limnol. Oceanogr. 49, 741–748.
Bar-Zeev, E., Berman, T., Rahav, E., Dishon, G., Herut, B., Kress, N., et al. (2011). Transparent exopolymer particle (TEP) dynamics in the eastern Mediterranean Sea. Mar. Ecol. Prog. Ser. 431, 107–118.
Bar-Zeev, E., Berman-Frank, I., Stambler, N., Domínguez, E. V., Zohary, T., Capuzzo, E., et al. (2009). Transparent exopolymer particles (TEP) link phytoplankton and bacterial production in the Gulf of Aqaba. Aquat. Microb. Ecol. 56, 217–225. doi: 10.3354/ame01322
Bhaskar, P. V., and Bhosle, N. B. (2005). Microbial extracellular polymeric substances in marine biogeochemical processes. Curr. Sci. 88, 45–53.
Bhaskar, P. V., Grossart, H. P., Bhosle, N. B., and Simon, M. (2005). Production of macroaggregates from dissolved exopolymeric substances (EPS) of bacterial and diatom origin. FEMS Microbiol. Ecol. 53, 255–264. doi: 10.1016/j.femsec.2004.12.013
Buonassissi, C. J., and Dierssen, H. M. (2010). A regional comparison of particle size distributions and the power law approximation in oceanic and estuarine surface waters. J. Geophys. Res. 115:C10028.
Burd, A., and Jackson, G. A. (2009). Particle aggregation. Annu. Rev. Mar. Sci. 1, 65–90. doi: 10.1146/annurev.marine.010908.163904
Busch, K., Endres, S., Iversen, M. H., Michels, J., Nöthig, E. M., and Engel, A. (2017). Bacterial colonization and vertical distribution of marine gel particles (TEP and CSP) in the Arctic Fram Strait. Front. Mar. Sci. 4:166. doi: 10.3389/fmars.2017.00166
Chen, F., Lu, J. R., Binder, B. J., Liu, Y. C., and Hodson, R. E. (2001). Application of digital image analysis and flow cytometry to enumerate marine viruses stained with SYBR Gold. Appl. Environ. Microbiol. 67, 539–545. doi: 10.1128/AEM.67.2.539-545.2001
Chin, W. C., Orellana, M. V., and Verdugo, P. (1998). Spontaneous assembly of marine dissolved organic matter into polymer gels. Nature 391, 568–572.
Cole, J. J., Findlay, S., and Pace, M. L. (1988). Bacterial production in fresh and saltwater ecosystems: a cross-system overview. Mar. Ecol. Prog. Ser. 43, 1–10.
Deng, W., Cruz, B. N., and Neuer, S. (2016). Effects of nutrient limitation on cell growth, TEP production and aggregate formation of marine Synechococcus. Aquat. Microb. Ecol. 78, 39–49.
Engel, A., Endres, S., Galgani, L., and Schartau, M. (2020). Marvelous marine microgels: on the distribution and impact of gel-like particles in the oceanic water-column. Front. Mar. Sci. 7:405. doi: 10.3389/fmars.2020.00405
Engel, A., and Galgani, L. (2016). The organic sea-surface microlayer in the upwelling region off the coast of Peru and potential implications fro air-sea exchange process. Biogeosciences 13, 989–1007. doi: 10.5194/bg-13-989-2016
Engel, A., and Passow, U. (2001). Carbon and nitrogen content of transparent exopolymer particle (TEP) in relation to their Alcian Blue adsorption. Mar. Ecol. Prog. Ser. 219, 1–10. doi: 10.3354/meps219001
Engel, A., Thoms, S., Riebesell, U., and Rochelle-Newall, E. (2004). Polysaccharide aggregation as a potential sink of marine dissolved organic carbon. Nature 428, 929–932. doi: 10.1038/nature02453
Fukuda, R., Ogawa, H., Nagata, T., and Koike, I. (1998). Direct determination of carbon and nitrogen contents of natural bacterial assemblages in marine environments. Appl. Environ. Microbiol. 64, 3352–3358.
Galgani, L., Piontek, J., and Engel, A. (2016). Biopolymers form a gelatinous microlayer at the air-sea interface when Arctic sea ice melts. Sci. Rep. 6:29465. doi: 10.1038/srep29465
Galgani, L., Tsapakis, M., Pitta, P., Tsiola, A., Tzempelikous, E., Kalantzi, I., et al. (2019). Microplastics increase the marine production of particulate forms of organic matter. Environ. Res. Lett. 14:124085. doi: 10.1088/1748-9326/ab59ca
Gogou, A., and Repeta, D. J. (2010). Particulate-dissolved transformations as a sink for semi-labile dissolved organic matter: chemical characterization of high molecular weight dissolved and surface-active organic matter in seawater and in diatom cultures. Mar. Chem. 121, 215–223. doi: 10.1016/j.marchem.2010.05.001
Harlay, J., De Bodt, C., Engel, A., Jansen, S., d’Hoop, Q., Piontek, J., et al. (2009). Abundance and size distribution of transparent exopolymer particles (TEP) in a coccolithophorid bloom in the northern Bay of Biscay. Deep Sea Res. Part I Oceanogr. Res. Pap. 56, 1251–1265. doi: 10.1016/j.dsr.2009.01.014
Japan Meteorological Agency (2021). Available online at: https://www.jma.go.jp/jma/index.html (accessed July 14, 2021).
Jennings, M. K., Passow, U., Wozniak, A. S., and Hansell, D. A. (2017). Distribution of transparent exopolymer particles (TEP) across and organic carbon gradient in the western North Atlantic Ocean. Mar. Chem. 190, 1–12.
Jiang, Q., and Logan, B. E. (1991). Fractal dimensions of aggregates determined from steady-state size distributions. Environ. Sci. Technol. 16, 303–309.
Kiørboe, T. (2003). Marine snow microbial communities: scaling of abundances with aggregate size. Aquat. Microb. Ecol. 33, 67–75. doi: 10.3354/ame033067
Koenings, J. P., and Edmundson, J. A. (1991). Secchi disk and photometer estimates of light regimes in Alaskan lakes: effects of yellow color and turbidity. Limnol. Oceanogr. 36, 91–105.
Kumar, M. D., Sarma, V. V. S. S., Ramaiah, N., Gauns, M., and De Sousa, S. N. (1998). Biogeochemical significance of transport exopolymer particles in the Indian Ocean. Geophys. Res. Lett. 25, 81–84. doi: 10.1029/97GL03481
Li, S., Winters, H., Villacorte, L. O., Ekowati, Y., Emwas, A. H., Kennedy, M. D., et al. (2015). Compositional similarities and differences between transparent exopolymer particles (TEPs) from two marine bacteria and two marine algae: significance to surface biofouling. Mar. Chem. 174, 131–140. doi: 10.1016/j.marchem.2015.06.009
Linley, E. A. S., and Field, J. G. (1982). The nature and ecological significance of bacterial aggregation in a nearshore upwelling ecosystem. Estuar. Coast Shelf Sci. 14, 1–11. doi: 10.1016/s0302-3524(82)80063-7
Logan, B. E., Grossart, H. P., and Simon, M. (1994). Direct observation of phytoplankton, TEP and aggregates on polycarbonate filters using brightfield microscopy. J. Plankton Res. 16, 1811–1815. doi: 10.1093/plankt/16.12.1811
Logan, B. E., and Wilkinson, D. B. (1990). Fractal geometry of marine snow and other biological aggregates. Limnol. Oceanogr. 35, 130–136.
Mari, X., and Burd, A. (1998). Seasonal size spectra of transparent exopolymeric particles (TEP) in a coastal sea and comparison with those predicted using coagulation theory. Mar. Ecol. Prog. Ser. 163, 63–76. doi: 10.3354/meps163063
Mari, X., and Kiørboe, T. (1996). Abundance, size distribution and bacterial colonization of transparent exopolymeric partiles (TEP) during spring in the Kattegat. J. Plankton Res. 18, 969–986. doi: 10.1093/plankt/18.6.969
Mari, X., Passow, U., Migon, C., Burd, A. B., and Legendre, L. (2017). Transparent exopolymer particles: effects on carbon cycling in the ocean. Prog. Oceanogr. 151, 13–37.
Mari, X., Rassoulzadegan, F., Brussaard, C. P. D., and Wassmann, P. (2005). Dynamics of transparent exopolymeric particles (TEP) production by Phaeocystis globose under N- or P-limitation: a controlling factor of the retention/export balance. Harmful Algae 4, 895–914. doi: 10.1016/j.hal.2004.12.014
Nagata, T. (2000). “Production mechanisms of dissolved organic matter,” in Microbial Ecology of the Oceans, ed. D. L. Kirchman (New York, NY: John Wiley & Sons), 121–152.
Nagata, T., Yamada, Y., and Fukuda, H. (2021). Transparent exopolymer particles in deep oceans: synthesis and future challenges. Gels 2021:75. doi: 10.3390/gels7030075
Najdek, M., Blažina, M., Fuks, D., Ivančić, I., and Šilović, T. (2011). Intrusion of high-salinity water causes accumulation of transparent exopolymer particles (TEP) in the northern Adriatic Sea. Aquat. Microb. Ecol. 63, 69–74. doi: 10.3354/ame01476
Ortega-Retuerta, E., Duarte, C. M., and Reche, I. (2010). Significance of bacterial activity for the distribution and dynamics of transparent exopolymer particles in the Mediterranean Sea. Microb. Ecol. 59, 808–818. doi: 10.1007/s00248-010-9640-7
Ortega-Retuerta, E., Reche, I., Pulido-Villena, E., Agustí, S., and Duarte, C. M. (2009). Uncoupled distributions of transparent exopolymer particles (TEP) and dissolved carbohydrates in the Southern Ocean. Mar. Chem. 115, 59–65. doi: 10.1016/j.marchem.2009.06.004
Ortega-Retuerta, E., Sala, M. M., Borrull, E., Mestre, M., Aparicio, F., Gallisai, R., et al. (2017). Horizontal and vertical distributions of transparent exopolymer particles (TEP) in the NW Mediterranean Sea are linked to chlorophyll a and O2 variability. Front. Microbiol. 7:2159. doi: 10.3389/fmicb.2016.02159
Passow, U. (2002a). Transparent exopolymer particles (TEP) in aquatic environments. Prog. Ocean. 55, 287–333. doi: 10.1016/S0079-6611(02)00138-6
Passow, U. (2002b). Production of transparent exopolymer particles (TEP) by phyto-and bacterioplankton. Mar. Ecol. Prog. Ser. 236, 1–12. doi: 10.3354/meps236001
Passow, U., and Alldredge, A. L. (1994). Distribution, size and bacterial colonization of transparent exopolymer particles (TEP) in the ocean. Mar. Ecol. Prog. Ser. 113, 185–198.
Passow, U., Alldredge, A. L., and Logan, B. E. (1994). The role of particulate carbohydrate exudates in the flocculation of diatom blooms. Deep Sea Res. Part I 41, 335–357. doi: 10.1016/0967-0637(94)90007-8
Passow, U., and Carlson, C. A. (2012). The biological pump in a high CO2 world. Mar. Ecol. Prog. Ser. 470, 249–271. doi: 10.3354/meps09985
Passow, U., Sweet, J., and Quigg, A. (2017). How the dispersant corexit impacts the formation of sinking marine oil snow. Mar. Pollut. Bull. 125, 139–145.
Piontek, J., Handel, N., Langer, G., Wohlers, J., Riebesell, U., and Engel, A. (2009). Effects of rising temperature on the formation and microbial degradation of marine diatom aggregates. Aquat. Microb. Ecol. 54, 305–318. doi: 10.3354/ame01273
Quigg, A., Passow, U., Chin, W. C., Xu, C., Doyle, S., Bretherton, L., et al. (2016). The role of microbial exopolymers in determining the fate of oil and chemical dispersants in the ocean. Limnol. Oceanogr. Lett. 1, 3–26. doi: 10.1002/lol2.10030
Radić, T., Ivancic, I., Fuks, D., and Radić, J. (2006). Marine bacterioplankton production of polysaccharidic and proteinaceous particles under different nutrient regimes. FEMS Microbiol. Ecol. 58, 333–342. doi: 10.1111/j.1574-6941.2006.00176.x
Ramaiah, N., Yoshikawa, T., and Furuya, K. (2001). Temporal variations in transparent exopolymer particles (TEP) associated with a diatom spring bloom in subarctic ria in Japan. Mar. Eco. Prog. Ser. 212, 79–88.
Rochelle-Newll, E. J., Mari, X., and Pringualt, O. (2010). Sticking properties of transparent exopolymeric particles (TEP) during aging and biodegradation. J. Plankton Res. 32, 1433–1442. doi: 10.1093/plankt/fbq060
Strickland, J. D. H., and Parsons, T. W. (1972). A Practical Handbook of Seawater Analysis. Bulletin 167. Ottawa, ON: Fisheries Research Board of Canada, 310.
Sugimoto, K., Fukuda, H., Baki, M. A., and Koike, I. (2007). Bacterial contributions to formation of transparent exopolymer particles (TEP) and seasonal trends in coastal waters of Sagami Bay. Japan. Aquat. Microb. Ecol. 46, 31–41. doi: 10.3354/ame046031
Suzuki, R., and Ishimaru, T. (1990). An improved method for the determination of phytoplankton chlorophyll using N, N-dimethylformamide. J. Oceanogr. Soc. Jpn. 46, 190–194. doi: 10.1007/BF02125580
Taylor, J. D., Cottingham, S. D., Billinge, J., and Cunliffe, M. (2014). Seasonal microbial community dynamics correlate with phytoplankton-derived polysaccharides in surface coastal waters. ISME J. 8, 245–248. doi: 10.1038/ismej.2013.178
Thornton, D. C. O. (2009). Effect of low pH on Carbohydrate production by a marine planktonic diatom (Chaetoceros muelleri). Int. J. Ecol. 2009:105901. doi: 10.1155/2009/105901
Van Oostende, N., Moerdijk-Poortvliet, T. C. W., Boschker, H. T. S., Vyverman, W., and Sabbe, K. (2013). Release of dissolved carbohydrates by Emiliania huxleyi and formation of transparent exopolymer particles depend on algal life cycle and bacterial activity. Environ. Microb. 15, 1514–1531.
Verdugo, P., Alldredge, A. L., Azam, F., Kirchman, D. L., Passow, U., and Santschi, P. H. (2004). The oceanic gel phase: a bridge in the DOM-POM continuum. Mar. Chem. 92, 67–85.
Wurl, O., and Holmes, M. (2008). The gelatinous nature of the sea-surface microlayer. Mar. Chem. 110, 89–97. doi: 10.1016/j.marchem.2008.02.009
Wurl, O., Miller, L., and Vagle, S. (2011). Production and fate of transparent exopolymer particles in the ocean. J. Geophys. Res. 116:C00H13.
Yamada, Y., Tomaru, Y., Fukuda, H., and Nagata, T. (2018). Aggregate formation during the viral lysis of a marine diatom. Front. Mar. Sci. 5:167. doi: 10.3389/fmars.2018.00167
Keywords: microscopic analysis, bacterial clumps, particle size distribution, aggregation, aggregate geometry, particle stickiness, carbon and pollutant transport, biogeochemical cycles
Citation: Sugimoto K, Fukuda H, Koike I and Nagata T (2021) Heterogeneity of Transparent Exopolymer Particles in a Coastal Marine Environment (Sagami Bay, Japan): Seasonal Variation and Its Possible Bacterial Causes. Front. Mar. Sci. 8:766771. doi: 10.3389/fmars.2021.766771
Received: 30 August 2021; Accepted: 18 November 2021;
Published: 23 December 2021.
Edited by:
Jun Sun, China University of Geosciences Wuhan, ChinaReviewed by:
Alfonso Corzo, University of Cadiz, SpainManuel Dall’Osto, Institute of Marine Sciences, Spanish National Research Council (CSIC), Spain
Copyright © 2021 Sugimoto, Fukuda, Koike and Nagata. This is an open-access article distributed under the terms of the Creative Commons Attribution License (CC BY). The use, distribution or reproduction in other forums is permitted, provided the original author(s) and the copyright owner(s) are credited and that the original publication in this journal is cited, in accordance with accepted academic practice. No use, distribution or reproduction is permitted which does not comply with these terms.
*Correspondence: Kugako Sugimoto, a3N1Z2ltb3RvQHNoaW1vZGEudHN1a3ViYS5hYy5qcA==