 Verena H. Wang
 Carley R. Zapfe
 Frank J. Hernandez
- Division of Coastal Sciences, School of Ocean Sciences and Engineering, University of Southern Mississippi, Ocean Springs, MS, United States
The early life stages of fishes play a critical role in pelagic food webs and oceanic carbon cycling, yet little is known about the taxonomic composition and distribution of larval fishes in the northern Gulf of Mexico (GOM) below the epipelagic (<200 m). Here, we provide the first large-scale characterization of larval fish assemblages in the GOM across epipelagic, mesopelagic, and bathypelagic regions (0–1,500 m), using samples collected during the Natural Resource Damage Assessment conducted following the Deepwater Horizon oil spill (DWHOS). These data contain > 130,000 ichthyoplankton specimens from depth-discrete plankton samples collected across 48 stations in the GOM during six cruises conducted in 2010 and 2011. We examined indices of abundance and diversity, and used a multivariate regression tree approach to model the relationship between larval fish assemblages and environmental conditions. The total abundance of larval fish followed a generally decreasing trend with increasing depth, and family-level richness and diversity were significantly higher in the epipelagic than mesopelagic and bathypelagic regions. Fourteen distinct assemblage groups were identified within the epipelagic, with depth, surface salinity, and season contributing to the major branches separating groups. Within the mesopelagic, seven distinct assemblage groups were identified and were largely explained by variation in depth, season, and surface temperature. Bathypelagic assemblages were poorly described by environmental conditions. The most common epipelagic assemblage groups were widely distributed across the GOM, as were all mesopelagic assemblage groups, suggesting limited horizontal structuring of GOM larval fishes. Of the mesopelagic-associated fish taxa, four dominant families (Myctophidae, Gonostomatidae, Sternoptychidae, Phosichthyidae) comprised the majority of the catch in both the epipelagic (63%) and combined mesopelagic and bathypelagic (97%) regions. Dufrêne-Legendre indicator analysis confirmed that these dominant families were characteristic of epipelagic and mesopelagic assemblages; the larvae of less common mesopelagic-associated families largely identified with epipelagic assemblage groups. A lack of baseline data about the distribution patterns of early life stages of mesopelagic fishes in the GOM was apparent following the DWHOS, and these findings provide a valuable reference point in the face of future ecosystem stressors.
Introduction
Open ocean ecosystems are dominated by mesopelagic fishes, which occupy depths between 200 and 1,000 m and collectively comprise the largest proportion of global fish biomass (Irigoien et al., 2014). As both major consumers of microzooplankton and key prey for pelagic predators, including commercially important species, mesopelagic fishes provide an important intermediate link in the pelagic food web (Choy et al., 2013; Young et al., 2015; Drazen and Sutton, 2017). Additionally, the diel vertical migration behavior characteristic of many mesopelagic fish taxa contributes to the global carbon cycle, actively transporting carbon consumed in the epipelagic to the mesopelagic, where it is deposited via respiration, fecal material, or mortality (Davison et al., 2013). While the importance of mesopelagic fishes to ecosystem function is now well recognized, the early life history stages of these taxa remain understudied.
Larval mesopelagic fishes are a large, often numerically dominant, component of oceanic ichthyoplankton catch in regions worldwide (e.g., eastern North Pacific, Moser and Smith, 1993; western North Pacific, Sassa et al., 2004; northwest Mediterranean, Olivar et al., 2010; equatorial and tropical Atlantic, Olivar et al., 2018; southern Gulf of Mexico, Daudén-Bengoa et al., 2020). Mesopelagic larvae are thought to be largely constrained to productive epipelagic regions of the water column (<200 m) with limited or small-scale diel vertical movements relative to adults (Ahlstrom, 1959; Sassa et al., 2002). However, broad-scale surveys of ichthyoplankton rarely sample at depths exceeding 200 m (exceptions include Moser and Smith, 1993; Sassa and Kawaguchi, 2006; Olivar et al., 2018; Dove et al., 2021), so mesopelagic larval dynamics throughout the water column remain largely unknown.
Understanding the spatial and temporal distributions of larval fish assemblages and the physical processes that shape them can provide insights into the patterns that structure adult populations (Fuiman and Werner, 2002). Indeed, the geographic distributions of adult mesopelagic fishes have been found to reflect larval fish distributions accurately, relative to the dispersal potential of the larval stage (Olivar et al., 2017, 2018). Because of their limited mobility and high vulnerability (Houde, 1989), larval fish assemblage dynamics are heavily influenced by oceanographic features and often reflect changes in the marine environment (Kingsford, 1993; Brodeur et al., 2008; Hsieh et al., 2009). This makes the early life stages of fishes uniquely susceptible to environmental perturbations, which can have impacts on adult recruitment, food web dynamics, and broader ecosystem services.
In the northern Gulf of Mexico (GOM), the Deepwater Horizon Oil Spill (DWHOS) occurred at ∼1,500 m depth in April 2010 and exposed a deficiency in baseline data for deep-sea ecosystems in the GOM and beyond (Ramirez-Llodra et al., 2011; Fisher et al., 2016). The adult stages of mesopelagic fishes have long been studied in the GOM, albeit on a limited spatial scale (see Hopkins et al., 1996) or without depth-discrete sampling (Murdy et al., 1983); focus on quantifying the ecology of the mesopelagic GOM, including fishes, has increased dramatically in the wake of DWHOS (Cook et al., 2020). Mesopelagic fish larvae, however, receive little targeted attention in the GOM. Studies of broad-scale ichthyoplankton assemblages in the GOM that include (but are not focused on) mesopelagic fish taxa are constrained to sampling of the epipelagic region (Muhling et al., 2012; Lyczkowski-Shultz et al., 2013; Meinert et al., 2020) and to coastal waters (Rakocinski et al., 1996; Carassou et al., 2012). High abundances of mesopelagic larvae in the mixed layer (0–100 m) of the open ocean GOM suggest that epipelagic regions represent important habitat for these taxa during early development (Meinert et al., 2020), but questions remain about larval distribution patterns and usage of mesopelagic portions of the water column.
Adult mesopelagic fish assemblages have been found to lack geographic and temporal patterns of structure in the GOM, suggesting that these assemblages are well-mixed and highly dispersed over large distances despite variation in local oceanographic features (Ross et al., 2010; Milligan and Sutton, 2020). On the continental shelf, distributions of larval mesopelagic fishes in the GOM were largely explained by sampling depth and were not associated with environmental factors, despite strong correlation of epipelagic-associated larval fishes to sea surface temperature (Muhling et al., 2012). These previous findings suggest that mesopelagic larval fishes in the oceanic GOM may have limited spatial assemblage structure, although the response of vertical assemblage distribution to environmental drivers remains unknown.
Here, we characterize the dynamics of larval fish assemblages across epipelagic, mesopelagic, and bathypelagic (0–1,500 m) regions of the GOM, encompassing both epipelagic- and mesopelagic-associated fish families. We examine indices of abundance and diversity, as well as environmental drivers of larval fish assemblage structure in the different pelagic zones. Insights into the spatial and temporal scale of variability in pelagic ichthyoplankton communities in the GOM will provide a reference point for a previously unstudied ecosystem that may guide response efforts to future environmental perturbations.
Materials and Methods
Sample Collection
Sample collection and specimen identification were conducted as part of the Deepwater Horizon Oil Spill Natural Resource Damage Assessment (DWH NRDA) effort. Our study focused on six deep-pelagic plankton cruises conducted during Fall 2010 and Spring 2011 (Table 1), encompassing 48 stations in the northern Gulf of Mexico (Figure 1). Samples were collected using a multiple opening/closing net and environmental sensing system (MOCNESS) with a 1 m2 opening and 333 μm mesh nets. The MOCNESS simultaneously collects plankton while using mounted sensors to measure conductivity, temperature, and depth, and a flowmeter to record the volume of water filtered for each net sample. Paired day and night oblique MOCNESS tows were conducted at each sampling location, with each tow consisting of eight sequentially collected depth-discrete net samples targeting depth bins ranging from 0 to 1,500 m (Table 1). Upon recovery of the MOCNESS, nets were rinsed with seawater and the contents of each cod end were preserved in 10% buffered formalin.
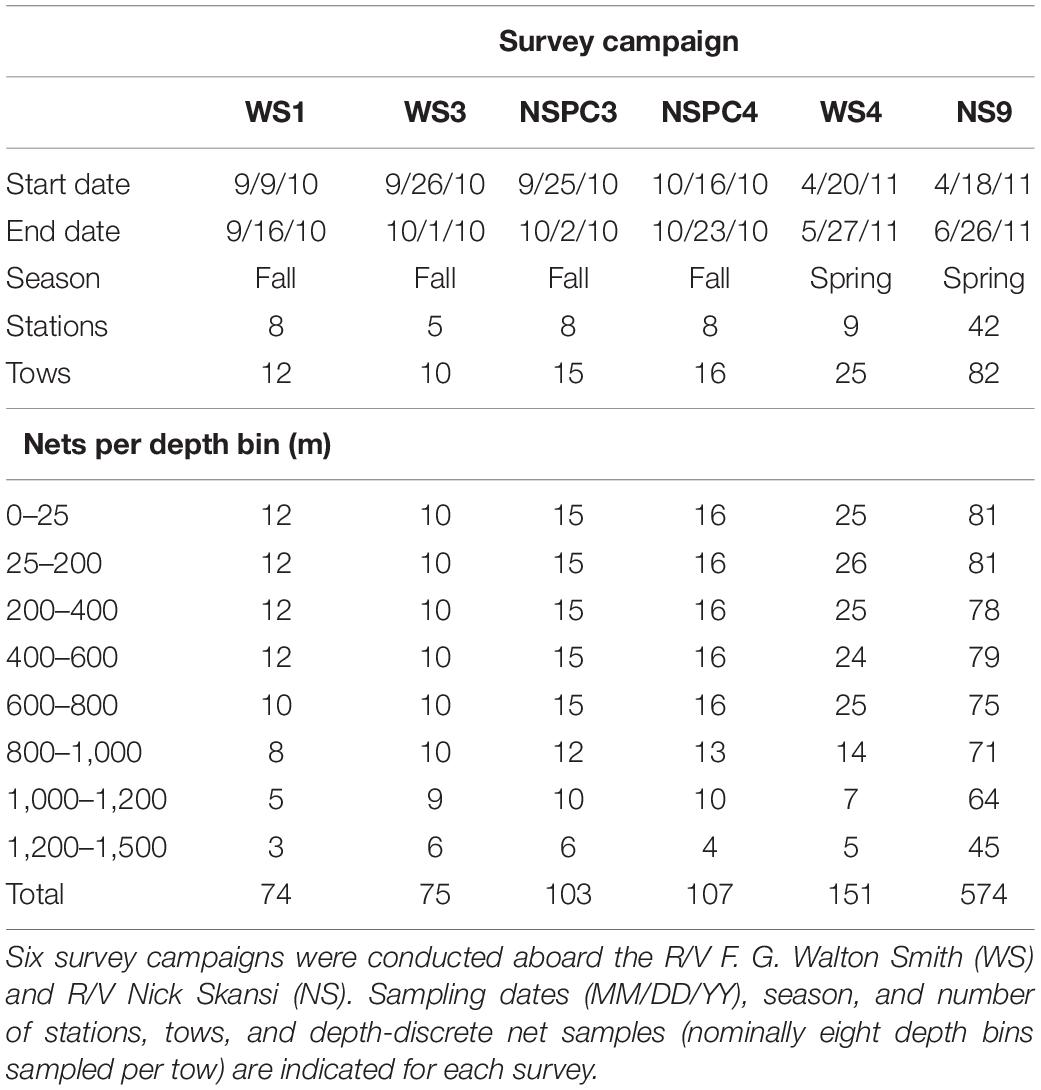
Table 1. Ichthyoplankton samples collected using a 1 m2 MOCNESS with 333 μm mesh nets in the northern Gulf of Mexico during the Deepwater Horizon Oil Spill Natural Resource Damage Assessment effort.
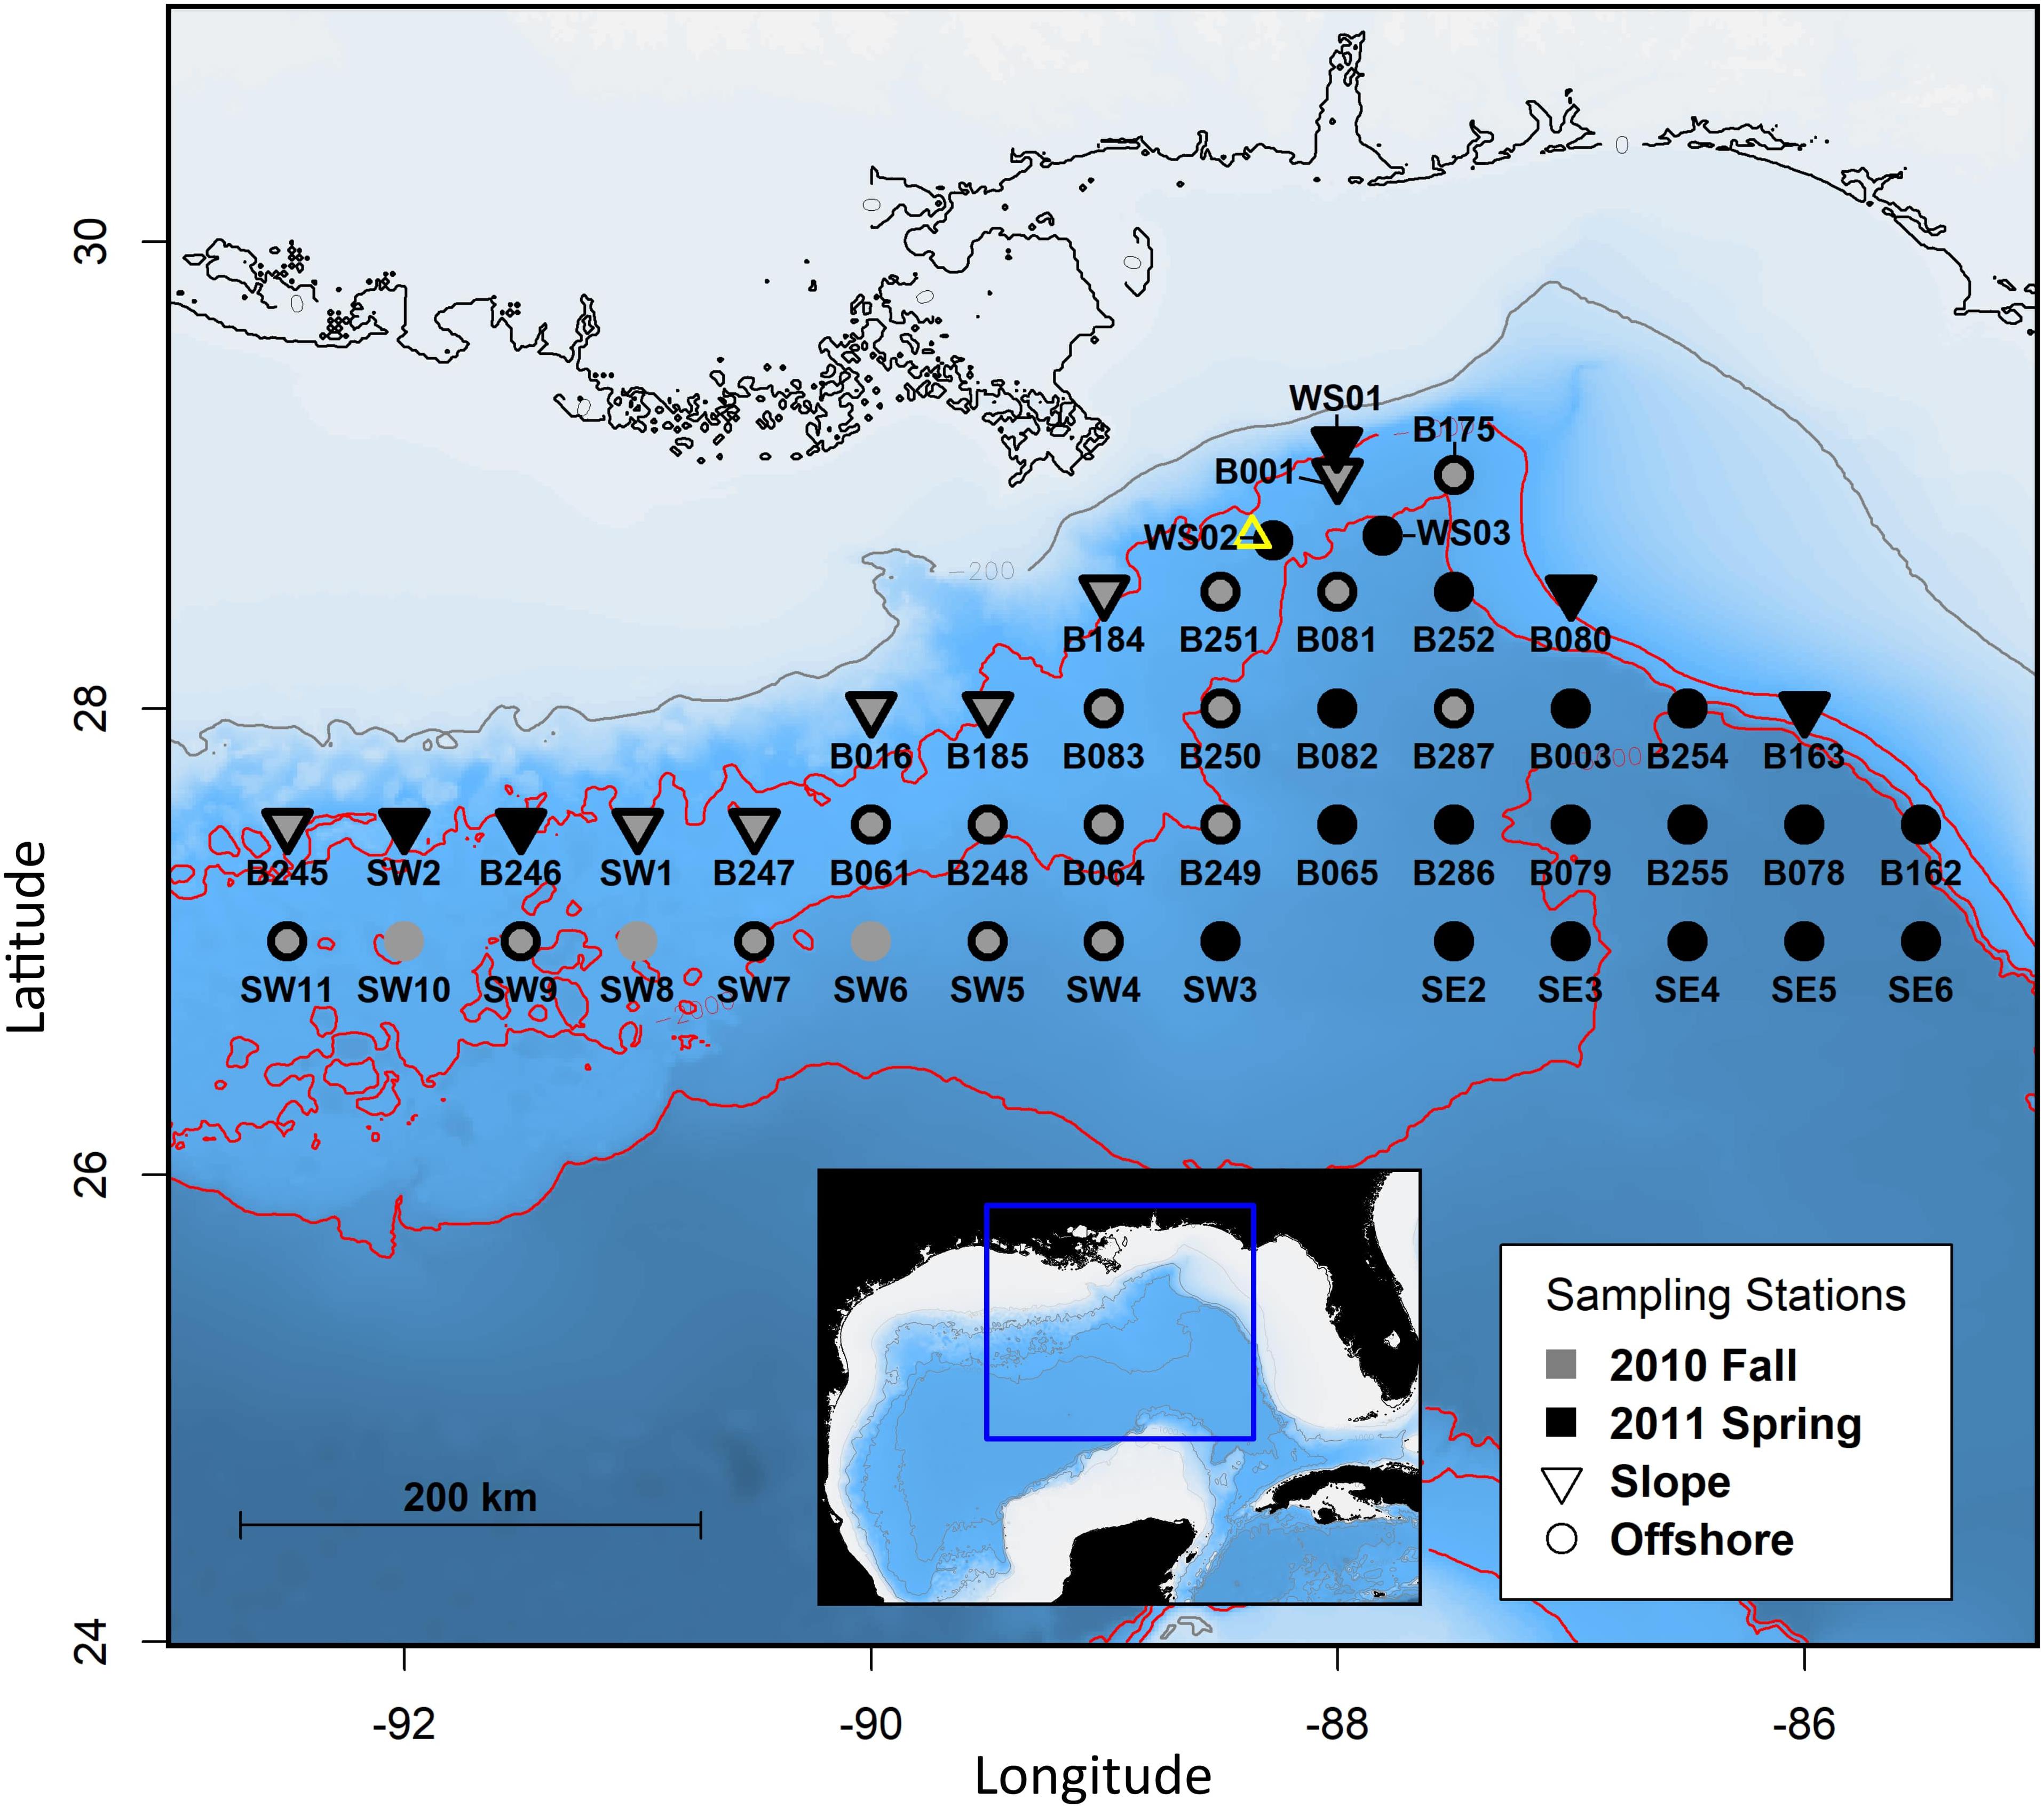
Figure 1. Map of deep-pelagic plankton sampling stations in the northern Gulf of Mexico, distinguishing between sampling period (year, season) and slope vs. offshore locations. The gray line represents the 200 m isobath, red lines represent 1,000 m isobath increments, and the open yellow triangle marks the location of the Deepwater Horizon wellhead.
Ichthyoplankton from the MOCNESS samples were sorted and identified to the lowest possible taxonomic level. During the sorting procedure, ichthyoplankton specimens were separated roughly into two size classes (<25 mm or > 25 mm, TL). Only specimens from the < 25 mm size category were retained for this analysis, as they represented the majority of the data and reduced the likelihood of confounding distribution patterns by including later life stages. Ichthyoplankton specimens were not consistently identified to the genus or species level, so all analyses were conducted at the family level. Occasionally, the complete set of eight nets within a MOCNESS deployment was not successfully collected due to weather or equipment malfunction. Because the analyses conducted here are largely based on comparisons among depth-discrete samples (nets) rather than tows, ichthyoplankton and environmental data from MOCNESS tows with missing nets were retained for analysis. Nets with missing environmental data were excluded from all analyses.
Ichthyoplankton Data
Raw ichthyoplankton counts were standardized by the volume of water filtered, resulting in larval fish concentration (larvae 1,000 m–3) for each depth-discrete net sample, hereafter referred to as “abundance.” Extremely rare families were excluded prior to all analyses. Due to the patchy nature of ichthyoplankton distribution, rare taxa may represent sampling error rather than truly rare taxa that are indicators of site-specific conditions (Legendre and Gallagher, 2001). While the treatment of rare taxa for multivariate analyses is certainly a matter of debate (Poos and Jackson, 2012), we conservatively removed families that did not exceed 1% of the catch in any net and families with < 5 total individuals across all nets to avoid the undue influence of rare families on distance measures.
Family-level abundance (log-transformed), richness, and diversity were compared among depth-bins using a one-way analysis of variance (ANOVA), followed by Tukey’s honestly significant difference (HSD) test to determine a posteriori differences among pairwise means. Richness was defined as the number of families present in a net sample. Diversity was estimated using the Shannon Diversity index:
where pi represents the proportion of the net sample represented by the ith family relative to the total number of families present in a net sample.
Environmental and Spatiotemporal Data
Environmental variables consist of a suite of in-situ measurements collected simultaneously with MOCNESS ichthyoplankton sampling, derived variables, and spatiotemporal descriptors. For each depth-discrete net sample, temperature, salinity, and density (sigma-t) were reported as the mean of all observations recorded while each net was actively sampling, and depth was reported as the midpoint between the depth measured at net opening and closing. Surface temperature, surface salinity, and mixed layer depth were reported from surface (0–25 m) net observations only, and were used to represent surface features for all subsurface nets within each respective tow deployment. Mixed layer depth was calculated following Levitus (1982) as the depth at which density (sigma-t) increases by 0.125 kg m–3 from a surface reference point at 10 m. Spatial variability was represented by geographic coordinates (latitude and longitude recorded at net opening), as well as general proximity to the continental slope. Sampling locales were grouped by bathymetry into “slope” and “offshore” stations (Figure 1), loosely following Burdett et al. (2017). Slope stations were on or adjacent to the 1,000 m isobath, and offshore stations were seaward of the 1,000 m isobath. Stations directly adjacent to the 1,000 m isobath but also encompassing steep bathymetric features were considered offshore stations. Season (fall/spring) and diel periodicity (day/night) were also included to account for multiple scales of temporal variability.
Assemblage Analyses
We used a multivariate regression tree (MRT) approach to model the relationship between the abundance of larval fish families and the environment (De’ath, 2002). The MRT classifies samples (multivariate ichthyoplankton family abundances from an individual net sample) by recursive partitioning, with each node of the tree defined by a rule for a single environmental variable, culminating in terminal nodes containing clusters of samples (hereafter, assemblage groups) represented by a suite of environmental characters. MRT analyses generate easily interpretable visual representations of taxon-environment relationships, and are well-suited to analyze imbalanced or incomplete datasets, mixtures of continuous and categorical explanatory environmental variables, and are robust to the collinearity of explanatory variables (De’ath, 2002).
Ichthyoplankton abundance data were Hellinger-transformed prior to MRT analyses. Hellinger transformations are appropriate for community composition data containing numerous zeros, do not assign high weights to rare taxa, and allow dissimilarity measures among sites to be calculated using Euclidean distances (Legendre and Gallagher, 2001). MRT analyses were conducted using all families (after removal of rare families) as well as with the 30 most abundant families after Hellinger transformation. MRT was conducted separately on four depth-defined subsets of ichthyoplankton and environmental data—all pelagic zones combined, epipelagic, mesopelagic, bathypelagic. For each depth-defined data subset, independent MRT trials were run for all possible combinations of the 12 explanatory environmental and spatiotemporal variables described above (temperature, salinity, density, depth, surface temperature, surface salinity, mixed layer depth, latitude, longitude, slope/offshore, season, diel periodicity), each with 10 cross-validations. The best predictive trees were selected by minimizing cross-validated relative error (CVRE) while maximizing relevance, or the ratio of the number of explanatory variables appearing on the tree relative to the number of variables included in each analysis (De’ath, 2002; Carassou et al., 2012).
After identifying the best fit trees, Dufrêne-Legendre (DL) indicator values were calculated to describe the families that were characteristic of each MRT-defined assemblage group. For each family and assemblage group within a tree, the DL index is the product of “specificity” and “fidelity,” where specificity is the mean family abundance in the assemblage group relative to the mean family abundance across all assemblage groups, and fidelity is the frequency of occurrence of the family within the assemblage group (Dufrêne and Legendre, 1997). The DL index is at a maximum (DL = 1) when a family occurs in all samples in an assemblage group and is absent from all other assemblage groups, and at a minimum (DL = 0) when a family does not occur in an assemblage group. Following De Cáceres et al. (2010), DL indices were assessed for all combinations of assemblage groups, and the combination that yielded the maximum indicator value was retained. This method accounts for varying niche breadths among families and allows for families to be representative of multiple assemblage groups, which may be particularly relevant for mesopelagic environments with ubiquitous fish taxa. The statistical significance for each DL index value and association with assemblage groups was assessed with permutation tests (n = 1,000 permutations) (De Cáceres and Legendre, 2009). All analyses were conducted using R v.3.6.2 (R Core Team, 2019), with MRT and DL analyses implemented with the “mvpart” and “indicspecies” packages, respectively.
Results
Ichthyoplankton
Over the six deep-pelagic survey campaigns included in this study, 160 tows were sampled, encompassing 1,084 depth-discrete nets (Table 1). A total of 134,610 fish larvae were collected and identified to at least the family level, belonging to 149 families (Supplementary Table 1). Only 66% of these larvae were identified to genus (251 genera) and 16% to species (256 species), thus all subsequent results are from family-level analyses. Of the mesopelagic fish taxa, the four most common families were Myctophidae, Gonostomatidae, Sternoptychidae, and Phosichthyidae, hereafter referred to as the dominant mesopelagic families. These dominant mesopelagic families were common in both the epipelagic (0–200 m), comprising 63.4% of the catch, as well as the meso- and bathypelagic (200–1,500 m), where they comprised 97.4% of all larvae. After removing rare taxa, 93 families were retained for abundance, diversity, richness, and assemblage analyses (Supplementary Table 1).
Larval fish abundance varied significantly among depth bins [F(7, 1075) = 827.3, P < 0.0001], as did family richness [F(7, 1076) = 466.3, P < 0.0001], and family diversity [F(7, 1076) = 288.3, P < 0.0001]. The abundance of larval fish followed a generally decreasing trend with increasing depth, and post hoc comparisons using Tukey’s HSD test showed that mean abundance differed significantly among all depth bin pairs (P < 0.0001) except for two bins within the mesopelagic (200–400 m vs. 600–800 m; P = 0.947; Figure 2). Family richness was higher overall in epipelagic depth bins than in meso- and bathypelagic depth bins (P < 0.0001), and a larger number of families were detected in the lower epipelagic (25–200 m) than in the upper epipelagic (0–25 m; Figure 2). Shannon diversity at the family level was highest in the epipelagic and was significantly different among epipelagic, mesopelagic, and bathypelagic depth zones (P < 0.0001), although differences in family diversity among depth bins within pelagic zones was less common (Figure 2).
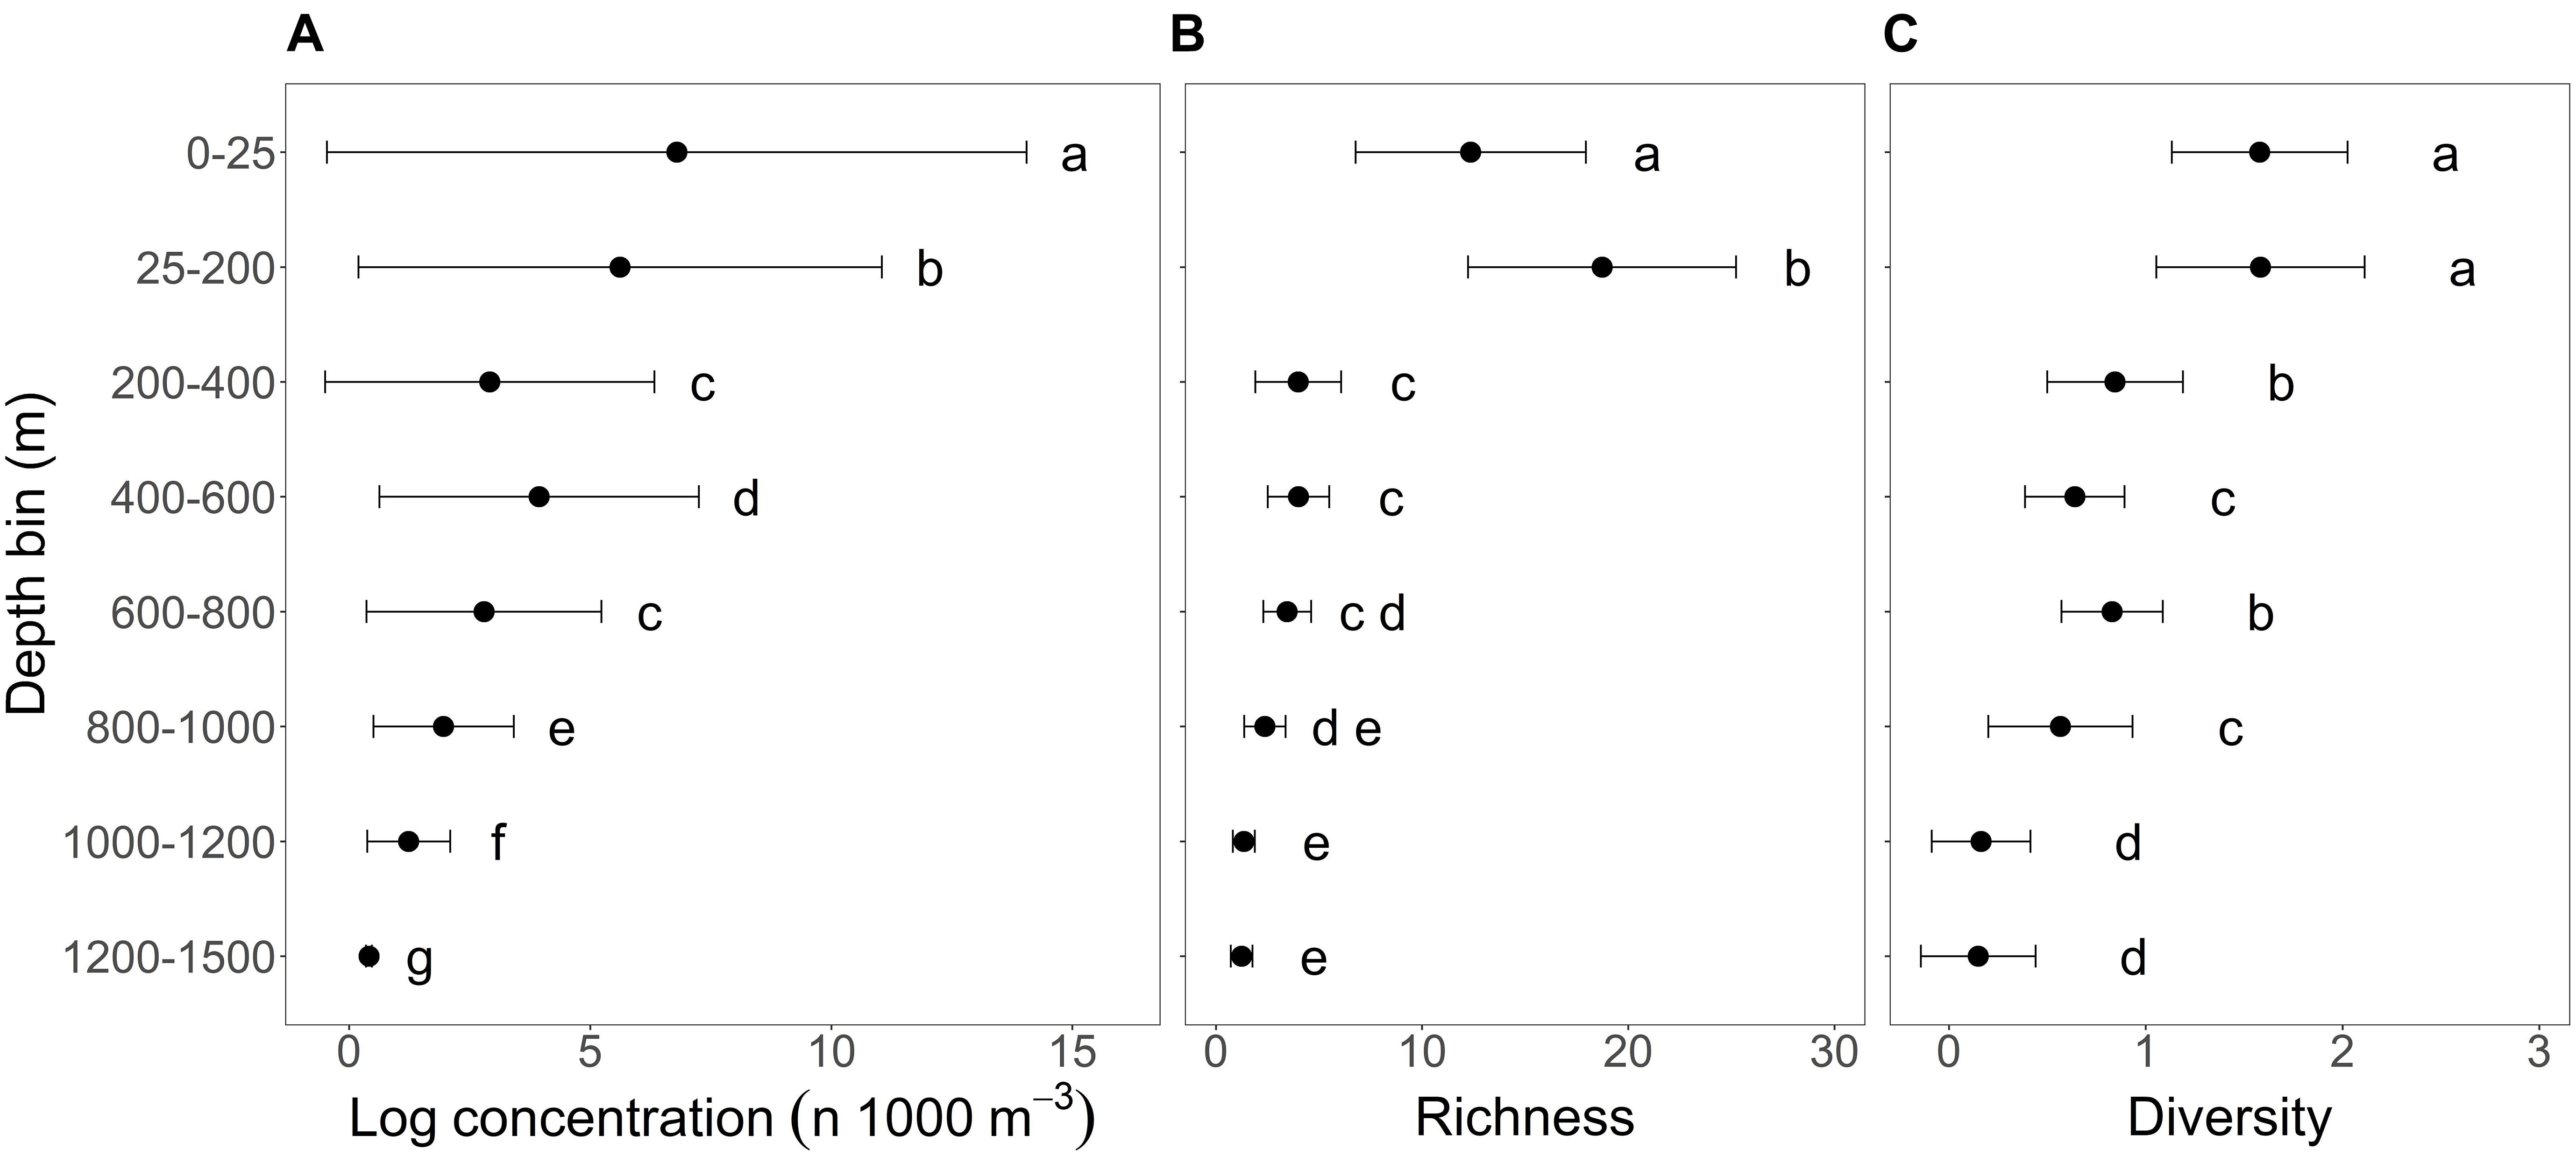
Figure 2. Variation in (A) total ichthyoplankton abundance (log number of larvae 1,000 m− 3), (B) family-level richness (number of families), and (C) family-level Shannon diversity index among depth bins sampled in the northern Gulf of Mexico. Points represent mean values and horizontal bars indicate standard deviations. Within each larval measure, lower case letters indicate significant differences among depth bins resulting from post-hoc Tukey’s HSD tests.
Ichthyoplankton Assemblage Structure
The MRT trials conducted with all 93 larval fish families (after removal of rare taxa) and with the 30 most abundant families resulted in identical tree structures and assemblage groups for three of the four depth-defined subsets of ichthyoplankton and environmental data (all pelagic zones combined, mesopelagic, bathypelagic), with minor differences in tree structure and group assignment for the epipelagic subset. For ease of interpretation, only MRT analyses for the 30 most abundant families are presented here. Among the environmental variables included in the MRT analyses, clear trends of decreasing temperature and increasing density were detected with increasing depth, and surface features (surface temperature, surface salinity, mixed layer depth) varied between seasons (Figure 3). Overall, the best-fit trees for the four depth-defined MRT analyses included various combinations of depth, season, surface salinity, surface temperature, mixed layer depth, and longitude as predictors of larval fish assemblage structure. Mean salinity and temperature of each depth-discrete net, latitude, slope/offshore station locale, and diel periodicity never appeared on the selected trees, and thus did not influence the structure of larval fish assemblages.
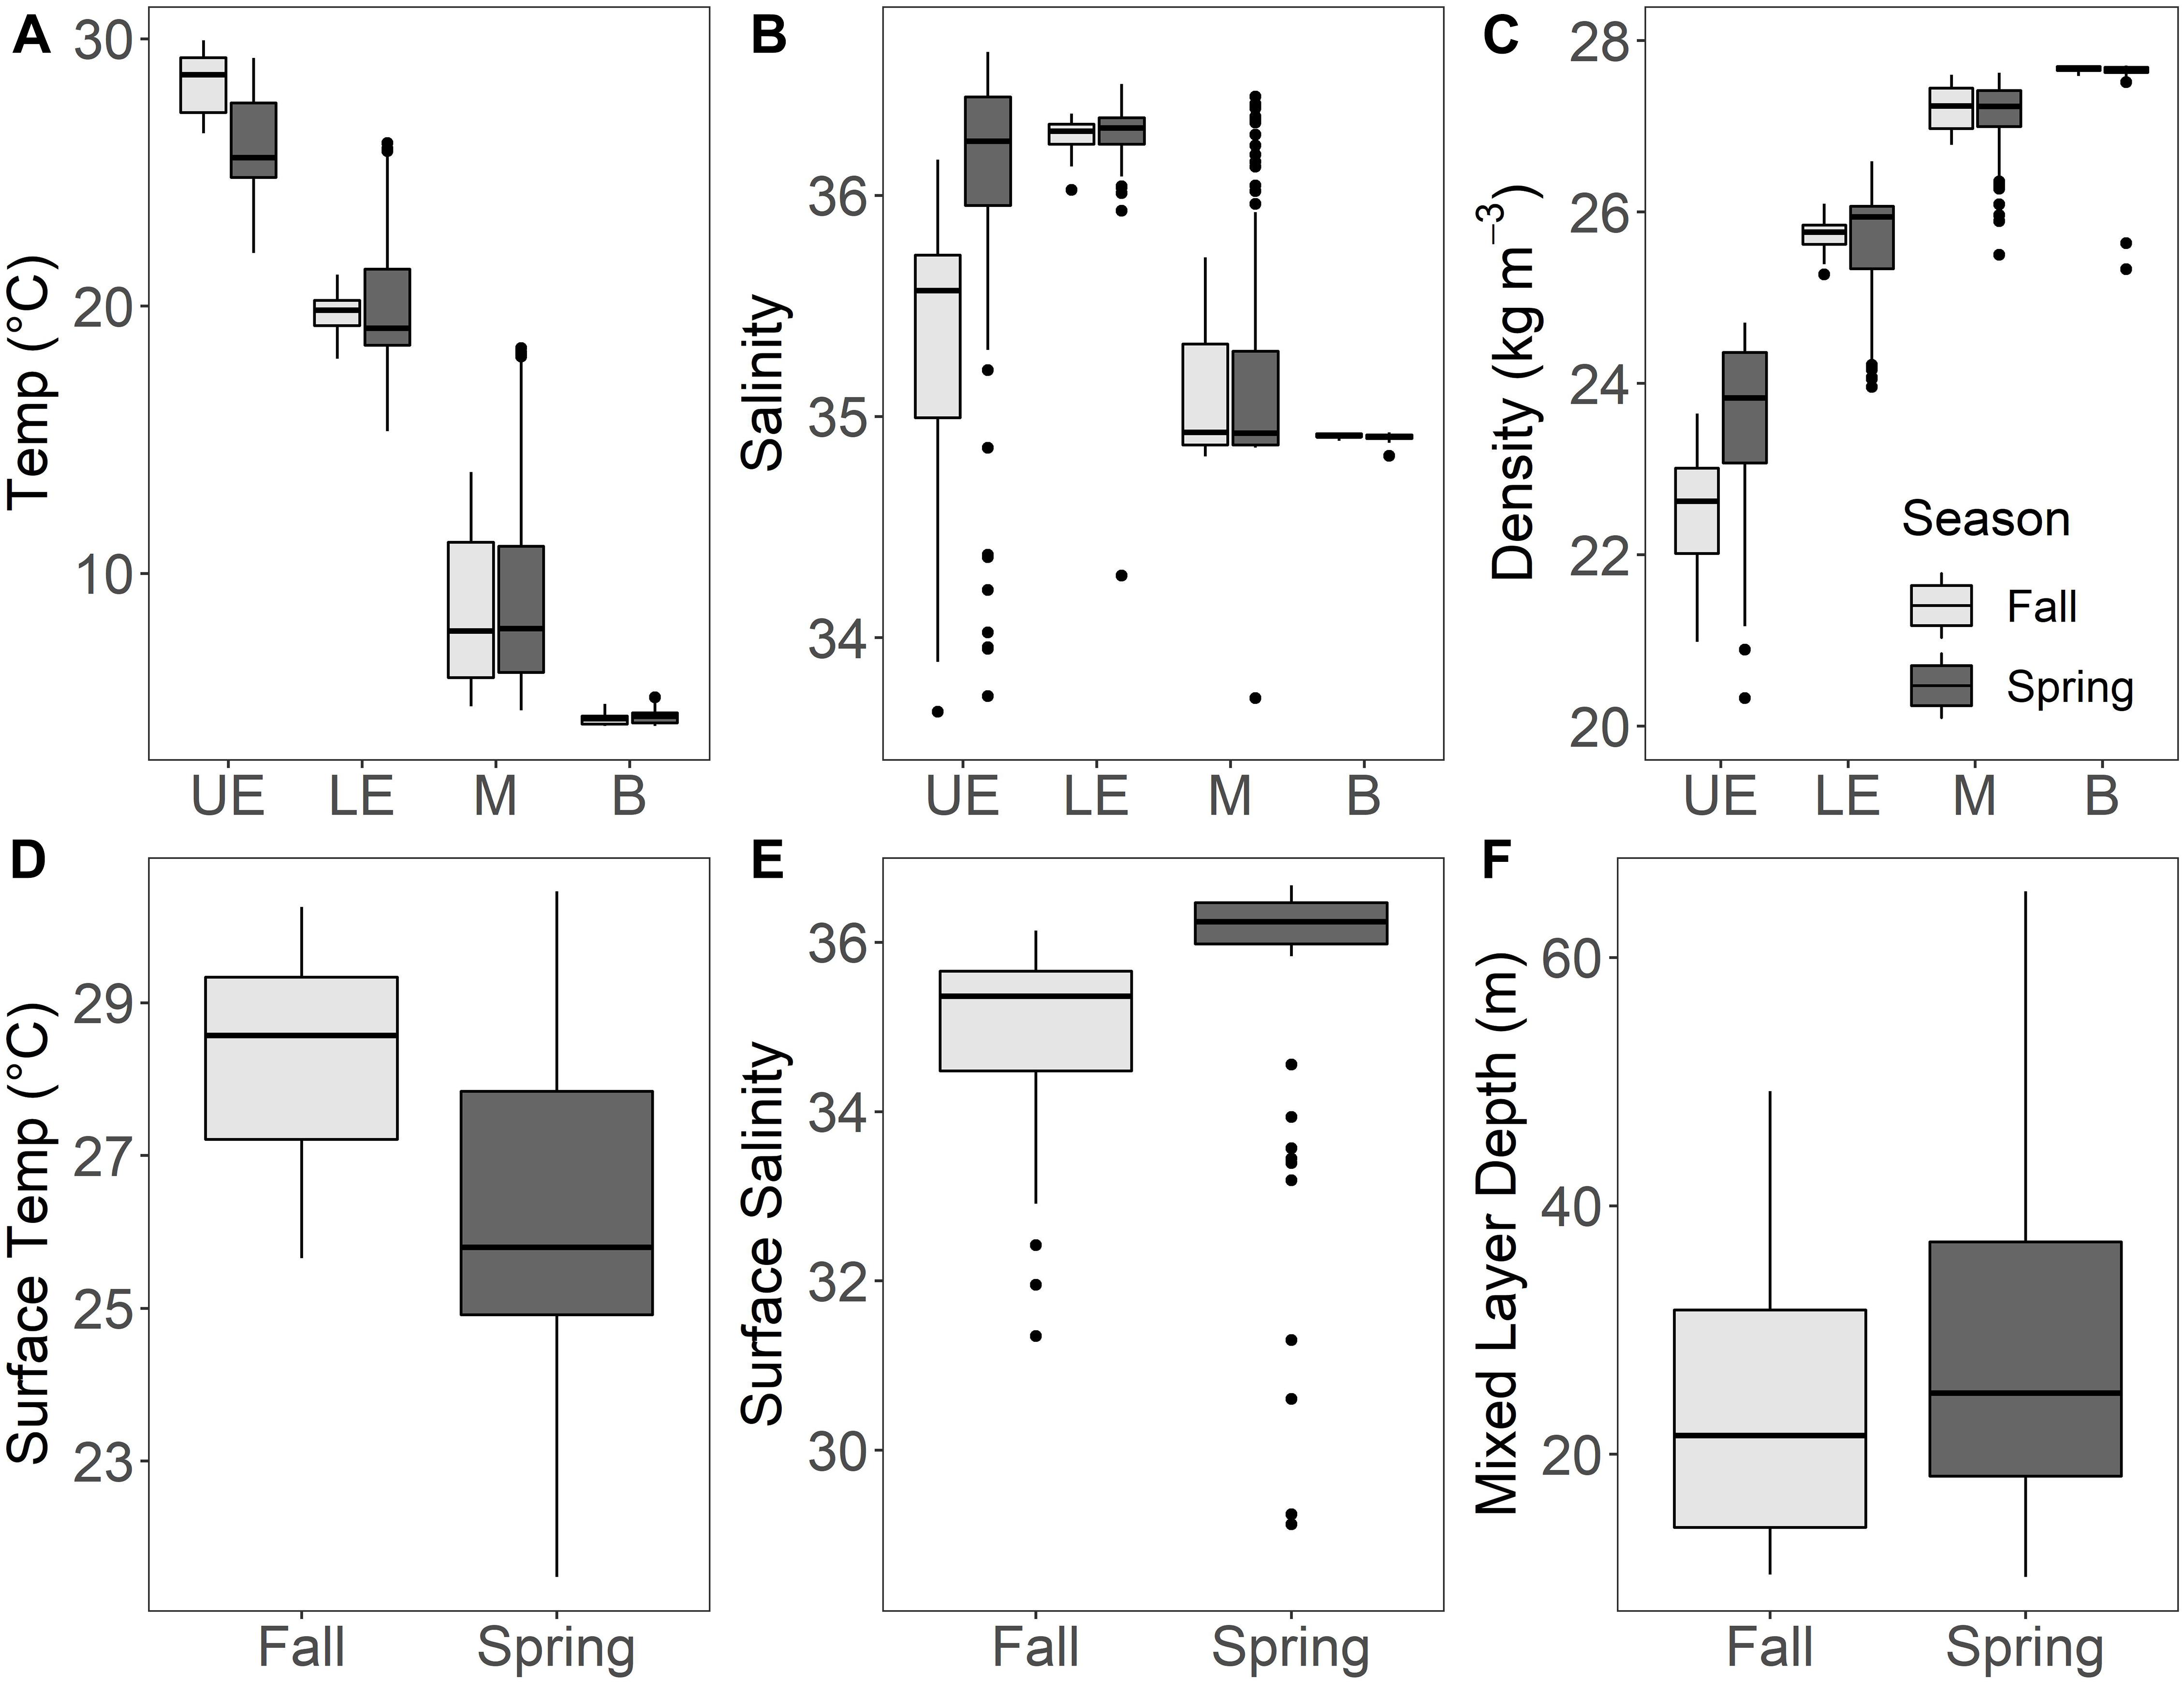
Figure 3. Environmental variability in the northern Gulf of Mexico among pelagic zones and seasons for (A) temperature, (B) salinity, and (C) density measured with each net sample. Surface feature variability between seasons was shown for (D) surface temperature, (E) surface salinity, and (F) mixed layer depth associated with each tow. UE, upper epipelagic (0–25 m); LE, lower epipelagic (25–200 m); M, mesopelagic (200–1,000 m); B, bathypelagic (1,000–1,500 m). Boxplots display the median value (horizontal line), 25th and 75th percentiles (lower and upper hinges, respectively), and the extent of the whiskers from each hinge represents 1.5 × IQR (inter-quartile range; distance between 25th and 75th percentiles), with outliers beyond the whiskers shown as filled symbols. A small number of outlier values for salinity, density, and surface salinity were truncated here for ease of visualization, but retained in all analyses.
All Pelagic Zones
When considering all pelagic zones combined (0–1,500 m), depth and season were the most important predictors of larval fish assemblage structure, explaining 51.6% of the variability [(1 – CVRE) × 100] in assemblage structure (CVRE = 0.484, relevance = 2/2, Supplementary Figure 1). Eight larval fish assemblage groups were identified, corresponding largely to variation among broad pelagic regions: upper epipelagic (0–25 m), lower epipelagic (25–200 m), upper mesopelagic (200–400 m), lower mesopelagic (400–1,000 m), bathypelagic (1,000–1,500 m). Assemblage groups in the upper epipelagic and lower mesopelagic were both further distinguished by season. Patterns of association between families and assemblage groups for all pelagic zones combined (Supplementary Table 2 and Supplementary Figure 1) were largely in agreement with broad-scale patterns identified in epipelagic and mesopelagic MRT analyses, which are discussed in further detail below.
Epipelagic
When examining the epipelagic (0–200 m), the largest predictors of larval fish assemblage structure were depth, surface salinity, season, mixed layer depth, and longitude, resulting in 14 distinct assemblage groups (Epi-A – Epi-N) and explaining 38.3% of the of the variability in assemblage structure (CVRE = 0.617, relevance = 5/5; Figure 4). Assemblage groups Epi-A – Epi-J were associated with the upper epipelagic (0–25 m), and Epi-K – Epi-N were associated with the lower epipelagic (25–200 m). Following the main branch separating the upper and lower epipelagic, assemblages in both depth regions were further structured by surface salinity, season, and mixed layer depth, while upper epipelagic assemblages were additionally distinguished by station locale (longitude). Assemblage groups that were not defined by seasonal branches (Epi-A, Epi-B, Epi-K) were nonetheless comprised of nearly all spring samples (with the exception a single fall sample in Epi-A). The most common epipelagic assemblage groups (Epi-A, Epi-K, Epi-M, Epi-N) were broadly distributed across the spatial extent of GOM sampling (Supplementary Figure 2).
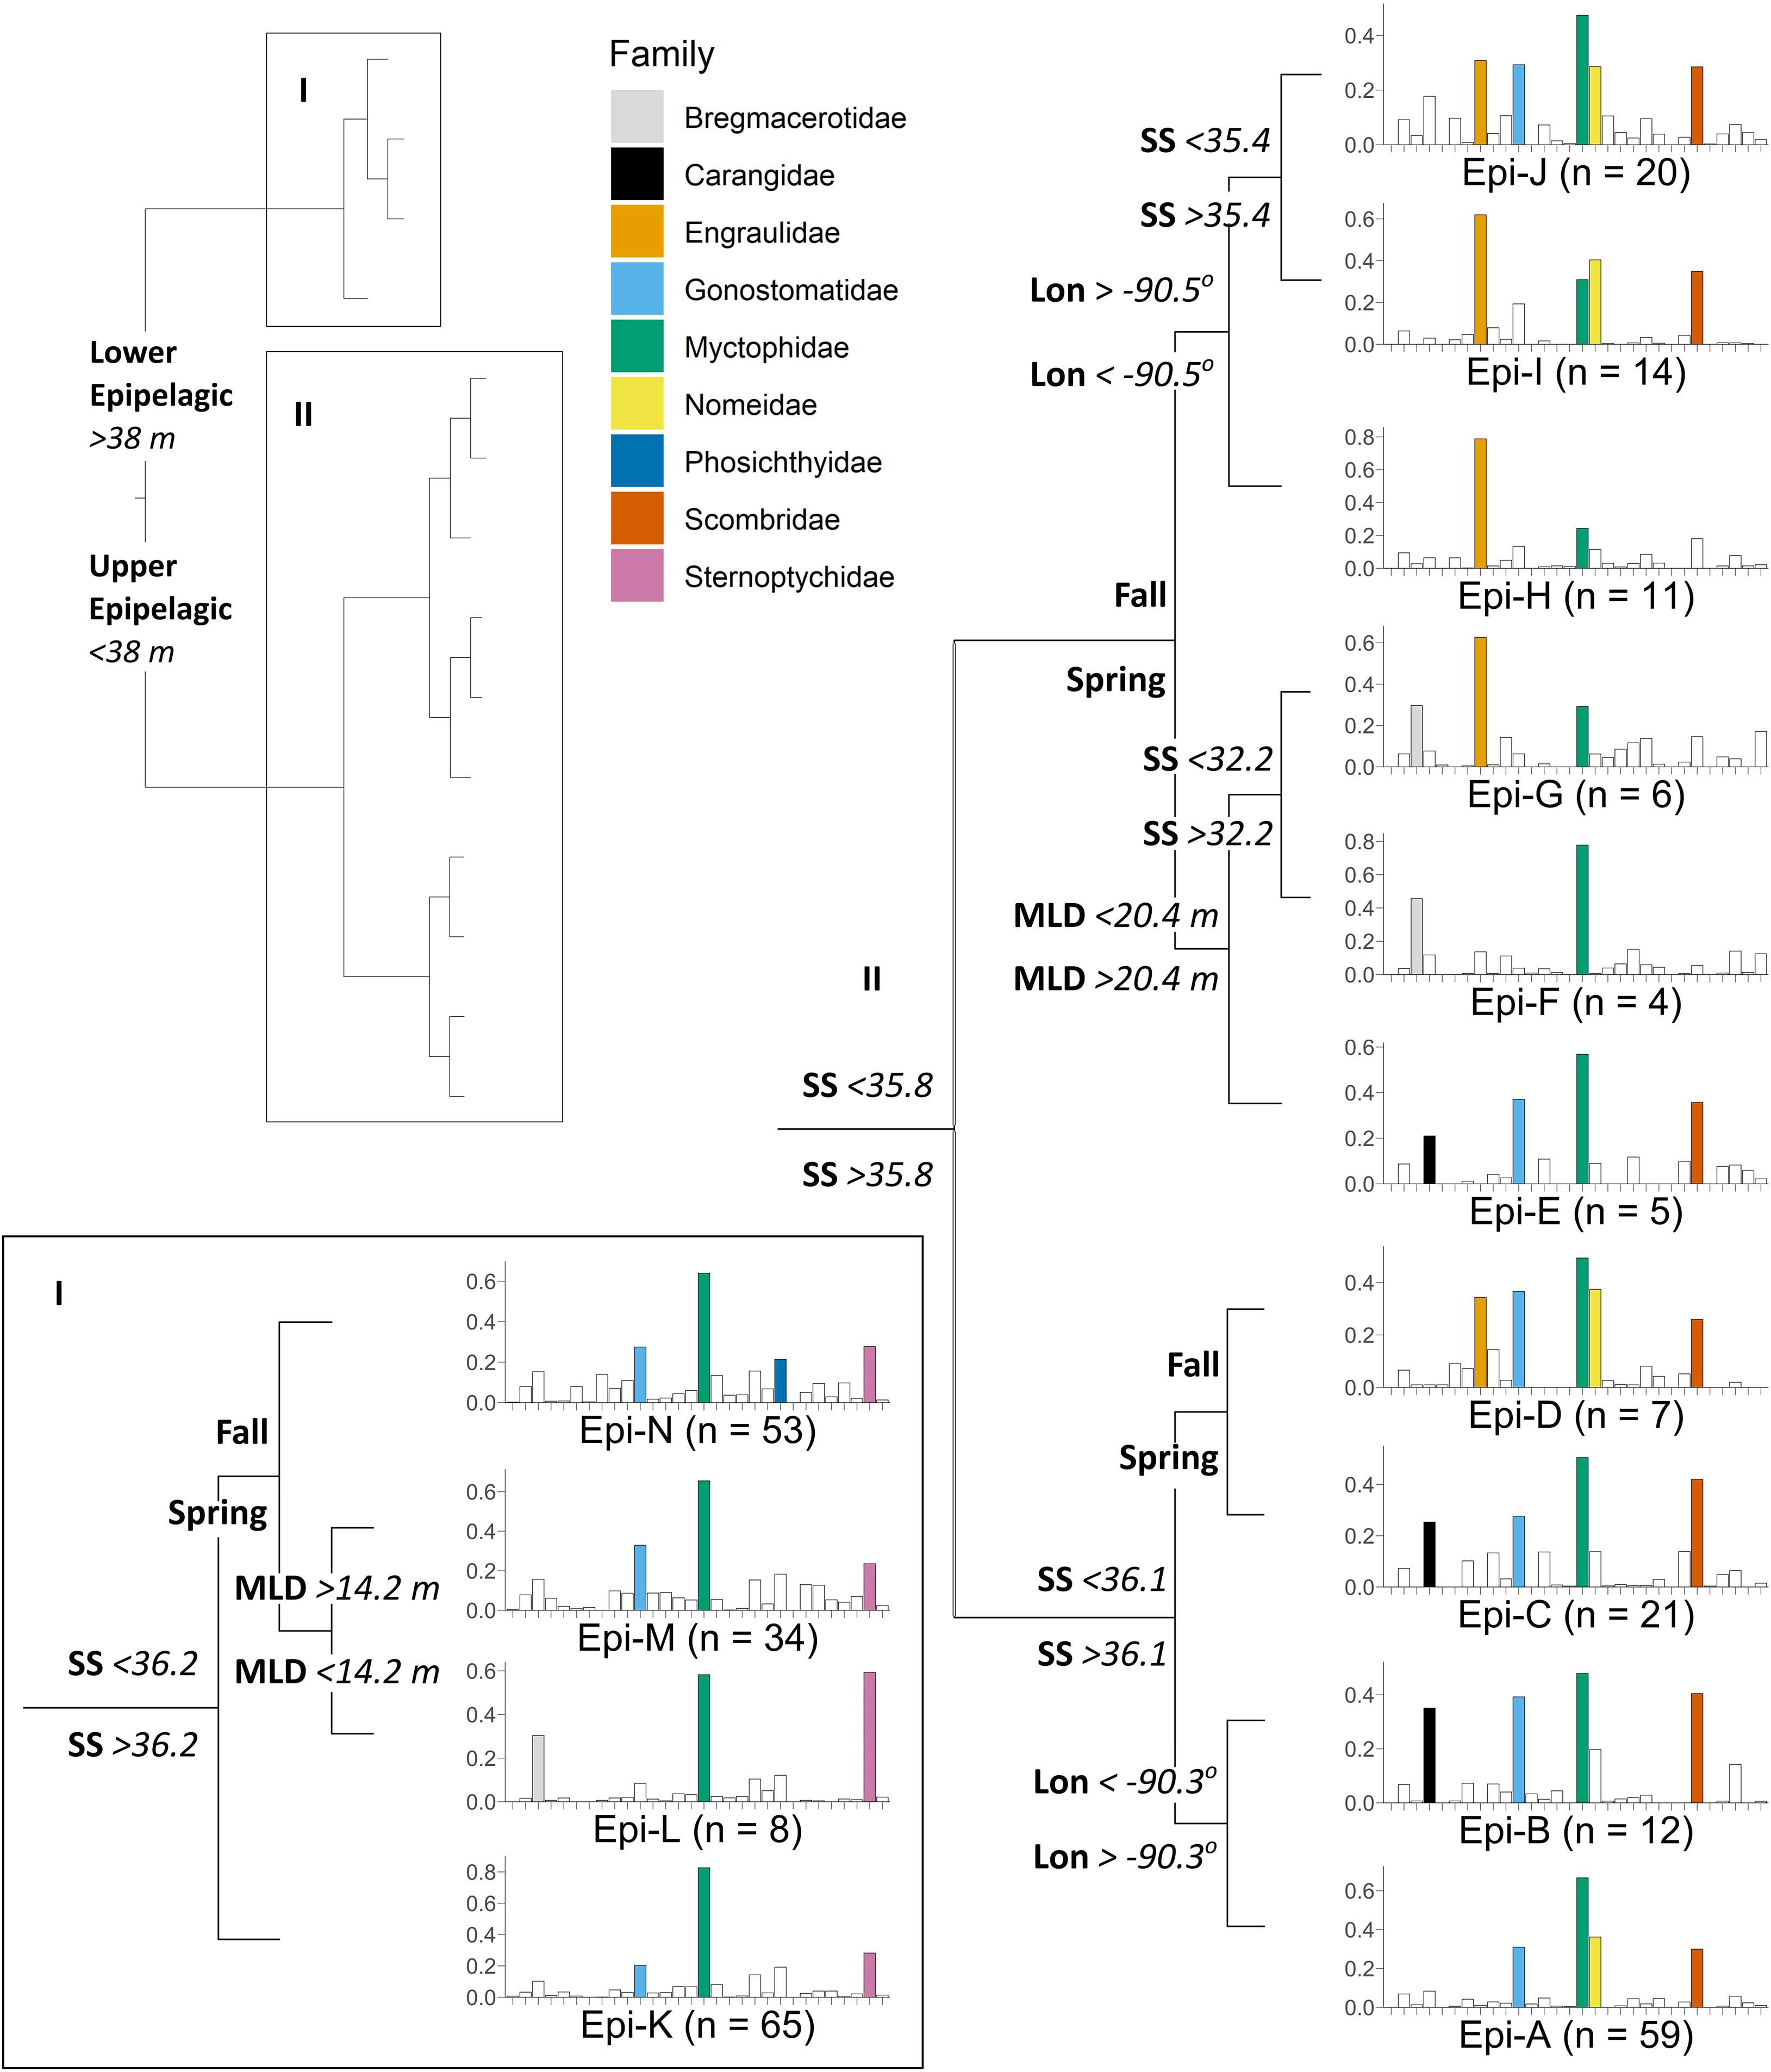
Figure 4. Multivariate regression tree illustrating the effect of depth, surface salinity (SS), season (fall/spring), mixed layer depth (MLD), and longitude (Lon) on the structure of epipelagic (0–200 m) larval fish assemblages in the northern Gulf of Mexico. The full tree structure is depicted in the upper left, with (I) lower epipelagic and (II) upper epipelagic branches detailed separately. Each node represents a diverging environmental or spatiotemporal variable, resulting in terminal nodes with distinct assemblage groups (Epi-A – Epi-N). Barplots represent mean square root relative abundance (i.e., Hellinger-transformed larval abundance; y-axis) for each of 30 families (x-axis) in alphabetical order from left to right (see Table 2 for list of family names), with the most abundant families (abundance > 0.2) in each assemblage group highlighted in color for clarity. Sample size (n) for each assemblage group is indicated next to the group name.
Mesopelagic-associated families were found to be characteristic of larval assemblage groups within both the upper and lower regions of the epipelagic. The families Gonostomatidae (DL = 0.95, P = NA) and Myctophidae (DL = 0.99, P = NA) were ubiquitous and were strongly characteristic of all 14 epipelagic assemblage groups (Epi-A – Epi-N; Table 2 and Figure 4). Assessment of significance was not possible for these two families because permutation tests cannot be conducted when all assemblage groups are included (i.e., no external groups for comparison). The families Sternoptychidae (DL = 0.87, P = 0.001), Paralepididae (DL = 0.78, P = 0.001), Phosichthyidae (DL = 0.74, P = 0.001), Bregmacerotidae (DL = 0.79, P = 0.001), and Microstomatidae (DL = 0.61, P = 0.001) were strongly associated with all lower epipelagic assemblage groups (Epi-K – Epi-N; Table 2 and Figure 4). However, only Microstomatidae were exclusive in their association with lower epipelagic assemblage groups. The families Sternoptychidae, Paralepididae, Phosichthyidae, and Bregmacerotidae were also occasionally characteristic of upper epipelagic (0–25 m) assemblage groups, although these assemblage groups represented small sample sizes and were relatively small contributors (3.0–8.6%) to the overall DL indicator group assignment for each family.
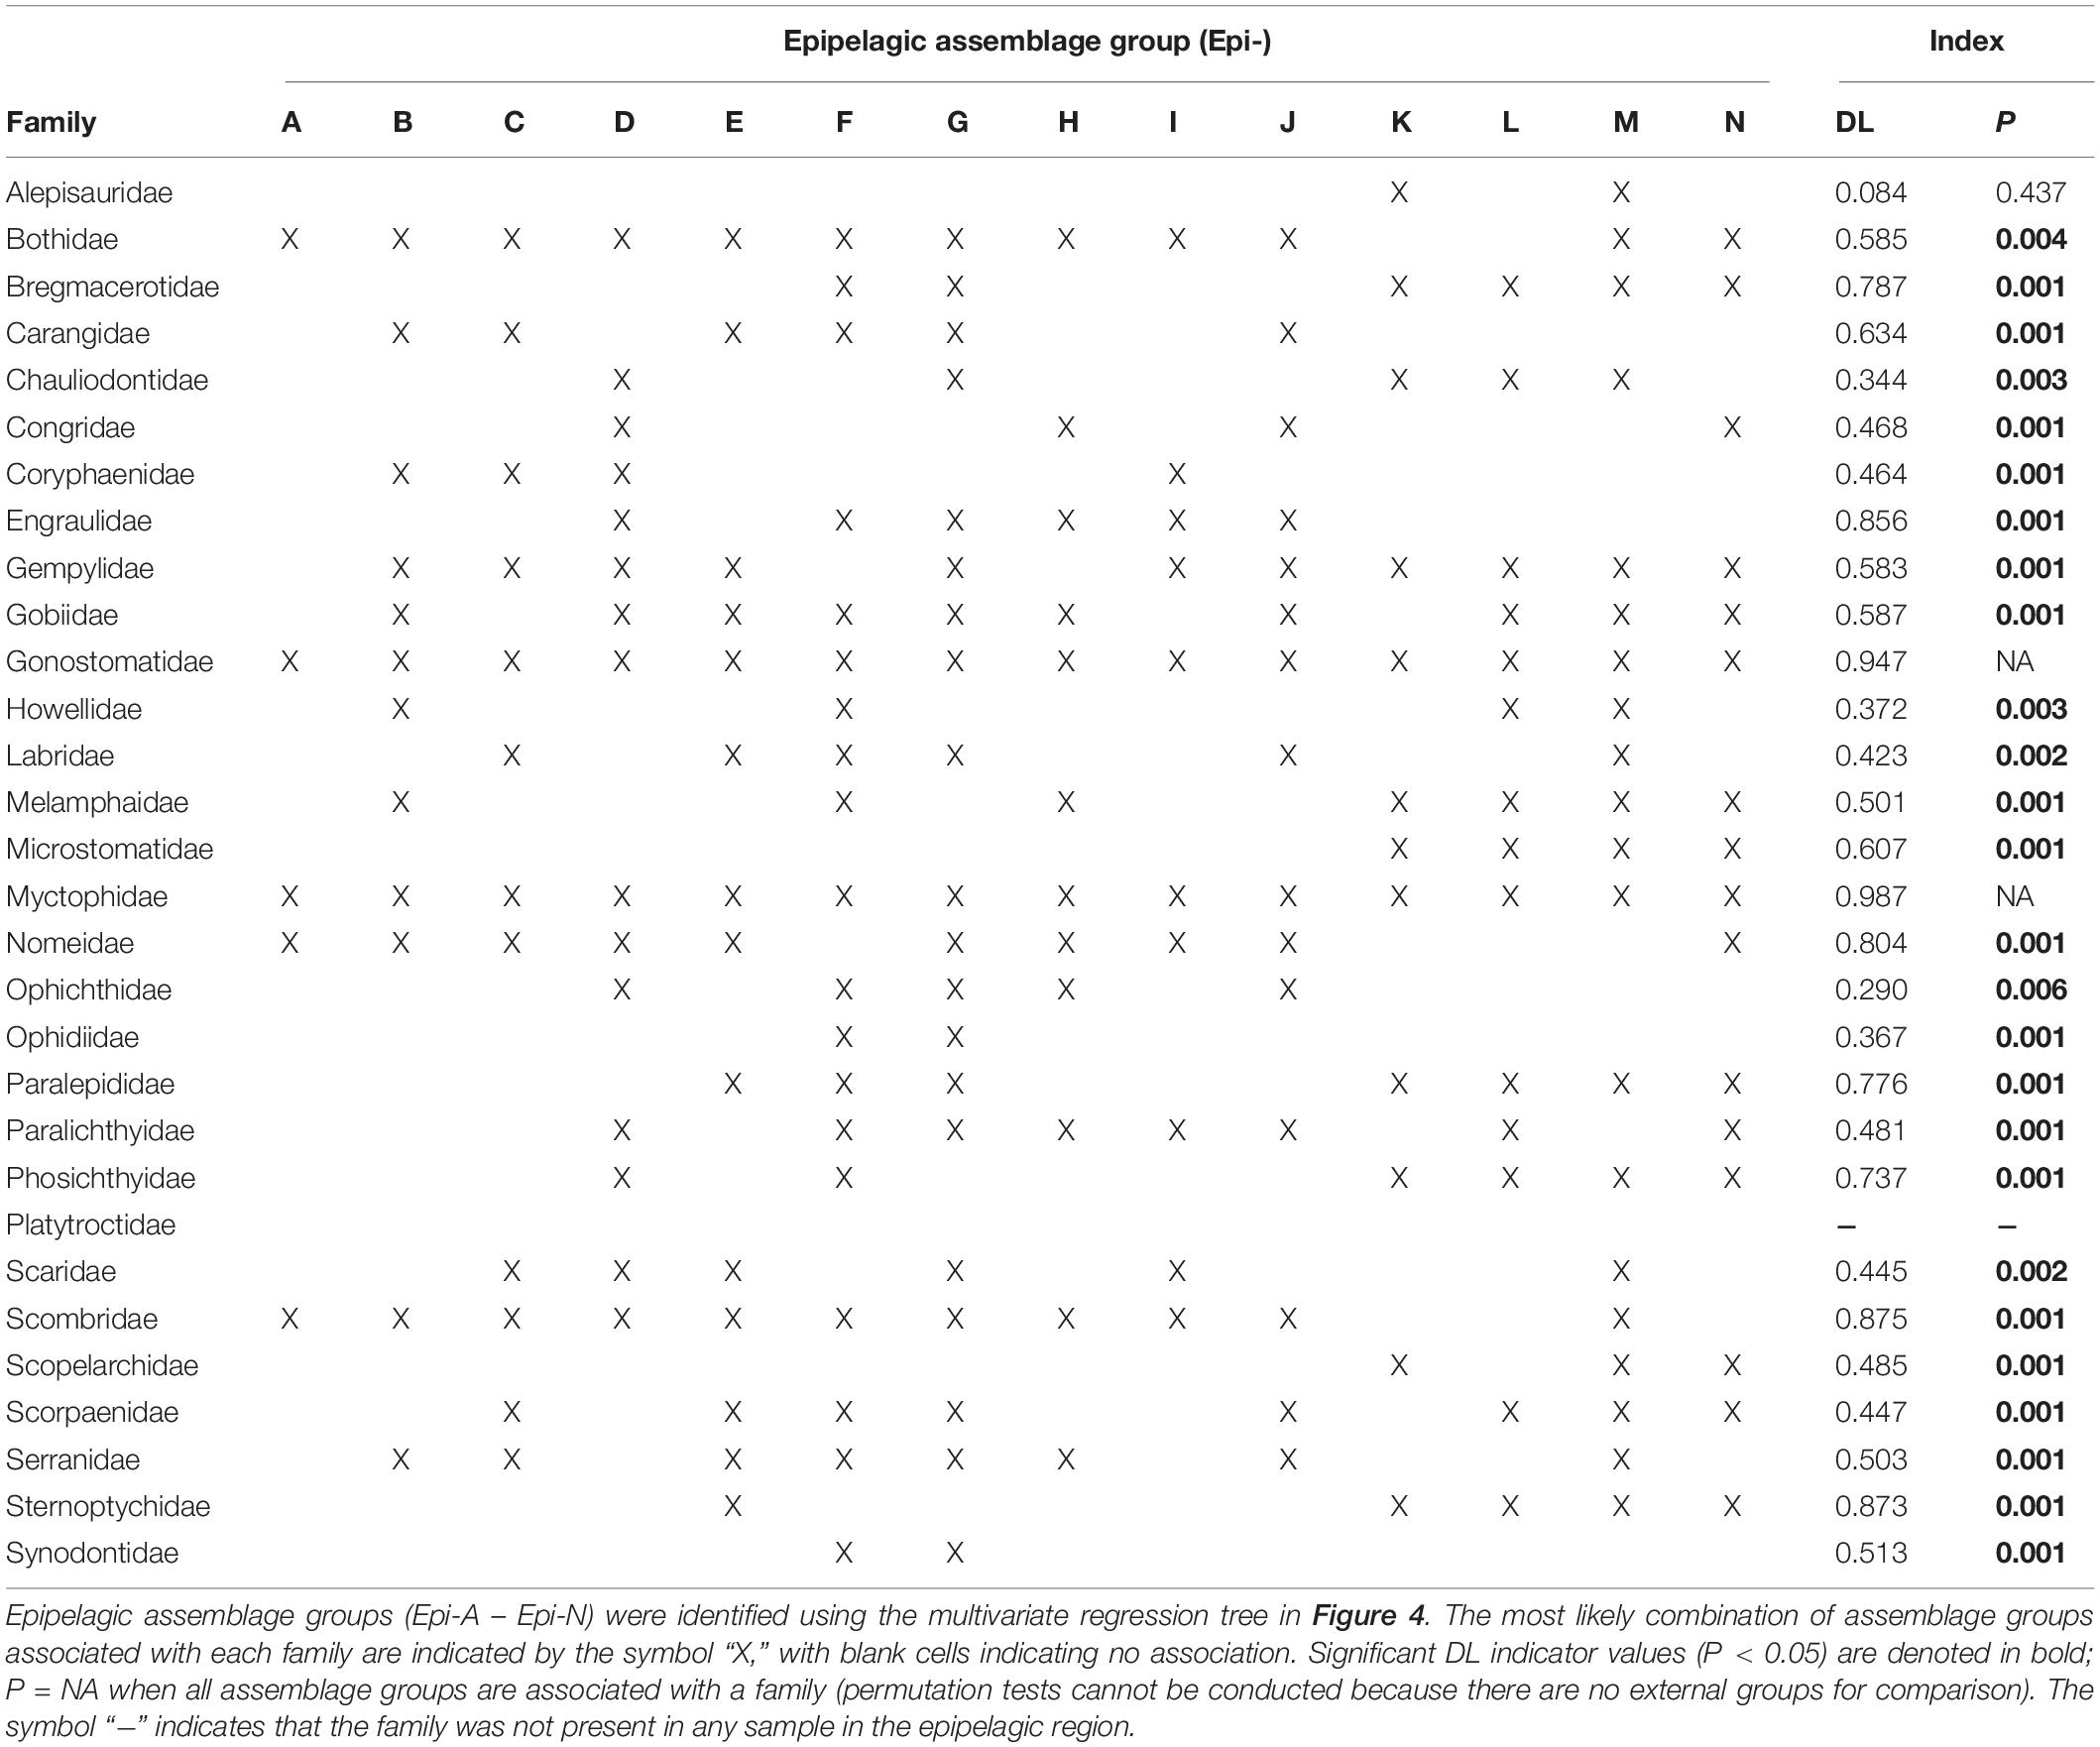
Table 2. Dufrêne-Legendre (DL) indicator values characterizing the association of larval fish families with epipelagic assemblage groups (or combinations of assemblage groups) following De Cáceres et al. (2010).
Epipelagic-associated taxa were mostly frequently found to be characteristic of larval assemblage groups within the upper region of the epipelagic. The families Scombridae (DL = 0.88, P = 0.001) and Nomeidae (DL = 0.80, P = 0.001) were strong indicators of all upper epipelagic assemblage groups (Epi-A – Epi-J), with the exception of the minor assemblage group Epi-F (n = 4) for Nomeidae (Table 2 and Figure 4). Scombridae were also associated with the lower epipelagic assemblage group Epi-M, which was characterized by lower surface salinity during the spring season when the depth of the mixed layer is large. Nomeidae were also associated with a large lower epipelagic assemblage group (Epi-N), which was characterized by lower surface salinity during the fall. The family Engraulidae (DL = 0.86, P = 0.001) was largely characteristic of upper epipelagic assemblage groups where the surface salinity was < 36.1, nearly all of which were fall samples (Epi-D, Epi-F – Epi-J; Table 2 and Figure 4). The family Carangidae (DL = 0.63, P = 0.001) was associated with six upper epipelagic assemblage groups (Epi-B, Epi-C, Epi-E – Epi-G, Epi-J), although these assemblage groups were spread among the upper epipelagic branches of the tree and environmental patterns were less clear (Table 2 and Figure 4).
While most upper epipelagic larval assemblage groups were defined by variability in season or surface features, minor spatial structure was also identified. Two upper epipelagic assemblage groups (Epi-B and Epi-H) were defined by longitude and associated with western sampling stations (delineated at and inclusive of stations B247 and SW7; Figure 1). Epi-B was distinguished from its closest neighboring assemblage group (Epi-A), which was comprised of samples collected at eastern stations, by its association with seven additional DL indicator families, including Carangidae, Gempylidae, Gobiidae, Melamphaidae, and Serranidae (Table 2 and Figure 4). Epi-H was associated with seven fewer DL indicator families than its nearest pair of neighboring assemblage groups combined (Epi-I and Epi-J), although only the families Gempylidae (Epi-I and Epi-J) and Melamphaidae (Epi-H) were uniquely characteristic of each branch (Table 2 and Figure 4). Nearly all of the families included in the epipelagic MRT analyses had high DL values (DL = 0.29–0.99) and significant associations with assemblage groups or combinations of assemblage groups, with the exception of the family Alepisauridae (DL = 0.08, P = 0.437) and Platytroctidae, which was not present in epipelagic samples.
Mesopelagic
Mesopelagic (200–1,000 m) larval fish assemblage structure was largely explained by depth, season, surface temperature, and mixed layer depth (although mixed layer depth did not appear on any tree nodes), resulting in seven distinct assemblage groups (Meso-A – Meso-G) and explaining 46.7% of the variability in larval fish assemblage structure (CVRE = 0.533, relevance = 3/4, Figure 5). Assemblage groups Meso-A – Meso-D were associated with the lower mesopelagic (400–1,000 m), and were further separated by season and depth. Assemblage groups Meso-E – Meso-G were associated with the upper mesopelagic (200–400 m), and assemblages within this region were distinguished additionally by season and surface temperature (Figure 5). Seasonal separation of mesopelagic assemblage groups was complete, with no overlap between spring and fall samples within assemblage groups. Broadly, more taxa were associated with upper mesopelagic assemblages (16–19 families) than lower mesopelagic assemblages (6–9 families), although most associations with families outside of the dominant mesopelagic taxa were weak (Table 3). All mesopelagic assemblage groups were widely distributed across sampling locales (Supplementary Figure 3).
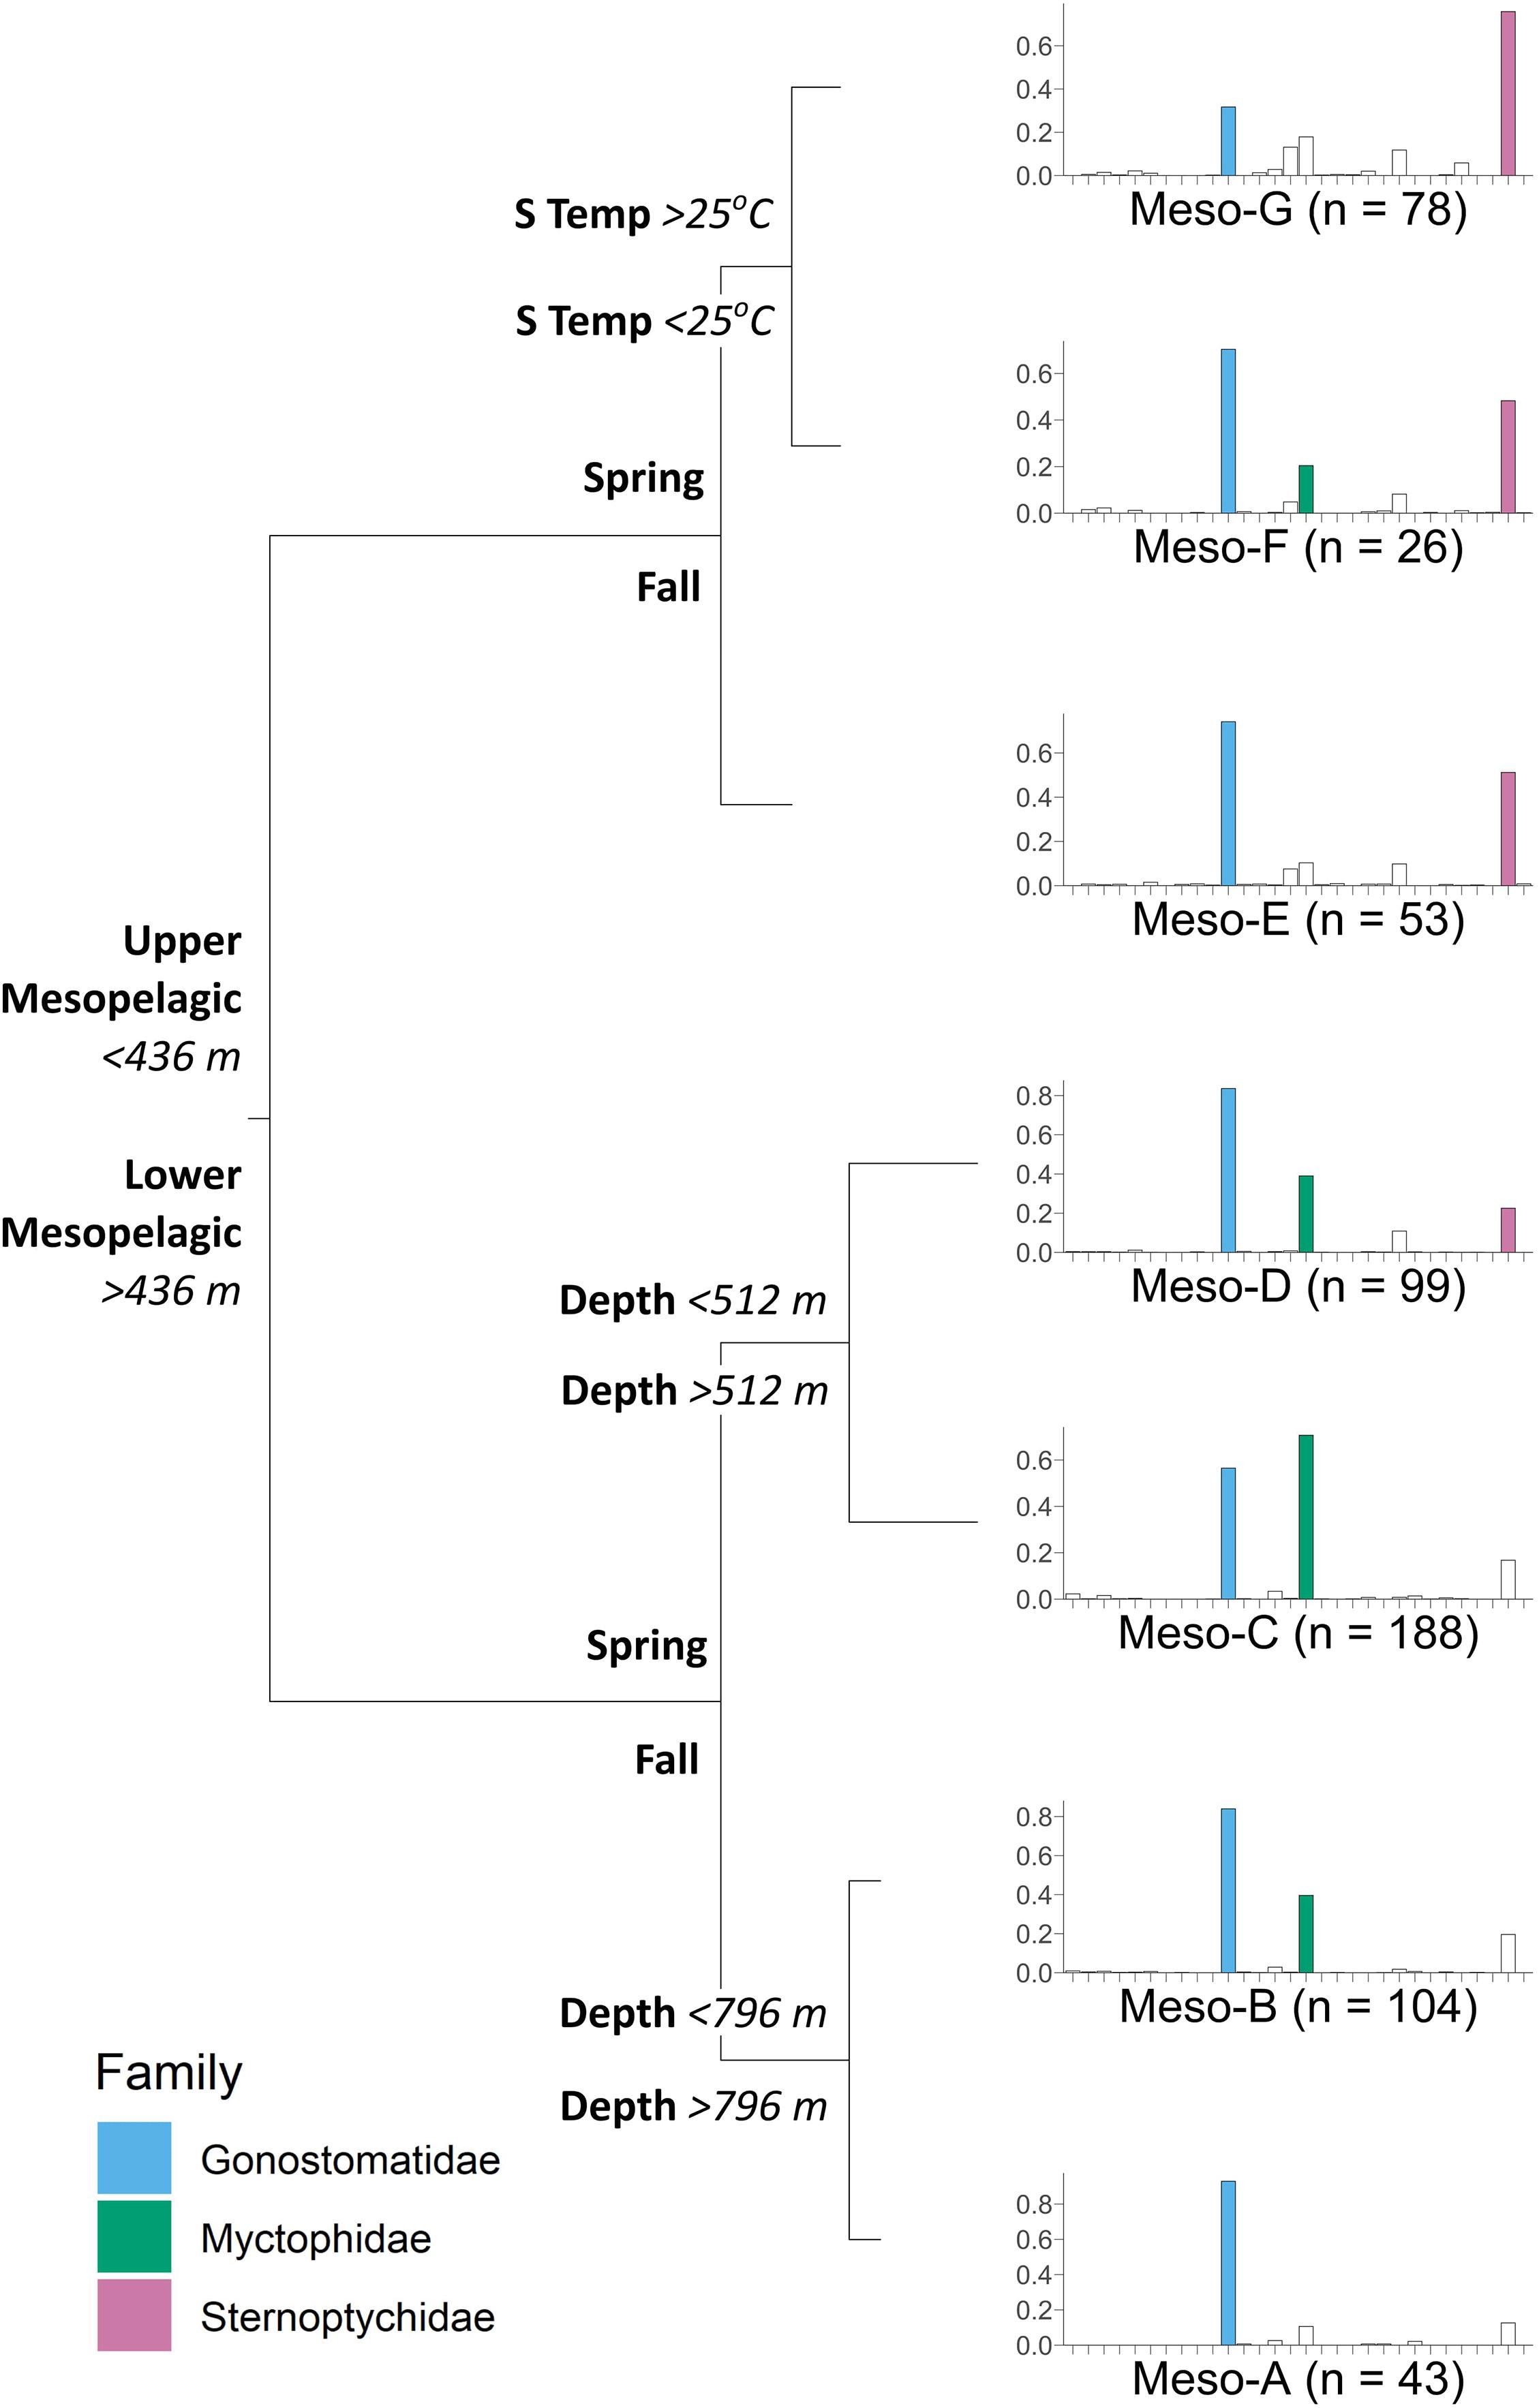
Figure 5. Multivariate regression tree illustrating the effect of depth, season (fall/spring), and surface temperature (S Temp) on the structure of mesopelagic (200–1,000 m) larval fish assemblages in the northern Gulf of Mexico. Each node represents a diverging environmental or spatiotemporal variable, resulting in terminal nodes with distinct assemblage groups (Meso-A – Meso-G). Barplots represent mean square root relative abundance (i.e., Hellinger-transformed larval abundance; y-axis) for each of 30 families (x-axis) in alphabetical order from left to right (see Table 2 for list of family names), with the most abundant families (abundance > 0.2) in each assemblage group highlighted in color for clarity. Sample size (n) for each assemblage group is indicated next to the group name.
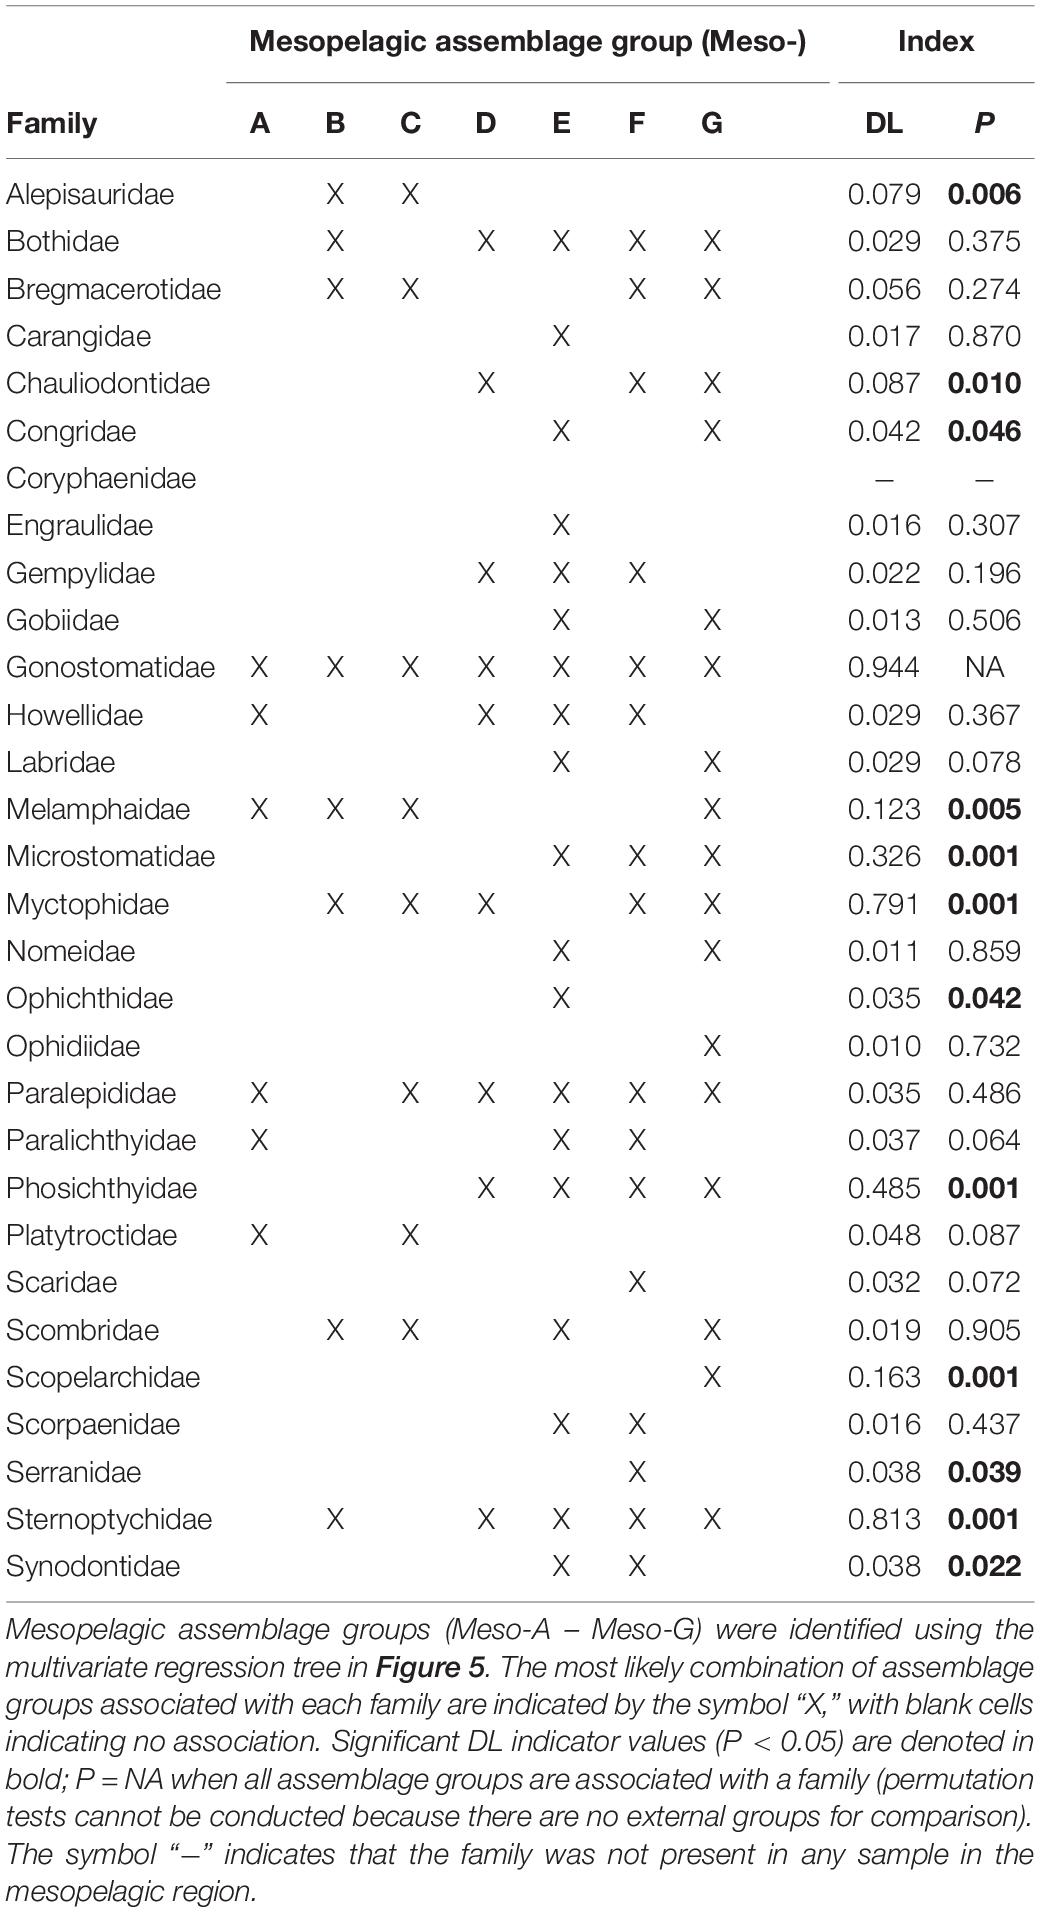
Table 3. Dufrêne-Legendre (DL) indicator values characterizing the association of larval fish families with mesopelagic assemblage groups (or combinations of assemblage groups) following De Cáceres et al. (2010).
Presence of the family Gonostomatidae was strongly characteristic of all mesopelagic assemblage groups (DL = 0.94, P = NA; Table 3 and Figure 5). The family Myctophidae was associated with the combination of three lower mesopelagic (Meso-B – Meso-D) and two upper mesopelagic (Meso-F and Meso-G) assemblage groups (DL = 0.79, P = 0.001; Table 3 and Figure 5), and was not associated with fall assemblage groups at 200–400 or 800–1,000 m depths. The families Sternoptychidae (DL = 0.81, P = 0.001) and Phosichthyidae (DL = 0.49, P = 0.001) were indicative of all upper mesopelagic assemblage groups (Meso-E – Meso-G), the spring assemblage group representing the 400–600 m depth strata (Meso-D), and the fall assemblage group representing 400–800 m depths (Meso-B, Sternoptychidae only; Table 3 and Figure 5). Sternoptychidae and Phosichthyidae were not characteristic of the 800–1,000 m portion of the mesopelagic (Table 3 and Figure 5). The family Microstomatidae, while lower in relative abundance than the aforementioned dominant mesopelagic families, was associated with the upper mesopelagic assemblage groups (Meso-E – Meso-G; DL = 0.33, P = 0.001; Table 3 and Figure 5). All other families had relatively low DL indicator values (DL < 0.2) and lacked strong association with assemblage groups.
Bathypelagic
Bathypelagic (1,000–1,500 m) larval fish assemblage structure was explained by density, surface salinity, and mixed layer depth, resulting in four assemblage groups (Bathy-A – Bathy-D). However, only 8.6% of the variability in assemblage structure was explained by these environmental predictors (CVRE = 0.914, relevance = 3/3), and the majority of samples (87%) fell into a single assemblage group (Bathy-A). Because these environmental variables were such poor predictors of bathypelagic assemblage structure, the bathypelagic MRT and indicator values will not be described further here (Supplementary Table 3 and Supplementary Figure 4).
Discussion
Mesopelagic-associated taxa comprised the majority of ichthyoplankton in both the epipelagic and mesopelagic regions of the northern Gulf of Mexico. Four dominant mesopelagic families (Myctophidae, Gonostomatidae, Sternoptychidae, Phosichthyidae) were particularly common, with few other families making significant contributions to larval assemblage groups within mesopelagic waters. Mesopelagic-associated families outside of the four dominant taxa (e.g., Chauliodontidae, Melamphaidae, Paralepididae) were largely constrained to larval assemblage groups within epipelagic waters, and while these families were occasionally found in the mesopelagic, catches were minimal in comparison to the epipelagic and associations with mesopelagic assemblage groups were weak. Overall, larval abundance declined steeply with increasing depth and even the dominant mesopelagic families were most abundant in epipelagic regions. In both epipelagic and mesopelagic regions, the distinct larval assemblage groups identified were predominantly structured by depth and season, with surface conditions (temperature, salinity, mixed layer depth) and geographic locale (longitude) providing some finer-scale distinctions among assemblages. The most common (largest) epipelagic assemblage groups consisted of samples distributed widely across the GOM, as did all mesopelagic assemblage groups (southeastern gap in sampling coverage during the fall notwithstanding). Meaningful assemblage structure was not detected in the bathypelagic region, which is not surprising given the environmental stability of the pelagic realm beyond 1,000 m depth.
The ubiquity of the dominant mesopelagic ichthyoplankton families detected aligns with prior surveys of adult mesopelagic fishes in the GOM, where Gonostomatidae, Myctophidae, Phosichthyidae, and Sternoptychidae accounted for 96% of all specimens collected (Ross et al., 2010). Ichthyoplankton surveys encompassing outer shelf and oceanic regions of the GOM also found high abundances of these dominant mesopelagic families when sampling epipelagic waters (Muhling et al., 2012; Meinert et al., 2020). Among the few ichthyoplankton surveys sampling to depths (800–1,000 m) comparable to this study, similar broad patterns of distribution were detected in the equatorial and tropical Atlantic when accounting for both epipelagic and mesopelagic waters, with prevalence of the same four dominant families and decreasing abundance and richness with increasing depth (Olivar et al., 2018; Dove et al., 2021).
We found that larval fish assemblages in the oceanic GOM were largely structured by depth and season, which is consistent with patterns from other regions and often reflect the spawning habitat preferences of adults (Doyle et al., 1993; Duffy-Anderson et al., 2006; Muhling et al., 2012). Adult mesopelagic fish assemblages in the GOM were found to lack spatial structure despite the presence of distinct physical oceanographic features among widely separated sampling sites (Ross et al., 2010; Milligan and Sutton, 2020), so it is not unexpected that the epipelagic and mesopelagic larval assemblage groups identified here were broadly distributed across the GOM with little horizontal differentiation. Adult distributions have been found to be important in structuring patterns of larval distribution in mesopelagic fishes in other regions (tropical and equatorial Atlantic, Olivar et al., 2017, 2018; southern Gulf of Mexico, Daudén-Bengoa et al., 2020). While the extent of larval distribution often mirrors patterns of adult distribution, larval assemblages are subsequently subject to strong influence by oceanographic conditions (Grothues and Cowen, 1999). Surface salinity was identified by MRT as the primary environmental variable responsible for differentiating larval fish assemblages within upper and lower epipelagic regions. In the GOM, freshwater and high nutrient discharge from the Mississippi River interact with the Loop Current system to influence salinity variability in the GOM (Dagg and Breed, 2003; Brokaw et al., 2019), resulting in salinity-driven variability in ichthyoplankton diversity and taxonomic richness in the GOM, both of which were highest during low salinity conditions (Meinert et al., 2020). We did not examine Loop Current and Mississippi River influences directly, but variability in salinity was high in the GOM both within and between seasons in surface and upper epipelagic waters, and strongly influenced epipelagic larval fish assemblage structure.
While surface features (surface salinity and temperature) were found to define ichthyoplankton assemblages, mean salinity and temperature for depth-discrete nets were not identified by MRT as structuring environmental variables. The MRT technique is robust to collinearity (De’ath, 2002), and the best fit trees typically remove variables that are redundant. Temperature and depth are not independent, with temperature decreasing as depth increases. Similarly, salinity varies with season in upper epipelagic waters. Both temperature and salinity have limited variability within depth bins in mesopelagic waters. Depth and season are strong drivers of ichthyoplankton assemblage structure in the selected trees, so temperature and salinity may not contribute to additional definition of assemblage groups. Indeed, substituting temperature as a proxy for depth (or including temperature in addition to depth) in our final analyses did not result in appreciably different tree structures. The importance of surface feature variability in defining assemblage structure in both epipelagic and mesopelagic regions here is not surprising, considering that primary productivity is tightly linked to mesopelagic fish biomass in the open ocean (Irigoien et al., 2014). Primary productivity at the surface can impact the mesopelagic food web via vertical migration of fishes and zooplankton prey, as well as sinking particles (Kelly et al., 2019). Larval mesopelagic fishes are weak vertical migrators relative to adults (Sassa et al., 2002), so larvae distributed in mesopelagic waters are likely to benefit from the downward export of surface productivity rather than active migration to feed at the surface. The larvae of common mesopelagic fish species have been found to display different diel patterns of vertical distribution, but migration in the water column was constrained within ∼20–200 m (Sabatés, 2004). Diel periodicity was not identified by MRT as a structuring factor for GOM larval fish assemblages, likely due to our broad epipelagic depth bins precluding detection of any fine scale differences in diel distribution patterns.
Outside of the GOM, the structure of mesopelagic larval fish assemblages has been influenced by currents (Sassa et al., 2004; Olivar et al., 2010), availability of planktonic prey (Olivar et al., 2010; Koslow et al., 2014), oxygen minimum zones (Koslow et al., 2011; Dove et al., 2021), as well as bathymetry (Olivar et al., 2010). Distinct larval fish assemblages have been identified between oceanic and continental shelf waters in the GOM (Richards et al., 1993), and bottom topography can influence the abundance and distributions of mesopelagic fauna by modifying local hydrography (Fock et al., 2004; Sutton et al., 2008; De Forest and Drazen, 2009). Significantly higher abundance and diversity were identified in the offshore GOM when compared to the slope environment in other mesopelagic taxa (Frank et al., 2020). Here, MRT analyses did not distinguish between larval fish assemblages in slope and offshore sampling locales in the GOM. Ichthyoplankton in the GOM were largely concentrated in epipelagic waters, so it is possible that beyond the continental shelf, bathymetric features have minimal influence on the surface conditions that appear to drive assemblage structure for the early life history stages of fishes.
Epipelagic-associated larval fishes were not the primary focus of this study, but the broad distribution patterns found here were generally in agreement with previous studies of common epipelagic larval fishes in the GOM. In particular, we found that larval Engraulidae in oceanic GOM waters are largely associated with fall assemblage groups (September–October). Analyses of long time series of GOM ichthyoplankton on the continental shelf found that Engraulidae were strongly associated with late summer and fall sampling periods (August–October), suggesting that spawning peaks during summer in shallow inshore waters (Muhling et al., 2012; Lyczkowski-Shultz et al., 2013) before dispersing to slope and offshore GOM environments. This timing is further supported by the lack of detection of larval Engraulidae in offshore GOM ichthyoplankton samples during early summer (June–July) (Meinert et al., 2020), although we did occasionally detect low concentrations of larval Engraulidae in spring samples. Engraulidae have previously been associated with western GOM locales (Muhling et al., 2012; Lyczkowski-Shultz et al., 2013). While a weak western pattern can be seen in the epipelagic assemblage groups strongly associated with Engraulidae in this study, these assemblage groups were not defined by longitude in the MRT analysis. Additionally, a lack of sampling effort during fall in the eastern portion of the GOM sampling range precludes us from drawing any conclusions about spatial distributions of larval Engraulidae here.
While our analyses generally indicate broad GOM distribution for most larval assemblages, MRT analysis identified two small assemblage groups (Epi-B and Epi-H) in upper epipelagic waters that were defined by their geographic location (encompassing the westernmost sampling stations, delineated at approximately 90°W). In a study encompassing both shelf and slope ichthyoplankton samples in the GOM, a faunal discontinuity was identified at 87°W with breaks in species distribution and distinct eastern and western patterns of abundance between common species (Lyczkowski-Shultz et al., 2013). This longitudinal differentiation in distribution patterns was attributed to distinct bottom topography (i.e., DeSoto Canyon) driving local circulation, as well as differences in riverine influence (i.e., Mississippi River outflow) (Lyczkowski-Shultz et al., 2013). Single-species evaluations of the larvae of commercially important fisheries species in the GOM have found higher larval abundance in the western GOM (delineated at 89.25°W) when assessing regional patterns of distribution (Hanisko et al., 2017a,b). Eastern and western differentiation in larval fish distribution and abundance in the GOM is well documented, so our finding of a pair of small western assemblage groups certainly warrant further evaluation beyond our family-level analyses.
Assemblage analyses in this study were conducted at the family level, which is not uncommon for studies of ichthyoplankton communities (e.g., in the GOM alone: Richards et al., 1993; Carassou et al., 2012; Muhling et al., 2012; Meinert et al., 2020). It is possible that with improved taxonomic resolution, additional structure could have been detected among GOM larval fish communities. The most common assemblage groups in both epipelagic and mesopelagic regions were largely structured by depth and season, suggesting that ichthyoplankton within families may respond similarly to broad-scale habitat changes. However, many families were associated with multiple assemblage groups, both large and small and across seasons and depth regions, so it is certainly feasible that the finer scale assemblage structure we detected may be attributable to varying environmental tolerances among species within families. It is important to note that MRT assemblage groupings result from evaluations of multivariate abundance and are not defined by the presence or absence of prominent indicator families, but by variation in the relative proportions of abundance of all families in the assemblage. Families that occur across assemblages with disparate environmental characters may differ in proportion of abundance or in coincidence with other families, in addition to potentially reflecting species-specific differences in environmental response that are masked by poor taxonomic resolution. The oceanic GOM is known to support one of the most speciose ichthyofaunas in the world (Sutton et al., 2017), and the ubiquitous family Myctophidae is known to be particularly diverse, with the early life stages of approximately 50 species from 18 genera identified in the GOM (Richards, 2005). Outside of the GOM, both adult and larval myctophids have demonstrated species-specific or subfamily-specific patterns of vertical distribution (Watanabe et al., 1999; Sassa et al., 2002; Collins et al., 2008; Olivar et al., 2018). Within the GOM, it is possible that improved taxonomic resolution could reveal that larval myctophid species are occupying different portions of the water column and contributing to vertical assemblage differentiation. Horizontally, assemblages of adult myctophid species in the GOM were found to be well-mixed, with limited spatial differentiation despite variation in major hydrographic features (Milligan and Sutton, 2020). Adult myctophids are presumed to be less susceptible to local oceanographic conditions due to their large capacity for vertical migration, which may allow for passive advection at depth with varying currents, promoting more horizontal assemblage homogenization than would be expected with environment-driven structuring (Heino et al., 2015; Milligan and Sutton, 2020). Larval myctophids display limited vertical migration behavior compared to adults (Sassa et al., 2002) and ichthyoplankton are highly sensitive to the local environment (Kingsford, 1993; Brodeur et al., 2008; Hsieh et al., 2009), so it’s possible that larval myctophid distribution patterns are quite distinct from those of their more mobile adult counterparts. It remains unknown whether increased taxonomic resolution (i.e., species-specific assemblage analyses of Myctophidae and other speciose families such as Carangidae and Scombridae) would have resulted in the detection of additional partitioning of GOM larval assemblages or aided in the ecological interpretation of defined assemblages. Regardless, when the aim is to describe overall ichthyoplankton structure or assess changes in ichthyoplankton assemblages resulting from environmental perturbations, family-level analyses have been found to be sufficient (Hernandez et al., 2013).
One goal of this study was to fill a gap in knowledge about larval fish distributions beyond the epipelagic waters of the GOM. A lack of baseline data about the early life stages of mesopelagic fishes in the GOM was apparent following the DWHOS, limiting the efficacy of subsequent damage assessment efforts. Effects of the DWHOS on epipelagic-associated larval fish populations in the GOM have been equivocal, but studies to date largely reflect resilient populations. On the continental shelf, red snapper showed declines in larval condition in the years following DWHOS (Hernandez et al., 2016), while detrimental effects on Spanish mackerel larval condition were not detected (Ransom et al., 2016); declines in abundance were not detected in either species in relation to the timing of DWHOS. In oceanic waters, declines were detected in the larval abundance of common pelagic fish species (blackfin tuna, blue marlin, dolphinfish, sailfish) in the months following DWHOS, although the declines were within the scope of interannual variability resulting from shifts in oceanographic conditions that may be unrelated to DWHOS (Rooker et al., 2013). Mesozooplankton communities were found to recover rapidly after initial DWHOS impacts (Carassou et al., 2014), perhaps contributing to food web continuity and minimizing DWHOS declines for the largely zooplanktivorous ichthyoplankton communities in the GOM.
Larval fish in the epipelagic GOM are surveyed annually (spring and fall) as part of a long-term monitoring program (Southeast Area Monitoring and Assessment Program [SEAMAP], Lyczkowski-Shultz et al., 2013), but no such survey exists for the water column beyond 200 m. This study provides the first large-scale characterization of larval fish assemblages in the GOM that encompasses epipelagic, mesopelagic, and bathypelagic portions of the water column, providing a vital description of mesopelagic-associated larval fish distributions within the full scope of their vertical habitat distribution. While the brief sampling timeframe of this study provides only a snapshot of two seasons of larval fish distributions in the GOM, our findings will provide a useful reference point for GOM ichthyoplankton communities nonetheless. We found that the vast majority of ichthyoplankton (including both epipelagic- and mesopelagic-associated families) were located in the epipelagic portion of the water column. Mesopelagic waters were dominated by larvae from four dominant mesopelagic families, which made up distinct assemblage groups that were widespread and largely structured by depth and season, not by spatial distribution. The bathypelagic GOM consisted of very few larval fish overall with limited diversity. Together, these results suggest that long-term epipelagic-focused surveys such as SEAMAP may be sufficient for characterizing the distributions of most mesopelagic-associated larval fishes and evaluating the responses of these communities to environmental perturbations. To capture variation in abundances of dominant mesopelagic-associated larval fish families associated with mesopelagic waters, the spatial scope of mesopelagic sampling for future assessments can likely be reduced considering the horizontal ubiquity of most larval assemblage groups. Tremendous resources and effort are required to assess damages to the marine environment, particularly when accounting for the logistical challenges of sampling the deep pelagic, so concentrating future evaluation efforts on epipelagic waters and reduced mesopelagic spatial extent can aid in speeding assessment, restoration, and mitigation.
Data Availability Statement
The data are publicly available through the Gulf of Mexico Research Initiative Information and Data Cooperative (GRIIDC) at https://data.gulfresearchinitiative.org (10.7266/n7-z8ry-6j20, 10.7266/n7-30jwaq82, 10.7266/n7-n2t3-aa19, 10.7266/n7-s18hwr95, 10.7266/n7-9vcj-nf90, 10.7266/n7-dp76-tz89, 10.7266/n7-j6rb-dt32, 10.7266/n7-7fxg-2980, 10.7266/n7-qecb-7x31, 10.7266/n7-rjqw-tf97, 10.7266/n7-60cgk731, and 10.7266/n7-1v14-fc70).
Author Contributions
FH, VW, and CZ contributed to the conception and design of the study. VW and CZ organized the database. VW conducted the data analyses, prepared the figures, and wrote the first manuscript draft. All authors reviewed and edited the final draft.
Funding
This research was made possible by a grant from the Gulf of Mexico Research Initiative (Award No. G-231805).
Conflict of Interest
The authors declare that the research was conducted in the absence of any commercial or financial relationships that could be construed as a potential conflict of interest.
Publisher’s Note
All claims expressed in this article are solely those of the authors and do not necessarily represent those of their affiliated organizations, or those of the publisher, the editors and the reviewers. Any product that may be evaluated in this article, or claim that may be made by its manufacturer, is not guaranteed or endorsed by the publisher.
Acknowledgments
We are grateful to all who contributed to the Deepwater Horizon Natural Resource Damage Assessment (DWHOS NRDA) efforts, particularly Malinda Sutor (LSU), Scott Friedman (IEC), Daniel Hahn (NOAA), Glenn Zapfe (NOAA), Joanne Lyczkowski-Schultz (NOAA), and Lauren Jackson (NOAA). Access to DWHOS NRDA data was generously provided by the Deepwater Horizon Plankton Assessment Archive and the National Centers for Environmental Information.
Supplementary Material
The Supplementary Material for this article can be found online at: https://www.frontiersin.org/articles/10.3389/fmars.2021.766369/full#supplementary-material
References
Ahlstrom, E. H. (1959). Vertical distribution of pelagic fish eggs and larvae off California and Baja California. Fish. Bull. 60, 107–146.
Brodeur, R. D., Peterson, W. T., Auth, T. D., Soulen, H. L., Parnel, M. M., and Emerson, A. A. (2008). Abundance and diversity of coastal fish larvae as indicators of recent changes in ocean and climate conditions in the Oregon upwelling zone. Mar. Ecol. Prog. Ser. 366, 187–202.
Brokaw, R. J., Subrahmanyam, B., and Morey, S. L. (2019). Loop current and eddy-driven salinity variability in the gulf of Mexico. Geophys. Res. Lett. 46, 5978–5986. doi: 10.1029/2019GL082931
Burdett, E. A., Fine, C. D., Sutton, T. T., Cook, A. B., and Frank, T. M. (2017). Geographic and depth distributions, ontogeny, and reproductive seasonality of decapod shrimps (Caridea: Oplophoridae) from the northeastern Gulf of Mexico. Bull. Mar. Sci. 93, 743–767. doi: 10.5343/bms.2016.1083
Carassou, L., Hernandez, F. J., and Graham, W. M. (2014). Change and recovery of coastal mesozooplankton community structure during the Deepwater Horizon oil spill. Environ. Res. Lett. 9:124003.
Carassou, L., Hernandez, F. J., Powers, S. P., and Graham, W. M. (2012). Cross-shore, seasonal, and depth-related structure of ichthyoplankton assemblages in coastal alabama. Transa. Am. Fish. Soc. 141, 1137–1150. doi: 10.1080/00028487.2012.675920
Choy, C. A., Portner, E., Iwane, M., and Drazen, J. C. (2013). Diets of five important predatory mesopelagic fishes of the central North Pacific. Mar. Ecol. Prog. Ser. 492, 169–184.
Collins, M. A., Xavier, J. C., Johnston, N. M., North, A. W., Enderlein, P., Tarling, G. A., et al. (2008). Patterns in the distribution of myctophid fish in the northern Scotia Sea ecosystem. Polar Biol. 31, 837–851. doi: 10.1007/s00300-008-0423-2
Cook, A. B., Bernard, A. M., Boswell, K. M., Bracken-Grissom, H., D’Elia, M., deRada, S., et al. (2020). A Multidisciplinary approach to investigate deep-pelagic ecosystem dynamics in the Gulf of Mexico following Deepwater Horizon. Front. Mar. Sci. 7:548880. doi: 10.3389/fmars.2020.548880
Dagg, M. J., and Breed, G. A. (2003). Biological effects of Mississippi River nitrogen on the northern gulf of Mexico—a review and synthesis. J. Mar. Syst. 43, 133–152. doi: 10.1016/j.jmarsys.2003.09.002
Daudén-Bengoa, G., Jiménez-Rosenberg, S. P. A., Compaire, J. C., del Pilar Echeverri-García, L., Pérez-Brunius, P., and Herzka, S. Z. (2020). Larval fish assemblages of myctophids in the deep water region of the southern Gulf of Mexico linked to oceanographic conditions. Deep Sea Res. Part I Oceanogr. Res. Pap. 155:103181. doi: 10.1016/j.dsr.2019.103181
Davison, P. C., Checkley, D. M., Koslow, J. A., and Barlow, J. (2013). Carbon export mediated by mesopelagic fishes in the northeast Pacific Ocean. Prog. Oceanogr. 116, 14–30. doi: 10.1016/j.pocean.2013.05.013
De Cáceres, M., and Legendre, P. (2009). Associations between species and groups of sites: indices and statistical inference. Ecology 90, 3566–3574. doi: 10.1890/08-1823.1
De Cáceres, M., Legendre, P., and Moretti, M. (2010). Improving indicator species analysis by combining groups of sites. Oikos 119, 1674–1684. doi: 10.1111/j.1600-0706.2010.18334.x
De Forest, L., and Drazen, J. (2009). The influence of a Hawaiian seamount on mesopelagic micronekton. Deep Sea Res. Part I Oceanogr. Res. Pap. 56, 232–250. doi: 10.1016/j.dsr.2008.09.007
De’ath, G. (2002). Multivariate regression trees: a new technique for modeling species–environment relationships. Ecology 83, 1105–1117.
Dove, S., Tiedemann, M., and Fock, H. O. (2021). Latitudinal transition of mesopelagic larval fish assemblages in the eastern central Atlantic. Deep Sea Res. Part I Oceanogr. Res. Pap. 168:103446. doi: 10.1016/j.dsr.2020.103446
Doyle, M. J., Morse, W. W., and Kendall, J. A. W. (1993). A comparison of larval fish assemblages in the temperate zone of the northeast pacific and northwest atlantic oceans. Bull. Mar. Sci. 53, 588–644.
Drazen, J. C., and Sutton, T. T. (2017). Dining in the deep: the feeding ecology of deep-sea fishes. Annu. Rev. Mar. Sci. 9, 337–366. doi: 10.1146/annurev-marine-010816-060543
Duffy-Anderson, J. T., Busby, M. S., Mier, K. L., Deliyanides, C. M., and Stabeno, P. J. (2006). Spatial and temporal patterns in summer ichthyoplankton assemblages on the eastern Bering Sea shelf 1996–2000. Fish. Oceanogr. 15, 80–94. doi: 10.1111/j.1365-2419.2005.00348.x
Dufrêne, M., and Legendre, P. (1997). Species assemblages and indicator species: the need for a flexible asymmetrical approach. Ecol. Monogr. 67, 345–366.
Fisher, C. R., Montagna, P. A., and Sutton, T. T. (2016). How did the Deepwater Horizon oil spill impact deep-sea ecosystems? Oceanography 29, 182–195.
Fock, H. O., Pusch, C., and Ehrich, S. (2004). Structure of deep-sea pelagic fish assemblages in relation to the Mid-Atlantic Ridge (45°–50°N). Deep Sea Res. Part I Oceanogr. Res. Pap. 51, 953–978. doi: 10.1016/j.dsr.2004.03.004
Frank, T. M., Fine, C. D., Burdett, E. A., Cook, A. B., and Sutton, T. T. (2020). The vertical and horizontal distribution of deep-sea crustaceans in the order euphausiacea in the vicinity of the deepwater horizon oil spill. Front. Mar. Sci. 7:99. doi: 10.3389/fmars.2020.00099
Fuiman, L. A., and Werner, R.G. (eds) (2002). Fishery Science: The Unique Contributions of Early Life Stages. Oxford: Blackwell Science.
Grothues, T. M., and Cowen, R. K. (1999). Larval fish assemblages and water mass history in a major faunal transition zone. Continent. Shelf Res. 19, 1171–1198.
Hanisko, D. S., Pollack, A., Zapfe, G., and Ingram, G. W. Jr. (2017a). King Mackerel (Scomberomorus cavalla) Larval Indices of Relative Abundance From SEAMAP Fall Plankton Surveys in the Gulf of Mexico, 1986 to 2014 SCRS/2017/095. Washington, DC: NOAA.
Hanisko, D. S., Pollack, A. G., Zapfe, G., and Ingram, G. W. Jr. (2017b). Spanish mackerel (Scomberomorus maculatus) Larval Indices of Relative Abundance From SEAMAP Fall Plankton Surveys in the Gulf of Mexico, 1986 to 2014 SCRS/2017/094. Washington, DC: NOAA.
Heino, J., Melo, A. S., Siqueira, T., Soininen, J., Valanko, S., and Bini, L. M. (2015). Metacommunity organisation, spatial extent and dispersal in aquatic systems: patterns, processes and prospects. Freshw. Biol. 60, 845–869. doi: 10.1111/fwb.12533
Hernandez, F. J. Jr., Carassou, L., Graham, W. M., and Powers, S. P. (2013). Evaluation of the taxonomic sufficiency approach for ichthyoplankton community analysis. Mar. Ecol. Prog. Ser. 491, 77–90.
Hernandez, F. J., Filbrun, J. E., Fang, J., and Ransom, J. T. (2016). Condition of larval red snapper (Lutjanus campechanus) relative to environmental variability and the Deepwater Horizon oil spill. Environ. Res. Lett. 11:094019. doi: 10.1088/1748-9326/11/9/094019
Hopkins, T. L., Sutton, T. T., and Lancraft, T. M. (1996). The trophic structure and predation impact of a low latitude midwater fish assemblage. Prog. Oceanogr. 38, 205–239. doi: 10.1016/S0079-6611(97)00003-7
Houde, E. D. (1989). Subtleties and episodes in the early life of fishes. J. Fish Biol. 35, 29–38. doi: 10.1111/j.1095-8649.1989.tb03043.x
Hsieh, C.-H., Chen, C.-S., Chiu, T.-S., Lee, K.-T., Shieh, F.-J., Pan, J.-Y., et al. (2009). Time series analyses reveal transient relationships between abundance of larval anchovy and environmental variables in the coastal waters southwest of Taiwan. Fish. Oceanogr. 18, 102–117. doi: 10.1111/j.1365-2419.2008.00498.x
Irigoien, X., Klevjer, T. A., Røstad, A., Martinez, U., Boyra, G., Acuña, J. L., et al. (2014). Large mesopelagic fishes biomass and trophic efficiency in the open ocean. Nat. Commun. 5:3271. doi: 10.1038/ncomms4271
Kelly, T. B., Davison, P. C., Goericke, R., Landry, M. R., Ohman, M. D., and Stukel, M. R. (2019). The importance of mesozooplankton diel vertical migration for sustaining a mesopelagic food web. Front. Mar. Sci. 6:508. doi: 10.3389/fmars.2019.00508
Kingsford, M. J. (1993). Biotic and abiotic structure in the pelagic environment: importance to small fishes. Bull. Mar. Sci. 53, 393–415.
Koslow, J. A., Davison, P., Lara-Lopez, A., and Ohman, M. D. (2014). Epipelagic and mesopelagic fishes in the southern California Current System: ecological interactions and oceanographic influences on their abundance. J. Mar. Syst. 138, 20–28. doi: 10.1016/j.jmarsys.2013.09.007
Koslow, J. A., Goericke, R., Lara-Lopez, A., and Watson, W. (2011). Impact of declining intermediate-water oxygen on deepwater fishes in the California Current. Mar. Ecol. Prog. Ser. 436, 207–218.
Legendre, P., and Gallagher, E. D. (2001). Ecologically meaningful transformations for ordination of species data. Oecologia 129, 271–280. doi: 10.1007/s004420100716
Levitus, S. (1982). Climatological Atlas of the World Ocean. US Department of Commerce, National Oceanic and Atmospheric Administration. Washington, DC: US Department of Commerce.
Lyczkowski-Shultz, J., Hanisko, D. S., Sulak, K. J., Konieczna, M., and Bond, P. J. (2013). Characterization of ichthyoplankton in the northeastern Gulf of Mexico from SEAMAP plankton surveys, 1982-1999. Gulf Caribb. Res. 25, 43–98.
Meinert, C. R., Clausen-Sparks, K., Cornic, M., Sutton, T. T., and Rooker, J. R. (2020). taxonomic richness and diversity of larval fish assemblages in the oceanic gulf of mexico: links to oceanographic conditions. Front. Mar. Sci. 7:579. doi: 10.3389/fmars.2020.00579
Milligan, R. J., and Sutton, T. T. (2020). Dispersion overrides environmental variability as a primary driver of the horizontal assemblage structure of the mesopelagic fish family myctophidae in the Northern Gulf of Mexico. Front. Mar. Sci. 7:15. doi: 10.3389/fmars.2020.00015
Moser, G. H., and Smith, P. E. (1993). Larval fish assemblages of the california current region and their horizontal and vertical distributions across a front. Bull. Mar. Sci. 53, 645–691.
Muhling, B. A., Lamkin, J. T., and Richards, W. J. (2012). Decadal-scale responses of larval fish assemblages to multiple ecosystem processes in the northern Gulf of Mexico. Mar. Ecol. Prog. Ser. 450, 37–53.
Murdy, E., Matheson, R. Jr., Fechhelm, J., and McCoid, M. (1983). Midwater fishes of the Gulf of Mexico collected from the R/V Alaminos, 1965-1973 [32 families, 75 genera, 116 species]. Texas J. Sci. 35, 109–127.
Olivar, M. P., Contreras, T., Hulley, P. A., Emelianov, M., López-Pérez, C., Tuset, V., et al. (2018). Variation in the diel vertical distributions of larvae and transforming stages of oceanic fishes across the tropical and equatorial Atlantic. Prog. Oceanogr. 160, 83–100. doi: 10.1016/j.pocean.2017.12.005
Olivar, M. P., Emelianov, M., Villate, F., Uriarte, I., Maynou, F., ÁLvarez, I., et al. (2010). The role of oceanographic conditions and plankton availability in larval fish assemblages off the Catalan coast (NW Mediterranean). Fish. Oceanogr. 19, 209–229. doi: 10.1111/j.1365-2419.2010.00538.x
Olivar, M. P., Hulley, P. A., Castellón, A., Emelianov, M., López, C., Tuset, V. M., et al. (2017). Mesopelagic fishes across the tropical and equatorial Atlantic: biogeographical and vertical patterns. Prog. Oceanogr. 151, 116–137. doi: 10.1016/j.pocean.2016.12.001
Poos, M. S., and Jackson, D. A. (2012). Addressing the removal of rare species in multivariate bioassessments: the impact of methodological choices. Ecol. Indic. 18, 82–90. doi: 10.1016/j.ecolind.2011.10.008
R Core Team (2019). R: A Language and Environment for Statistical Computing. Vienna: R Foundation for Statistical Computing.
Rakocinski, C. F., Lyczkowski-Shultz, J., and Richardson, S. L. (1996). Ichthyoplankton assemblage structure in mississippi sound as revealed by canonical correspondence analysis. Estuar. Coast. Shelf Sci. 43, 237–257. doi: 10.1006/ecss.1996.0067
Ramirez-Llodra, E., Tyler, P. A., Baker, M. C., Bergstad, O. A., Clark, M. R., Escobar, E., et al. (2011). Man and the last great wilderness: human impact on the deep sea. PLoS One 6:e22588. doi: 10.1371/journal.pone.0022588
Ransom, J. T., Filbrun, J. E., and Hernandez, F. J. Jr. (2016). Condition of larval Spanish mackerel Scomberomorus maculatus in relation to the Deepwater Horizon oil spill. Mar. Ecol. Prog. Ser. 558, 143–152.
Richards, W. J. (2005). Early Stages of Atlantic Fishes: An Identification Guide for the Western Central North Atlantic, Two Volume Set. Boca Raton, FL: CRC Press.
Richards, W. J., McGowan, M. F., Leming, T., Lamkin, J. T., and Kelley, S. (1993). Larval fish assemblages at the loop current boundary in the Gulf of Mexico. Bull. Mar. Sci. 53, 475–537.
Rooker, J. R., Kitchens, L. L., Dance, M. A., Wells, R. J. D., Falterman, B., and Cornic, M. (2013). Spatial, temporal, and habitat-related variation in abundance of pelagic fishes in the Gulf of Mexico: potential implications of the Deepwater Horizon Oil Spill. PLoS One 8:e76080. doi: 10.1371/journal.pone.0076080
Ross, S. W., Quattrini, A. M., Roa-Varón, A. Y., and McClain, J. P. (2010). Species composition and distributions of mesopelagic fishes over the slope of the north-central Gulf of Mexico. Deep Sea Res. Part II Top. Stud. Oceanogr. 57, 1926–1956. doi: 10.1016/j.dsr2.2010.05.008
Sabatés, A. (2004). Diel vertical distribution of fish larvae during the winter-mixing period in the Northwestern Mediterranean. ICES J. Mar. Sci. 61, 1243–1252. doi: 10.1016/j.icesjms.2004.07.022
Sassa, C., and Kawaguchi, K. (2006). Occurrence patterns of mesopelagic fish larvae in Sagami Bay, central Japan. J. Oceanogr. 62, 143–153. doi: 10.1007/s10872-006-0040-z
Sassa, C., Kawaguchi, K., and Mori, K. (2004). Late winter larval mesopelagic fish assemblage in the Kuroshio waters of the western North Pacific. Fish. Oceanogr. 13, 121–133. doi: 10.1046/j.1365-2419.2003.00275.x
Sassa, C., Moser, H. G., and Kawaguchi, K. (2002). Horizontal and vertical distribution patterns of larval myctophid fishes in the Kuroshio Current region. Fish. Oceanogr. 11, 1–10. doi: 10.1046/j.1365-2419.2002.00182.x
Sutton, T. T., Clark, M. R., Dunn, D. C., Halpin, P. N., Rogers, A. D., Guinotte, J., et al. (2017). A global biogeographic classification of the mesopelagic zone. Deep Sea Res. Part I Oceanogr. Res. Pap. 126, 85–102. doi: 10.1016/j.dsr.2017.05.006
Sutton, T. T., Porteiro, F. M., Heino, M., Byrkjedal, I., Langhelle, G., Anderson, C. I. H., et al. (2008). Vertical structure, biomass and topographic association of deep-pelagic fishes in relation to a mid-ocean ridge system. Deep Sea Res. Part II Top. Stud. Oceanogr. 55, 161–184. doi: 10.1016/j.dsr2.2007.09.013
Watanabe, H., Moku, M., Kawaguchi, K., Ishimaru, K., and Ohno, A. (1999). Diel vertical migration of myctophid fishes (Family Myctophidae) in the transitional waters of the western North Pacific. Fish. Oceanogr. 8, 115–127. doi: 10.1046/j.1365-2419.1999.00103.x
Keywords: ichthyoplankton, plankton survey, MOCNESS, deep sea, multivariate regression tree, Dufrêne-Legendre
Citation: Wang VH, Zapfe CR and Hernandez FJ (2021) Assemblage Structure of Larval Fishes in Epipelagic and Mesopelagic Waters of the Northern Gulf of Mexico. Front. Mar. Sci. 8:766369. doi: 10.3389/fmars.2021.766369
Received: 29 August 2021; Accepted: 19 October 2021;
Published: 18 November 2021.
Edited by:
Hui Zhang, Institute of Oceanology, Chinese Academy of Sciences (CAS), ChinaReviewed by:
Simon Geist, Texas A&M University Corpus Christi, United StatesKhor Waiho, University of Malaysia Terengganu, Malaysia
Copyright © 2021 Wang, Zapfe and Hernandez. This is an open-access article distributed under the terms of the Creative Commons Attribution License (CC BY). The use, distribution or reproduction in other forums is permitted, provided the original author(s) and the copyright owner(s) are credited and that the original publication in this journal is cited, in accordance with accepted academic practice. No use, distribution or reproduction is permitted which does not comply with these terms.
*Correspondence: Verena H. Wang, d2FuZ3YyMUBlY3UuZWR1
†Present address: Verena H. Wang, Department of Biology, Coastal Studies Institute, East Carolina University, Wanchese, NC, United States