 Tomoharu Senjyu
- Research Institute for Applied Mechanics, Kyushu University, Fukuoka, Japan
The influence of global warming on mid-depth water mass ventilation in the Japan Sea was investigated using both Argo-based and ship-based hydrographic datasets. The Argo-based dataset of the entire Japan Sea area revealed a warming trend during the past two decades in the upper portion of the Japan Sea Proper Water (UJSPW), which lies at intermediate depths from just under the main thermocline to approximately 1000 m. The warming rates in the southern Japan Sea are generally greater than those in the northern sea by a factor of 2–3. Long-term hydrographic data obtained over the last five decades in the northeast and southeast of the sea revealed that higher warming rates in the southern sea began from 2008, although a significant warming in both northern and southern seas was initiated from the late 1980s. A stagnation in the UJSPW formation from the late 1980s was suggested by a positive shift in the winter sea surface temperature in its formation region and a decreasing trend in dissolved oxygen concentration during the 1990s. In addition, a vertical multi-box model demonstrated that an imbalance between the heating from the upper layer and the cold water supply from its source region induces a warming in the UJSPW. We conclude that a significant change in the mid-depth water mass ventilation occurred in the entire Japan Sea in the late 1980s due to a stagnation in the UJSPW formation. Subsequently, a modest event in the mid-depth water mass ventilation have occurred since 2008. The higher warming rates in the southern sea than those in the northern sea in the event suggest a reduction in cold UJSPW supply to the southern sea from its formation region.
Introduction
Oceanic thermohaline circulation, which is an important part of the global climate system, is believed to be significantly influenced by global warming. The freshening of mid-depth water masses in the Pacific and Indian Oceans and the warming of bottom water in the subarctic North Pacific have been considered evidence of the influence of global warming (Wong et al., 1999; Fukasawa et al., 2004). However, little is known about how thermohaline circulation responds to global warming and the signals that can be detected in oceans.
The Japan Sea is a mid-latitude marginal sea loosely separated from the northwestern North Pacific by the Japanese archipelago (Figure 1). One of the unique features of the Japan Sea is a self-contained thermohaline circulation system that includes deep water formation. The thermohaline circulation system in the Japan Sea is sensitive to global warming and climate change owing to its limited size (Bindoff et al., 2007). In fact, a gradual warming and depletion in the dissolved oxygen (DO) concentration have been reported from the abyssal Japan Sea, suggesting a stagnation in the deep water formation (Gamo et al., 1986; Minami et al., 1999; Gamo, 2011). Therefore, the Japan Sea can be regarded as a “canary in a coal mine” of climate change impacts in the global oceans (Gamo, 2011).
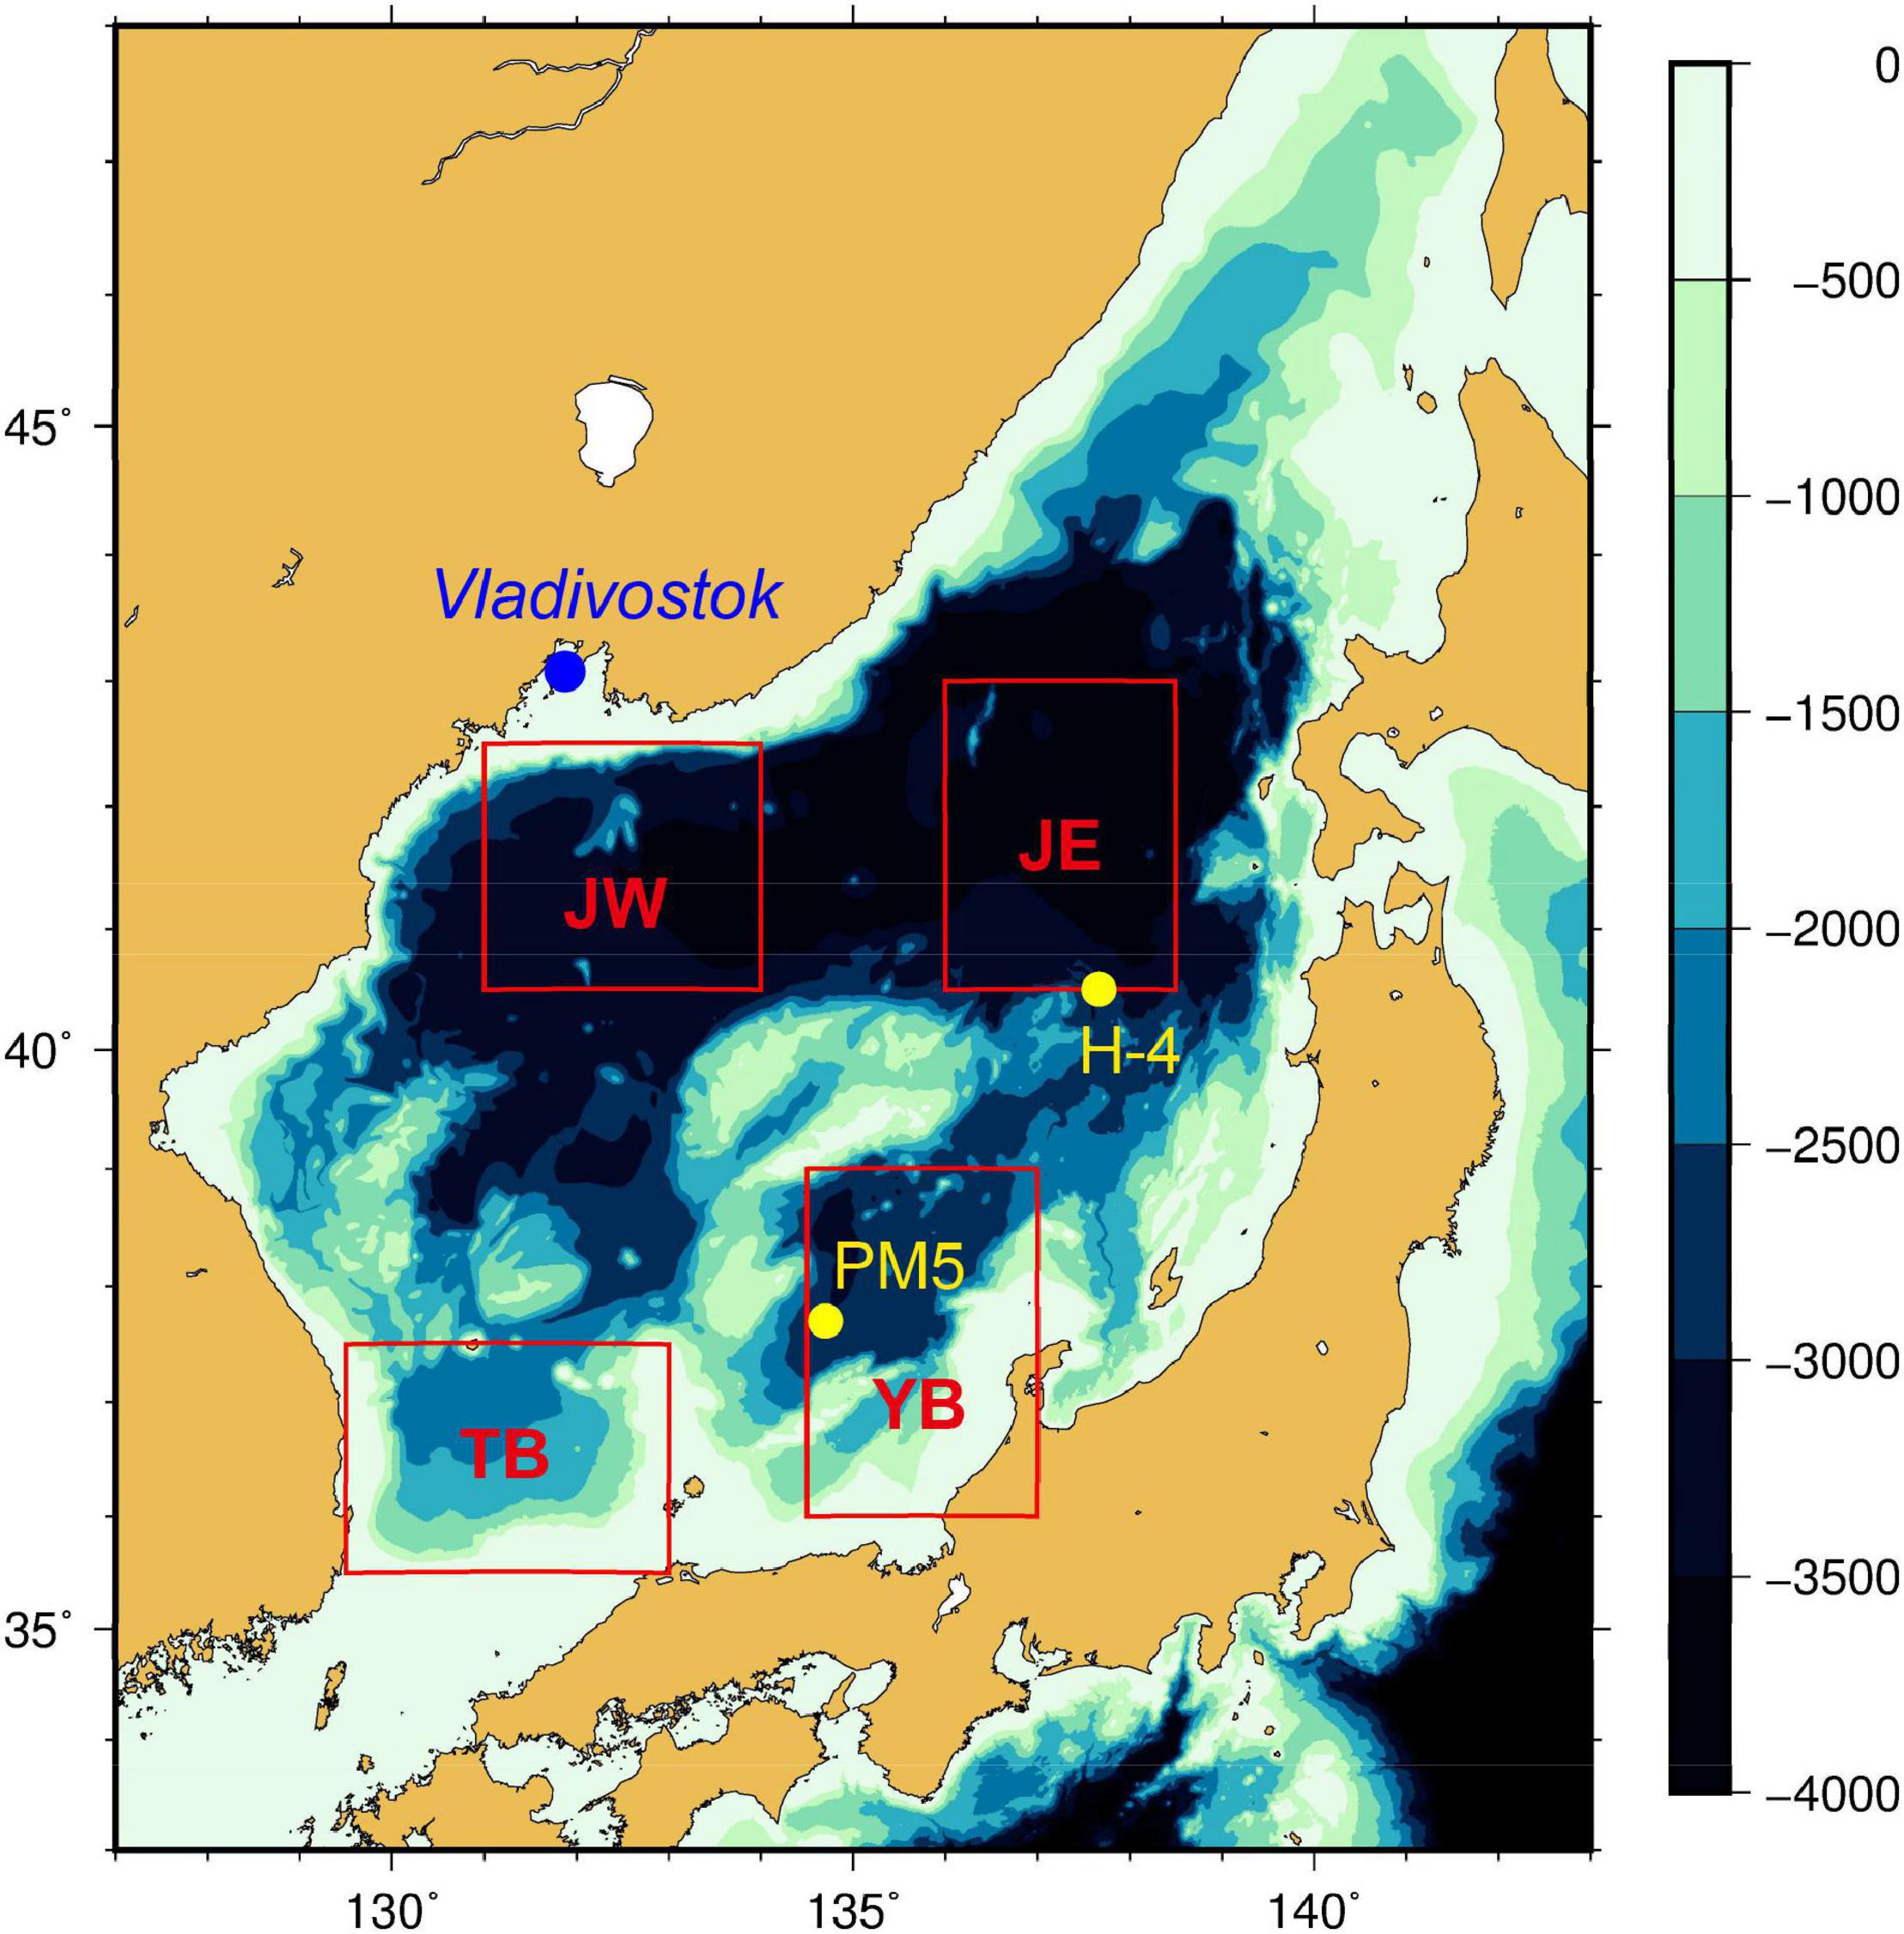
Figure 1. Bottom topography of the Japan Sea. Red squares labeled JW, JE, YB, and TB indicate the areas for the Argo data analysis representing the western Japan, eastern Japan, Yamato, and Tsushima Basins, respectively. Two yellow circles labeled H-4 and PM5 show the long-term hydrographic stations by the JMA. The location of Vladivostok is indicated by a blue circle.
A simple view of thermohaline circulation in the Japan Sea is as follows. The layer under the main thermocline of the Japan Sea is occupied by a water mass called the Japan Sea Proper Water (JSPW), which was previously considered a single water mass because of its narrow temperature (0–1°C) and salinity (34.06–34.08) ranges (Uda, 1934; Worthington, 1981). The JSPW is formed by deep convection due to surface cooling in winter in the northwestern Japan Sea (Sudo, 1986; Senjyu and Sudo, 1993, 1994; Seung and Yoon, 1995; Senjyu et al., 2002). The cold and oxygen-rich characteristics (>190 μmol kg–1) in the JSPW as well as its narrowness in temperature and salinity ranges originate from the convective formation process (Senjyu, 2020). Because of the shallow sill depths of the four straits connecting the Japan Sea with other waters, the JSPW is perfectly isolated from the surrounding seas. Hence, the JSPW sunken into a deep layer in the northwestern region gradually upwells during the course of the cyclonic circulation in the abyssal Japan Sea basins (Senjyu et al., 2005b; Senjyu and Yoshida, 2019).
Close examinations of water characteristics have revealed that the JSPW consists of several water masses (e.g., Nitani, 1972; Gamo and Horibe, 1983; Senjyu and Sudo, 1993, 1994, 1996; Kim et al., 2004). Circulation and ventilation systems corresponding to each water mass have been suggested in accordance with this layered water mass system (Kang et al., 2004; Hatta and Zhang, 2006). In this study, we implicitly assume three-layered water masses, the upper portion of the Japan Sea Proper Water (UJSPW) from just under the main thermocline to approximately 1000 m (Sudo, 1986; Senjyu and Sudo, 1993, 1994), the deep water lying approximately 1000–2000 m (Nitani, 1972; Kim et al., 2004), and bottom water below approximately 2000 m (Gamo and Horibe, 1983; Gamo et al., 1986).
This study discusses the recent influence of global warming on the mid-depth water mass in the Japan Sea (corresponding to the UJSPW) based on hydrographic datasets obtained by the Argo floats and research vessels. The UJSPW has been defined as the water mass in the potential density (PD) range 27.31–27.34, along with its core density of 27.32, based on the hydrographic data obtained before 1985 (Sudo, 1986; Senjyu and Sudo, 1994). Although the UJSPW distributes in the entire Japan Sea area, the water mass north of the subarctic front is characterized by a relatively weak stratification (pycnostad) with high DO concentration (Senjyu and Sudo, 1993). Since this is a remnant of deep convection at the UJSPW formation, remarkable signals reflecting global warming are anticipated in its long-term variations.
The Argo float is a robotic instrument drifting with the currents at a mid-depth and measuring temperature and salinity between a depth and the sea surface via a periodic movement up and down. As shown in the next section, the Argo float data are available over the entire Japan Sea area, including the regions where frequent observations by research vessels are difficult to conduct, such as the North Korean territory and the south of the Peter the Great Bay off Vladivostok in winter, which are potentially important for JSPW formation. Although the Argo float datasets provide oceanographic conditions in a wide area of the Japan Sea, their temporal coverage spans only just over 20 years as the international Argo Project began in 2000. For this reason, Argo float data have been mainly utilized to detect the mid-depth circulation pattern in the Japan Sea (e.g., Park et al., 2004, 2010; Choi and Yoon, 2010; Kang et al., 2016). To compensate for the temporal coverage of the Argo data, we analyzed long-term (spanning the last five decades) ship-based hydrographic data obtained in the northeastern and southeastern Japan Sea. The analyses of the complementary datasets revealed changes in the mid-depth water mass ventilation in the wide areas of the Japan Sea that occurred in recent decades.
Data and Method
We analyzed the Advanced Automatic Quality Checked Argo data (AQC Argo data) version 1.2a offered by the Japan Marine Science and Technology Center (JAMSTEC), which provides temperature and salinity profiles with more advanced automatic checks than the real-time quality-controlled data from the Global Data Assembly Center. In total, 20610 temperature and salinity profiles were registered in the Japan Sea area for the period from October 2001 to December 2019. The typical sampling intervals in the profile were 10–30 m. The Argo floats in oceans worldwide typically park at a depth of 1000 m and measure temperature and salinity between 2000 m and the sea surface via temporal sinking every 10 days. However, most Argo floats in the Japan Sea have been set to stay at 700–800 m and measure temperature and salinity between the parking depth and the sea surface every 7–10 days. Therefore, the amount of data decreases to less than 40000 points below the depth of 700 m from more than 200000 points in the upper 200 m (Figure 2). However, data from the upper 700 m are sufficient for investigating the oceanic conditions in the UJSPW.
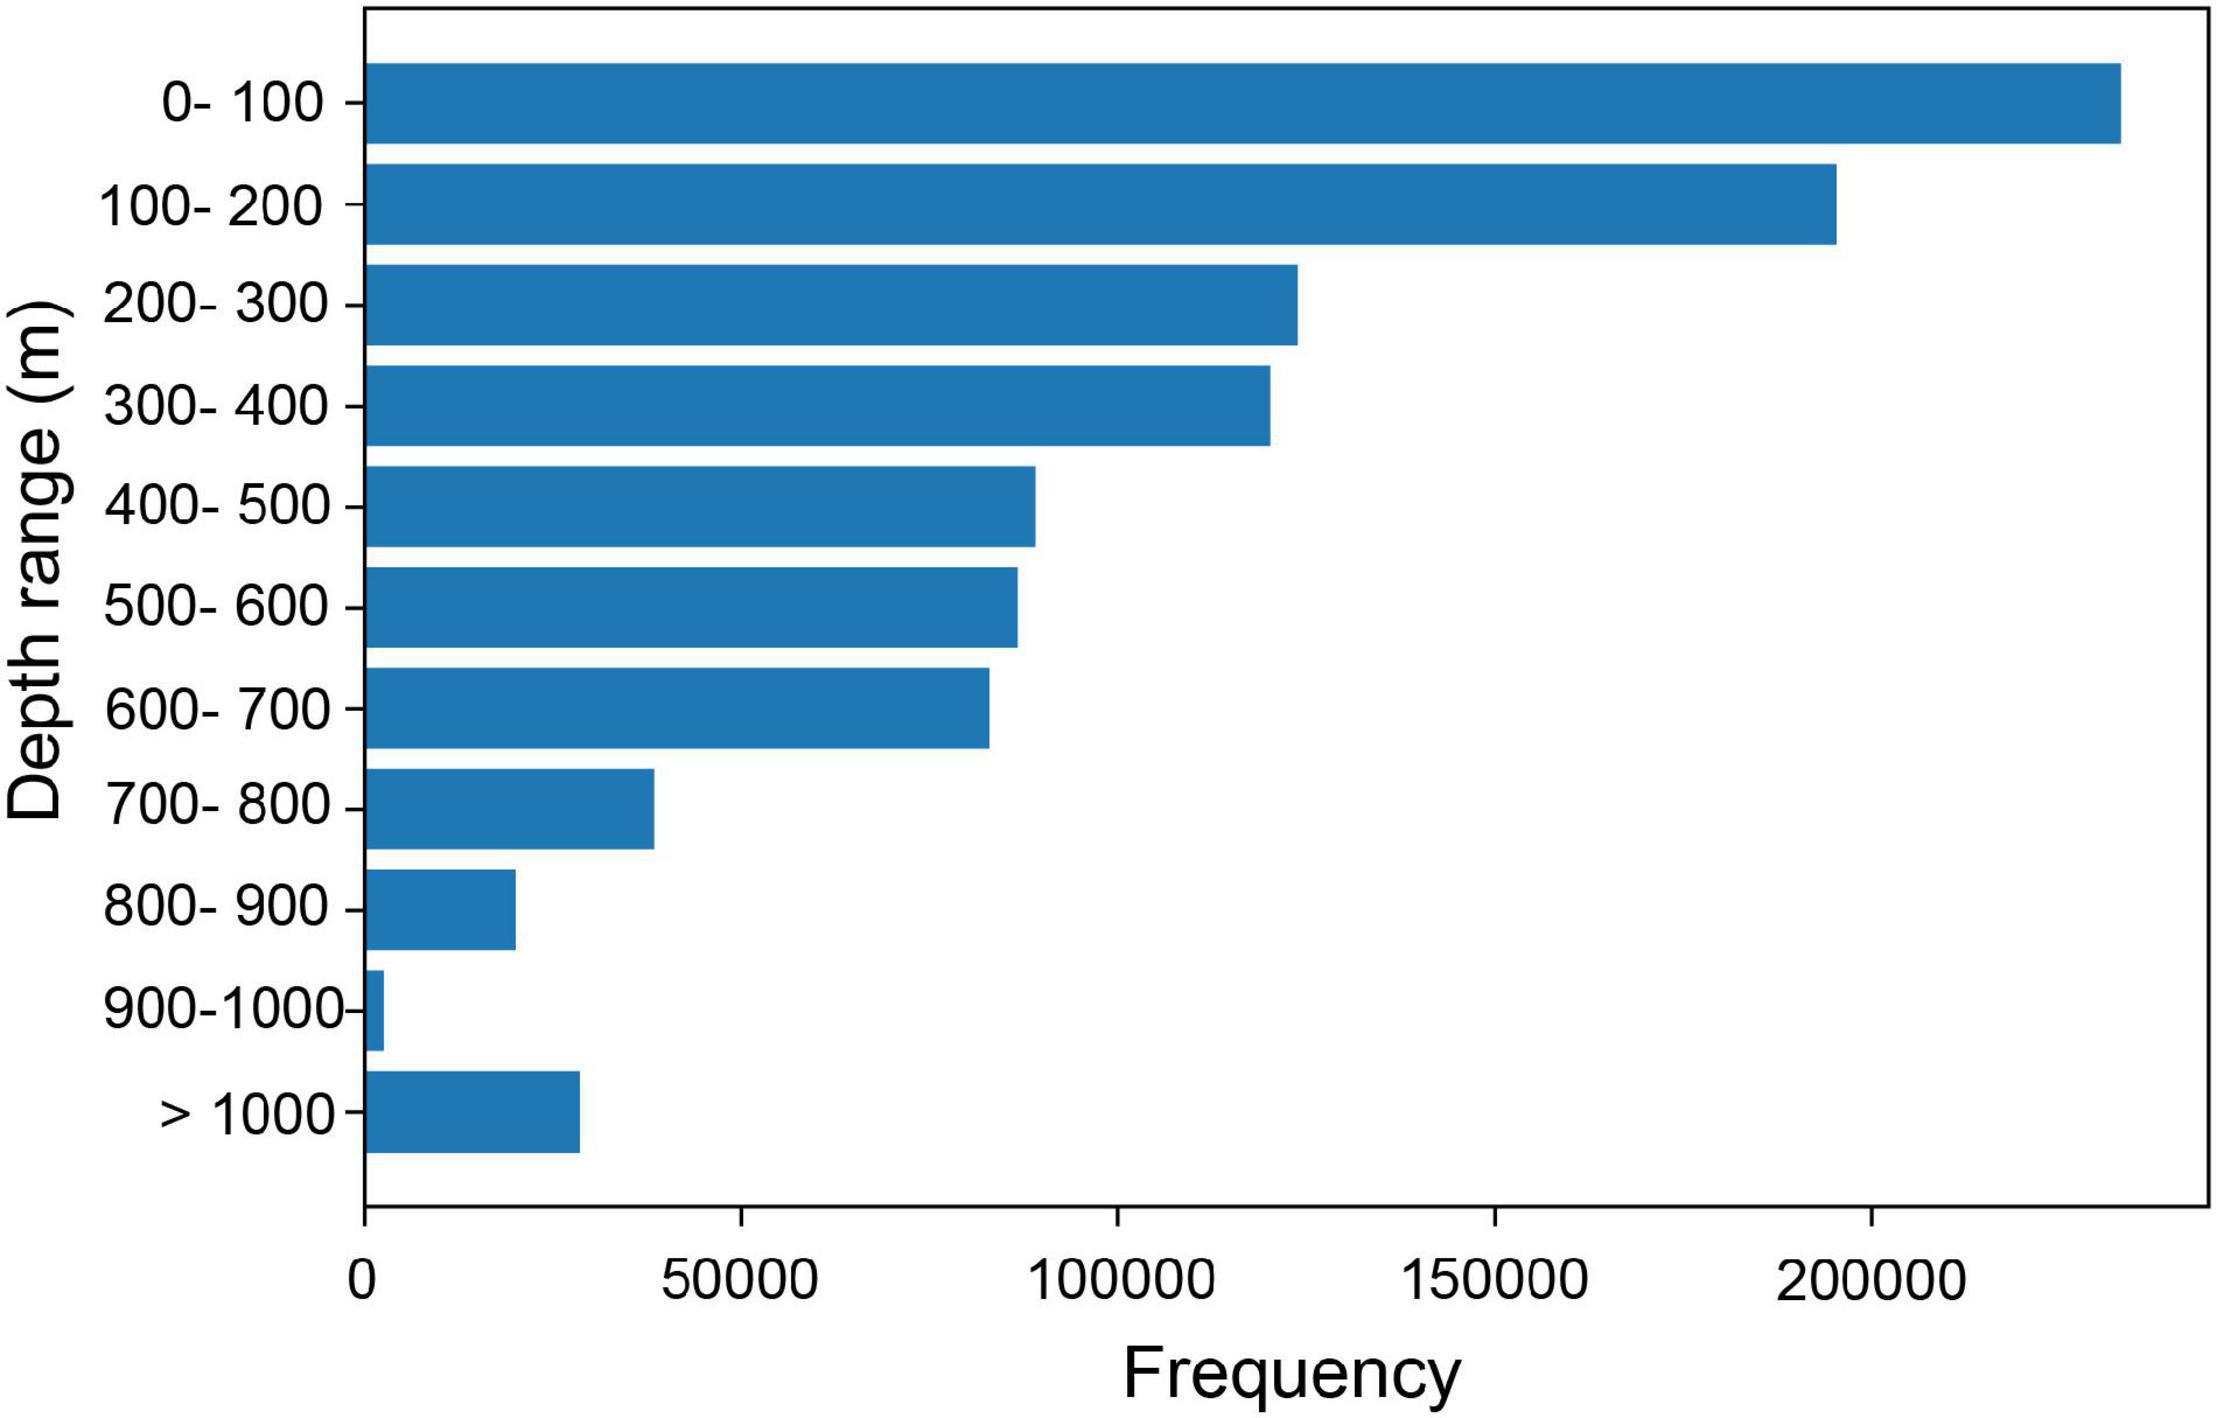
Figure 2. Frequency distribution of the AQC-Argo data in the Japan Sea with respect to the depth.
First, a screening of the profiles was performed with the criterion that the maximum observation depth was deeper than 500 m and the number of observation layers was greater than 10. Each profile was interpolated every 10 m using the Akima method (Akima, 1970) based on the data that all the quality flags of pressure, temperature, and salinity labeled by the JAMSTEC were normal. Nevertheless, abnormally low or high values were often found in salinity in the JSPW, although temperature measurements were generally within a reasonable range. It has been reported that the long-term variation in salinity at a depth range of 300–1000 m is small (+0.06 per 100 years) (Kwon et al., 2004). Indeed, ship-based salinity measurements at Stations H-4 and PM5 in the northeastern and southeastern Japan Sea (Figure 1), respectively, showed relatively stable values around 34.07 in the UJSPW since the 1970s, particularly after 1993 when the observations with a CTD (conductivity-temperature-depth profiler) were initiated (not shown). Therefore, we applied a simple correction to salinity in the AQC Argo data, assuming that the salinity in the UJSPW was almost constant during the analysis period. The difference between the observed salinity at the bottom layer of each profile (Sb) and the reference salinity (34.070) was evaluated, and the difference was added throughout the salinity profile, excluding the profiles of Sb in the range 34.065–34.075. The profiles showing extremely high or low salinity in the bottom layer (i.e., Sb > 34.10 or Sb < 34.02) were rejected.
Following this exclusion process, the number of profiles was reduced to 16115, although the data points were still distributed across the entire sea area (Figure 3T). However, if we see the distribution of the data points in each year, the profiles were concentrated in the southwestern part of the sea in the early stage of the analysis period (Figures 3A–G), because the Argo floats in the Japan Sea were mainly deployed by Korean organizations. They were spread annually and distributed throughout the entire Japan Sea area by 2008 (Figures 3H–S). Considering the data distribution in each year, as well as the bottom topography, we defined the four areas representing the western Japan Basin (JW), eastern Japan Basin (JE), Yamato Basin (YB), and Tsushima Basin (TB), shown in Figure 1, and then calculated the yearly mean profiles of potential temperature (PT) and PD in each area from the temperature and corrected salinity profiles.
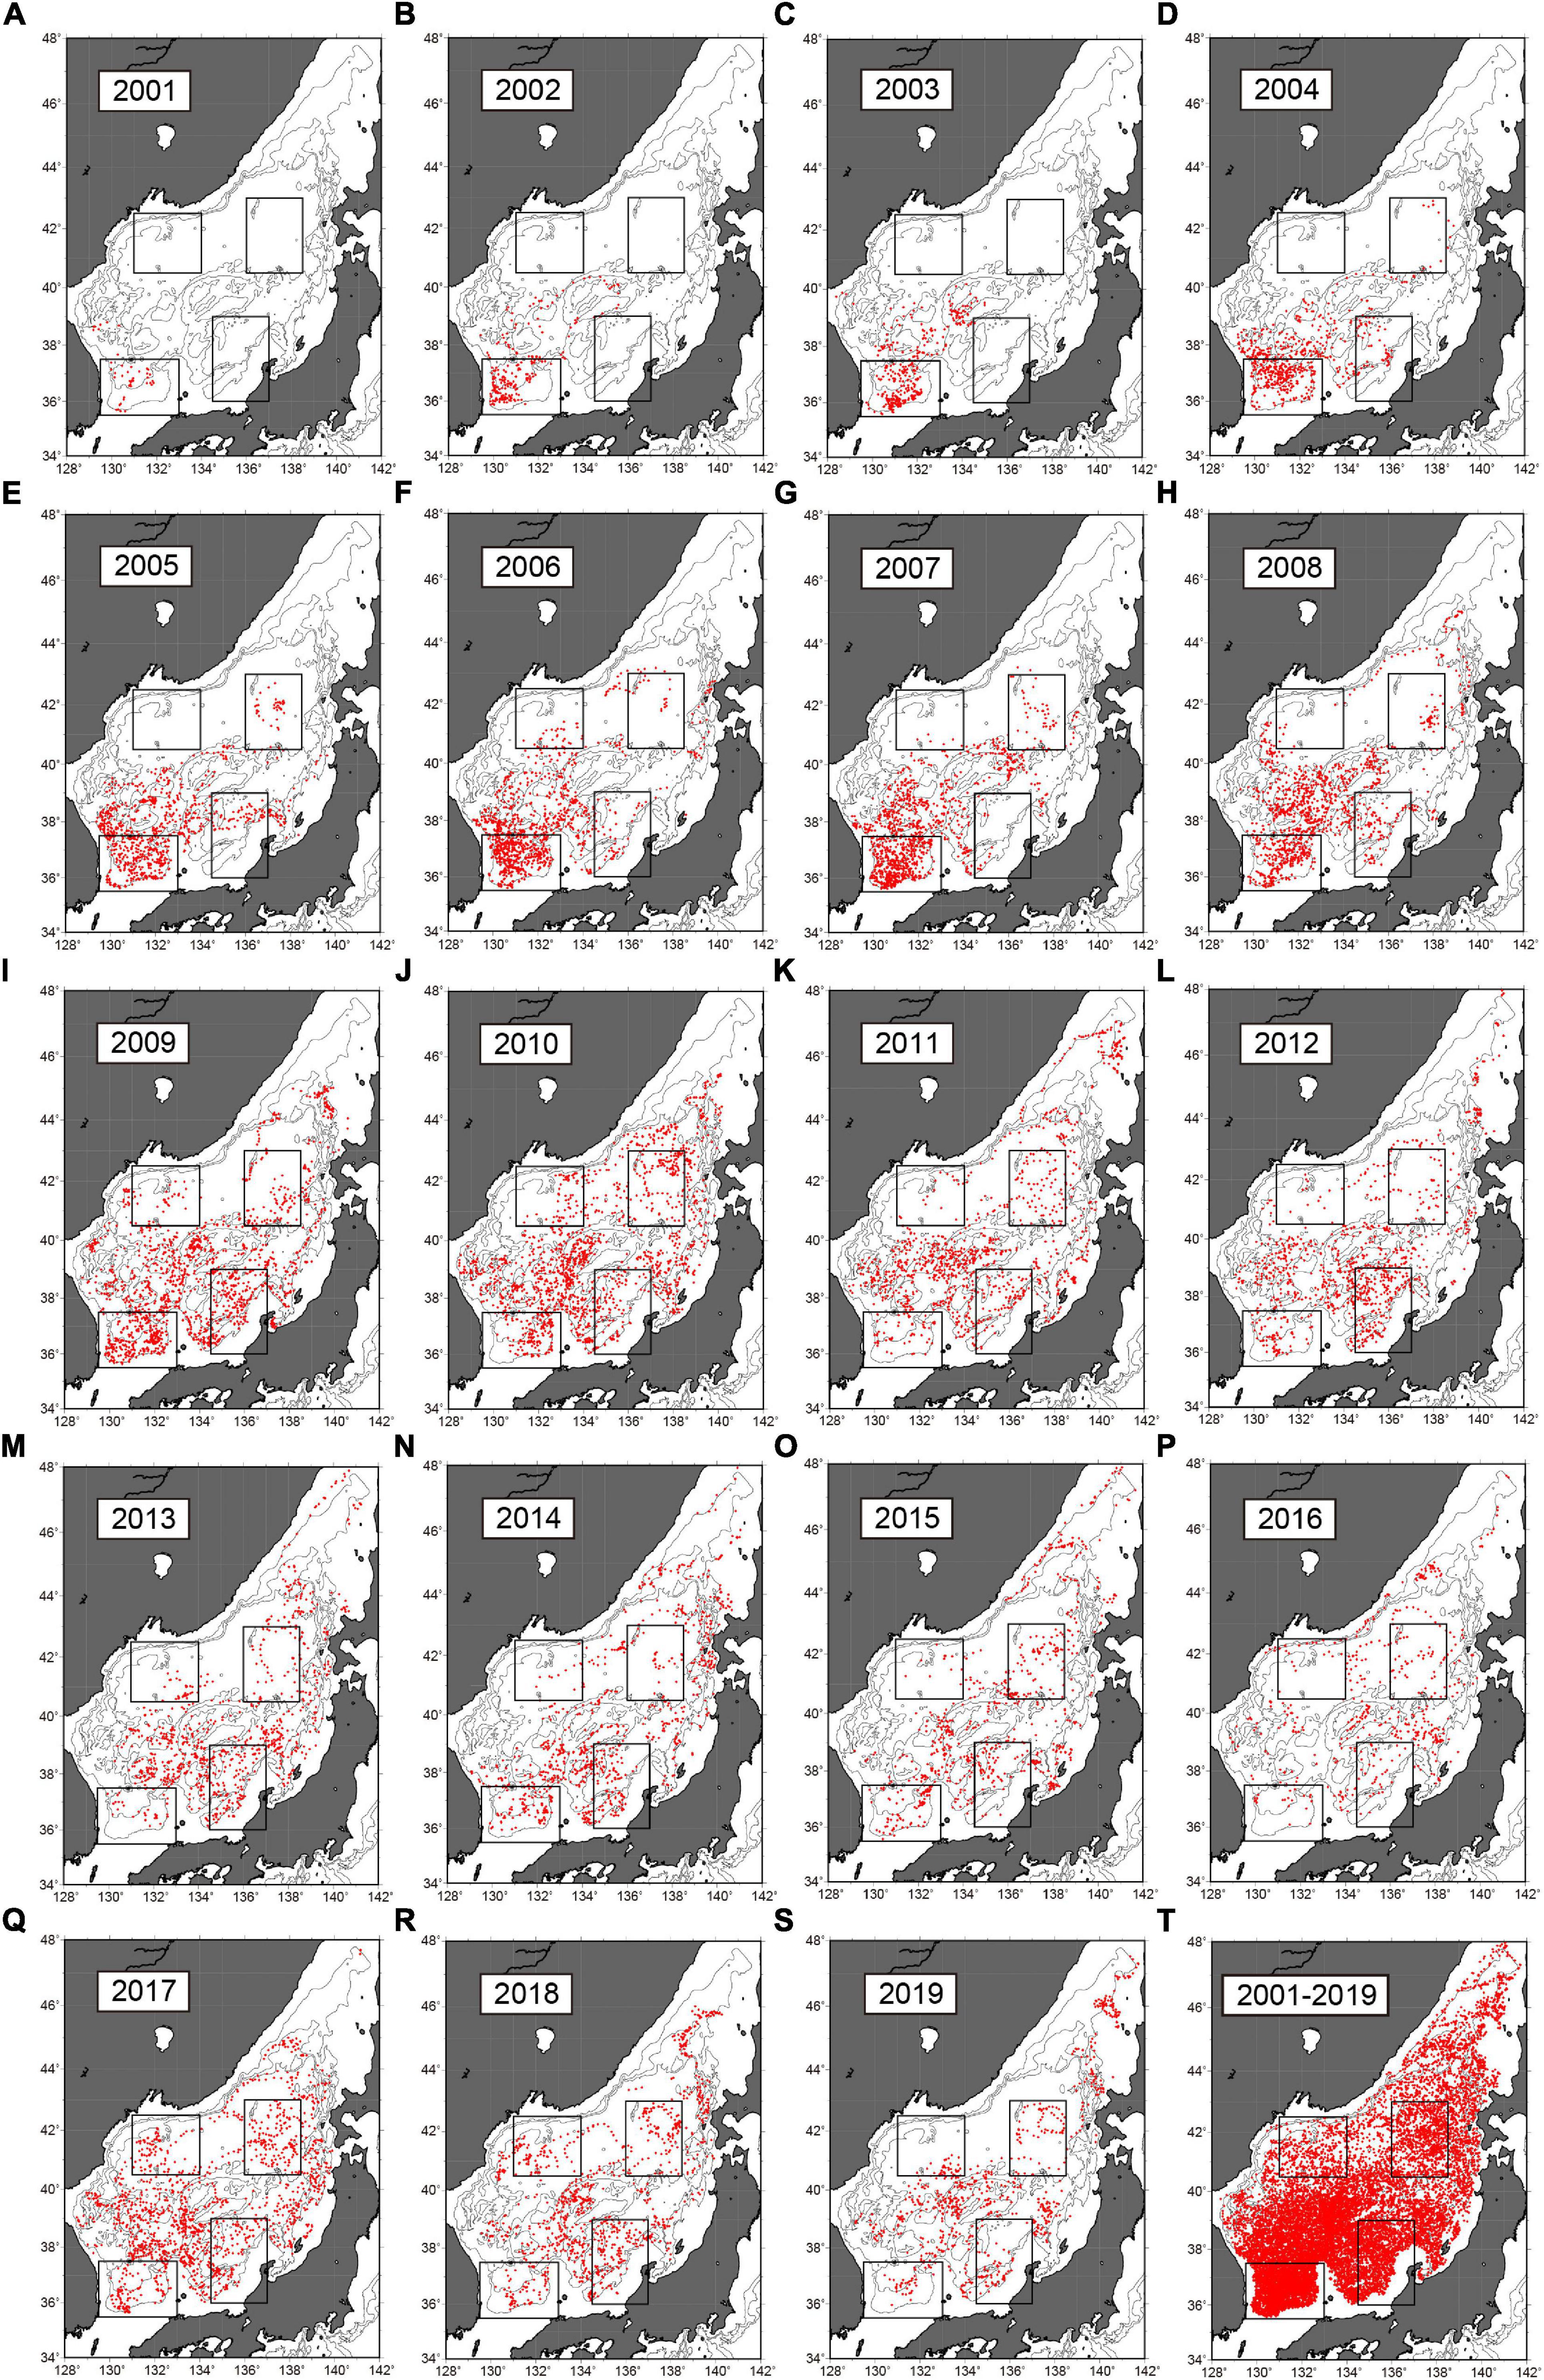
Figure 3. Distributions of Argo float data in each year: (A) 2001, (B) 2002, (C) 2003, (D) 2004, (E) 2005, (F) 2006, (G) 2007, (H) 2008, (I) 2009, (J) 2010, (K) 2011, (L) 2012, (M) 2013, (N) 2014, (O) 2015, (P) 2016, (Q) 2017, (R) 2018, and (S) 2019. Total distribution from 2001 through 2019 is shown in (T). Black squares indicate JW, JE, YB, and TB in Figure 1.
A bi-modal distribution in PT, warm, and cold modes was occasionally found throughout the year, particularly in JW. Close examinations revealed that the warm mode originated from the floats that had been trapped in warm eddies. These warm mode profiles typically showed PT > 1.0°C at 400 m. Therefore, we excluded the profiles showing PT > 1.0°C at 400 m from the calculation of the yearly mean PT and PD in each area, as our specific interesting is in the JSPW that is generally colder than 1.0°C. The yearly mean values and standard deviations for each area were calculated from at least three data points. The degree of spatiotemporal biases in the data distribution in each area can be evaluated by the standard deviations.
To investigate longer-period variations in the UJSPW, ship-based hydrographic data (temperature, salinity, and DO) during the period 1971–2019 at Stas. H-4 and PM5 in JE and YB, respectively, were analyzed (Figure 1). Sta. PM5 (37°42′N 134°42′E) is a most frequently observed hydrographic station in the Japan Sea by the Japan Meteorological Agency (JMA) since the 1960s; particularly, during the period 1972–2009, observations were conducted regularly four times a year mainly in February, April–May, July, and September, although the frequency has been reduced to once a year (mainly in November) since 2011. Hydrographic observations at Sta. H-4 (40°30′N 134°40′E) have been conducted at least once a year from 1972 to 2019 by the JMA, with exceptions in 1981, 1988, and 1991. The DO measurements at Sta. H-4 during the period 1986–1996 were not available except for 1987 and 1993–1995. The yearly mean and standard deviation of PT and PD were calculated for each station if there were plural data more than two in a year, otherwise only the mean value was calculated. In any cases, we applied the criterion that profiles of PT > 1.0°C at 400 m are excluded, as in the Argo data processing.
In addition, the sea surface temperature (SST) in JW was analyzed as an indicator of oceanic conditions in the JSPW formation region (Figure 1). The Centennial in situ Observation-Based Estimates of the Variability of SST and Marine Meteorological Variables, version 2 (COBE-SST2) provides global monthly mean SSTs with spatial resolutions of 1° × 1° in latitude and longitude (Hirahara et al., 2014). We downloaded the dataset during the period 1971–2020 from the website of the North-East Asian Regional Global Ocean Observing System (NEAR-GOOS), Regional Real Time Data Base by the JMA.
Results
The time series of Argo-based PT and PD at representative depths (400, 500, 600, 650, and 700 m) in each area are shown in Figures 4, 5, respectively. Although there were insufficient data in the early stage of the analysis period except for TB, as previously mentioned, the linear warming trend throughout the depths in all the evaluated areas is presented. Accordingly, PD shows decreasing trends in all the areas; however, most PD values were within the range of the UJSPW (27.31–27.34) defined by Senjyu and Sudo (1994) except for 400 m. We tested the statistical significance of the trends using the Student’s t-test. The bold and bold-underlined figures in Tables 1, 2 indicate statistical significance at the 95 and 99% confidence levels, respectively. The warming and lightening rates in PT and PD were significant at the 99% confidence level throughout the depths in YB and TB. JE also showed significant warming rates throughout the depths except for 400 m, although the lightening rate in PD at 400 m was significant at the 99% confidence level. In JW, statistically significant warming and lightening rates were found in the depth ranges 600–650 m and 400–600 m, respectively. The changing rates in each region were also estimated based on the vertically averaged PT and PD for a depth range 400–650 m. All the regions showed the positive and negative rates in PT and PD, respectively. The changing rates in PD were statistically significant in all the regions, although significant PT rates were found in YB and TB in the southern Japan Sea.
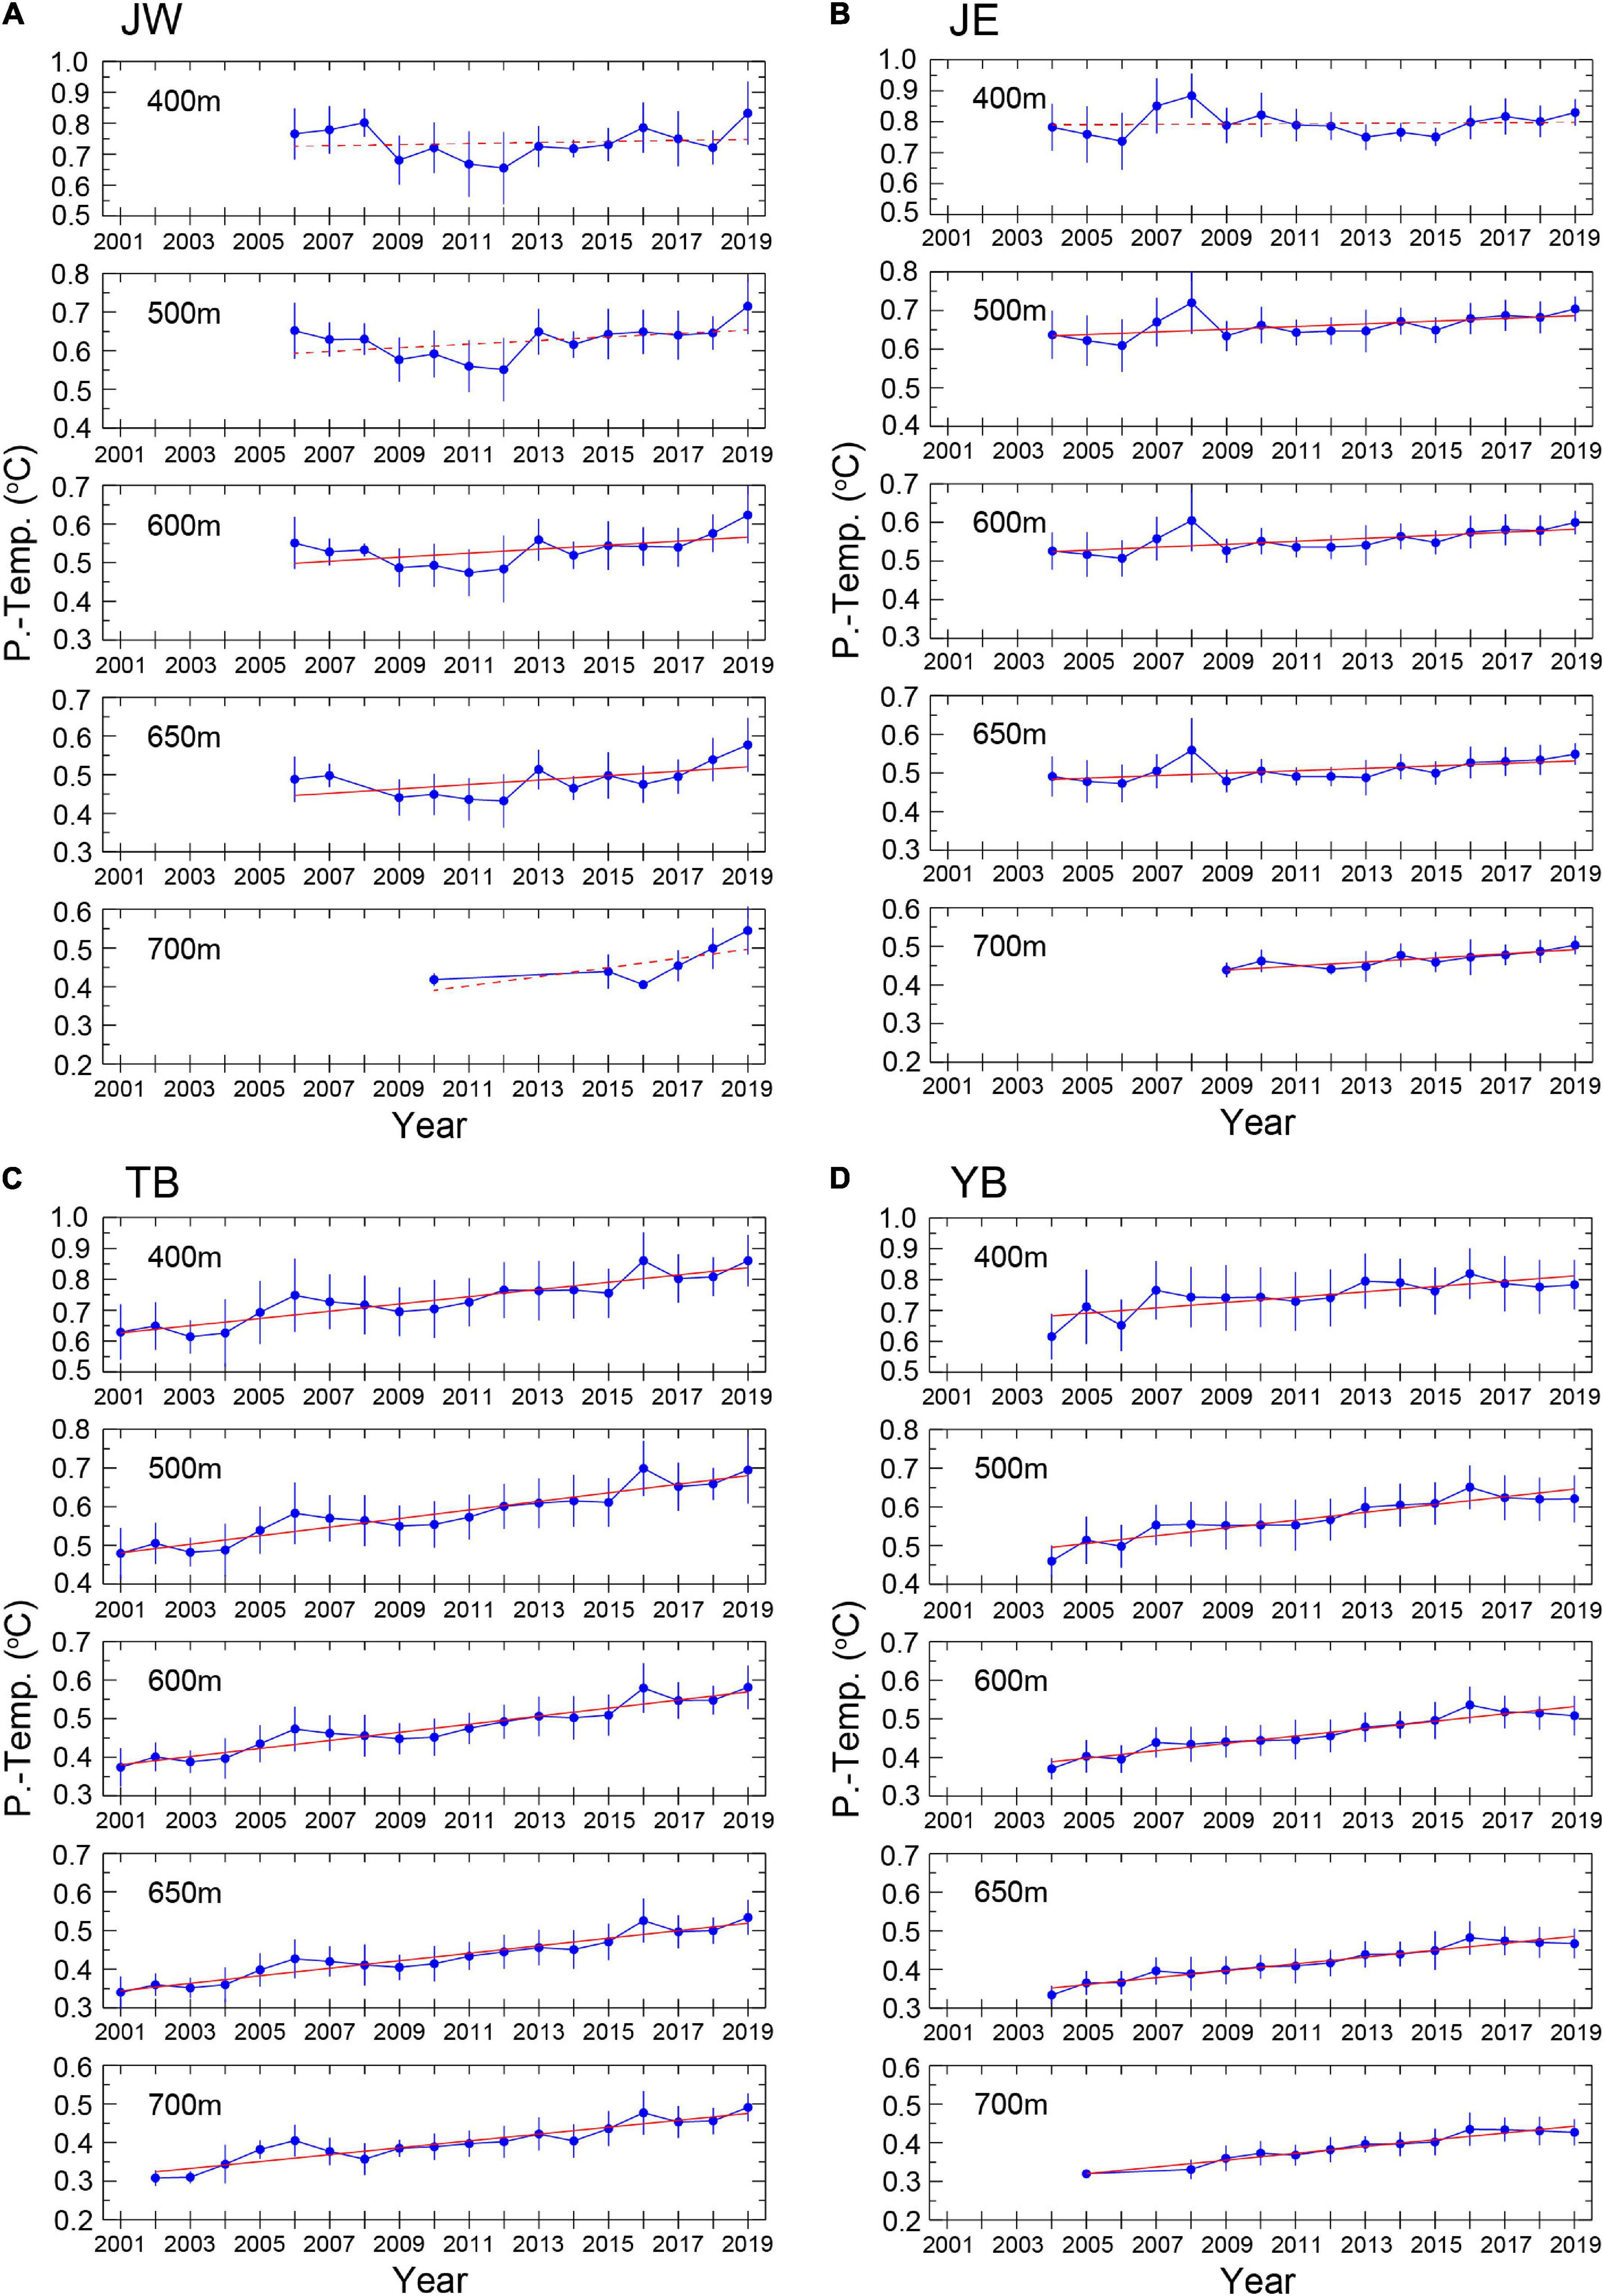
Figure 4. Time series of the Argo-based yearly mean PT at 400, 500, 600, 650, and 700 m in (A) JW, (B) JE, (C) TB, and (D) YB. Vertical bars at each data point indicate one standard deviation. Red lines depict the linear trend calculated by least square method. Statistically insignificant trends at 95% confidence level are shown by dashed lines.
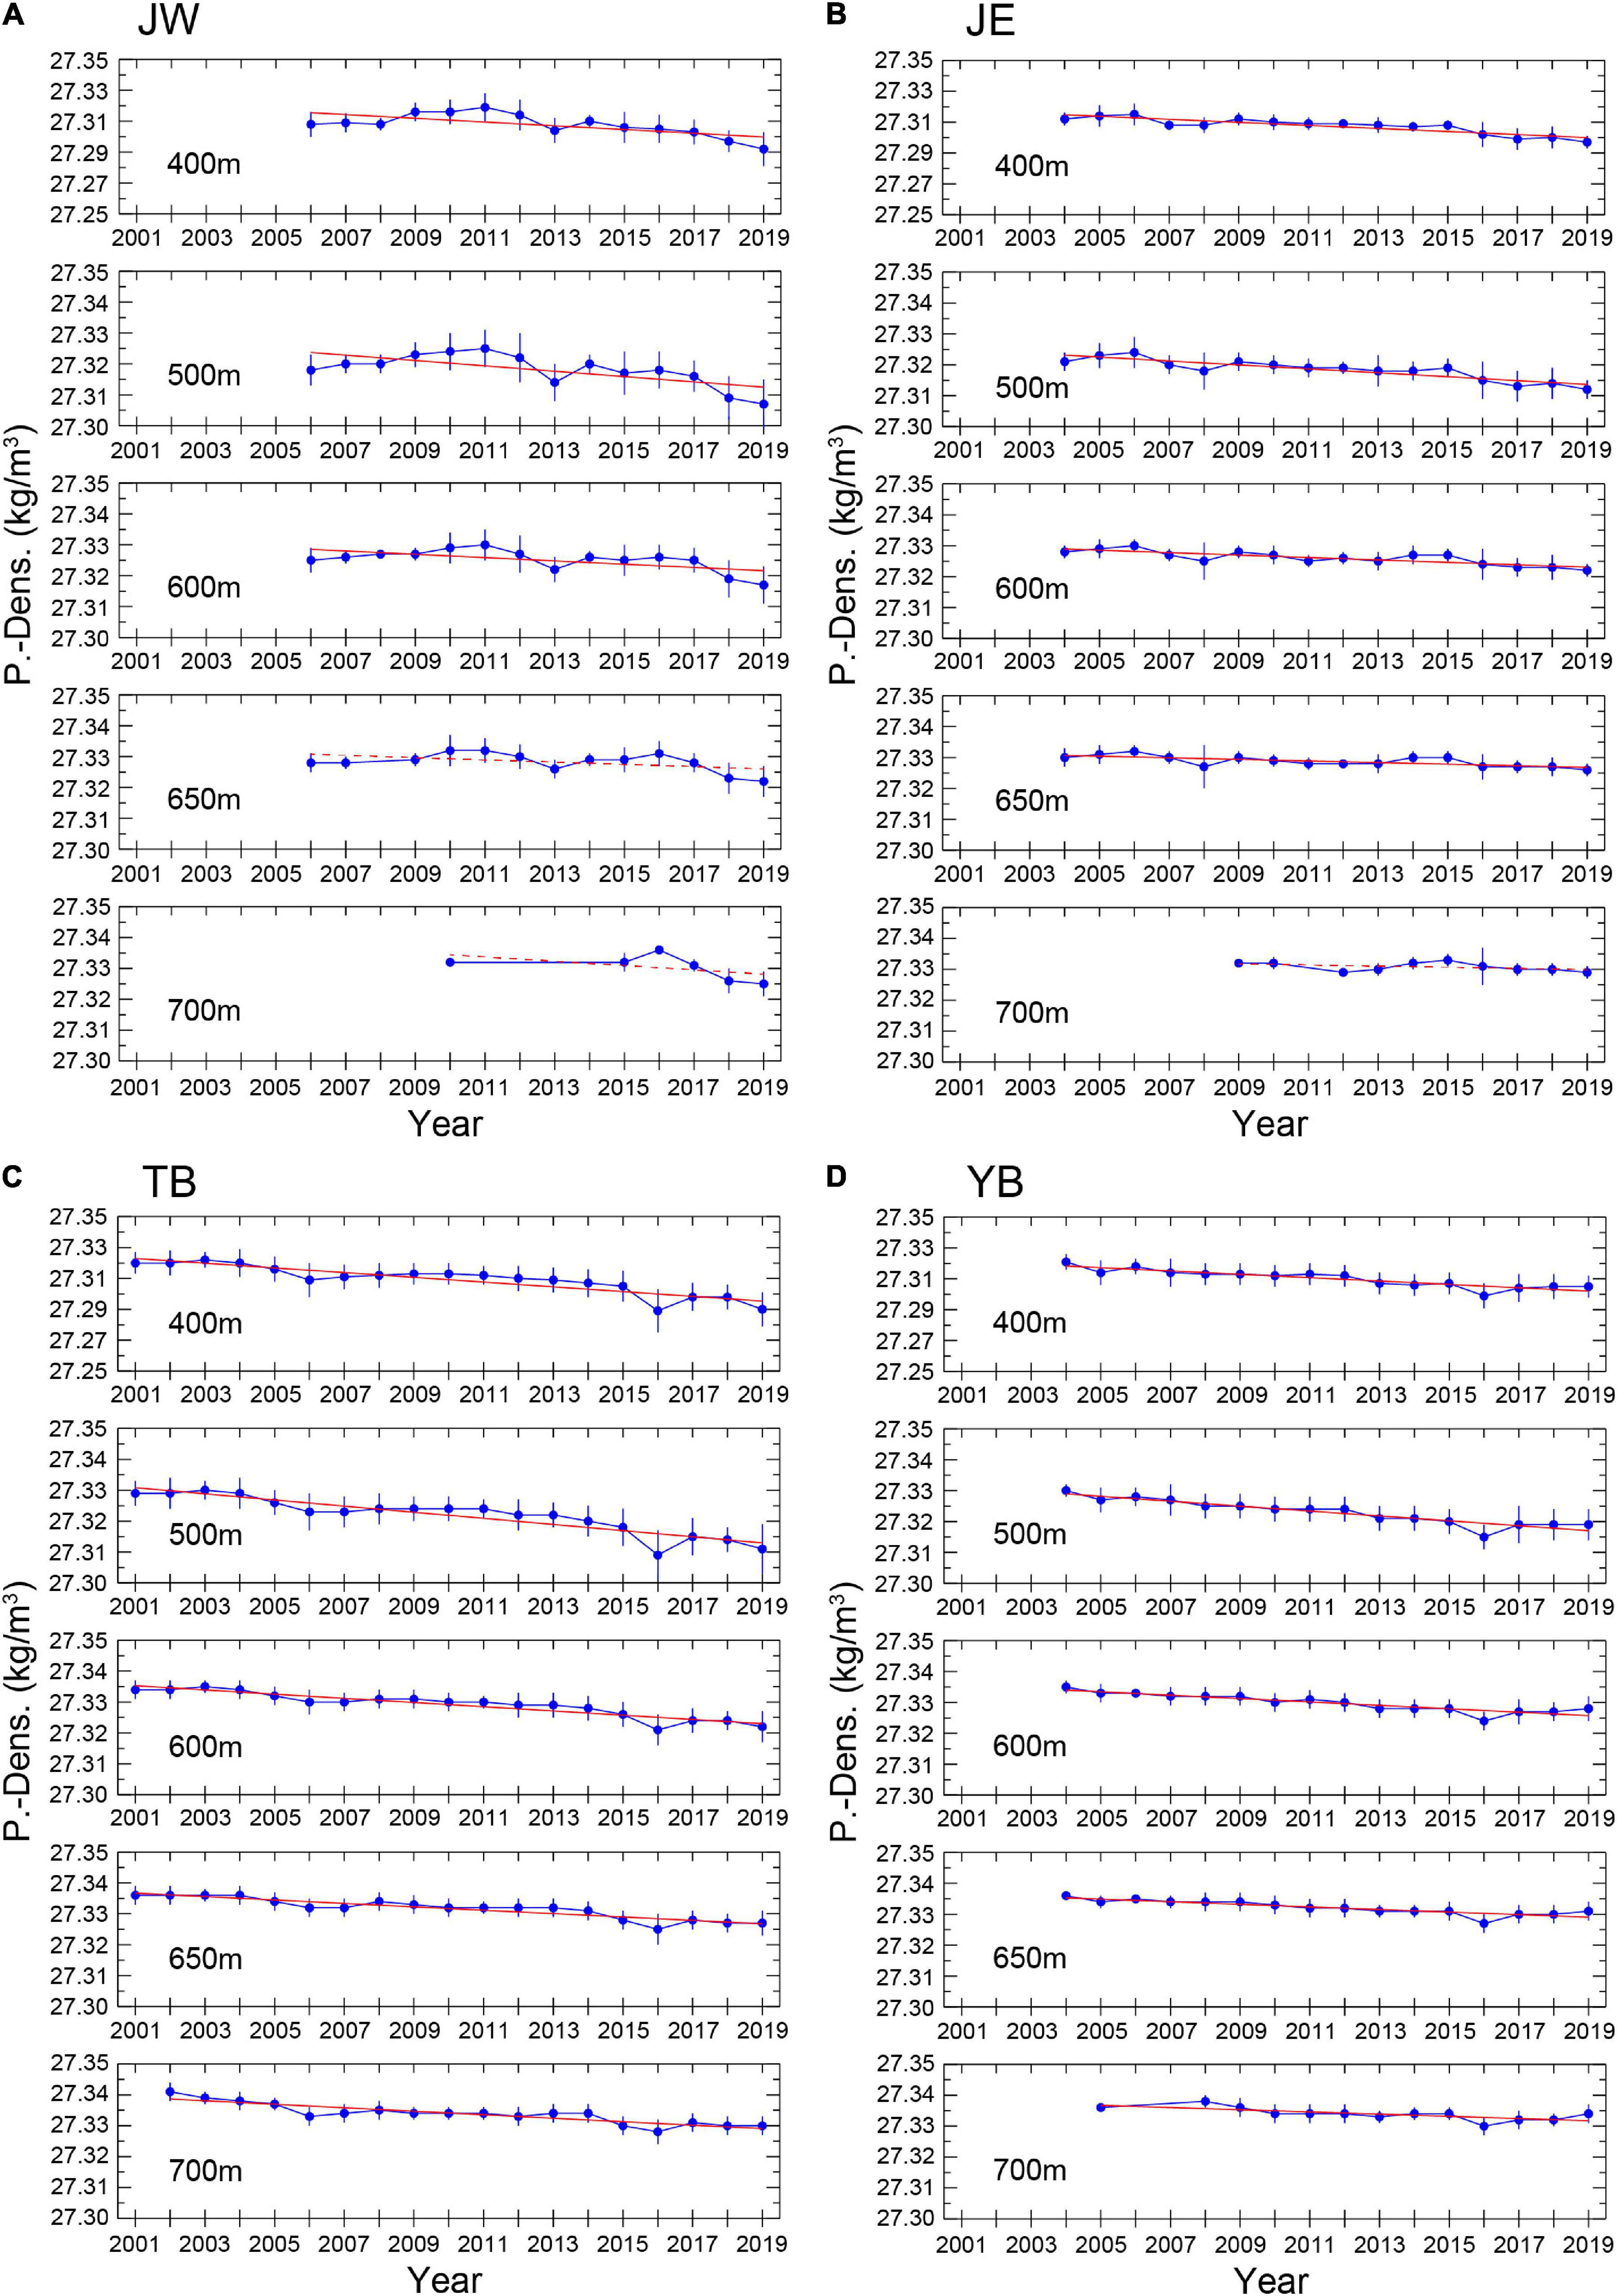
Figure 5. Time series of the Argo-based yearly mean PD at 400, 500, 600, 650, and 700 m in (A) JW, (B) JE, (C) TB, and (D) YB. Vertical bars at each data point indicate one standard deviation. Red lines depict the linear trend calculated by least square method. Statistically insignificant trends at 95% confidence level are shown by dashed lines.
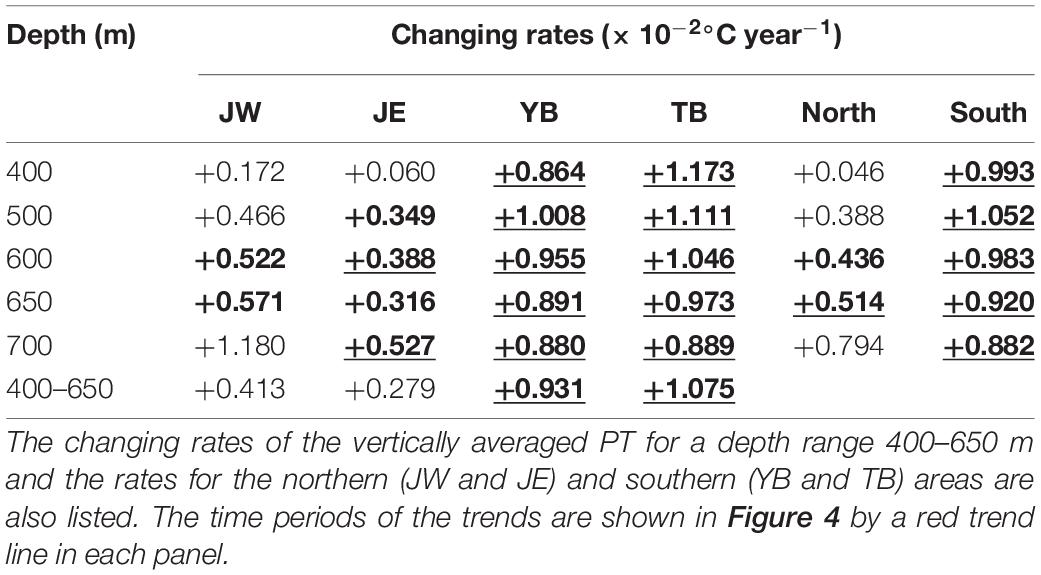
Table 1. Changing PT rates in JW, JE, YB, and TB based on the Argo data. Bold and bold-underlined figures indicate statistically significant values at 95 and 99% confidence levels, respectively.
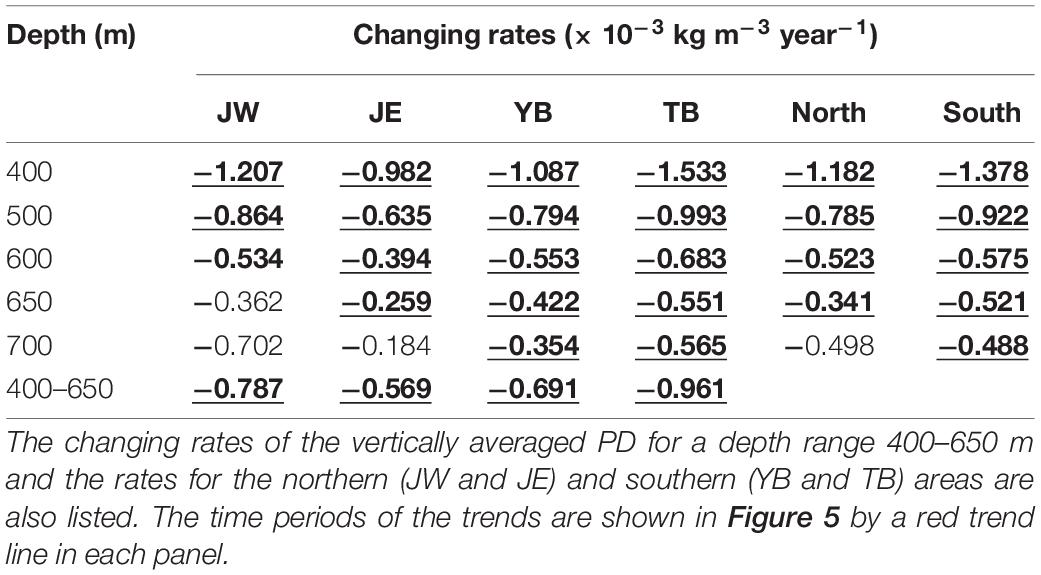
Table 2. Changing PD rates in JW, JE, YB, and TB based on the Argo data. Bold and bold-underlined figures indicate statistically significant data at 95 and 99% confidence levels, respectively.
It is noteworthy that the warming rates in the southern areas (YB and TB) were generally greater than those in the northern areas (JW and JE). To highlight the contrast, warming rates were evaluated for the northern and southern areas separately (Table 1). Although statistically significant rates were only found at 600 and 650 m in the northern area, the corresponding warming rates in the southern area were approximately two times greater than those in the northern area. In addition, the warming rates in the southern area were statistically significant at the 99% confidence level throughout the depths. Correspondingly, the decreasing rates in PD in the southern area were generally greater than those in the northern area, and the rates were statistically significant in all the cases with an exception at 700 m in the northern area (Table 2).
To see the transition of the trends over several decades, time series of the yearly mean PT and PD at 400, 500, 600, and 700 m at Stas. H-4 and PM5 are shown in Figures 6, 7, respectively, along with the Argo-based yearly mean values in JE and YB. Note that the data points in 2012, 2013, and 2019 were excluded from the time series because of the data processing criterion. Although PT and PD at each layer fluctuated with an amplitude, particularly at Sta. PM5 in the Yamato Basin where the mesoscale eddies are active (Lee et al., 2000; Morimoto et al., 2000; Watanabe et al., 2009; Yabe et al., 2021), the overall trends of the ship-based PT and PD coincide well with those of the Argo-based yearly mean values in both areas.
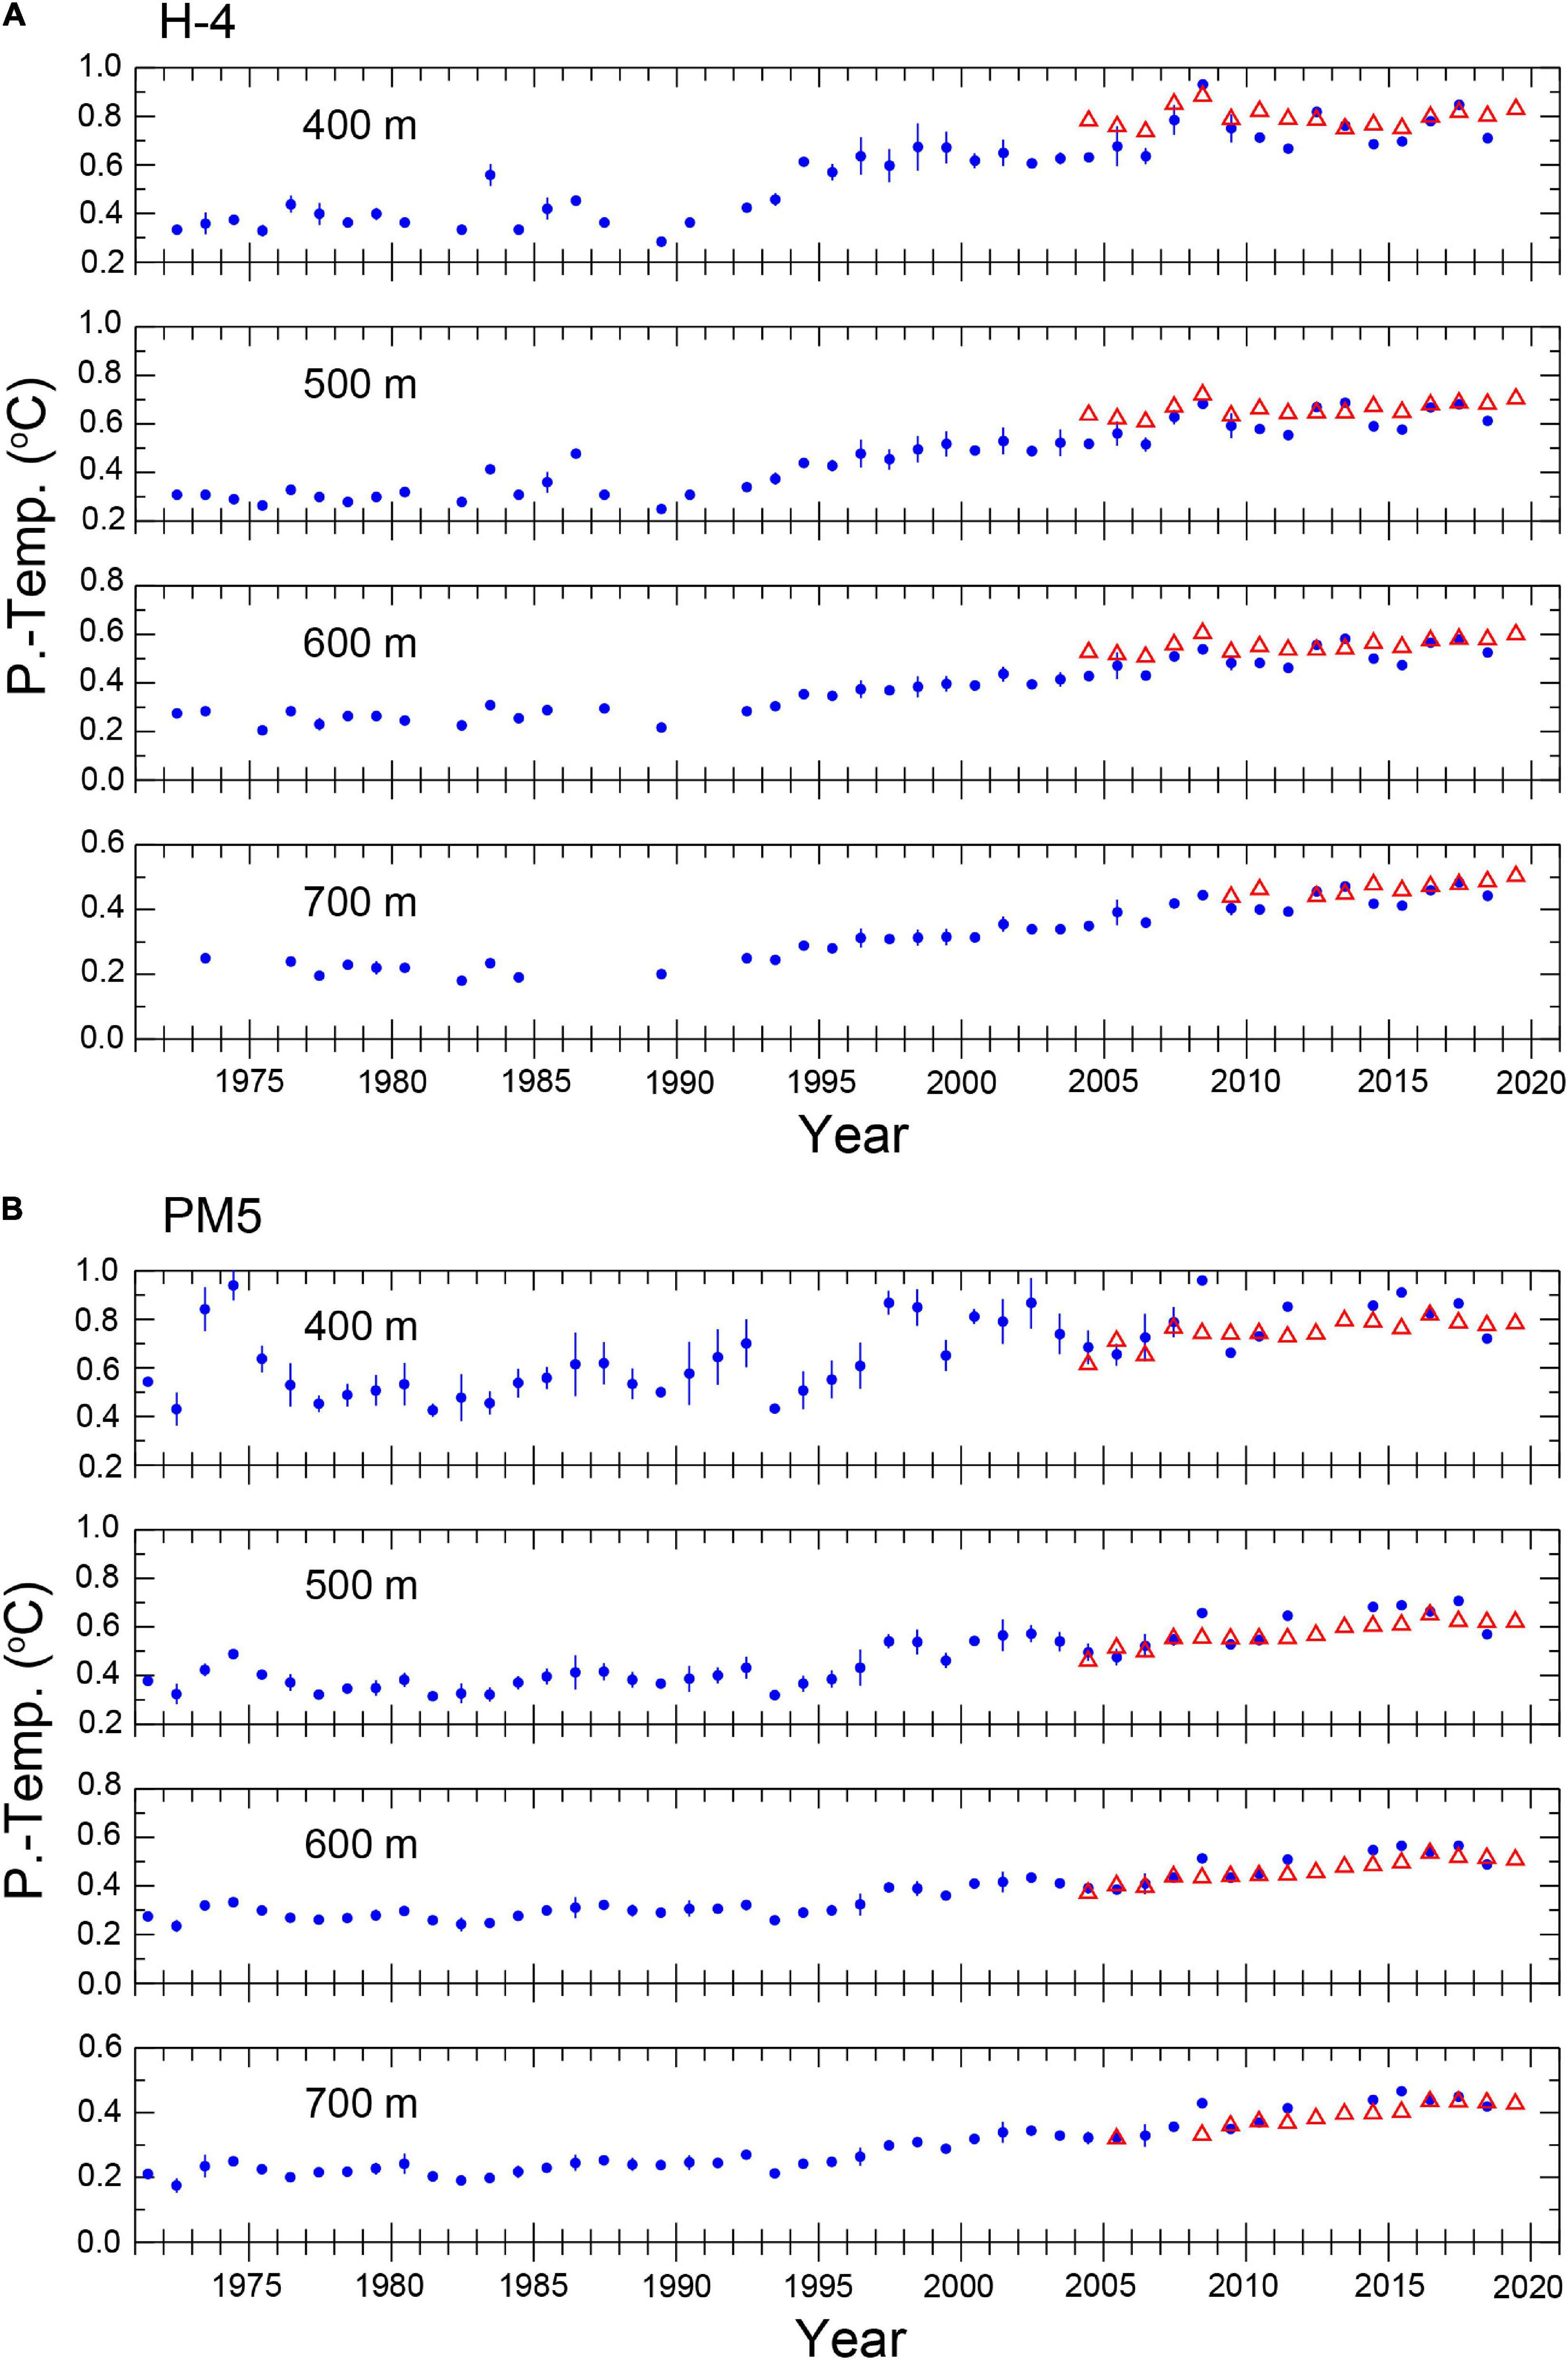
Figure 6. Time series of the ship-based yearly mean PT at 400, 500, 600, and 700 m at (A) Stas. H-4 and (B) PM5. Vertical bars at each data point indicate one standard deviation. Red triangles in (A,B) indicate the Argo-based yearly mean PT in JE and YB, respectively.
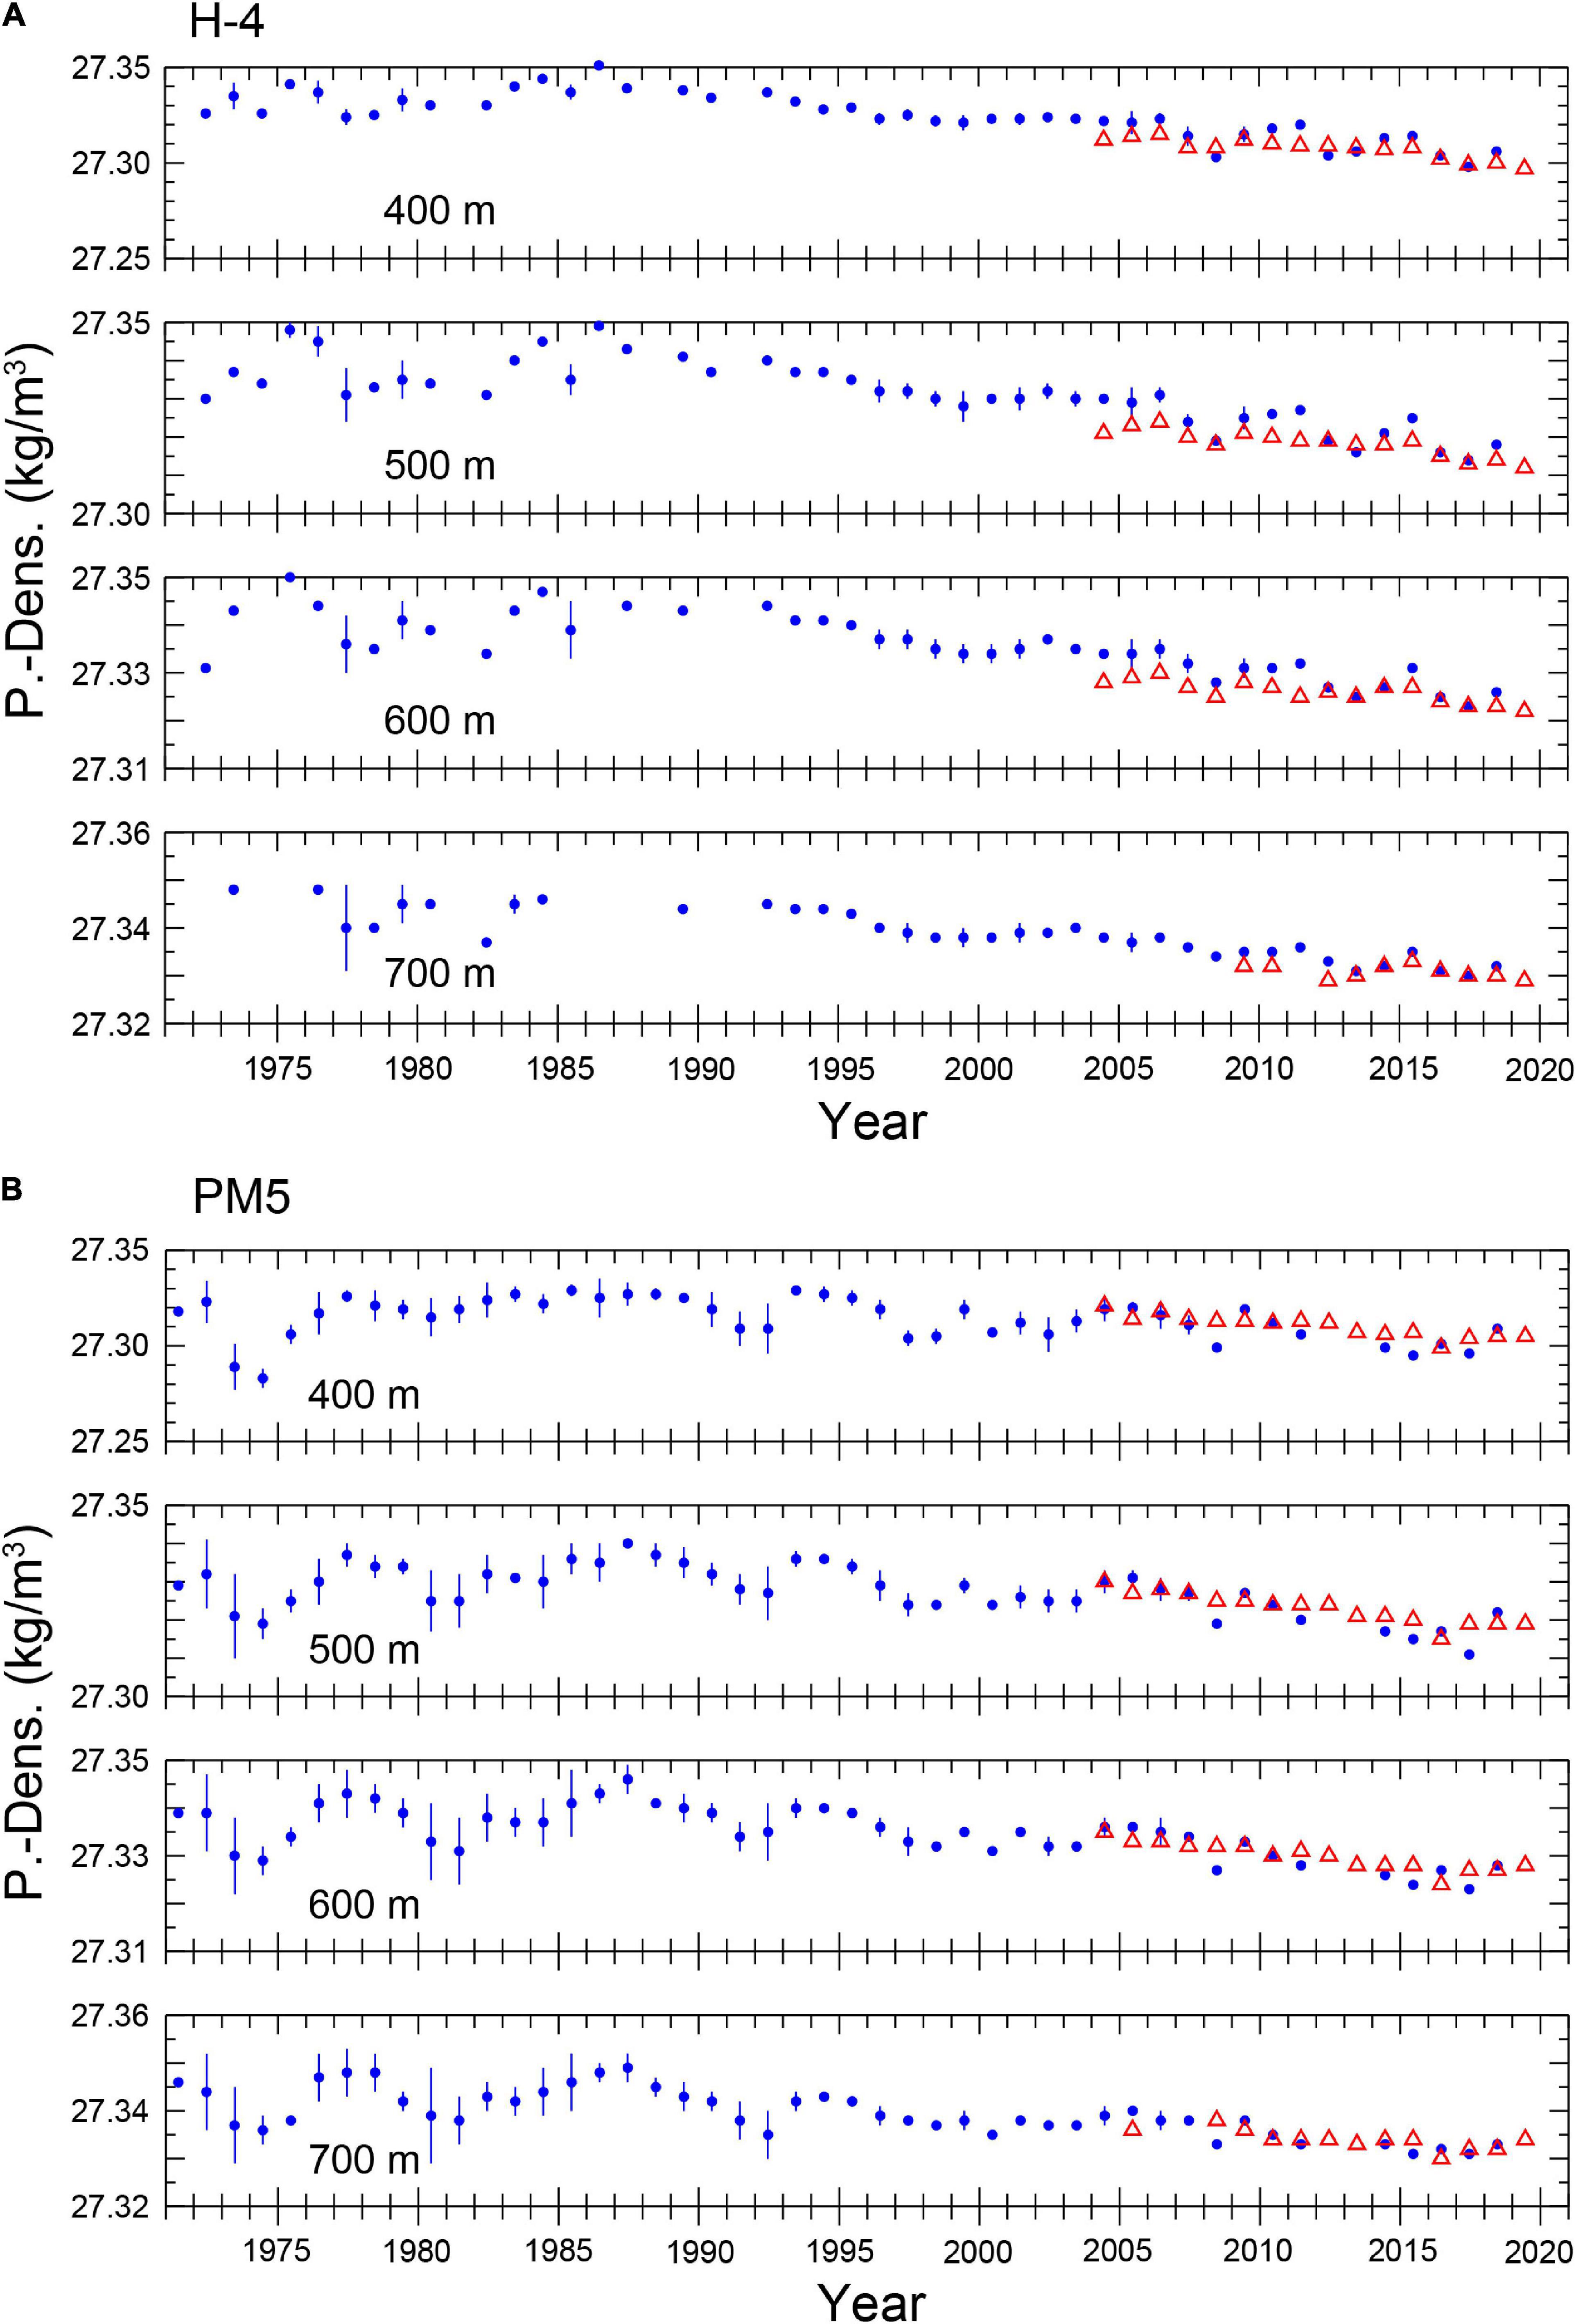
Figure 7. Time series of the ship-based yearly mean PD at 400, 500, 600, and 700 m at (A) Stas. H-4 and (B) PM5. Vertical bars at each data point indicate one standard deviation. Red triangles in (A,B) indicate the Argo-based yearly mean PD in JE and YB, respectively.
It is worth noting that warming appeared to accelerate from the 1990s throughout the depths at both stations. Therefore, the transition of changing rates in PT and PD were evaluated using a 15-year sliding window based on the yearly mean values. The time series of warming rate for a period of 15-year long showed a weak or no warming trend before 1986 at both stations (Figure 8A). By contrast, an acceleration of warming occurred during the period from the late 1980s to the mid-1990s throughout the depths, although a peak of the warming rate at Sta. PM5 lagged by 2–5 years to that at Sta. H-4, suggesting a limited water mass exchange between the Japan and Yamato Basins (Senjyu et al., 2005a,2013; Senjyu and Aramaki, 2017). After the maximum warming rate, the period of nearly constant warming rate continued until 2007, except for the period 2002–2006 at 400 and 500 m at Sta. PM5. As the positive rate continued over more than 15 years with a statistical significance, the warming of UJSPW from the late 1980s is robust regardless of the selection of sliding window width. The warming rate at Sta. PM5 was slightly accelerated again from 2008, particularly below the depth of 500 m. As a result, the warming rates at Sta. PM5 were greater than those at Sta. H-4, consistent with the recent Argo floats observations (Table 1). The variation of PD changing rates basically follow that in PT; positive or no changing rates in the 1980s, an acceleration of lightening from the late 1980s to the mid-1990s followed by a slight deceleration of lightening by 1998, and the second acceleration of lightening from 2006 to 2011 (Figure 8B).
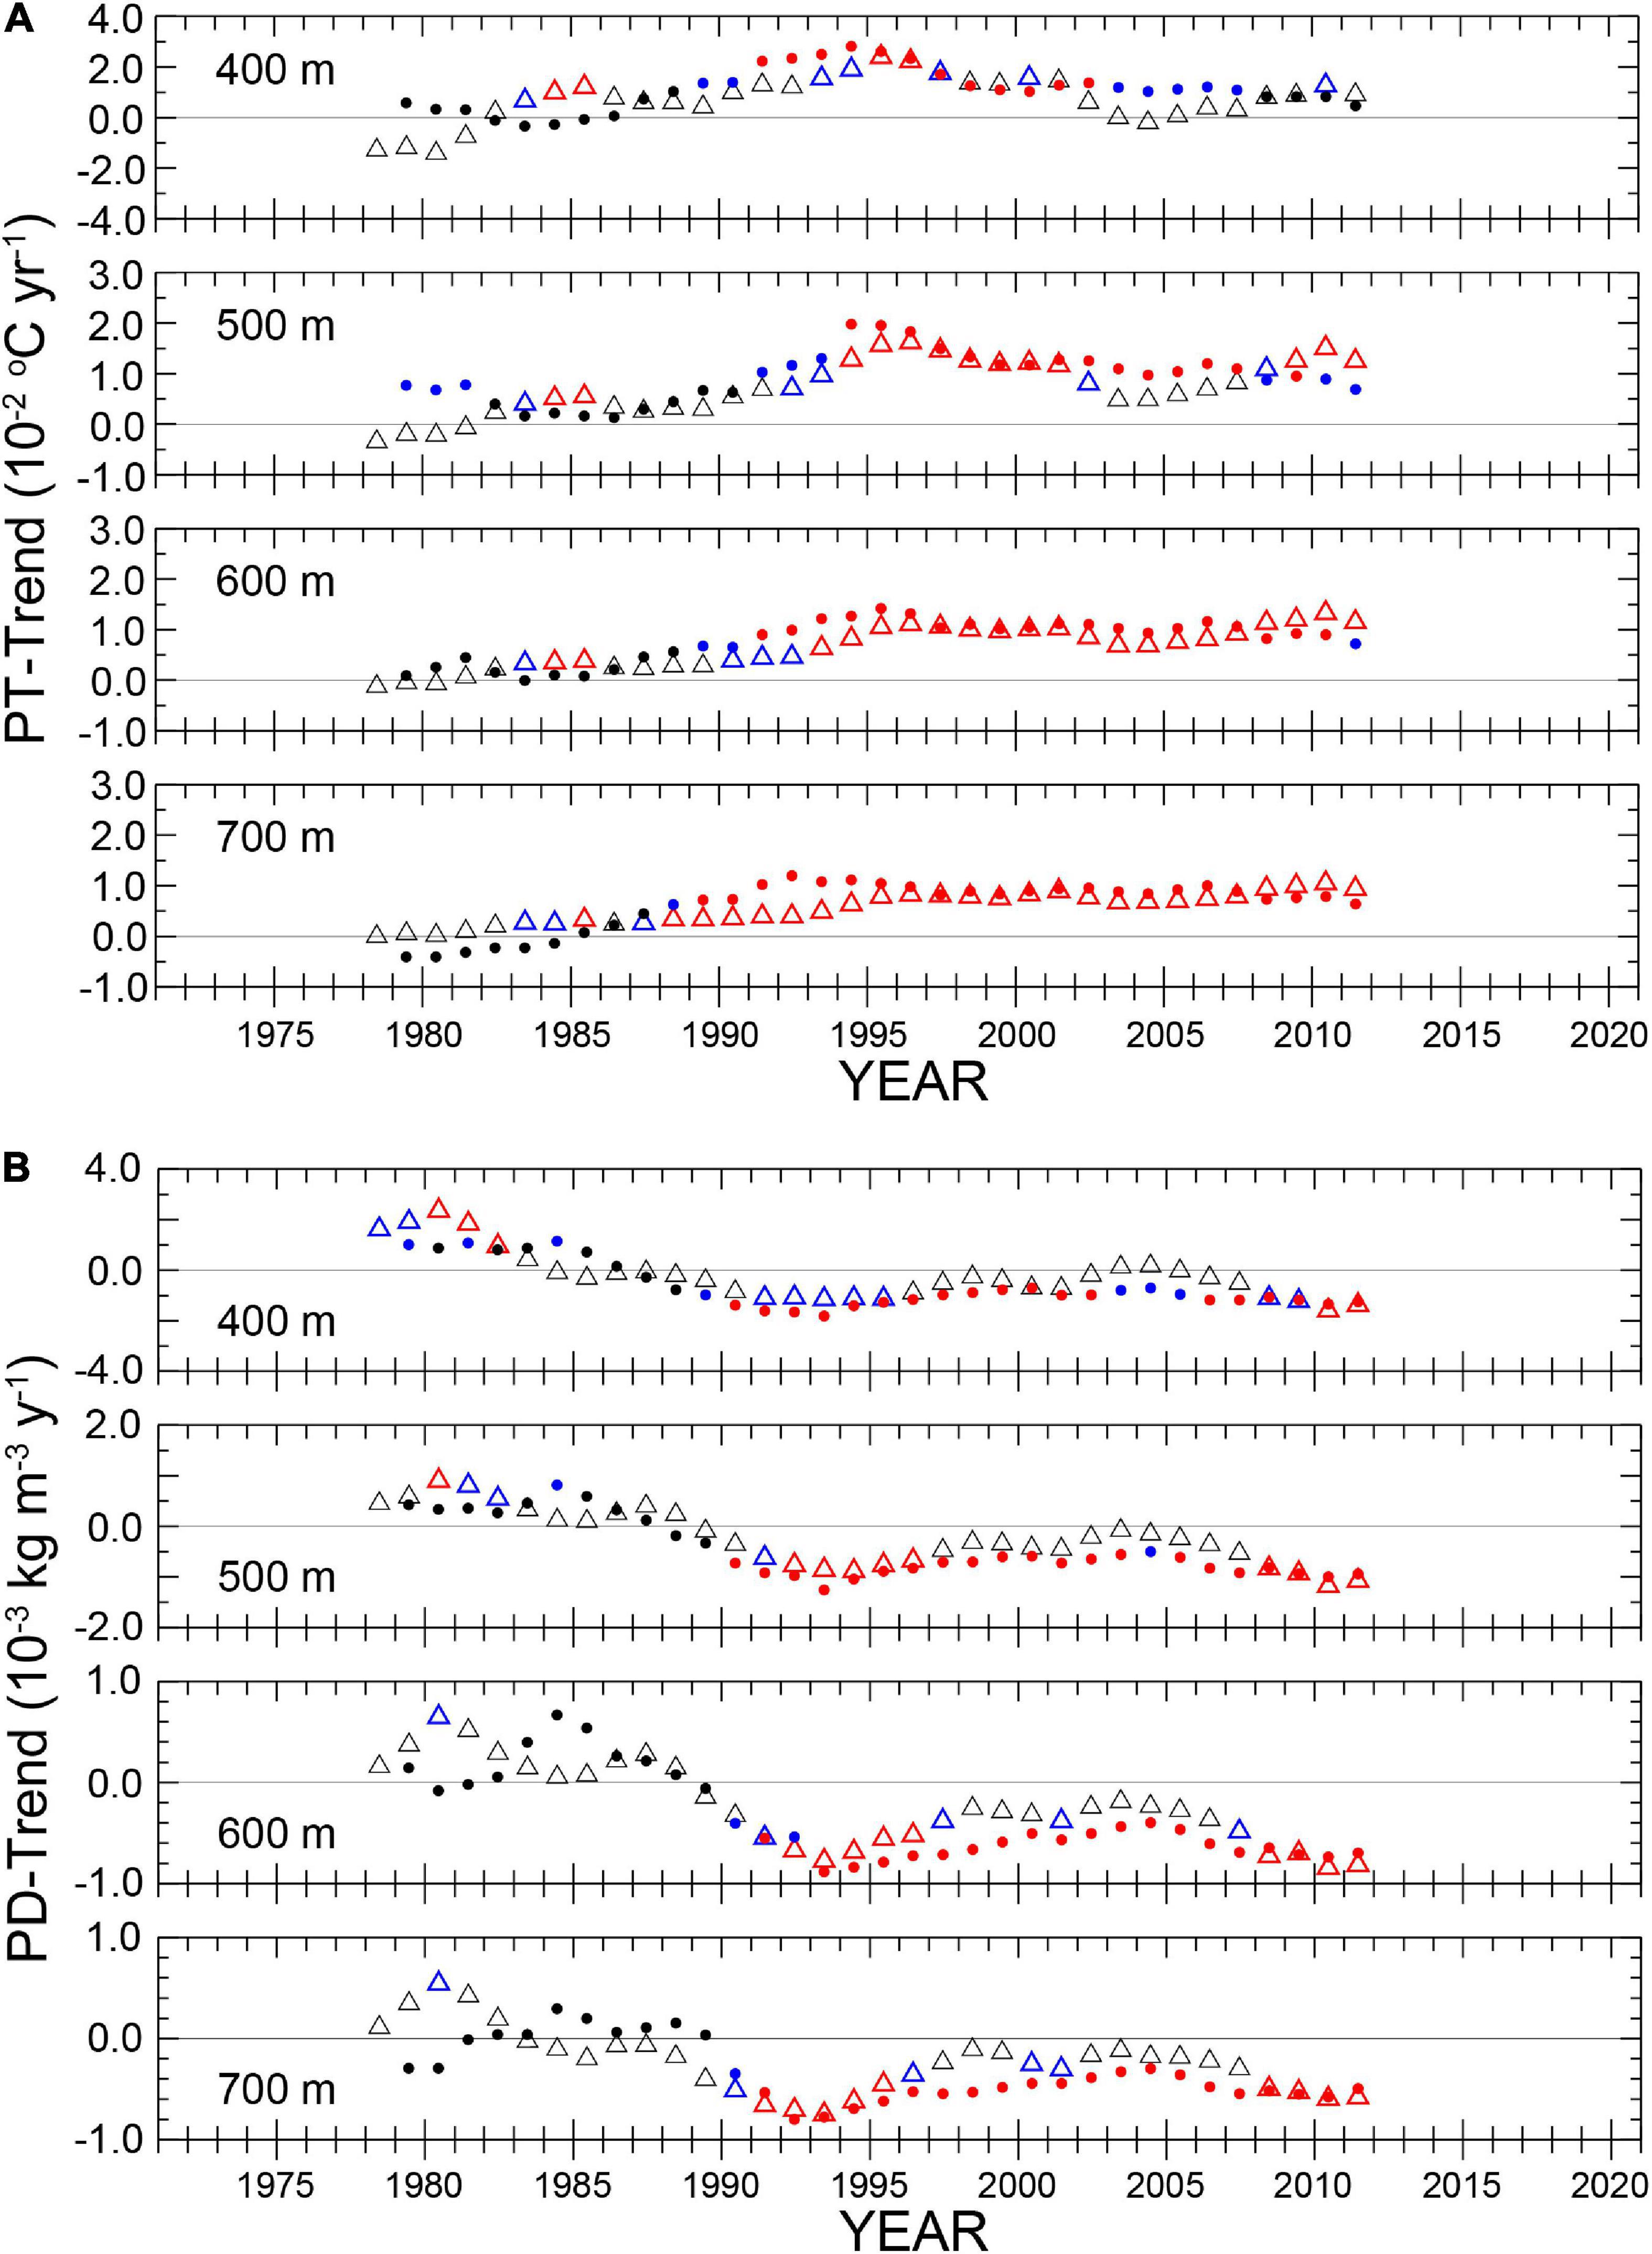
Figure 8. Time series of the changing rates in PT (A) and PD (B) evaluated by a 15-year sliding window at 400, 500, 600, and 700 m at Stas. H-4 (solid circles) and PM5 (triangles). Statistically significant values at the 95 and 99% confidence levels are indicated by blue and red colors, respectively.
The temporal variations in stratification are found in the decadal-mean PT and PD profiles at both stations (Figure 9). The PT and PD profiles for the 1970 and 1980s were almost coincided each other, whereas those after the 1990s exhibited a gradual warming and lightening throughout the depths. It is noticeable that the PT profiles at Sta. PM 5 show a slight acceleration of warming at each layer, whereas PT below 500 m at Sta. H-4 seems to increase at a constant rate during the period from the 1990 to the 2010s.
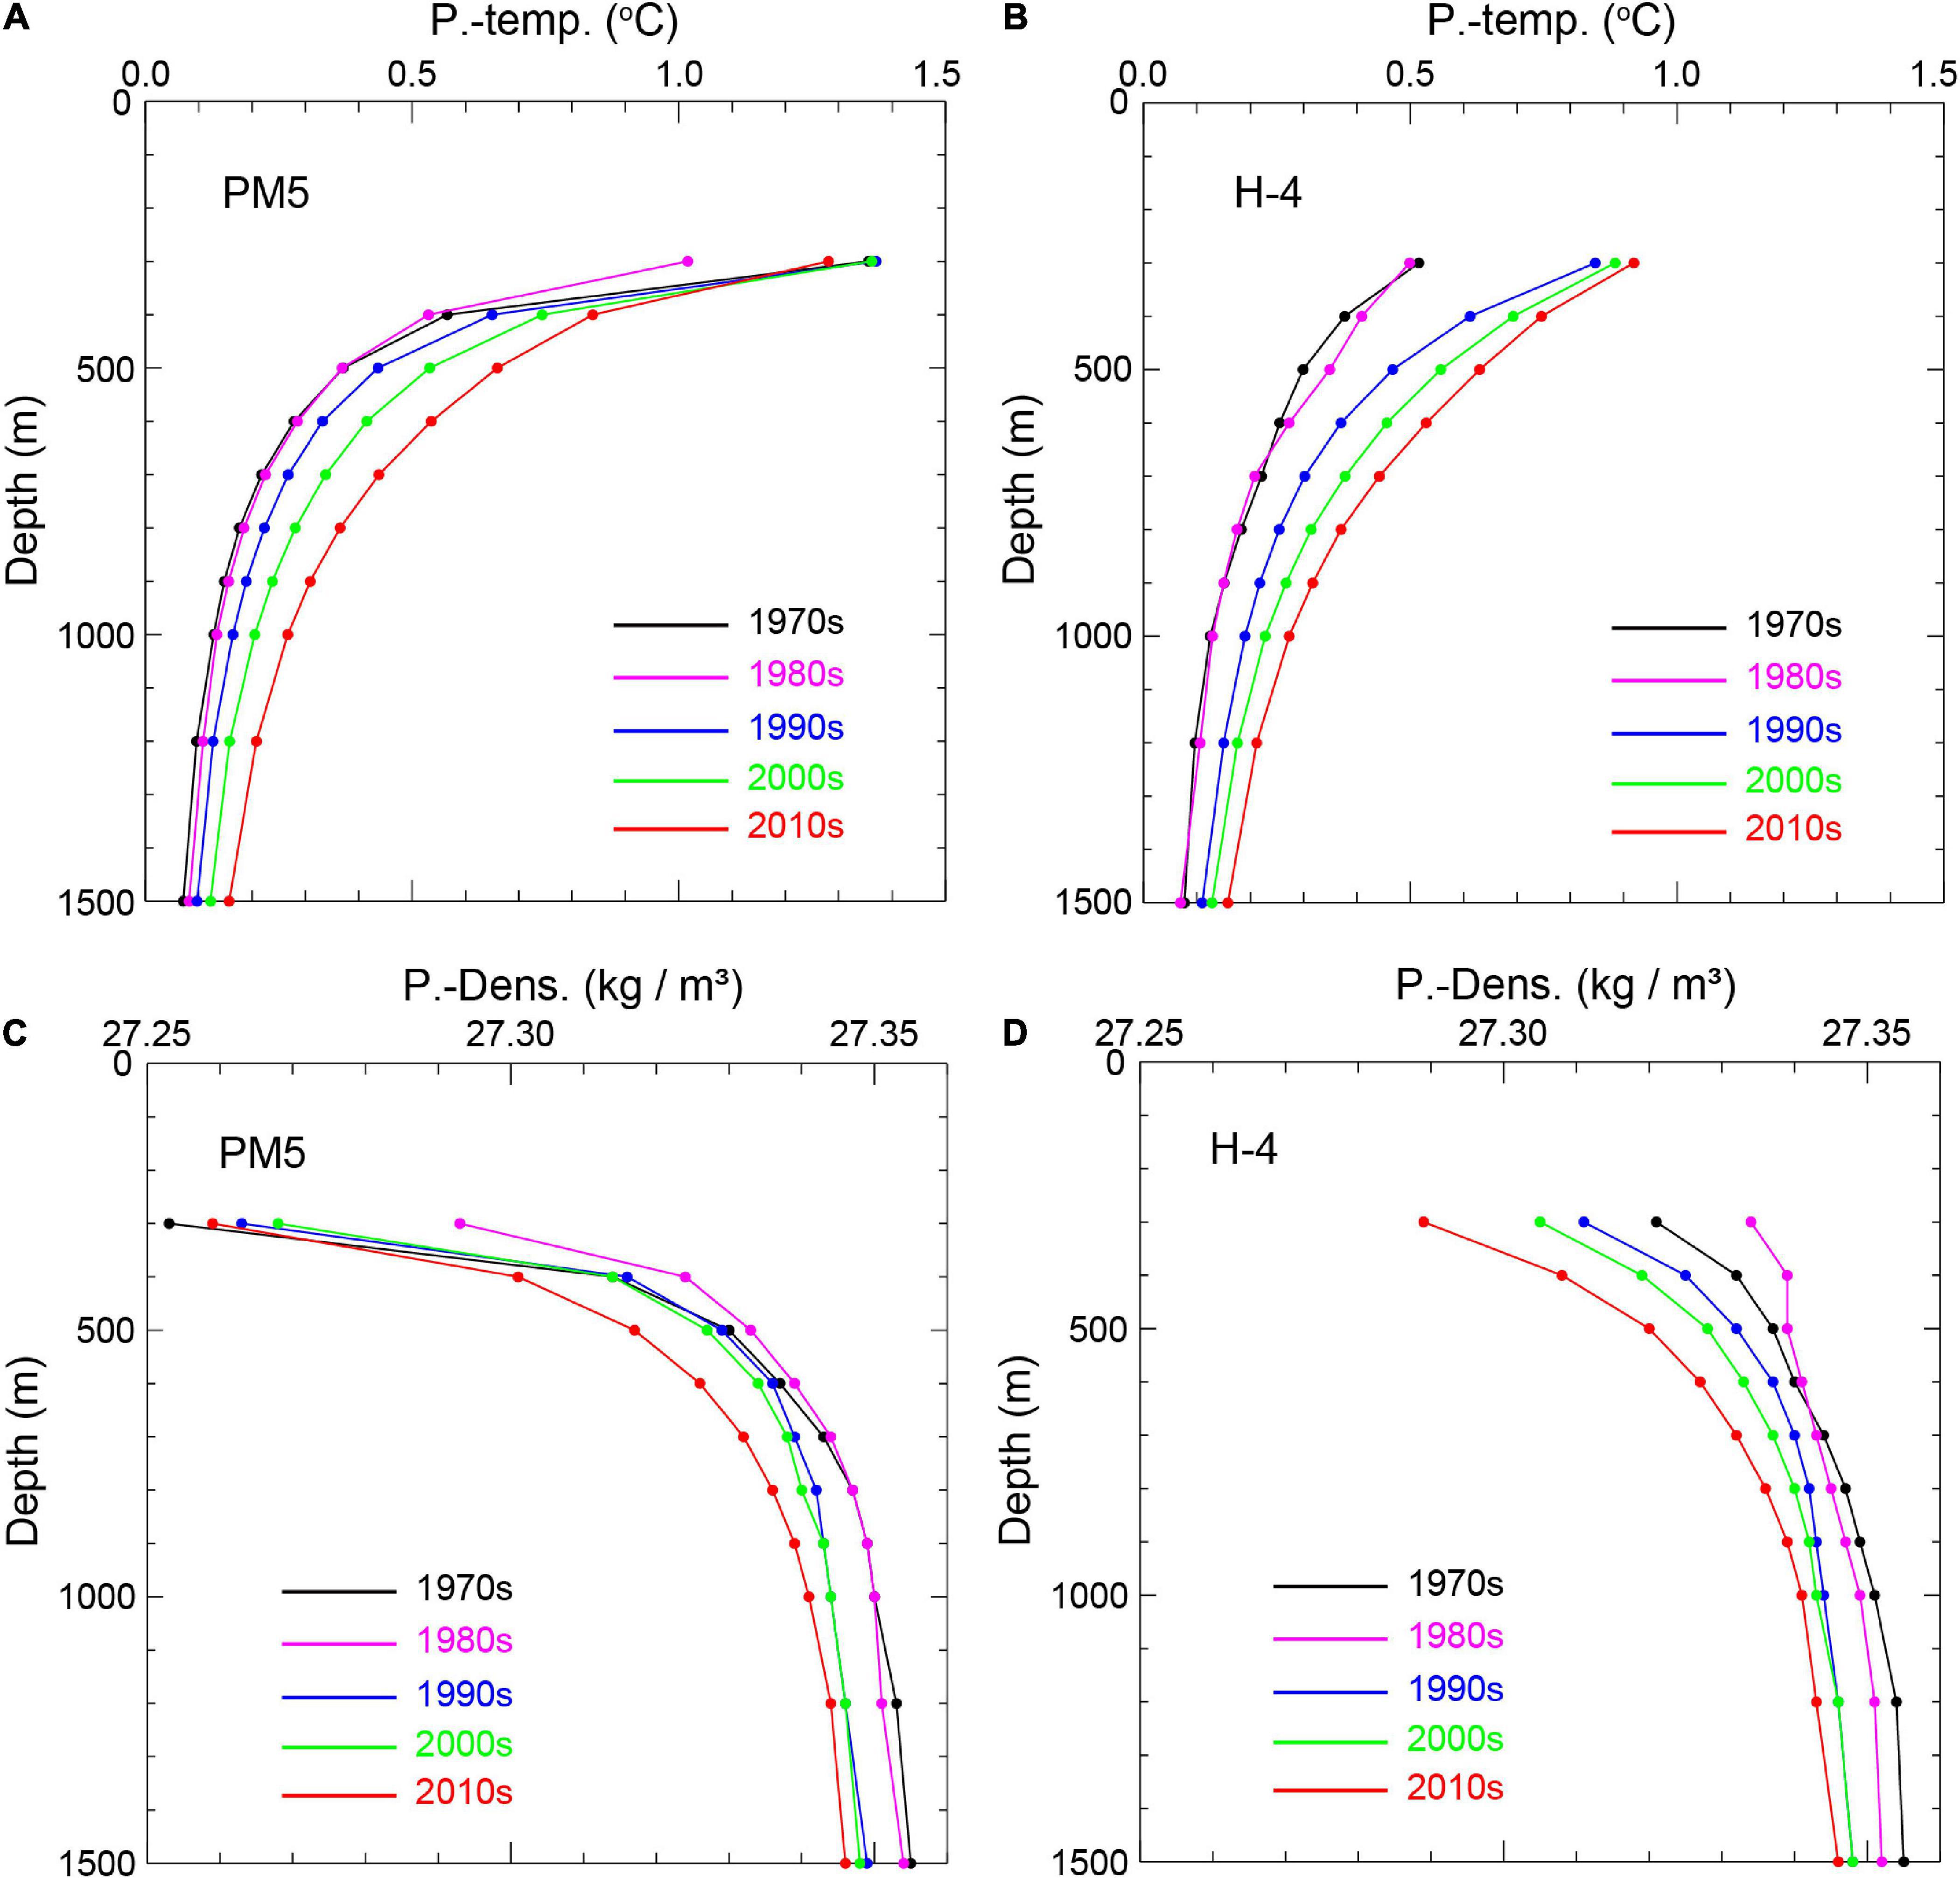
Figure 9. Decadal mean profiles of PT (A,B) and PD (C,D) at Stas. PM5 (left panels) and H-4 (right panels) in a depth rage 300–1500 m.
Discussion
The ship-based long-term hydrographic data revealed the significant warming initiated from the late 1980s. Simply, the warming in the UJSPW is caused by the imbalance between the heating from the upper layer and the advection of cold water from the UJSPW formation region. To understand this situation, a vertical one-dimensional multi-box model was introduced. This model is similar to the one used in Minami et al. (1999) and consists of 25 boxes with a thickness Δz = 100 m (Figure 10). The horizontal advection of cold water from the UJSPW formation region is represented by the injection (ventilation) of cold water (PT = θ0 = 0.1°C) of volume S0 into the Boxes 19–23 corresponding to the UJSPW depth range (500–1000 m). Although new bottom water formation during the analysis period has been suggested (Kim et al., 2002; Senjyu et al., 2002; Talley et al., 2003; Yoon et al., 2018), the cold water supply was imposed on only the intermediate layers because our interest was in the UJSPW variation. As the cold water is assumed to be equally injected into the five boxes, the PT in a box (θi) changes to
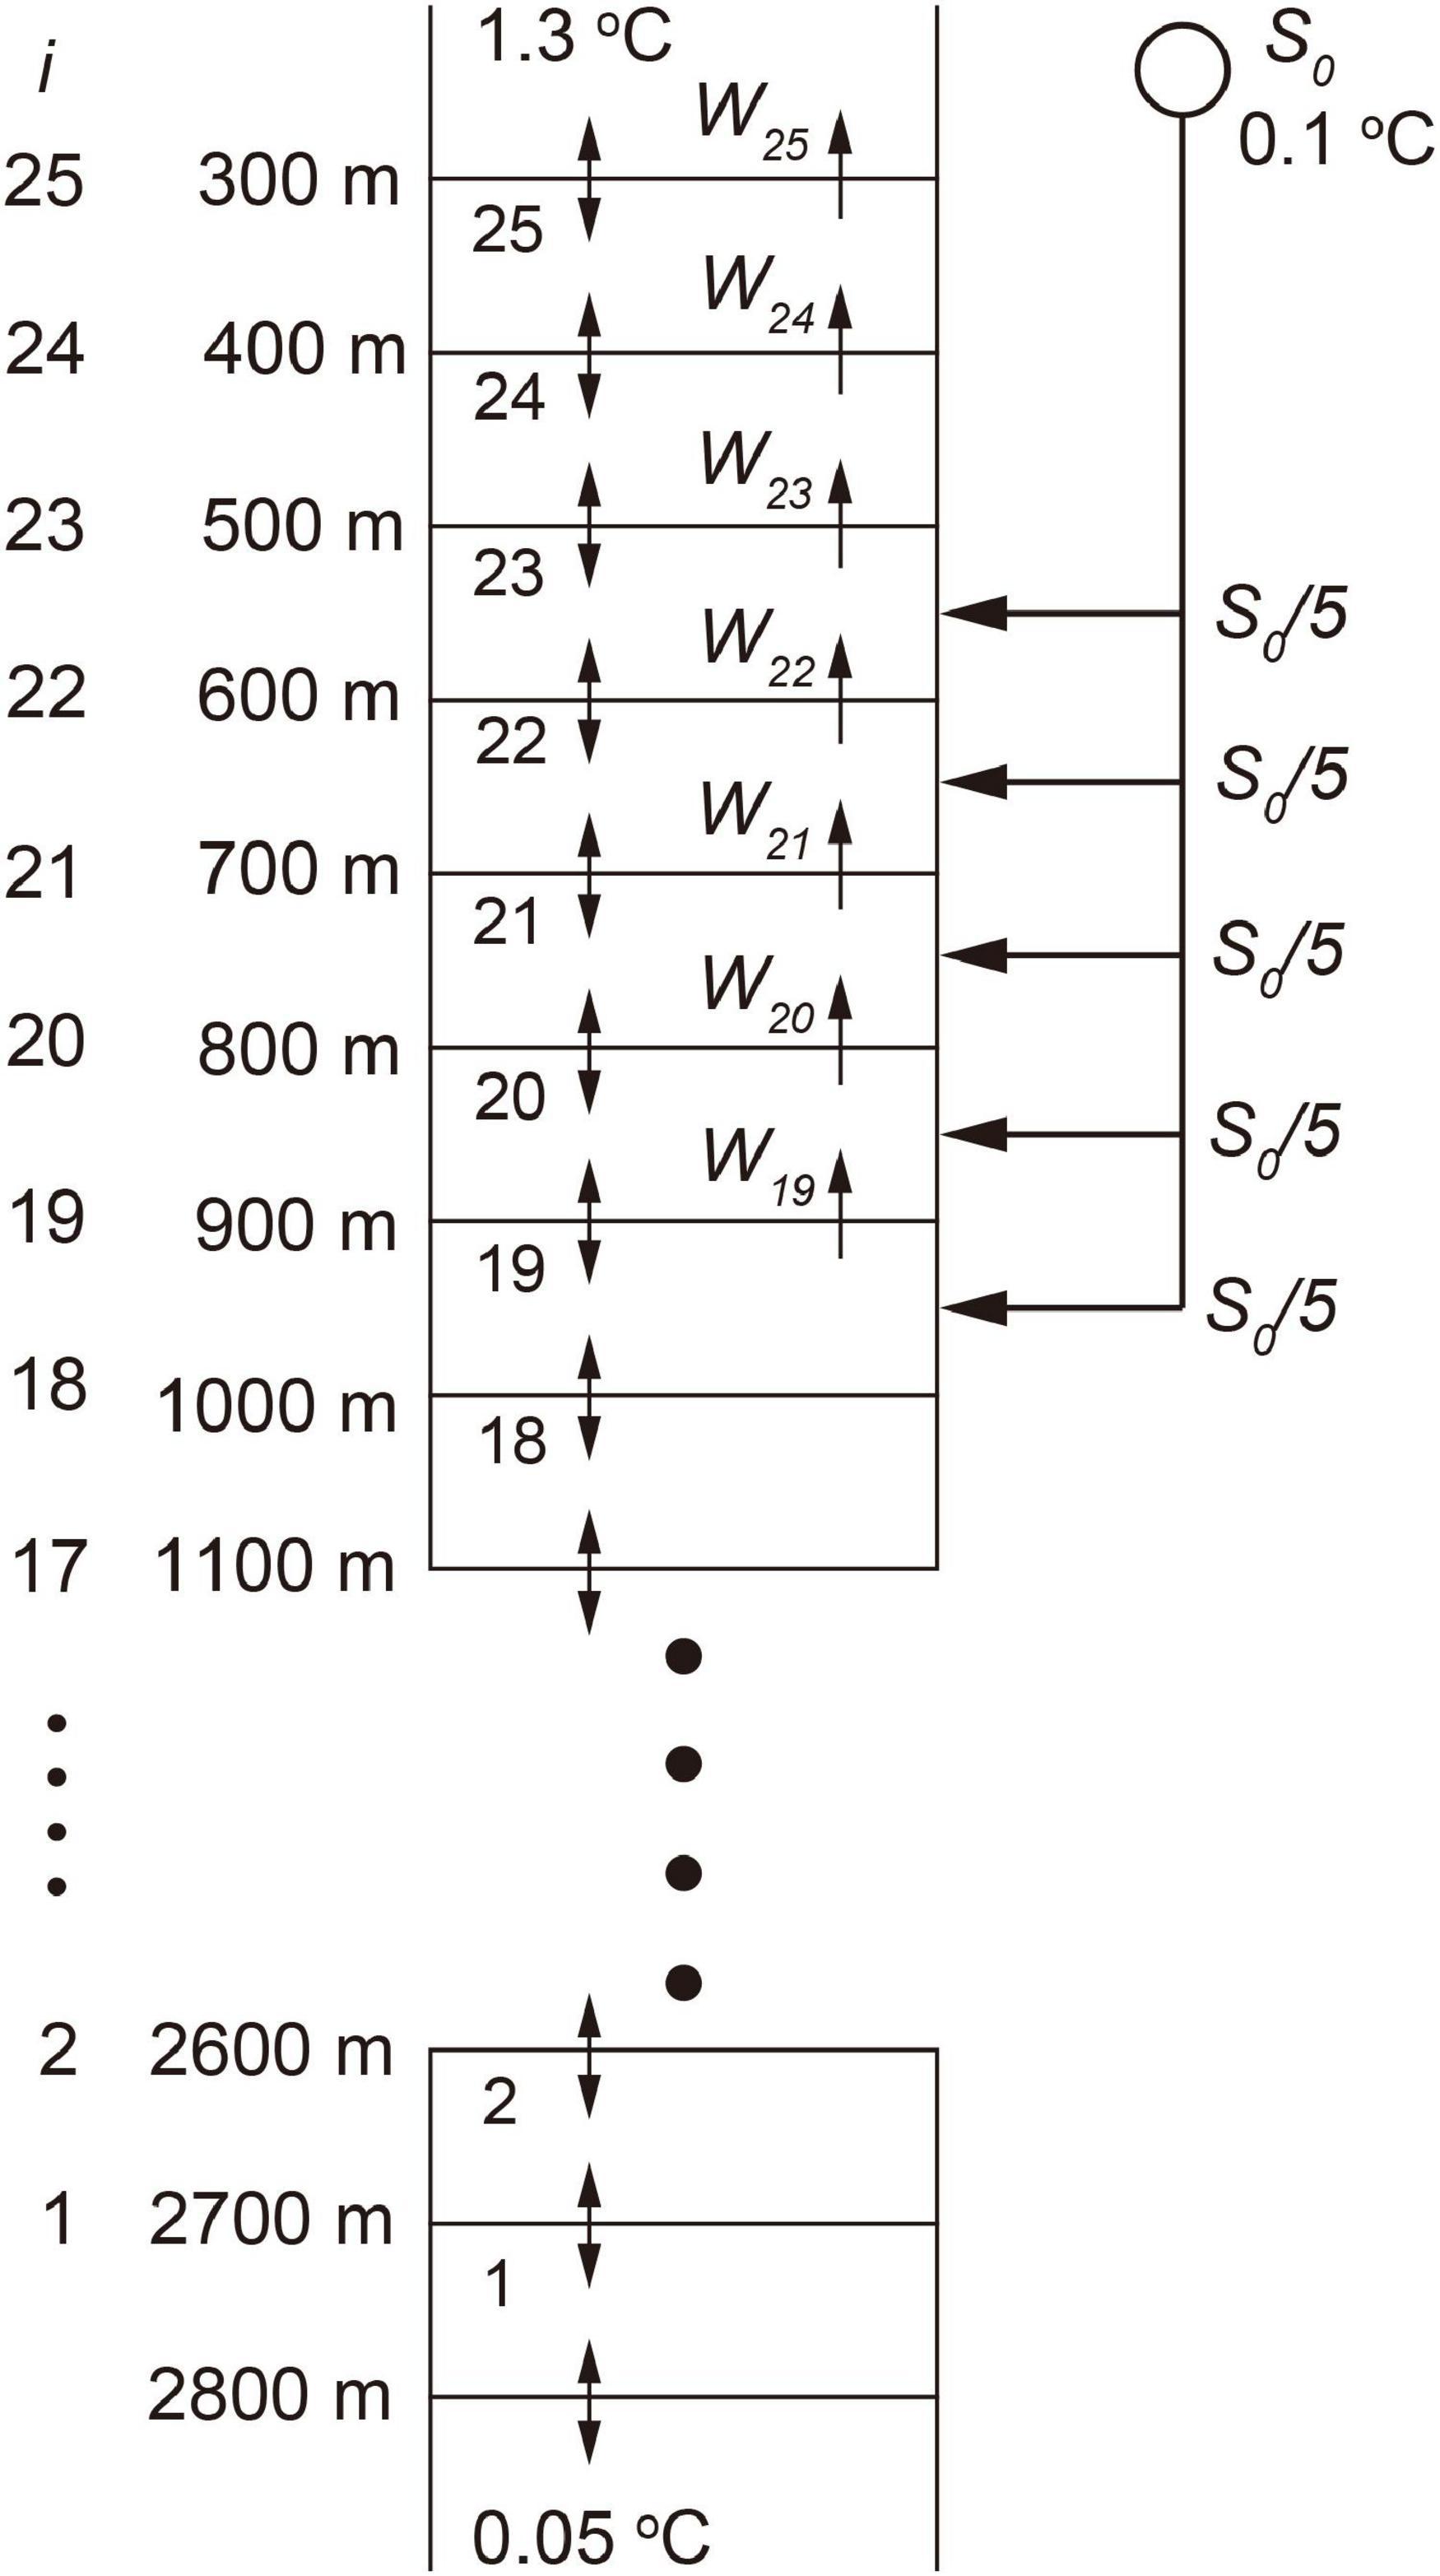
Figure 10. Configuration of the vertical advection-diffusion box model which consists of 25 boxes with 100 m thickness. The horizontal advection of cold UJSPW (PT = 0.1°C) of volume S0 from its souse region is represented by the water injection (ventilation) into the intermediate layers (boxes 19–23), which induces the upwelling velocity W19–W25. The two way arrows between the boxes indicate the vertical heat diffusion. The upper and lower boundary conditions are PT = 1.3 and 0.05°C, respectively.
by instantaneous mixing with the injected water. In addition, the lateral injection of cold water induces upward advection velocity in each box (Wi) to conserve the volume of the box,
The change of PT in each box is controlled by the vertical advection–diffusion equation,
with a vertical diffusivity K. We solved Eqs 1 and 2 alternately at the time step Δt = 1 day, under the boundary conditions PT = 1.3 and 0.05°C at 300 and 2800 m, respectively. The PT profile reaches an equilibrium state after several hundred years. By tried and error examinations, we attained a comparable equilibrium profile to the observed PT distributions at Sta. PM5 during the 1970–1980s at S0 = 7.9 × 10⁻⁷ m s–1 (25 m year–1) and K = 2.0 × 10⁻⁴ m2 s–1 after 600 years (Figure 11). However, this result should be considered as a possible combination of the parameters in reasonable ranges rather than the best fit model results to the observed PT profile.
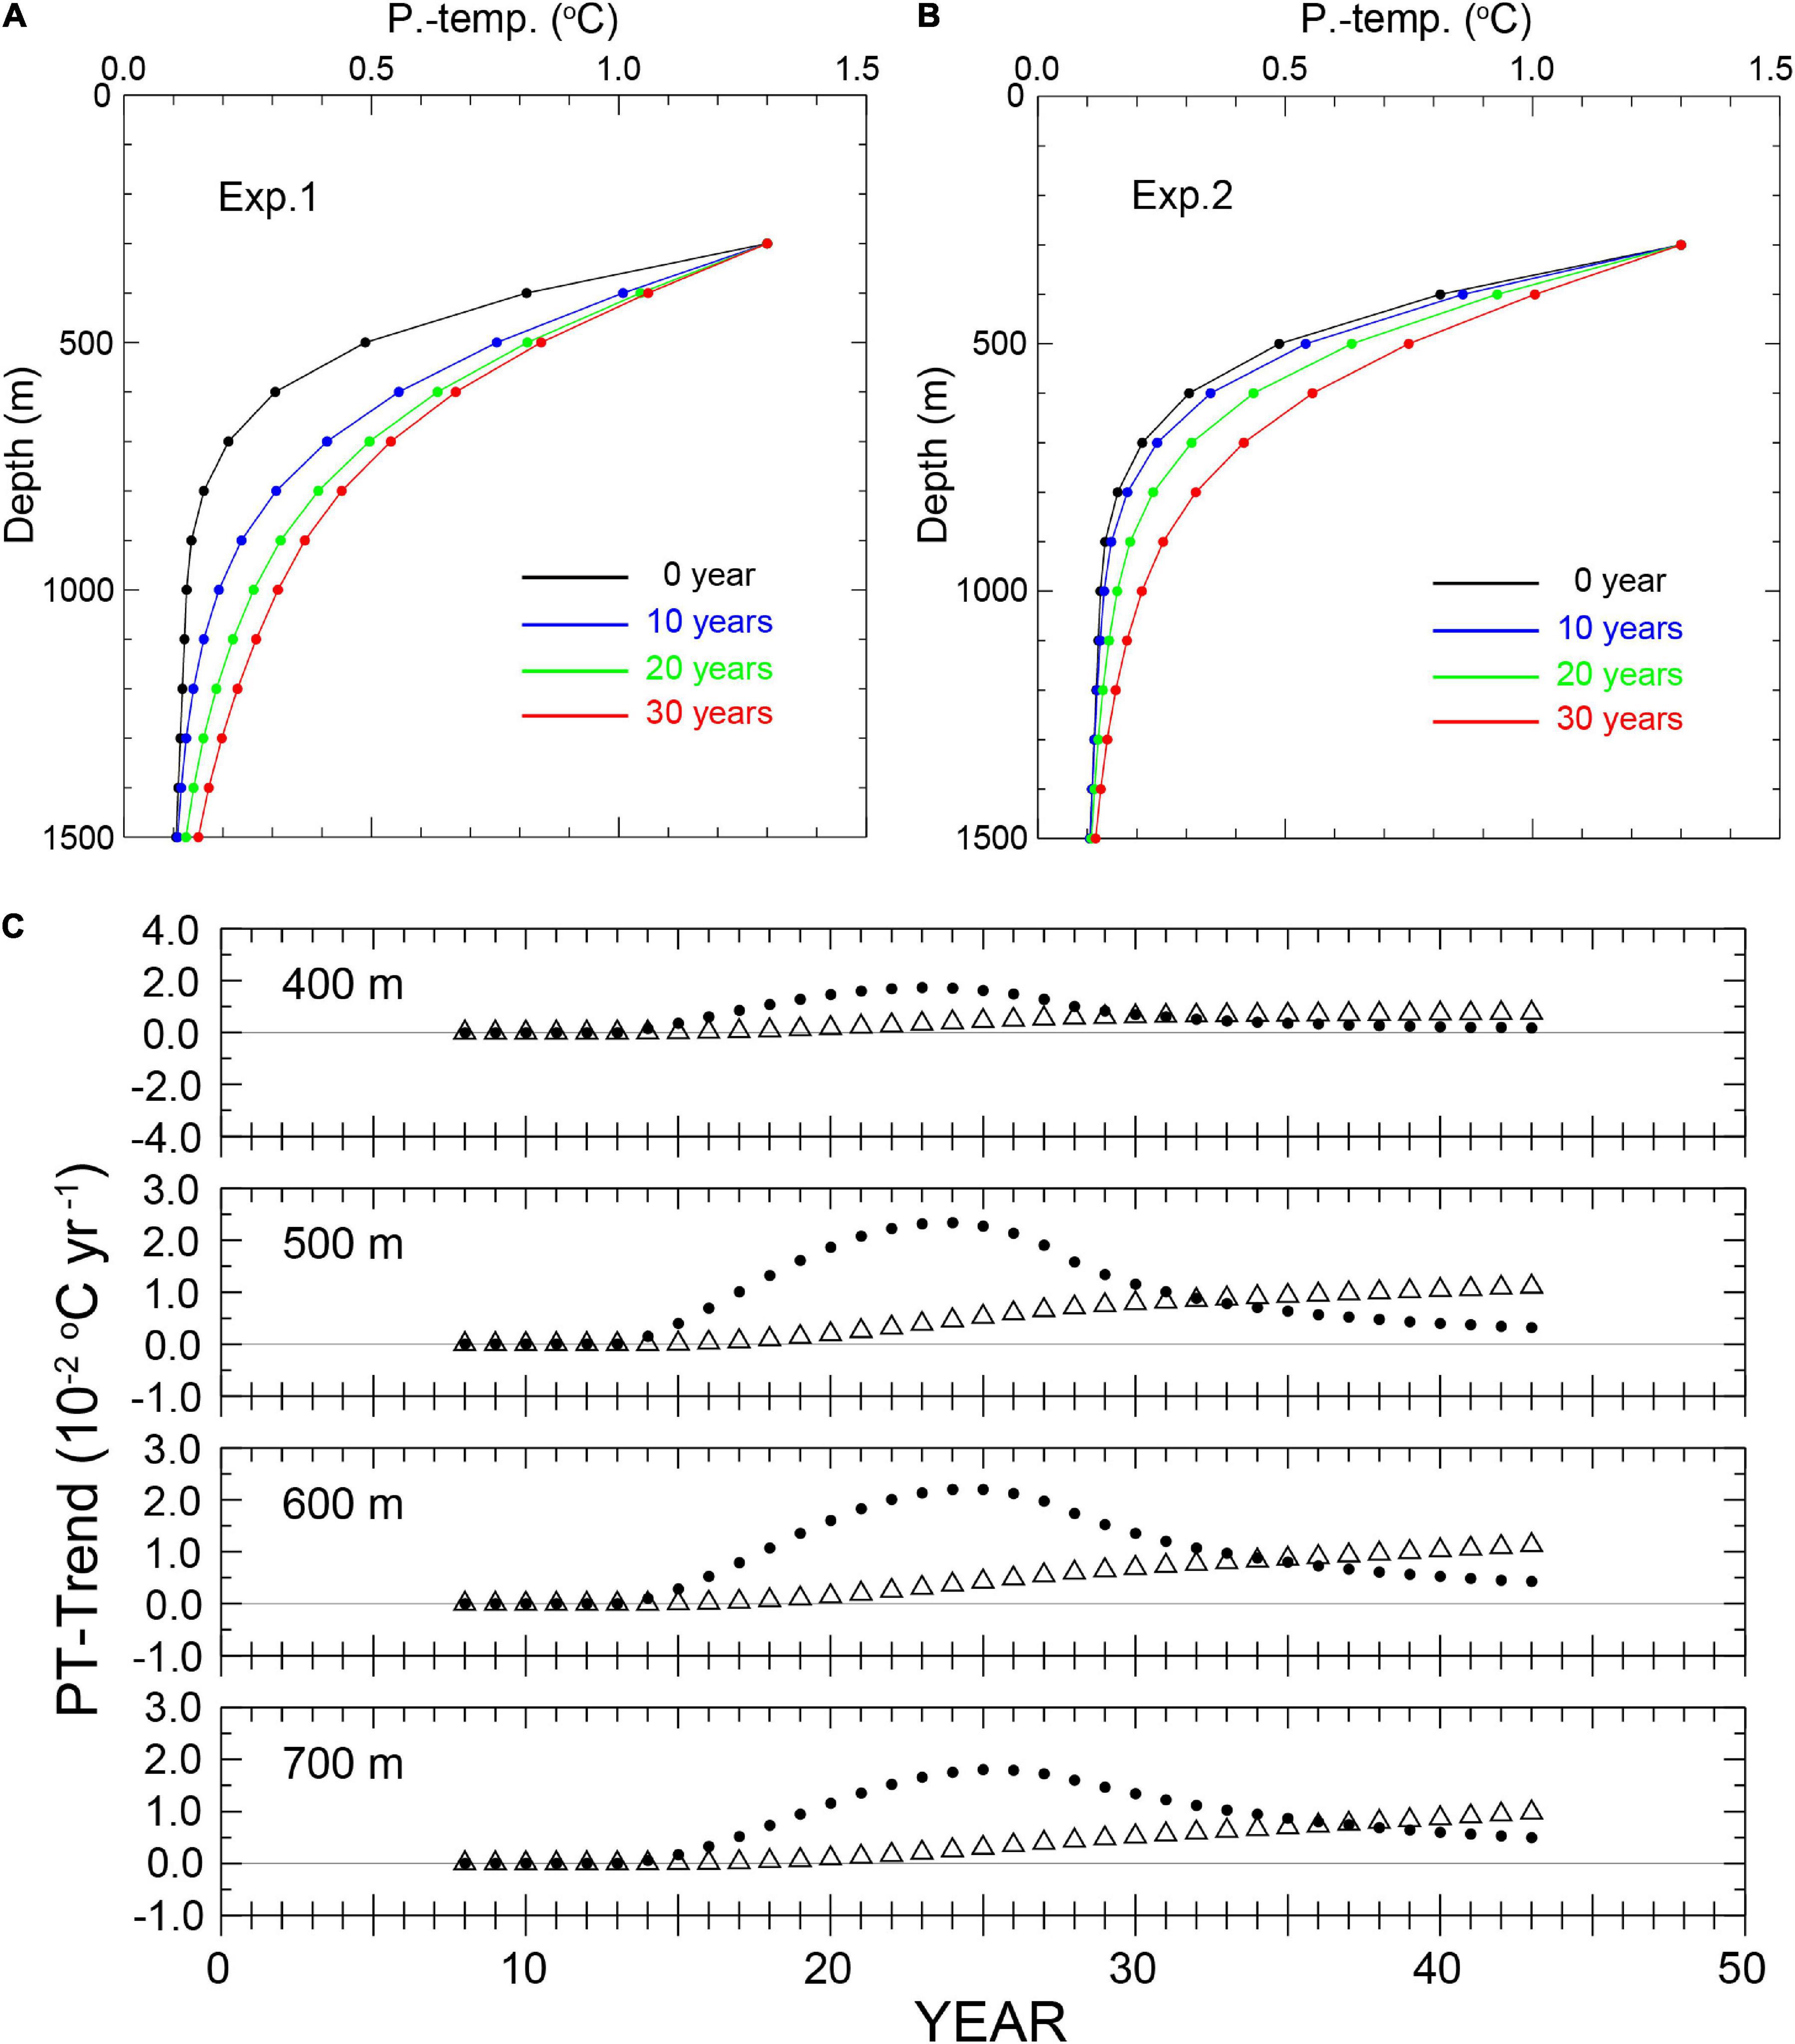
Figure 11. Decadal evolution of the model-calculated PT profiles after the reduction of the cold water injection: (A) Exp. 1 and (B) Exp. 2. For a comparison with the observed PT distributions (Figure 9), only the PT profiles above 1500 m are shown. The profile at 0 year (black) indicates the equilibrium profile at S0 = 7.9 × 10⁻⁷ m s–1 (25 m year–1) and K = 2.0 × 10⁻⁴ m2 s–1 at 600 years in the equilibrium calculation. Time series of the model-calculated PT changing rates evaluated with the 15-year sliding window are shown in (C) by solid circles (Exp. 1) and empty triangles (Exp. 2). The evaluations were performed for the 50-year long datasets that consist of the last 20 years of the equilibrium calculation (581–600 years) and the results from Exps. 1 and 2 of 30-year long.
From this equilibrium state, the cold water injection was reduced to S0/4 in two manners, an abrupt reduction (Exp. 1) and a linear reduction over 30 years (Exp. 2), and then the subsequent change in PT profile was investigated. In both cases, the PT profiles showed a gradual warming throughout the depths due to the imbalance between the downward heat diffusion and the upward cold water advection (Figure 11). However, the evolution of the profiles after the reduction of cold water supply was different in two cases. In Exp. 1, the PT profile gradually approached to another equilibrium state after the sudden PT increase during the first 10 years. On the other hand, the warming at each depth was accelerated with time in Exp. 2. The time series of PT changing rate evaluated by the 15-year sliding window show the difference in PT changes (Figure 11C). The observed variations in warming rates (Figure 8) and stratifications (Figure 9) seem to be explained by a combination of the results from Exps. 1 and 2. As the shape of the equilibrium PT profile is determined by the ratio of the upwelling velocity to the vertical diffusivity (W/K) in this model, an increase in vertical diffusivity, instead of decreasing advection velocity, brings a warming in the PT profile; however, it is not likely that the vertical diffusivity varies with time over several decades. Therefore, a reduction of cold water supply is the most probable cause of the significant warming initiated in the late 1980s.
A stagnation in the UJSPW formation during the 1990s is suggested by the DO variations at Stas. H-4 and PM5. Time series of the DO concentration at the representative depths of the UJSPW showed a decreasing trend after the mid-1990s, although the trends before 1995 were ambiguous due to the superimposed interdecadal oscillation (Cui and Senjyu, 2010, 2012) and the long period of lack of data at Sta. H-4 (Figure 12). A similar long-term decreasing trend in DO concentration has been observed in the deep and bottom waters in the Japan Sea, and the negative trends in DO have been considered as an evidence of the stagnation in the JSPW formation due to global warming (Gamo et al., 1986, 2014; Minami et al., 1999; Gamo, 2011; Kumamoto, 2021), although bio-geochemical DO consumption rate in each basin are unknown.
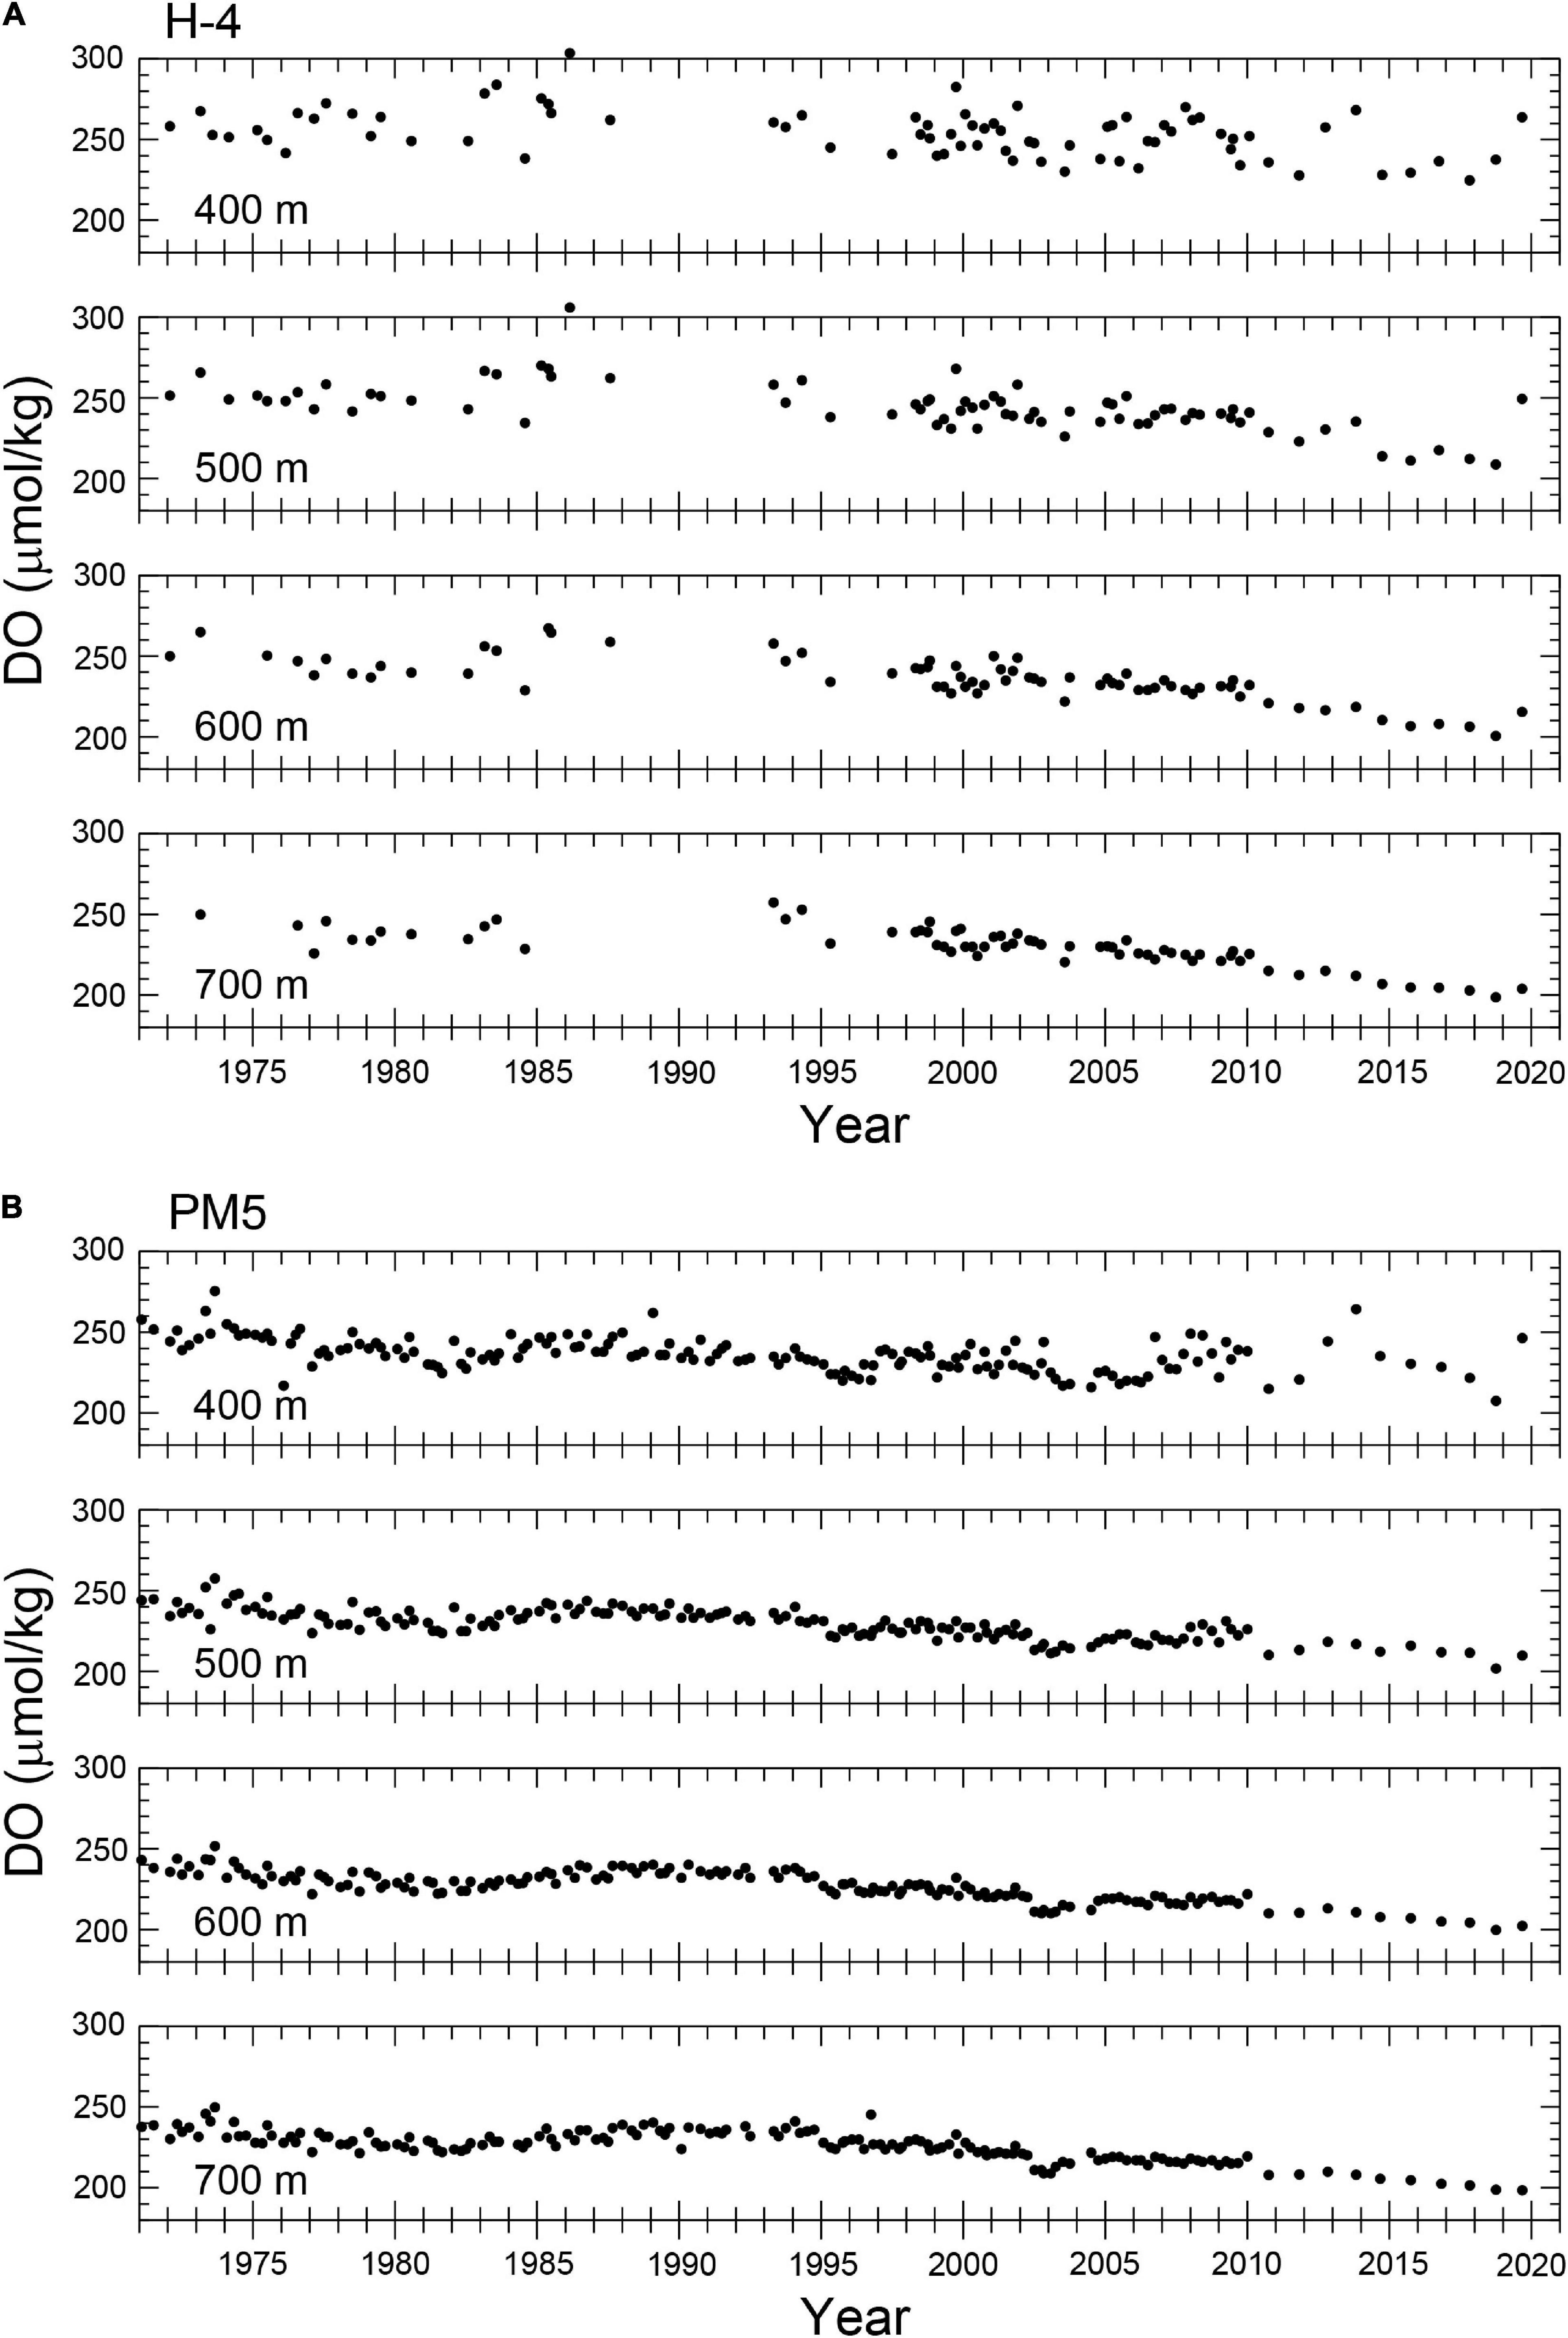
Figure 12. DO time series at 400, 500, 600, and 700 m at (A) Stas. H-4 and (B) PM5.
As the JSPW is formed by deep convection due to surface cooling in winter in the northwestern Japan Sea (Sudo, 1986; Senjyu and Sudo, 1993, 1994; Seung and Yoon, 1995; Kawamura and Wu, 1998; Senjyu et al., 2002), a long-term variation in the winter mean (December–February) SST in the JW region was investigated (Figure 1). Although the areal-mean winter SST in the UJSPW formation region exhibited a distinctive positive trend (+0.02°C yr–1) for the analysis period, a detection of discontinuous changes in the SST field was examined using the Lepage test (Figure 13). The Lepage test is a non-parametric two-sample test (Lepage, 1971) and has been used to detect a “jump” in a time series of climate parameters (Yonetani, 1992a,b). In this study, we set to test the statistical difference between before and after 10-year periods bounded by a year. The test statistic (HK) showed significant values of greater than 95% confidence level during the period 1989–1995, which indicates a discontinuous change between the periods before and after the years. In fact, the mean SSTs during the periods 1979–1988 and 1996–2005 were 1.38 and 1.95°C, respectively. As the warming explained by the linear trend during 1989–1995 is 0.12°C, a rapid warming (+0.57°C) occurred in the winter SST field from the late 1980s to mid-1990s. This also supports the stagnation in the UJSPW formation from the late 1980s.
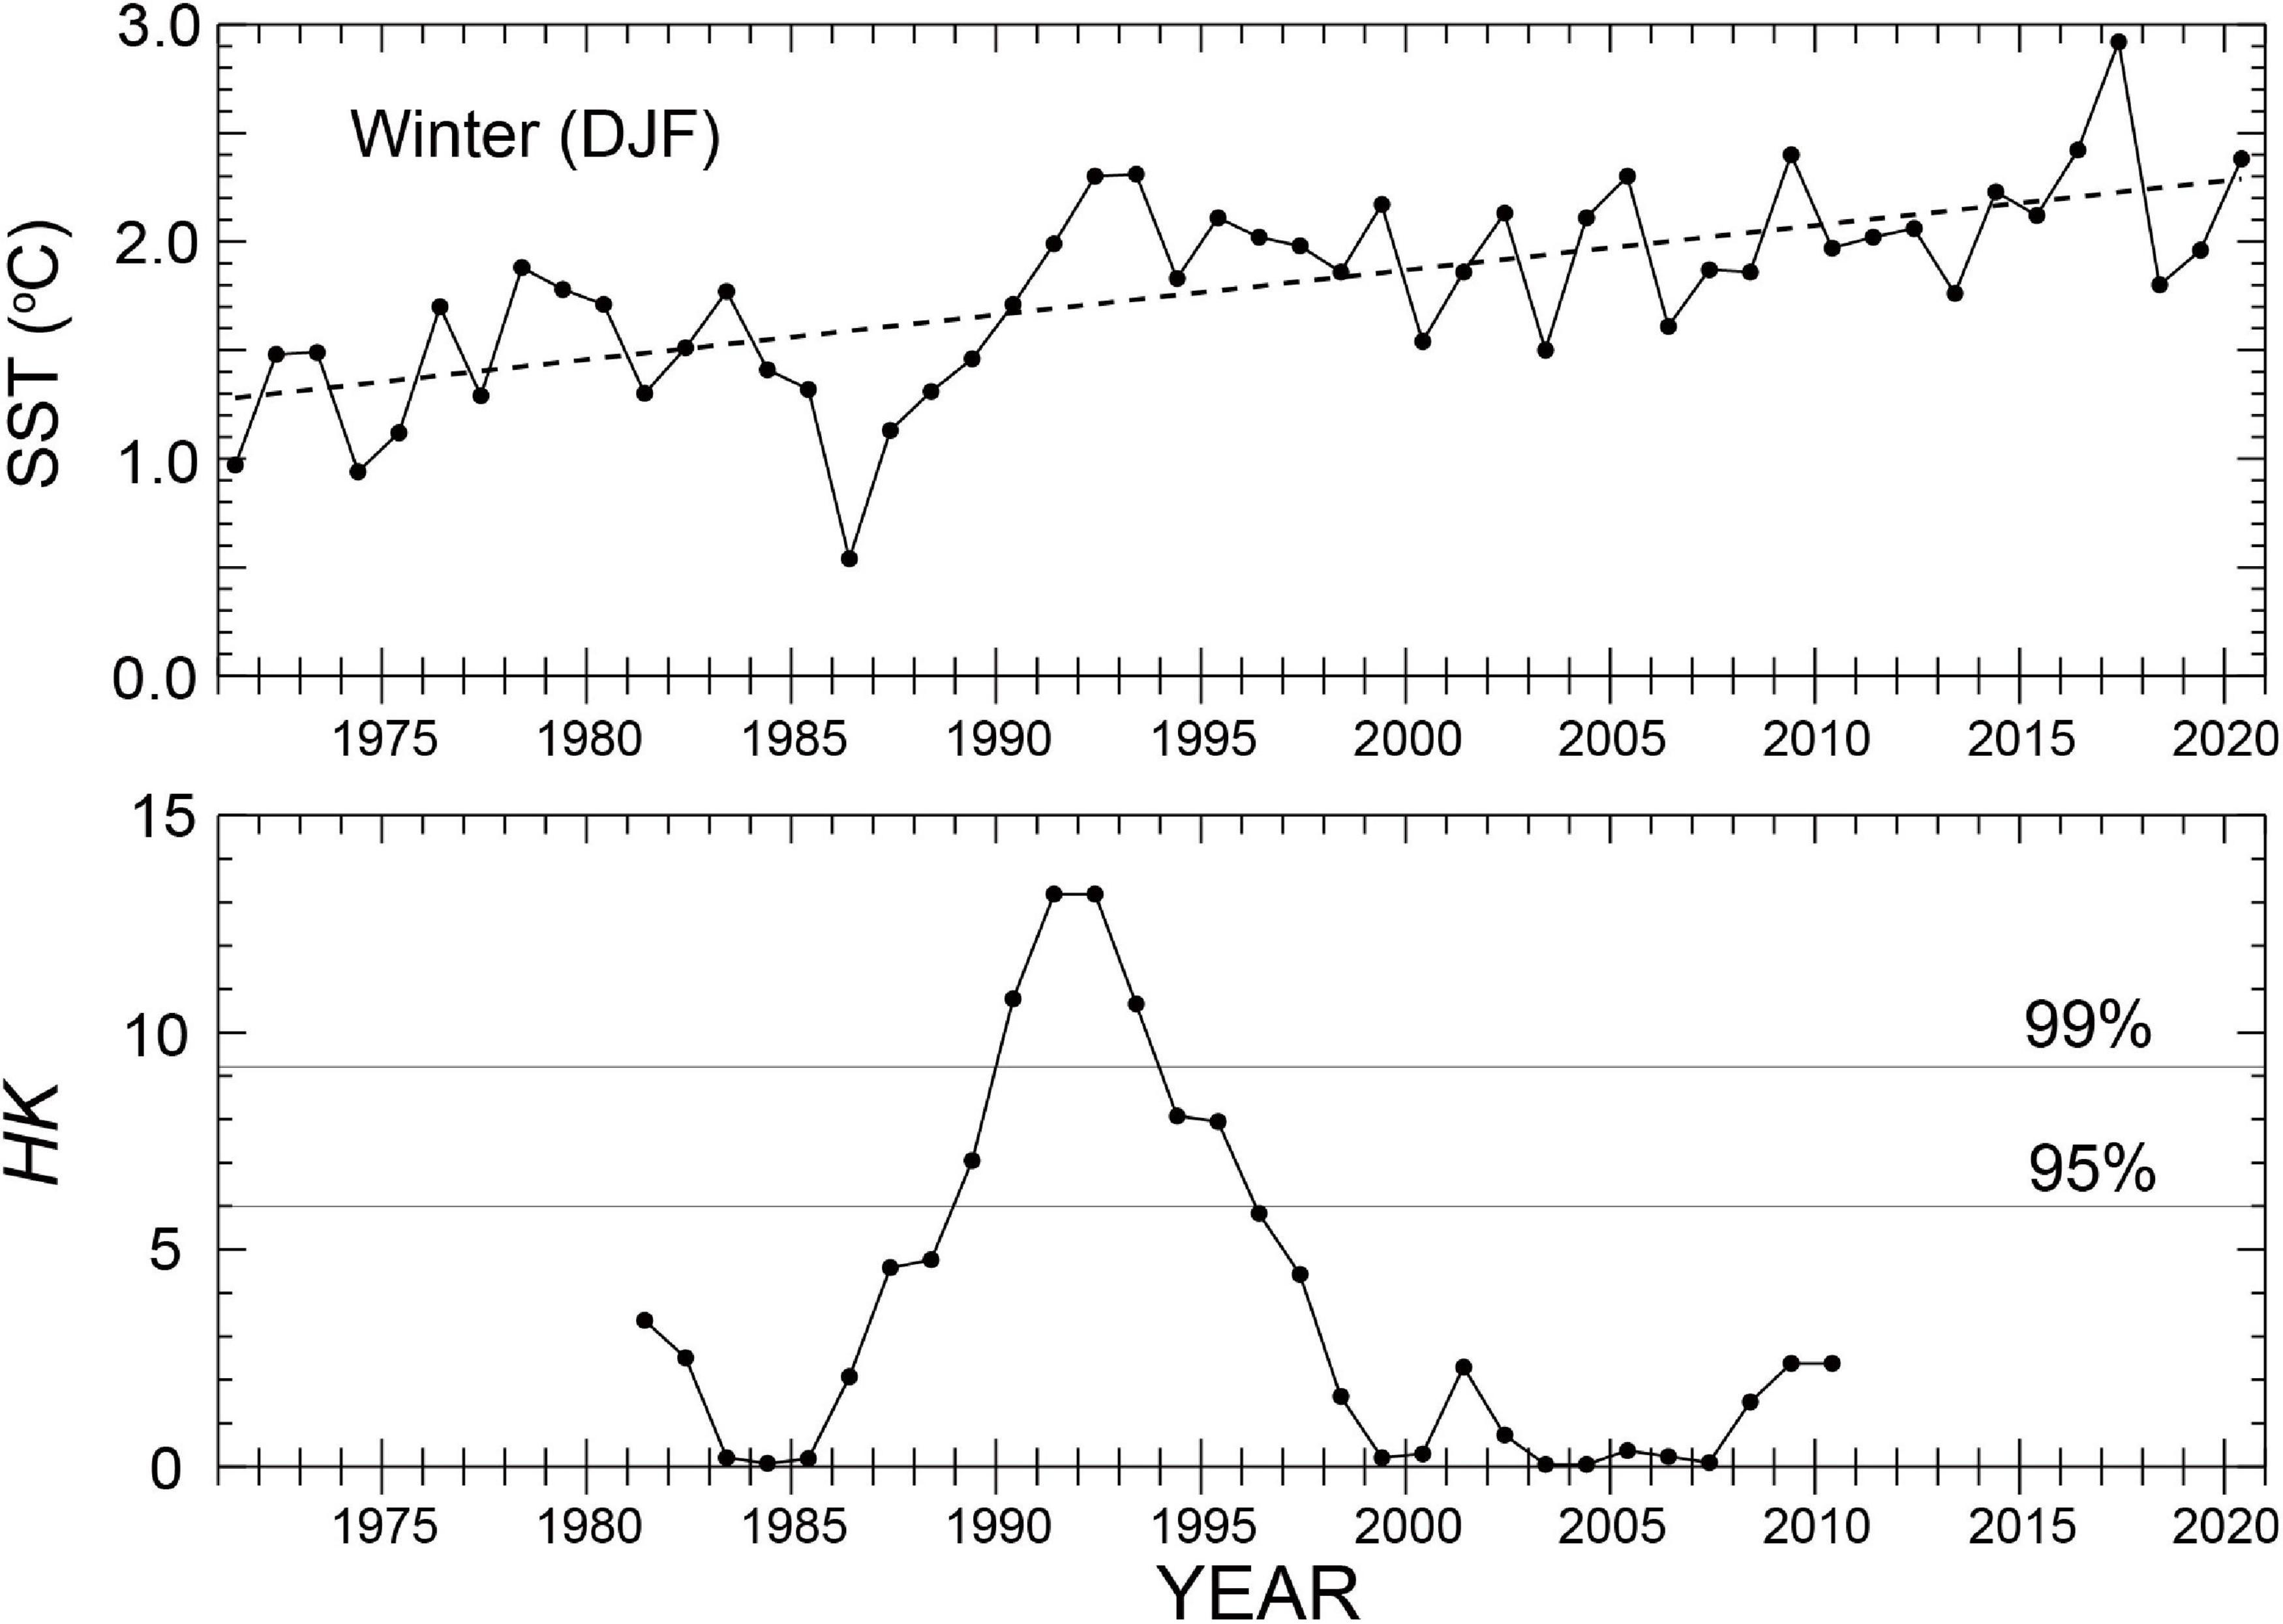
Figure 13. Time series of the areal-mean winter (December–February) sea surface temperature in JW (upper panel). The linear trend for the analysis period is depicted by a dashed line. The lower panel shows the time series of Lepage test statistics (HK) with the 99 and 95% confidence levels (thin horizontal bars).
Conclusion
We conclude that a significant change in the mid-depth water mass ventilation occurred in the Japan Sea in the late 1980s. Since the warming trends in JW and TB in the western sea are similar to those in JE and YB in the eastern sea, respectively (Figure 4), it is suggested that the significant acceleration of warming from the late 1980s occurred concurrently in the northwestern and southwestern areas, which is in the entire Japan Sea area. Before the mid-1980s, when the influence of global warming in this region was not very serious, the cold, newly formed UJSPW was supplied to the entire Japan Sea area from its formation region via deep circulation (Senjyu et al., 2005b). However, a stagnation of the UJSPW formation occurred in the late 1980s, as suggested by the abrupt SST warming in its formation region and the depression in DO concentration at Stas. H-4 and PM5, which resulted in the warming of UJSPW over the entire Japan Sea area through the imbalance between the heating from the upper layer and the advection of cold water from the UJSPW formation region.
Subsequently, an acceleration of warming began from 2008 at Sta. PM5, which led to the recent higher warming rates in the southern Japan Sea than those in the northern sea (Figure 8). Considering the nearly constant or weak decelerated warming rates at Sta. H-4 after 2008, a relatively large volume of cold UJSPW was still supplied to the northern Japan Sea including the UJSPW formation region, although DO at Sta. H-4 exhibited negative trends (Figure 12). In contrast, in the southern Japan Sea away from the UJSPW formation area, the transport of newly formed UJSPW was restricted, which resulted in greater warming rates in the southern Japan Sea than in the northern sea owing to the larger imbalance in the UJSPW heat budget. As the warming occurred only in the southern sea, the water mass ventilation event after 2008 may be modest compared to that occurred in the late 1980s.
The second event after 2008 implies that a remarkable signal of global warming on thermohaline circulation appears first in the terminal regions of deep circulation, which are away from the source region of the deep water, as a weakening of water mass ventilation. Actually, a notable warming of deep water has been observed in the Ulleung Interplain Gap in the southwestern Japan Sea, although no significant long-term trend was reported for the deep flows (Chang et al., 2009). Trans-basin warming in the bottom water of the North Pacific has been reported from the subarctic North Pacific along the 47°N line, which corresponds to a terminal region of the bottom water pathway from the South Pacific (Fukasawa et al., 2004). We point out a similarity between the warming in the North Pacific bottom water and the recent greater warming rates in the southern Japan Sea, which is away from the UJSPW formation region, although warming trends have already been detected in the northern Japan Sea.
In this study, global warming has been considered as a main cause of the long-term variations in the UJSPW. However, decadal-scale variations associated with hemisphere-scale atmospheric variations have been reported in the Japan Sea (Minobe et al., 2004; Cui and Senjyu, 2010, 2012; Na et al., 2012). It is meaningful that the significant UJSPW warming from the late 1980s appears to correlate with a regime shift occurred in the Northern Hemisphere in 1988/1989 that is associated with the Arctic Oscillation (Yasunaka and Hanawa, 2002). This may indicate that the decadal-scale climatic variability triggers a change in the mid-depth water mass ventilation in marginal seas of relatively small volume, as well as the longer-period warming trend.
Data Availability Statement
Publicly available datasets were analyzed in this study. This data can be found here: The AQC Argo data used in this study are available on the websites of the JAMSTEC (http://www.jamstec.go.jp/ARGO/argo_web/argo/?page_id=100&lang=en). The ship-based hydrographic data can be downloaded from the website of the JMA (http://www.data.jma.go.jp/gmd/kaiyou/db/vessel_obs/data-report/html/ship/ship.php). The monthly SST data in the COBE-SST2 provided by the JMA were available in the NEAR-GOOS website (http://ds.data.jma.go.jp/gmd/goos/data/pub/JMA-product/) by the JMA.
Author Contributions
TS designated the study, performed the data processing and analysis, conducted the model calculation, and wrote the manuscript.
Funding
This study was partly supported by JSPS KAKENHI (Grant Numbers JP18H03741 and JP19H04245) and the Environment Research and Technology Development Fund of the Ministry of the Environment, Japan (2-1604).
Conflict of Interest
The author declares that the research was conducted in the absence of any commercial or financial relationships that could be construed as a potential conflict of interest.
Publisher’s Note
All claims expressed in this article are solely those of the authors and do not necessarily represent those of their affiliated organizations, or those of the publisher, the editors and the reviewers. Any product that may be evaluated in this article, or claim that may be made by its manufacturer, is not guaranteed or endorsed by the publisher.
Acknowledgments
I would like to express sincere respect to all data originators of the Argo, shipboard, and meteorological observations. Qian, Y., a graduate student at Kyushu University, is acknowledged for his assistance with the Argo data arrangement in the early stages of this study.
References
Akima, H. (1970). A new method of interpolation and smooth curve fitting based on local procedures. J. ACM 17, 589–602. doi: 10.1145/321607.321609
Bindoff, N. L., Willebrand, J., Artale, V., Cazenave, A., Gregory, J., Gulev, S., et al. (2007). “Observations: oceanic climate change and sea level,” in Climate Change: The Physical Science Basis. Contribution of Working Group I to the Fourth Assessment Report of the Intergovernmental Panel on Climate Change, eds S. Solomon, D. Qin, M. Manning, Z. Chen, M. Marquis, K.B. Averyt, et al. (Cambridge: Cambridge University Press), 385–432.
Chang, K. I., Kim, K., Kim, Y. B., Teague, W. J., Chul Lee, J. C., and Lee, J. H. (2009). Deep flow and transport through the Ulleung Interplain Gap in the southwestern East/Japan Sea. Deep Sea Res. I 56, 61–72. doi: 10.1016/j.dsr.2008.07.015
Choi, Y. J., and Yoon, J. H. (2010). Structure and seasonal variability of the deep mean circulation of the East Sea (Sea of Japan). J. Oceanogr. 66, 349–361. doi: 10.1007/s10872-010-0031-y
Cui, Y., and Senjyu, T. (2010). Interdecadal oscillations in the Japan Sea proper water related to the arctic oscillation. J. Oceanogr. 66, 337–348. doi: 10.1007/s10872-010-0030-z
Cui, Y., and Senjyu, T. (2012). Has the upper portion of the Japan Sea Proper Water formation really been enhancing? J. Oceanogr. 68, 593–598. doi: 10.1007/s10872-012-0115-y
Fukasawa, M., Freeland, H., Perkin, R., Watanabe, T., Uchida, H., and Nishina, A. (2004). Bottom water warming in the North Pacific Ocean. Nature 427, 825–827. doi: 10.1038/nature02337
Gamo, T. (2011). Dissolved oxygen in the bottom water of the Sea of Japan as a sensitive alarm for global climate change. Trends Anal. Chem. 30, 1308–1319. doi: 10.1016/j.trac.2011.06.005
Gamo, T., and Horibe, Y. (1983). Abyssal circulation in the Japan Sea. J. Oceanogr. Soc. Japan 39, 220–230. doi: 10.1007/BF02070392
Gamo, T., Nakayama, N., Takahata, N., Sano, Y., Zhan, J., Yamazaki, E., et al. (2014). The Sea of Japan and its unique chemistry revealed by time-series observations over the last 30 years. Monogr. Environ. Earth Planets 2, 1–22. doi: 10.5047/meep.2014.00201.0001
Gamo, T., Nozaki, Y., Sakai, H., Nakai, T., and Tsubota, H. (1986). Spacial and temporal variations of water characteristics in the Japan Sea bottom layer. J. Mar. Res. 44, 781–793. doi: 10.1357/002224086788401620
Hatta, M., and Zhang, J. (2006). Possible source of advected water mass and residence times in the multi-structured Sea of Japan using rare earth elements. Geophys. Res. Lett. 33:L16606. doi: 10.1029/2006GL026537
Hirahara, S., Ishii, M., and Fukuda, Y. (2014). Centennial-scale sea surface temperature analysis and its uncertainty. J. Clim. 27, 57–75. doi: 10.1175/jcli-d-12-00837.1
Kang, D. J., Kim, K., and Kim, K. R. (2004). The past, present and future of the East/Japan Sea in change: a simple moving-boundary box model approach. Prog. Oceanogr. 61, 175–191. doi: 10.1016/j.pocean.2004.06.006
Kang, S. K., Seung, Y. H., Park, J. J., Park, J. H., Lee, J. H., Kim, E. J., et al. (2016). Seasonal variability in middepth gyral circulation patterns in the central East/Japan Sea as revealed by long-term Argo data. J. Phys. Oceanogr. 46, 937–946. doi: 10.1175/JPO-D-15-0157.1
Kawamura, H., and Wu, P. (1998). Formation mechanism of Japan sea proper water in the flux center off Vladivostok. J. Geophys. Res. 103, 21611–21622. doi: 10.1029/98JC01948
Kim, K., Kim, K. R., Kim, Y. G., Cho, Y. K., Kang, D. J., Takematsu, M., et al. (2004). Water masses and decadal variability in the East Sea (Sea of Japan). Prog. Oceanogr. 61, 157–174. doi: 10.1016/j.pocean.2004.06.003
Kim, K. R., Kim, G., Kim, K., Lobanov, V., Ponomarev, V., and Salyuk, A. (2002). A sudden bottom-water formation during the severe winter 2000–2001: the case of the East/Japan Sea. Geophys. Res. Lett. 29, 75–71. doi: 10.1029/2001GL014498
Kumamoto, Y. (2021). Temporal variation in dissolved oxygen in Japan sea bottom water. Kaiyo Monthly 53, 343–349.
Kwon, Y.-O., Kim, K., Kim, Y. G., and Kim, K. R. (2004). Diagnosing long-term trends of the water mass properties in the East Sea (Sea of Japan). Geophys. Res. Lett. 31:L20306. doi: 10.1029/2004GL020881
Lee, D. K., Niiler, P. P., Lee, S. R., Kim, K., and Lie, H. J. (2000). Energetics of the surface circulation of the Japan/East Sea. J. Geophys. Res. 105, 19561–19573. doi: 10.1029/2000JC900061
Lepage, Y. (1971). A combination of Wilcoxon’s and Ansari-Bradley’s statistics. Biometrika 58, 213–217. doi: 10.1093/biomet/58.1.213
Minami, H., Kano, Y., and Ogawa, K. (1999). Long-term variations of potential temperature and dissolved oxygen of the Japan sea proper water. J. Oceanogr. 55, 197–205. doi: 10.1023/A:1007889929187
Minobe, S., Sako, A., and Nakamura, M. (2004). Interannual to interdecadal variability in the Japan Sea based on a new gridded upper water temperature dataset. J. Phys. Oceanogr. 34, 2382–2397. doi: 10.1175/JPO2627.1
Morimoto, A., Yanagi, T., and Kaneko, A. (2000). Eddy field in the Japan Sea derived from satellite altimetric data. J. Oceanogr. 56, 449–462. doi: 10.1023/A:1011184523983
Na, H., Kim, K. Y., Chang, K. I., Park, J. J., Kim, K., and Minobe, S. (2012). Decadal variability of the upper ocean heat content in the East/Japan Sea and its possible relationship to northwestern Pacific variability. J. Geophys. Res. 117:C02017. doi: 10.1029/2011JC007369
Nitani, H. (1972). “On the deep and bottom waters in the Japan Sea,” in Researches in Hydrography and Oceanography, ed. D. Shoji (Tokyo: Hydrographic Department of Japan Maritime Safety Agency), 151–201.
Park, Y. G., Choi, A., Kim, Y. H., Min, H. S., Hwang, J. H., and Choi, S. H. (2010). Direct flows from the Ulleung Basin into the Yamato Basin in the East/Japan Sea. Deep-Sea Res. I 57, 731–738. doi: 10.1016/j.dsr.2010.03.006
Park, Y. G., Oh, K. H., Chang, K. I., and Suk, M. S. (2004). Intermediate level circulation of the southwestern part of the East/Japan Sea estimated from autonomous isobaric profiling floats. Geophys. Res. Lett. 31:L13213. doi: 10.1029/2004GL020424
Senjyu, T. (2020). “Long-term changes in the abyssal Japan Sea (East Sea): a physical view,” in Changing Asia-Pacific Marginal Seas, Atmosphere, Earth, Ocean & Space, eds C. T. A. Chen and X. Guo (Singapore: Springer Nature), 69–85. doi: 10.1007/978-981-15-4886-4_5
Senjyu, T., and Aramaki, T. (2017). Volume transport from the Japan Basin to the Yamato Basin in the abyssal Japan Sea inferred from direct current observations. J. Oceanogr. 73, 235–247. doi: 10.1007/s10872-016-0399-4
Senjyu, T., Aramaki, T., Otosaka, S., Togawa, O., Danchenkov, M., Karasev, E., et al. (2002). Renewal of the bottom water after the winter 2000–2001 may spin-up the thermohaline circulation in the Japan Sea. Geophys. Res. Lett. 29, doi: 10.1029/2001GL014093
Senjyu, T., Aramaki, T., Tanaka, S. S., Zhang, J., Isoda, Y., Kumamoto, Y., et al. (2013). Abyssal water mass exchange between the Japan and Yamato Basins in the Japan Sea. J. Geophys. Res. Oceans 118, 4878–4888. doi: 10.1002/jgrc.20373
Senjyu, T., Shin, H. R., Yoon, J. H., Nagano, Z., An, H. S., Byun, S. K., et al. (2005b). Deep flow field in the Japan/East Sea as deduced from direct current measurements. Deep Sea Res. II 52, 1726–1741. doi: 10.1016/j.dsr2.2003.10.013
Senjyu, T., Isoda, Y., Aramaki, T., Otosaka, S., Fujio, S., Yanagimoto, D., et al. (2005a). Benthic front and the Yamato Basin Bottom Water in the Japan Sea. J. Oceanogr. 61, 1047–1058. doi: 10.1007/s10872-006-0021-2
Senjyu, T., and Sudo, H. (1993). Water characteristics and circulation of the upper portion of the Japan Sea Proper Water. J. Mar. Syst. 4, 349–362. doi: 10.1016/0924-7963(93)90029-L
Senjyu, T., and Sudo, H. (1994). The upper portion of the Japan Sea Proper Water; its source and circulation as deduced from isopycnal analysis. J. Oceanogr. 50, 663–690. doi: 10.1007/BF02270499
Senjyu, T., and Sudo, H. (1996). Interannual variation of the upper portion of the Japan Sea Proper Water and its probable cause. J. Oceanogr. 52, 27–42. doi: 10.1007/BF02236531
Senjyu, T., and Yoshida, J. (2019). A note on the abyssal circulation in the Japan Sea: suggestion from rotating-tank experiments. La mer 56, 113–123. doi: 10.32211/lamer.56.3-4_113
Seung, Y. H., and Yoon, J. H. (1995). Some features of winter convection in the Japan Sea. J. Oceanogr. 51, 61–73. doi: 10.1007/BF02235936
Sudo, H. (1986). A note on the Japan Sea Proper Water. Prog. Oceanogr. 17, 313–336. doi: 10.1016/0079-6611(86)90052-2
Talley, L. D., Lobanov, V., Ponomarev, V., Salyuk, A., Tishchenko, P., Zhabin, I., et al. (2003). Deep convection and brine rejection in the Japan Sea. Geophys. Res. Lett. 30:1159. doi: 10.1029/2002GL016451
Uda, M. (1934). The results of simultaneous oceanographical investigations in the Japan Sea and its adjacent waters in May and June. J. Imp. Fish. Exp. Stn. 5, 57–190.
Watanabe, T., Simizu, D., Nishiuchi, K., Hasegawa, T., and Katoh, O. (2009). Surface current structure of the Tsushima Warm Current region in the Japan Sea derived by satellite-tracked surface drifters. J. Oceanogr. 65, 791–801. doi: 10.1007/s10872-009-0066-0
Wong, A. P. S., Bindoff, N. L., and Church, J. A. (1999). Large-scale freshening of intermediate waters in the Pacific and Indian Oceans. Nature 400, 440–443. doi: 10.1038/22733
Worthington, L. V. (1981). “The water masses of the world ocean: some results of a fine-scale census,” in Evolution of Physical Oceanography, eds B. A. Warren and C. Wunsch (Cambridge: M.I.T. Press), 42–69.
Yabe, I., Kawaguchi, Y., Wagawa, T., and Fujio, S. (2021). Anatomical study of Tsushima Warm Current system: determination of principal pathways and its variation. Prog. Oceanogr. 194:102590. doi: 10.1016/j.pocean.2021.102590
Yasunaka, S., and Hanawa, K. (2002). Regime shifts found in the Northern Hemisphere SST field. J. Meteor. Soc. Japan 80, 119–135. doi: 10.2151/jmsj.80.119
Yonetani, T. (1992a). Discontinuous changes of precipitation in Japan after 1900 detected by the Lepage test. J. Meteor. Soc. Japan 70, 95–104. doi: 10.2151/jmsj1965.70.1_95
Yonetani, T. (1992b). Discontinuous climate changes in Japan after 1900. J. Meteor. Soc. Japan 70, 1125–1135. doi: 10.2151/jmsj1965.70.6_1125
Keywords: global warming, deep water formation, water mass ventilation, Japan Sea, intermediate circulation, warming trends, Argo floats, long-term variations
Citation: Senjyu T (2022) Changes in Mid-Depth Water Mass Ventilation in the Japan Sea Deduced From Long-Term Spatiotemporal Variations of Warming Trends. Front. Mar. Sci. 8:766042. doi: 10.3389/fmars.2021.766042
Received: 28 August 2021; Accepted: 31 December 2021;
Published: 20 January 2022.
Edited by:
SungHyun Nam, Seoul National University, South KoreaReviewed by:
Yang-Ki Cho, Seoul National University, South KoreaShijian Hu, Institute of Oceanology, Chinese Academy of Sciences (CAS), China
Copyright © 2022 Senjyu. This is an open-access article distributed under the terms of the Creative Commons Attribution License (CC BY). The use, distribution or reproduction in other forums is permitted, provided the original author(s) and the copyright owner(s) are credited and that the original publication in this journal is cited, in accordance with accepted academic practice. No use, distribution or reproduction is permitted which does not comply with these terms.
*Correspondence: Tomoharu Senjyu, c2Vuanl1QHJpYW0ua3l1c2h1LXUuYWMuanA=