
94% of researchers rate our articles as excellent or good
Learn more about the work of our research integrity team to safeguard the quality of each article we publish.
Find out more
ORIGINAL RESEARCH article
Front. Mar. Sci. , 16 December 2021
Sec. Marine Biogeochemistry
Volume 8 - 2021 | https://doi.org/10.3389/fmars.2021.757529
 Haijiao Liu1
 Yuyao Song1
 Xiaodong Zhang1
 Guicheng Zhang1
 Chao Wu1
 Xingzhou Wang1
 Satheeswaran Thangaraj2,3,4
 Dongxiao Wang5,6Ju Chen7
 Jun Sun1,2,3*
To examine the spatial pattern and controlling factors of the primary productivity (PP) of phytoplankton in the eastern Indian Ocean (EIO), deck-incubation carbon fixation (a 14C tracer technique) and the related hydrographic properties were measured at 15 locations during the pre-summer monsoon season (February–April 2017). There are knowledge gaps in the field observations of PP in the EIO. The estimated daily carbon production rates integrated over the photic zone ranged from 113 to 817 mgC m–2 d–1, with a mean of 522 mgC m–2 d–1. The mixed-layer integrated primary production (MLD-PP) ranged from 29.0 to 303.7 mgC m–2 d–1 (mean: 177.2 mgC m–2 d–1). The contribution of MLD-PP to the photic zone-integrated PP (PZI-PP) varied between 19 and 51% (mean: 36%). Strong spatial variability in the carbon fixation rates was found in the study region. Specifically, the surface primary production rates were relatively higher in the Bay of Bengal domain affected by riverine flux and lower in the equatorial domain owing to the presence of intermonsoonal Wyrtki jets, which were characterized by a depression of thermocline and nitracline. The PZI-PP exhibited a linear (positive) relationship with nutrient values, but with no significance, indicating a partial control of macronutrients and a light limitation of carbon fixation. As evident from the vertical profiles, the primary production process mainly occurred above the nitracline depth and at high photosynthetic efficiency. Phytoplankton (>5 μm), including dinoflagellates, Trichodesmium, coccolithophores, and dissolved nutrients, are thought to have been correlated with primary production during the study period. The measured on-deck biological data of our study allow for a general understanding of the trends in PP in the survey area of the EIO and can be incorporated into global primary production models.
Phytoplankton photosynthesis is a crucial and highly variable step of the global carbon cycle and marine ecosystems. Primary marine primary production contributes to nearly 50% of the bulk photosynthetic carbon of the planet and is closely related to global fishery catches (Saba et al., 2011; Behrenfeld et al., 2001; Chassot et al., 2010). Net primary productivity (NPP) is closely related to global ocean biogeochemical cycles (Buitenhuis et al., 2013). Primary productivity (PP) has been used as an ideal indicator of eutrophication in marine ecosystems (Smith, 2006). In addition, marine phytoplankton productivity has been found to be an important factor for the trace elements contributing to atmospheric deposition (Blazina et al., 2017). In general, phytoplankton productivity and biomass have been linked to abiotic stressors such as water stability, nutrient status, and biotic interactions (e.g., consumer populations and grazing) at different spatial scales (Bunt, 1975; Bermejo et al., 2018; Morrow et al., 2018; Gusha et al., 2019). In addition, the photosynthetic performance of different primary producers has a significant influence on the community NPP (Petrou and Ralph, 2011). On a global scale, marine NPP can be estimated using a variety of ocean color models (Behrenfeld et al., 2006; Chassot et al., 2010; Saba et al., 2011). However, these indirect productivity estimates show large uncertainties between various models (Friedrichs et al., 2009). In situ measurement, which is a more accurate method, can provide vertical information about seawater primary production, and increasing demands have been made on its role in the application and calibration of numerical simulation. Understanding the dynamics and controlling factors of the spatial–temporal distribution of primary production is a fundamental issue for the higher trophic levels in aquatic systems.
For shipboard incubations, the 14C uptake, oxygen evolution (18O and light/dark bottle method), and chlorophyll a (Chl a) fluorescence are currently used to quantify primary production and photosynthesis (Grande et al., 1989; Krause and Weis, 1991; Juneau and Harrison, 2005). There are some ambiguities in various methods stemming from many subjects and impersonal aspects (Laws et al., 2000). Among them is the assimilation of the H14CO3– method, which can generate a good estimation of the PP rate due to significant improvements (Grande et al., 1989). This accuracy was already shown long ago by many studies involving the measurement of PP [(Grande et al., 1989), and reference therein]. Thus, we applied the H14CO3– assimilation method for the NPP estimates in this study. Specifically, the 14C methodology also contains different techniques, such as membrane filtration and decontamination procedures, which consider cell damage and the retention of isotopes, which can produce varying degrees of error (Lean and Burnison, 1979).
The estimation of photosynthetic production is an essential process for interpreting the biological activity of oligotrophic oceans. The eastern Indian Ocean (EIO) along the boundary of the Indian Ocean (Sumatra) and its western counterpart (the Arabian Sea) are forced by seasonally reversing monsoonal systems. Sea surface winds drive the variability of near-surface circulations, such as the equatorial jets (EJs), South Equatorial Current (SEC), Indonesia Throughflow (ITF), westward Rossby waves, and eddy kinetic energy (Wyrtki, 1973; Wyrtki et al., 1976; Peng et al., 2015; Chen et al., 2017, 2018; Cheng et al., 2018). Most of them can be detected in all seasons, except for the EJs, which only occur in spring and fall. These oceanographic processes, such as diverse eddy activity and the high-saline equatorial water transported from the Arabian Sea, alter biological production in the EIO through regulating the growth-limiting factors like light and nutrient sources (Kumar et al., 2007; Muraleedharan et al., 2007; Liu et al., 2020).
The global NPP has previously been estimated in several studies using satellite-derived algorithms, observations, and models under global climate process scenarios (Carr et al., 2006; Buitenhuis et al., 2013; Ma et al., 2014; Siegel et al., 2016). Driven by an intense ocean with subsequent seawater stratification over the tropical Indian Ocean, the PP is expected to decrease, which was projected using future climatological models (Chassot et al., 2010; Roxy et al., 2016). In the past decades, the primary production in the northern sector of the Indian Ocean has mainly been conducted in the Arabian Sea, as has been reported in many previous studies (Ryther et al., 1966; Owens et al., 1993; Barber et al., 2001; Sarma et al., 2003; Bhavya et al., 2017; Vase et al., 2018), as well as the Bay of Bengal (BoB) (Madhupratap et al., 2003; Prasanna Kumar et al., 2004; Kumar et al., 2007; Muraleedharan et al., 2007; Sarma et al., 2020). There is relatively limited information on the biological productivity information from the EIO. Spring primary production along two latitudinal sections located in the eastern and western Indian Ocean was reported by Dalabehara and Sarma (2020). However, large spatial coverage variabilities for primary production have been reported in these previous studies. Thus, there are knowledge gaps from at least two aspects in the current study area: the observation method and the survey area coverage. In other words, the in situ observational studies based on PP measurements were never conducted across the oligotrophic EIO using the sensitive 14C tracer method. We, therefore, hypothesized that the level of carbon fixation by phytoplankton was spatially varied in this region and that near-surface circulations and phytoplankton composition were dependent on the study area of the EIO. In order to examine the spatial variability and evaluate the potential controlling factors of primary production, in situ incubations at 15 stations were performed during the spring period (February–April 2017) in the EIO. Specifically, the purposes of this study were (i) to investigate the PP level and its spatial variability across the dynamic study area; (ii) to study the relevant biogeochemical factors, including the hydrographic characteristics, phytoplankton community, particulate organic carbon (POC) concentration, and inorganic nutrients; and (iii) to explore the underlying mechanisms affecting the spatial biogeography of primary production.
In situ incubations of PP were executed at 15 selected morning stations from the EIO between February 27 and April 27, 2017. In this study, we define the euphotic depth (Zeu, m) as the depth with 1% intensity of the surface light intensity. Field seawater for the experiments was collected at five optical depths (100, 50, 25, 10, and 1% of the surface light penetration) determined using a domestic Secchi disk, and the corresponding physical depths (actual depths) were acquired using light model formulas previously developed (Brewin et al., 2017; Xie et al., 2020). The depth of the euphotic zone (Zeu) is usually 3.5 times the Secchi disk depth (Lee et al., 2018). The selected stations spanning the EIO were characterized by varied oceanographic settings. These stations are located in four domains: south of the equator (Sts. I402b, I317, and I707), equatorial Indian Ocean (Sts. I308, I403, I408, and I411), BoB region (Sts. I208, I202, and I108), and Sumatra Basin (the eastern boundary of the Indian Ocean) (Sts. I103, OBS1, I415, I503, and I507) (Figure 1).
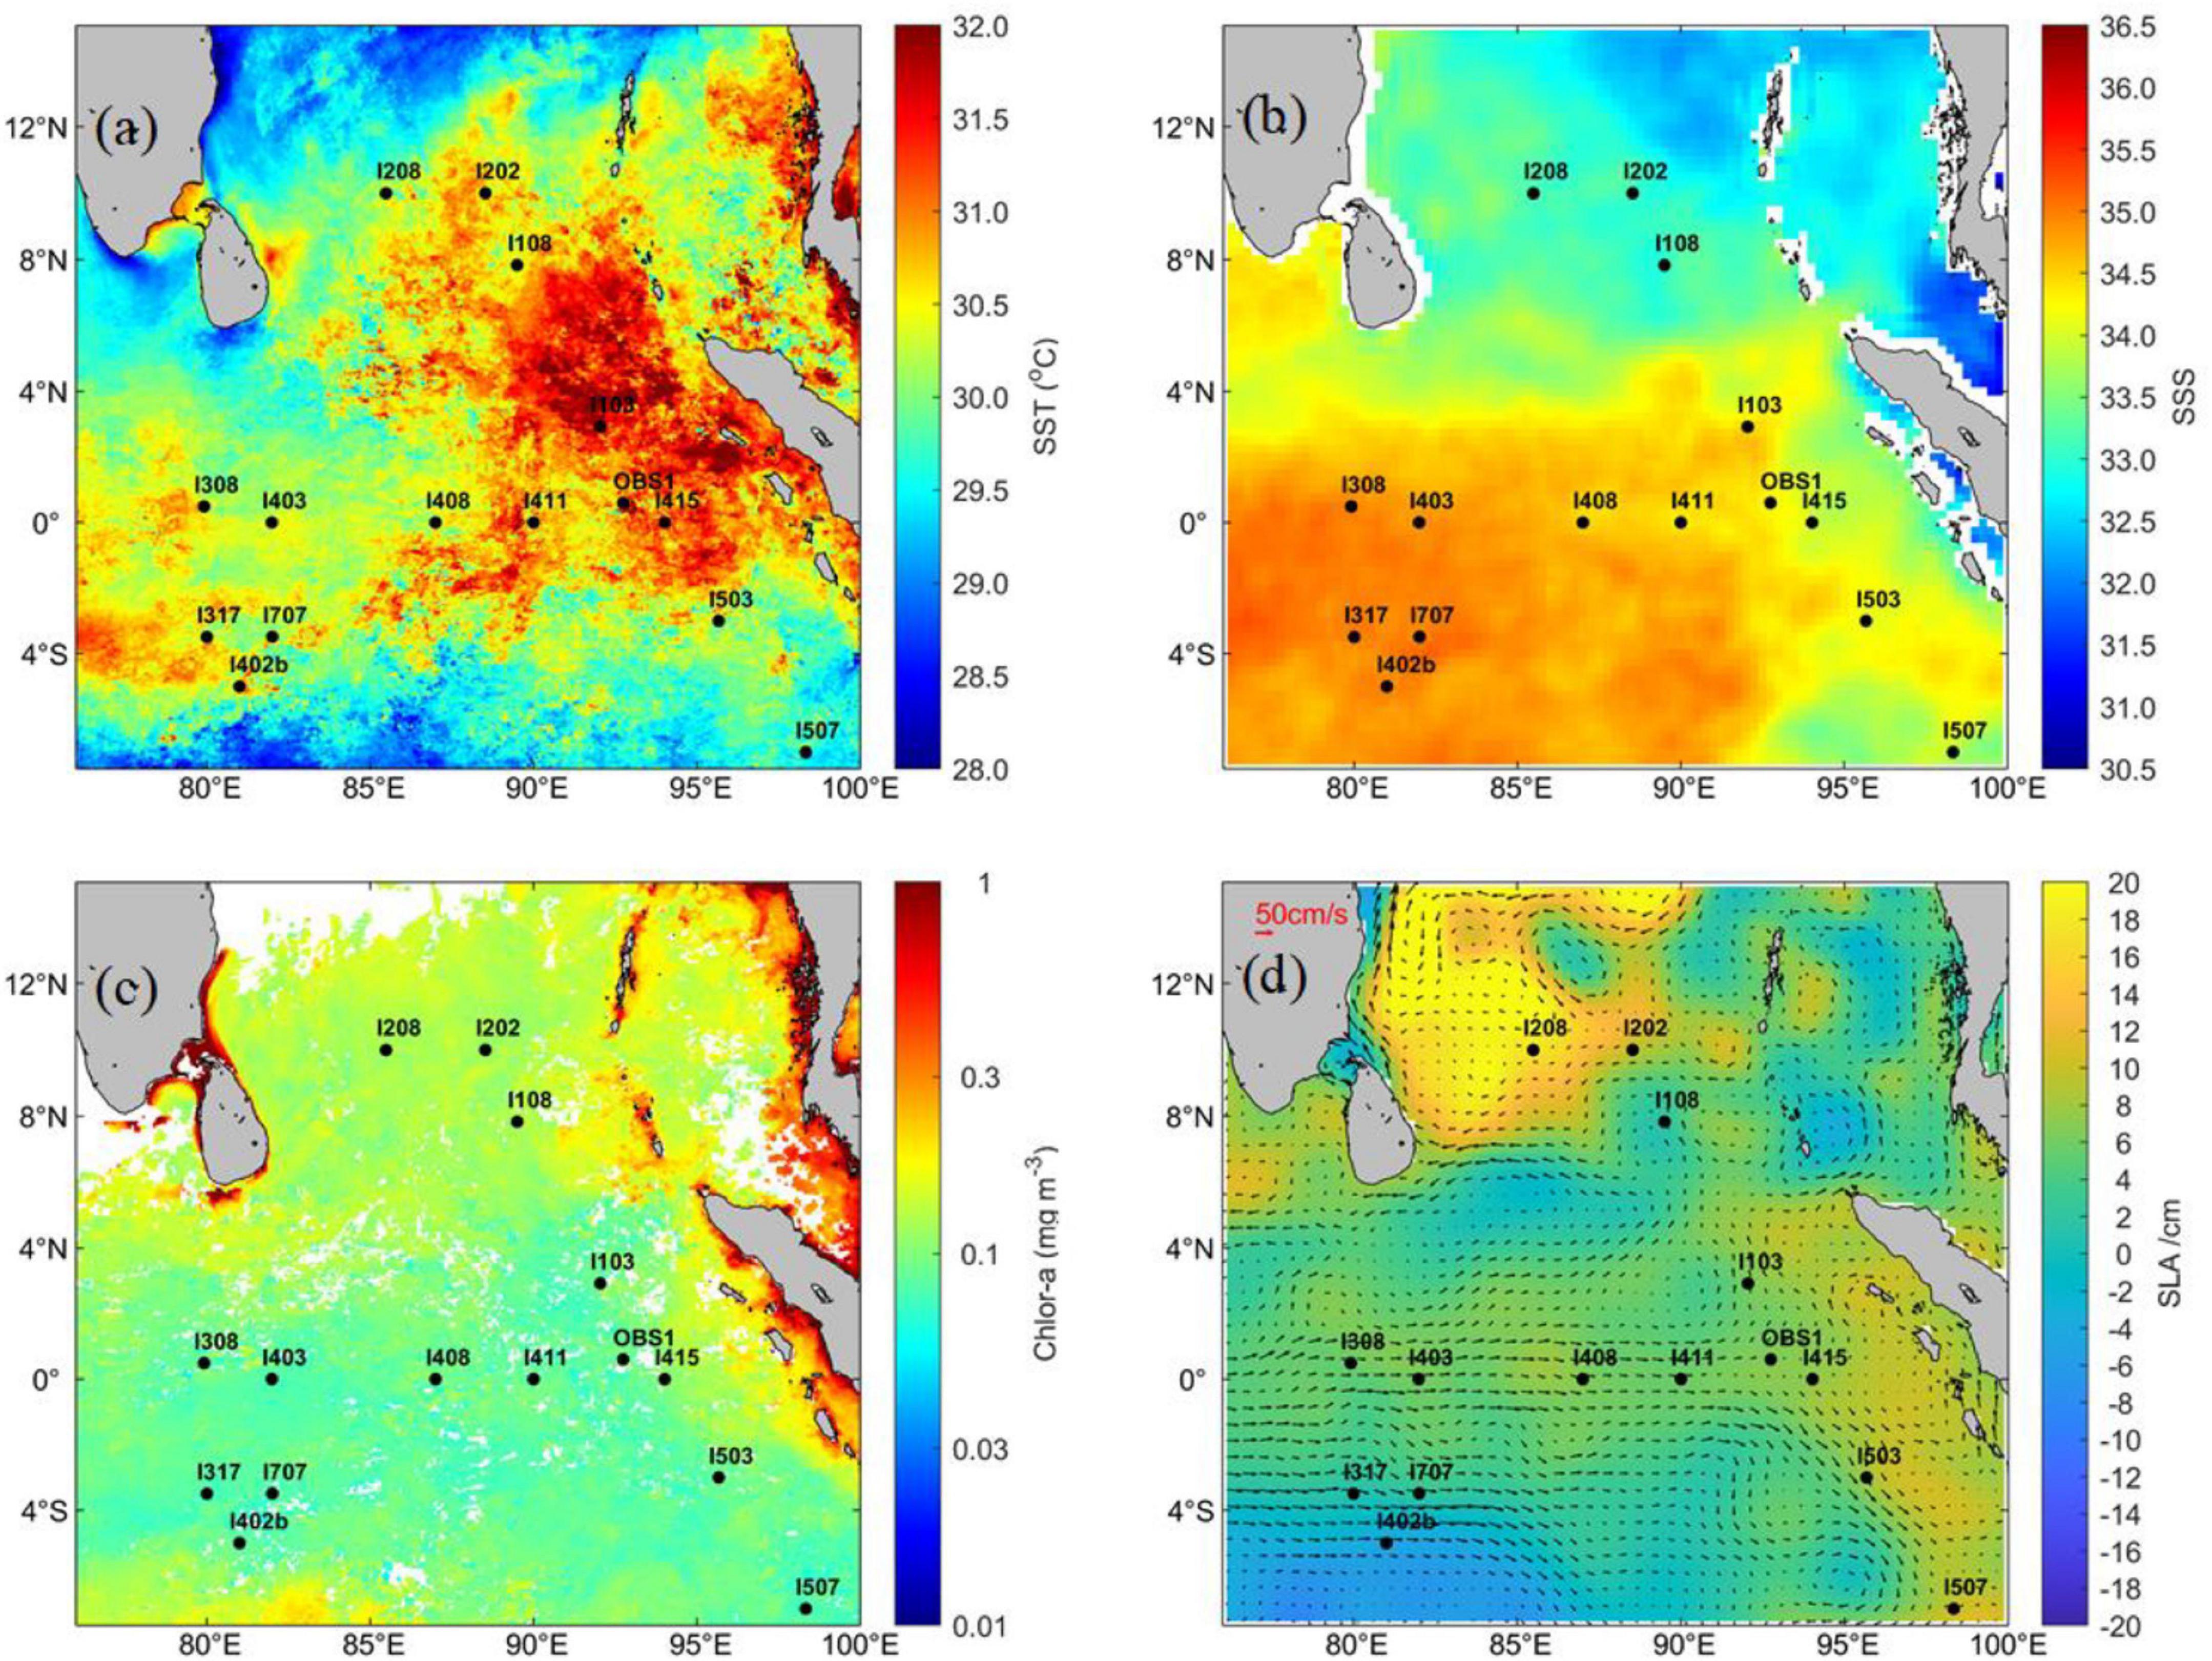
Figure 1. Map area with station locations overlaid on monthly mean (a) sea surface temperature, (b) sea surface salinity, (c) sea surface Chl a, and (d) sea-level anomaly by color shading and geostrophic currents by arrows during April 2017.
The depth of the mixed layer (MLD) was defined as the depth at which the density was 0.125 kg m–3 higher than that of the surface, and the nitracline depth was estimated as the depth with a nitrate concentration of 1 μM (Dalabehara and Sarma, 2020).
Parameters, including the temperature and salinity, Chl a, inorganic nutrients, and POC, were acquired during the investigation. Horizontal and vertical profiles of temperature and salinity were recorded at each station using a Seabird SBE 911 CTD assembly equipped with 12-L Niskin bottles. The seawater samples (1000 ml) used for measuring the Chl a concentration were filtered using 25-mm-diameter Whatman GF/F glass fiber filters and then covered with aluminum foil under freezing conditions (−20°C). For Chl a determination, the filters were extracted using 5 ml of 90% acetone at −20°C under dark conditions. The Chl a extractions were measured fluorometrically using a Turner-Designs Trilogy fluorometer (Sunnyvale, CA, United States) according to a previous publication (Parsons et al., 1984). For inorganic nutrient analysis, 100 ml of seawater was collected onboard. The concentration values of five nutrients (NOx: NO3-N + NO2-N, NH4-N, PO4-P, and SiO3-Si) were determined using an Autoanalyzer 3-AA3 (Bran + Luebbe, Norderstedt, Germany). The nutrient detection limits were 0.015 ± 0.010 μM (NO3-N), 0.003 ± 0.0015 μM (NO2-N), 0.04 ± 0.034 μM (NH4-N), 0.024 ± 0.020 μM (PO4-P), and 0.030 ± 0.016 μM (SiO3-Si). The principal nutrient methods were performed according to earlier publications (Ehrhardt et al., 1976; Pai et al., 2001). Seawater samples (1000 ml) used for measuring the POC were filtered onto pre-combusted (450°C, 2 h) Whatman GF/F glass fiber filters (25 mm in diameter). Then, the POC filters were fumed for 4 h to remove all inorganic carbon, and the POC concentrations were determined using a CHN analyzer (Costech Analytical Technologies Inc., United States). The filtration process and follow-up determination details are presented in our published work from the same cruise (Liu et al., 2020).
The seawater phytoplankton population composition and cell abundance were determined via microscopic observations at ×200 or ×400 magnification. Seawater subsamples of 1,000 ml of each light depth were collected in plastic bottles and fixed using formaldehyde solution at a final concentration of 1–2%. In the laboratory, 1,000 ml subsamples were concentrated into 100 ml by siphoning and settled in an Uthermöhl sedimentation column for 24 h. Then, species recognition and cell enumeration were processed using an inverted microscope (Motic, AE2000). The water samples (500 ml) used for the examination of the calcifying coccolithophores were gently filtered through a mixed cellulose membrane with a pore size of 0.22 μm (25 mm diameter). The filters were then air-dried in Petri dishes. Subsequently, the filters were fixed onto glass slides until microscopic analysis. Finally, coccolithophore assemblages and their detached coccoliths were identified and enumerated using a polarized microscope (Motic, BA300POL), which have been described in detail in our previous work (Liu et al., 2020).
The seawater carbon fixation rates were determined using the 14C uptake method and natural phytoplankton assemblages. Samples for on-deck incubation were collected in the morning from five optical depths corresponding to 100, 50, 25, 10, and 1% of the surface light levels, as indirectly determined by seawater transparency using a Secchi disk. During the incubation, 20 μCi of NaH14CO3 was inoculated immediately into a 200 ml sample of water in triplicate light and dark polycarbonate bottles (250 ml), and the samples were wrapped with varied neutral meshes (simulating light attenuation) and incubated for 6 h from 10:00 to 16:00 in an on-deck incubator under natural light conditions. The temperature of the on-deck incubator was controlled via circulated surface seawater (5 m). After incubation, all samples were terminated by gentle filtration through pre-combusted (450°C, 4 h) Whatman GF/F membranes and stored at −20°C until further analysis. The micro-diffusion technique was applied to measure the organic carbon fixation (primary production) and inorganic carbon fixation (calcification) simultaneously (Paasche and Brubak, 1994). Detailed information on the incubation and calcification rates has been reported in our previous paper (Liu et al., 2020).
It should be noted that the 14C-method was used for POC measurement in our study and that the dissolved organic carbon (DOC) exuded into the seawater was not considered. Thus, the current evaluation of primary production is likely to be underestimated. A large proportion of primary production in oligotrophic oceans, such as the Indian Ocean, exists in the form of DOC, which is primarily produced by picoplankton (Sarma et al., 2020). Since DOC production was not considered in our study, picoplankton was not analyzed in this study.
The monthly mean sea surface temperature (SST) and the Chl a over the study area were derived from the standard monthly Level-3 products of the Moderate Resolution Imaging Spectroradiometer onboard Aqua satellite provided by the NASA’s Ocean Colour Web1. The spatial resolution is 4 km. The monthly SMAP salinity data (0.25° × 0.25° resolution) were obtained from Remote Sensing Systems.2 Monthly gridded sea-level anomalies (SLA) and surface geostrophic currents with a spatial resolution of 1/4° were obtained from the merged multi-altimetry products of TOPEX/Poseidon (T/P), Jason-1, Jason-2, ENVISAT, GFO, and ERS-1/2, with tidal corrections (provided by the Copernicus Marine Environmental Monitoring Service3). The significance of the primary production rates among the various domains was tested using one-way ANOVA. Non-metric multidimensional scaling (NMDS) analysis based on the Bray–Curtis similarity matrix was carried out to reveal the spatial variations of phytoplankton groups using the PRIMER v6.0. Before the analysis, all phytoplankton cell abundance data were after log10-transformed. Pearson’s correlations and redundancy analysis (RDA) between primary production and environmental variables were computed using the “ggcorrplot” package and visualized using the “gglpot2” and “ggthemes” packages in R software (v3.6.2). A statistical significance was set at p < 0.05.
The monthly mean (April 2017) SST, salinity, Chl a, and SLA overlaid with the geostrophic currents in the EIO are shown in Figure 1. Seawater with a relatively low surface temperature and salinity occupied the northern area of the EIO (Figures 1a,b). The surface temperature was extremely high (>31°C) along the Sumatra Basin (Figure 1a). The surface Chl a was generally low (<0.2 mg m–3) among the stations, with relatively higher values in the north (north of 4°N, >0.1 mg m–3) than in the south (south of 4°N, <0.1 mg m–3) (Figure 1c). Variations in SLA showed that a large anticyclonic eddy with extremely high values (>14 cm) located close to 10°N, 84°E, and St. I108 was included in this eddy area (Figure 1d). In addition, SLA along the Sumatra Basin displayed relatively high values of approximately 10 cm. The lowest SLA was observed in the southwest stations of the equator.
In the water column, moderate temperature and salinity ranges were observed (12–30°C and 32–35 PSU, respectively) (Figure 2). The temperature isolines fluctuated slightly below the thermocline depth (approximately 50–75 m). The lowest salinity water (<33 PSU) was present in the northern region near the BoB, followed by the eastern boundary of the study area (Sumatra Basin). The vertical structure of the temperature suggests that the upper 30 m of the water column was relatively stable. However, the depth of the 29°C isotherms was deeper in the eastern equatorial region (Sts. I103, OBS1, and I415) and allowed to reach 25 m in the BoB domain (Figure 2). The upsloping of cooler waters (<20°C) was observed from 100 m depth onward, close to the Sumatra Basin associated with high salinity (Figure 2). Lower salinity values (around 33 PSU) were observed in the upper 30 m of the water column in the BoB domain, followed by the Sumatra Basin than in the other domains of the EIO (Figure 2). The euphotic depth varied between 82 and 147 m with shallow depth in the BoB station (e.g., St. I108) compared with the other regions in the study area. Variable mixing was confirmed from the MLD depth, which varied between 6 and 46 m with at the mean value of 28 m with shallow values in the BoB region (6–19 m). The Chl a value in the upper 30 m was mostly <0.2 mg m–3 (ranges: 0.08–0.23, an average of 0.14 mg m–3) except for Sts. I507 and OBS1 (∼0.22 mg m–3).
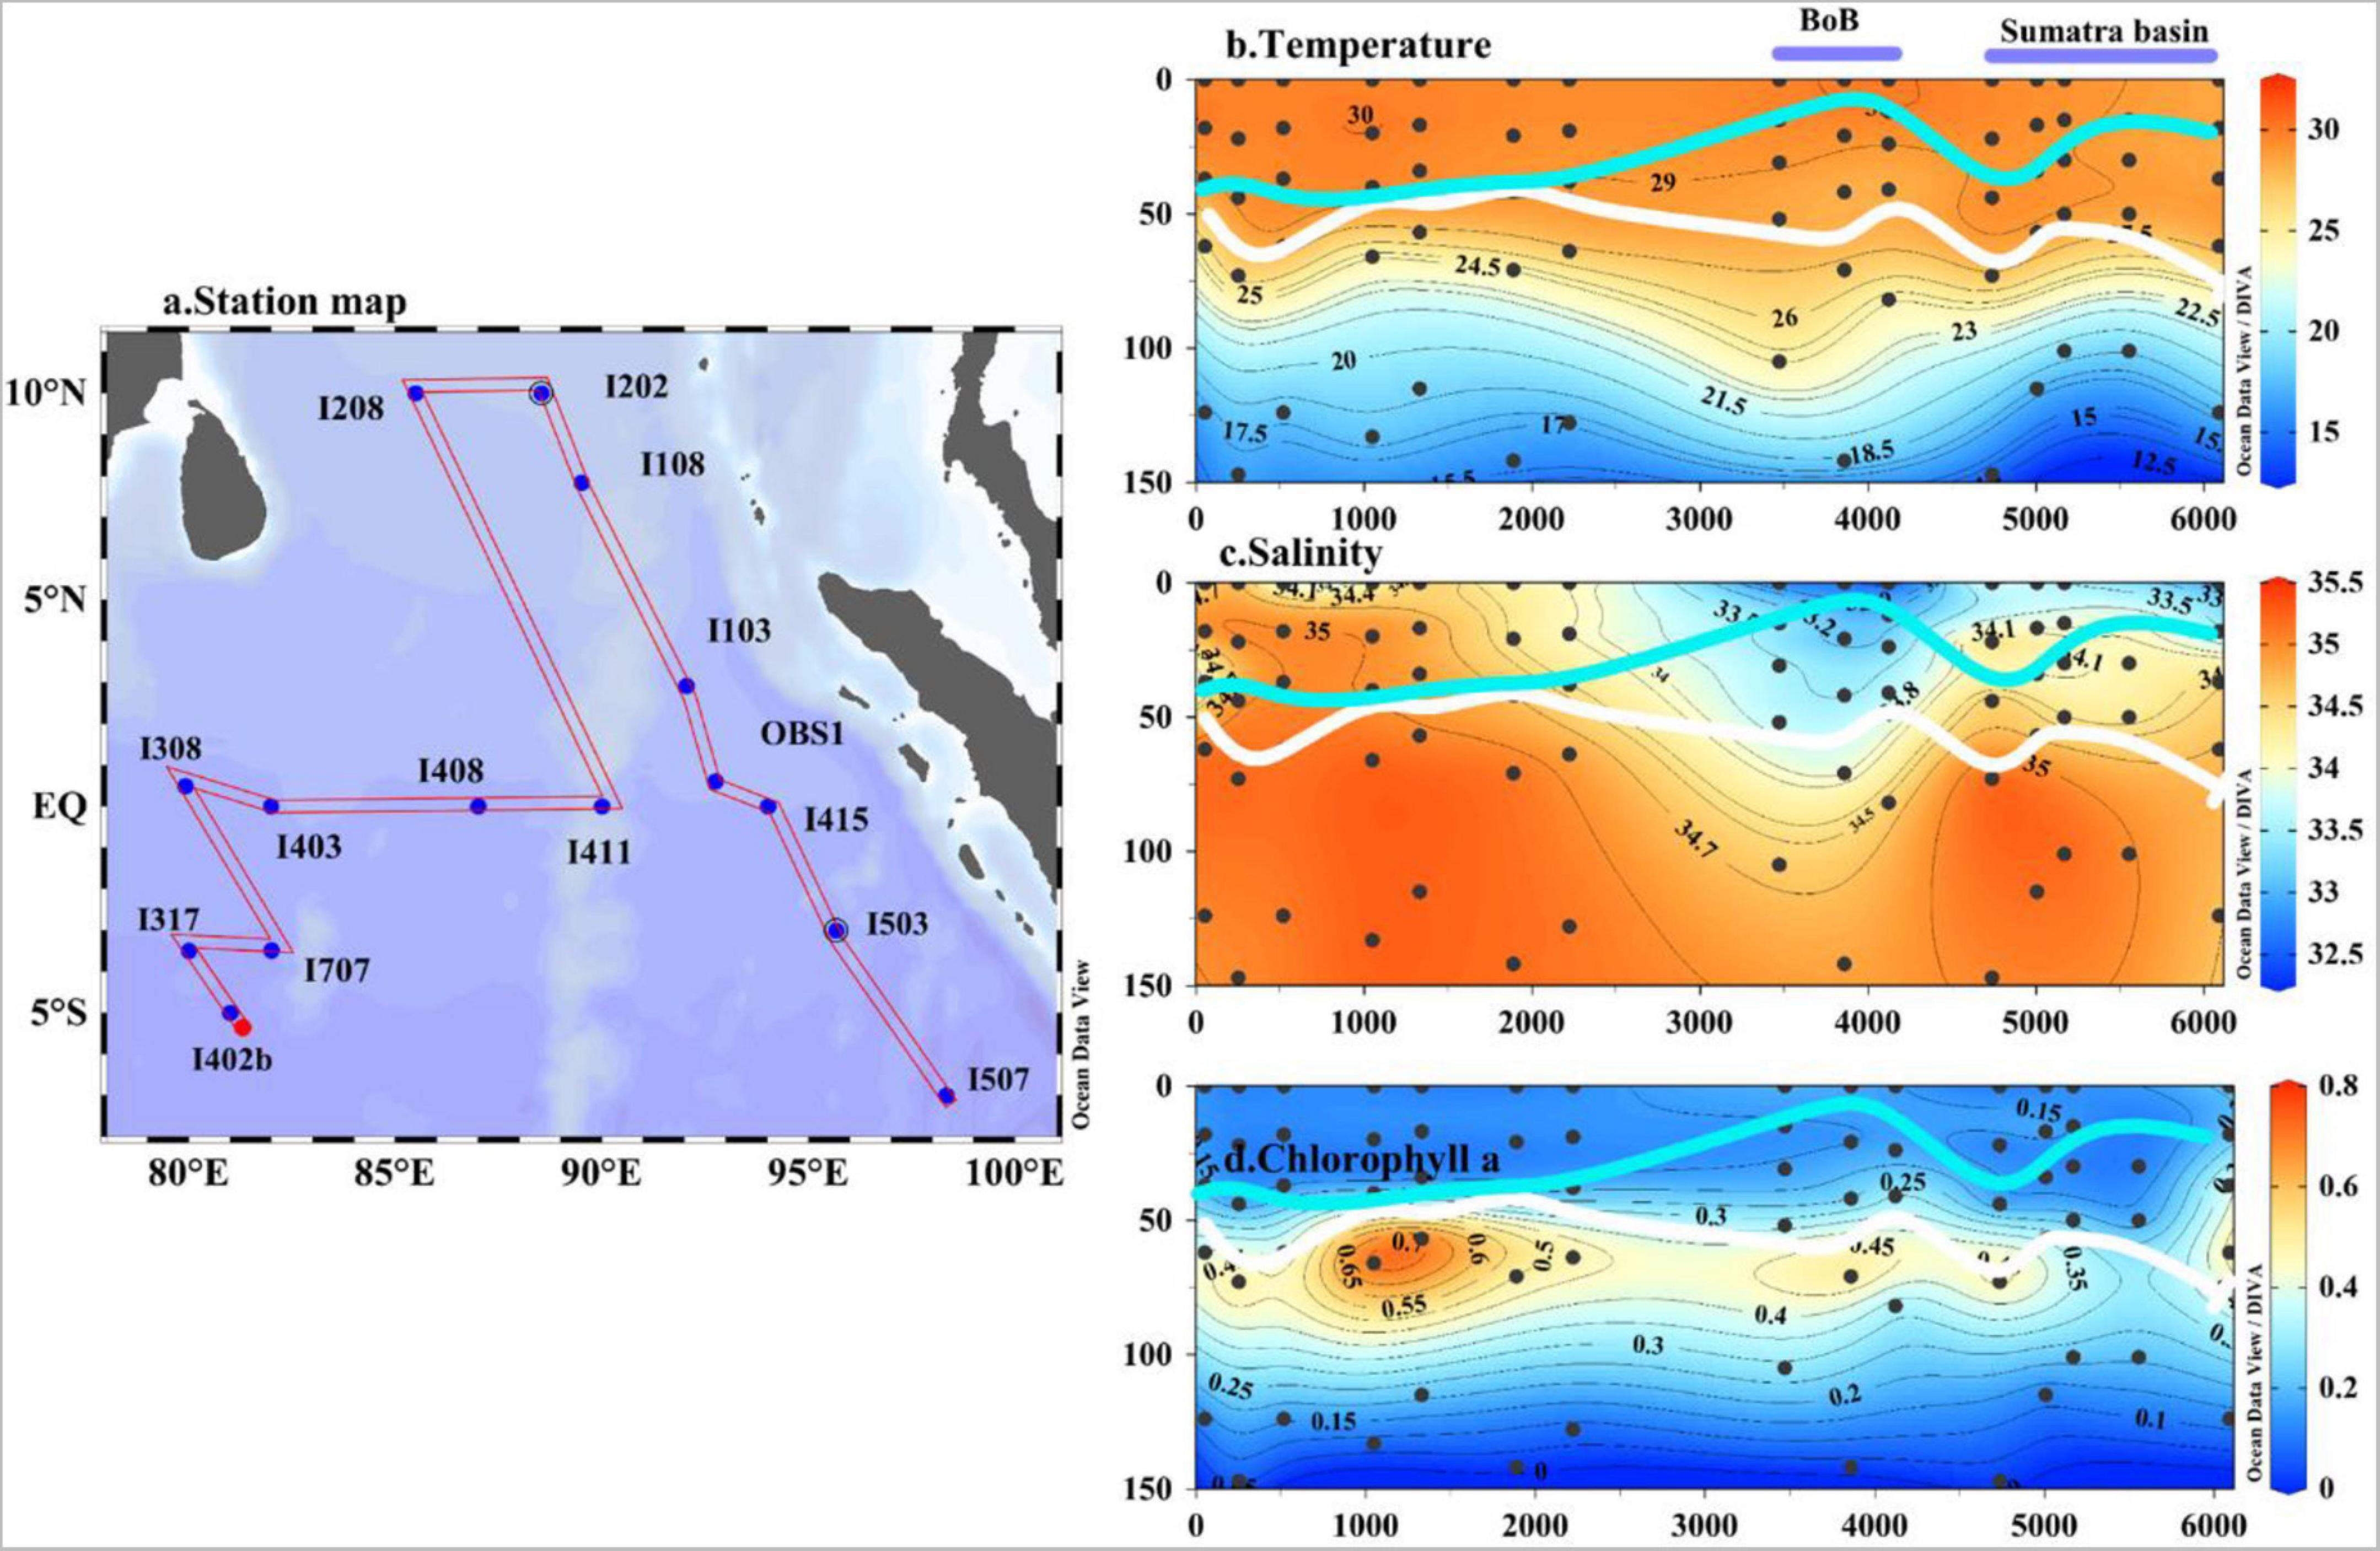
Figure 2. The locations of the primary production stations (a) and temperature (b, °C), salinity (c), and chlorophyll a (d, mg m–3) in the upper 150 m along the cruise track from the western (St. I402b) to the eastern region (St. I507) of the eastern Indian Ocean during the 2017 spring cruise. The white line and the blue line show the depth of nitracline and mixed layer (MLD), respectively.
The nitracline depth varied between 45 and 80 m (average 60 m) with shallower depths in the BoB domain St. I108. The mean of MLD-NOx and MLD-SiO3 varied between 0.14 and 0.60 μM (mean 0.33 μM) and 0.66 and 1.56 μM (mean 0.98 μM), both with higher values in the BoB domain (mean 0.39 and 1.32 μM, respectively) than in the other domains (Figures 3A,C). However, MLD-PO4 was not consistent with them as the mean value in BoB (0.02 μM) was lower than that in the other domains (0.05 μM) (Figure 3B). Most of MLD-Chl a values fluctuated around 0.12 mg m−3 (Figure 3D).
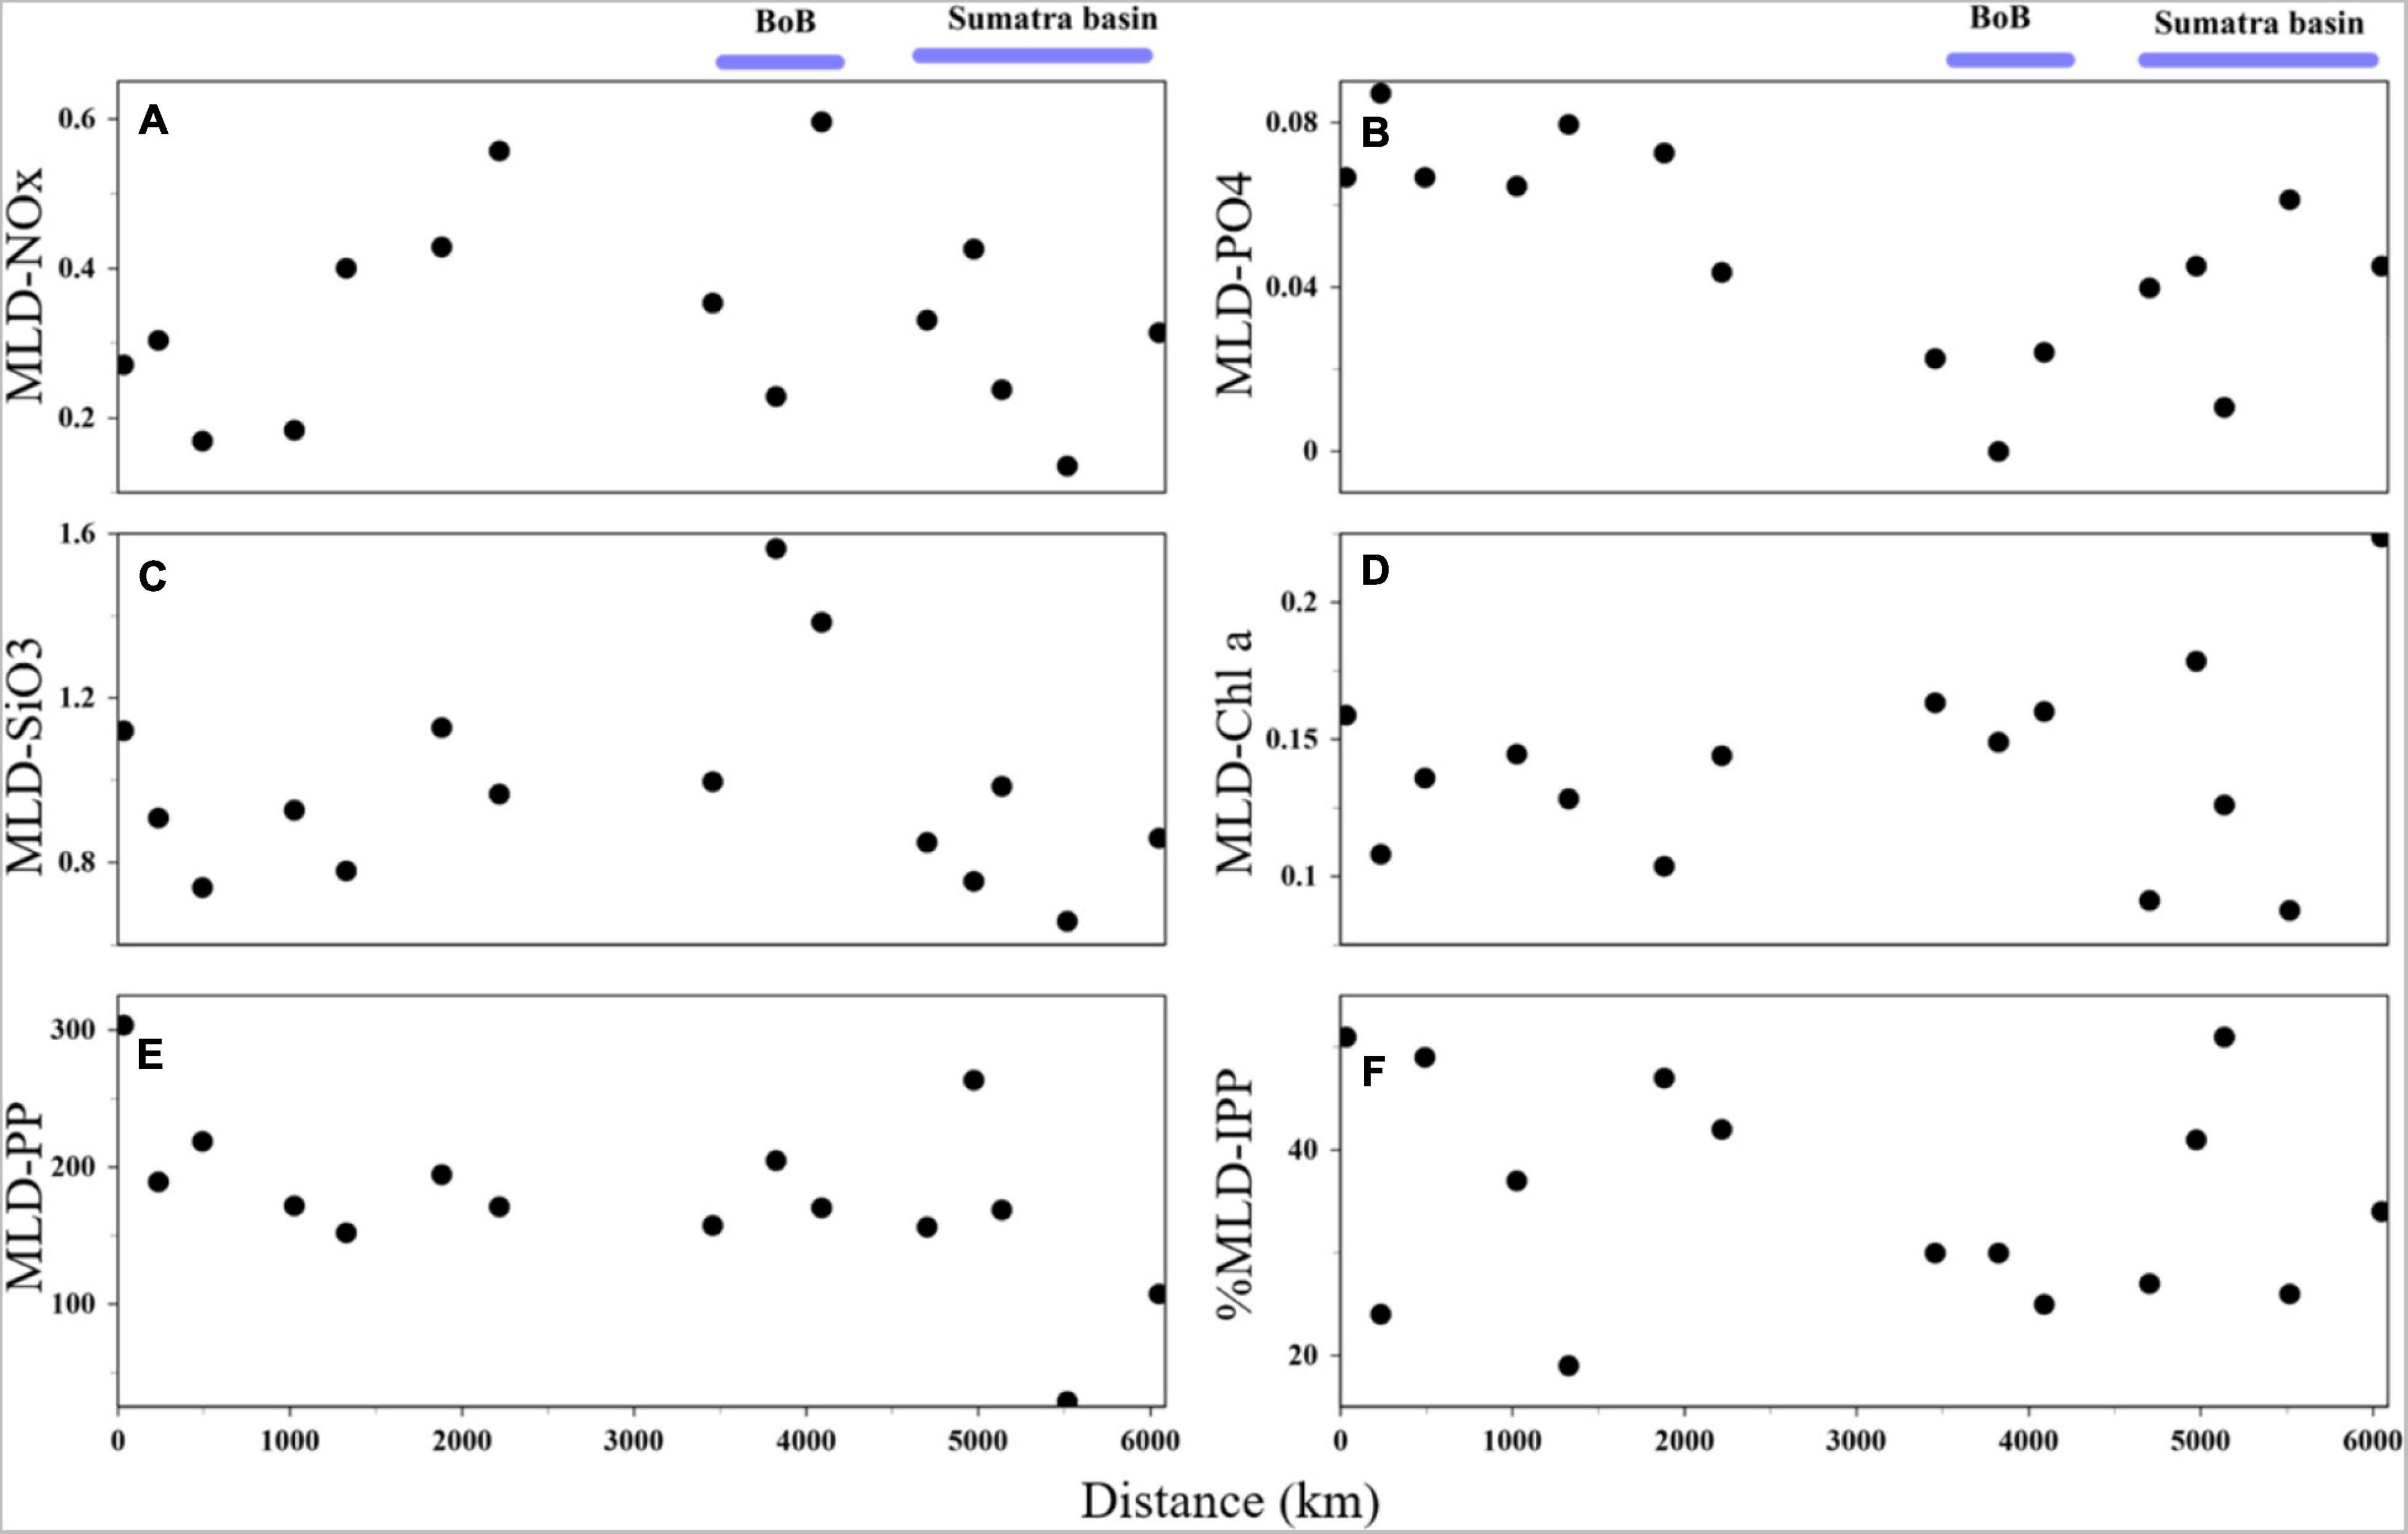
Figure 3. Spatial variations of mixed-layer depth (MLD) (A) averaged NOx (μM), (B) averaged phosphate (μM), (C) averaged silicate (μM), (D) averaged Chl a (mg m–3), (E) integrated primary production (mgC m–2 d–1), and (F) contribution ratio of MLD-PP to the euphotic zone-integrated PP.
Major non-calcifying phytoplankton (>5 μm) and calcifying coccolithophore cell abundance are listed in Table 1; the former group mainly includes diatoms, dinoflagellates, chrysophytes, and colony-forming cyanobacteria (counted as trichomes in Trichodesmium). The total abundance of diatoms, dinoflagellates, and chrysophytes ranged from 19 to 2218 cells/L, with a mean value of 178 cells/L in the water column. The mean abundance of diatoms and dinoflagellates accounted for 66 and 31% of the total abundance, respectively. Trichodesmium trichomes and coccolithophores ranged from 0 to 866 trichomes/L and 0 to 43,694 cells/L, with mean values of 36 trichomes/L and 1,0821 cells/L, respectively.
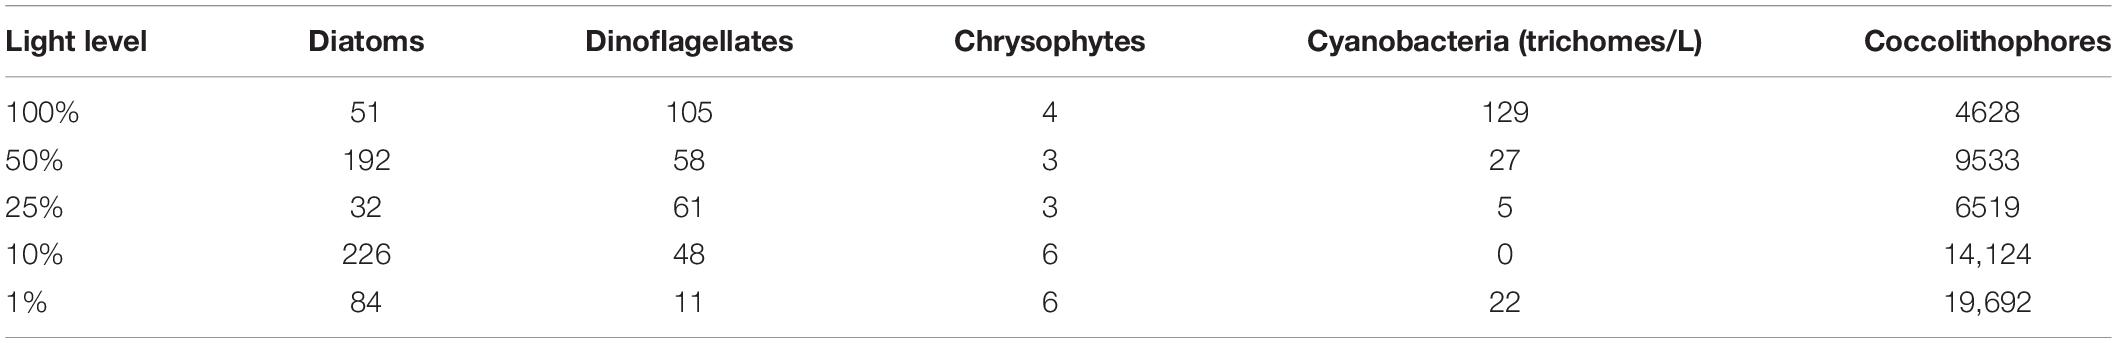
Table 1. Major non-calcifying phytoplankton (>5 μm) and calcifying coccolithophores composition (mean cell abundance, unit: cells/L) among the 15 stations in the eastern Indian Ocean in 2017.
The depth-integrated phytoplankton abundance and their vertical sections are presented in Figures 4, 5, respectively. The phytoplankton groups had varied distributions in the study area. Large phytoplankton, such as diatoms and dinoflagellates, showed preferences in deeper and upper water, respectively, and were mainly distributed in the upper water of west and east of the equator, respectively. Chrysophytes, mainly represented by Dictyocha fibula, were concentrated in the lower depth of the north area and upper water west of the equator. A high abundance of Trichodesmium trichomes was observed in the surface water of both the northern area and east of the equator. The calcifying coccolithophores were mainly distributed throughout the deeper depth, peaking in the lower-photic zone south of the equator and along the Sumatra Basin. Their abundance was nearly absent in the surface water of the entire study area. From the NMDS analysis of the phytoplankton assemblage composition among the four domains, samples in the BoB and Sumatra Basins were almost clustered together in their domain, while the other two domains (equator and 5°S) were almost overlying in their community composition (Figure 6).
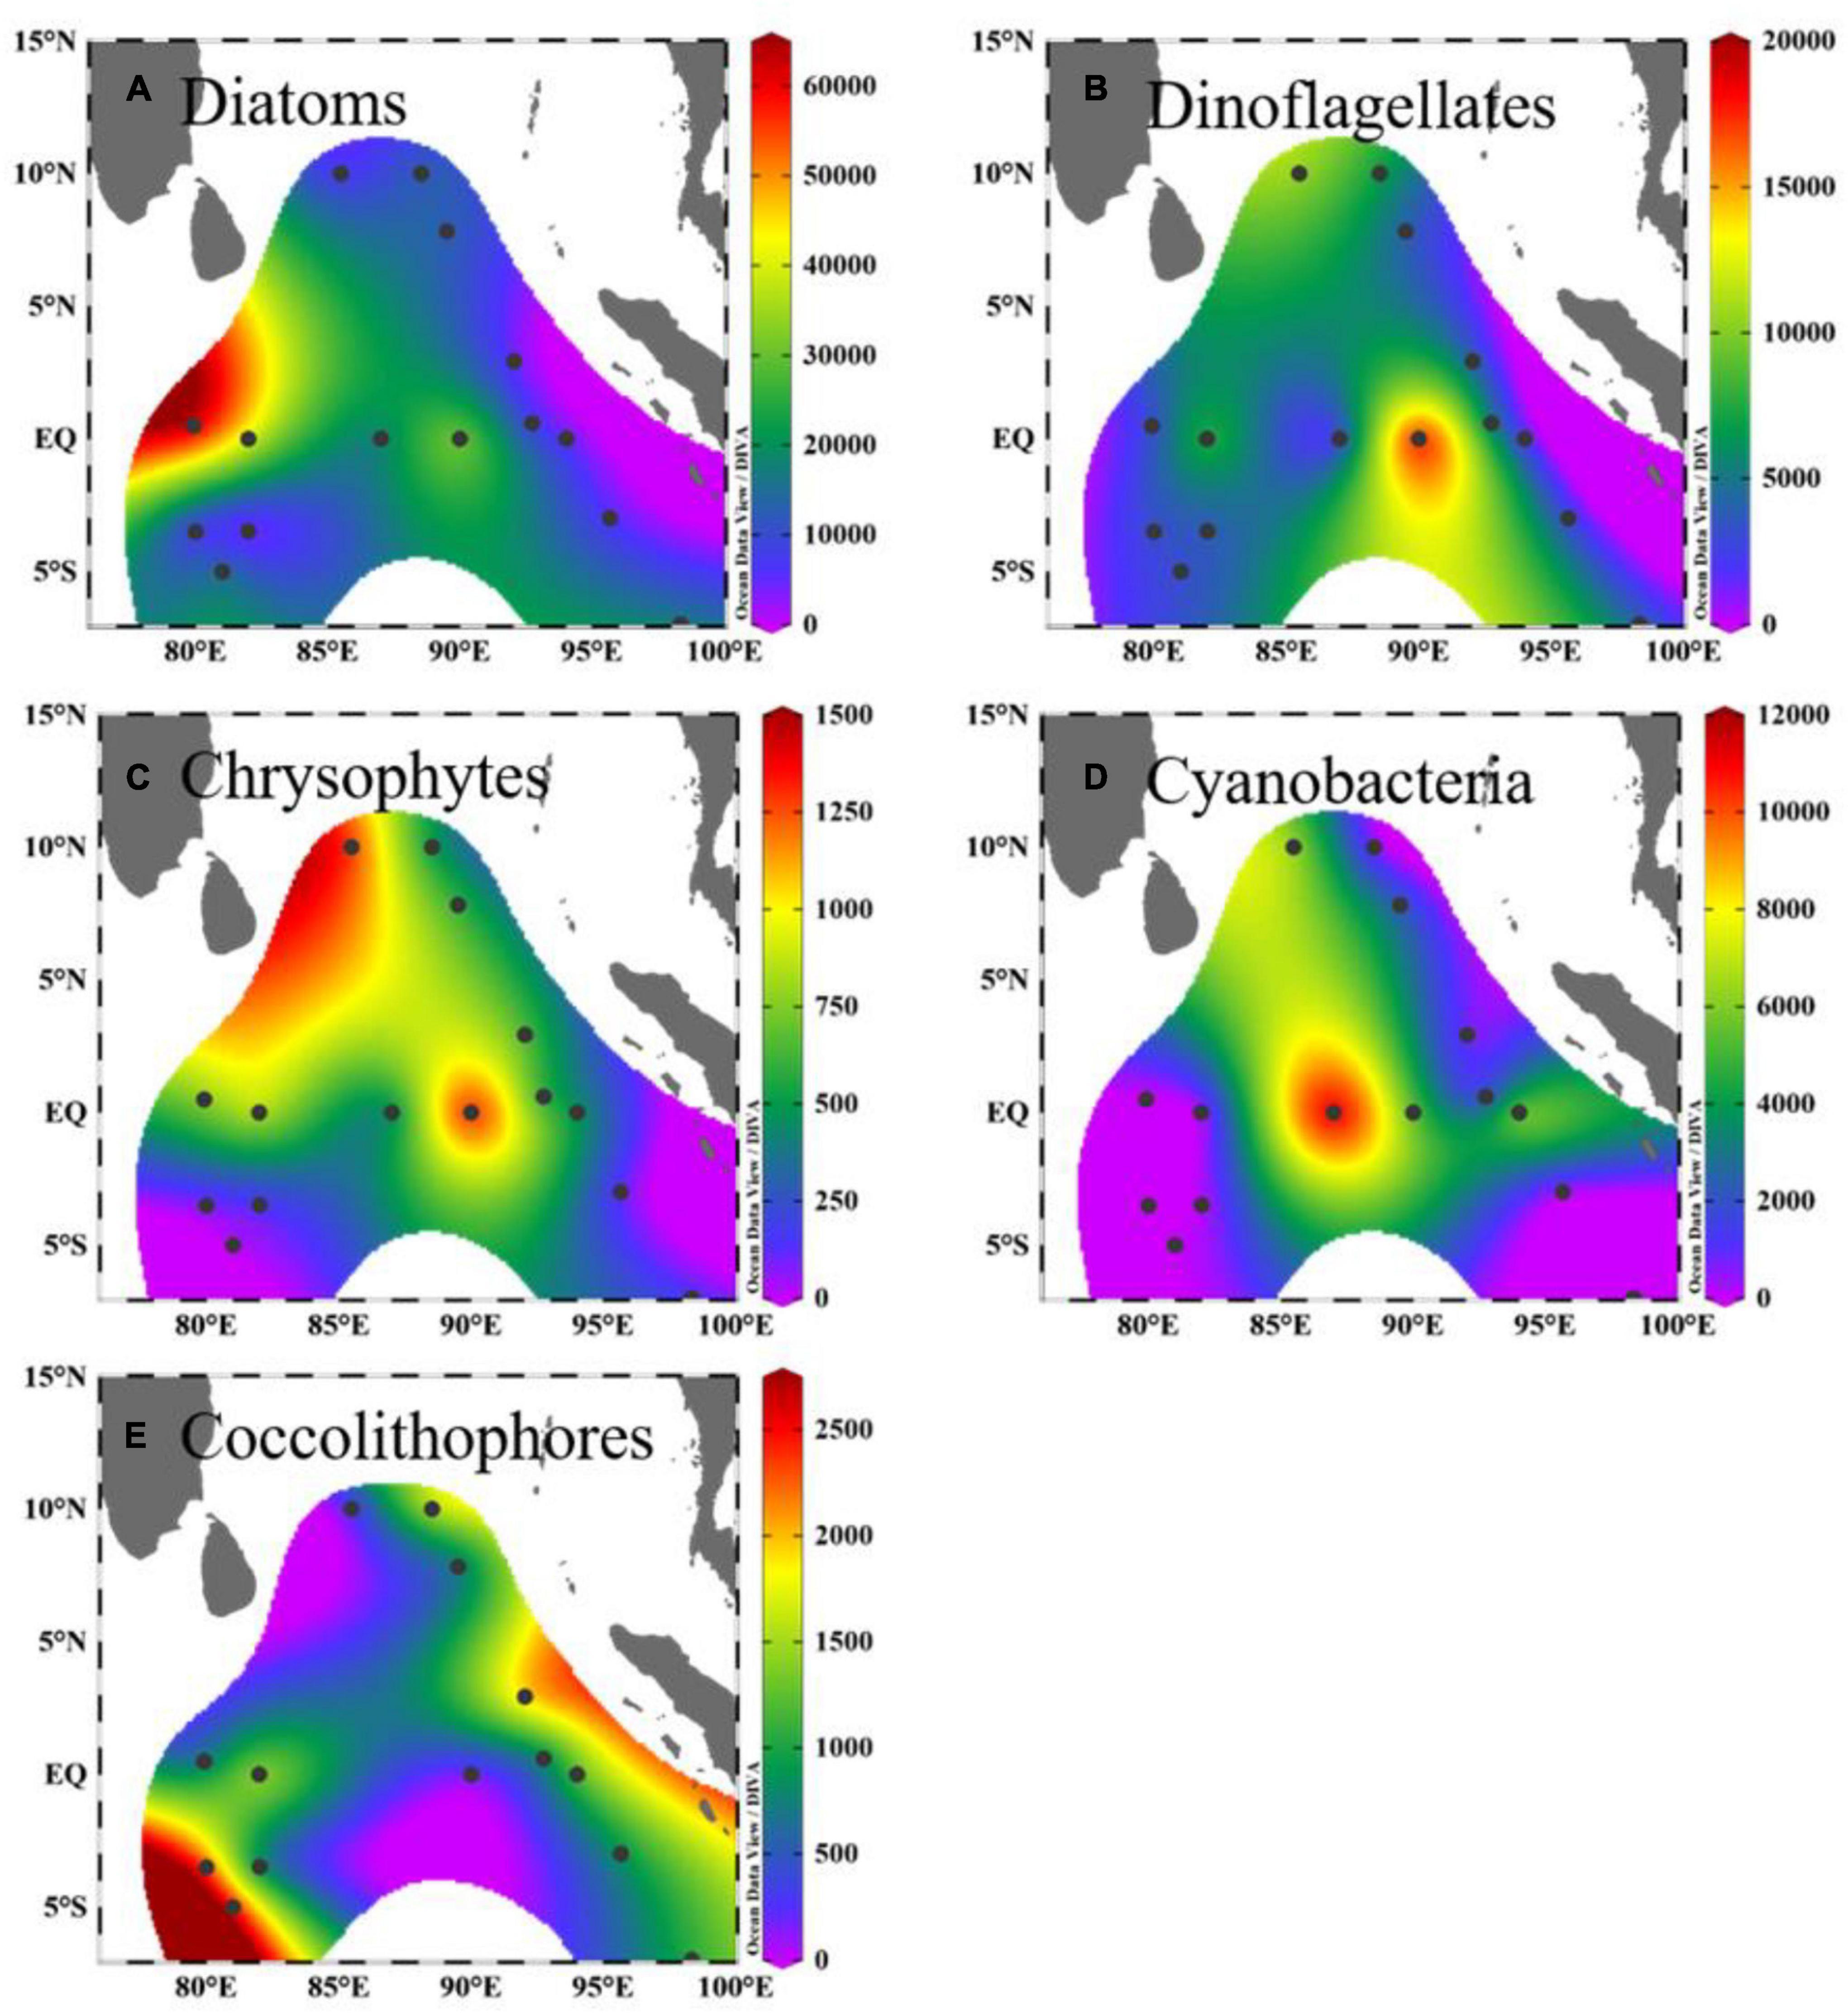
Figure 4. Horizontal distribution of depth-integrated phytoplankton abundance (for diatoms, dinoflagellates, chrysophytes: unit: ×103 cells m–2; for cyanobacteria: ×103 trichomes m–2; for coccolithophores: unit: ×106 cells m–2). (A) Diatoms. (B) Dinoflagellates. (C) Chrysophytes. (D) Cyanobacteria. (E) Coccolithophores.
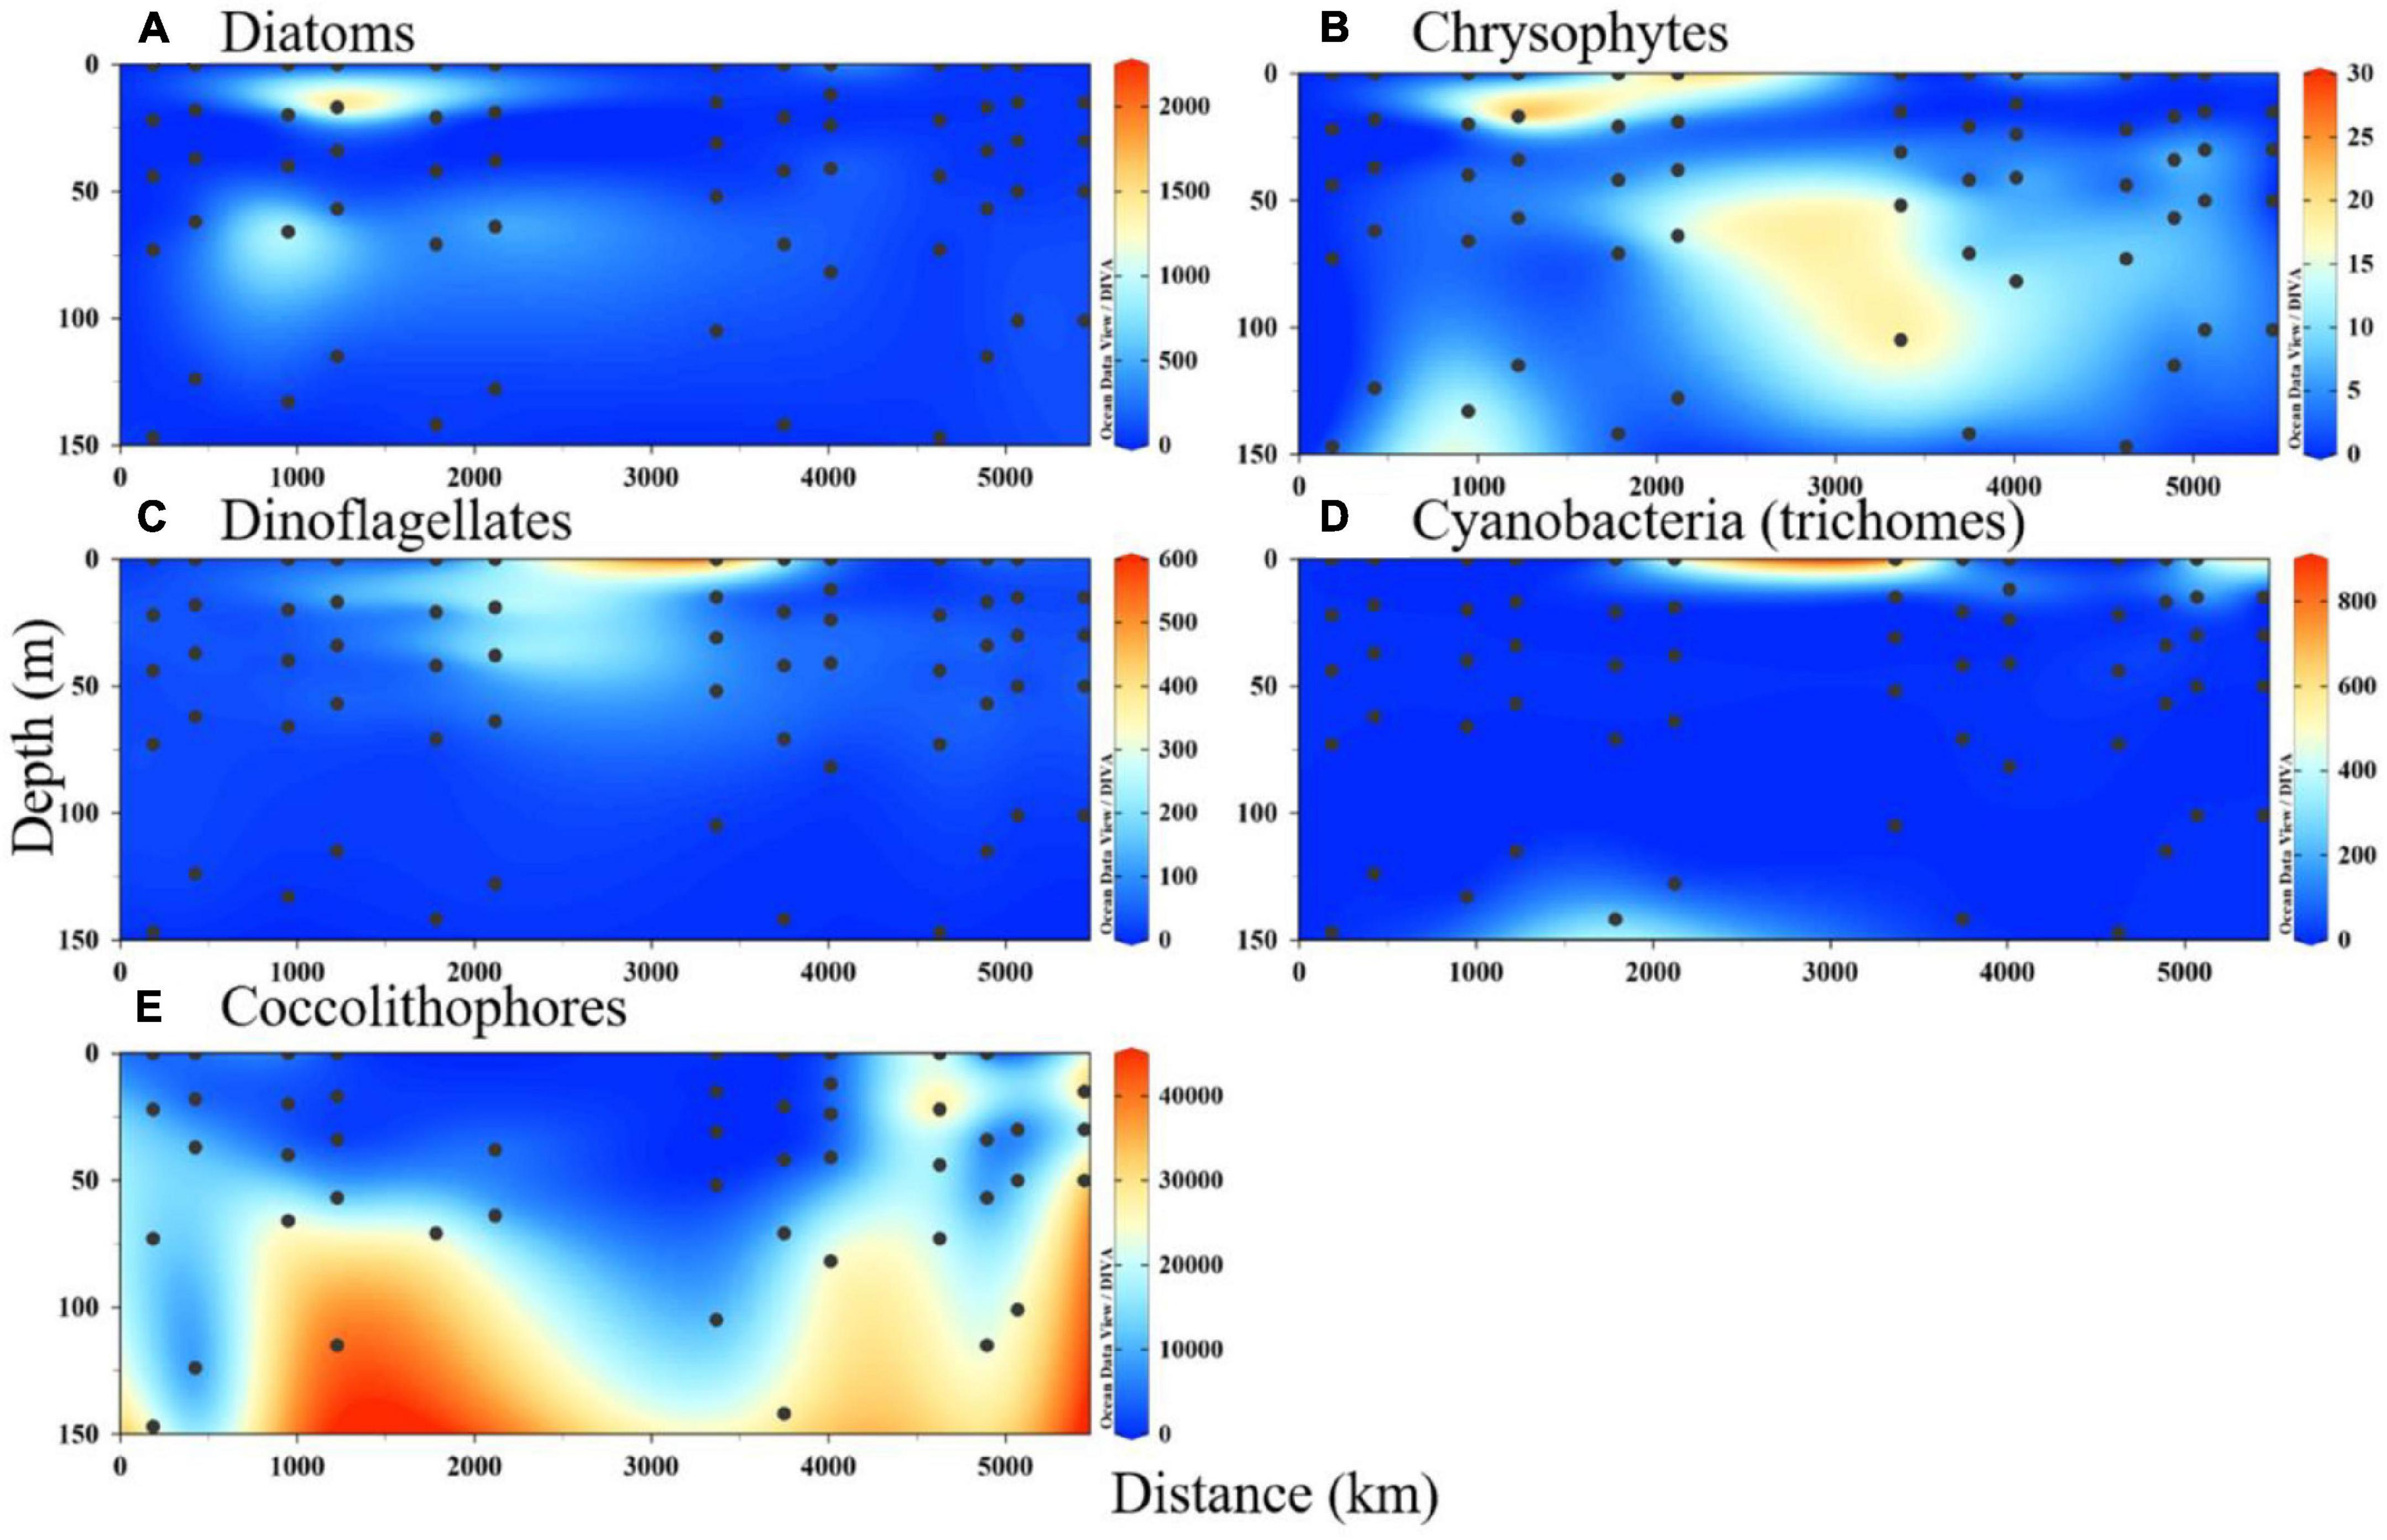
Figure 5. Vertical section of phytoplankton abundance (unit: cells/L; for cyanobacteria: trichomes/L). (A) Diatoms. (B) Chrysophytes. (C) Dinoflagellates. (D) Cyanobacteria (trichomes). (E) Coccolithophores.
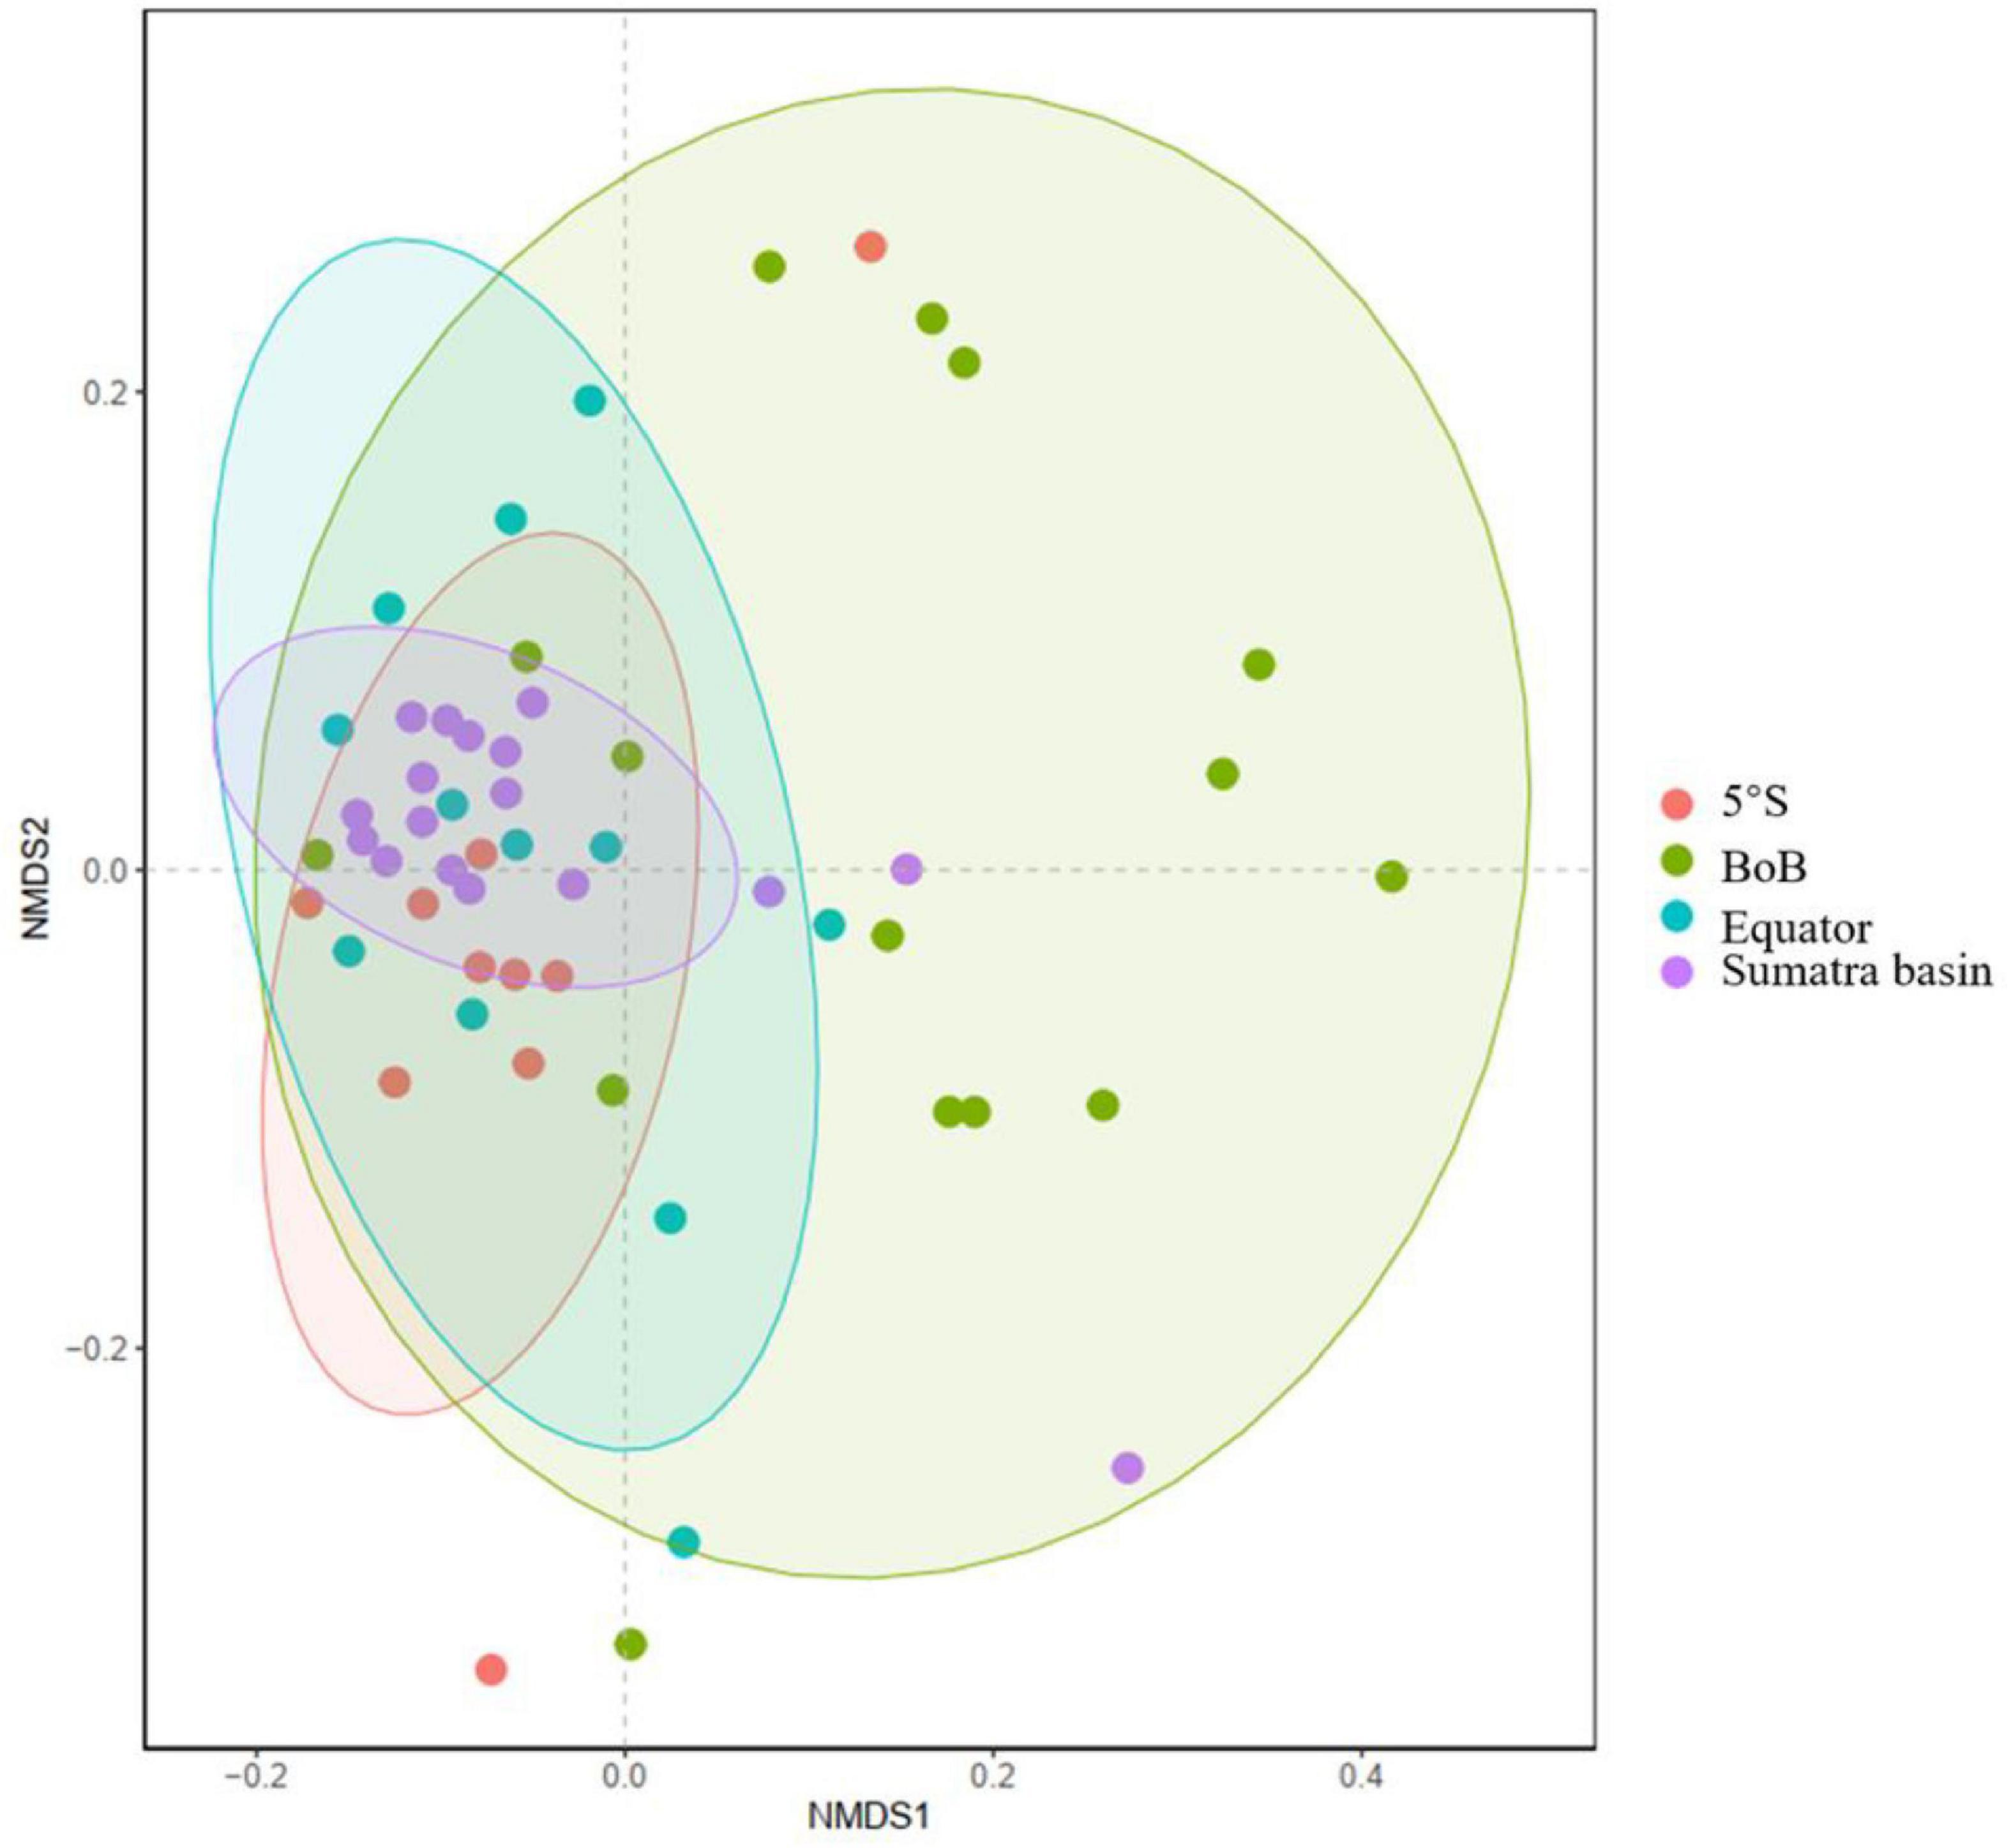
Figure 6. Non-metric multidimensional scaling (NMDS) analysis of seawater phytoplankton communities in the four domains of the study area.
The daily PP in the surface water ranged from 1.6 to 19.9 mgC m–3 d–1, with a mean of 7.4 mgC m–3 d–1 (Figure 7A). The estimated daily carbon production rates integrated over the photic zone ranged from 113 to 817 mgC m–2 d––1, with a mean of 522 mgC m–2 d–1 (Figure 7B). To analyze the specific carbon production rates, the PP rates were normalized to the Chl a concentration (PB). The spatial variability of PB in surface water (Figure 7C) was similar to that of PP The surface PB varied from 20.9 to 127.8 with a mean of 53.5 mgC (mg Chl a)–1 d–1. The Chl a-normalized IPP ranged from 8.0 to 31.3 mgC (mg Chl a)–1 d–1, with a mean of 17.2 mgC (mg Chl a)–1 d–1. Over the study area, the IPP was the highest at St. I108, followed by that at Sts. OBS1 [25.5 mgC (mg Chl a)–1 d–1], I317 [20.8 mgC (mg Chl a)–1 d–1], I402b [20.5 mgC (mg Chl a)–1 d–1], and I208 [20.4 mgC (mg Chl a)–1 d–1], and showed the values lower than 20 mgC (mg Chl a)–1d–1 at the remaining stations (Figure 7D). As a whole, the mean value of the PP rates was the highest in the BoB domain (7.3 mgC m–3 d–1), followed by south of the equator (5°S) (5.2 mgC m–3 d–1), the equatorial domain (4.1 mgC m–3 d–1), and Sumatra Basin (3.6 mgC m–3 d–1) (Figure 7E).
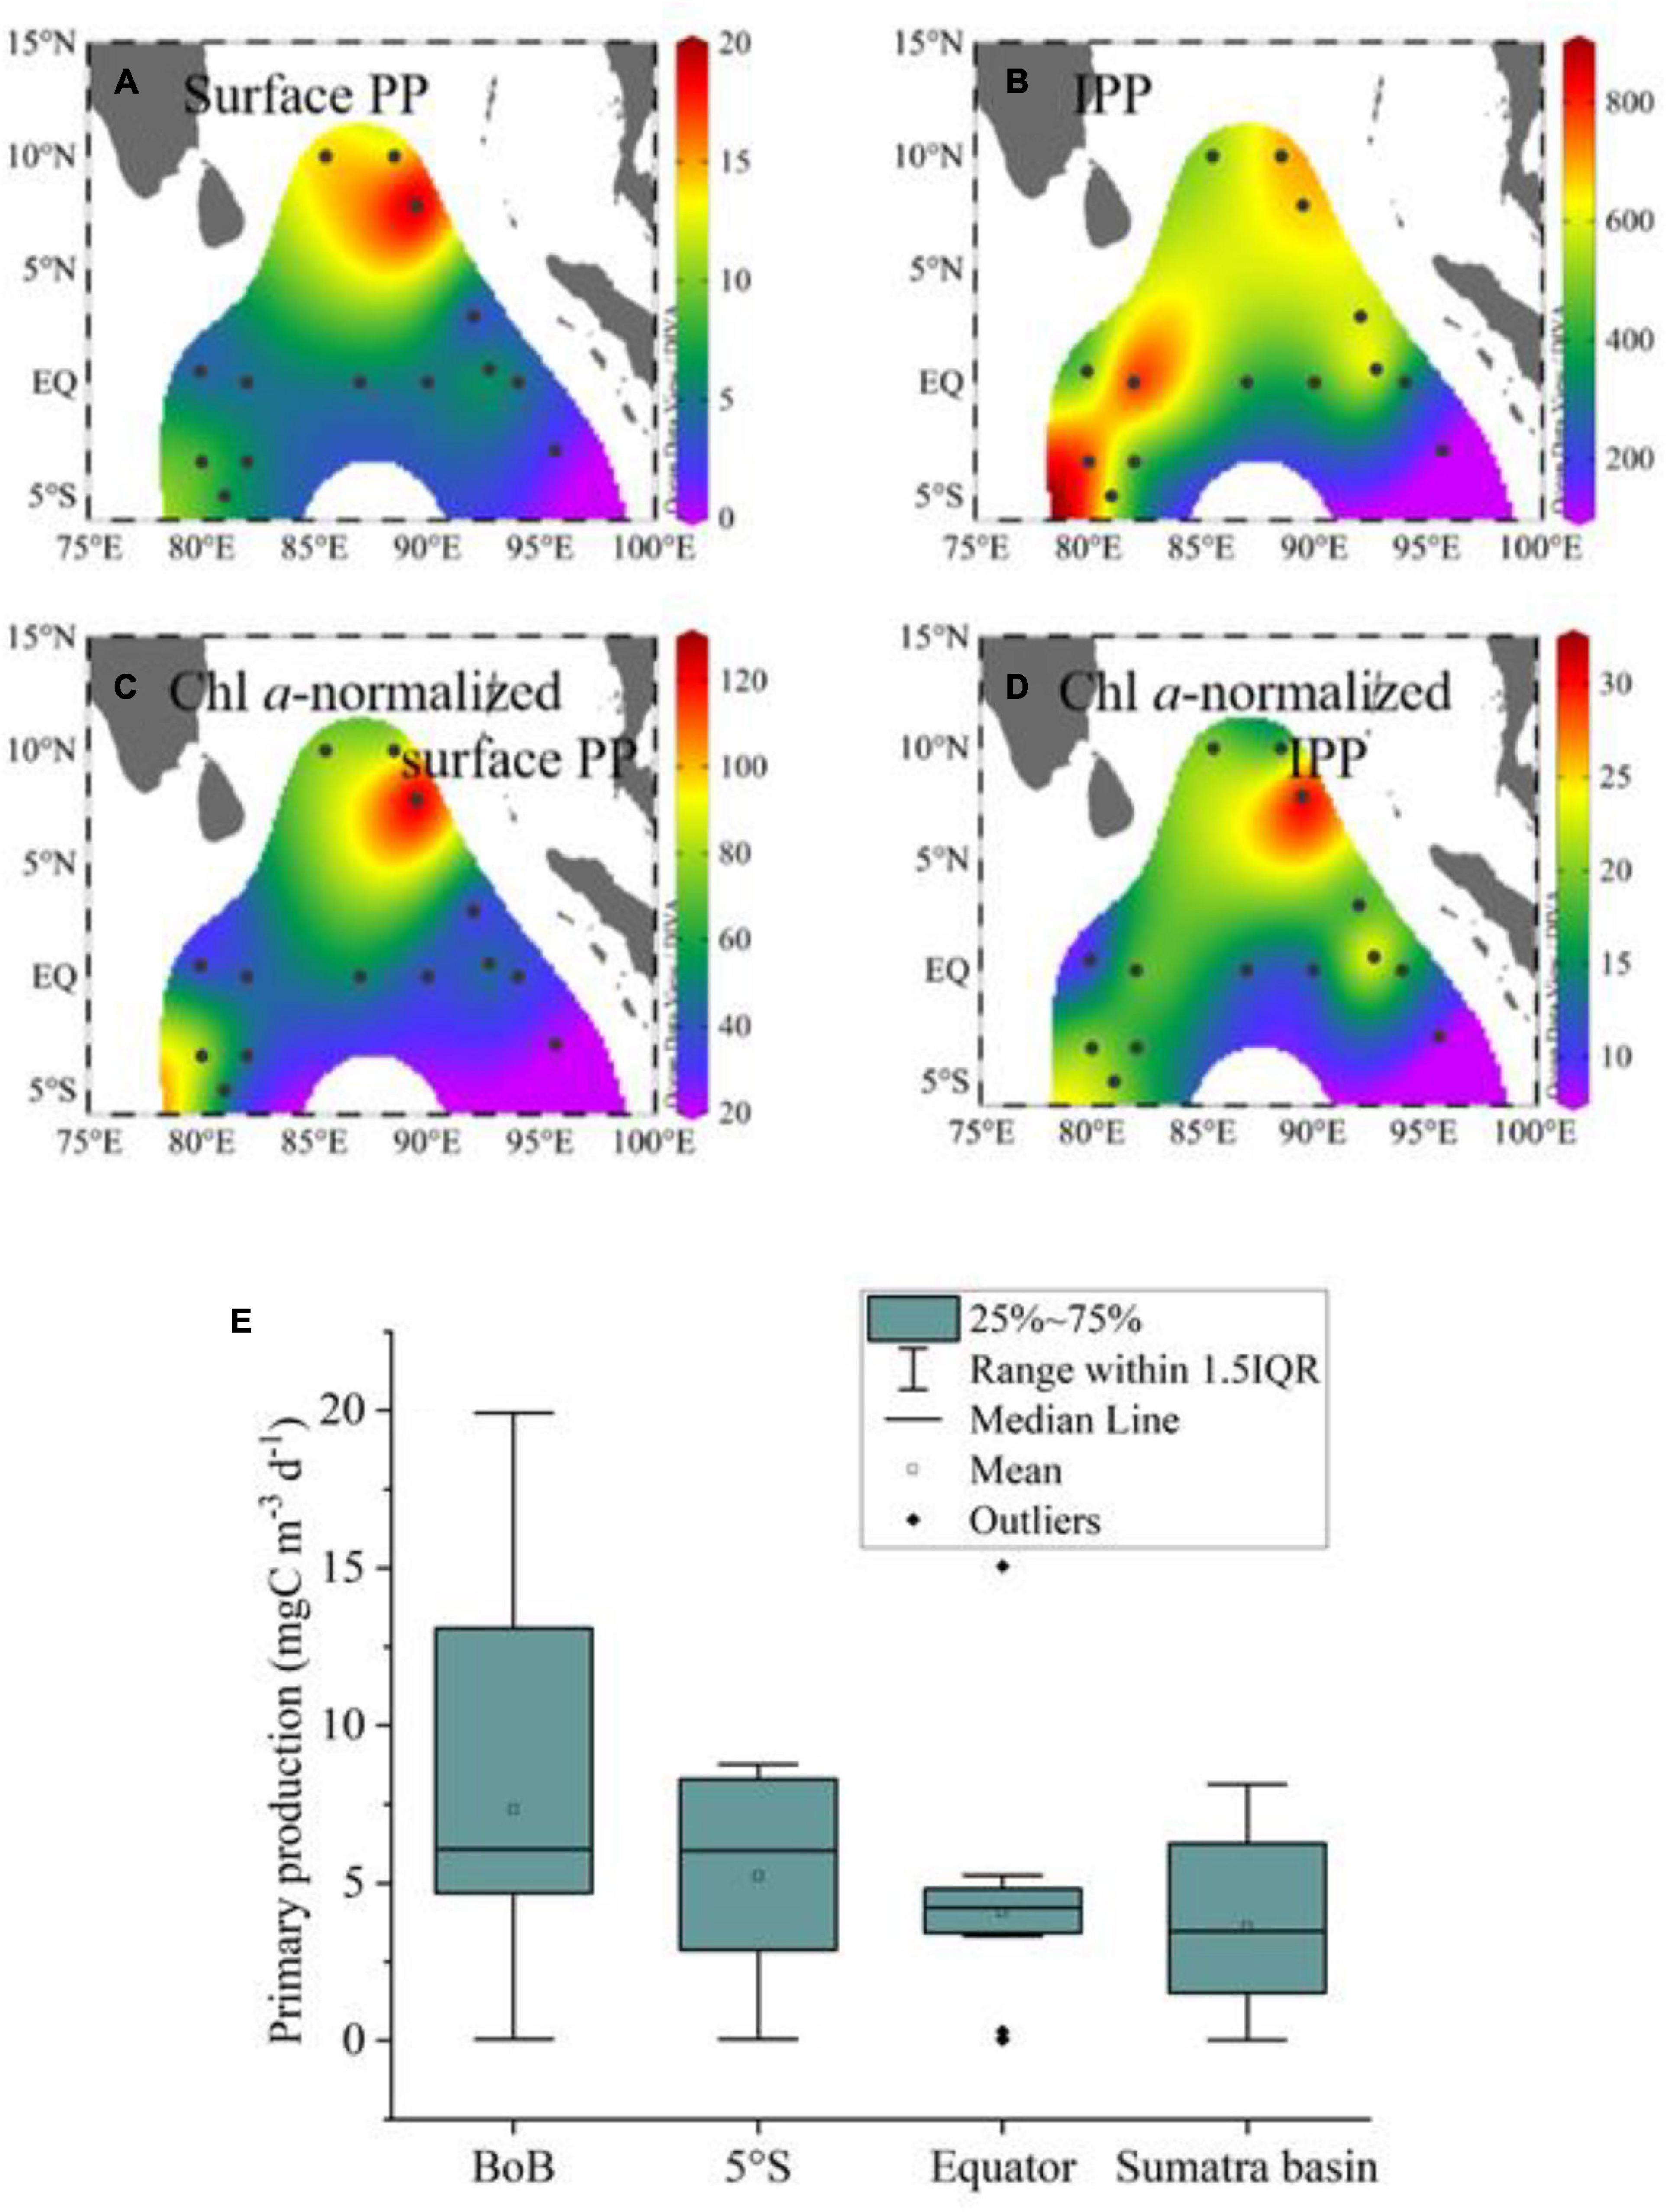
Figure 7. The distributions of primary production (PP) and photic zone-integrated PP (IPP). (A) Surface PP, unit: mgC m–3 d–1; (B) IPP, unit: mgC m–2 d–1; (C) Chl a-normalized surface PP, unit: mgC (mg Chl a)–1 d–1; (D) Chl a-normalized IPP, unit: mgC (mg Chl a)–1 d–1; (E) Box–Whisker plot of PP among the four domains.
The PP and Chl a-normalized PP showed that both maxima were observed at the surface layer and then sharply decreased as the depth increased (Figures 8A,B). However, there is a slight difference between Figures 8A,B at a depth of 10% of the surface light level (near the DCM layer), where before the Chl a-normalization, the PP value was relatively higher than that of the subsurface layer (50 and 25%). The vertical distributions of PP and Chl a-normalized PP are presented in Figures 8A,B to identify the spatial heterogeneity, indicating that the maximum values were observed at the surface/subsurface of the BoB area (Sts. I108, I202, and I208), followed by the southern equator (Sts. I317, I707, and I402b). In particular, the PP value at the equatorial station from the west showed a relatively high value near the DCM layer (Figure 8C), whereas Chl a-normalized PP did not (Figure 8D). Deep carbon production below 50 m was extremely low. Overall, the surface PP and IPP values from the BoB stations (Sts. I108, I202, and I208) and three south equator stations (Sts. I317, I707, and I402b) were 2.4 and 0.4 and 0.6 and 0.4 times greater than those from the other stations in the study area.
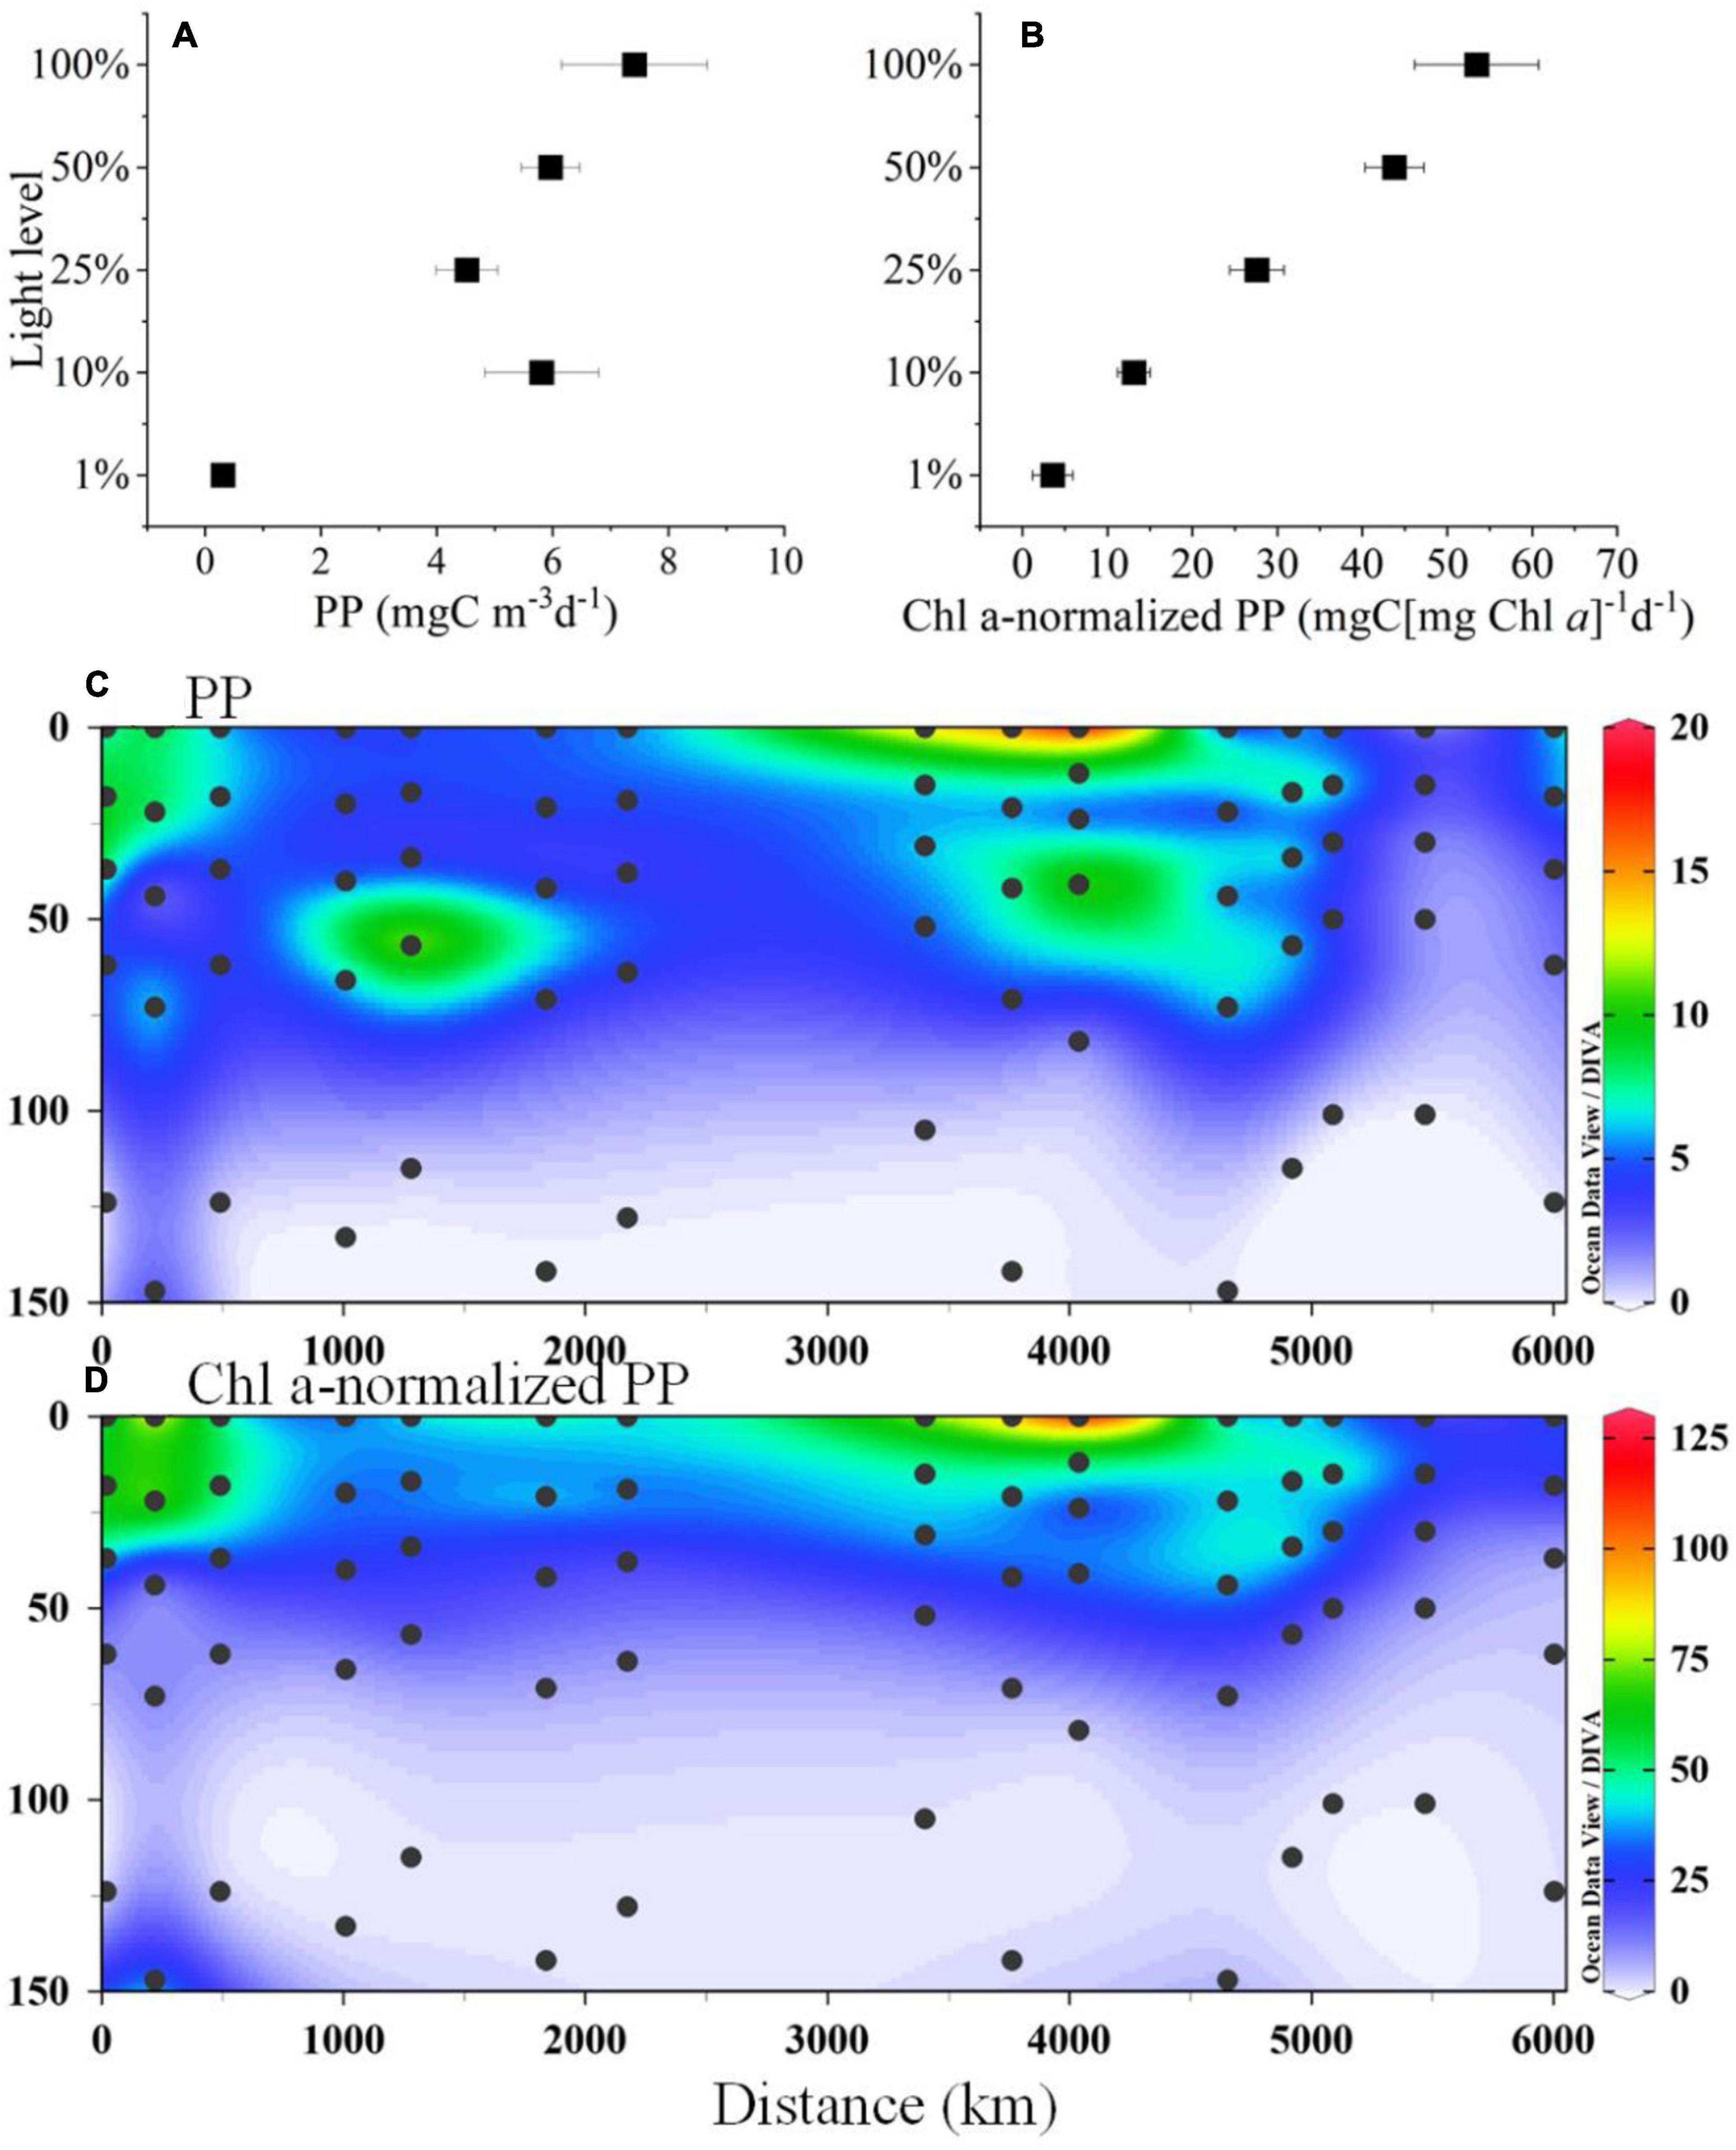
Figure 8. The vertical profiles of (A) primary production (PP), (B) Chl a-normalized PP and section distributions of (C) PP, unit: mgC m–3 d–1) and (D) Chl a-normalized PP [unit: mgC (mg Chl a)–1d–1] in the study area.
The mixed-layer integrated primary production (MLD-PP) varied from 29.0 to 303.7 mgC m–2 d–1 (mean 177.2 mgC m–2 d–1) and displayed lower values in the Sumatra Basin (Figure 3E). The contribution of MLD-PP to the euphotic zone-integrated PP (IPP) ranged from 19 to 51% (mean 36%) with lower values in some equatorial stations and BoB areas (Figure 3F). A linear trend among the IPP and some biogeochemical factors was observed, although there were no significant differences. IPP displayed a linear relationship with the photic-integrated NOx (r2 = 0.08; p = 0.32; Figure 9A), phosphate (r2 = 0.02; p = 0.59; Figure 9B), silicate (r2 = 0.03; p = 0.52; Figure 9C), Chl a (r2 = 0.22; p = 0.08; Figure 9D) and a non-linear relationship between MLD and the depth of the nitracline (Figures 9E,F).
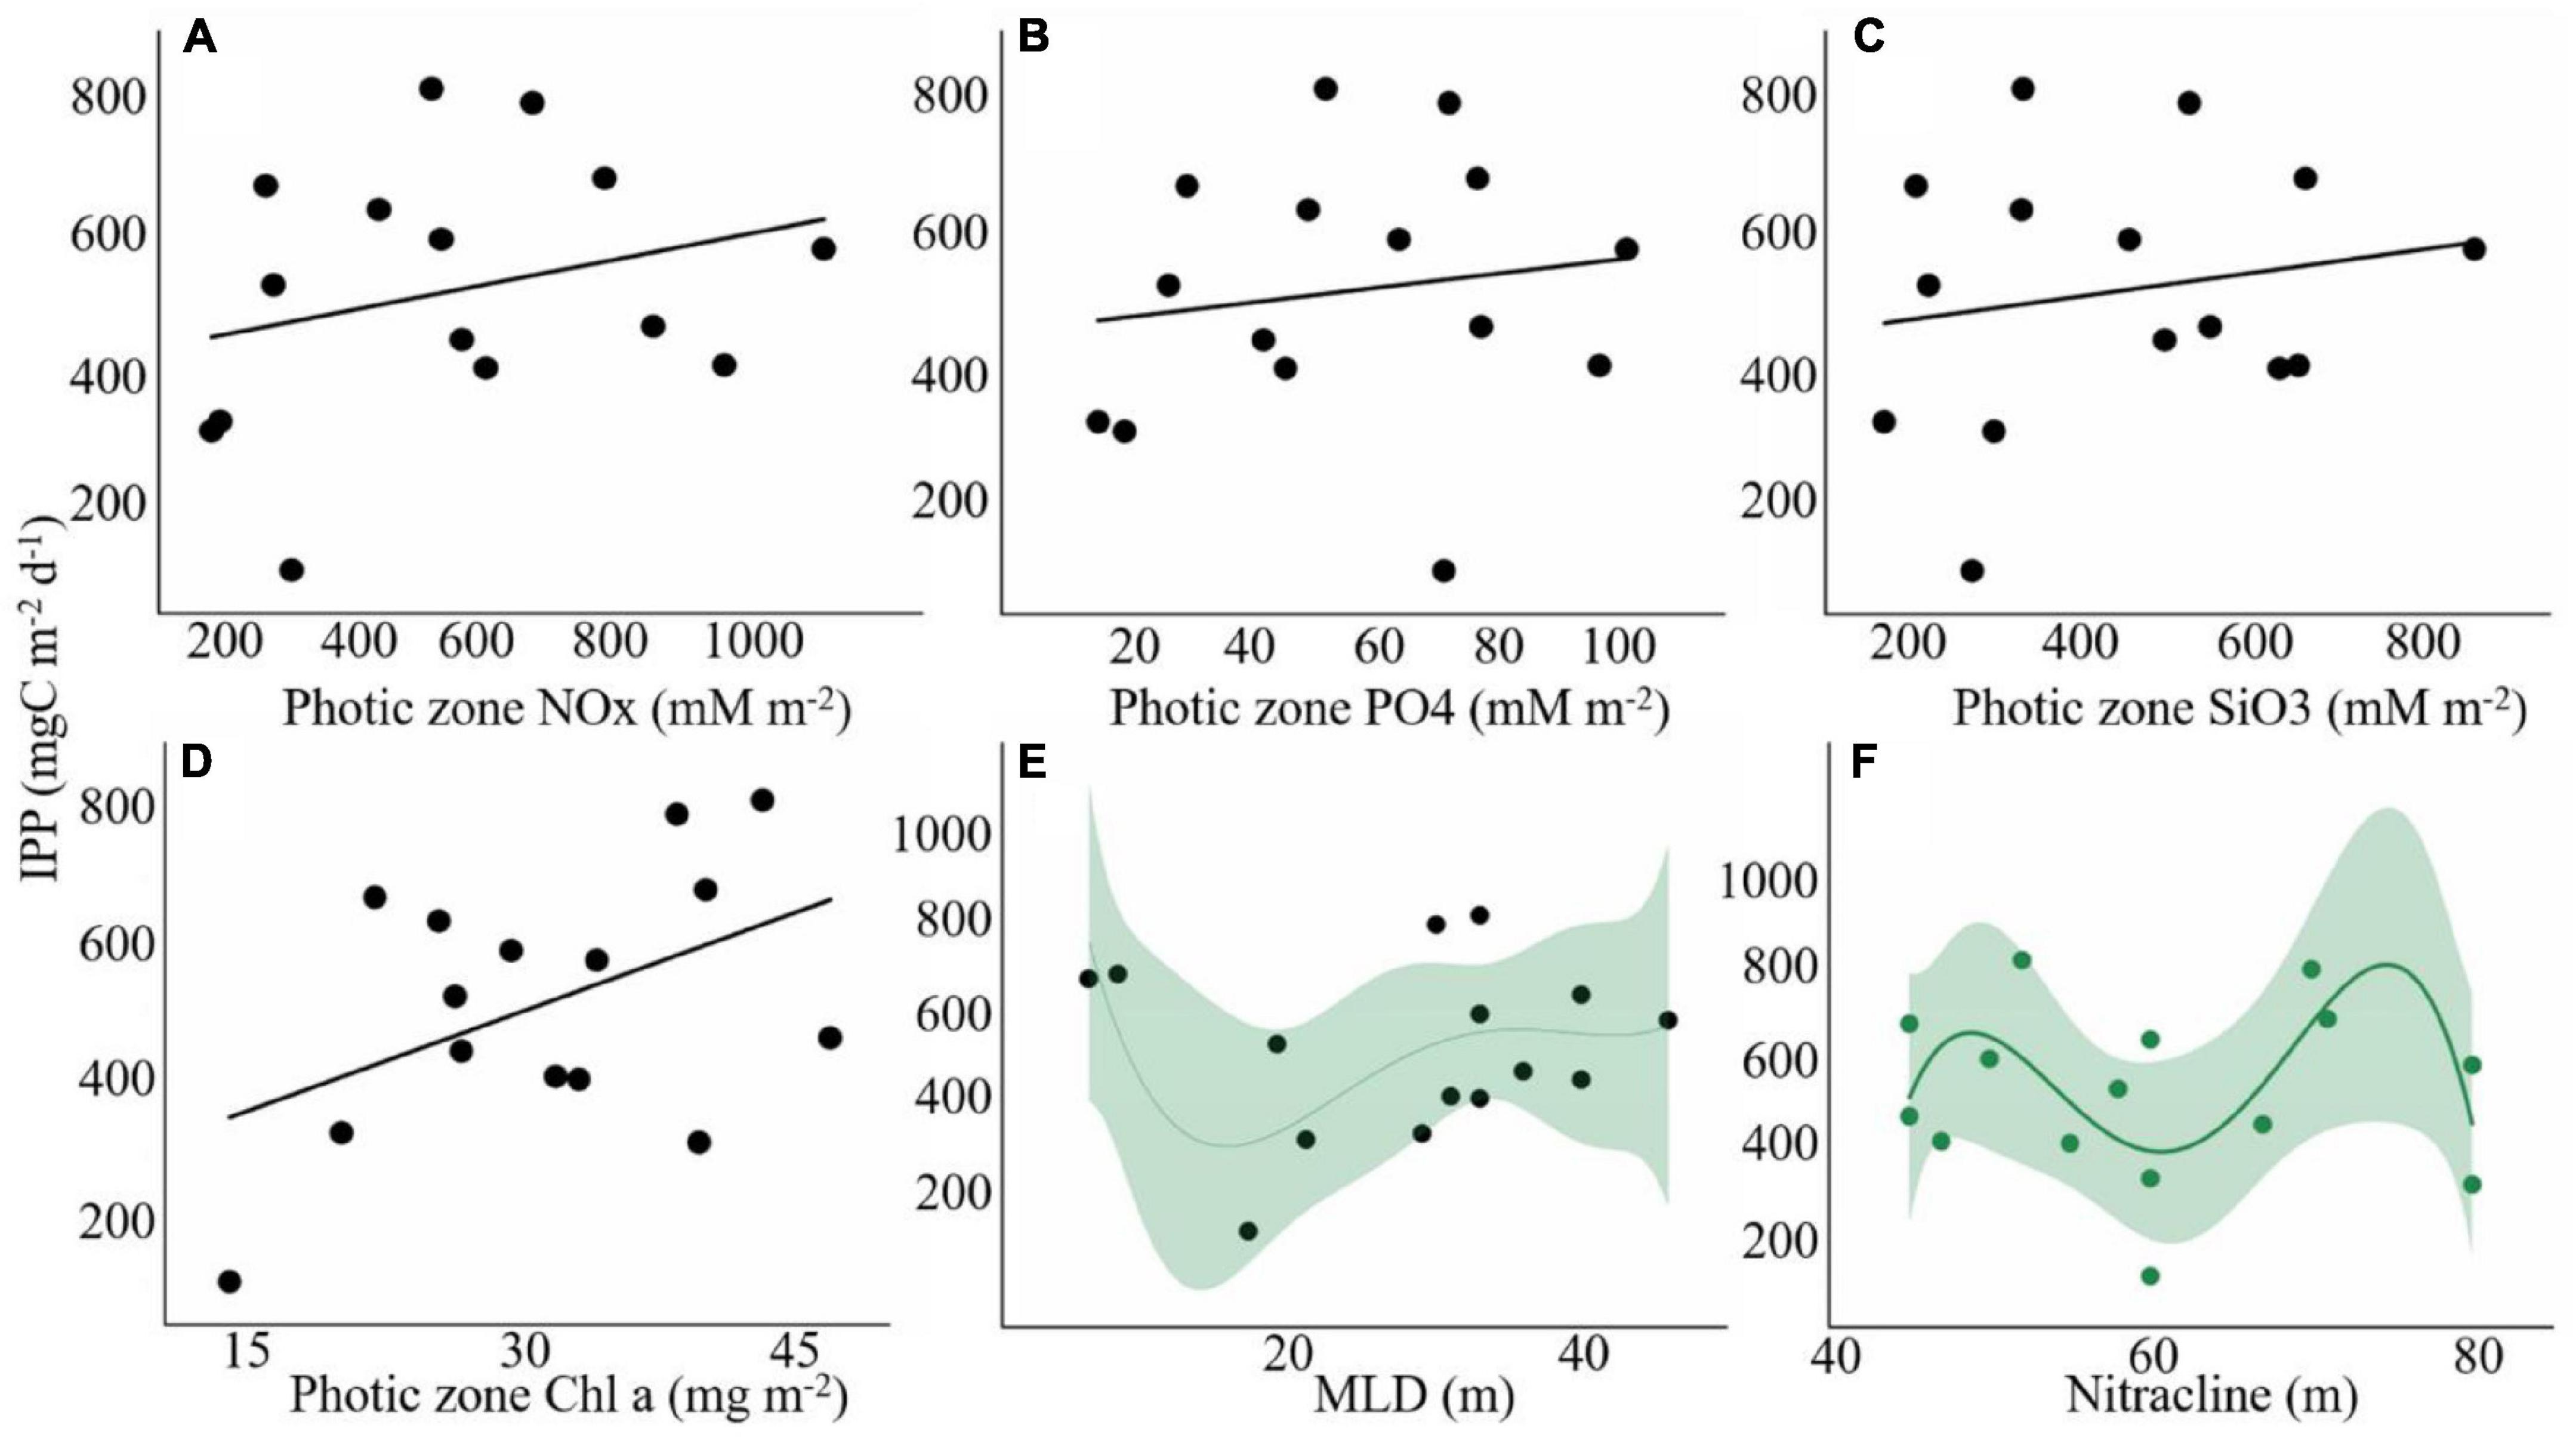
Figure 9. Relationship of euphotic zone-integrated primary production (IPP) with (A) NOx (mM m–2), (B) phosphate (mM m–2), (C) silicate (mM m–2), (D) Chl a (mg m–2), (E) mixed-layer depth, and (F) nitracline depth (m) in the eastern Indian Ocean.
Pearson’s rank correlation was performed between primary production and multiple environmental variables (Figure 10A). Significant correlation values are shown with an asterisk (*). Among the 16 types of biogeochemical variables, primary production was strongly negatively correlated with depth (r = −0.55, p < 0.001), coccolithophores (r = −0.49, p < 0.001), salinity (r = −0.54, p < 0.005), nutrients including NOx (nitrate + nitrite) (r = −0.51, p < 0.05) and phosphate (P) (r = −0.54, p = 0.001). Furthermore, primary production was positively correlated with dinoflagellates (r = 0.45, p < 0.05), cyanobacteria (r = 0.37, p < 0.05), temperature (r = 0.55, p < 0.05), Chl a (r = 0.26, p = 0.06), and POC (r = 0.20, p = 0.15). In addition, RDA was employed to reveal the relationships between phytoplankton primary production and explanatory variables. As shown in Figure 10B, the BoB domain was clearly distinguished from the other domains. The first two axes (RDA1 and RDA2) together explained 52% of the total variation in the biotic data. The RDA indicated that the temperature, salinity, nitrate, and phosphate were the major environmental factors driving the spatial variability in phytoplankton primary production.
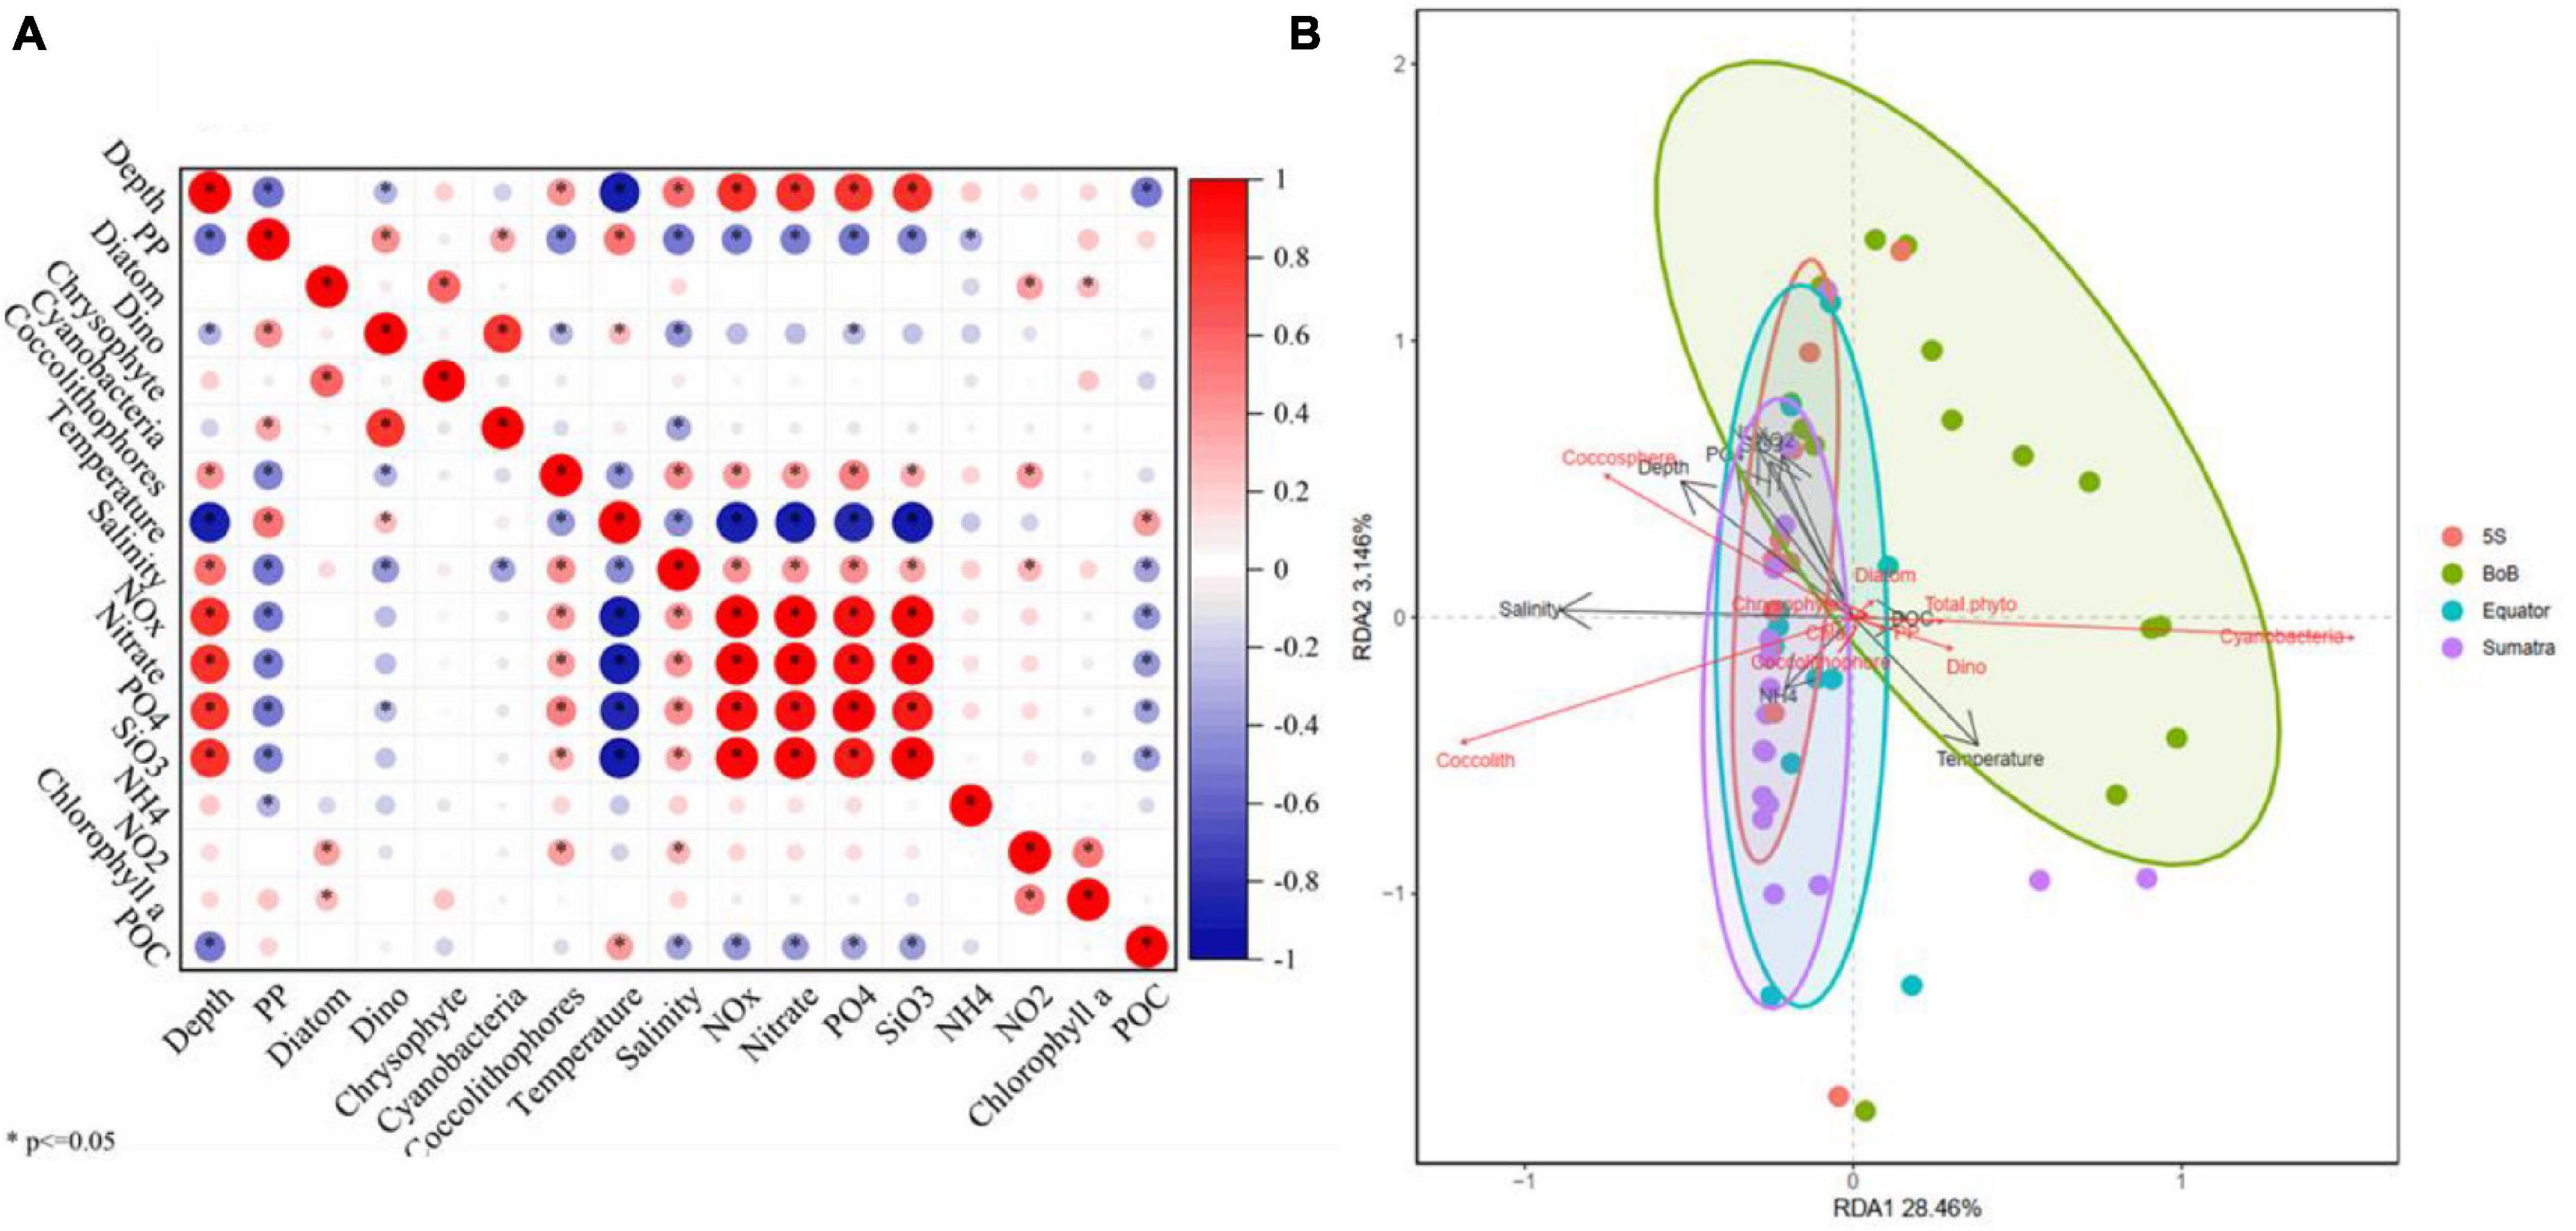
Figure 10. Pearson’s rank analysis of environmental factors and primary production (A) and redundancy analysis (RDA) between biotic and abiotic variables (B).
Carbon production in the Indian Ocean can display large spatial differences due to the complex hydrographical background (Madhu et al., 2006; Barber et al., 2001). We observed remarkable variations (p < 0.05, one-way ANOVA) in carbon production among the four domains (south of the equator, equatorial Indian Ocean, BoB region, and Sumatra Basin) in the EIO. However, the photic zone-integrated PP (PZI-PP) did not show significant variations in the study area. In the following subsections, factors such as physical forcing and biotic community composition were mainly discussed for their determination of the spatial variations in primary production.
We observed some biochemical differences when comparing the BoB domain and the remaining EIO stations. The photic zone-integrated nutrients were lower in the BoB (NOx: 449.9 mM m–2; phosphate: 45.9 mM m–2; silicate: 363.9 mM m–2) than in the remaining EIO stations (NOx: 591.4 mM m–2; phosphate: 60.7 mM m–2; silicate: 465.5 mM m–2), which was possibly caused by the faster sinking rate of non-mineralized organic carbon (Ittekkot et al., 1991). Dalabehara and Sarma (2020) noticed two times higher euphotic depth-integrated nitrate in the equatorial Indian Ocean than in BoB. Influenced by river discharges in the northern bay, the concentration of silicate was generally higher than that in other areas. We observed high silicate, high nitrate, and low phosphate concentrations (Figures 3A–C). The surface silicate concentration and N:P ratios in the BoB domain were almost two times those of the other three domains. Spatially, significant changes in PP in the water column among the four domains were observed. Specifically, the surface PP rates (Figures 7A,C) were found to be the highest in the BoB domain, which was consistent with the shallow mixed-layer depth induced by the freshwater influx from the major rivers in the northern BoB. Abundant dinoflagellates in the BoB domain were speculated to contribute to high PP rates. When comparing the three stations within the BoB domain, we found that surface production values in Sts. I208 and I202 were, on average, 30% lower than that of St. I108, as the former two were influenced by the anticyclonic eddy and the latter was under the effect of a cyclonic eddy (Figure 1d). Due to seawater divergence in the cyclonic area, elevated nutrient concentrations lead to a high carbon production (Kumar et al., 2007; Mergulhao et al., 2013). The concentrations of Chl a in the upper water of the BoB stations in our study were low (<0.2 mg m–3). This result was consistent with the reported modeling results in the oligotrophic central and southern areas of the BoB (Wiggert et al., 2006). In addition, relatively higher PP rates were found in the southwest of the station map near −5°S (Sts. I402b and I317), which was possibly affected by the SEC and the seawater divergence effect (as seen from relatively low SLA, Figure 1d). The relatively higher PP at these southwest stations corresponded to a relatively deeper MLD (Figure 2), a higher MLD-PO4 (Figure 3B), and coccolithophore abundance (Figure 4e). In this oligotrophic habitat with relatively low MLD-NOx and MLD-SiO3 levels and a higher MLD-PO4 level, coccolithophores with their small cell size could outcompete other larger phytoplankton cells such as diatoms and dinoflagellates. A low surface PP was observed in the equatorial domain (80–90°E, Figures 7A,C) due to the presence of the intermonsoonal Wyrtki jets (EJs), which were characterized by a depressed thermocline and nitracline depression (Wiggert et al., 2006), corresponding to a low PP (manifested by the ocean-color Chl a concentration) (Yuan et al., 2019). Besides the equatorial domain, the south of Sumatra also exhibited low productivity (Figure 7A) possibly induced by the winter-spring equatorial undercurrent (EUC). These two low production areas both corresponded to relatively high SLA values (Figure 1d), suggesting the adverse effect of seawater convergence on productivity. The transient EUC carried salty water from the western Arabian Basin which could induce a downwelling in the EIO (Chen et al., 2016). The vertical profiles of primary production (Figure 8), as a whole, indicated that there was no clear photoinhibition or nutrient limitation in the study area due to the absence of subsurface maximum.
The PZI-PP displayed a positive correlation with inorganic nutrients (Figure 9), but with no significance, indicating the partial control of macronutrients and light limitation on phytoplankton carbon fixation. In addition, trace metals such as iron can become a limiting factor for phytoplankton growth (Hutchins et al., 2002). As previously reported in the Indian Ocean, many regions tend toward iron deficiency, especially in the central basin during the spring intermonsoon period (Wiggert et al., 2006). Some studies have suggested that nitrate and phosphate were the principal controlling factors of primary production in the Indian ocean as significant linear relations have shown (Sarma et al., 2020; Dalabehara and Sarma, 2020). In addition, they observed an inverse relationship between primary production and MLD and nitracline depth, suggesting that nutrient availability and light levels have a synergistic effect. However, in our study, no significant linear relationship (PP vs. MLD and nitracline depth) was observed (Figures 9E,F), suggesting that nutrients cannot successfully support primary producer growth at higher light levels in the EIO.
The mean value of PB in the water column was significantly higher (p < 0.05, t-test, two-tailed) in the BoB domain [39.4 mgC (mg Chl a)–1 d–1] than in the other three domains of the EIO [25.5 mgC (mg Chl a)–1 d–1], suggesting higher photosynthetic efficiency in the former than in the latter region. Phytoplankton can develop different photosynthetic traits and photoadaptation strategies at various optical depths. Due to the absence of photoinhibition near the northern bay, phytoplankton has a relatively high light utilization efficiency (Yuan et al., 2019). Associating with lower photic zone-integrated nutrients in the BoB domain, small size-fractionated phytoplankton cells might be major contributors to local PP. Wei et al. (2021) reported abundant picoeukaryotes in the BoB area corresponding to high biogenic silica (bSi) standing stocks with a <2 μm fraction (Wei et al., 2021). As seen from the phytoplankton distribution pattern, large diatoms were nearly absent in the BoB domain due to the low dissolved nutrient concentration (Figure 4a). A high abundance of photic zone-integrated diatoms at the western equatorial stations (Sts. I308 and I403) corresponding to high POC concentrations (0.116 and 0.095 mg/L) may play a significant role in sinking carbon fluxes. This was in good agreement with the highest IPP rates in the equatorial domain (Figure 7B). Unlike the low surface PP rates in the equatorial domain, the subsurface PP rates reached a maximum value due to a mass of diatoms in the subsurface water (Figure 4a), which is a balance between nutrient availability and light intensity. The absolute cell abundance of dinoflagellates was dominant in the entire surface water and reached the maximum in the BoB domain (see supporting information of Liu et al., 2020). High silicate concentrations loaded by riverine fluxes from the northern BoB area might contribute to the high small primary production rate. In addition, this high carbon production also benefited from the higher nitrogen fixation rate (10°N section), to which diazotrophs (mainly cyanobacteria) largely contributed (>10 μm) (Wu et al., 2021). The highest cyanobacteria abundance (Trichodesmium) of 173.25 × 10³ cells/L was found in the BoB station St. I208. Our results show that the surface N:P ratio in the BoB domain was two times that in the other domains, suggesting a potential role in dinitrogen fixation. In tropical oceans, reactive nitrogen is considered a major limitation in primary production (Moore et al., 2013). Nitrogen fixation by diazotrophs is thriving in the BoB domain and contributes largely to local primary production by supplying new nitrogen sources (Löscher et al., 2020). Trichodesmium, which is one of the most conspicuous nitrogen-fixing phytoplankton, possibly contributes significantly to primary production in the BoB stations, fueling euphotic microbial production (Dore et al., 2008). In addition to Trichodesmium, Richelia intracellularis is also an important N2 fixer in oligotrophic oceans, generally in the formation of diatom–diazotroph associations (Venrick, 1974). In the current BoB domain, no occurrence of R. intracellularis was observed because diazotrophic diatoms were almost absent. Unlike the BoB domain, the other EIO areas in the Northern Hemisphere are not sites of active N2 fixation, suggesting that nitrogen fixation may not be a major contributor to primary production. During the survey period, diazotrophic blooms were not observed. In contrast, Waite et al. (2013) reported that nitrogen fixation contributed to 40–100% of the nitrate in the EIO off Australia (Waite et al., 2013).
We collected carbon uptake studies around the EIO from 2000 onward (Table 2). It should be noted that these studies used different methods and spatial coverage. Many of them were conducted using the 14C-tracer technique, and 13C- and 15N-tracer methods were also used. There is good agreement between the 13C- and 14C-determined photosynthesis, the former is 1.8 times higher than that of the latter (Hama et al., 1983; Regaudie-de-Gioux et al., 2014). As seen from the listed latitudes, northern BoB (north of 15°N) is the most studied region. It makes sense that the PP in the EIO is higher than that in the northern BoB. Low primary production in the northern BoB was speculated to be influenced by heavy cloud cover and turbidity, weak vertical mixing, and nutrient supply (Madhupratap et al., 2003; Gauns et al., 2005). Unlike the northern BoB, the area at 10°N section (BoB domain) in our study exhibited higher surface PP rates caused by nutrient regimes (high N:P ratio and silicate concentration) and small-sized phytoplankton groups (see section “Phytoplankton Community and Photosynthetic Traits in Response to Primary Production”). Our results were comparable to those of Dalabehara and Sarma (2020), who analyzed a similar sampling area during the spring intermonsoon period. Low primary production was associated with low photosynthetic efficiency in the northern BoB as previously reported (Dalabehara and Sarma, 2020; Gomes et al., 2000). However, the photosynthetic efficiency can be highly variable during the intermonsoon period, being associated with the changing nutrient status in the water column (Barber et al., 2001). Generally, eutrophic environments exhibit a higher maximum quantum yield of photosystem II (Fv/Fm) (Yuan et al., 2019). Overall, the ambient physical forcing, nutrient availability, and bio-optical properties modulated the photosynthetic competency of different-sized phytoplankton and further influenced the productivity level (Kerkar et al., 2020).
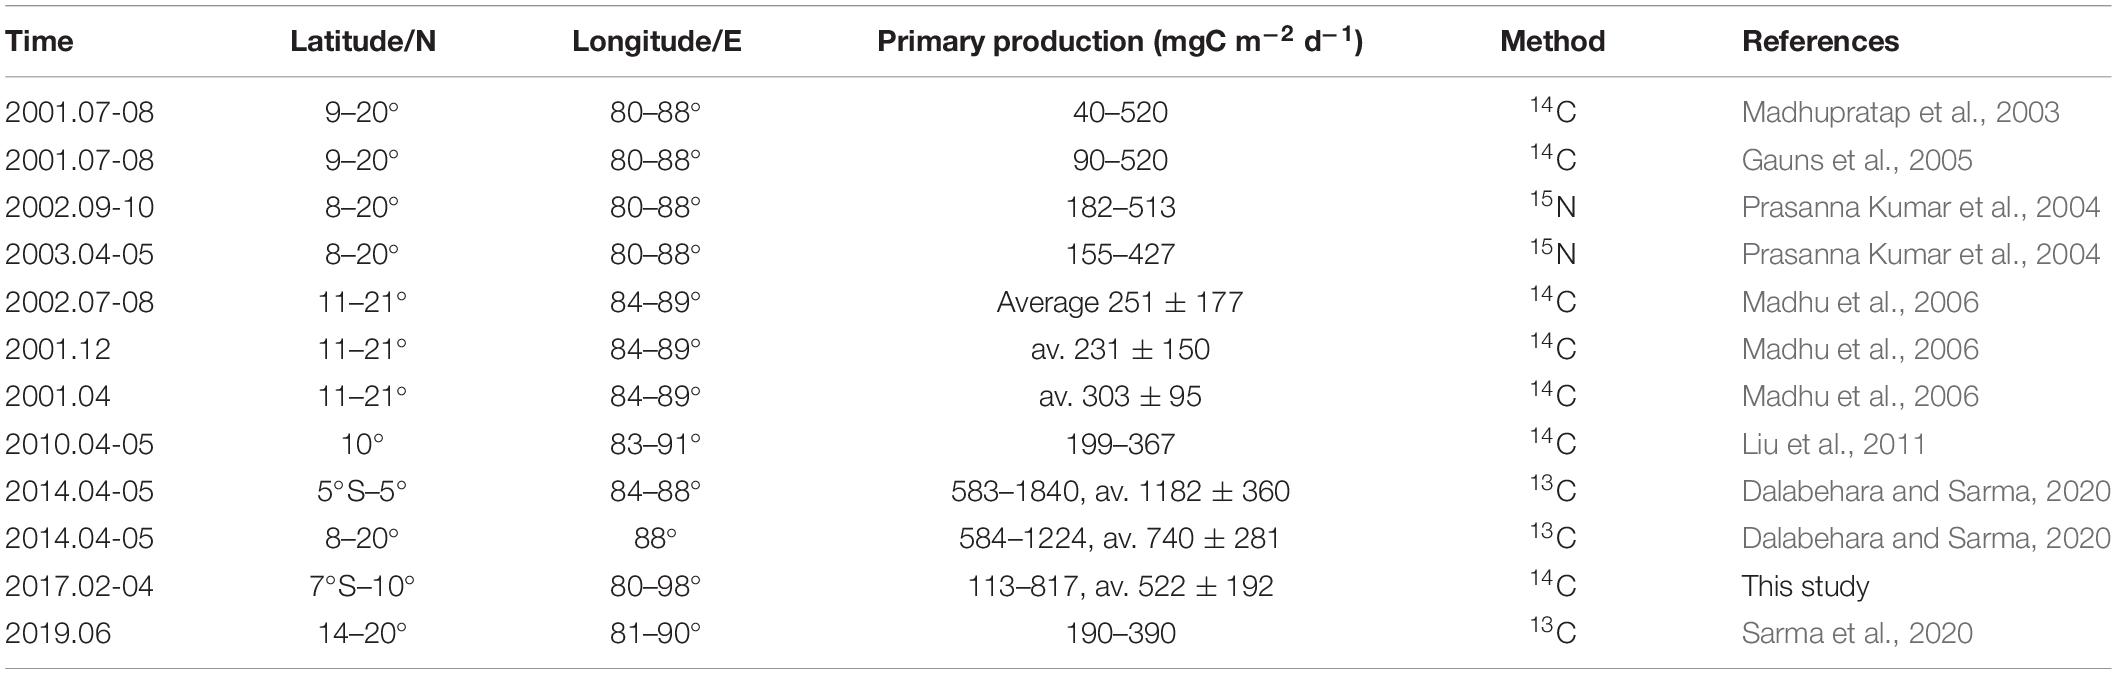
Table 2. Primary production in the eastern Indian Ocean.
In comparison with the Arabian Sea and the northern BoB, EIO study in the middle-latitude region sustained moderate PP levels (Table 1 and references therein). It fits our perception of primary production across the Indian Ocean in the Northern Hemisphere. Primary production is higher in the Arabian Sea and lower in the BoB, which can be explained by multiple factors, such as solar radiation, seawater stratification, nutrient input, and eddy activity (Barber et al., 2001; Kumar et al., 2007; Prasanna Kumar et al., 2010; Cheng et al., 2018).
The present in situ observations attempted to understand the spatial variability of NPP and the associated hydrographic properties within the photic zone in the EIO during the spring intermonsoon period. Analysis of deck-incubation data at 15 locations revealed that the tropical environment exhibited spatial variability in hydrochemistry, such as physical forcing, nutrient conditions, and biotic community. Influenced by these factors, a remarkable difference in the primary production rate was observed among the survey areas, especially between the BoB domain and the other domains. The phytoplankton primary production and photosynthetic efficiency have shown decreasing trends with depth; in particular, they are mostly present above the depth of the nitracline benefiting from moderate nutrient concentration values and solar radiation. The correlation and redundancy analyses distinctly explained that the PP of the study region depended on the phytoplankton groups and nutrient conditions. Dinoflagellates and colony-forming cyanobacteria (Trichodesmium) and calcifying coccolithophores were speculated to make important contributions to POC production, as evidenced by their consistent spatial distribution and correlation with primary production. The results presented here of the photic-zone PP rates and their spatial variability in response to local environments have far-reaching implications on the biogeochemistry and ecosystem processes of the EIO. A better understanding of the influence of physical processes on the NPP level and distribution may shed some light on the adaptation and sensitivity mechanisms of primary producers to the ongoing warming trends and human-induced climate forcing in the Indian Ocean.
The original contributions presented in the study are included in the article/supplementary material, further inquiries can be directed to the corresponding author.
HL drafted the original manuscript. YS helped the data processing. XZ revised the entire manuscript and polished the English language. GZ was responsible for nutrient measurements. ST reviewed the manuscript and supplied constructive comments. CW and XW assisted the sample collection. DW and JC were the lead of this investigation and responsible for funding sources. JS organized the field cruises and designed the experiment. All authors contributed to the article and approved the submitted version.
This publication was funded by the National Natural Science Foundation of China (41876134, 41676112, and 41276124) and the Changjiang Scholar Program of Chinese Ministry of Education of China (T2014253) to JS. This study was also supported by State Key Laboratory of Biogeology and Environmental Geology, China University of Geosciences (No. GKZ21Y645).
The authors declare that the research was conducted in the absence of any commercial or financial relationships that could be construed as a potential conflict of interest.
All claims expressed in this article are solely those of the authors and do not necessarily represent those of their affiliated organizations, or those of the publisher, the editors and the reviewers. Any product that may be evaluated in this article, or claim that may be made by its manufacturer, is not guaranteed or endorsed by the publisher.
The authors would like to thank the Open Cruise Project in the eastern Indian Ocean of National Natural Science Foundation of China (NORC2017-10) for sharing their ship time. The authors also acknowledge the Captain and Crews of R/V Shiyan3 for their co-ordination of the field cruise operation. The authors are thankful to the Elsevier language editing service to improve the language proficiency.
Barber, R. T., Marra, J., Bidigare, R. C., Codispoti, L. A., Halpern, D., Johnson, Z., et al. (2001). Primary productivity and its regulation in the Arabian Sea during 1995. Top. Stud. Oceanography 48, 1127–1172. doi: 10.1016/s0967-0645(00)00134-x
Behrenfeld, M. J., O’Malley, R. T., Siegel, D. A., McClain, C. R., Sarmiento, J. L., Feldman, G. C., et al. (2006). Climate-driven trends in contemporary ocean productivity. Nature 444:752. doi: 10.1038/nature05317
Behrenfeld, M. J., Randerson, J. T., McClain, C. R., Feldman, G. C., Los, S. O., Tucker, C. J., et al. (2001). Biospheric primary production during an ENSO transition. Science 291, 2594–2597. doi: 10.1126/science.1055071
Bermejo, P., Helbling, E. W., Durán-Romero, C., Cabrerizo, M. J., and Villafañe, V. E. (2018). Abiotic control of phytoplankton blooms in temperate coastal marine ecosystems: a case study in the South Atlantic Ocean. Sci. Total Environ. 612, 894–902. doi: 10.1016/j.scitotenv.2017.08.176
Bhavya, P., Kumar, S., Gupta, G., and Sudheesh, V. (2017). Carbon uptake rates in the Cochin estuary and adjoining coastal Arabian Sea. Estuaries Coasts 40, 447–456. doi: 10.1007/s12237-016-0147-144
Blazina, T., Laäderach, A., Jones, G. D., Sodemann, H., Wernli, H., Kirchner, J. W., et al. (2017). Marine primary productivity as a potential indirect source of selenium and other trace elements in atmospheric deposition. Environ. Sci. Technol. 51, 108–118. doi: 10.1021/acs.est.6b03063
Brewin, R. J. W., Tilstone, G. H., Jackson, T., Cain, T., Miller, P. I., Lange, P. K., et al. (2017). Modelling size-fractionated primary production in the Atlantic Ocean from remote sensing. Prog. Oceanogr. 158, 130–149. doi: 10.1016/j.pocean.2017.02.002
Buitenhuis, E. T., Hashioka, T., and Quéré, C. L. (2013). Combined constraints on global ocean primary production using observations and models. Global Biogeochem. Cy 27, 847–858. doi: 10.1002/gbc.20074
Bunt, J. S. (1975). Primary Productivity of Marine Ecosystems, Primary Productivity of the Biosphere. Berlin: Springer.
Carr, M.-E., Friedrichs, M. A. M., Schmeltz, M., Aita, M. N., Antoine, D., Arrigo, K. R., et al. (2006). A comparison of global estimates of marine primary production from ocean color. Deep Sea Res. Part II 53, 741–770. doi: 10.1016/j.dsr2.2006.01.028
Chassot, E., Bonhommeau, S., Dulvy, N. K., Mélin, F., Watson, R., Gascuel, D., et al. (2010). Global marine primary production constrains fisheries catches. Ecol. Lett. 13, 495–505. doi: 10.1111/j.1461-0248.2010.01443.xf
Chen, G., Han, W., Li, Y., McPhaden, M. J., Chen, J., Wang, W., et al. (2017). Strong intraseasonal variability of meridional currents near 5°N in the Eastern Indian Ocean: characteristics and causes. J. Phys. Oceanogr. 47, 979–998. doi: 10.1175/jpo-d-16-0250.1
Chen, G., Han, W., Shu, Y., Li, Y., Wang, D., and Xie, Q. (2016). The role of equatorial undercurrent in sustaining the Eastern Indian Ocean upwelling. Geophys. Res. Lett. 43, 6444–6451. doi: 10.1002/2016GL069433
Chen, G., Li, Y., Xie, Q., and Wang, D. (2018). Origins of eddy kinetic energy in the Bay of Bengal. J. Geophys. Res.- Oceans 123, 2097–2115. doi: 10.1002/2017JC013455
Cheng, X., McCreary, J. P., Qiu, B., Qi, Y., Du, Y., and Chen, X. (2018). Dynamics of eddy generation in the central Bay of Bengal. J. Geophys. Res.- Oceans 123, 6861–6875. doi: 10.1029/2018JC014100
Dalabehara, H. B., and Sarma, V. V. S. S. (2020). Physical forcing controls spatial variability in primary production in the Indian Ocean. Deep Sea Res. Part II: Top. Stud. Oceanography 183:104906. doi: 10.1016/j.dsr2.2020.104906
Dore, J. E., Letelier, R. M., Church, M. J., Lukas, R., and Karl, D. M. (2008). Summer phytoplankton blooms in the oligotrophic North Pacific Subtropical Gyre: historical perspective and recent observations. Prog. Oceanogr. 76, 2–38. doi: 10.1016/j.pocean.2007.10.002
Ehrhardt, M. A., Kremling, K., Almgren, T., and Grasshoff, K. M. (1976). Methods of Seawater Analysis. Hoboken, NJ: wiley.
Friedrichs, M. A. M., Carr, M.-E., Barber, R. T., Scardi, M., Antoine, D., Armstrong, R. A., et al. (2009). Assessing the uncertainties of model estimates of primary productivity in the tropical Pacific Ocean. J. Mar. Syst. 76, 113–133. doi: 10.1016/j.jmarsys.2008.05.010
Gauns, M., Madhupratap, M., Ramaiah, N., Jyothibabu, R., Fernandes, V., Paul, J. T., et al. (2005). Comparative accounts of biological productivity characteristics and estimates of carbon fluxes in the Arabian Sea and the Bay of Bengal. Deep Sea Res. Part II 52, 2003–2017. doi: 10.1016/j.dsr2.2005.05.009
Gomes, H. R., Goes, J. I., and Saino, T. (2000). Influence of physical processes and freshwater discharge on the seasonality of phytoplankton regime in the Bay of Bengal. Cont. Shelf Res. 20, 313–330. doi: 10.1016/S0278-4343(99)00072-72
Grande, K. D., Williams, P. J. L., Marra, J., Purdie, D. A., Heinemann, K., Eppley, R. W., et al. (1989). Primary production in the North Pacific gyre: a comparison of rates determined by the 14C, O2 concentration and 18O methods. Deep Sea Res. Part A. Oceanographic Res. Papers 36, 1621–1634. doi: 10.1016/0198-0149(89)90063-90060
Gusha, M. N., Dalu, T., Wasserman, R. J., and McQuaid, C. D. (2019). Zooplankton grazing pressure is insufficient for primary producer control under elevated warming and nutrient levels. Sci. Total Environ. 651, 410–418. doi: 10.1016/j.scitotenv.2018.09.132
Hama, T., Miyazaki, T., Ogawa, Y., Iwakuma, T., and Ichimura, S. (1983). Measurement of photosynthetic production of a marine phytoplankton population using a stable 13C isotope. Mar. Biol. 73, 31–36. doi: 10.1007/BF00396282
Hutchins, D., Hare, C., Weaver, R., Zhang, Y., Firme, G., DiTullio, G., et al. (2002). Phytoplankton iron limitation in the humboldt current and peru upwelling. Limnol. Oceanogr. 47, 997–1011. doi: 10.4319/lo.2002.47.4.0997
Ittekkot, V., Nair, R. R., Honjo, S., Ramaswamy, V., Bartsch, M., Manganini, S. J., et al. (1991). Enhanced particle fluxes in Bay of Bengal induced by injection of fresh water. Nature 351, 385–387. doi: 10.1038/351385a0
Juneau, P., and Harrison, P. J. (2005). Comparison by PAM fluorometry of photosynthetic activity of nine marine phytoplankton grown under identical conditions. Photochem. Photobiol. 81, 649–653. doi: 10.1111/j.1751-1097.2005.tb00239.x
Kerkar, A. U., Tripathy, S. C., Minu, P., Baranval, N., and Sarkar, A. (2020). Variability in primary productivity and bio-optical properties in the Indian sector of the Southern Ocean during an austral summer. Polar Biol. 43, 1469–1492. doi: 10.1007/s00300-020-02722-2722
Krause, G., and Weis, E. (1991). Chlorophyll fluorescence and photosynthesis: the basics. Annu. Rev. Plant Biol. 42, 313–349. doi: 10.1146/annurev.arplant.42.1.313
Kumar, S. P., Nuncio, M., Ramaiah, N., Sardesai, S., Narvekar, J., Fernandes, V., et al. (2007). Eddy-mediated biological productivity in the Bay of Bengal during fall and spring intermonsoons. Deep-Sea Res. (I: Oceanogr. Res. Pap). 54, 1619–1640. doi: 10.1016/j.dsr.2007.06.002
Laws, E. A., Landry, M. R., Barber, R. T., Campbell, L., Dickson, M.-L., and Marra, J. (2000). Carbon cycling in primary production bottle incubations: inferences from grazing experiments and photosynthetic studies using 14C and 18O in the Arabian Sea. Deep Sea Res. Part II: Top. Stud. Oceanography 47, 1339–1352. doi: 10.1016/S0967-0645(99)00146-140
Lean, D., and Burnison, B. (1979). An evaluation of errors in the 14C method of primary production measurement. Limnol. Oceanogr. 24, 917–928. doi: 10.2307/2835330
Lee, Z., Shang, S., Du, K., and Wei, J. (2018). Resolving the long-standing puzzles about the observed Secchi depth relationships. Limnol. Oceanogr. 63, 2321–2336. doi: 10.1002/lno.10940
Liu, H., Yun, M., Zhang, X., Zhang, G., Thangaraj, S., Huang, K., et al. (2020). Biological calcification rate and species-specific contributions of coccolithophores to total calcite inventory in the eastern Indian Ocean. J. Geophys. Res.-Biogeo. 125:e2019JG005547. doi: 10.1029/2019jg005547
Liu, X., Ke, Z., Song, X., Tan, Y., Huang, L., and Lin, Q. (2011). Primary production in the Bay of Bengal during spring intermonsoon period. Acta Ecol. Sin. 31, 7007–7012.
Löscher, C. R., Mohr, W., Bange, H. W., and Canfield, D. E. (2020). No nitrogen fixation in the Bay of Bengal? Biogeosciences 17, 851–864. doi: 10.5194/bg-17-851-2020
Ma, S., Tao, Z., Yang, X., Yu, Y., Zhou, X., Ma, W., et al. (2014). Estimation of marine primary productivity from satellite-derived phytoplankton absorption data. IEEE J. Selected Top. Appl. Earth Observat. Remote Sens. 7, 3084–3092. doi: 10.1109/JSTARS.2014.2298863
Madhu, N., Jyothibabu, R., Maheswaran, P., Gerson, V. J., Gopalakrishnan, T., and Nair, K. (2006). Lack of seasonality in phytoplankton standing stock (chlorophyll a) and production in the western Bay of Bengal. Cont. Shelf Res. 26, 1868–1883. doi: 10.1016/j.csr.2006.06.004
Madhupratap, M., Gauns, M., Ramaiah, N., Kumar, S. P., Muraleedharan, P., De Sousa, S., et al. (2003). Biogeochemistry of the Bay of Bengal: physical, chemical and primary productivity characteristics of the central and western Bay of Bengal during summer monsoon 2001. Deep Sea Res. Part II: Top. Stud. Oceanography 50, 881–896.
Mergulhao, L. P., Guptha, M., Unger, D., and Murty, V. (2013). Seasonality and variability of coccolithophore fluxes in response to diverse oceanographic regimes in the Bay of Bengal: sediment trap results. Palaeogeogr. Palaeoclimatol. Palaeoecol. 371, 119–135. doi: 10.1016/j.palaeo.2012.12.024
Moore, C. M., Mills, M. M., Arrigo, K. R., Berman-Frank, I., Bopp, L., Boyd, P. W., et al. (2013). Processes and patterns of oceanic nutrient limitation. Nat. Geosci. 6, 701–710. doi: 10.1038/ngeo1765
Morrow, R. M., Ohman, M. D., Goericke, R., Kelly, T. B., Stephens, B. M., and Stukel, M. R. (2018). CCE V: primary production, mesozooplankton grazing, and the biological pump in the California current ecosystem: variability and response to El Niño. Deep Sea Res. Part I: Oceanographic Res. Papers 140, 52–62. doi: 10.1016/j.dsr.2018.07.012
Muraleedharan, K. R., Jasmine, P., Achuthankutty, C. T., Revichandran, C., Kumar, P. K. D., Anand, P., et al. (2007). Influence of basin-scale and mesoscale physical processes on biological productivity in the Bay of Bengal during the summer monsoon. Prog. Oceanogr. 72, 364–383. doi: 10.1016/j.pocean.2006.09.012
Owens, N. J. P., Burkill, P. H., Mantoura, R. F. C., Woodward, E. M. S., Bellan, I. E., Aiken, J., et al. (1993). Size-fractionated primary production and nitrogen assimilation in the northwestern Indian Ocean. Deep Sea Res. Part II: Top. Stud. Oceanography 40, 697–709. doi: 10.1016/0967-0645(93)90053-P
Paasche, E., and Brubak, S. (1994). Enhanced calcification in the coccolithophorid Emiliania huxleyi (Haptophyceae) under phosphorus limitation. Phycologia 33, 324–330. doi: 10.2216/i0031-8884-33-5-324.1
Pai, S.-C., Tsau, Y.-J., and Yang, T.-I. (2001). pH and buffering capacity problems involved in the determination of ammonia in saline water using the indophenol blue spectrophotometric method. Anal. Chim. Acta 434, 209–216.
Parsons, T. R., Maita, Y. R., and Lalli, C. M. (1984). A Manual of Chemical & Biological Methods for Seawater Analysis. Oxford: Pergamin press.
Peng, S., Qian, Y.-K., Lumpkin, R., Du, Y., Wang, D., and Li, P. (2015). Characteristics of the near-surface currents in the Indian Ocean as deduced from satellite-tracked surface drifters. Part I: Pseudo-Eulerian Statistics. J. Phys. Oceanogr. 45, 441–458. doi: 10.1175/jpo-d-14-0050.1
Petrou, K., and Ralph, P. (2011). Photosynthesis and net primary productivity in three Antarctic diatoms: possible significance for their distribution in the Antarctic marine ecosystem. Mar. Ecol. Prog. Ser. 437, 27–40. doi: 10.3354/meps09291
Prasanna Kumar, S., Narvekar, J., Nuncio, M., Kumar, A., Ramaiah, N., Sardesai, S., et al. (2010). Is the biological productivity in the Bay of Bengal light limited? Curr. Sci. 98, 1331–1339. doi: 10.1371/journal.pone.0010816
Prasanna Kumar, S., Nuncio, M., Narvekar, J., Kumar, A., Sardesai, D. S., De Souza, S., et al. (2004). Are eddies nature’s trigger to enhance biological productivity in the Bay of Bengal? Geophys. Res. Lett. 31:L07309 doi: 10.1029/2003GL019274
Regaudie-de-Gioux, A., Lasternas, S., Agustí, S., and Duarte, C. (2014). Comparing marine primary production estimates through different methods and development of conversion equations. Front. Mar. Sci. 1:19. doi: 10.3389/fmars.2014.00019
Roxy, M. K., Modi, A., Murtugudde, R., Valsala, V., Panickal, S., Prasanna Kumar, S., et al. (2016). A reduction in marine primary productivity driven by rapid warming over the tropical Indian Ocean. Geophys. Res. Lett. 43, 826–833. doi: 10.1002/2015GL066979
Ryther, J. H., Hall, J. R., Pease, A. K., Bakun, A., and Jones, M. M. (1966). Primary organic production in relation to the chemistry and hydrography of the western Indian Ocean. Limnol. Oceanogr. 11, 371–380. doi: 10.4319/lo.1966.11.3.0371
Saba, V. S., Friedrichs, M. A., Antoine, D., Armstrong, R., Asanuma, I., Behrenfeld, M., et al. (2011). An evaluation of ocean color model estimates of marine primary productivity in coastal and pelagic regions across the globe. Biogeosciences 8, 489–503. doi: 10.5194/bg-8-489-2011
Sarma, V. V. S. S., Chopra, M., Rao, D. N., Priya, M., and Rao, V. D. (2020). Role of eddies on controlling total and size-fractionated primary production in the Bay of Bengal. Cont. Shelf Res. 204:104186. doi: 10.1016/j.csr.2020.104186
Sarma, V. V. S. S., Swathi, P. S., Kumar, M. D., Prasannakumar, S., Bhattathiri, P. M. A., Madhupratap, M., et al. (2003). Carbon budget in the eastern and central Arabian Sea: an Indian JGOFS synthesis. Global Biogeochem. Cy 17:1102. doi: 10.1029/2002GB001978
Siegel, D. A., Buesseler, K. O., Behrenfeld, M. J., Benitez-Nelson, C. R., Boss, E., Brzezinski, M. A., et al. (2016). Prediction of the export and fate of global ocean net primary production: the exports science plan. Front. Mar. Sci. 3:22. doi: 10.3389/fmars.2016.00022
Smith, V. H. (2006). Using primary productivity as an index of coastal eutrophication: the units of measurement matter. J. Plankton Res. 29, 1–6. doi: 10.1093/plankt/fbl061
Vase, V. K., Dash, G., Sreenath, K., Temkar, G., Shailendra, R., Koya, K. M., et al. (2018). Spatio-temporal variability of physico-chemical variables, chlorophyll a, and primary productivity in the northern Arabian Sea along India coast. Environ. Monit. Assess. 190:148. doi: 10.1007/s10661-018-6490-6490
Venrick, E. L. (1974). The distribution and significance of Richelia intracellularis Schmidt in the North Pacific Central Gyre. Limnol. Oceanogr. 19, 437–445. doi: 10.4319/lo.1974.19.3.0437
Waite, A., Rossi, V., Roughan, M., Tilbrook, B., Akl, J., Thompson, P., et al. (2013). Formation and maintenance of high-nitrate, low pH layers in the Eastern Indian Ocean and the role of nitrogen fixation. Biogeosci. Disc. 10, 5691–5702. doi: 10.5194/bgd-10-3951-2013
Wei, Y., Wang, X., Gui, J., and Sun, J. (2021). Significant pico- and nanoplankton contributions to biogenic silica standing stocks and production rates in the oligotrophic Eastern Indian Ocean. Ecosystems 24, 1654–1669. doi: 10.1007/s10021-021-00608-w
Wiggert, J. D., Murtugudde, R. G., and Christian, J. R. (2006). Annual ecosystem variability in the tropical Indian Ocean: results of a coupled bio-physical ocean general circulation model. Deep-Sea Res. Part II 53, 644–676. doi: 10.1016/j.dsr2.2006.01.027
Wu, C., Sun, J., Liu, H., Xu, W., Zhang, G., Lu, H., et al. (2021). Evidence of the significant contribution of heterotrophic diazotrophs to nitrogen fixation in the eastern indian ocean during pre-southwest monsoon period. Ecosystems. doi: 10.1007/s10021-021-00702-z
Wyrtki, K., Magaard, L., and Hager, J. (1976). Eddy energy in the oceans. J. Geophys. Res. 81, 2641–2646. doi: 10.1029/JC081i015p02641
Xie, Y., Lizhen, L., Xiao, W., Yu, X., Lan, W., and Huang, B. (2020). Striking seasonal pattern of primary production in the river-dominated ocean margin of the northern South China Sea (NSCS-RiOMar) revealed by new field and remotely sensed data. Prog. Oceanogr. 189:102470. doi: 10.1016/j.pocean.2020.102470
Keywords: primary productivity, phytoplankton, radioactive 14C labeling, eastern Indian Ocean, photosynthetic efficiency
Citation: Liu H, Song Y, Zhang X, Zhang G, Wu C, Wang X, Thangaraj S, Wang D, Chen J and Sun J (2021) Spatial Variation in Primary Production in the Eastern Indian Ocean. Front. Mar. Sci. 8:757529. doi: 10.3389/fmars.2021.757529
Received: 12 August 2021; Accepted: 15 November 2021;
Published: 16 December 2021.
Edited by:
Yong Zhu, Second Institute of Oceanography, Ministry of Natural Resources, ChinaReviewed by:
Xin Liu, Xiamen University, ChinaCopyright © 2021 Liu, Song, Zhang, Zhang, Wu, Wang, Thangaraj, Wang, Chen and Sun. This is an open-access article distributed under the terms of the Creative Commons Attribution License (CC BY). The use, distribution or reproduction in other forums is permitted, provided the original author(s) and the copyright owner(s) are credited and that the original publication in this journal is cited, in accordance with accepted academic practice. No use, distribution or reproduction is permitted which does not comply with these terms.
*Correspondence: Jun Sun, cGh5dG9wbGFua3RvbkAxNjMuY29t
Disclaimer: All claims expressed in this article are solely those of the authors and do not necessarily represent those of their affiliated organizations, or those of the publisher, the editors and the reviewers. Any product that may be evaluated in this article or claim that may be made by its manufacturer is not guaranteed or endorsed by the publisher.
Research integrity at Frontiers
Learn more about the work of our research integrity team to safeguard the quality of each article we publish.