 Lorenzo C. Halasan
 Paul John L. Geraldino
 Hsiu-Chin Lin
- 1Department of Marine Biotechnology and Resources, National Sun Yat-sen University, Kaohsiung, Taiwan
- 2Department of Biology, University of San Carlos, Cebu, Philippines
- 3Doctoral Degree Program in Marine Biotechnology, National Sun Yat-sen University, Kaohsiung, Taiwan
The yellowstripe scad, Selaroides leptolepis (Carangidae), is an important fish commodity in the Tropical Western Pacific (TWP). It has a latitudinal Pacific range from south of Japan down to northern Australia, with the highest concentration in Southeast Asia. However, its TWP fishing grounds have long been a hotspot of unsustainable exploitations, thus threatening the remaining wild populations. Despite the species’ commercial significance, there is limited understanding of its genetic structure and diversity. Herein, the genetic structure of S. leptolepis was examined using mitochondrial COI and CytB sequences. Both markers denoted significant genetic structuring based on high overall FST values. Hierarchical analysis of molecular variance (AMOVA), maximum likelihood (ML) phylogenetic trees, and median-joining (MJ) haplotype networks strongly supported the occurrence of two allopatrically distributed lineages. These comprised of a widespread Asian lineage and an isolated Australian lineage. Within-lineage distances were low (K2P < 1%) whereas across-lineage distances were remarkably high (K2P > 6%), already comparable to that of interspecific carangid divergences. Haplotype sequence memberships, high genetic variations, and the geographic correlation suggested that the Australian lineage was a putative cryptic species. Historical demographic inferences also revealed that the species experienced rapid expansion commencing on the late Pleistocene, most likely during the end of the Last Glacial Maximum (∼20,000 years ago). The present study encouraged the application of lineage-specific management efforts, as the lineages are experiencing different evolutionary pressures. Overall, accurate knowledge of the species’ genetic distribution is fundamental in protecting its diversity and assuring stock sustainability.
Introduction
The yellowstripe scad, Selaroides leptolepis, is an economically important fish commodity in the Tropical Western Pacific (TWP). This species is highly exploited in Southeast Asian countries, particularly Malaysia, Indonesia, the Philippines, and in the United Arab Emirates (Kempter, 2015; Figure 1). The S. leptolepis is commonly consumed fried, steamed, sun-dried, and even prepared as components of surimi and burger patties (Yu and Siah, 1998; Arfat and Benjakul, 2012). Aside from being a good source of dietary protein, it also contains other functional biomaterials such as protein hydrolyzates and histamine (Klompong et al., 2009; Huang et al., 2010). Since the market price of S. leptolepis is relatively more affordable than other fish groups (Kempter, 2015), it is highly patronized by local consumers. The species’ commercial significance, however, also makes it a vulnerable target of extensive exploitations.
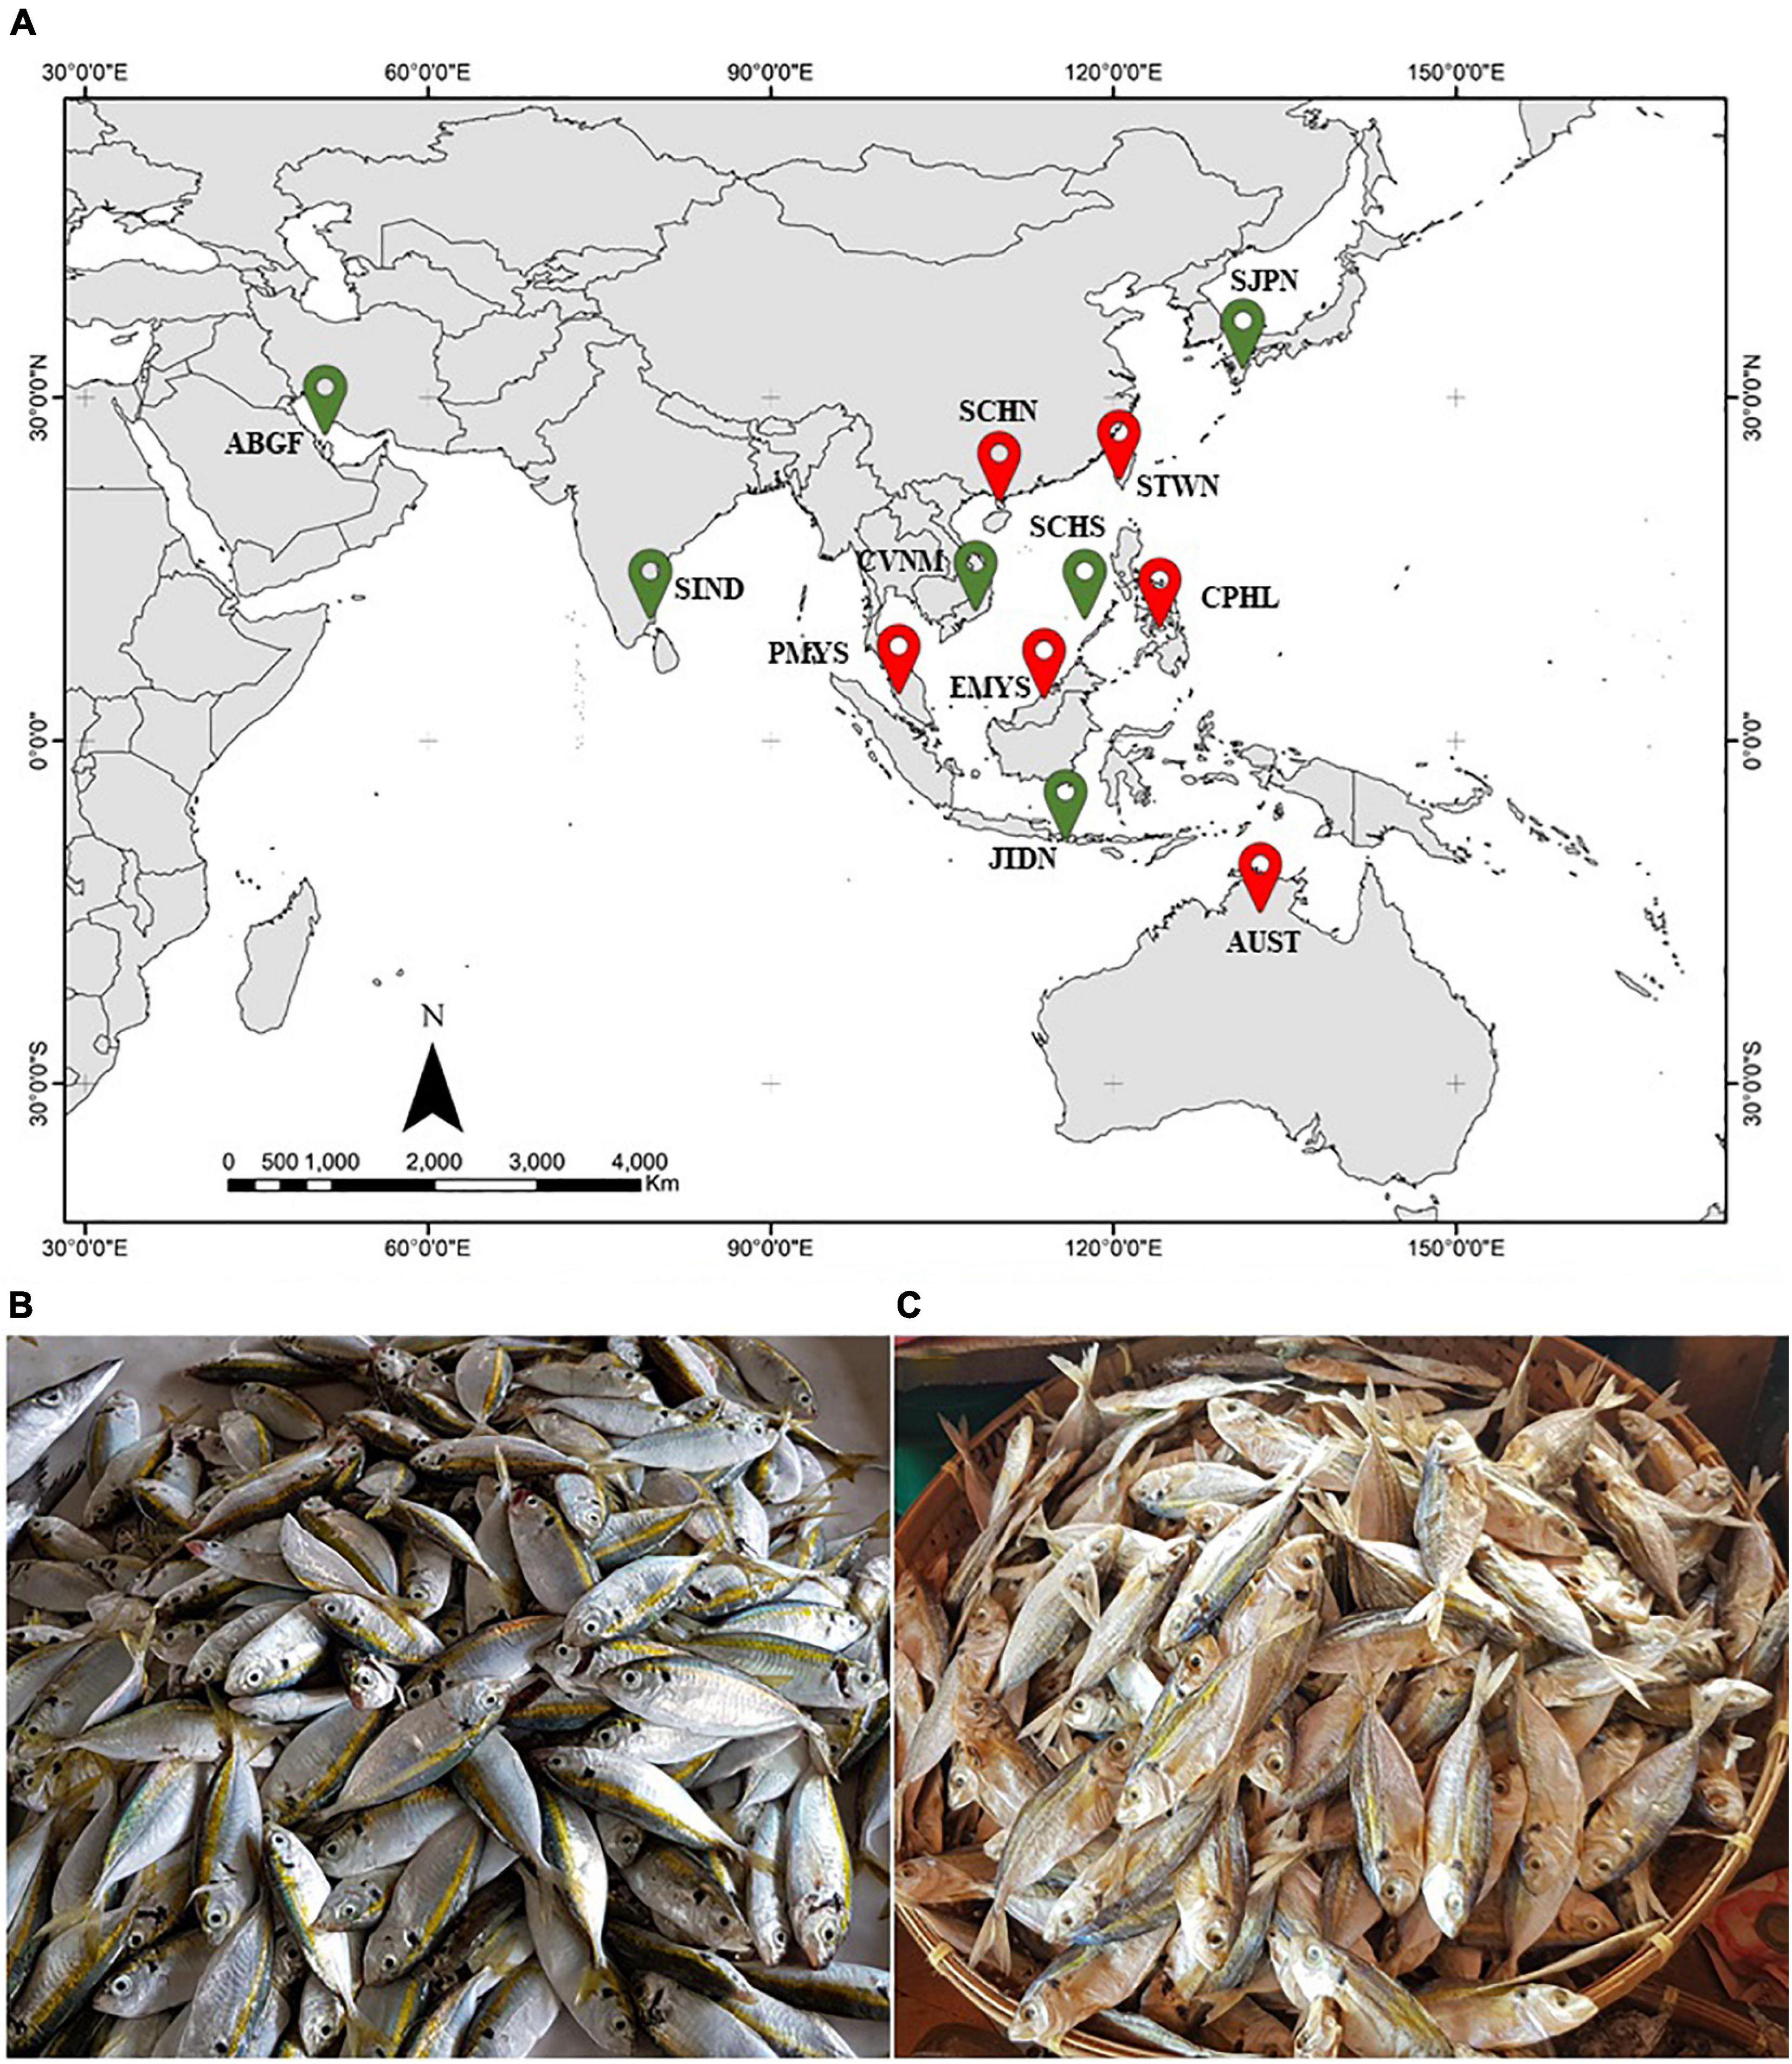
Figure 1. (A) Major collection sites from this study indicated by  (n > 10 individuals) and
  (n < 10 individuals). The map is courtesy of The World Bank Org (2021). (B) Fresh and (C) dried S. leptolepis sold at a local fish market in Central Philippines (CPHL).
The S. leptolepis is the only representative of the genus Selaroides (Family Carangidae). Its closest relatives include Selar, Alepes, Hemicaranx, Chloroscombrus, and Caranx of the Tribe Carangini (Reed et al., 2002). Taxonomically, S. leptolepis is often misidentified as its Carangid relative—Selar crumenophthalmus (Bloch et al., 1793) due to morphological similarities. S. leptolepis differs by the absence of papilla on the lower pectoral girdle, absence of teeth on the upper jaw, and prominence of the longitudinal yellow stripe on its body (Nakabo, 2002). As a demersal species, S. leptolepis is commonly found in inshore waters shallower than 50 m (Allen and Erdmann, 2012). It is widely distributed throughout the tropical and subtropical Indian and Pacific waters (Abdussamad et al., 2013). In the TWP, it has a latitudinal distribution range from the south of Japan (Hata et al., 2017), down to the Indo-Malay-Philippine archipelagos (IMPA) (Mat Jaafar et al., 2012), and northern Australia (Dell et al., 2009).
Considered as one of the globally most important fishing regions, the TWP accounts for almost half of the world’s marine fisheries production (Food and Agriculture Organization [FAO], 2020) and houses the top capture fish producers of the world, namely China, Indonesia, Vietnam, and Japan (Food and Agriculture Organization [FAO], 2020). Its IMPA region, in particular, is also considered a megadiverse area, with several studies documenting the presence of genetically distinct fish populations in the region (Rohfritsch and Borsa, 2005; Salini et al., 2006; Hubert et al., 2012; Thomas et al., 2014). The high biodiversity index of TWP had been attributed to its geologic history, oceanographic dynamics, capacity for biomass support, and vicariance histories (Carpenter and Springer, 2005; Gaither and Rocha, 2013). Unfortunately, some TWP fishing grounds have been experiencing high percentages of unsustainable fisheries. Stock depletions have already been reported in several fishing grounds within the TWP (Teh et al., 2007; Guanco et al., 2009; Tangke et al., 2018; Fauziyah et al., 2020). Records also revealed a steady decline in the global yield of S. leptolepis after reaching peak production in 2014 (Food and Agriculture Organization [FAO], 2021). The conservation of S. leptolepis and other demersal fishes is important since these groups constitute a significant portion of the TWP capture fisheries (Food and Agriculture Organization [FAO], 2020).
In fisheries management, the reduction of genetic diversity on the remaining natural populations remains a major problem. This loss of genetic diversity translates into reduced population fitness and its inability to adapt against evolutionary pressures (Kenchington, 2003). To address these problems, the incorporation of molecular techniques in conservation studies had been practiced. These techniques can reveal valuable genetic information, including a species’ pattern of distribution and the demographic history of its populations. Clear information on the genetic structures allows us to define management zones and assess risks to overexploitation. Only a few records have documented the genetic distribution of S leptolepis, and all were done on small regional scales (Kempter, 2015; Mat Jaafar et al., 2020). There is no available information on its extant genetic structure and diversity in the TWP scale, hence this study.
The objective of this study was to investigate the intraspecies genetic diversity, structure, and demographic history of S. leptolepis in TWP. Sequence data from the mitochondrial DNA Cytochrome Oxidase I (COI) and Cytochrome B (CytB) regions were utilized to infer genetic structures. The mtDNA genome is conserved across animal lineages, contains few duplications, mutates rapidly, and is relatively easy to isolate—making it a good marker for intraspecies genetic studies (Desalle et al., 2017; Zhang et al., 2020). The COI and CytB have moderate evolutionary rates than other mtDNA genes (Kochzius et al., 2010; Kartavtsev, 2011) and their fragments contain adequate informative phylogenetic information (Liu et al., 2021). The coupled use of COI and CytB had not only been applied to barcode animal taxa and infer deep intraspecies divergences (Baker et al., 1995; Smith et al., 2011; Çiftçi et al., 2013; Joshi et al., 2019), but also to detect provisional cryptic populations awaiting thorough screenings (Asgharian et al., 2011; Hubert et al., 2012; Sienes et al., 2014; Thongtam Na Ayudhaya et al., 2017). Findings from this study serve as baseline information for the fishery management and sustainable utilization of S. leptolepis given its economic relevance and understudied status.
Materials and Methods
Sampling and DNA Extraction
Selaroides leptolepis individuals were obtained from landing sites and wet markets from Central Philippines (n = 132) and Southern Taiwan (n = 43) between 2018 and 2021. Identification was based on morphological characters (i.e., longitudinal yellow stripe from upper part of eye to caudal peduncle, toothless upper jaw, and lower pectoral girdle absent of papilla; Nakabo, 2002; Motomura et al., 2017; Koeda and Ho, 2019). Approximately 1 g of muscle from the right caudal peduncle of each fish were stored in 2 ml tubes with 95% ethanol prior to genomic extraction. Donated muscle tissues from museum collections were also included and subjected to genomic extractions. These samples originated from Taiwan (n = 6), Philippines (n = 1), Malaysia (n = 1), and Australia (n = 16). More information regarding these samples can be found in Supplementary Table 1. Extraction was carried out using ReliaPrepTM gDNA Tissue Miniprep System (Promega) or Genomic DNA Extraction Kit 2.0 (Yeastern Biotech) following manufacturers’ protocols.
Polymerase Chain Reaction Amplification and Sequencing
The COI gene portion was amplified using published primers, namely, FishF1 (5′-TCA ACC AAC CAC AAA GAC ATT GGC AC-3′) and FishR1 (5′-TAG ACT TCT GGG TGG CCA AAG AAT CA-3′) (Ward et al., 2005); whereas the CytB regions were amplified using CytbF (5′-GGC TGA TTC GGA ATA TGC AYG CNA AYG G-3′) and CytbR (5′-GGG AAT GGA TCG TAG AAT TGC RTA NGC RAA-3′) (Kochzius et al., 2010). Amplifications were performed in 20 μl reaction volumes containing 10 μl Ampliqon Taq DNA Polymerase Master Mix, 1 μl of genomic DNA, 0.5 μl of each primer, and 8 μl of ultrapure water. Polymerase chain reaction (PCR) for both markers was carried out with an initial denaturation at 94°C for 2 min, followed by 35 cycles of 94°C denaturation for 30 s, 52°C annealing for 40 s, 72°C extension for 1 min, and final extension of 72°C for 10 min. The quality of the PCR products was evaluated in 1.5% agarose gel. PCR amplicons were either sent to Macrogen Inc. (Seoul, South Korea) or Genomics (New Taipei, Taiwan) for bidirectional sequencing using the mentioned respective PCR primers. Obtained sequences were quality checked and assembled in Sequencher 5.4.6 (Ann Arbor, MI, United States).
Data Analyses
Additional sequences publicly stored in GenBank were also incorporated in the analyses (Supplementary Table 2). COI sequences included the Malaysian dataset published by Mat Jaafar et al. (2020) (n = 70).
Genetic Diversity and Structuring
Sequences were aligned in BioEdit 7.2.5 (Hall, 1999) using Clustal W option with default settings and trimmed to 517- and 527-bp lengths, respectively, for COI and CytB. These were then exported to DnaSP 6.12 (Rozas et al., 2017) for clustering and haplotype generation. Sequences were grouped according to collection regions, namely: South Japan (SJPN), South Taiwan (STWN), Southeast China (SECH), Central Vietnam (CVNM), South China Sea (SCHS), Central Philippines (CPHL), Peninsular Malaysia (PMYS), East Malaysia (EMYS), Java Indonesia (JIDN), Southern Indian Peninsula (SIND), Arabian Gulf (ABGF), and Australia (AUST) (Figure 1 and Table 1). Selection of the best-fit nucleotide substitution models through the Akaike information criteria (AIC) were carried out separately for COI and CytB using MEGA X (Kumar et al., 2018). Since some analyses were sensitive to the sample sizes, only groups with n >10 sequences were included in the following calculations: estimations for genetic diversity (Hd), nucleotide diversity (π), and analysis of molecular variance (AMOVA)—which were carried out in Arlequin 3.5.2.2 (Excoffier and Lischer, 2010). K2P sequence divergence was calculated using MEGA X. For COI, the n >10 groups included STWN, SECH, CPHL, PMYS, EMYS, and AUST, while CytB only included STWN, CPHL, and AUST (Table 1).
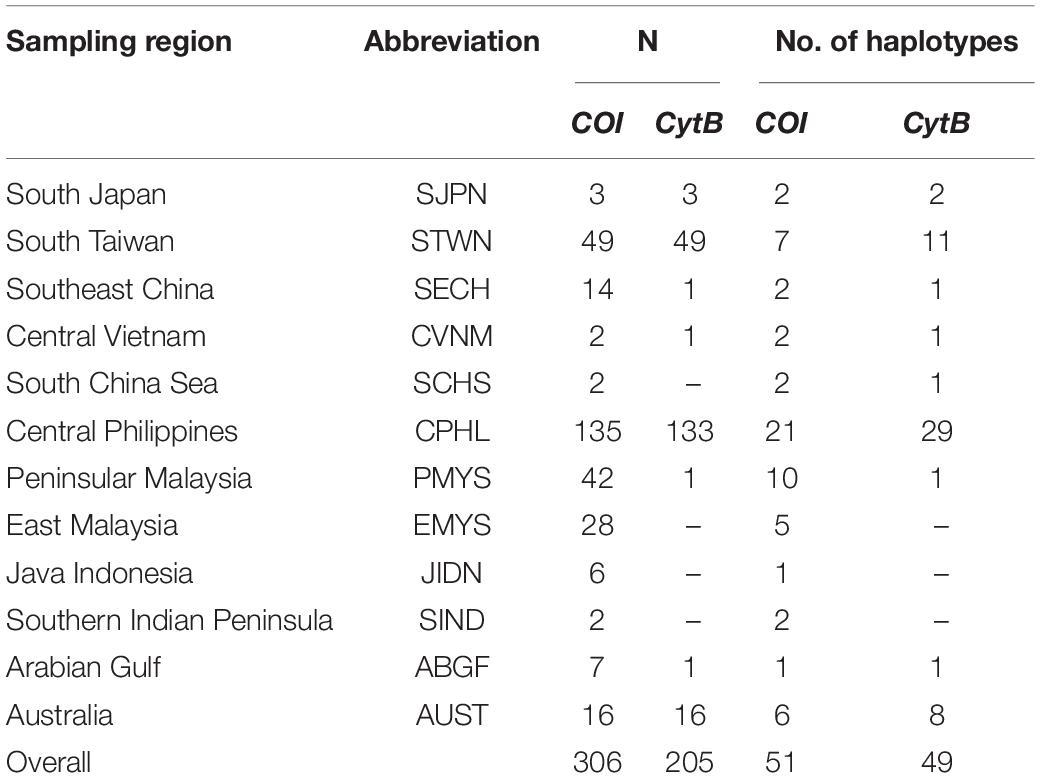
Table 1. Sampling region and abbreviations, sample size (N), and the number of haplotypes.
For phylogenetic trees and haplotype networks generations that were not sensitive to sample sizes, individuals from sparsely represented geographic regions (n > 10) were incorporated to explore the global relationship among all the available sequences. These regions included SJPN, SCHS, JIDN, SIND, and ABGF for COI, and SJPN, SCHN, CVNM, PMYS, and ABGF for CytB (Table 1 and Supplementary Table 2). The inclusion of these sequences was relevant, as these regions represented individuals from the species’ holotype collection site (i.e., JIDN, Cuvier and Valenciennes, 1833) and marginal distribution range (i.e., Southern Japan, Indian Ocean; Prabhu, 1956; Abdussamad et al., 2013; Hata et al., 2017). Maximum likelihood (ML) phylogenetic trees were created in MEGA X under substitution models K2P (COI) and K2P + G (CytB), with S. crumenophthalmus as the outgroup. PopART 1.7 (Leigh and Bryant, 2015) was used to generate the median-joining (MJ) haplotype networks.
Demographic History
Neutrality tests and effective population size change estimations were done for the n >10 sample groups. These were performed to infer historical demography and evolution neutrality. Deviation from the neutrality model was calculated using Tajima’s D (Tajima, 1989) and Fu’s Fs (Fu, 1997) in Arlequin 3.5.2.2. These indices indicate whether populations underwent expansions. Further inferences on historical demography were carried out with a mismatch distribution analysis. Demographic parameters such as tau (τ), θ0, θ1, sum of squared deviation (SSD), and Harpending’s raggedness index (Hri) were also calculated in Arlequin 3.5.2.2. Graphical figures showing the pairwise comparison between the frequency of individuals (y-axis) with the corresponding number of pairwise differences (x-axis) were generated using DnaSP v6.12.
Changes in effective population size (Ne) across time were inferred using Bayesian skyline plot analysis (Drummond et al., 2005) implemented in BEAST 2.6.5 (Bouckaert et al., 2019). XML files were initially prepared with BEAUti 2.6.5 (Bouckaert et al., 2019). The HKY + G nucleotide substitution model was selected for both markers to take into account possible site-specific variations (Hill and Baele, 2019), and applied a strict clock mutation rate of 1 × 10⁻⁸ per site per year as suggested for reef fishes (Stewart Grant et al., 2012; Delrieu-Trottin et al., 2017). Independent Markov chain Monte Carlo (MCMC) analyses were ran for 100 million generations with a burn-in of 10 million and sampled every 1,000 iterations. If necessary, runs were repeated until combined ESS >200 values were attained, and consensus of these parameter values were visualized in Tracer 1.7.2 (Rambaut et al., 2018).
Results
Genetic Diversity
A total of 306 and 205 sequences were generated for COI and CytB, respectively. Fifty-one haplotypes were identified from the 517-bp COI fragment (GenBank accession numbers: MZ520638–MZ520664), whereas 49 haplotypes were identified from the 527-bp CytB (GenBank accession numbers: MZ55565 8–MZ555703). Thirty-eight singletons were found for COI and 40 for CytB. Overall, 69 and 65 polymorphic sites were identified for COI and CytB, of which 45 and 40 were parsimony informative, and 22 and 25 were singleton variables, respectively. Global genetic diversities were high (COIglobal Hd = 0.7825; CytBglobal Hd = 0.7364) while nucleotide diversities were low (COIglobal π = 0.0119; CytBglobal π = 0.0106). Corresponding nucleotide composition for COI and CytB were 23.21 and 22.69% adenine, 29.15 and 28.63% thymine, 29.68 and 33.22% cytosine, and 17.96 and 15.46% guanine. The genetic indices for each group were presented in Table 2.
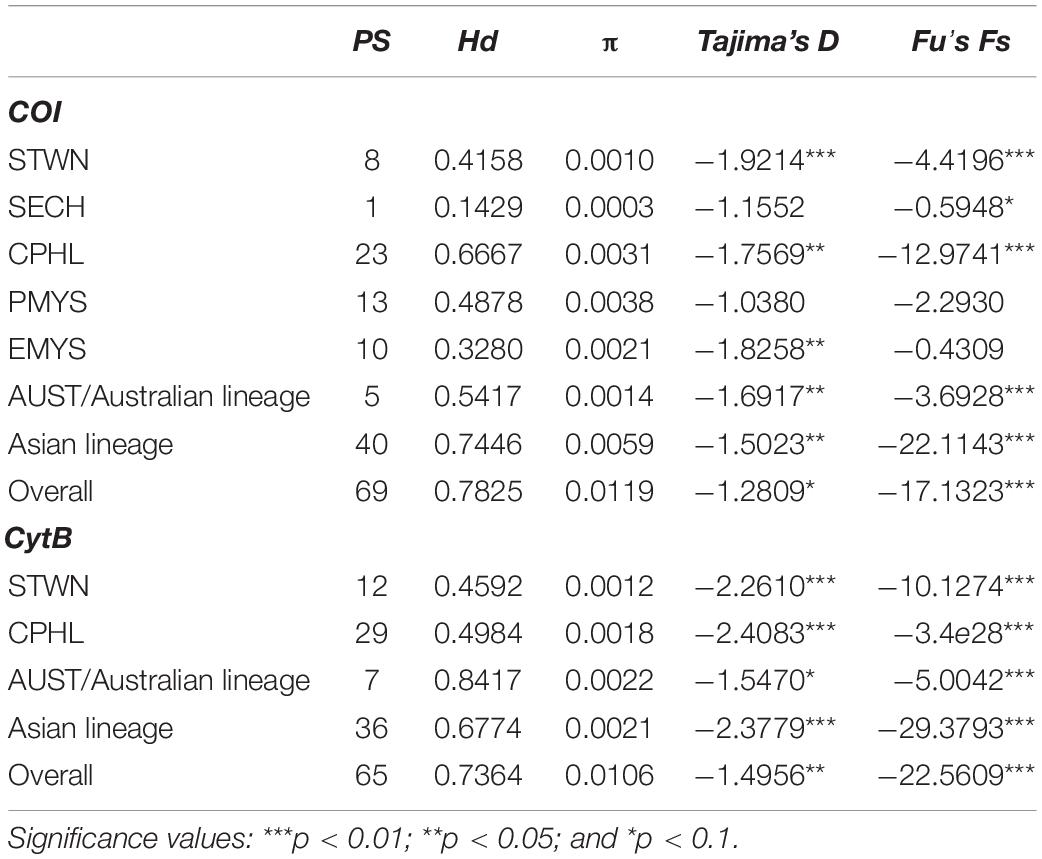
Table 2. Polymorphic sites (PS), haplotype diversity (Hd), nucleotide diversity (π), and Tajima’s D and Fu’s Fs indices for cytochrome oxidase I (COI) and cytochrome B (CytB).
Genetic Structure and Phylogeographic Relationships
Overall, pairwise FST values for both markers showed significant genetic variation (p < 0.05) across populations. For COI, AUST, and CPHL significantly differed from the rest of the groups. AUST exhibited the highest pairwise differentiation (FST > 0.95) followed by CPHL (FST > 0.62). For CytB, all three sampling regions (STWN, CPHL, and AUST) significantly differed from each other. Pairwise FST values across each sampling group were presented in Table 3. Hierarchical AMOVA also showed the highest among-clusters FCT variability when AUST was separated from the others (COI = 0.8847; CytB = 0.9491), though the variation was statistically insignificant at p > 0.05. Additional AMOVA results from other hypothetical combinations are shown in Table 4.
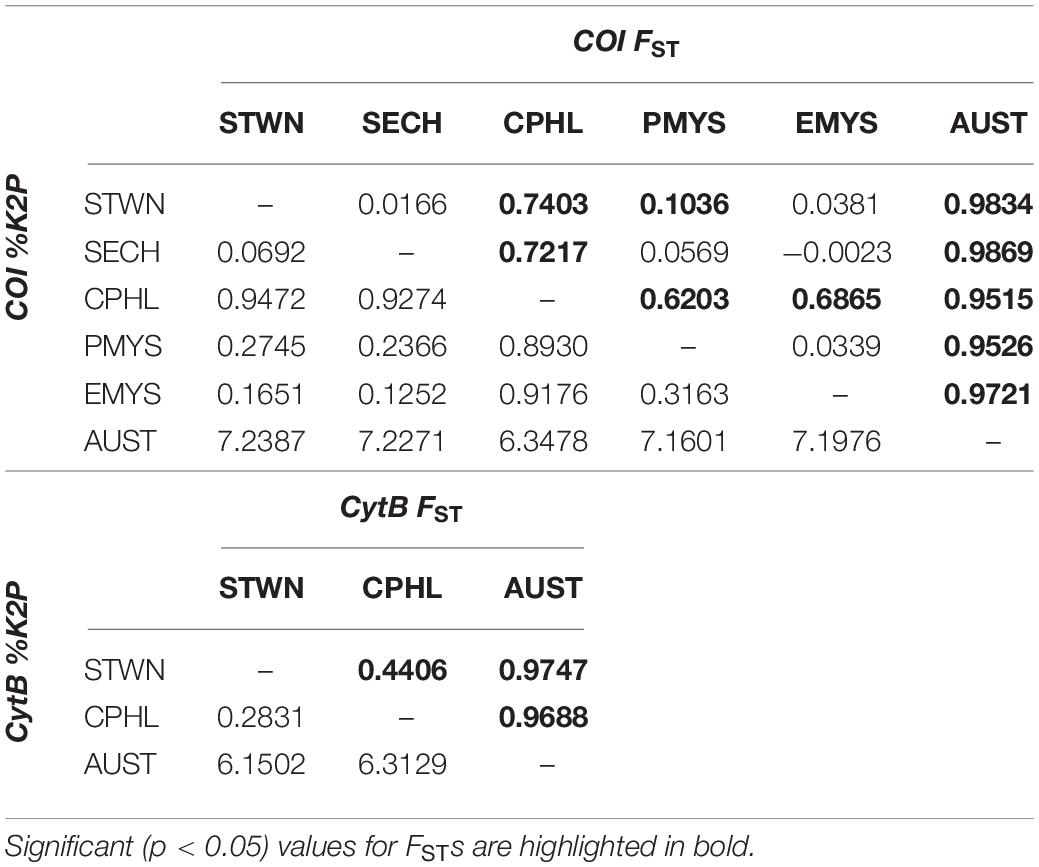
Table 3. Population pairwise distances using FSTs (upper diagonals) and Kimura two-parameter (%K2P) (lower diagonals) for cytochrome oxidase I (COI) (upper table) and cytochrome B (CytB) (lower table).
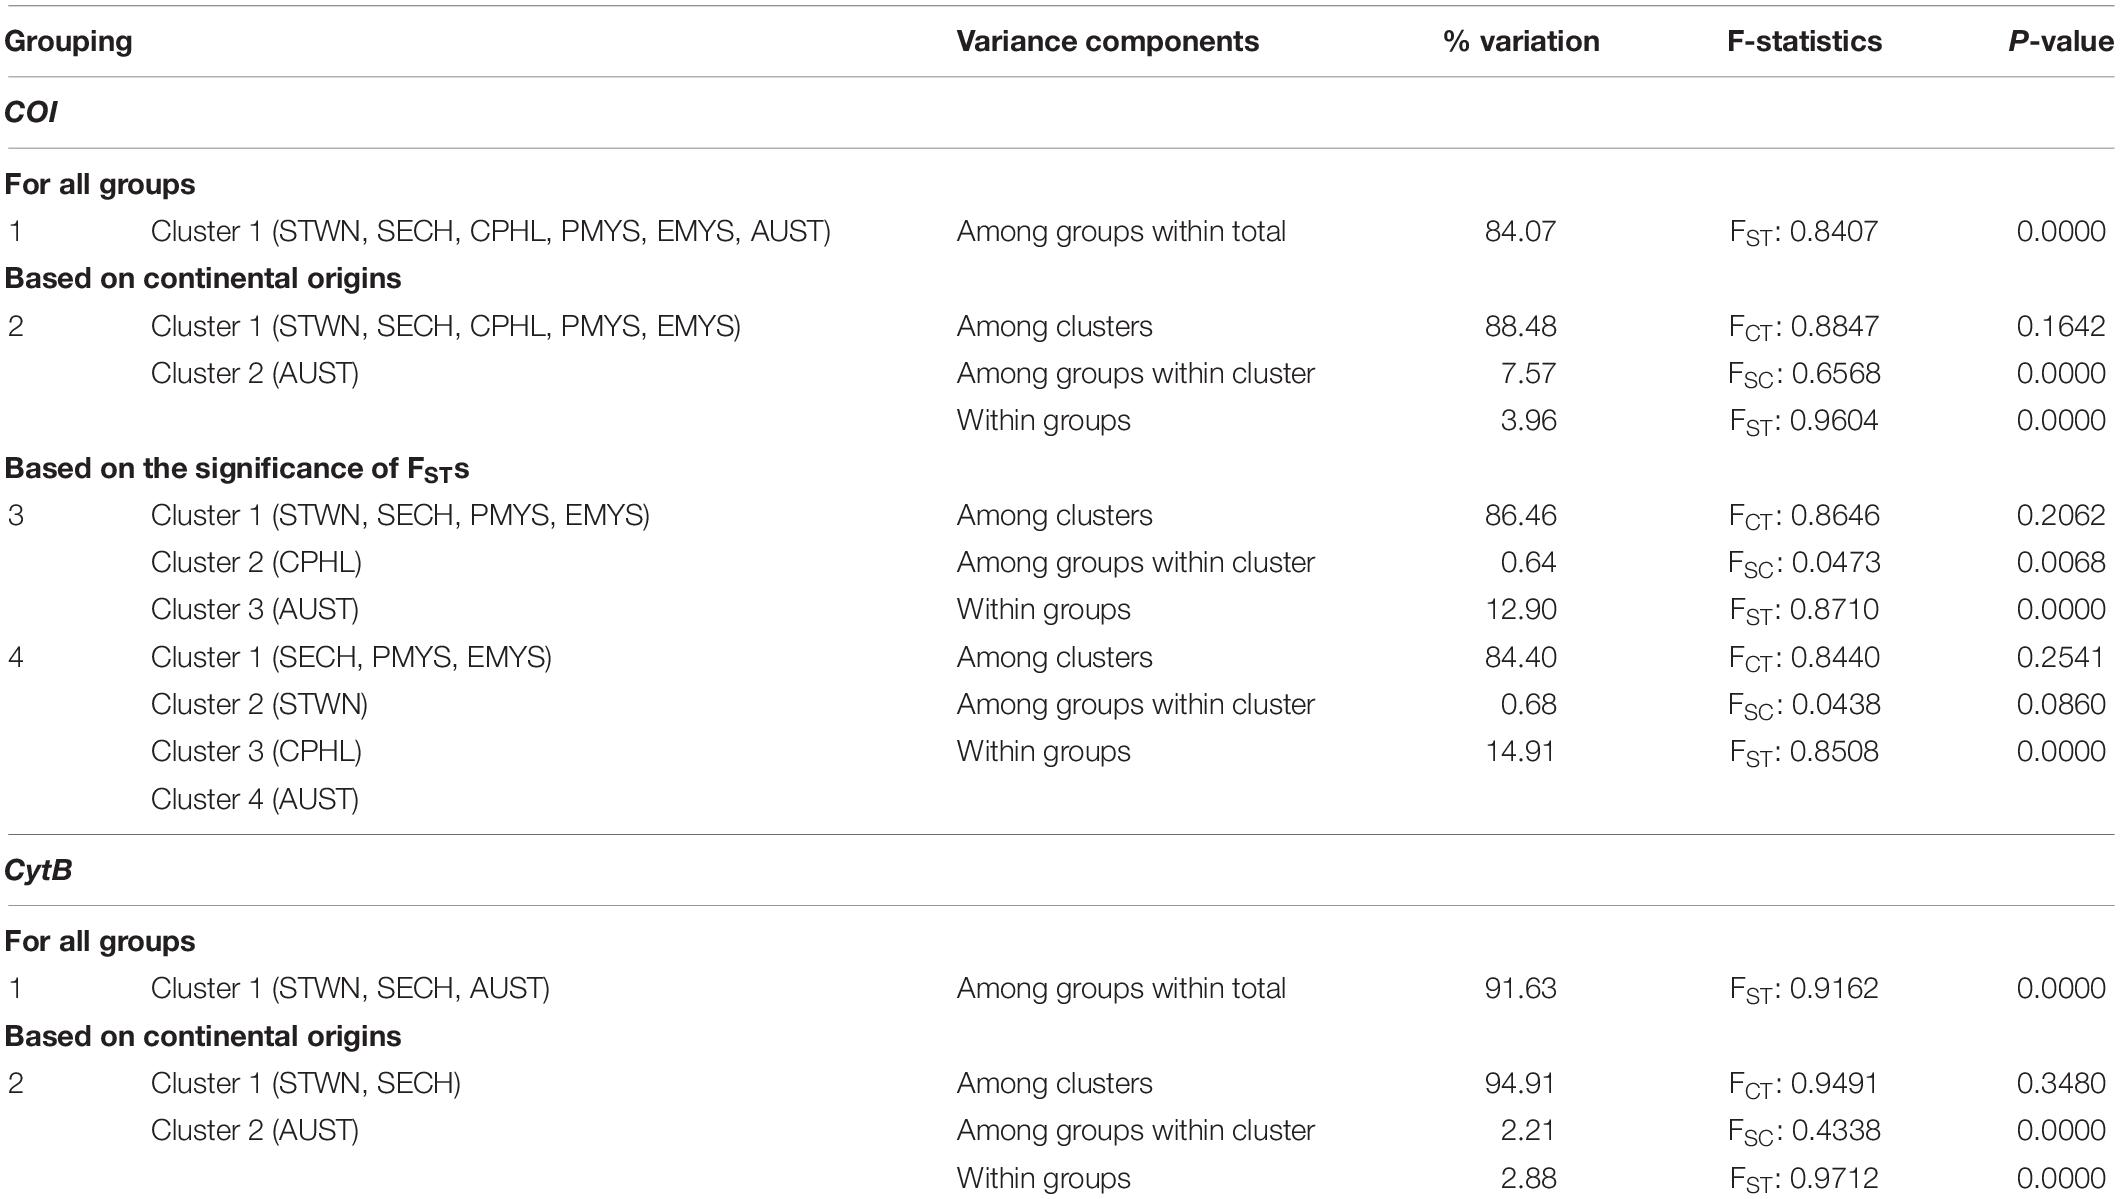
Table 4. Analysis of molecular variance (AMOVA) results for hierarchical genetic subdivision for the percentage of variation and F-statistics of the cytochrome oxidase I (COI) and cytochrome B (CytB) genes.
Combining all the other available sequences, the presence of two diverging lineages was detected from the network topologies (Figure 2) and phylogenetic trees (bootstrap > 75%) (Figure 3). Herein, these lineages were referred to as the Asian and Australian lineages. The Asian lineage covers all individuals excluding AUST, while the Australian lineage is comprised only of AUST individuals. The MJ haplotype networks for each marker showed a deep divergence on the Asian and Australian lineage in a reciprocally monophyletic network. Such type of network is characterized by the presence of more than one lineage, usually separated by numerous mutational steps (Jenkins et al., 2018). Pairwise K2P distances across the two lineages were COI = 6.77% and CytB = 6.64%. Within-lineage K2P differences were COI = 0.60% and CytB = 0.22% for the Asian lineage, and COI = 0.14% and CytB = 0.23% for the Australian lineage. Corresponding K2P differences across each collection region were presented in Table 3.
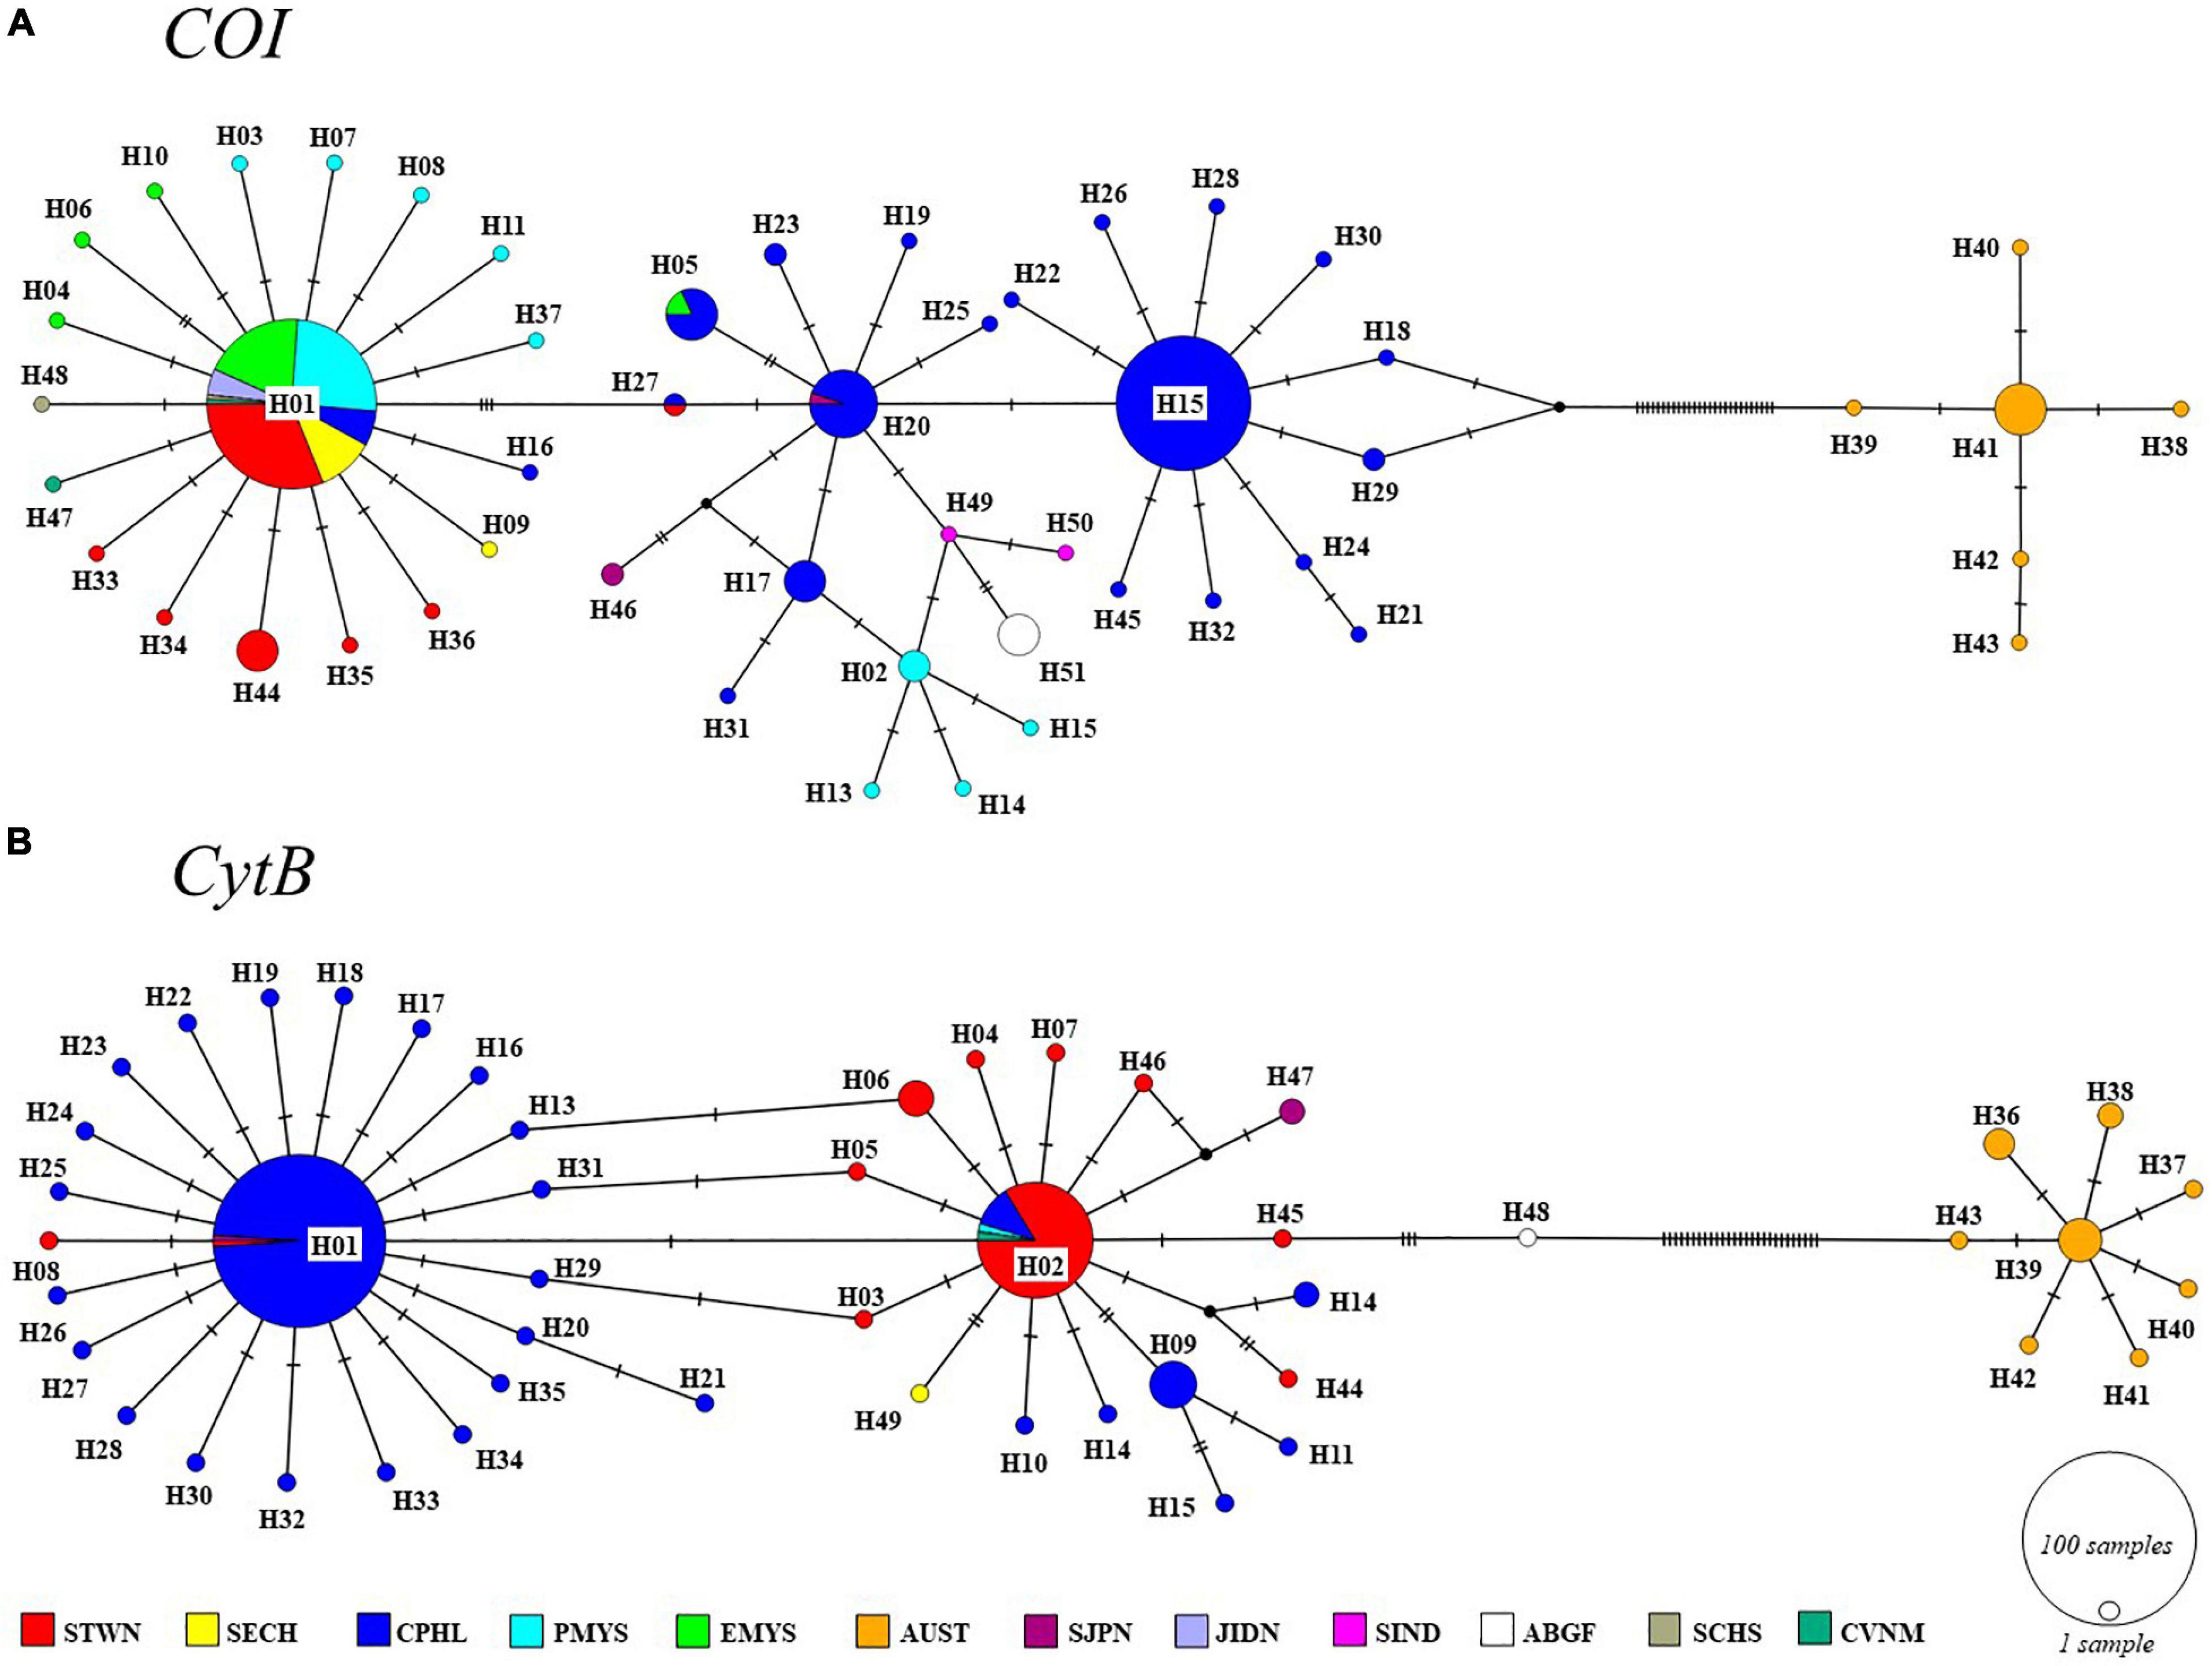
Figure 2. Median-joining (MJ) networks of (A) cytochrome oxidase I (COI) and (B) cytochrome B (CytB) haplotypes of S. leptolepis Tropical Western Pacific (TWP) populations. The sizes of nodes (circles) are proportional to the number of individuals. Black dots represent median vectors (unsampled haplotypes).
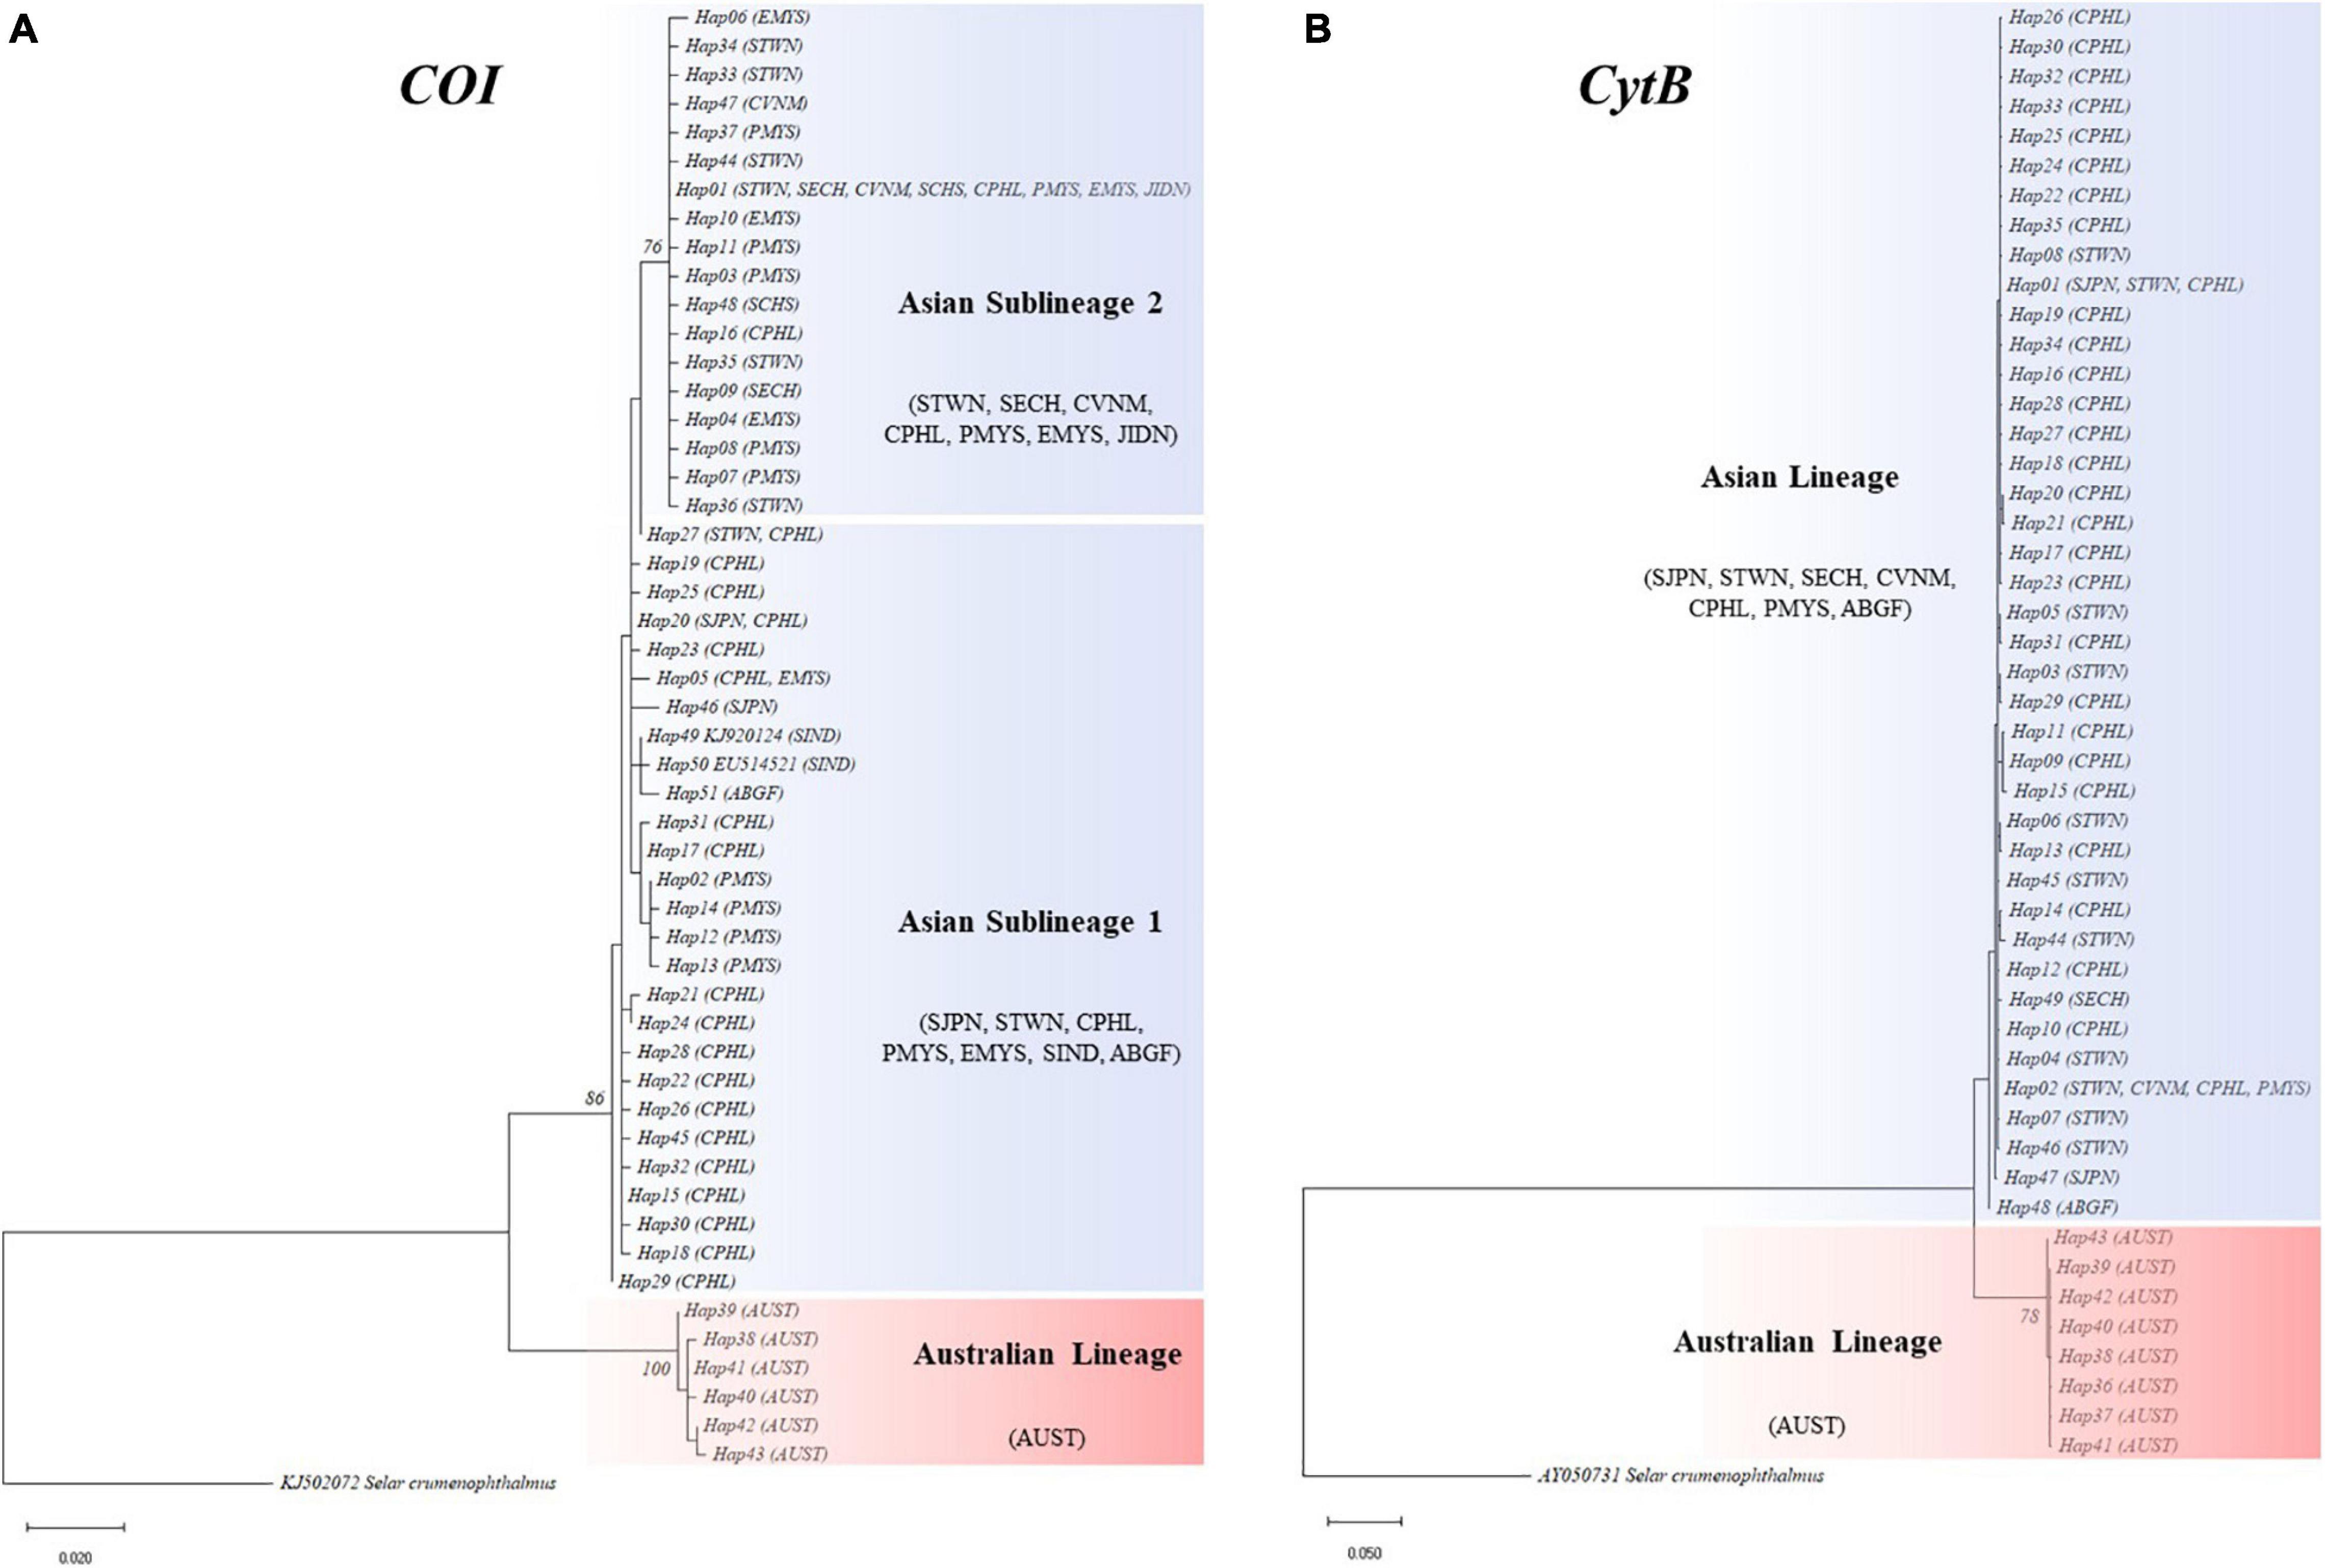
Figure 3. (A) Cytochrome oxidase I (COI) and (B) cytochrome B (CytB) maximum likelihood (ML) trees of S. leptolepis rooted with S. crumenophthalmus (KJ502072, AY050731) from GenBank. Bootstrap consensus tree for the topology was inferred from 1,000 replicates and >75% support labels are retained at tree nodes.
Further analyses without AUST were carried out to detect variations within the Asian lineage. FST values revealed significant differences across Asian populations (COI = 0.6511; CytB = 0.4406). Only the COI ML tree showed a further divergence of the Asian lineage into two main sublineages with 76% bootstrap support. The first sublineage consisted of STWN and most of CPHL individuals, as well as a few PMYS, EMYS, SIND, SJPN, and ABGF individuals. On the other hand, the second sublineage included STWN, SECH, CVNM, PMYS, EMYS, JIDN, and CPHL individuals. These two Asian sublineages had a pairwise difference of K2P = 0.99%. The COI network displayed the divergence by the separation of its two dominant haplotypes—H01 and H15. H01 includes individuals from STWN, SECH, CPHL, PMYS, EMYS, and the additional representatives from JIDN, SIND, SCHS, and CVNM. Meanwhile, H15 is composed exclusively of CPHL individuals. For CytB, the dominant haplotypes were H01 and H02. H01 is majorly represented by individuals from CPHL and with few samples from STWN and SJPN, while H02 is comprised mostly of STWN and few CPHL, PMYS, and CVNM individuals (Figure 2 and Supplementary Table 3).
Demographic History
Overall Tajima’s D were negative for COI (Dglobal = −1.2809; p < 0.1) and CytB (Dglobal = −1.4956; p < 0.05). Fu’s Fs revealed highly significant negative values for both markers (COIglobal Fs = −17.1323, p < 0.01) (CytBglobal Fs = −22.5609, p < 0.01) (Table 2). Total mismatch distribution for COI and CytB reflected different demographic signatures. COI showed a multimodal pattern whereas CytB was bimodal (Figure 4). SSD value for COI revealed an insignificant difference (p > 0.05) from a predicted growth expansion model. Raggedness values (Hri) for both markers also showed statistical insignificance (p > 0.05), implying the samples had a relatively good fit to a population expansion model. Corresponding mismatch indices for the lineages were shown in Figure 4. Using COI mismatch parameters θ0 and θ1 (Harpending, 1994; Marini et al., 2021), the estimated effective female population size for S. leptolepis after expansion (θ1) was approximately 5,000 times higher than prior (θ0).
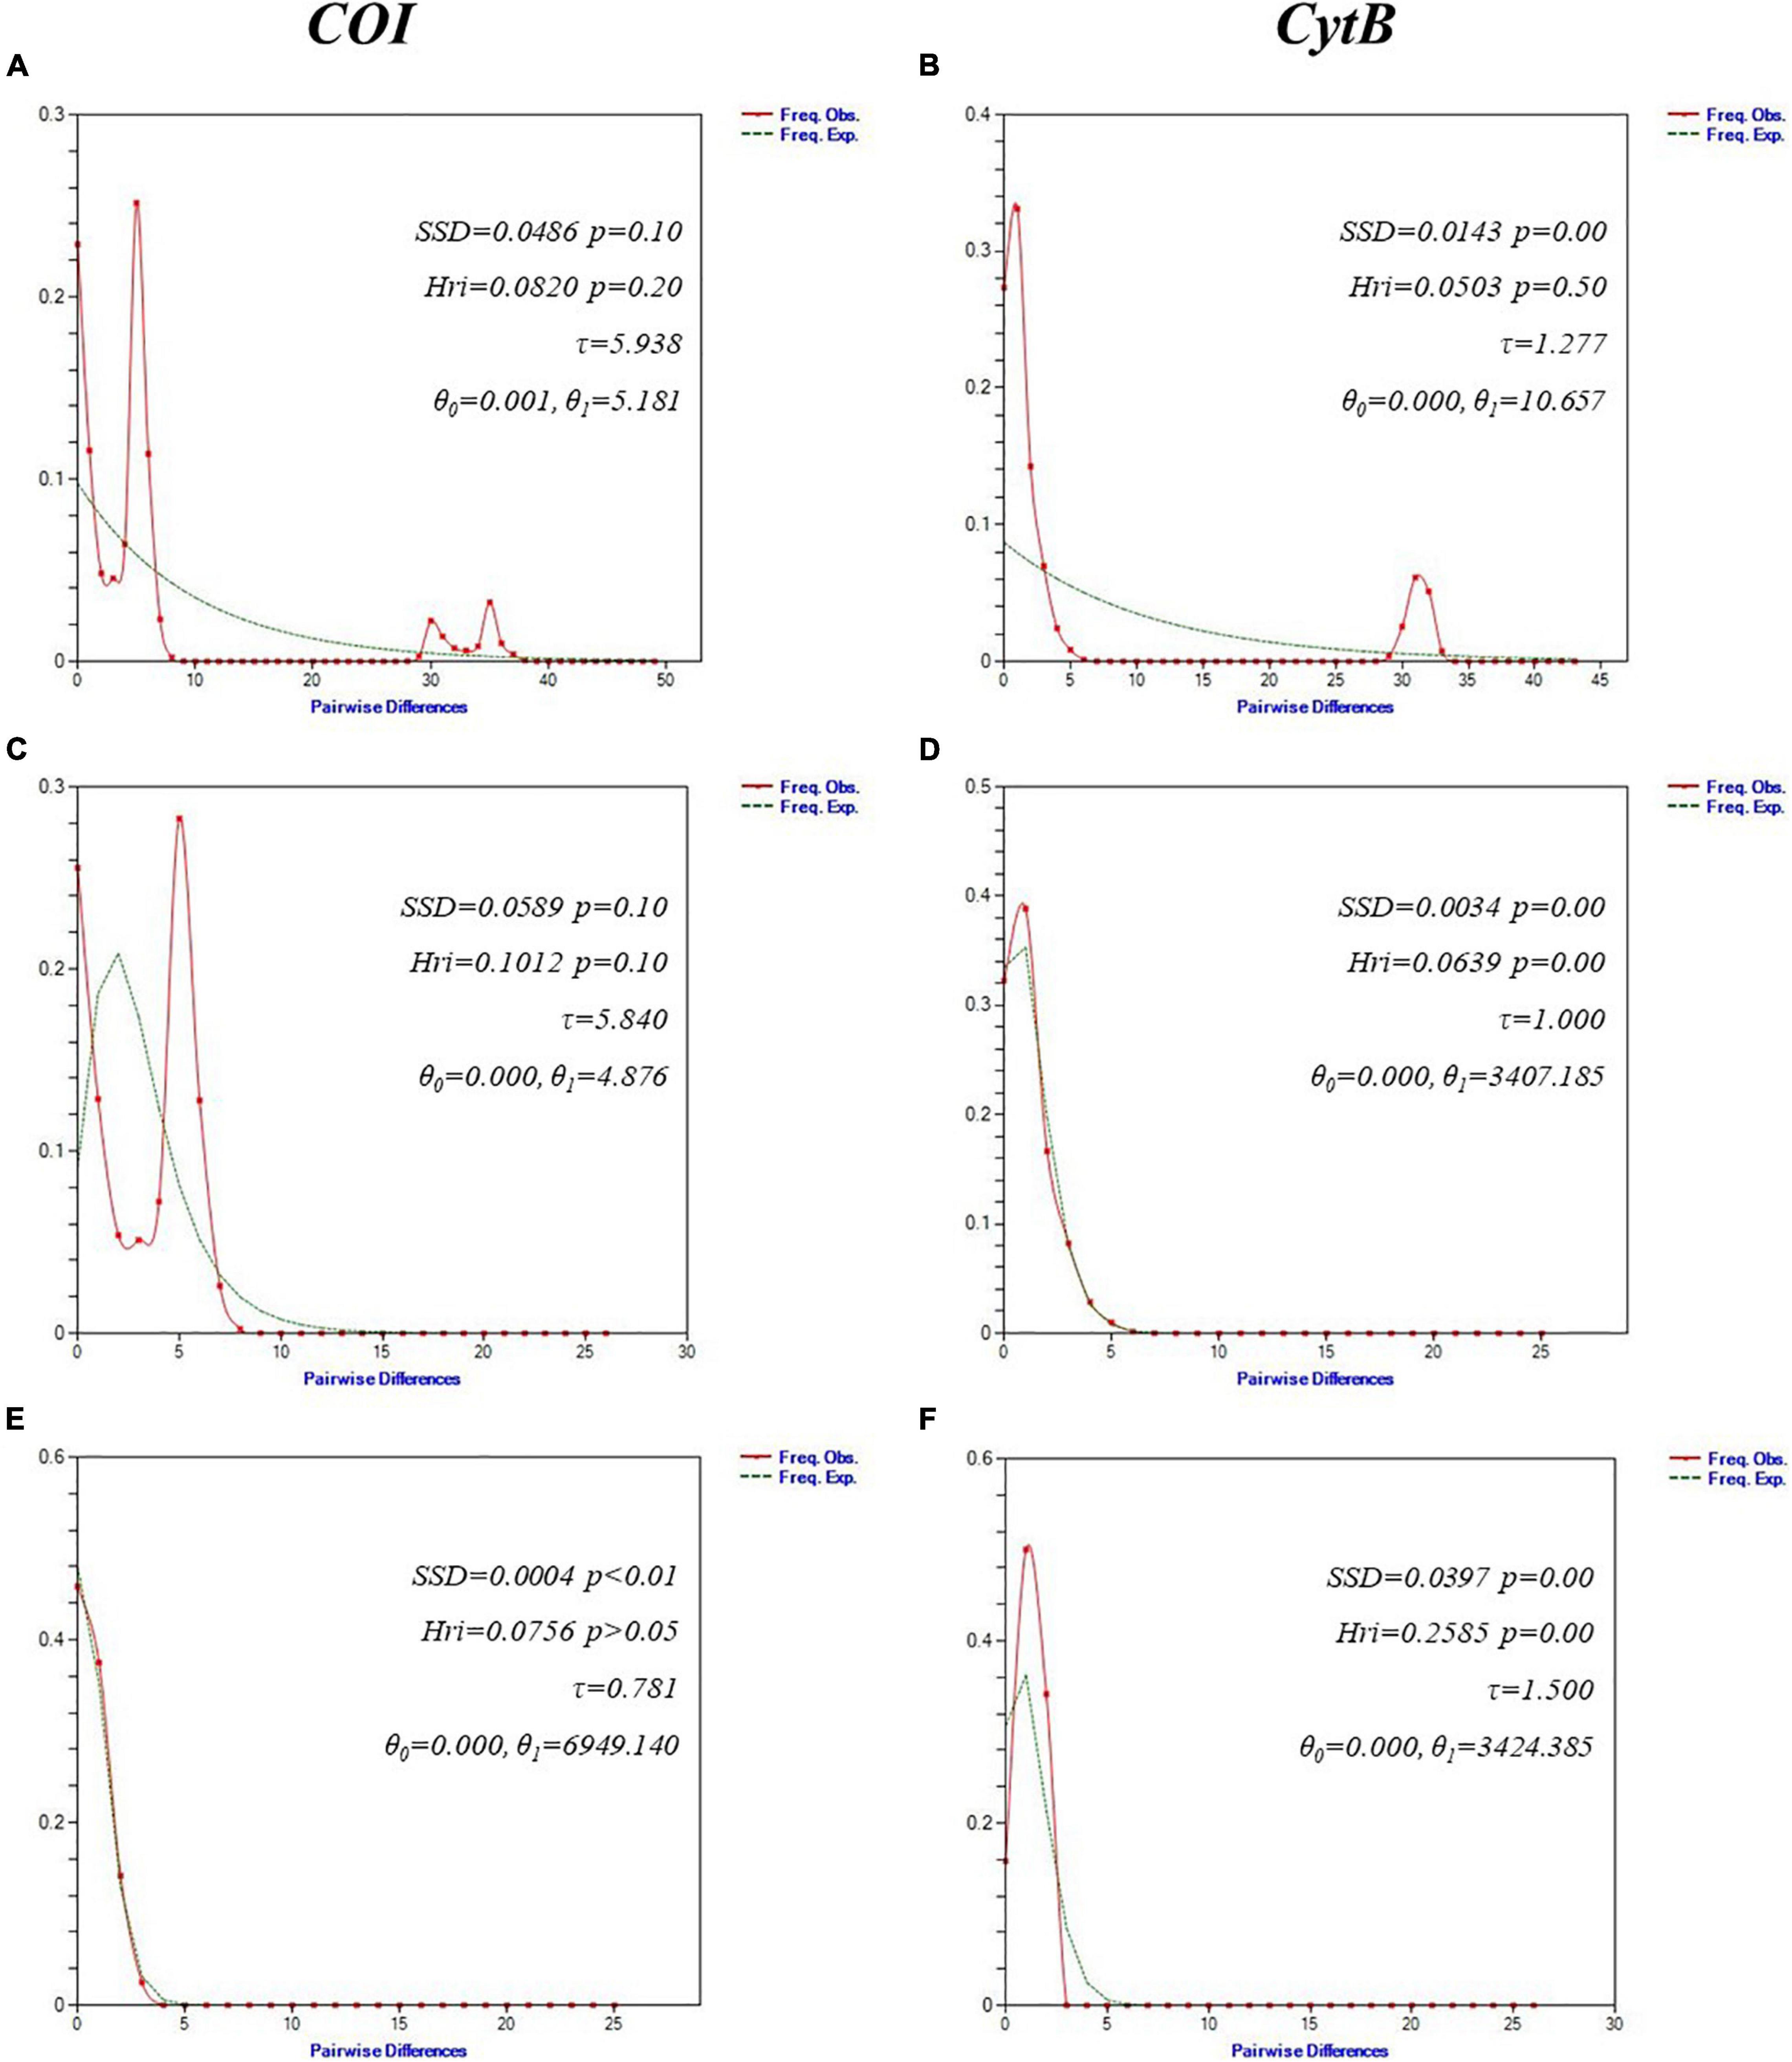
Figure 4. Mismatch distribution analysis for S. leptolepis mtDNA cytochrome oxidase I (COI) (left) and cytochrome B (CytB) (right) using DnaSP v6.12. Graphs of the mismatch distributions of (A,B) overall populations; (C,D) Asian lineage; and (E,F) Australian lineage. The X-axis shows the observed distribution of pairwise nucleotide differences while Y-axis shows the frequencies. Solid lines represent the observed frequency of pairwise differences and broken lines show the expected values under the sudden expansion model. Sum of squared deviation (SSD) and Harpending’s raggedness index (Hri) indices with corresponding p-values are also presented.
Demographic scenarios supporting the recent population expansion of S. leptolepis were presented in the Bayesian skyline plots (Figure 5). Both COI and CytB revealed patterns of a long history of constant population size, followed by a slight decline (bottleneck), and a subsequent demographic expansion. The fastest increase of its effective population Ne happened between 21 and 10 thousand years ago (KYA). It showed a relatively stable effective population starting 2,000 years ago until the present. At the lineage level, the Asian lineage also displayed the rapid expansion signature, whereas the Australian lineage depicted slow population growths (Supplementary Figure 1).
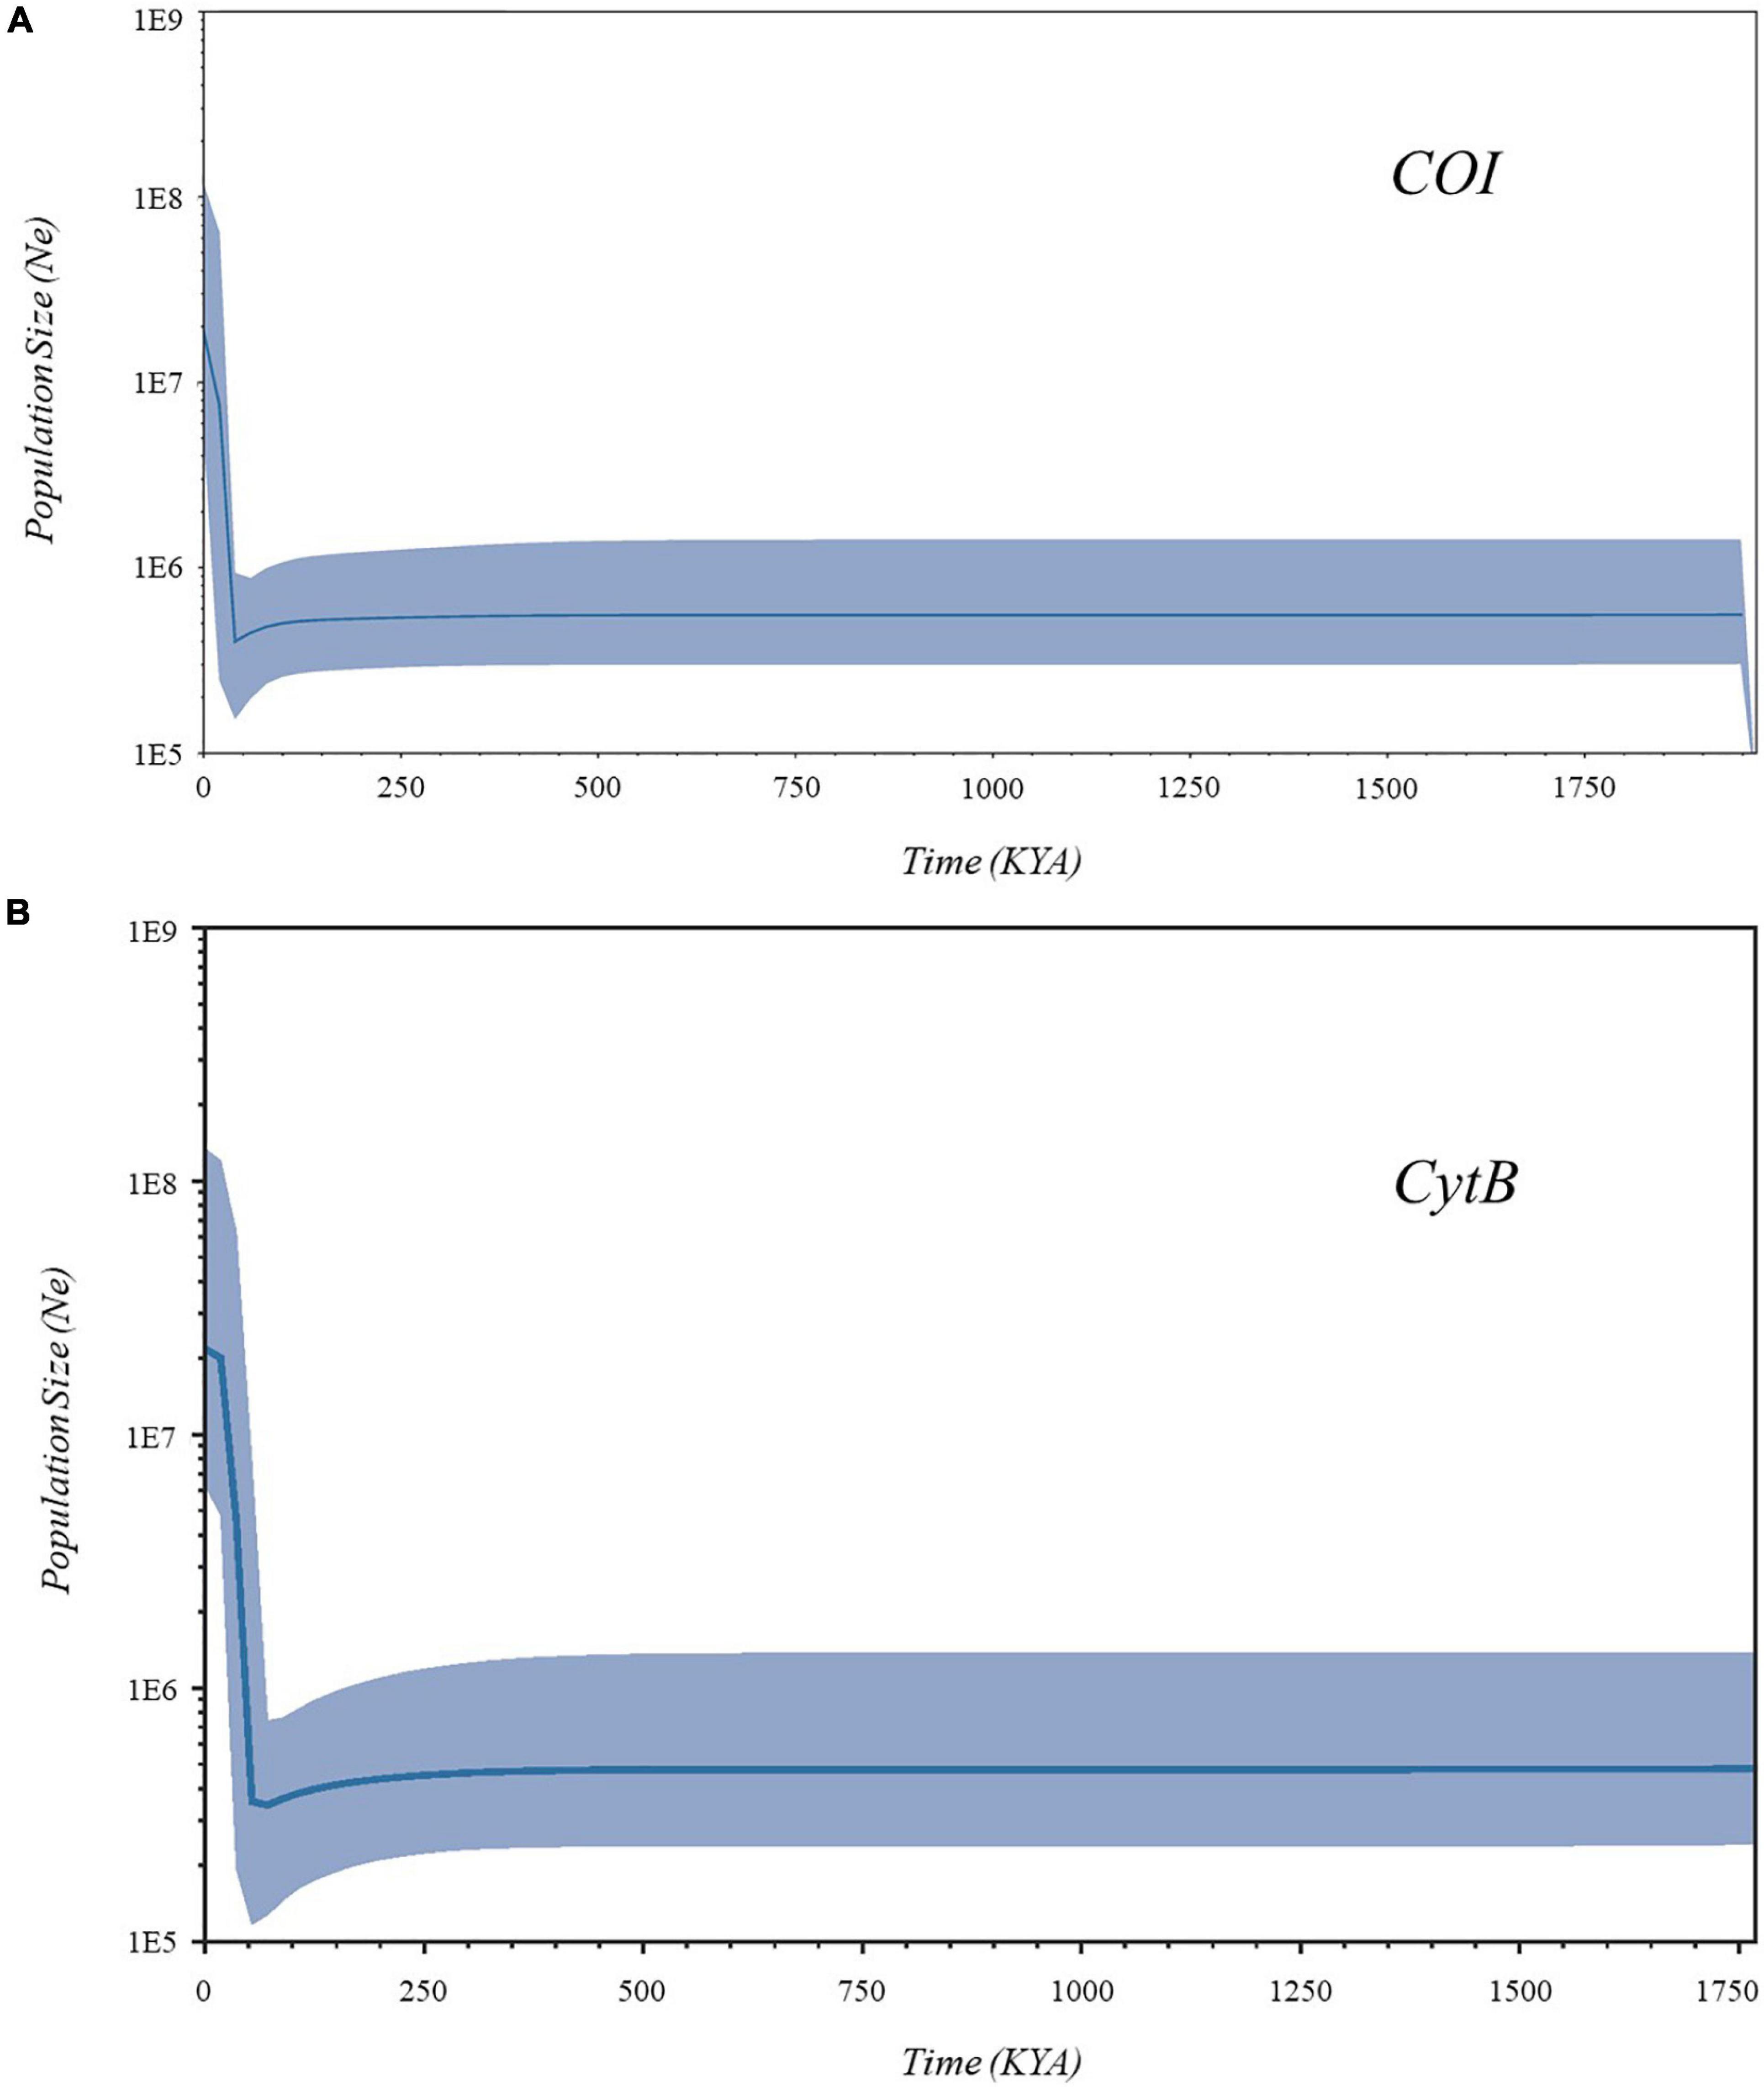
Figure 5. Bayesian skyline plot based on (A) cytochrome oxidase I (COI) and (B) cytochrome B (CytB) for the effective population size changes throughout time. X-axes represent time in thousand years ago (KYA), while Y-axes show the effective population size (Ne). The blue line represents the median, while the thick blue band represents 95% highest posterior density (HPD) intervals.
Discussion
Genetic Diversity
High overall haplotype and low nucleotide diversities were recorded for both markers, with numerous unique haplotypes or singletons present in the MJ haplotype networks. These singletons directly radiate from a largely shared haplotype, indicating few mutational step differences. On one hand, high haplotype diversity was detected when numerous unique sequences were present within the overall population. On the other hand, low nucleotide diversity was reflected when these nucleotide compositions were closely similar. This type of genetic pattern is usually attributed to a recently experienced expansion (Grant and Bowen, 1998), which is likewise supported by our historical demography findings. In such cases, individuals evolve into different haplotypes with minimal differences; and these haplotypes may either evolve directly or indirectly from an ancestral haplotype (Chanthran et al., 2020). This kind of genetic pattern has also been recorded in other TWP carangids (Rohfritsch and Borsa, 2005; Jamaludin et al., 2020; Mat Jaafar et al., 2020; Torres and Santos, 2020). The most recurrent and widespread haplotype is considered the oldest and most successful in traversing across sampling locations (Posada and Crandall, 2001; Mat Jaafar et al., 2012). This indicates that the second Asian sublineage might be the ancestral S. leptolepis lineage and, the IMPA waters could be its potential geographic origin.
Genetic Structuring
Differentiation of Asia and Australia Groups
Our findings coherently supported the distinction of the Australian group. The high, significant genetic variations and correlation with geography supported an allopatric separation. The lineages’ pairwise K2P divergences (COI = 6.77%; CytB = 6.64%) were higher than intraspecific variances on carangids with detected cryptic populations: Atule mate COI < 4.82%; S. crumenophthalmus COI < 4.66%; Seriolina nigrofasciata COI < 4.32% (Mat Jaafar et al., 2012); Decapterus maruadsi CytB < 5.0% (Jamaludin et al., 2020). These values were also more than 10× higher than the mean intraspecific divergences of barcoded fishes: COI = 0.39% (Ward et al., 2005); COI = 0.34% (Thu et al., 2019); COI = 0.32% (Zhang, 2011); COI = 0.59% and CytB = 0.57% (Kochzius et al., 2010); and CytB < 1.0% (Li et al., 2018). Herein, it is suggested that the two lineages represented different putative species in an S. leptolepis complex. This magnitude of divergence was at comparable values with the interspecific differentiation in the confamilial Pseudocaranx dentex complex (Bearham et al., 2020).
The separation of the two lineages can probably be related to habitat discontinuity, oceanographic barriers, the species’ dispersal capacity, and past geologic events. For instance, additional collections from Eastern Java, Indonesia corresponded with the widely distributed Asian haplotype—H01. This sampling locality is known to exhibit continuous coral and rocky reef bottoms that extend to the Nusa Tenggara region (Fahmi et al., 2021). The Eastern Indian Ocean and the Timor Sea separate Eastern Java, Indonesia from North Australia, which is the southernmost range of the species in TWP. These two regions have a proximate distance of ∼1,400 km and reach a maximum depth of ∼3,300 m through the Timor Trough, implying that water dynamics between the two neighboring localities might have acted as barriers which prohibited their genetic exchange. The small islands in the area are also known to serve as a gateway for the strong intrusive Pacific waters flowing westwards to the Indian Ocean (Gordon, 2005). Being an inshore, demersal fish, these suggest that S. leptolepis has a weak migration capability to overcome deep water and strong current conditions despite proximity. In contrast, genetic homogeneity was displayed within the Australian group (K2P ≤ 0.2%), which consisted of individuals collected from Queensland and Western Australia (Supplementary Table 1). Found on opposite sides of the continent, this reflects an extant gene flow and signifies a high dispersal capability for S. leptolepis in shallow coastal regions. All in all, oceanographic hindrances and physical limitations explained the separation of Asian and Australian lineages. Other examples of fishes showing homogenous North Australian groupings with sharp discontinuities along the Timor Sea include Lutjanus erythropterus (Salini et al., 2006), Decapterus russelli (Rohfritsch and Borsa, 2005), and Pristipomoides multidens (Ovenden et al., 2002). Additional samples from the Lesser Sunda and nearby island localities will be ideal to establish a more comprehensive narrative of the S. leptolepis distribution.
Shallow Structuring Across Asia
A broadscale geographic homogeneity was observed in the Asian samples. Within this lineage, K2P divergences were <1% on both markers. However, despite the evident genetic differences in our findings, the magnitude of these differences was low and inadequately supported (i.e., insignificant FSTs, low bootstrap support on CytB, and mixed haplotype and sublineage memberships). The discrepancy between the phylogenetic results of COI and CytB, where further substructuring was apparent in COI, might be an artifact of the level of sensitivity of the mtDNA marker. This undetected sub-clustering implies that such divergence is shallow. Moreover, the limited inference on phylogenetic trees is complemented with the use of networks. Since genetic diversity is usually low at the population level, this leads to indecisive tree resolutions and further overlooks other important evolutionary information. To effectively visualize reticulated relationships such as hybridization and recombination, networks are used. The implicit, sequence-based MJ haplotype network may suggest the possible occurrence of extant unsampled sequences or extinct sequences through median vectors (Bandelt et al., 1999; Kong et al., 2016; Figure 2). The mixed memberships of the dominant Asian haplotypes imply sympatric distribution and the absence of a clear genetic structure in the Asian lineage.
The absence of genetic structuring may partly be explained by the spawning patterns and pelagic larval duration of S. leptolepis, as well as the hydrogeographic features of the SCHS. S. leptolepis exhibits two annual spawning events succeeded by recruitment pulses which usually peak from March to June when the temperature is warmer (Prabhu, 1956; Guanco et al., 2009). In addition, observations from its close relative, S. crumenophthalmus, reveal an 18-day post-hatching time before reaching a nursing flexion stage (Welch et al., 2013), which supports the notion that the pelagic larval time of S. leptolepis might be close to 2–3 weeks. Our S. leptolepis Asian collection grounds also lie on the periphery of the SCHS, which is bounded to its adjacent areas by shallow waters and straits. The water movement of the SCHS’s top layer is mainly influenced by seasonal monsoons, with its water circulation directly affected by two oppositely headed winds that sweep over the area at different times of the year (Huang et al., 1994). Consequently, the spawning times S. leptolepis temporally coincide with the timings of the opposing monsoons. With all these being said, the buoyancy of its ichthyoplankton, assisted with oceanographic circulators and ample pelagic larval durations, could be key factors in the successful genetic dispersal in the region.
Other notable clusterings of some haplotypes are shown in the ML trees and MJ networks. For instance, majority of the Malaysian haplogroup of Mat Jaafar et al. (2020) is now recognized as part of the widespread second Asian sublineage. This implies that most of the Malaysian S. leptolepis stocks are mainly comprised of direct ancient lineage descendants and thus support its IMPA origination. Additionally, SJPN sequences, which are collected from the northern-most TWP range of the species, appear to be more closely related to CPHL. This suggests a possible influence of the upward-moving Kuroshio current in dispersing the S. leptolepis to this northmost distribution. Also, the COI haplotype network showed that SIND (H49, H50) and ABGF (H51) samples formed a unique, close cluster. This suggests that S. leptolepis from the Indian Peninsula and ABGF region probably is a genetically distinct cluster. These samples are linked closely to the Peninsular Malaysian samples of Mat Jaafar et al. (2020), denoting that S. leptolepis from localities near the Malacca Strait might be genetically closer to its Indian Ocean conspecifics than those from the majority of IMPA. Additional samples are necessary to quantify their degree of genetic variability. This type of delineation was also observed in Seriola nigrofasciata (Mat Jaafar et al., 2012), Lutjanus lutjanus (Bakar et al., 2018), Uranoscopus cognatus (Mohd Yusoff et al., 2021), and Penaeus semisulcatus (Halim et al., 2021).
Demographic History
The negative Tajima’s D and Fu’s Fs indicated the presence of excessively rare haplotypes and imply a recent population expansion, thus rejecting the neutral evolution hypothesis. Fu’s Fs has been considered as a more superior test, giving more reliability in inferring population growth (Ramos-Onsins and Rozas, 2002). A multi/bi-modal mismatch distribution suggested that the S. leptolepis populations are in equilibrium. However, relying solely on this graphical inference does not automatically warrant its respective history. Multiple and bimodality in mismatch analysis also happen in the presence of genetically distinct lineage in the samples. Its first peak in the graph represented the close intra-clade pairwise differences, and the next successive peaks illustrated a more ancient inter-clade pairwise difference. Therefore, lineages were suggested to be prior segregated to avoid possible violations in coalescent theory assumptions (Jenkins et al., 2018). In contrast, the unimodal patterns in each lineage depicted recent demographic expansion on the populations. Statistically insignificant values for SSD and Hri support such population expansion.
The Bayesian skyline plots suggested recent population expansion for S. leptolepis that initiated around the late Pleistocene era. The species recorded the most rapid increase in its effective population size during the Late Pleistocene (20 KYA) up to the early Holocene (10 KYA). During the Pleistocene, the TWP region, historically known as Sundaland, experienced glaciation and deglaciation processes which caused sea-level and temperature fluctuations that configured ocean dynamics. A contraction of the S. leptolepis effective populations was detected to coincide during these fluctuating periods (200–40 KYA). The formation of ice on continents and poles lowered sea levels, thus reducing the available space and ocean food supply for marine populations, and probably leading to depopulation. The abrupt rise in effective population size synchronously commenced during the Last Glacial Maximum’s deglaciation timetable (∼20 KYA). This deglaciation caused a rapid rise in sea level which opened expansion opportunities. Once habitat conditions became acceptable, ancient S. leptolepis populations could have moved to these newly filled coastal regions. With the help of its high dispersal abilities in shallow environments, rapid population expansion, and new habitat colonization could have been easily achieved by the species. Overall, these collective circumstances might have influenced the present-day distribution patterns of S. leptolepis in the TWP coastal margins. Other relative carangids that exhibited similar expansion timelines in the region include D. maruadsi (Niu et al., 2019; Jamaludin et al., 2020), D. macrosoma, and D. macarellus (Arnaud et al., 1999).
Implications for Management and Conservation
The occurrence of two geographically isolated S. leptolepis lineages in TWP suggested at least two genetically distinct stocks were present in its waters. Their high level of K2P divergences was already at comparable levels for interspecies differentiation in Carangidae. The type locality for the original description of S. leptolepis was Java, Indonesia (Cuvier and Valenciennes, 1833). Specimens from Eastern Java grouped with the widespread Asian haplogroup suggested that this lineage might be the originally described S. leptolepis, and the Australian lineage is another putative species. Species complexes were considered recently diverged; therefore, their morphological differentiation is believed to have develop later due to new environment adaptations (Fahmi et al., 2021). A comprehensive and adequate collection on the S. leptolepis full range would also help us understand its global structure and detect the presence of any possible intermediate populations.
Selaroides leptolepis is of economic importance particularly in regions of Southeast Asia. However, this is also often coupled with a high exploitation rate. These Asian genetic stocks experience high fishery pressures driven by human consumption demands, which lead to localized fishery depletions. On the other hand, its Australian counterpart experiences relatively lesser pressures, as this species is not a top targeted fish commodity in the Australian region (Gunn, 1990). This species is usually documented as part of bycatch by fishery reports in this region (Blaber, 1993; Dell et al., 2009). Reports have indicated that >85% of Australia’s fish stocks are well-managed and are at sustainable levels (Mobsby and Curtotti, 2018; Piddocke et al., 2020). This suggests that the two newly uncovered S. leptolepis lineages are experiencing different levels of fishery-induced pressures. Moreover, persisting localized unsustainable exploitations on the Asian stocks can cause fragmented isolation of small S. leptolepis populations. A lowered genetic diversity in these small S. leptolepis populations also means reduced fitness and higher risks against genetic degradation and drift. Small, isolated populations are also highly vulnerable to inbreeding, which reduces offspring number and viability. The S. leptolepis populations’ ability in adapting to their constantly changing environment will also be restricted if genetic diversity is persistently decreased. If the highly targeted Asian lineage ultimately depletes, chances of replenishing its gene pool through migration will be unlikely due to the discussed isolating mechanisms.
Delimiting the S. leptolepis cryptic species complex will not only provide an advantage for its taxonomic recognition but can also aid in the formulation of better conservation measures. The challenge to fully delimit this S. leptolepis complex might rely on the combinatory use of genetic and non-genetic approaches. Exclusively associated characters in the morphology, reproductive traits, or habitat preferences will be helpful features for the species’ field-based diagnostics. Otherwise, the absence of strong characters will make field-based differentiation impossible and even further complicate its management. Separating them into different units will foster more suitable stock-specific management approaches, especially since these groups are experiencing different exploitation pressures. Subdividing them will define their stock geographic boundaries, which can lead to more precise estimates on its fishery indices (e.g., recruitment, growth, and mortality) (Ovenden et al., 2009).
This study defined the genetic structure and the presence of a cryptic species of S. leptolepis in the TWP, wherein this species is of economic importance. Their isolated distribution, demographic history, and absence of in-between populations warrant the clear separation; and this signifies the need for other diagnostic characters, whether morphological, habitat or behavioral, to disintegrate the species complex. A full distributional range survey coupled with robust genetic approaches [e.g., single nucleotide polymorphisms (SNP)] will reveal the global structuring and evolutionary history of this taxon. Regarding management and conservation, we recommend a lineage-specific approach since stocks face different environmental and fishery pressures. A transnational management scheme can be designed for the widely distributed lineage. Most importantly, the integration of insights from genetic studies and other scientific information can foster the best management plan for this species in the future.
Data Availability Statement
The datasets presented in this study can be found in online repositories. The names of the repository/repositories and accession number(s) can be found below: NCBI (accession: MZ520638–MZ520664 and MZ555658–MZ555703).
Ethics Statement
Ethical review and approval was not required for the animal study because no live samples were used in the study. All specimens were acquired from local fish markets.
Author Contributions
LCH performed the experiments and data analyses. H-CL helped to supervise the study. LCH and H-CL drafted the manuscript. All authors conceived and designed the study, reviewed the drafts, and approved the final version of the manuscript.
Funding
This work was supported by the Department of Science and Technology–Science Education Institute, Philippines and Ministry of Science and Technology, Taiwan (Grant No. 109-2611-M-110-003).
Conflict of Interest
The authors declare that the research was conducted in the absence of any commercial or financial relationships that could be construed as a potential conflict of interest.
Publisher’s Note
All claims expressed in this article are solely those of the authors and do not necessarily represent those of their affiliated organizations, or those of the publisher, the editors and the reviewers. Any product that may be evaluated in this article, or claim that may be made by its manufacturer, is not guaranteed or endorsed by the publisher.
Acknowledgments
We would like to thank our following contacts, especially for providing tissue sample collections: A. Graham (CSIRO National Research Collections, Australia), H. Motomura (Kagoshima University Museum, Japan), M. Nakae (National Museum of Nature and Science, Japan), A. Murase (University of Miyazaki, Japan), and S. P. Huang (Academia Sinica, Taiwan). We also thank A. C. J. Hurboda, T. A. B. Itong, P. H. T. Apag, O. P. C. Halasan, T. N. A. Mat Jaafar, Y. H. Guo, S. Yo, and J. W. Kuo for rendering technical assistance.
Supplementary Material
The Supplementary Material for this article can be found online at: https://www.frontiersin.org/articles/10.3389/fmars.2021.756163/full#supplementary-material
References
Abdussamad, E. M., Rohit, P., Koya, S. K. P., Habeeb Mohamed, O. M. M. J., and Jeyabalan, K. (2013). Carangids (Family: Carangidae) in the seas around Indian subcontinent with description of macro-taxonomic characters for the field identification of genera and species. Indian J. Fish. 60, 21–36.
Allen, G. R., and Erdmann, M. V. (2012). Reef Fishes of the East Indies: Volumes I-III, Tropical Reef Research. Perth: Universitiy of Hawai’i Press.
Arfat, Y. A., and Benjakul, S. (2012). Gelling characteristics of surimi from yellow stripe trevally (Selaroides leptolepis). Int. Aquat. Res. 4:5. doi: 10.1186/2008-6970-4-5
Arnaud, S., Bonhomme, F., and Borsa, P. (1999). Mitochondrial DNA analysis of the genetic relationships among populations of scad mackerel (Decapterus macarellus, D. macrosoma, and D. russelli) in South-East Asia. Mar. Biol. 135, 699–707. doi: 10.1007/s002270050671
Asgharian, H., Sahafi, H. H., Ardalan, A. A., Shekarriz, S., and Elahi, E. (2011). Cytochrome c oxidase subunit 1 barcode data of fish of the Nayband National Park in the Persian Gulf and analysis using meta-data flag several cryptic species. Mol. Ecol. Resour. 11, 461–472. doi: 10.1111/j.1755-0998.2011.02989.x
Bakar, A. A., Adamson, E. A. S., Juliana, L. H., Nor Mohd, S. A., Chen, W. J., Man, A., et al. (2018). DNA barcoding of Malaysian commercial snapper reveals an unrecognized species of the yellow-lined Lutjanus (Pisces:Lutjanidae). PLoS One 13:e0202945. doi: 10.1371/journal.pone.0202945
Baker, C. S., Perry, A., Chambers, G. K., and Smith, P. J. (1995). Population variation in the mitochondrial cytochrome b gene of the orange roughy Hoplostethus atlanticus and the hoki Macruronus novaezelandiae. Mar. Biol. 122, 503–509. doi: 10.1007/BF00350673
Bandelt, H. J., Forster, P., and Röhl, A. (1999). Median-joining networks for inferring intraspecific phylogenies. Mol. Biol. Evol. 16, 37–48. doi: 10.1093/oxfordjournals.molbev.a026036
Bearham, D., Robert, M., Chaplin, J. A., Moore, G. I., Fairclough, D. V., and Bertram, A. (2020). Molecular evidence of three species in the Pseudocaranx dentex complex (Carangidae) in Australian waters. Mar. Freshw. Res. 71, 518–531. doi: 10.1071/mf18445
Blaber, S. J. M. (1993). The Fish Resources of Tropical Northeastern Australian Waters. Canberra: CSIRO.
Bloch, M. E., Berger, D., Berger, F. G., Bodenehr, G., Darchow, C., Gursch, C. F., et al. (1793). D. Marcus Elieser Bloch’s, Ausübenden Arztes zu Berlin … Oeconomische Naturgeschichte der Fische Deutschlands. Berlin: Auf Kosten des Verfassers und in Commission bei dem Buchhändler Hr. Hesse.
Bouckaert, R., Vaughan, T. G., Barido-Sottani, J., Duchêne, S., Fourment, M., Gavryushkina, A., et al. (2019). BEAST 2.5: an advanced software platform for Bayesian evolutionary analysis. PLoS Comput. Biol. 15:e1006650. doi: 10.1371/journal.pcbi.1006650
Carpenter, K. E., and Springer, V. G. (2005). The center of the center of marine shore fish biodiversity: the Philippine Islands. Environ. Biol. Fish. 72, 467–480. doi: 10.1007/s10641-004-3154-4
Chanthran, S. S. D., Lim, P. E., Li, Y., Liao, T. Y., Poong, S. W., Du, J., et al. (2020). Genetic diversity and population structure of Terapon jarbua (Forskal, 1775) (Teleostei, Terapontidae) in Malaysian waters. Zookeys 911, 139–160. doi: 10.3897/zookeys.911.39222
Çiftçi, Y., Eroǧlu, O., and Firidin, S. (2013). Mitochondrial cytochrome b sequence variation in three sturgeon species (A. stellatus Pallas, 1771, A. gueldenstaedtii Brandt, 1833, H. huso Linnaeus, 1758) from the Black Sea coasts of Turkey. Turkish J. Fish. Aquat. Sci. 13, 291–303. doi: 10.4194/1303-2712-v13_2_11
Dell, Q., Brewer, D. T., Griffiths, S. P., Heales, D. S., and Tonks, M. L. (2009). Bycatch in a tropical schooling - penaeid fishery and comparisons with a related, specialised trawl regime. Fish. Manag. Ecol. 16, 191–201. doi: 10.1111/j.1365-2400.2009.00655.x
Delrieu-Trottin, E., Mona, S., Maynard, J., Neglia, V., Veuille, M., and Planes, S. (2017). Population expansions dominate demographic histories of endemic and widespread Pacific reef fishes. Sci. Rep. 7:40519. doi: 10.1038/srep40519
Desalle, R., Schierwater, B., and Hadrys, H. (2017). MtDNA: the small workhorse of evolutionary studies. Front. Biosci. 22, 873–887. doi: 10.2741/4522
Drummond, A. J., Rambaut, A., Shapiro, B., and Pybus, O. G. (2005). Bayesian coalescent inference of past population dynamics from molecular sequences. Mol. Biol. Evol. 22, 1185–1192. doi: 10.1093/molbev/msi103
Excoffier, L., and Lischer, H. E. L. (2010). Arlequin suite ver 3.5: a new series of programs to perform population genetics analyses under Linux and Windows. Mol. Ecol. Resour. 10, 564–567. doi: 10.1111/j.1755-0998.2010.02847.x
Fahmi, Tibbetts, I. R., Bennett, M. B., and Dudgeon, C. L. (2021). Delimiting cryptic species within the brown-banded bamboo shark, Chiloscyllium punctatum in the Indo-Australian region with mitochondrial DNA and genome-wide SNP approaches. BMC Ecol. Evol. 21:121. doi: 10.1186/s12862-021-01852-3
Fauziyah, Putri, W. A. E., Purwiyanto, A. I. S., Agustriani, F., Ermatita, and Putra, A. (2020). The stock status of the pelagic fishes in Banyuasin coastal waters, Indonesia. J. Fish. 8, 798–807.
Food and Agriculture Organization [FAO] (2020). The State of World Fisheries and Aquaculture 2020. Rome: Food and Agriculture Organization of the United Nations.
Food and Agriculture Organization [FAO] (2021). Species Fact Sheet. Selaroides leptolepis (Cuvier, 1833). Available online at: http://www.fao.org/fishery/species/3126/en (accessed July 21, 2021).
Fu, Y. X. (1997). Statistical tests of neutrality of mutations against population growth, hitchhiking and background selection. Genetics 147, 915–925. doi: 10.1093/genetics/147.2.915
Gaither, M. R., and Rocha, L. A. (2013). Origins of species richness in the Indo-Malay-Philippine biodiversity hotspot: evidence for the centre of overlap hypothesis. J. Biogeogr. 40, 1638–1648. doi: 10.1111/jbi.12126
Gordon, A. L. (2005). Oceanography of the Indonesian seas and their throughflow. Oceanography 18, 14–27. doi: 10.5670/oceanog.2005.01
Grant, W., and Bowen, B. (1998). Shallow population histories in deep evolutionary lineages of marine fishes: insights from sardines and anchovies and lessons for conservation. J. Hered. 89, 415–426. doi: 10.1093/jhered/89.5.415
Guanco, M. R., Mesa, S. V., Belga, P. B., and Nunal, D. R. M. (2009). Assessment of the commercial fisheries of Western and Central Visayan Sea. BFAR NFRDI Techn. Pap. Ser. 12, 1–44.
Gunn, J. S. (1990). A revision of selected genera of the family Carangidae (Pisces) from Australian waters. Rec. Aust. Mus. 12, 1–77. doi: 10.3853/j.0812-7387.12.1990.92
Halim, S. A. A. A., Othman, A. S., Akib, N. A. M., Jamaludin, N. A., Esa, Y., and Nor, S. A. M. (2021). Mitochondrial markers identify a genetic boundary of the Green Tiger Prawn (Penaeus semisulcatus) in the Indo-Pacific Ocean. Zool. Stud. 60:e8. doi: 10.6620/ZS.2021.60-08
Hall, T. (1999). BioEdit: a user-friendly biological sequence alignment editor and analysis program for Windows 95/98/NT. Nucleic Acids Symp. Ser. 41, 95–98.
Harpending, H. C. (1994). Signature of ancient population growth in a low-resolution mitochondrial DNA mismatch distribution. Hum. Biol. 66, 591–600.
Hata, H., Maekawa, T., Nakae, M., and Motomura, H. (2017). Records of three species of carangids (Perciformes: Carangidae), Caranx tille, Megalaspis cordyla, and Selaroides leptolepis, from Amima-oshima island, Amami Islands, Kagoshima Prefecture, southern Japan. Nat. Kagoshima 44, 27–35.
Hill, V., and Baele, G. (2019). Bayesian estimation of past population dynamics in BEAST 1.10 using the skygrid coalescent model. Mol. Biol. Evol. 36, 2620–2628. doi: 10.1093/molbev/msz172
Huang, Q. Z., Wang, W. Z., Li, Y. S., and Li, C. W. (1994). “Current characteristics of the South China Sea,” in Oceanology of China Seas, eds D. Zhou, Y. B. Liang, and C. K. Tseng (Dordrecht: Kluwer Academic Publishers), 39–47. doi: 10.1007/978-94-011-0862-1_5
Huang, Y. R., Liu, K. J., Hsieh, H. S., Hsieh, C. H., Hwang, D. F., and Tsai, Y. H. (2010). Histamine level and histamine-forming bacteria in dried fish products sold in Penghu Island of Taiwan. Food Control 21, 1234–1239. doi: 10.1016/j.foodcont.2010.02.008
Hubert, N., Meyer, C. P., Bruggemann, H. J., Guerin, F., Komeno, R. J., Espiau, B., et al. (2012). Cryptic diversity in Indo-Pacific coral-reef fishes revealed by DNA-barcoding provides new support to the centre-of-overlap hypothesis. PLoS One 7:e28987. doi: 10.1371/journal.pone.0028987
Jamaludin, N. A., Mohd-Arshaad, W., Mohd Akib, N. A., Zainal Abidin, D. H., Nghia, N. V., and Nor, S. M. (2020). Phylogeography of the Japanese scad, Decapterus maruadsi (Teleostei; Carangidae) across the Central Indo-West Pacific: evidence of strong regional structure and cryptic diversity. Mitochond. DNA A DNA Mapp. Seq. Anal. 31, 298–310. doi: 10.1080/24701394.2020.1799996
Jenkins, T. L., Castilho, R., and Stevens, J. R. (2018). Meta-analysis of northeast Atlantic marine taxa shows contrasting phylogeographic patterns following post-LGM expansions. PeerJ 6:e5684. doi: 10.7717/peerj.5684
Joshi, B. D., Johnson, J. A., Negi, T., Singh, A., Goyal, S. P., and Negi, R. K. (2019). Understanding genetic diversity and population genetic structure of three Cyprinidae fishes occupying the same habitat from Uttarakhand. India. Mitochond. DNA B: Resour. 4, 2956–2961. doi: 10.1080/23802359.2019.1662740
Kartavtsev, Y. P. (2011). Divergence at Cyt-b and Co-1 mtDNA genes on different taxonomic levels and genetics of speciation in animals. Mitochond. DNA A DNA Mapp. Seq. Anal. 22, 55–65. doi: 10.3109/19401736.2011.588215
Kempter, J. M. (2015). Genetic traceability of selected populations of the yellowstripe scad, Selaroides leptolepis (Actinopterygii: Perciformes: Carangidae), based on the analysis of microsatellite DNA—CELFISH Project—Part 3. Acta Ichthyol. Piscat. 45, 299–305. doi: 10.3750/aip2015.45.3.08
Kenchington, E. (2003). “The effects of fishing on species and genetic diversity,” in Responsible Fisheries in the Marine Ecosystem, eds M. Sinclair and G. Valdimarsson (Wallingford: CAB International), 235–253. doi: 10.1079/9780851996332.0235
Klompong, V., Benjakul, S., Yachai, M., Visessanguan, W., Shahidi, F., and Hayes, K. D. (2009). Amino acid composition and antioxidative peptides from protein hydrolysates of yellow stripe trevally (Selaroides leptolepis). J. Food Sci. 74, C126–C133. doi: 10.1111/j.1750-3841.2009.01047.x
Kochzius, M., Seidel, C., Antoniou, A., Botla, S. K., Campo, D., Cariani, A., et al. (2010). Identifying fishes through DNA barcodes and microarrays. PLoS One 5:e12620. doi: 10.1371/journal.pone.0012620
Koeda, K., and Ho, H. C. (2019). Fishes of Southern Taiwan. Pingtung: National Museum of Marine Biology & Aquarium.
Kong, S., Sánchez-Pacheco, S. J., and Murphy, R. W. (2016). On the use of median-joining networks in evolutionary biology. Cladistics 32, 691–699. doi: 10.1111/cla.12147
Kumar, S., Stecher, G., Li, M., Knyaz, C., and Tamura, K. (2018). MEGA X: molecular evolutionary genetics analysis across computing platforms. Mol. Biol. Evol. 35:1547. doi: 10.1093/molbev/msy096
Leigh, J. W., and Bryant, D. (2015). POPART: full-feature software for haplotype network construction. Methods Ecol. Evol. 6, 1110–1116. doi: 10.1111/2041-210X.12410
Li, X., Shen, X., Chen, X., Xiang, D., Murphy, R. W., and Shen, Y. (2018). Detection of potential problematic Cytb gene sequences of fishes in GenBank. Front. Genet. 9:30. doi: 10.3389/fgene.2018.00030
Liu, Y., Yao, L., Ci, Y., Cao, X., Zhao, M., Li, Y., et al. (2021). Genetic differentiation of geographic populations of Rattus tanezumi based on the mitochondrial Cytb gene. PLoS One 16:e0248102. doi: 10.1371/journal.pone.0248102
Marini, M., Pedrosa-Gerasmio, I. R., Santos, M. D., Shibuno, T., Daryani, A., Romana-Eguia, M. R. R., et al. (2021). Genetic diversity, population structure and demographic history of the tropical eel Anguilla bicolor pacifica in Southeast Asia using mitochondrial DNA control region sequences. Glob. Ecol. Conserv. 26:e01493. doi: 10.1016/j.gecco.2021.e01493
Mat Jaafar, T. N. A., Taylor, M. I., Mohd Nor, S. A., Bruyn, M., and Carvalho, G. R. (2020). Comparative genetic stock structure in three species of commercially exploited Indo-Malay Carangidae (Teleosteii, Perciformes). J. Fish Biol. 96, 337–349. doi: 10.1111/jfb.14202
Mat Jaafar, T. N. A., Taylor, M. I., Mohd Nor, S. A., De Bruyn, M., and Carvalho, G. R. (2012). DNA barcoding reveals cryptic diversity within commercially exploited Indo-Malay Carangidae (Teleosteii: Perciformes). PLoS One 7:e49623. doi: 10.1371/journal.pone.0049623
Mobsby, D., and Curtotti, R. (2018). Snapshot of Australia’s Commercial Fisheries and Aquaculture in ABARES Insights. Canberra, ACT: Australian Bureau of Agricultural and Resource Economics and Sciences. doi: 10.25814/5c10f672bff77
Mohd Yusoff, N. I. S., Mat Jaafar, T. N. A., Vilasri, V., Mohd Nor, S. A., Seah, Y. G., Habib, A., et al. (2021). Genetic diversity, population structure and historical demography of the two-spined yellowtail stargazer (Uranoscopus cognatus). Sci. Rep. 11:13357. doi: 10.1038/s41598-021-92905-6
Motomura, H., Alama, U. B., Muto, N., Babaran, P., and Ishikawa, S. (2017). Commercial and Bycatch Market Fishes of Panay Island, Republic of the Philippines. Kagoshima: Kagoshima University Museum.
Nakabo, T. (2002). Fishes of Japan: With Pictorial Keys to the Species. Tokyo: Tokai University Press.
Niu, S. F., Wu, R. X., Zhai, Y., Zhang, H. R., Li, Z. L., Liang, Z. B., et al. (2019). Demographic history and population genetic analysis of Decapterus maruadsi from the northern South China Sea based on mitochondrial control region sequence. PeerJ 7:e7953. doi: 10.7717/peerj.7953
Ovenden, J. R., Kashiwagi, T., Broderick, D., Giles, J., and Salini, J. (2009). The extent of population genetic subdivision differs among four co-distributed shark species in the Indo-Australian archipelago. BMC Evol. Biol. 9:40. doi: 10.1186/1471-2148-9-40
Ovenden, J. R., Lloyd, J., Newman, S. J., Keenan, C. P., and Slater, L. S. (2002). Spatial genetic subdivision between northern Australian and southeast Asian populations of Pristipomoides multidens: a tropical marine reef fish species. Fish. Res. 59, 57–69. doi: 10.1016/S0165-7836(01)00415-5
Piddocke, T., Ashby, C., Hartmann, K., Hesp, A., Hone, P., Klemke, J., et al. (2020). Status of Australian Fish Stocks Reports 2020, 5 Edn, Canberra: Fisheries Research and Development Corporation.
Posada, D., and Crandall, K. A. (2001). Intraspecific gene genealogies: trees grafting into networks. Trends Ecol. Evol. 16, 37–45. doi: 10.1016/s0169-5347(00)02026-7
Prabhu, M. S. (1956). Maturation of intra-ovarian eggs and spawning periodicities in some fishes. J. Fish. 3, 51–90.
Rambaut, A., Drummond, A. J., Xie, D., Baele, G., and Suchard, M. A. (2018). Posterior summarization in Bayesian phylogenetics using Tracer 1.7. Syst. Biol. 67, 901–904. doi: 10.1093/sysbio/syy032
Ramos-Onsins, S. E., and Rozas, J. (2002). Statistical properties of new neutrality tests against population growth. Mol. Biol. Evol. 19, 2092–2100. doi: 10.1093/oxfordjournals.molbev.a004034
Reed, D. L., Carpenter, K. E., and Degravelle, M. J. (2002). Molecular systematics of the Jacks (Perciformes: Carangidae) based on mitochondrial cytochrome b sequences using parsimony, likelihood, and Bayesian approaches. Mol. Phylogenet. Evol. 23, 513–524. doi: 10.1016/S1055-7903(02)00036-2
Rohfritsch, A., and Borsa, P. (2005). Genetic structure of Indian scad mackerel Decapterus russelli: pleistocene vicariance and secondary contact in the Central Indo-West Pacific Seas. Heredity 95, 315–326. doi: 10.1038/sj.hdy.6800727
Rozas, J., Ferrer-Mata, A., Sánchez-Delbarrio, J. C., Guirao-Rico, S., Librado, P., Ramos-Onsins, S. E., et al. (2017). DnaSP 6: DNA sequence polymorphism analysis of large data sets. Mol. Biol. Evol. 34, 3299–3302. doi: 10.1093/molbev/msx248
Salini, J. P., Ovenden, J. R., Street, R., Pendrey, R., Haryanti, O., and Ngurah, T. (2006). Genetic population structure of red snappers (Lutjanus malabaricus Bloch & Schneider, 1801 and Lutjanus erythropterus Bloch, 1790) in central and eastern Indonesia and northern Australia. J. Fish Biol. 68, 217–234. doi: 10.1111/j.0022-1112.2006.001060.x
Sienes, P. M. Q., Willette, D. A., Romena, L. R., Alvior, C. G., and Estacion, J. S. (2014). Genetic diversity and the discovery of a putative cryptic species within a valued crab fishery, Portunus pelagicus (Linnaeus 1758), in the Philippines. Philipp. Sci. Lett. 7, 317–323.
Smith, P. J., Steinke, D., Mcmillan, P., Stewart, A., and Ward, R. D. (2011). DNA barcoding of morid cods reveals deep divergence in the antitropical Halargyreus johnsoni but little distinction between Antimora rostrata and Antimora microlepis. Mitochond. DNA A DNA Mapp. Seq. Anal. 22, (Suppl. 1), 21–26. doi: 10.3109/19401736.2010.532329
Stewart Grant, W., Liu, M., Gao, T. X., and Yanagimoto, T. (2012). Limits of Bayesian skyline plot analysis of mtDNA sequences to infer historical demographies in Pacific herring (and other species). Mol. Phylogenet. Evol. 65, 203–212. doi: 10.1016/j.ympev.2012.06.006
Tajima, F. (1989). Statistical method for testing the neutral mutation hypothesis by DNA polymorphism. Genetics 123, 585–595. doi: 10.1093/genetics/123.3.585
Tangke, U., Sangadji, I., Rochmady, R., and Susiana, S. (2018). A population dynamic aspect of Selaroides leptolepis in the coastal waters of South Ternate Island, Indonesia. Aquac. Aquar. Conserv. Legis. 11, 1334–1342.
Teh, L. S. L., Zeller, D., Cabanban, A., Teh, L. C. L., and Sumaila, U. R. (2007). Seasonality and historic trends in the reef fisheries of Pulau Banggi, Sabah, Malaysia. Coral Reefs 26, 251–263. doi: 10.1007/s00338-006-0182-x
The World Bank Org (2021). World Bank Official Boundaries. Available online at: https://datacatalog.worldbank.org/dataset/world-bank-official-boundaries (accessed July 07, 2021).
Thomas, R. C. Jr., Willette, D. A., Carpenter, K. E., and Santos, M. D. (2014). Hidden diversity in sardines: genetic and morphological evidence for cryptic species in the goldstripe sardinella, Sardinella gibbosa (Bleeker, 1849). PLoS One 9:e84719. doi: 10.1371/journal.pone.0084719
Thongtam Na Ayudhaya, P., Muangmai, N., Banjongsat, N., Singchat, W., Janekitkarn, S., Peyachoknagul, S., et al. (2017). Unveiling cryptic diversity of the anemonefish genera Amphiprion and Premnas (Perciformes: Pomacentridae) in Thailand with mitochondrial DNA barcodes. Agric. Nat. Resour. 51, 198–205. doi: 10.1016/j.anres.2017.07.001
Thu, P. T., Huang, W. C., Chou, T. K., Van Quan, N., Van Chien, P., Li, F., et al. (2019). DNA barcoding of coastal ray-finned fishes in Vietnam. PLoS One 14:e0222631. doi: 10.1371/journal.pone.0222631
Torres, S. K. M., and Santos, B. S. (2020). Genetic diversity and population structure of three caranx species from Batangas Province. Phillip. J. Sci. 150, 223–236.
Ward, R. D., Zemlak, T. S., Innes, B. H., Last, P. R., and Hebert, P. D. (2005). DNA barcoding Australia’s fish species. Philos. Trans. R. Soc. Lond. B, Biol. Sci. 360, 1847–1857. doi: 10.1098/rstb.2005.1716
Welch, A., Hoenig, R., Stieglitz, J., Daugherty, Z., Sardenberg, B., Miralao, S., et al. (2013). Growth rates of larval and juvenile bigeye scad Selar crumenophthalmus in captivity. Springerplus 2, 634–634. doi: 10.1186/2193-1801-2-634
Yu, S. Y., and Siah, W. M. (1998). Development and acceptability of burgers made from Selaroides leptoleps and Aristichthys nobilis. Asian Fish. Sci. 10, 329–337.
Zhang, J. (2011). Species identification of marine fishes in china with DNA barcoding. Evid. Based Complement. Alternat. Med. 2011:978253. doi: 10.1155/2011/978253
Keywords: yellowstripe scad, Carangidae, mitochondrial DNA, haplotype, COI (cytochrome oxidase I), cytochrome B (CytB)
Citation: Halasan LC, Geraldino PJL and Lin H-C (2021) First Evidence of Cryptic Species Diversity and Population Structuring of Selaroides leptolepis in the Tropical Western Pacific. Front. Mar. Sci. 8:756163. doi: 10.3389/fmars.2021.756163
Received: 10 August 2021; Accepted: 28 September 2021;
Published: 18 October 2021.
Edited by:
Yehuda Benayahu, Tel Aviv University, IsraelReviewed by:
Claudio Oliveira, São Paulo State University, BrazilMarie Nydam, Soka University of America, United States
Copyright © 2021 Halasan, Geraldino and Lin. This is an open-access article distributed under the terms of the Creative Commons Attribution License (CC BY). The use, distribution or reproduction in other forums is permitted, provided the original author(s) and the copyright owner(s) are credited and that the original publication in this journal is cited, in accordance with accepted academic practice. No use, distribution or reproduction is permitted which does not comply with these terms.
*Correspondence: Hsiu-Chin Lin, aHNpdWNoaW5saW5AbWFpbC5uc3lzdS5lZHUudHc=