 Janaka Bamunawala
 Ad van der Spek
 Ali Dastgheib
 A. Brad Murray
 Roshanka Ranasinghe
- 1Department of Water Engineering and Management, University of Twente, Enschede, Netherlands
- 2IHE Delft Institute for Water Education, Delft, Netherlands
- 3Department of Applied Morphodynamics, Deltares, Delft, Netherlands
- 4Department of Physical Geography, Faculty of Geosciences, Utrecht University, Utrecht, Netherlands
- 5Division of Earth and Ocean Sciences, Center for Non-linear and Complex Systems, Nicholas School of the Environment, Duke University, Durham, NC, United States
- 6Harbour, Coastal and Offshore Engineering, Deltares, Delft, Netherlands
Barrier-island systems, spanning ∼7% of the world’s coastlines, are of great importance to society because not only they provide attractive, liveable space for coastal communities but also act as the first line of defense from coastal storms. As many of these unique coastal systems are affected by both oceanic and terrestrial processes, it is necessary to consider the holistic behavior of applicable terrestrial and coastal processes when investigating their evolution under plausible future scenarios for climate change, population growth and human activities. Such holistic assessments, also accounting for uncertainties, can readily be achieved via reduced-complexity modeling techniques, owing to their much faster simulation times compared to sophisticated process-based models. Here, we develop and demonstrate a novel probabilistic modeling framework to obtain stochastic projections of barrier-island evolution over the twenty-first century while accounting for relevant oceanic and terrestrial processes under climate change impacts and anthropogenic activities. The model is here demonstrated at the Chandeleur islands (Louisiana, United States) under the four Intergovernmental Panel on Climate Change (IPCC) greenhouse gas emission scenarios (i.e., Representative Concentration Pathways 2.6, 4.5, 6.0, and 8.5) with results indicating that there are significant uncertainties in projected end-century barrier-island migration distance and available barrier freeboard under the high emission scenario RCP 8.5. The range of uncertainties in these projections underscores the value of stochastic projections in supporting the development of effective adaptation strategies for these fragile coastal systems.
Introduction
Barriers are elongated, wave, tide, and wind-built ridges that are composed predominantly of unconsolidated sand and gravel and protect the adjacent mainland from open ocean processes. Most of them are oriented parallel to the general shoreline trend. Barrier island coasts cover about 7% of the world’s coastlines (Stutz and Pilkey, 2001, 2011) and are often densely populated areas subjected to potentially conflicting interests of economy, coastal safety and ecology. They are generally separated from the mainland by tidal creeks, bays, and lagoons. Beaches and dune systems form on the barrier island facing the ocean, while the side facing the mainland shore often contains marshes, tidal flats, and/or maritime forests. These coastal ecosystems areas are important habitats for seabirds, fish, and nesting sea turtles.
The global distribution of barrier islands is very uneven, except for their tectonic setting, with 75% of the world’s barrier coastlines occupying low relief coastal plains on trailing edge continental margins (Stutz and Pilkey, 2001). Barrier island systems can be classified in different ways: attachment vs. detachment, wave or tide dominance, open water or fetch limited exposure, drift, or swash alignment, single or multiple barrier planform, and island length or inlet width. Detached barriers form islands. In contrast, attached barriers form different forms of barrier systems (e.g., tombolos and double tombolos, barrier spits, and pocket barriers) (van Heteren, 2014).
Barrier islands are essential in protecting coastal communities and ecosystems from extreme weather/wave conditions as they absorb most of the energy in waves before they arrive at mainland coasts. This energy absorption generally results in slower rise of surge heights and reduced flooding on mainland coasts, thus safeguarding valuable infrastructure and millions of lives in coastal communities. However, unfortunately, barrier islands are disappearing at an alarming rate (Feagin et al., 2010; Wicander and Monroe, 2014). In addition to the usual loss of sediment due to storm surges and specific wave and wind conditions, erosion of barrier islands may be caused by human activities such as ship traffic, hard levees, and infrastructure projects, even those far upriver. However, to the best of our knowledge, barrier island erosion due to human activities at river catchments has hardly been considered in any study to date. For instance, damming and dredging projects within river catchments can significantly affect fluvial sediment supply to the coast (Syvitski and Milliman, 2007; Syvitski et al., 2009; Syvitski and Kettner, 2011), subsequently affecting the volume of sediment available to reinforce barrier islands. The effects of climate change, including extreme weather events and accelerated sea-level rise, can cause, or in most cases, will worsen barrier island erosion.
Given their essential contributions to sustain valuable coastal ecosystems and infrastructure, many scientific investigations are being undertaken to project the evolution of barrier-island systems under different forcing and time scales. Some of those studies are focused on the evolution of barrier-islands over decadal time scales under episodic events such as storm surges and extreme weather [e.g., 2D MCO model by Rosati et al. (2010)]. Some other studies are focused on the evolution of barrier-islands on geological time scales [e.g., GEOMBEST model by Stolper et al. (2005), a simple morphodynamic model to assess barrier island evolution by Lorenzo-Trueba and Ashton (2014), the Barrier 3D model by Reeves et al. (2021), and the CoastMorpho2D model by Mariotti (2021)]. However, almost all these studies only provide deterministic projections of future barrier-island evolution. Significant uncertainties in future climate change and anthropogenically driven impacts could affect the evolution of barrier-island systems. Therefore, apart from the uncertainties arising from the modeling techniques used (i.e., model uncertainties), model-derived projections of barrier-island evolutions will inherit the uncertainties related to model inputs such as climate-change and anthropogenic activities. Therefore, it is necessary to quantify the uncertainties associated with the projections of barrier-island evolution to better inform adaptation measures to manage the impacts of future climate change and anthropogenic activities, including potential socio-economic and coastal ecosystem losses.
Here we present a simplified, fully probabilistic modeling technique to assess the evolution of barrier-island systems over multi-decadal to century time scale. Such probabilistic assessments of barrier-island systems under climate-change and anthropogenic activities requires multiple realizations with stochastic model inputs (i.e., Monte-Carlo simulations). Under ideal circumstances, if unlimited computational resources were available, such a probabilistic modeling approach could be undertaken with coupled, highly detailed coastal and catchment models for the entire period of interest. Such a coupled modeling exercise would ensure all the short-, medium-, and long-term impacts due to climate change and anthropogenic activities are accounted for, while assessing the evolution of barrier-island systems. However, due to computational restrictions, ∼100-year simulations with such detailed coupled modeling techniques are presently very expensive. Besides that, such modeling outputs are not necessarily accurate due to the potential cascade of model imperfections through temporal and spatial upscaling (Murray, 2007; French et al., 2016) and numerical error accumulation within the computational domain during long-term simulations, which in turn may lead to morphological instabilities (Duong et al., 2016; Ranasinghe, 2016, 2020). The use of reduced-complexity modeling techniques overcomes these drawbacks and allows users to obtain valuable insights into the long-term evolution of a coastal zone at a regional scale (Ranasinghe, 2016, 2020; van Maanen et al., 2016; Bamunawala et al., 2020a,b).
This paper presents the application of a novel probabilistic modeling approach to long-term (∼50–100 years) barrier-island evolution. It accounts for relevant oceanic and terrestrial processes and quantifies the input uncertainties associated with climate-change impacts and anthropogenic activities. The model’s capabilities are demonstrated by application at a selected case study location with relatively simple environmental and subsurface conditions.
Model Development
The evolution of barrier islands under changing conditions at macro time scales can be assessed based on the concepts of sediment conservation and invariant shoreface and barrier profiles. This is similar to the concepts adopted in the numerical model presented by Stolper et al. (2005) and Moore et al. (2007, 2010), in which the initial equilibrium barrier island morphology is assumed to maintain its vertical position with respect to rising sea level. Given the macro (50–100 years) time scales considered in this study and an adequate sand volume to maintain their volume and profile, it is assumed that barrier islands would eventually recover from the impact of episodic events such as storm surges, extreme waves, and winds.
Determination of Equilibrium Barrier Island Profile Volume
As a first step of the modeling framework, it is necessary to identify an initial equilibrium barrier island profile(s) that can adequately represent the average conditions of the study area. This equilibrium profile is used to calculate the initial barrier island profile volume (VBIP–i in m3/m). It provides the basis to compute future equilibrium barrier profile volume under climate change impacts and anthropogenic activities (Figure 1).
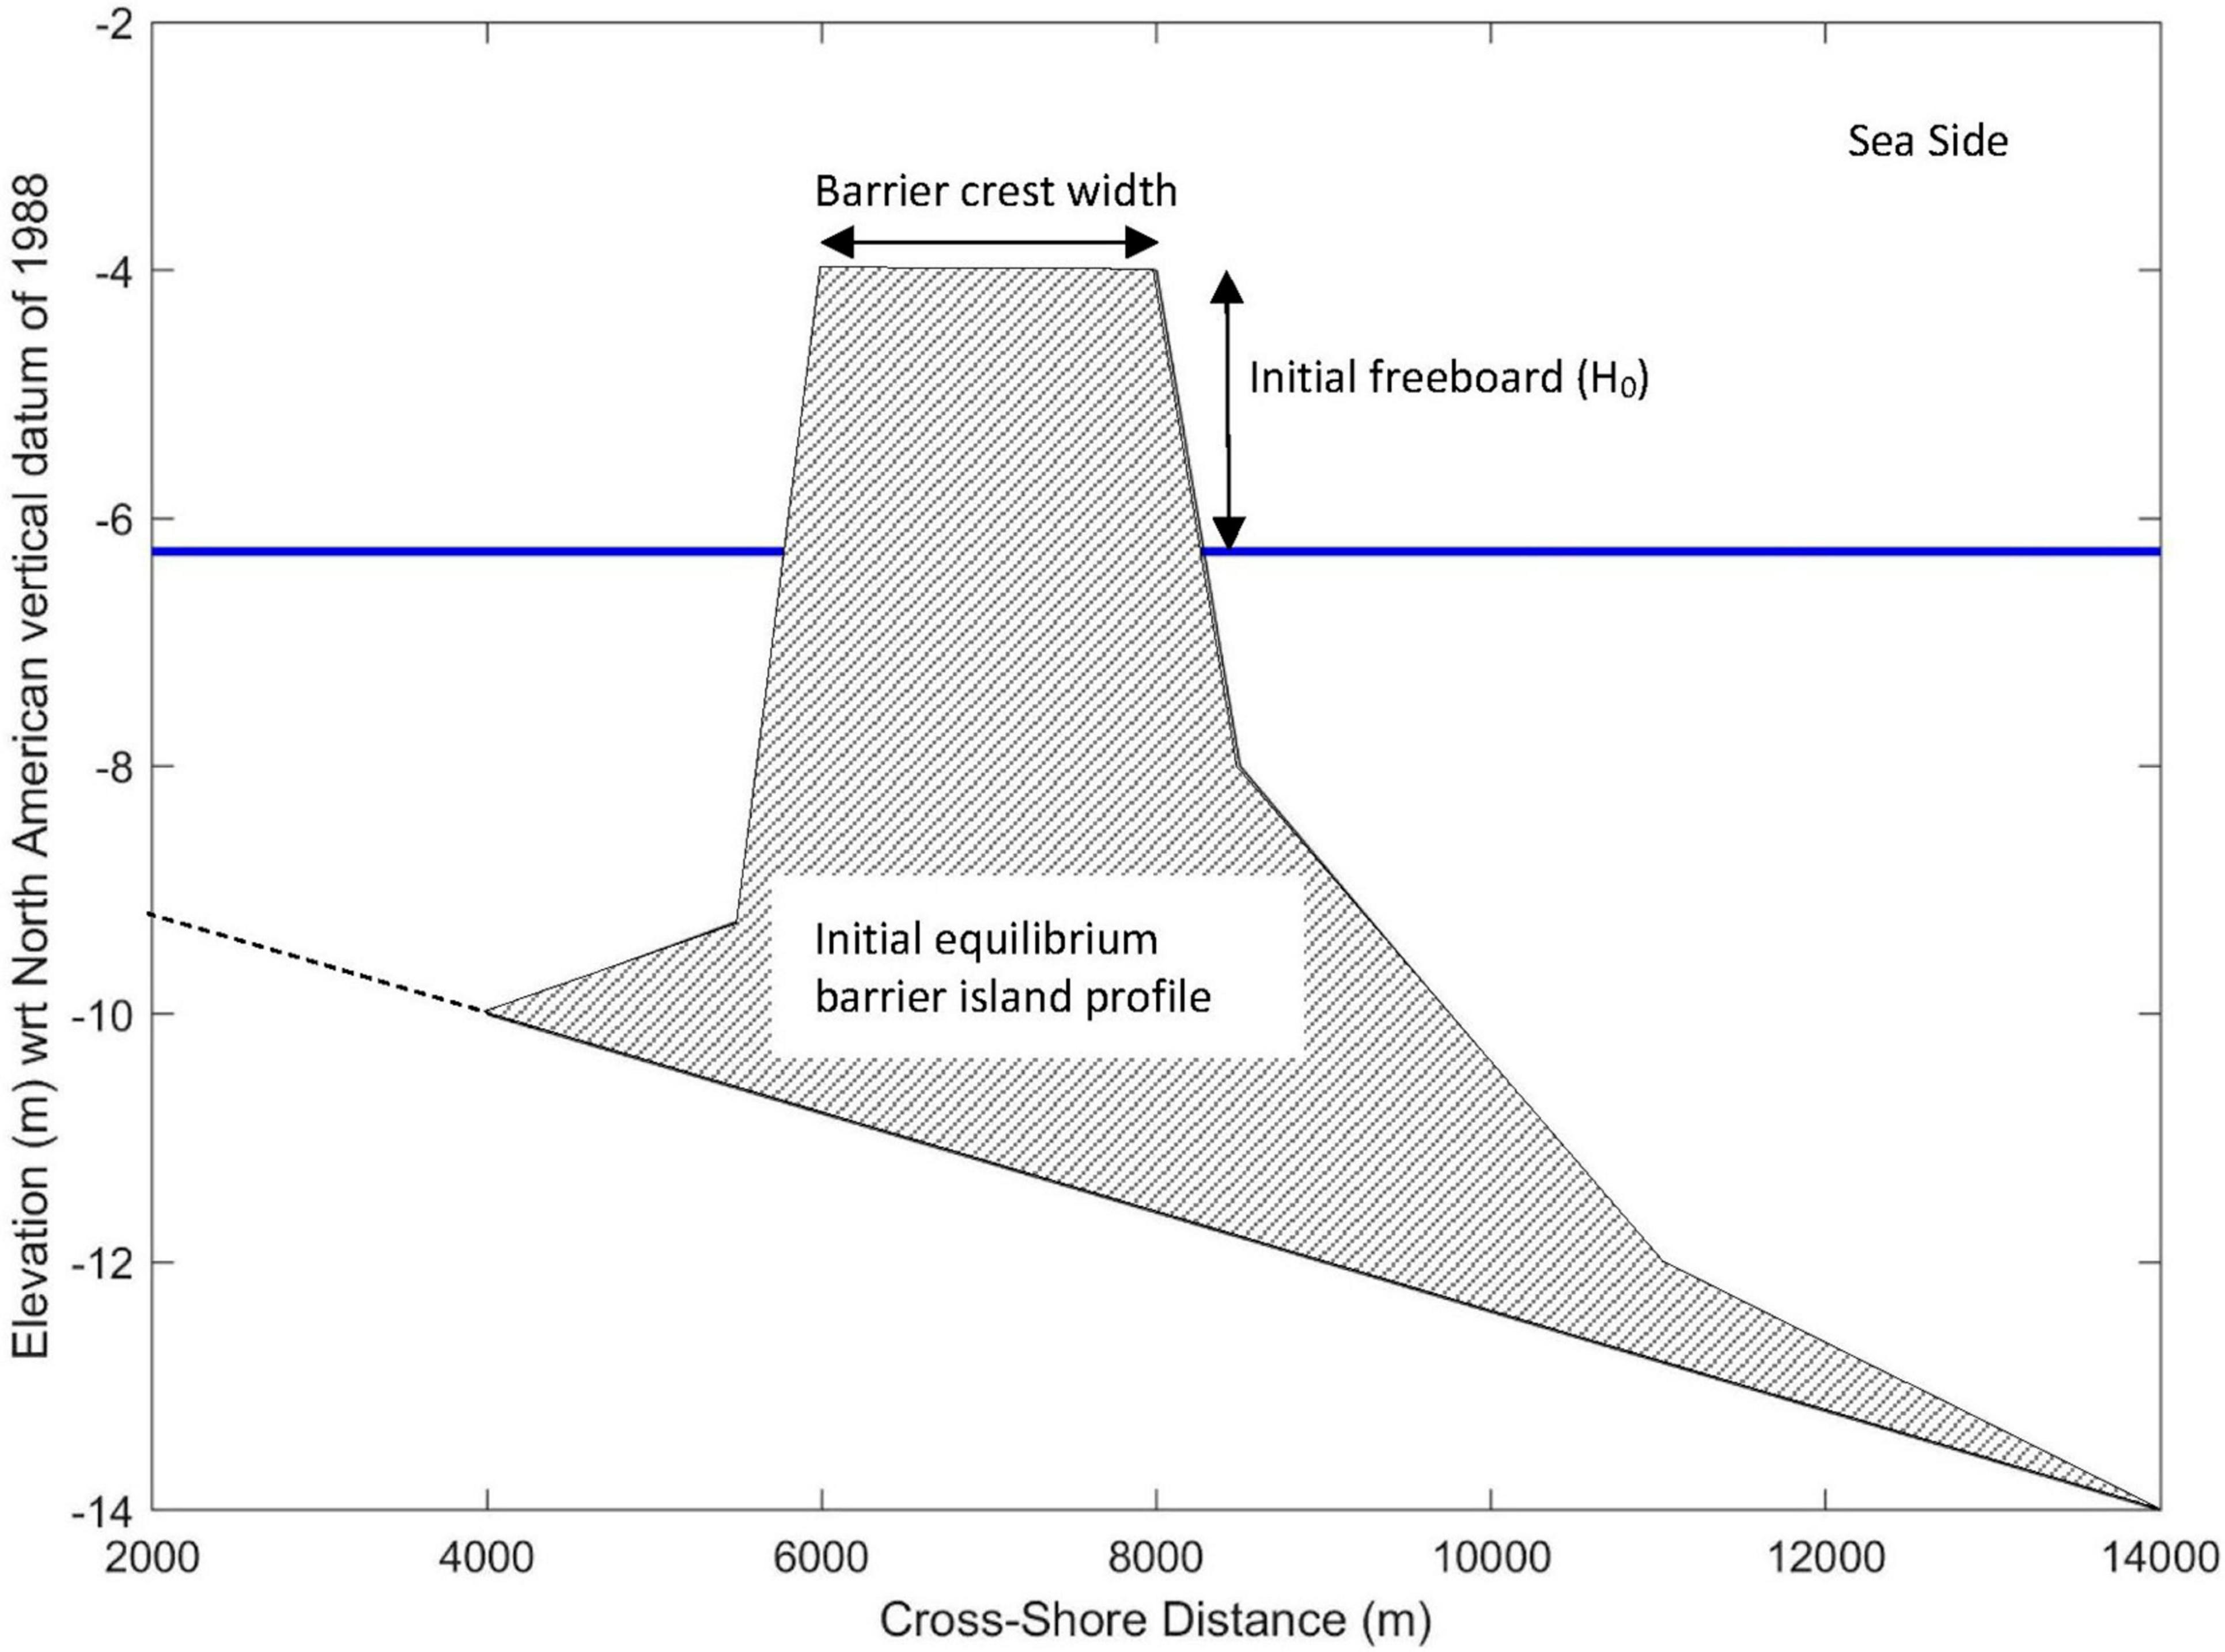
Figure 1. An illustrative plot of the initial equilibrium barrier island profile and the present-day sea level. The hatched area indicates the equilibrium barrier island profile, while the blue line indicates the present-day sea level.
According to the time scales considered in this study (i.e., 50∼100 years), sea-level rise-induced increase in accommodation space of the back-barrier (△VBI in m3) is considered to be the most significant sediment volume component that affects the future equilibrium barrier island profile. If applicable, new sediments gain to the system due to divergence in Longshore Sediment Transport (LST) (n△VLST in m3/year) and variations in fluvial sediment supply (△VFS in m3) should also be considered at an instance where a significant gradient in LST and a prominent source of terrestrial flow exist at the vicinity of the barrier island system considered. Therefore, the equilibrium barrier profile volume in a future time step (VBIP–f in m3/m) can be calculated as:
where n is the number of years considered from the reference condition, and LBIS is the length of the barrier island (m).
Accommodation space represents the additional volume formed within an estuary (or back-barrier) due to increased relative mean sea level [△RSL (m)]. Sediment demand due to basin infilling (△VBI in m3) at a barrier island systems can be calculated according to the following Eq. (2), while taking into account the time lag between sea-level rise (hydrodynamic forcing) and the associated basin infilling (morphological response) (Ranasinghe et al., 2013).
where Ab is the basin surface area (m2) and “fac” (0 < fac < 1) accounts for the morphological response lag. In this study, it is taken as 0.5 (following the argumentation and formulations in Ranasinghe et al., 2013).
Future changes in climate and human activities could result in significant changes in fluvial sediment supply from river catchments (Kettner et al., 2005; Syvitski et al., 2005, 2009; Palmer et al., 2008; Vörösmarty et al., 2009; Ranasinghe et al., 2019). If a prominent fluvial sediment source is present in the vicinity of a barrier island system, its changes will also affect the equilibrium barrier island profile volume. Previous studies investigating the long-term evolution of inlet-interrupted coastlines (e.g., Bamunawala et al., 2018, 2020a,b) have shown that the empirical BQART model presented by Syvitski and Milliman (2007) can be used to effectively assess the annual fluvial sediment supply to the coast while considering both climate change-driven impacts and human activities. This empirical model is developed based on a global dataset of 488 river basins that covers 63% of the world’s land surface and thus constitutes a highly representative subset of global geology, climate, and socioeconomic conditions. For the river catchments with an annual mean temperature greater than 2°C, the BQART model projects the annual fluvial sediment supply (Qs) by the following equation:
where ω is 0.02 or 0.0006 for the sediment volume (QS) expressed in kg/s or MT/year, respectively, Q is the annual river discharge from the catchment considered (km3/year), A is the catchment area (km2), R is the relief of the catchment (km), and T is the catchment-wide mean annual temperature (°C).
In the above equation, the term “B” represents the catchment sediment production that comprises a glacial erosion factor (I), reservoir trapping efficiency (TE) that accounts for anthropogenic sediment retention, a lithological factor (L) that represent the catchment’s soil type and erodibility, and a human-induced erosion factor (Eh), which is expressed as the following equation:
The factor for glacial erosion in the above equation is expressed as:
where Ag is the percentage of ice cover within the river catchment considered.
The BQART model uses country-wide values of Gross National Product (per capita) and population density to determine the Eh. However, Balthazar et al. (2013) have used a high-resolution (0.25°) Human FootPrint Index (HFPI) global dataset published by the Wildlife Conservation Society [WCS] and Center for International Earth Science Information Network [CIESIN] — Columbia University, Wildlife Conservation Society-WCS, and Center for International Earth Science Information Network-Ciesin-Columbia University (2005) to better represent human-induced erosion within river catchments.
It is customary to assume no loss of sediment due to LST gradients in the vicinity of barrier islands when investigating the long-term evolution of barrier island systems. However, if there is a gradient in LST in the vicinity of a barrier island system, the lower shoreface would incise into the underlying substrate, and landward movement of the barrier would then bring new sediment into the system at a rate that will meet the LST divergence. For systems with such divergence in LST, the new sediment volume gain to the system is represented by n△VLST term in the Eq. (1).
Determination of Final Barrier Island Position
Once the barrier island volume at future time step(s) is determined by Eq. (1), it is passed into a lookup table containing barrier island profile volumes, computed at different barrier crest positions. The lookup table is composed by considering the initial equilibrium barrier profile and the mean underlying substrate slope over which the barrier island migrates. This lookup table’s vertical and horizontal resolutions are kept at reasonably fine (0.01 and 10 m, respectively) so that the final barrier position could be determined with a reasonable accuracy.
The principle of using the lookup table mentioned above is that the equilibrium barrier island morphology is assumed to maintain its vertical position with respect to the rising sea level. Thus, if the considered magnitude of regional relative sea-level change is known, the vertical position of the barrier island can be determined. This provides the vertical grid position of the lookup table. The model then searches for the most suitable VBIP–f along the horizontal grid points of the lookup table and interpolates (if necessary) to determine the final horizontal position of the barrier island profile (Figure 2).
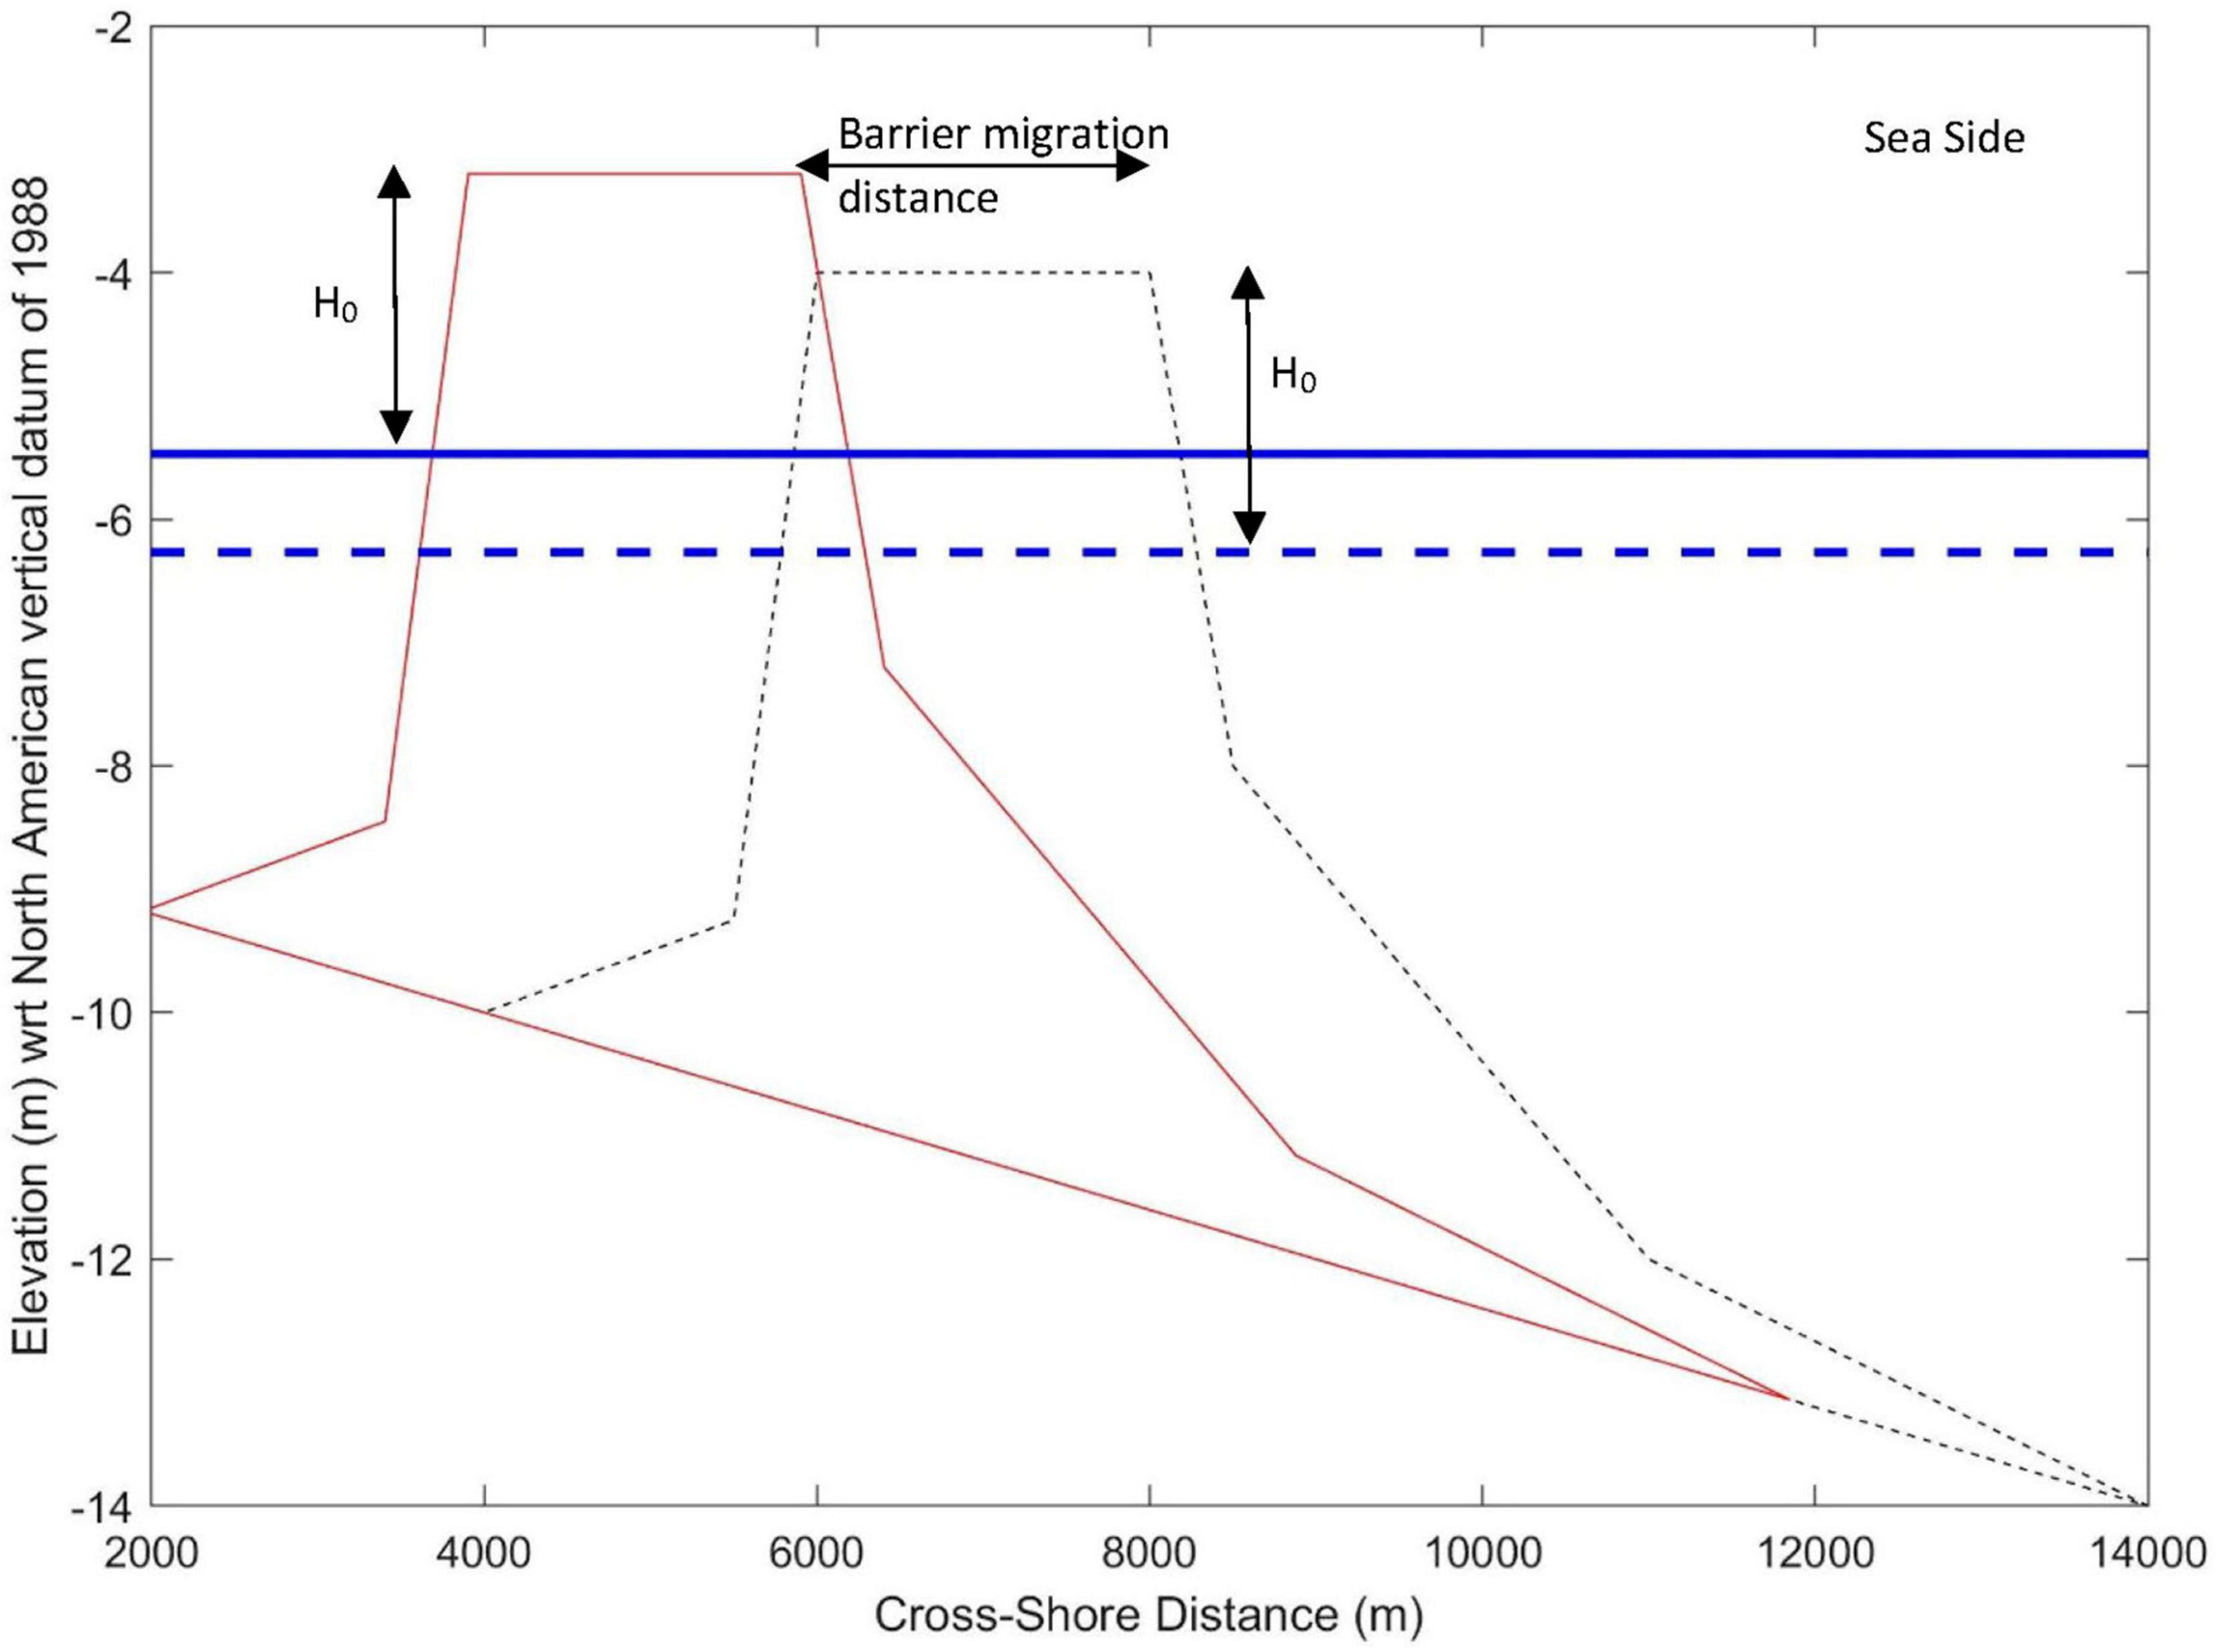
Figure 2. An illustrative plot of the intermediate barrier island profile under future sea-level conditions (computed without a threshold on maximum barrier migration rate). The dashed black line and solid red line indicate initial and future barrier island profiles, respectively. H0 is the initial barrier freeboard (maintained under future sea level). Initial and future sea levels are indicated in dashed and solid blue lines, respectively.
However, cross-shore migration of barrier islands is restricted by an applicable maximum barrier-migration rate (Rb(max)). The maximum barrier-migration rate (m/year) is a site-specific value, which primarily depends on the size and the width of the equilibrium barrier island profile. Barrier island systems with larger sediment volumes (m3/m) will have less mobility (in terms of barrier migration rate), because more energy is required to transport the larger sediment volumes cross-shore. This maximum barrier migration rate can be differentiated with respect to the system width because of the difference in energy required to transport the sediment eroded from its shoreface to the back-barrier area (Morton and Miller, 2005; Twichell et al., 2013). An approximated relationship of this concept is presented in (6) and by considering the total volume of overwash sediment (flux in 6).
where flux is the flux of overwash sediment past a line behind the beach, averaged over many storms occurred within a given year; △RSL is the rate of regional relative sea-level change, Rb is the rate of landward retreat of the barrier, Lbar is the width of the subaerial barrier, and Hbb is the back-barrier height (i.e., the depth of the back-barrier bay).
If a long-term maximum overwash flux (i.e., fluxmax) is postulated under a given sediment characteristic (as in Lorenzo-Trueba and Ashton, 2014), rearranging the above (6) to examine the maximum rate of landward retreat of the barrier (Rb(max)) provides (7):
This relationship (7) supports the above-mentioned estimate of the maximum barrier migration rate. Subsequently, this maximum migration rate applies a threshold to the possible barrier movement. Thus, the model subsequently checks whether the migration distances computed above would displace the barrier island beyond the acceptable migration threshold over a given period. If the threshold is exceeded, then the model forces the barrier profile to reduce its freeboard so that the new equilibrium position will be at a reduced vertical position with respect to the new sea level. To enable this reduction of the vertical position of the barrier island crest, the lookup table is used (via a search routine) at different vertical grid positions to determine the new horizontal position of the barrier island that does not exceed the applied maximum barrier-migration threshold (Figure 3).
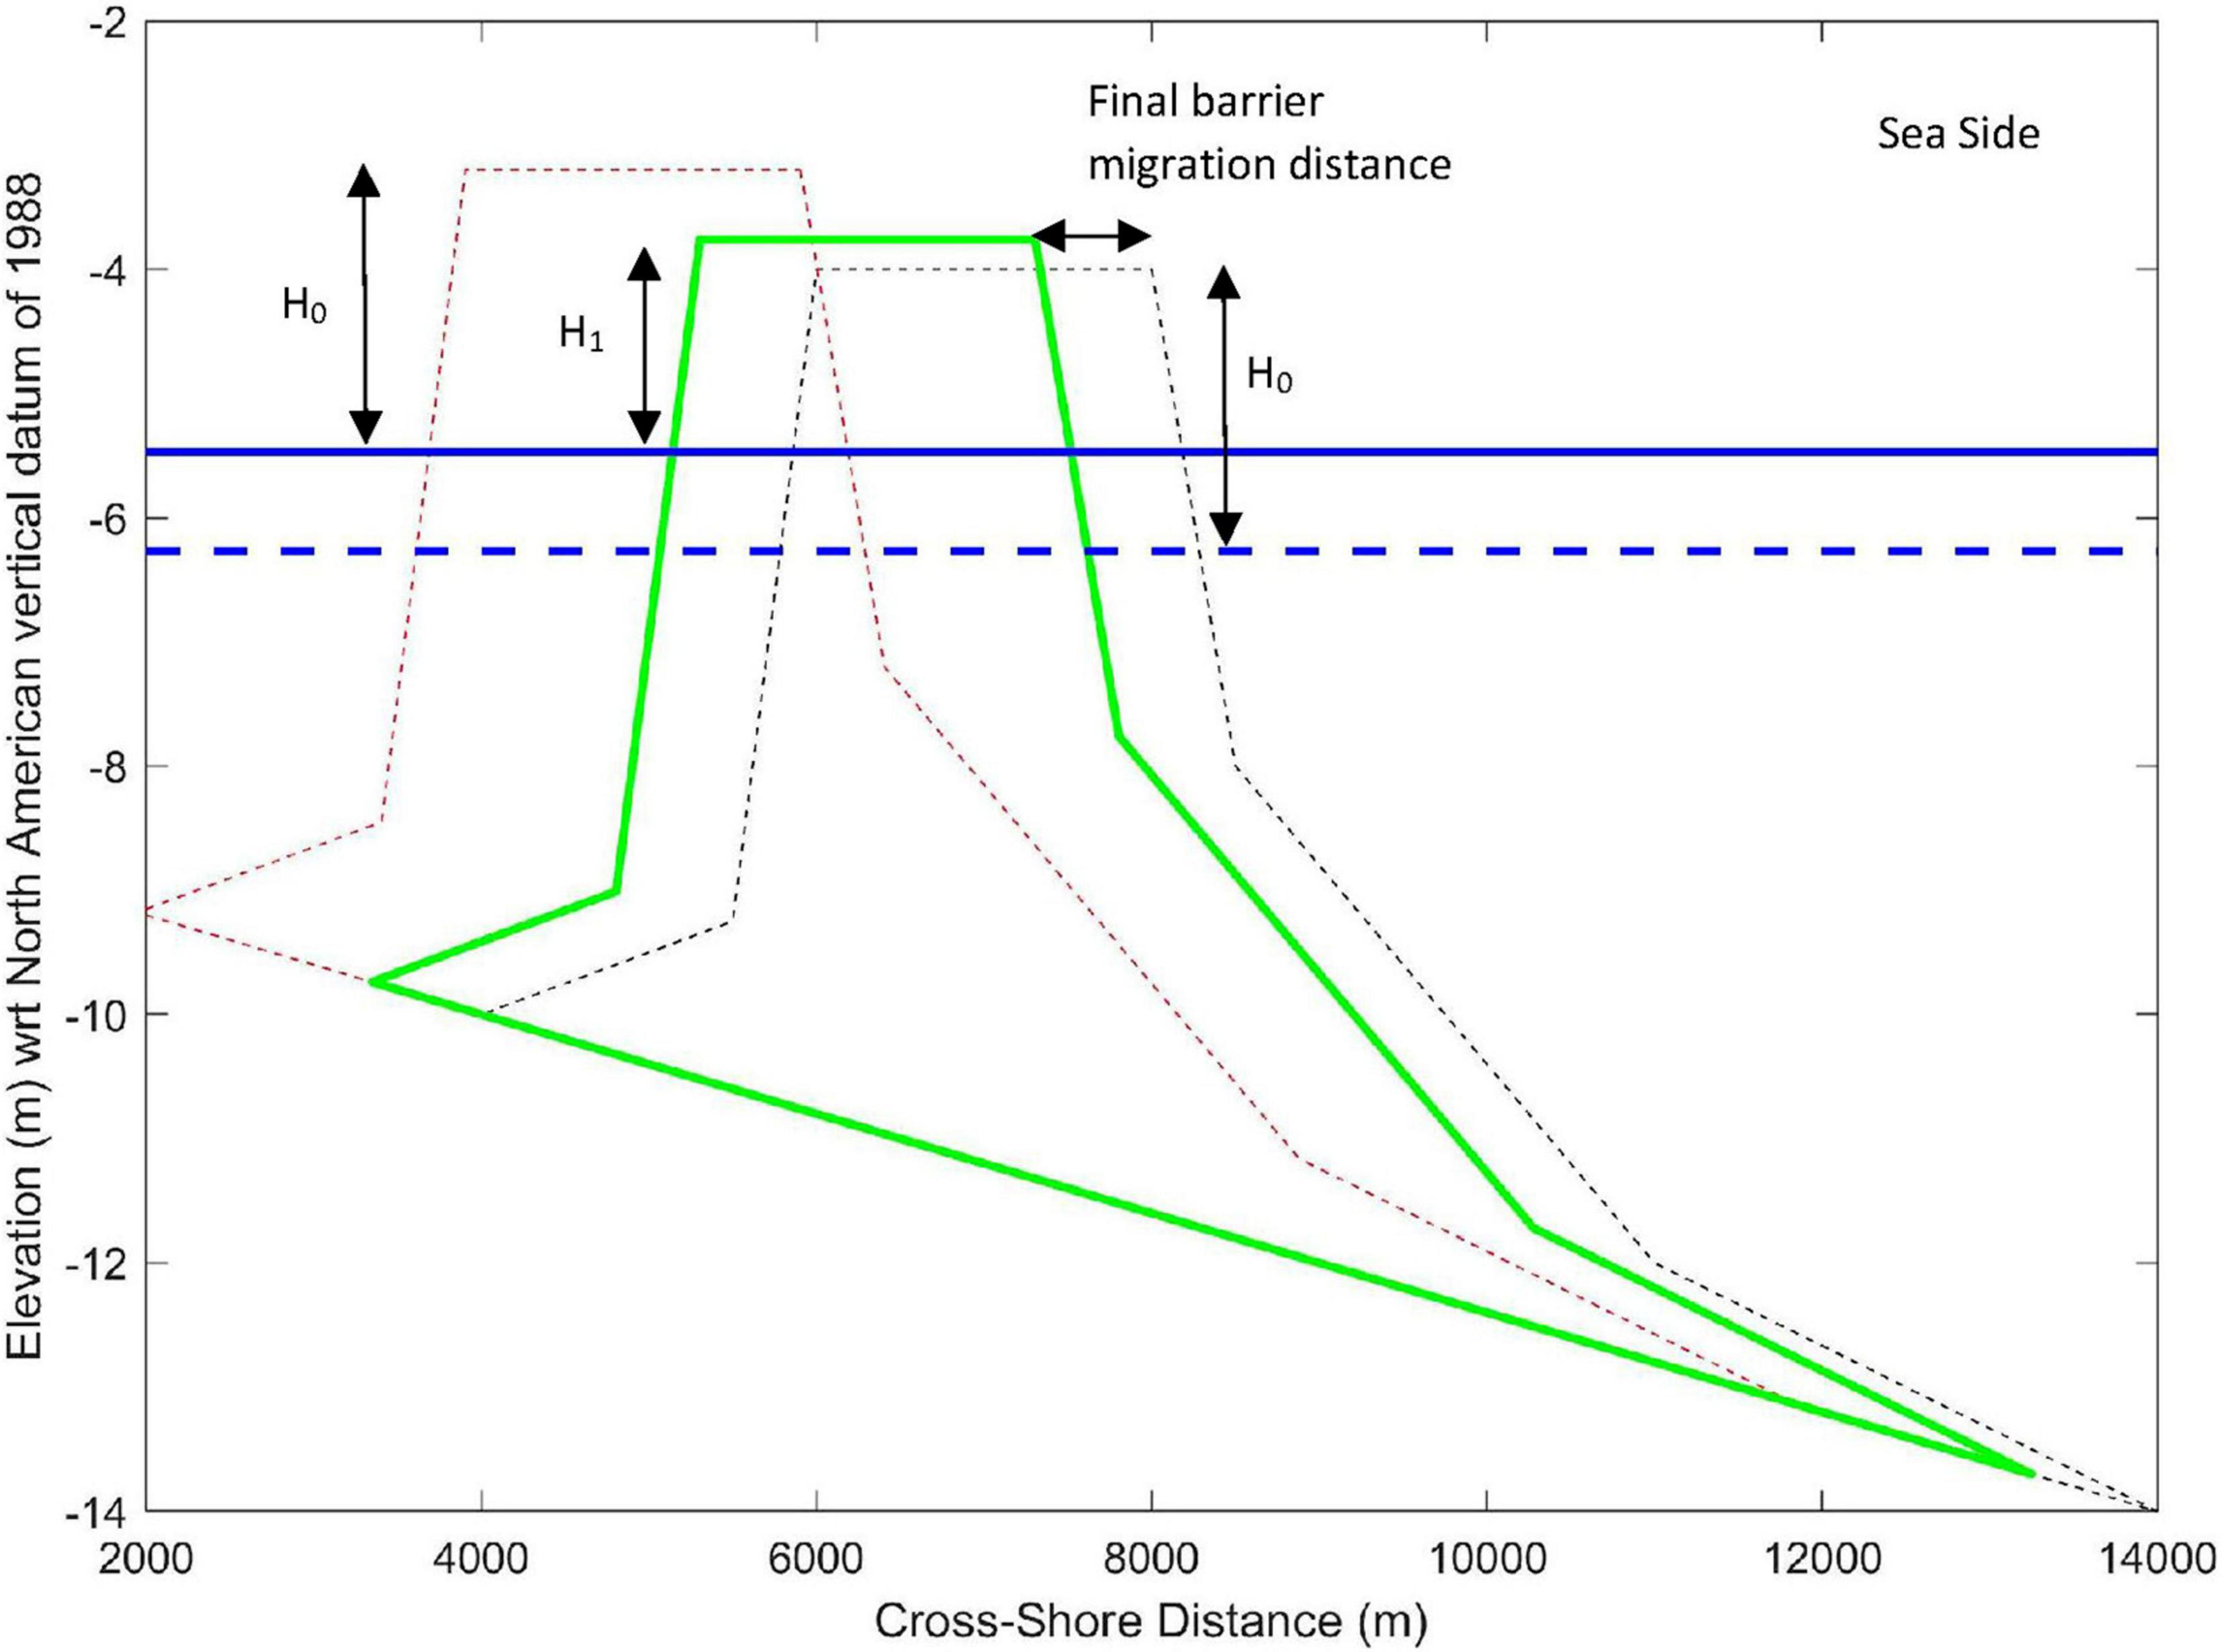
Figure 3. An illustrative plot of the final barrier island profile under future sea-level conditions (computed with a threshold on maximum barrier migration rate). Initial, intermediate, and final barrier island profiles are indicated by dashed black, dashed red, and solid green lines, respectively. H0 and H1 are the initial and future barrier freeboard, respectively. Initial and future sea levels are indicated by dashed and solid blue lines, respectively.
Figures 1–3 illustrate the above-described computation sequence of barrier island evolution. Figure 1 shows an initial equilibrium barrier-island profile (i.e., the hatched area) and its freeboard (H0) under present-day sea level (blue line). This equilibrium profile is used to calculate the initial barrier island profile volume (VBIP–i in m3/m). Figure 2 shows the barrier migration under future sea-level conditions (solid blue line). The solid red line shows this new cross-shore position of the barrier-island profile. The barrier island maintains its initial freeboard (H0) by freely migrating in the landward direction. Initial sea level and barrier island profile are shown in dashed red and black lines, respectively. Figure 3 shows the final equilibrium barrier island profile (green line) after restricting its cross-shore migration distance under the maximum barrier-migration threshold concept. The figure also indicates the final barrier freeboard (H1), which is less than its initial value (H0). The model forces this reduction in barrier freeboard (i.e., H0-H1) to accommodate the applicable maximum barrier-migration threshold (Rb(max)). The figure also indicates the reduced barrier-migration distance due to the application of the threshold for maximum migration. Initial sea level and the barrier island profile are indicated by dashed blue and black lines, respectively. The dashed red line shows the intermediate position of the barrier island.
Probabilistic Assessment of Future Barrier Island Position
The new modeling framework presented in this study requires stochastic model inputs of regional relative change in sea level (ΔRSL), maximum barrier island migration rate (Rb(max)), and if applicable, temperature (T), runoff (Q), and human-induced erosion factor (Eh) to determine the sea-level rise-induced increase in accommodation space (△VBI), the applicable threshold for maximum barrier migration distance, and fluvial sediment supply (△VFS) from the attached river catchment, respectively. The flowchart of the proposed probabilistic modeling framework that simulates the future changes in barrier islands is shown in Figure 4, followed by the descriptions of the different computational steps involved.
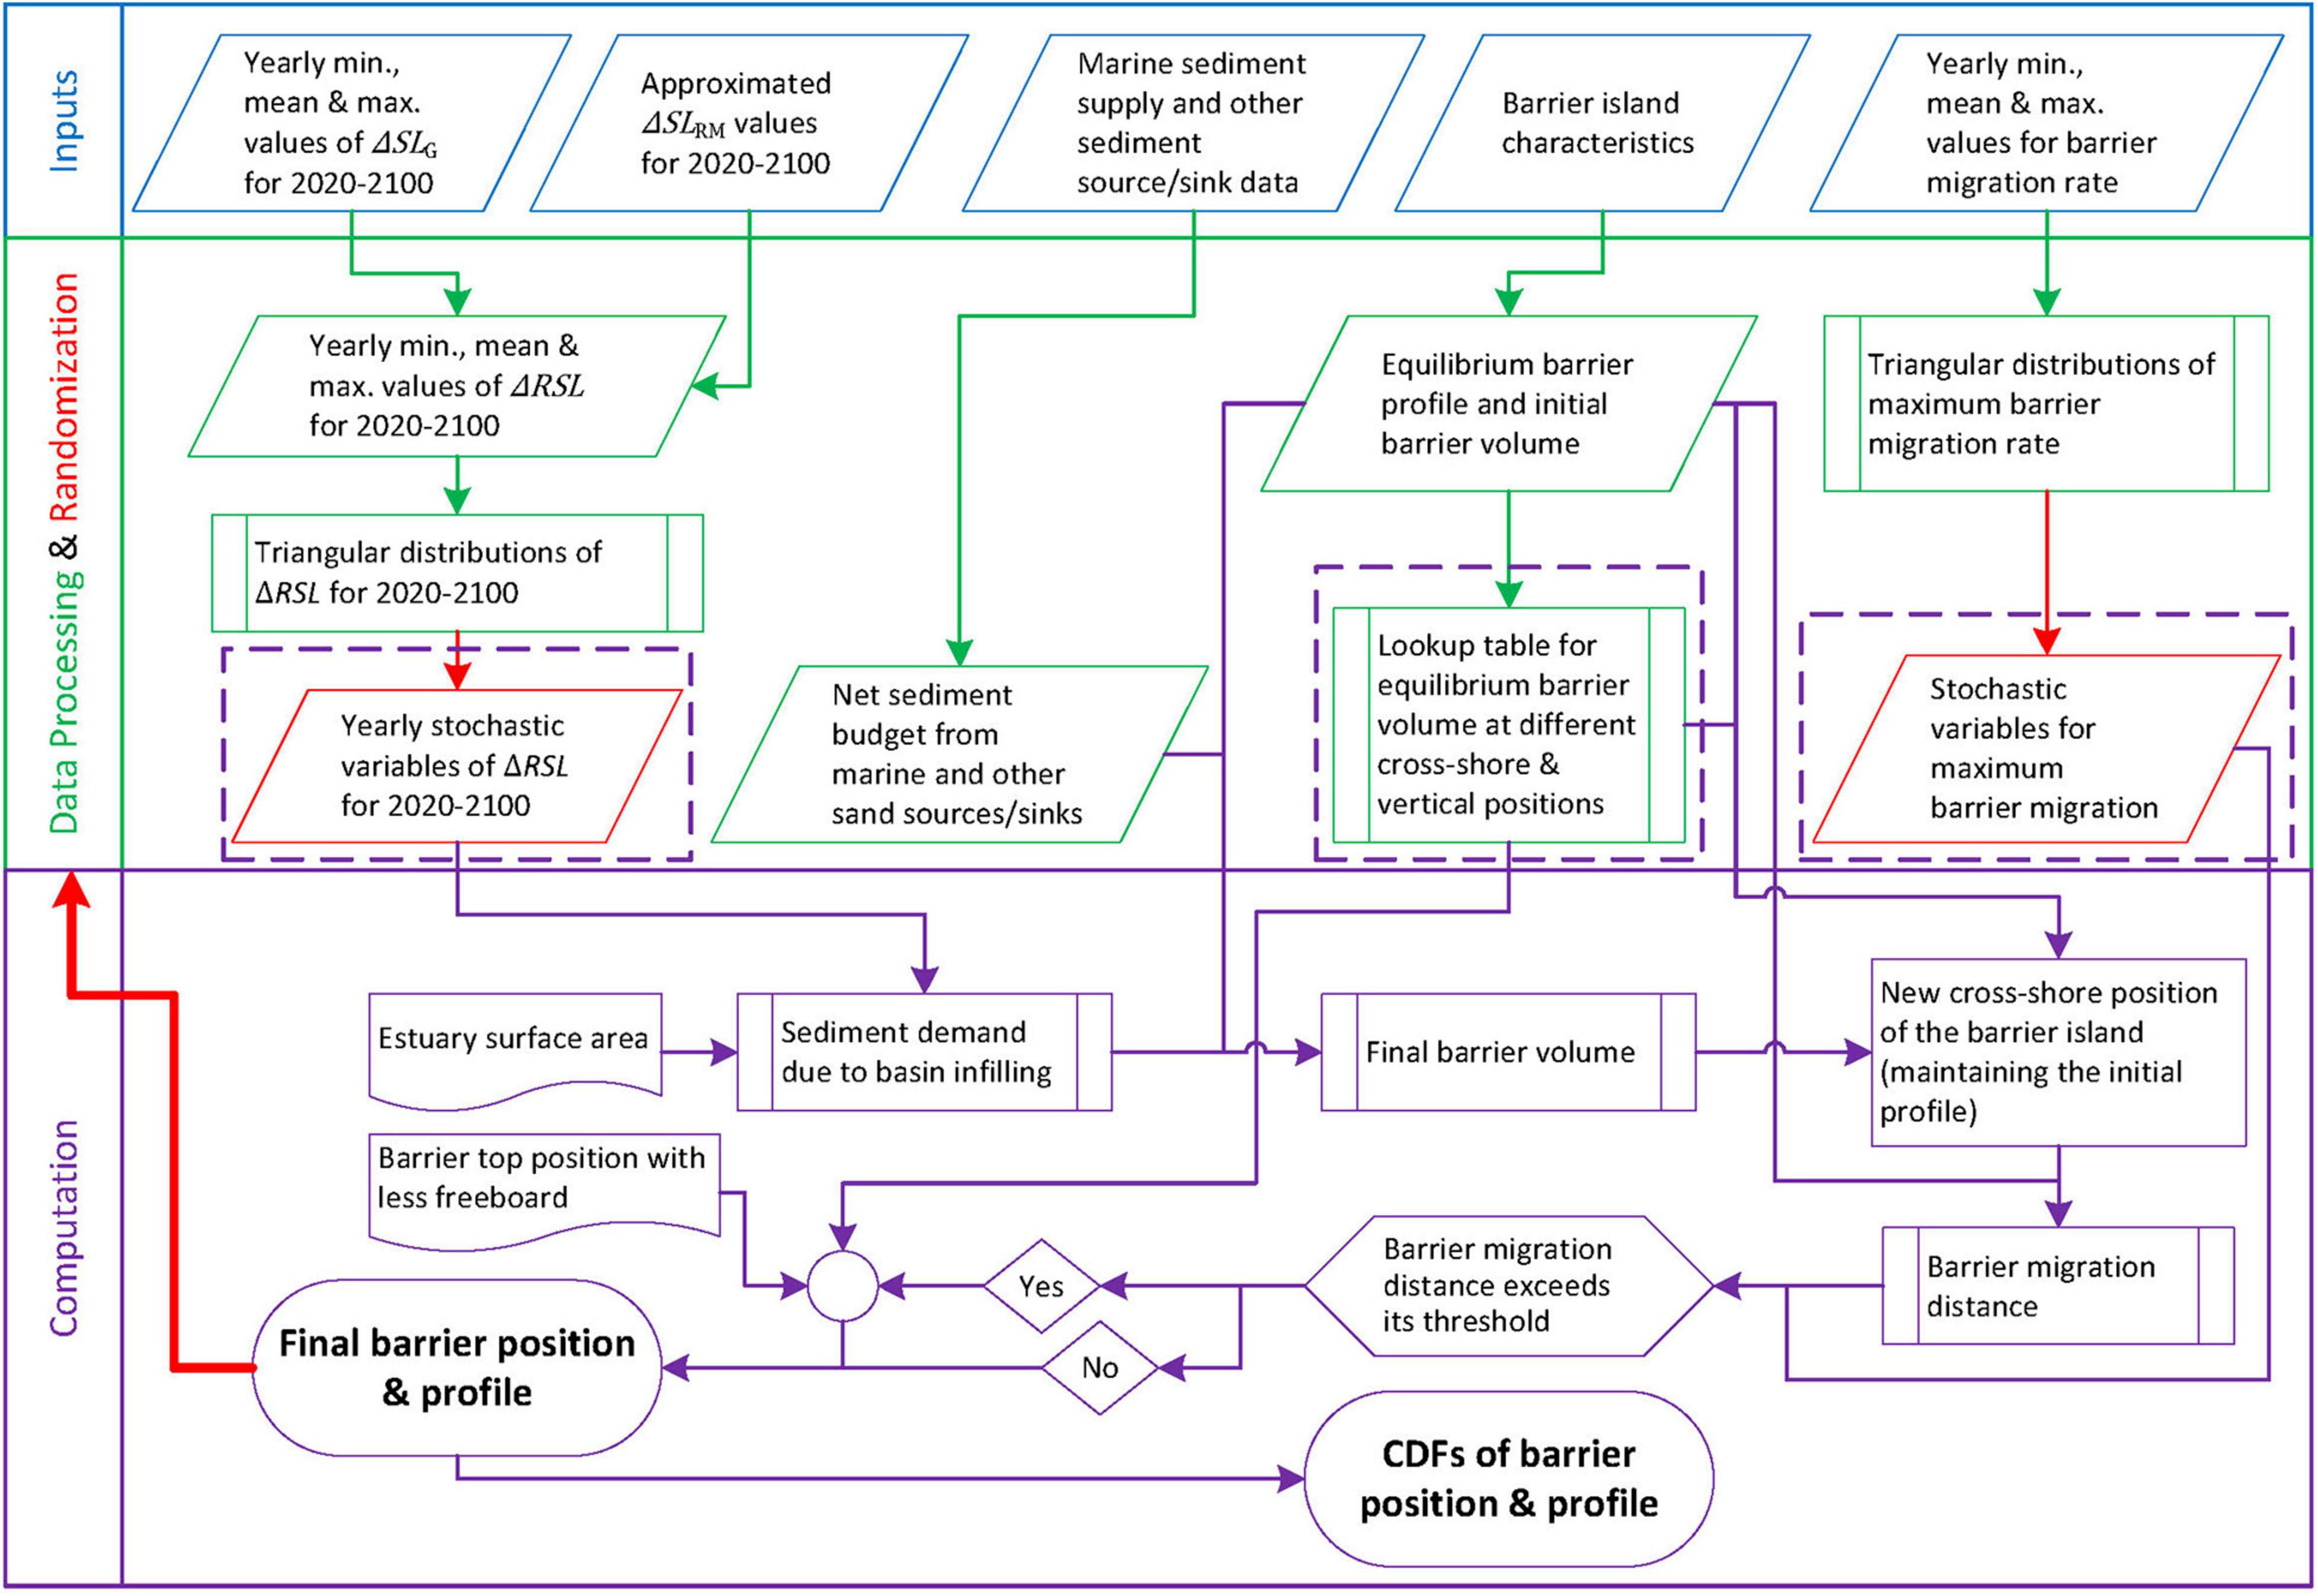
Figure 4. Flowchart of the newly developed probabilistic modeling framework to determine the future evolution of barrier-island systems.
The first step of the proposed modeling approach is the identification of data sources and the initial equilibrium barrier-island profile. Regional relative sea-level change (△RSL) values are calculated according to Nicholls et al. (2011):
where △RSL is the change in relative sea level, △SLG is the change in global mean sea level, △SLRM is the regional variation in sea level from the global mean due to meteo-oceanographic factors, △SLRG is the regional variation in sea level due to changes in the earth’s gravitational field, and △SLVLM is the change in sea level due to vertical land movement (all values in m).
Yearly minimum, mean, and maximum values of △SLG (per each RCP) are generated according to the method presented by Nicholls et al. (2014).
where △SLG is the change in global sea level (m) since 2000, “t” is the number of years since 2000, a1 is the trend in sea level change (m/year), and a2 is the change in the rate of sea-level change trend (m/year2). The a1 and a2 coefficient values are obtained from published literature (Mehvar et al., 2016) and presented as Supplementary Table 1.
Figure TS 23 of Stocker et al. (2013a) is used to determine IPCC projections of △RSL at the required location, while Table SPM 2 of Stocker et al. (2013b) to be used to obtain the corresponding △SLG values for 2100. The difference between the above two sets of values provides the aggregate impact of △SLRM, △SLRG, and △SLVLM for 2100. The temporal variation of the aggregated value of the above three components was assumed to vary linearly from 2000 to 2100 (Mehvar et al., 2016) to enable the computation of the aggregated impact of these components at yearly time steps as required by the new modeling approach presented here. Yearly △RSL values are stochastically generated by fitted triangular distributions over the 2020–2100 period (100,000 values per each RCP).
If applicable, the contribution from fluvial sediment supply is also determined stochastically by the fitted joint probability distributions between temperature (T) and runoff (Q) to represent their inter-dependency (Trenberth et al., 2007; Hegerl et al., 2015). Inputs for these distributions over the 2020–2100 period are obtained from selected General Circulation Models (GCMs). Human-induced erosion factor (Eh) values are also generated stochastically from fitted triangular distributions, where the reference condition values are assumed to increase linearly over 2020–2100 by plausible minimum, median, and maximum values (Bamunawala et al., 2020b). Maximum barrier migration values (Rb(max)) are stochastically generated by the fitted triangular distributions with the minimum, median, and maximum values for plausible barrier migration.
The net sediment volume that contributes to an equilibrium barrier island profile volume in the future is calculated based on n△VLST, △VFS, and other applicable sediment sinks/source data (Eq. 1). Initial barrier volume and the lookup table of equilibrium barrier volume are computed based on the initial barrier-island characteristics.
Final barrier island volume values are computed using the above generated stochastic model inputs of ΔRSL, applicable net sediment budget, and the initial barrier island volume (Eq. 1). Then the potential cross-shore positions of the barrier island were determined according to the method described in section “Determination of Final Barrier Island Position.” The fitted triangular distribution of maximum barrier-migration rates is used to generate potential maximum barrier-migration distances. These stochastic model inputs of maximum barrier migration rate are used to determine whether the above computed horizontal positions have exceeded the applicable threshold for migration distance. For those instances where the barrier migration threshold was found to be exceeded, new equilibrium positions of the barrier island were computed following the method described in section “Determination of Final Barrier Island Position.”
Case Study Site and Input Data
Here, the modeling concept was applied at the Chandeleur Islands (Louisiana, United States) with some simplifications to its actual conditions. This application is intended as an illustration, choosing the Chandeleur Islands because they present a relatively simple geographic setting and have been studied [e.g., Moore et al. (2014)]. The Chandeleur Islands is a chain of barrier islands located in the Gulf of Mexico, LA, United States (Figure 5). This 80 km long island chain provides shelter to the mainland Louisiana state by attenuating the intensity of waves and storm surges. The unique environmental conditions along the extensive back-barrier estuary area of the Chandeleur Islands (∼1,750 km2) are rich in biodiversity and of great economic importance. The freeboard of the barrier islands is about 2.3 m, and the barrier crest width is ∼2 km. The net annual longshore sediment transport toward the south has a long-term averaged gradient of 5.7 m3/m/year (Lavoie, 2009). Here, it was assumed that the subsurface predominantly consists of sand, allowing a straightforward application of the new probabilistic modeling approach. Previous modeling studies have represented the composition of the subsurface, and addressed the effects on barrier evolution that results from the fact that sediment added to the barrier system from shoreface erosion is partially fine-grained, and not all sand (Moore et al., 2014).
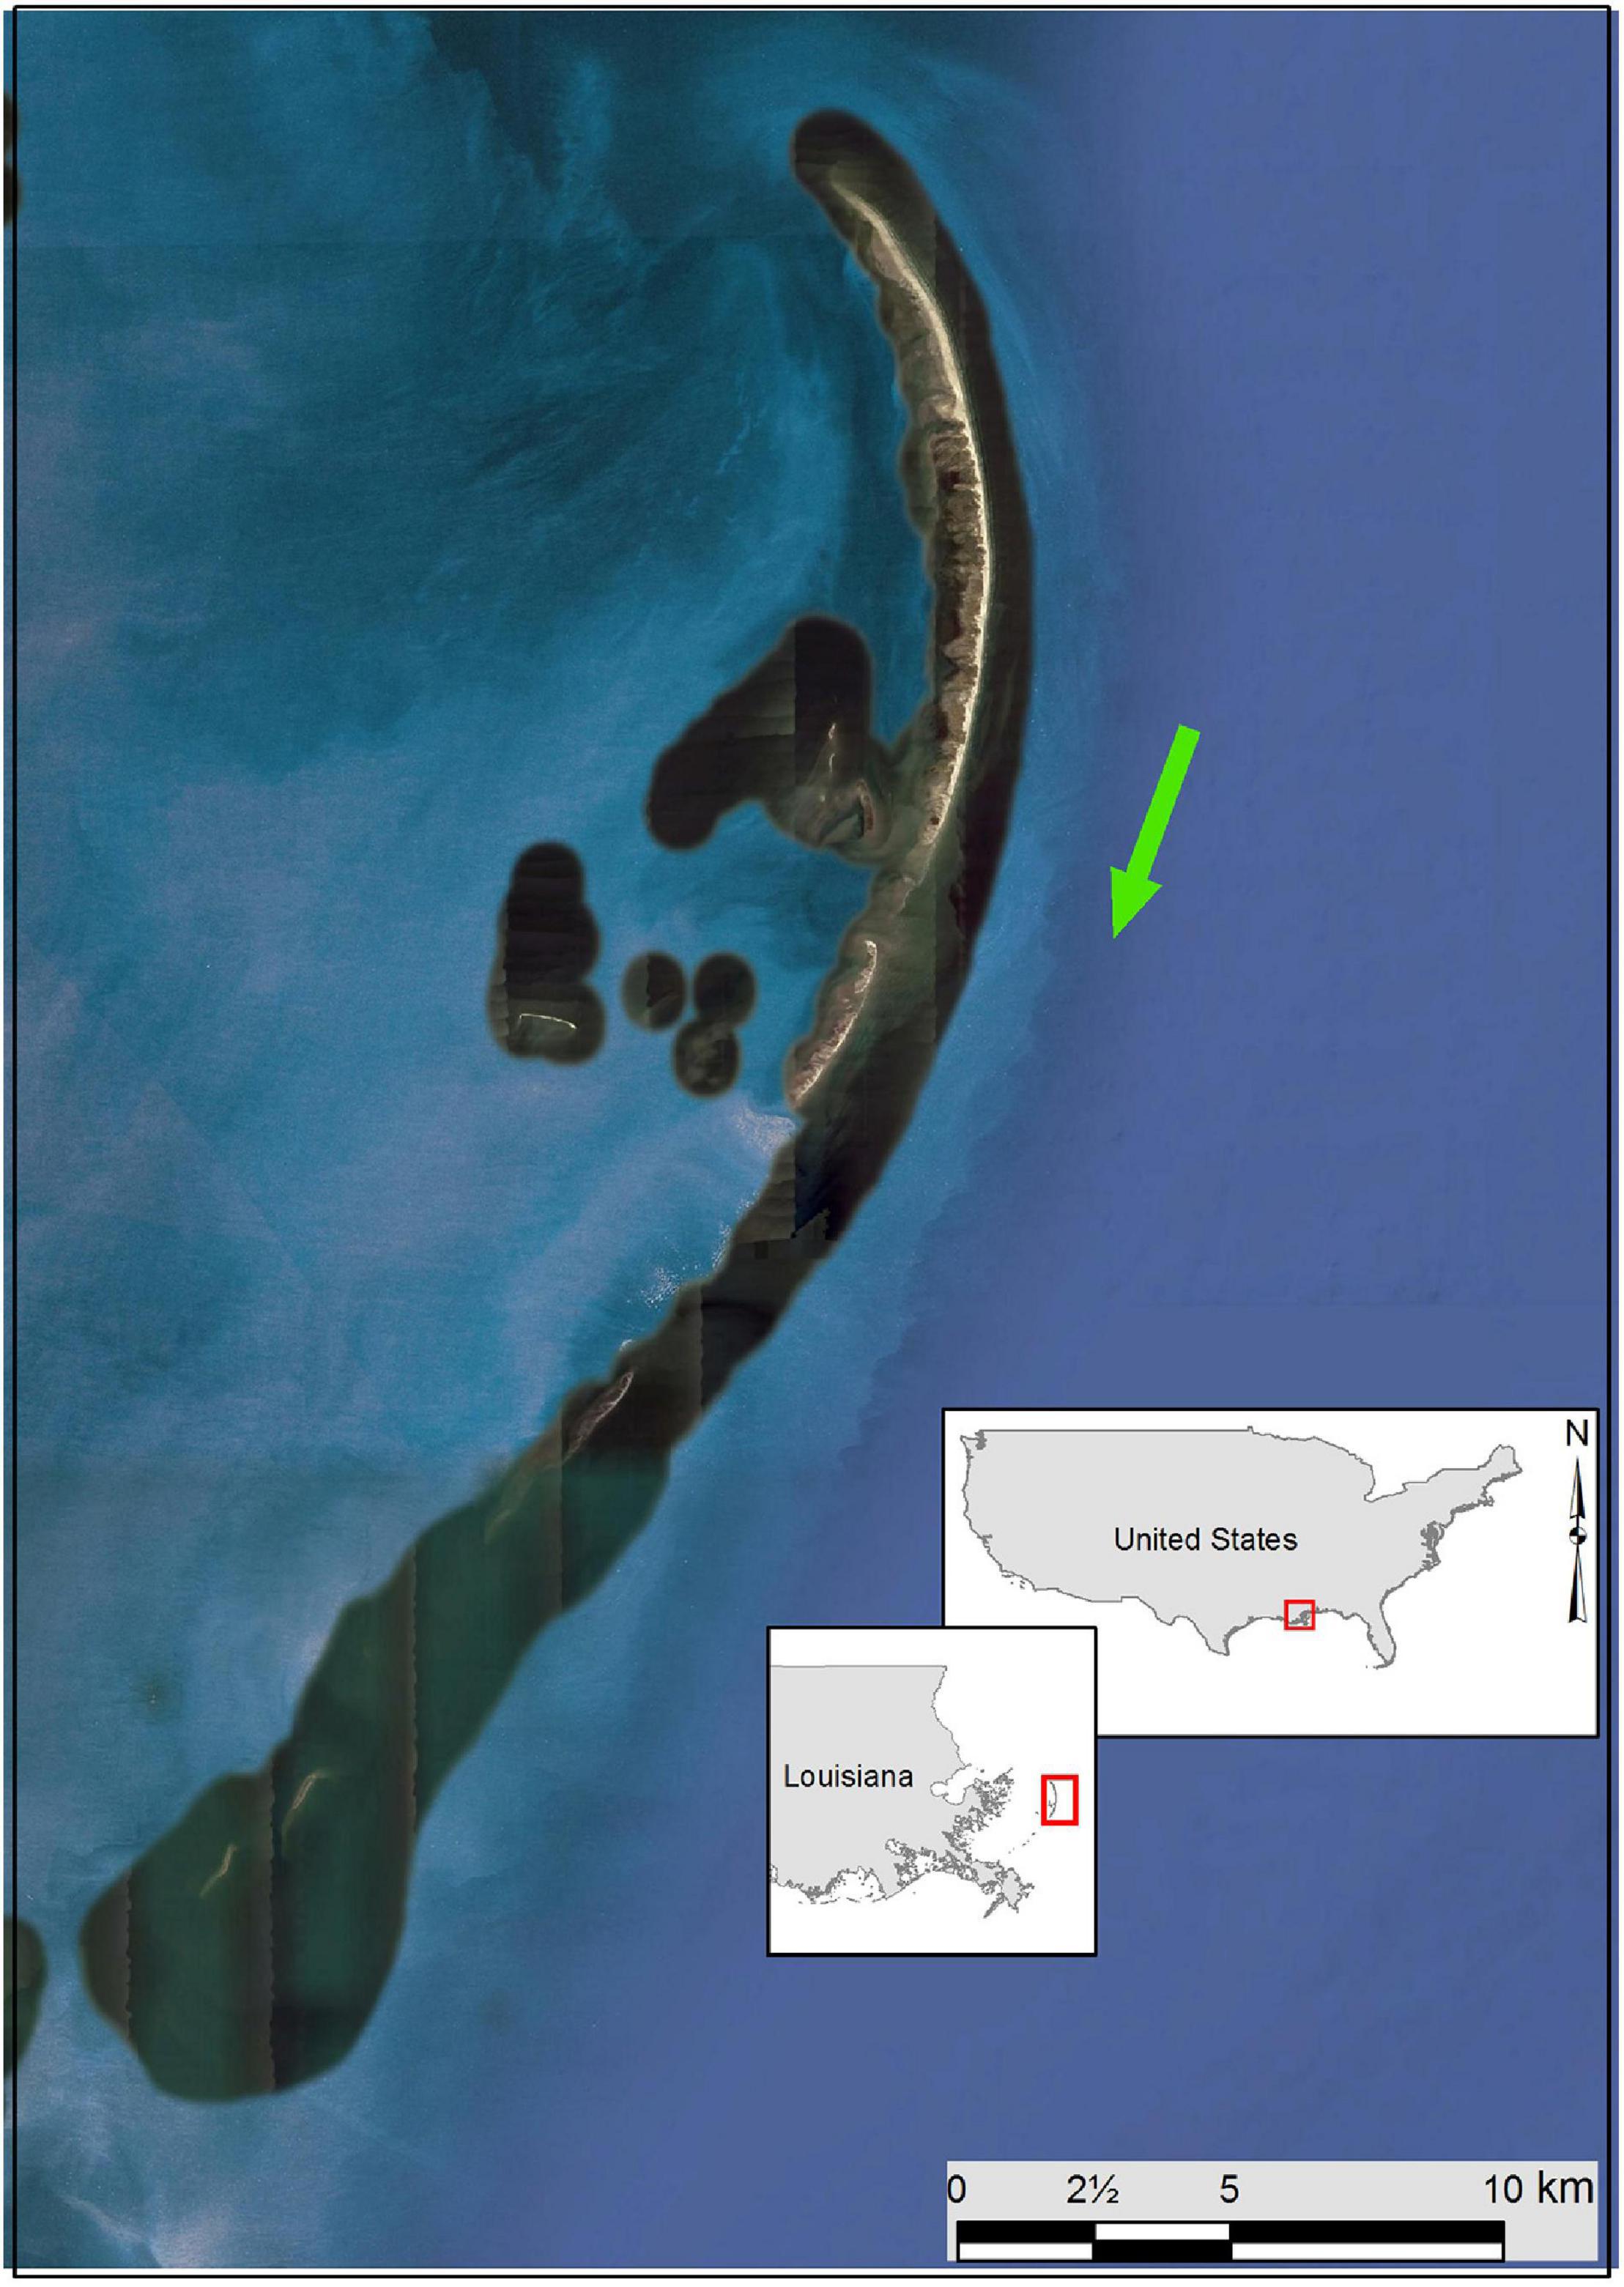
Figure 5. Location of the Chandeleur Islands barrier-island system in Louisiana, United States. The green arrow indicates the direction of net annual longshore sediment transport.
It should be noted that here, it is practically impossible for the whole area behind the island chain to keep up with the rising sea level. The Chandeleur Islands are the remainder of a lobe of the Mississippi Delta that has long been abandoned, and is not receiving sediment from the Mississippi River. Hence, it is realistic to expect only the area just behind the barrier chain to keep up with projected rising sea levels over the twenty-first century because the sediment liberated from the eroding barrier shoreface would make its way across (through overwash) and around the barrier (through LST). For this reason, here, we have considered a restricted area of the back-barrier bay in this study (Table 1). Additionally, input from fluvial sediment supply is not considered in computations.
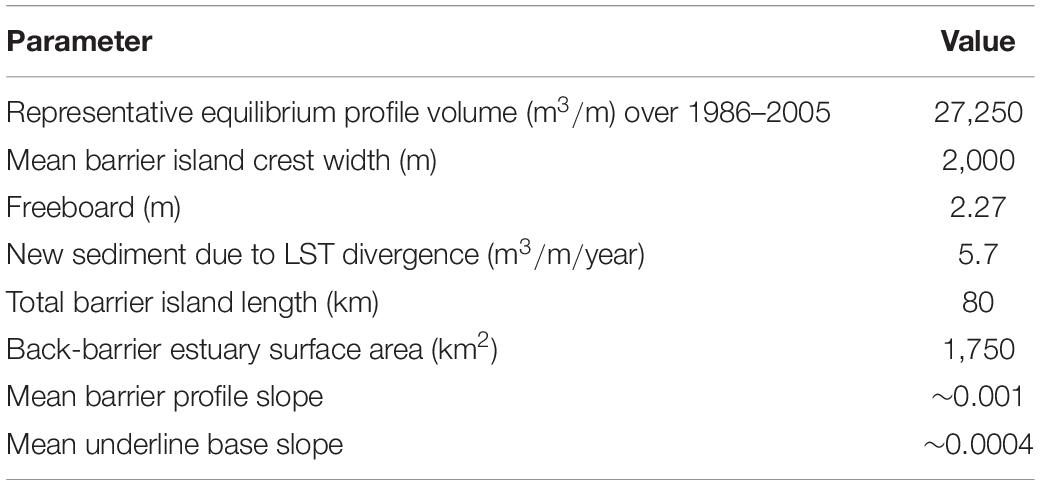
Table 1. Important characteristics of the Chandeleur Islands (Lavoie, 2009).
It is also vital to notice that although sediment is lost from each cross section in the system due to divergence in LST (Table 1), the shoreface erosion resulting from this sediment flux divergence (as well as overwash) produces new sediment that is added to the barrier chain as a whole. This modeling approach does not consider barrier elongation over the study period considered via sediment deposition along shoals at either end of the barrier chain. As such, the above-mentioned sediment volume is assumed to be retained in the chain, thus making it a gain term (n△VLST) in Eq. (1). It is also assumed that all the overwashed sediment volumes are deposited within the restricted back-barrier area considered in this study. However, a part of these overwashed sediments may be deposited beyond the restricted back-barrier areas and would not contribute to the total sediment budget of the barrier island system, potentially leading to barrier drowning at lower sea-level than projected by this model.
Figure 6 shows the projected regional relative sea-level changes (ΔRSL) in the vicinity of the Chandeleur Islands for the 2021–2100 period. The projected maximum and minimum changes in mean ΔRSL by 2100 are ∼0.65 and ∼0.40 m for RCP 8.5 and 2.6, respectively.
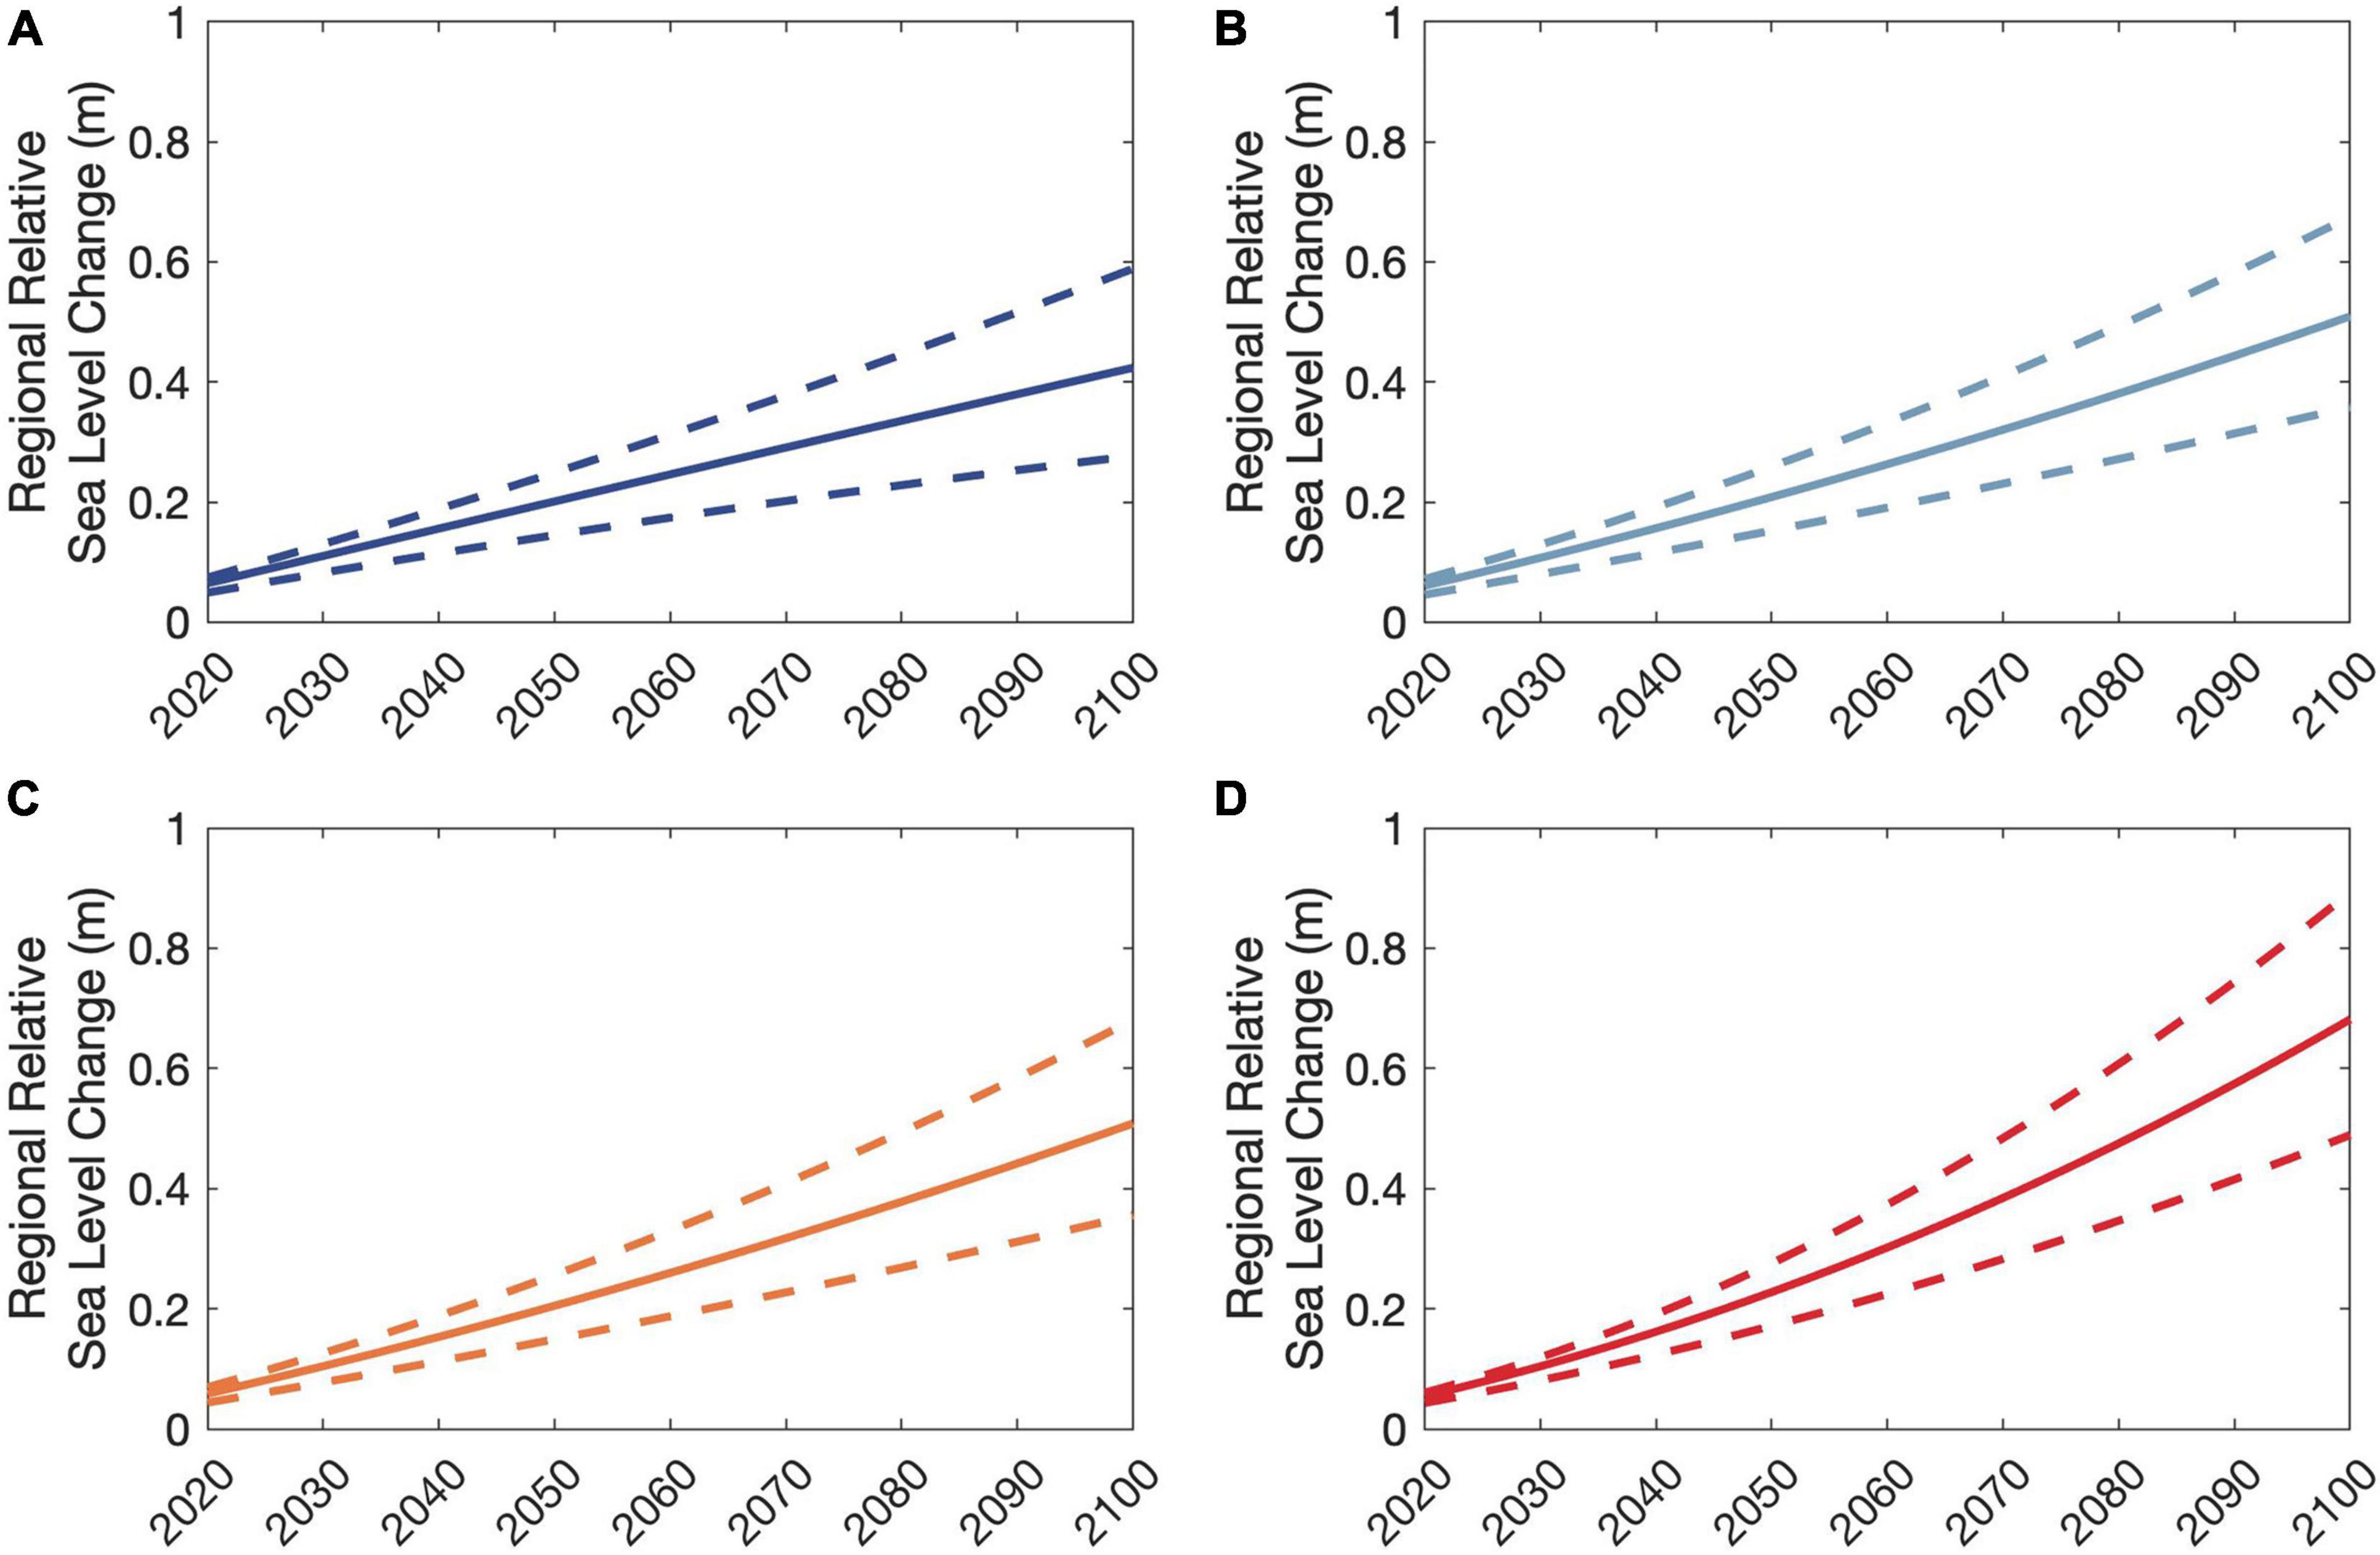
Figure 6. Projected changes in regional relative sea level at the Chandeleur Islands, Louisiana, United States. Subplots (A–D) are for the RCPs 2.6, 4.5, 6.0, and 8.5, respectively. The solid line indicates the mean change, while the two dashed lines indicate the maximum and minimum variations of △RSL.
Other relevant characteristics of the selected case study site are presented in Table 1.
Results
The model hindcast at the Chandeleur Islands is presented in section “Model Hindcast for the 1986–2005 Period.” Results of the model application at the Chandeleur Islands are presented in section “Projected Changes in the Barrier Island System” and the projected barrier island evolution under hypothetical conditions is presented in section “Projected Changes of the Barrier Island Under Hypothetical Initial Conditions.”
Model Hindcast for the 1986–2005 Period
The newly developed modeling technique was first applied deterministically to the 1986–2005 period to compare the model hindcasts with observed shoreline change at the Chandeleur Islands. For this model hindcast, the rate of global mean sea-level rise was taken as 2.1 mm/year for the 1986–2005 period, as per the projections presented in Chapter 4 of the IPCC Special Report on the Ocean and Cryosphere in a Changing Climate [i.e., Oppenheimer et al. (2019)]. The model hindcasted coastline change rate at Chandeleur Islands (8.7 m/year) for 1986–2005 compares well with satellite-image derived ambient shoreline change rates (∼9.3 m/year) presented by Luijendijk et al. (2018) over the same period, providing confidence in the model.
Projected Changes in the Barrier Island System
Figure 7 shows the empirical cumulative distributions (CDFs) of the projected migration distances for the Chandeleur Islands by 2040, 2060, 2080, and 2100 for all RCPs. These CDF plots incorporate the total uncertainty associated with the projected barrier-island migration distances. It indicates that the projected distributions of barrier-island migration distances are almost identical for RCP 2.6, 4.5, and 6.0 over the period considered. The maximum and minimum values of the projected 50th percentile-barrier island migration distance by 2100 are ∼420 and 100 m for RCP 8.5 and 2.6, respectively. It is noteworthy that the total uncertainty of the projected barrier migration distance increases significantly under RCP 8.5 (∼550 m over end-century, oppose to ∼50 m under RCP 2.6 over the same period).
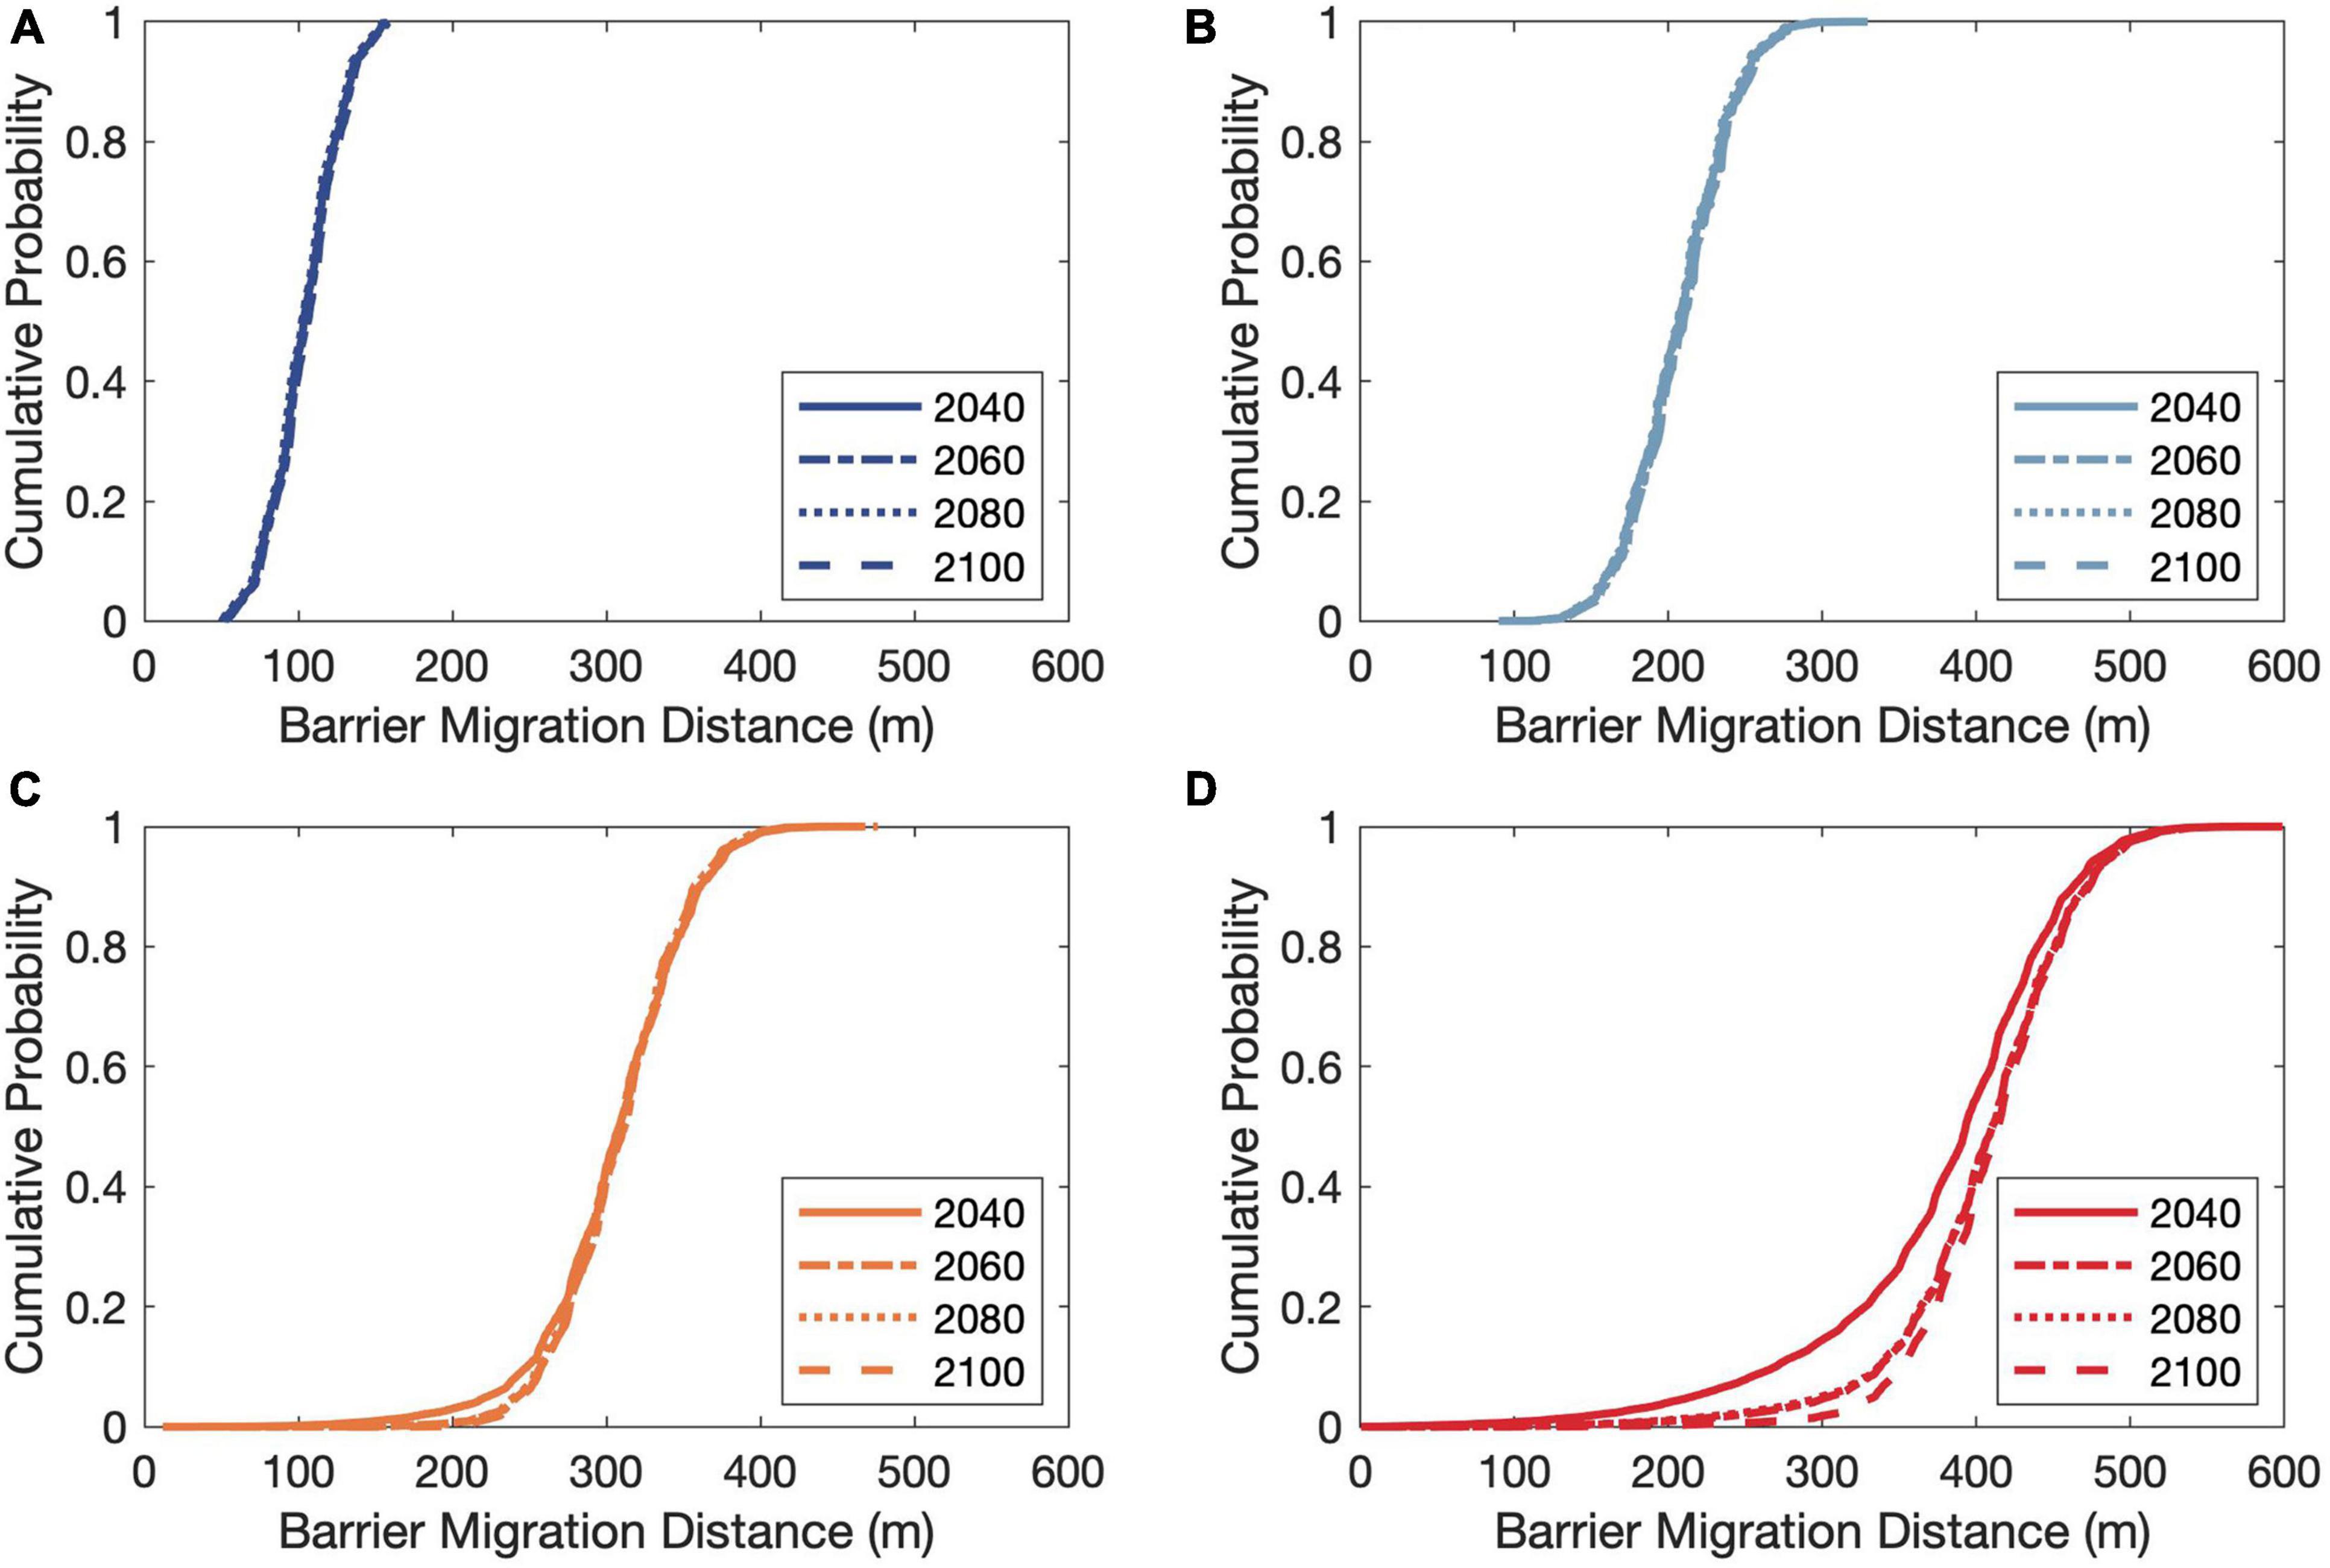
Figure 7. Empirical cumulative distributions of the projected barrier island migration distances of the Chandeleur Islands. Subplots (A–D) are for the RCPs 2.6, 4.5, 6.0, and 8.5, respectively.
Figure 8 shows the empirical cumulative distributions (CDFs) of the projected barrier island freeboard at the Chandeleur Islands by 2040, 2060, 2080, and 2100 for all RCPs. It indicates that the uncertainties in the projected barrier-islands freeboard for RCP 2.6 are similar for all the periods considered (∼0.25 m). The maximum and minimum values of the projected 50th percentile barrier-island freeboard by 2100 are ∼2.0 and 0.75 m for RCP 2.6 and 8.5, respectively. The results also indicate a ∼90% probability of the barrier-island freeboard being less than 1.0 m by 2100 for RCP 8.5. Similar to the barrier migration distance projections, here, the total uncertainty of the projected barrier freeboard increases significantly under RCP 8.5 (∼1.5 m over end-century, oppose to ∼0.5 m under RCP 2.6 over the same period).
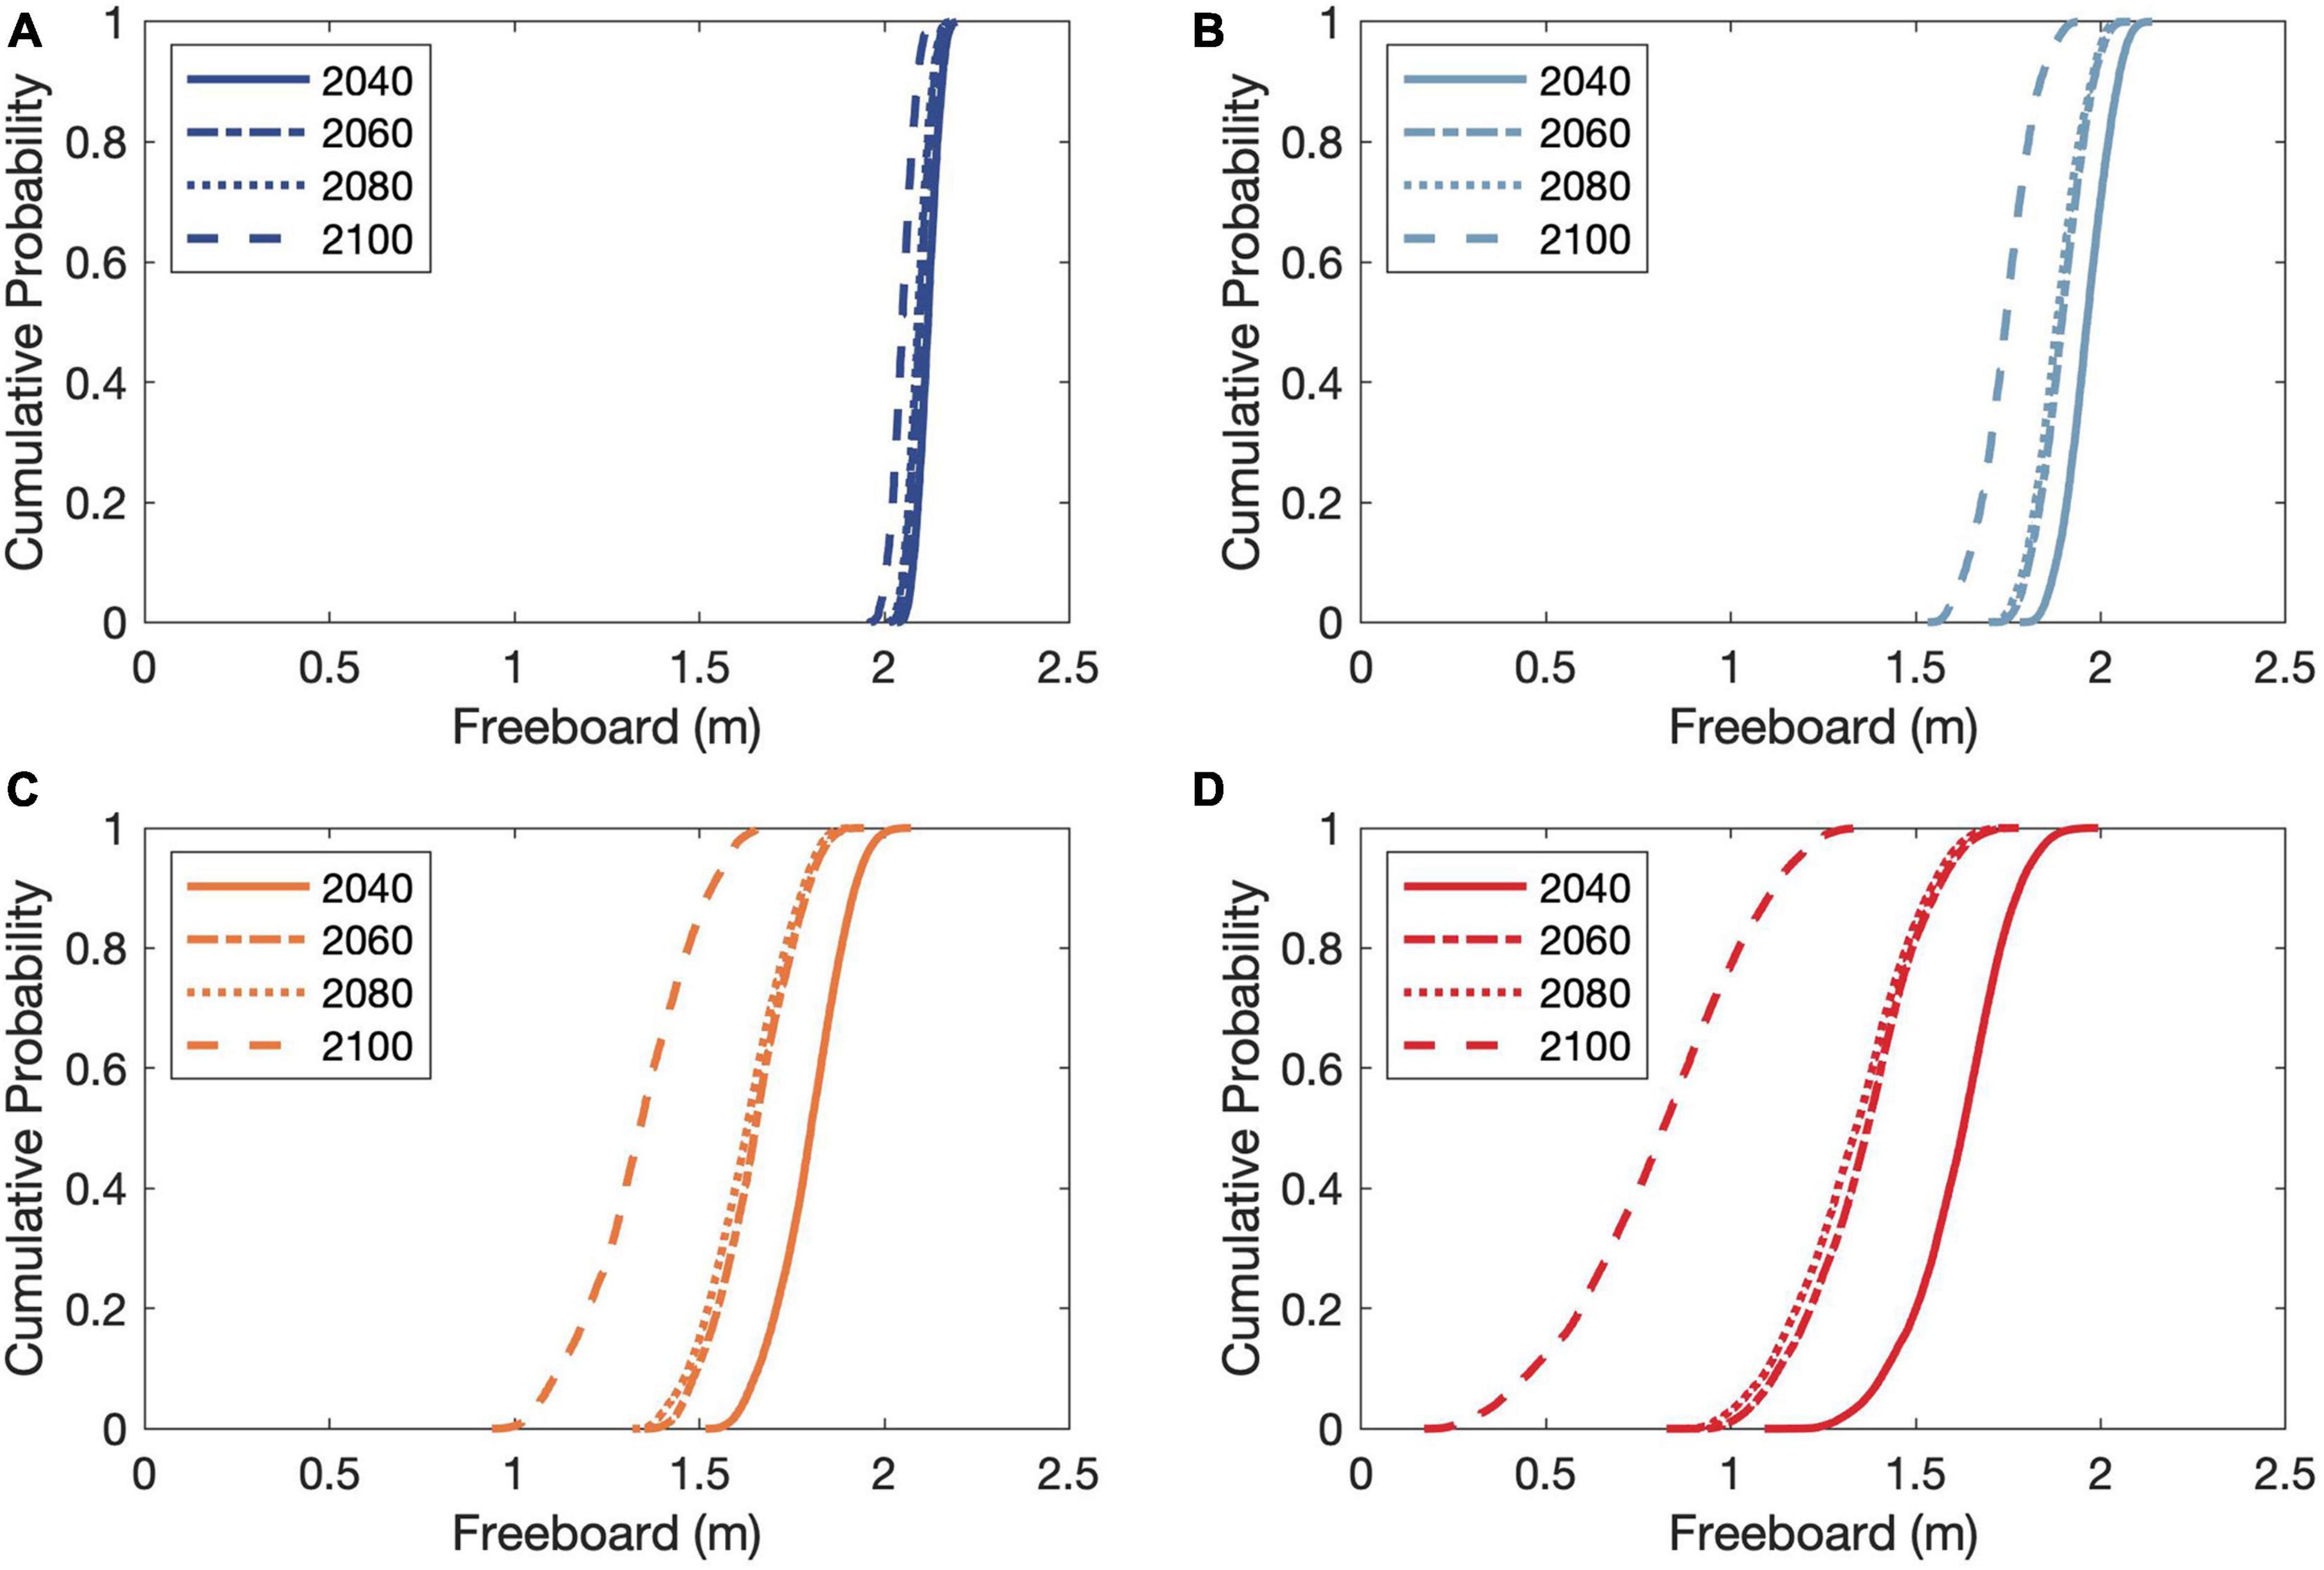
Figure 8. Empirical cumulative distributions of the projected barrier island freeboard for the Chandeleur Islands. Subplots (A–D) are for the RCPs 2.6, 4.5, 6.0, and 8.5, respectively.
Projected Changes of the Barrier Island Under Hypothetical Initial Conditions
In addition to the above simulations, a second set of model settings was used to investigate the possibility of barrier drowning. For this purpose, hypothetical initial barrier-island characteristics were considered, including no addition of new sediment to the barrier-island system, lower thresholds for the maximum barrier-migration rate, and reduced barrier freeboard. Such hypothetical initial conditions were considered to investigate the most influential system characteristic that would cause the barrier island to drown under the projected sea-level changes over the twenty-first century.
Under the hypothetical initial conditions, it was first assumed that there is no new sediment gain due to divergence in longshore sediment transportation across the Chandeleur Islands (neglecting the existing input of 5.7 m3/m/year). However, this restriction of marine sediment supply alone did not result in drowning the barrier island by 2100. Hence, secondly (in addition to the changes made to the marine sediment supply), the thresholds for maximum migration rates were also reduced. The new thresholds of maximum, mean, and minimum migration rates (in m/year) were assumed to be 10, 7.5, and 5, respectively. These hypothetical initial conditions only resulted in a quite trivial probability (<1%) of barrier drowning by 2100 under RCP 8.5. Hence, thirdly, the initial barrier freeboard was also reduced (in addition to the two assumptions made above) to investigate the probability of barrier drowning by 2100, and the results are presented herewith. These results indicate that the initial barrier freeboard is the critical factor in preventing the drowning of this barrier island under the projected sea-level rise over the twenty-first century.
Figure 9 shows the empirical cumulative distributions of projected barrier island migration distances under the assumed initial conditions for the Chandeleur Islands for the different periods considered (by the years 2040, 2060, 2080, and 2100). The above results indicate that the projected distributions of barrier-island migration distances are almost identical for RCP 4.5 and 6.0 over the four periods considered. The maximum and minimum values of the projected 50th percentile barrier-island migration distance by 2100 are ∼125 and ∼25 m for RCP 8.5 and 2.6, respectively.
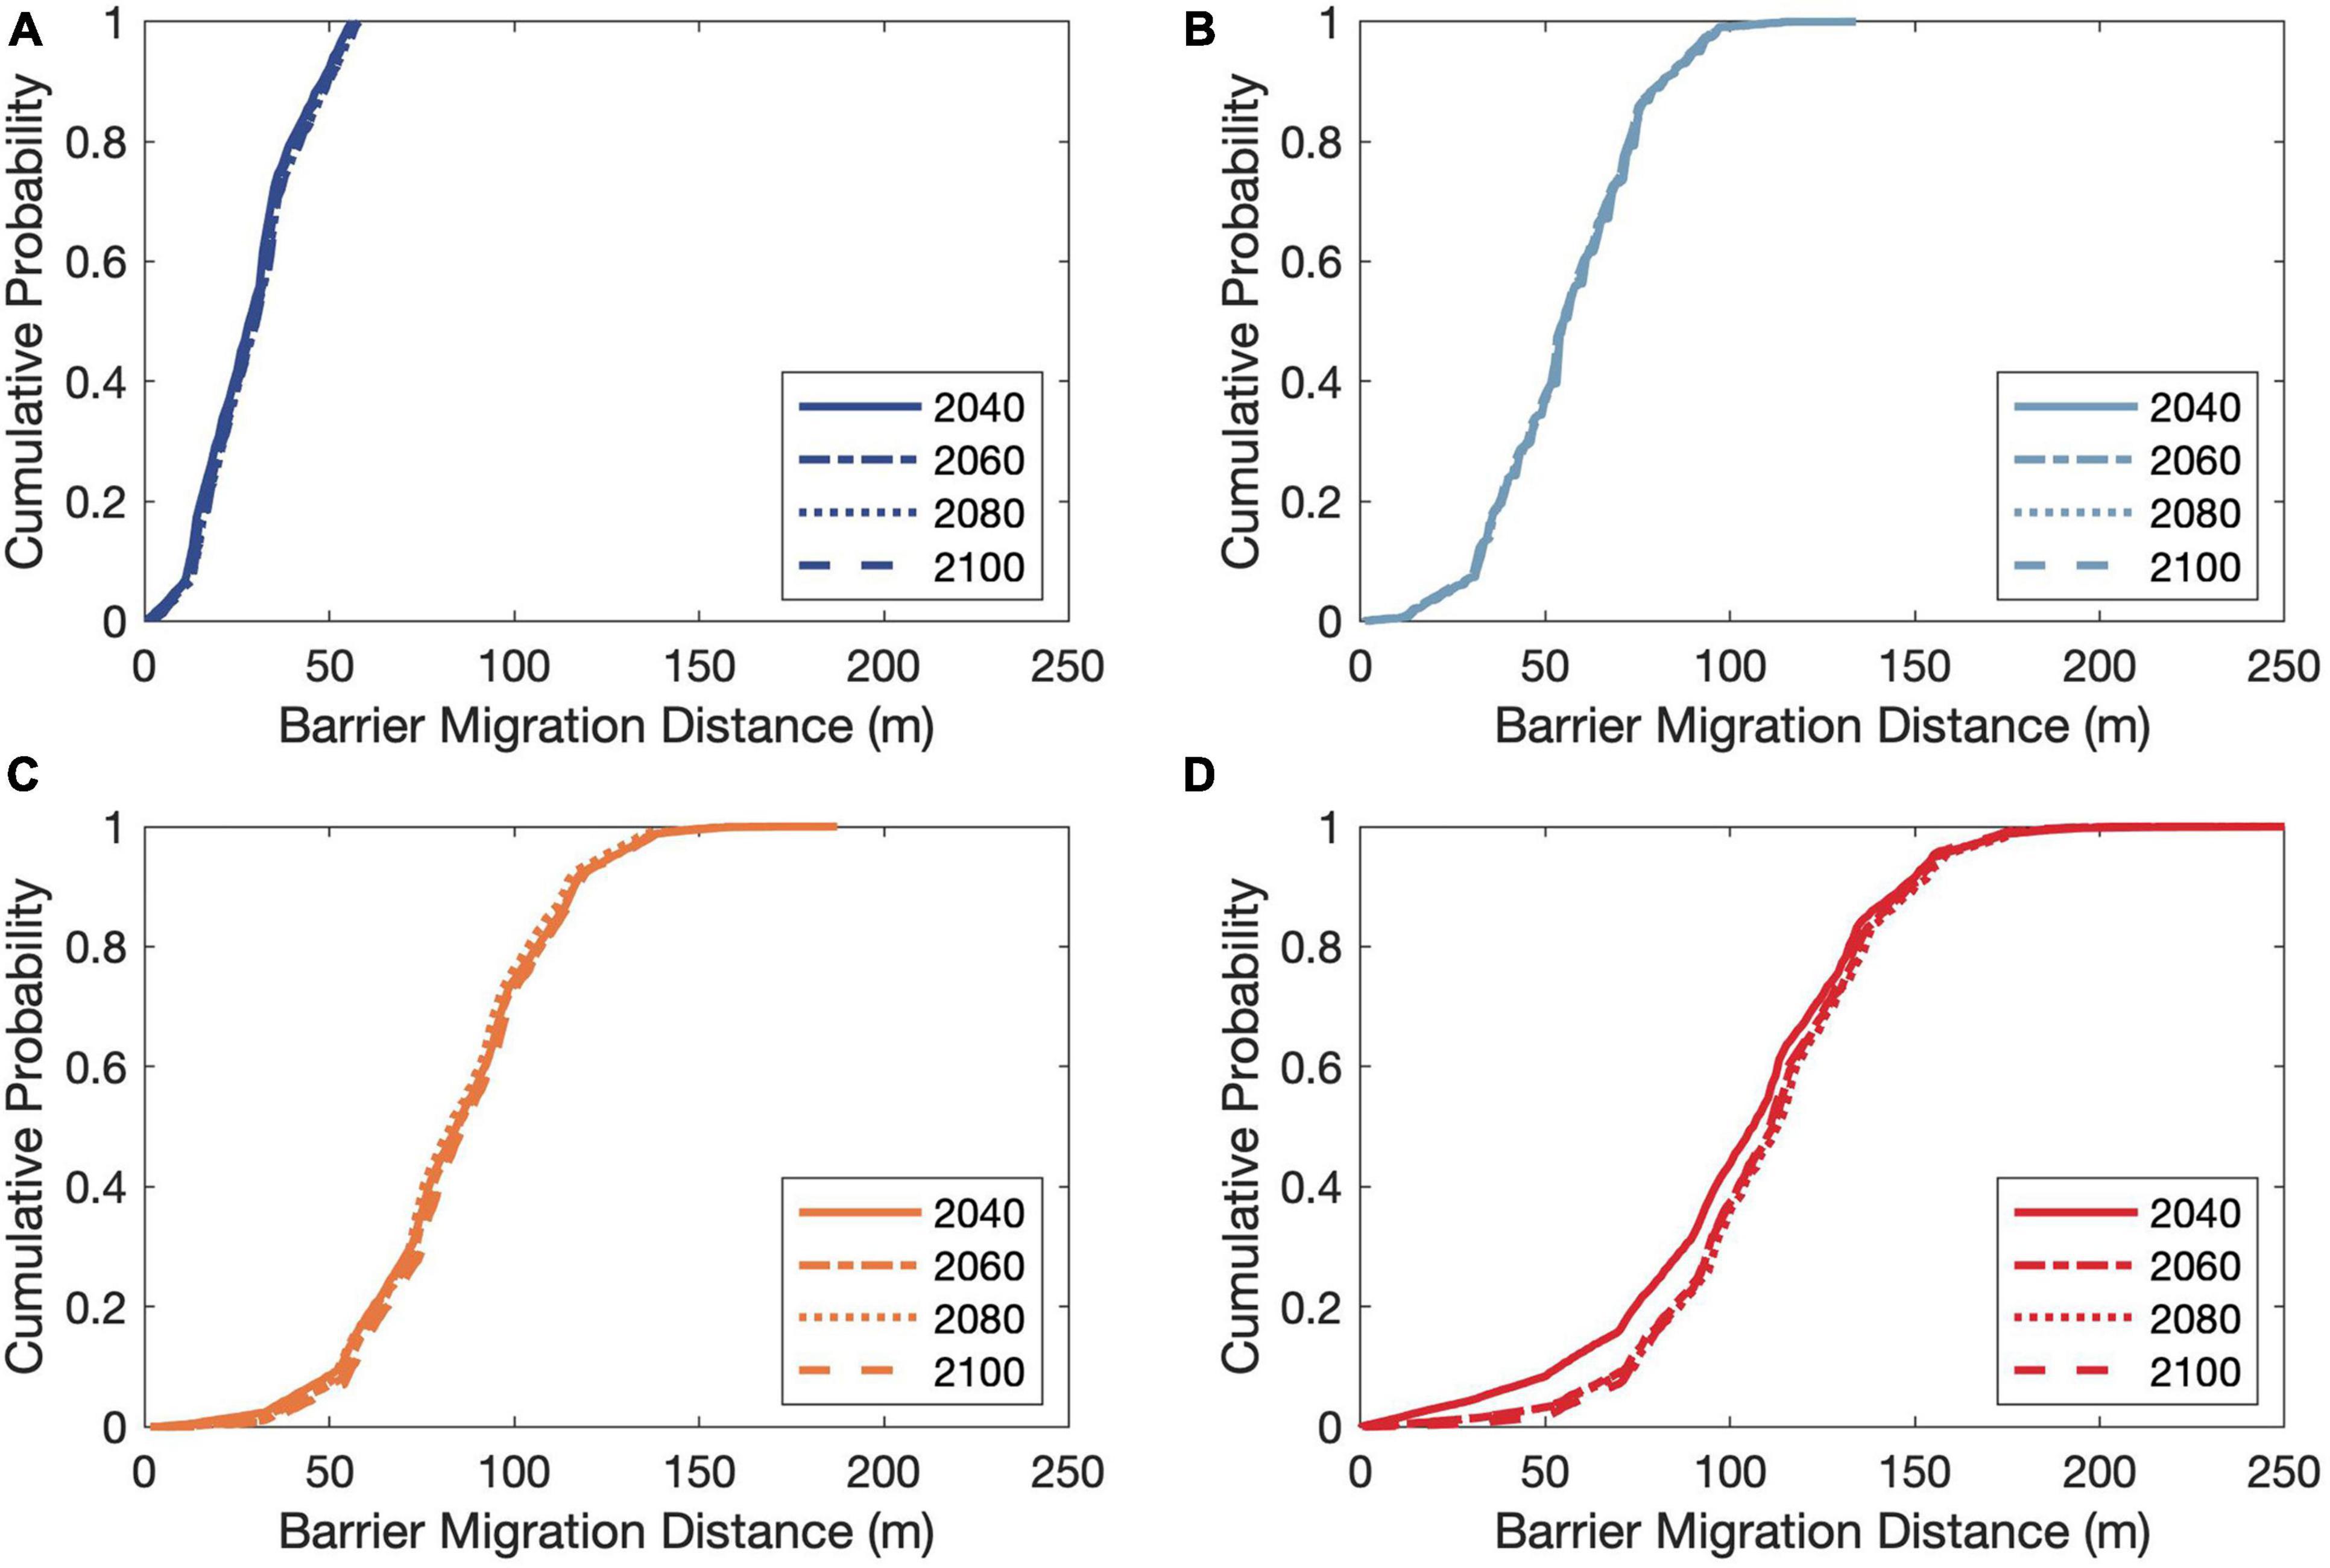
Figure 9. Empirical cumulative distributions of projected barrier-island migration distances for the Chandeleur Islands under hypothetical initial conditions [i.e., no addition of new sediment volume, reduced maximum barrier-migration rate threshold distribution with the minimum, mean, and maximum values of 5, 7.5, and 10, respectively (in m/year), and reduced barrier freeboard of 1.0 m]. Subplots (A–D) are corresponding to RCPs 2.6, 4.5, 6.0, and 8.5, respectively.
Figure 10 shows the empirical cumulative distributions of projected barrier-island freeboard under the assumed initial conditions for the Chandeleur Islands during the different periods considered (by the years 2040, 2060, 2080, and 2100). The results indicate that there are no considered circumstances under which the barrier island will be inundated by the rising sea level projections for both RCP 2.6 and 4.5. It also indicates a probability of about 70% of barrier drowning for RCP 6.0 by 2100. However, the projected probability of barrier drowning by 2080 is less than 5% for RCP 6.0. This is due to the projected variation in △RSL over the period considered, in which the change in sea level over the last 20 years is almost equal to that over the first 60 years (i.e., 2020–2080 and Figure 6). The projected probabilities of barrier drowning are significant for RCP 8.5. Results show that sea-level rise under RCP 8.5 is likely to completely drown the barrier island by 2100, while the probability of drowning by 2060 is ∼75%.
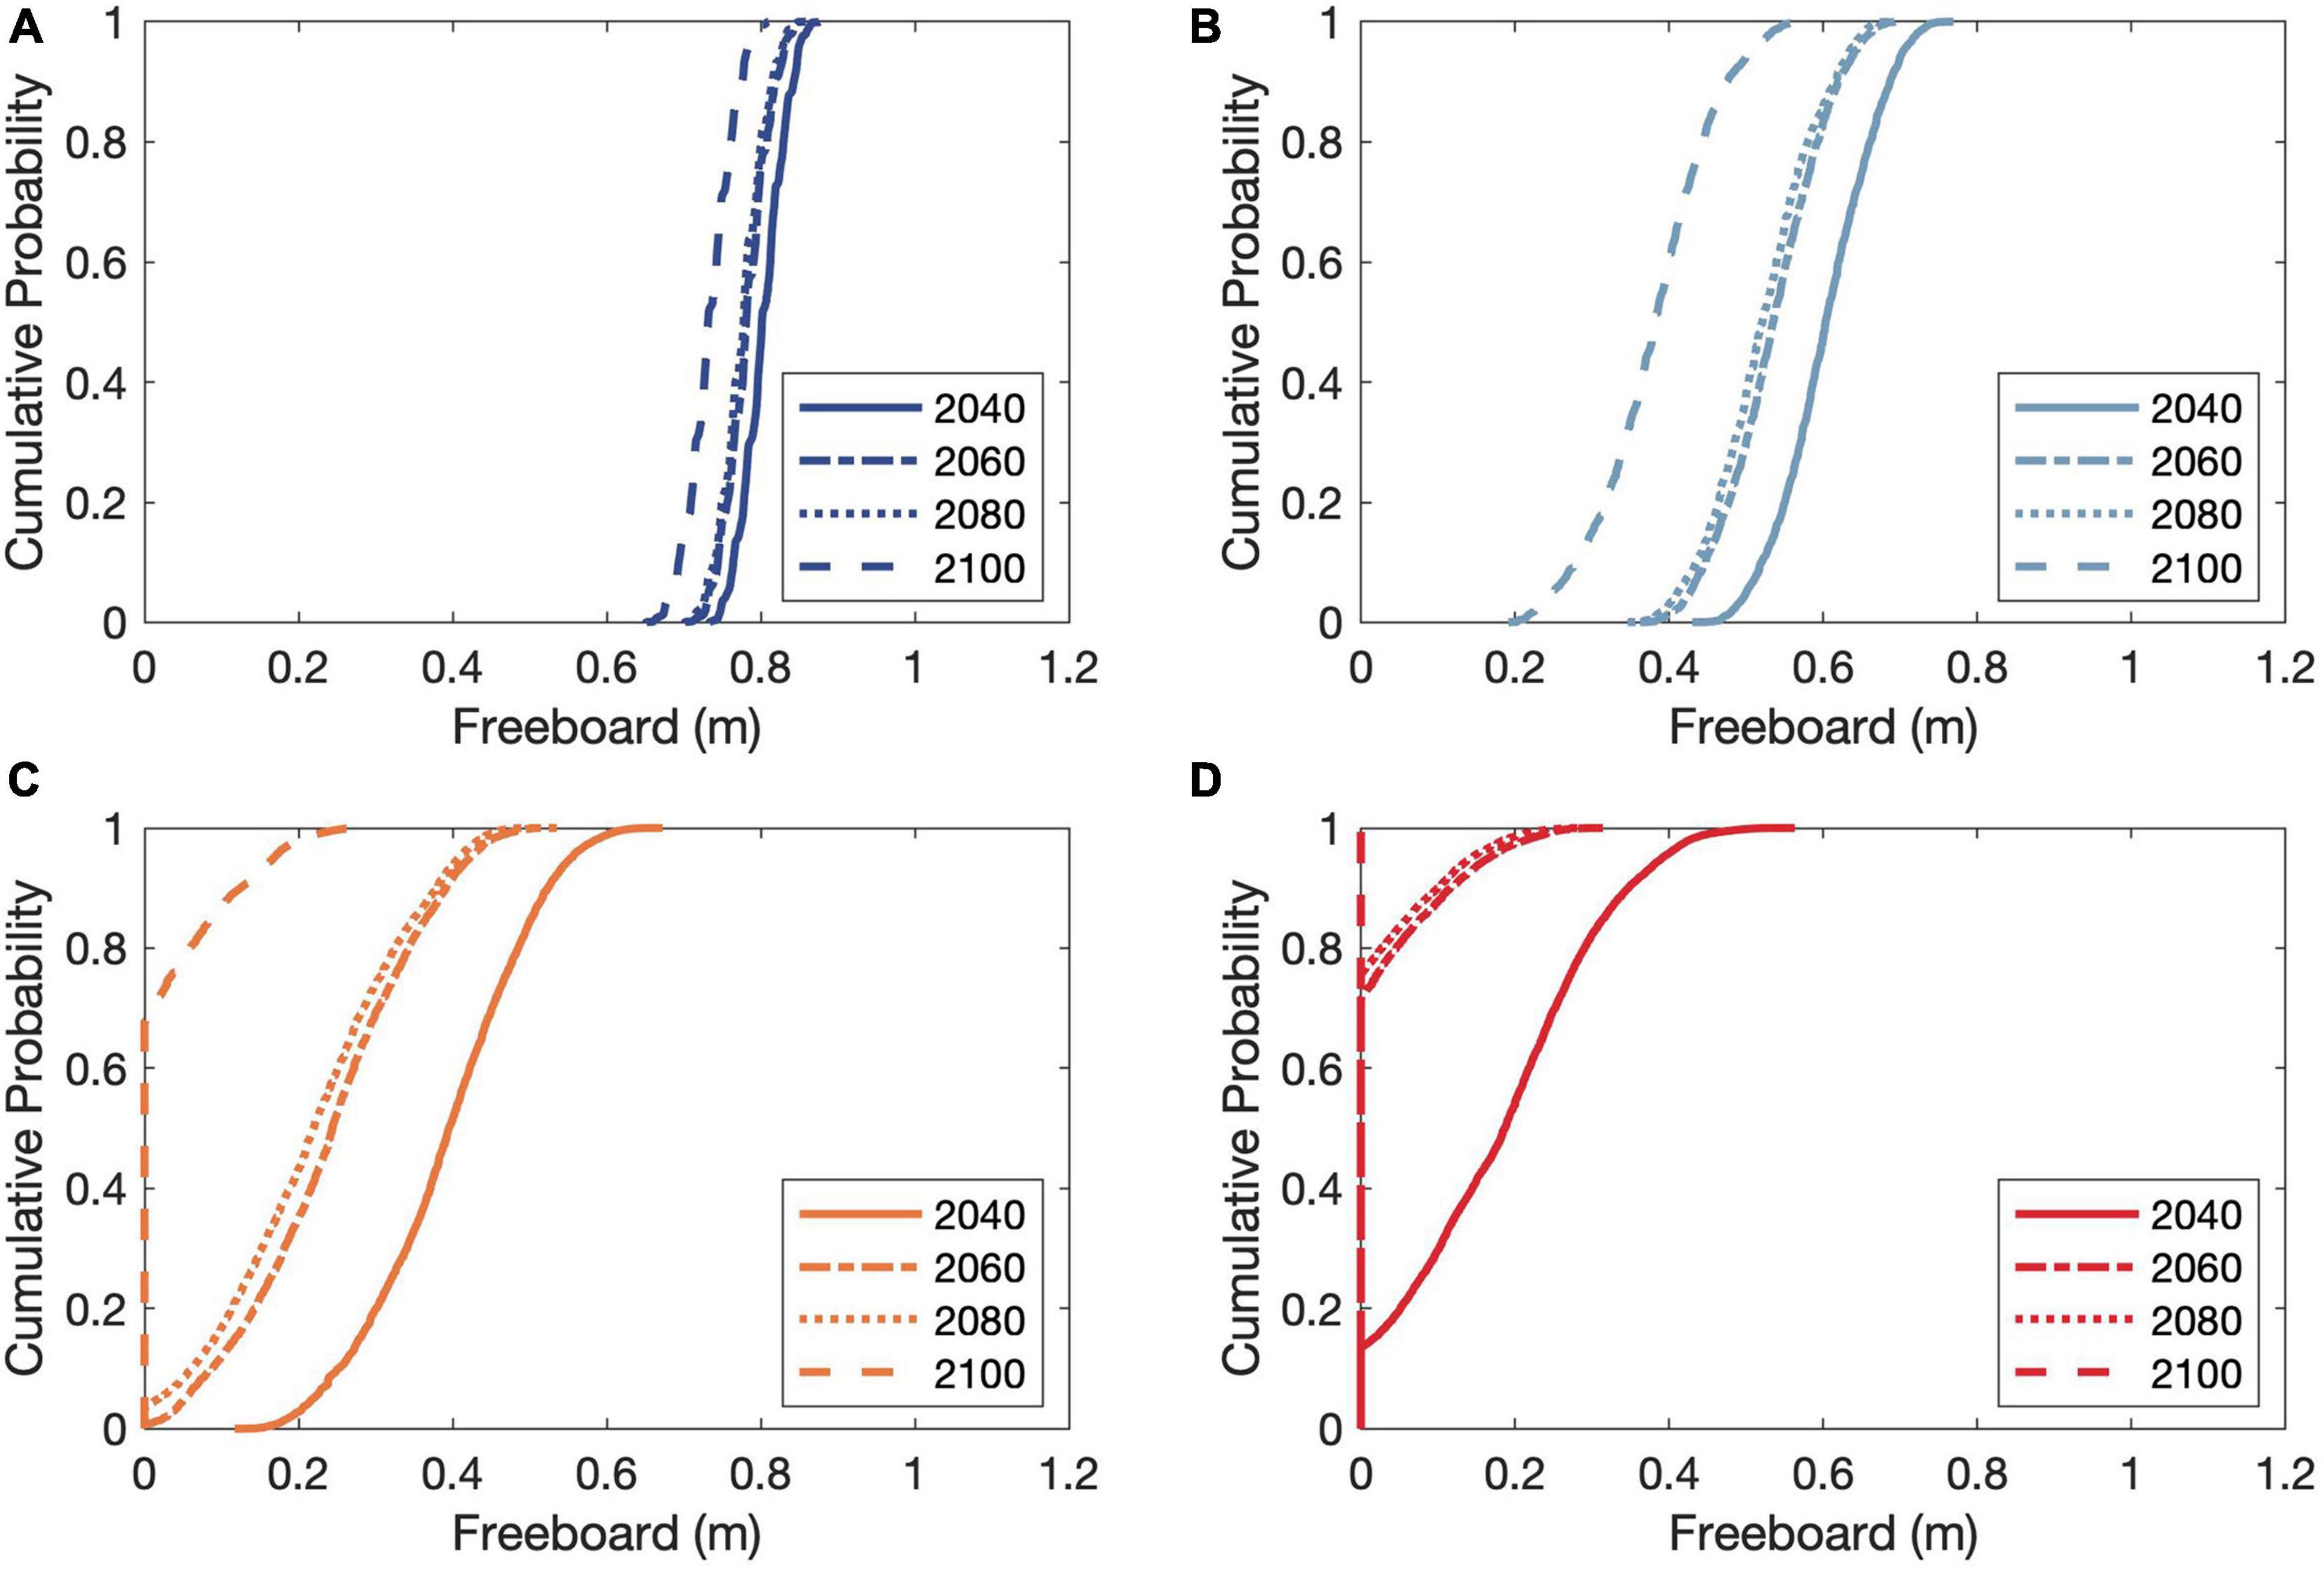
Figure 10. Empirical cumulative distributions of projected barrier island freeboard for the Chandeleur Islands under hypothetical initial conditions [i.e., no addition of new sediment volume, reduced maximum barrier-migration rate threshold distribution with minimum, mean, and maximum values of 5, 7.5, and 10, respectively (in m/year), and a reduced barrier freeboard of 1.0 m]. Subplots (A–D) are corresponding to RCP 2.6, 4.5, 6.0, and 8.5, respectively.
Discussion
Application of the newly developed model to the selected case studies indicates that there are significant uncertainties associated with the long-term evolution of the barrier-island system under climate-change impacts. These uncertainties are due to the model inputs considered (i.e., regional relative sea-level change and maximum barrier migration rate). Hence, it should be noted that the total uncertainties in model projections would be much larger when the uncertainties due to modeling techniques (i.e., model uncertainties) are also considered.
This modeling approach assumed that the barrier moves along the same trajectory as the back-barrier bay slope. However, the trajectory that a barrier follows as sea-level rises will tend to be steeper than the slope of the back-barrier bay (this reflects the fact that the average slope of the barrier profile is steeper than the back-barrier bay slope in such cases). As a result, the subsequent increment of landward movement of the barrier for each increment of SLR would be smaller, compared to the assumption that the trajectory is parallel to the back-barrier bay slope (as assumed in this study). As such, the projected results under the assumed considerations would overestimate the landward retreat rate so that the results are conservative (i.e., if a barrier does not drown in this analysis, then there is a factor of safety built-in). It should also be noted that the model application presented in this study assumed that the underlying substrate would always produce sand and treated sand to be freely available when there is a divergence in LST. A more realistic approximation of the barrier-island evolution [e.g., Moore et al. (2014)] may be obtained if the actual soil profile information were to be available (which required many geological observations of the vicinity or a realistic estimate based on the available geological information). If the underlying substrate contains muddy and/or organic sediments, then part of the eroded shoreface material is resuspended and will be lost from the site. Hence, the barrier island needs to move farther landward with each increment of SLR than the model projections suggest in this analysis. Further, simplifications/assumptions used in the model development (e.g., invariant barrier island profile during the model period and recovery of barrier islands from episodic events such as storm surges, extreme waves and winds) would affect projections of barrier island response to rising sea-level.
It is also desirable to apply the proposed modeling technique at different barrier-island systems. Such a modeling exercise will provide better insights and more conclusive outcomes on whether the reduced-complexity model presented in this study can be generically used to assess the long-term evolution of barrier-island systems with a broader range of environmental and geomorphic settings.
Conclusion
This paper presents the development and application of a reduced-complexity modeling technique that can probabilistically assess the climate change-driven evolution of barrier-island systems at macro-time scales of 50–100 years. The model developed here is solely based on the volume conservation principle and represents the main physical processes relevant for barrier island dynamics in a simplified manner. The probabilistic framework within which the model is developed here enables the quantification of the uncertainties associated with the projected evolution of the barrier-island system (in terms of migration distance and barrier freeboard), arising from model input uncertainties. Further, detailed, stochastic treatment of fluvial sediment supply is another significant value addition in the developed model. As an initial example, the model was applied to a case-study site: the evolution of the Chandeleur Islands from 2020 to 2100 under the four IPCC greenhouse gas emission scenarios RCPs 2.6, 4.5, 6.0, and 8.5.
Results obtained for the selected case study site indicate that barrier islands with a large initial sediment volume and freeboard might not drown under the projected changes in sea level over the twenty-first century, even under RCP 8.5. Model simulations with different initial conditions (i.e., different magnitudes for initial barrier freeboard, maximum barrier-island migration rate, and marine sediment availability) indicate that whether a barrier island may drown by the projected sea-level rise over the twenty-first century is closely tied to the present-day freeboard of the island. The wide range of projection uncertainties, for example, by the end-century under RCP 8.5 in the model projections, highlight the need for adaptation strategies to consider stochastic projections of the future evolution of barrier-island systems to minimize the risk of failure.
Data Availability Statement
The raw data supporting the conclusions of this article will be made available by the authors, without undue reservation.
Author Contributions
JB, AD, AS, and RR conceived and designed the study. JB developed the model, carried out all model applications, and wrote the first draft of the manuscript. AM provided strategic advice on the structure of the manuscript, its content and interpretation of the result. All authors provided feedback on the manuscript and contributed text.
Funding
JB was supported by the Deltares research program “Understanding System Dynamics; from River Basin to Coastal Zone” and the AXA Research Fund. RR was supported by the AXA Research Fund.
Conflict of Interest
The authors declare that the research was conducted in the absence of any commercial or financial relationships that could be construed as a potential conflict of interest.
Publisher’s Note
All claims expressed in this article are solely those of the authors and do not necessarily represent those of their affiliated organizations, or those of the publisher, the editors and the reviewers. Any product that may be evaluated in this article, or claim that may be made by its manufacturer, is not guaranteed or endorsed by the publisher.
Supplementary Material
The Supplementary Material for this article can be found online at: https://www.frontiersin.org/articles/10.3389/fmars.2021.755699/full#supplementary-material
References
Balthazar, V., Vanacker, V., Girma, A., Poesen, J., and Golla, S. (2013). Human impact on sediment fluxes within the Blue Nile and Atbara River basins. Geomorphology 180–181, 231–241. doi: 10.1016/j.geomorph.2012.10.013
Bamunawala, J., Dastgheib, A., Ranasinghe, R., van der Spek, A., Maskey, S., Murray, A. B., et al. (2020a). A holistic modeling approach to project the evolution of inlet-interrupted coastlines over the 21st century. Front. Mar. Sci. 7:542. doi: 10.3389/fmars.2020.00542
Bamunawala, J., Dastgheib, A., Ranasinghe, R., van der Spek, A., Maskey, S., Murray, A. B., et al. (2020b). Probabilistic application of an integrated catchment-estuary-coastal system model to assess the evolution of inlet-interrupted coasts over the 21st century. Front. Mar. Sci. 7:1104. doi: 10.3389/fmars.2020.579203
Bamunawala, J., Maskey, S., Duong, T. M., and van der Spek, A. (2018). Significance of fluvial sediment supply in coastline modelling at tidal inlets. J. Mar. Sci. Eng. 6:79. doi: 10.3390/jmse6030079
Duong, T. M., Ranasinghe, R., Walstra, D., and Roelvink, D. (2016). Assessing climate change impacts on the stability of small tidal inlet systems: why and how? Earth Sci. Rev. 154, 369–380. doi: 10.1016/j.earscirev.2015.12.001
Feagin, R. A., Smith, W. K., Psuty, N. P., Young, D. R., Martínez, M. L., Carter, G. A., et al. (2010). Barrier islands: coupling anthropogenic stability with ecological sustainability. J. Coast. Res. 26, 987–992. doi: 10.2112/09-1185.1
French, J., Payo, A., Murray, B., Orford, J., Eliot, M., and Cowell, P. (2016). Appropriate complexity for the prediction of coastal and estuarine geomorphic behaviour at decadal to centennial scales. Geomorphology 256, 3–16. doi: 10.1016/j.geomorph.2015.10.005
Hegerl, G. C., Black, E., Allan, R. P., Ingram, W. J., Polson, D., Trenberth, K. E., et al. (2015). Challenges in quantifying changes in the global water cycle. Bull. Am. Meteorol. Soc. 96, 1097–1115. doi: 10.1175/BAMS-D-13-00212.1
Kettner, A. J., Syvitski, J. P., and Gomez, B. (2005). “Simulating the effects of natural events and anthropogenic activity on sediment discharge to the poverty shelf, New Zealand during the late Holocene,” in Proceedings of the American Geophysical Union, Fall Meeting, Abstract H51C-0388 (San Francisco, CA), Vol. 86.
Lavoie, D. (ed.) (2009). Sand Resources, Regional Geology, and Coastal Processes of the Chandeleur Islands Coastal System-An Evaluation of the Breton National Wildlife Refuge: U.S. Geological Survey Scientific Investigations Report 2009–5252. Reston, VA: U.S. Geological Survey, 180.
Lorenzo-Trueba, J., and Ashton, A. D. (2014). Rollover, drowning, and discontinuous retreat: distinct modes of barrier response to sea-level rise arising from a simple morphodynamic model. J. Geophys. Res. Earth Surf. 119, 779–801. doi: 10.1002/2013JF002941
Luijendijk, A., Hagenaars, G., Ranasinghe, R., Baart, F., Donchyts, G., and Aarninkhof, S. (2018). The state of the world’s beaches. Sci. Rep. 8:6641. doi: 10.1038/s41598-018-24630-6
Mariotti, G. (2021). Self-organization of coastal barrier systems during the Holocene. J. Geophys. Res. Earth Surf. 126:e2020JF005867. doi: 10.1029/2020JF005867
Mehvar, A., Dastgheib, A., and Ranasinghe, R. (2016). Relative Sea Level Rise Scenarios: Central Coast of Bangladesh. Delft: Delft University of Technology.
Moore, L. J., List, J. H., Williams, S. J., and Stolper, D. (2007). “Modelling barrier island response to sea-level rise in the outer banks, North Carolina,” in Coastal Sediments ’07: Sixth International Symposium on Coastal Engineering and Science of Coastal Sediment Process, eds N. C. Kraus and J. D. Rosati (New Orleans, LA: American Society of Civil Engineers), 1153–1164. doi: 10.1061/40926(239)89
Moore, L. J., List, J. H., Williams, S. J., and Stolper, D. (2010). Complexities in barrier island response to sea level rise: insights from numerical model experiments, North Carolina Outer Banks. J. Geophys. Res. 115:F03004. doi: 10.1029/2009JF001299
Moore, L. J., Patsch, K., List, J. H., and Williams, S. J. (2014). The potential for sea-level-rise-induced barrier island loss: insights from the Chandeleur Islands, Louisiana, USA. Mar. Geol. 355, 244–259. doi: 10.1016/j.margeo.2014.05.022
Morton, R. A., and Miller, T. L. (2005). National Assessment of Shoreline Change: Part 2, Historical Shoreline Changes And Associated Coastal Land Loss Along The U.S. Southeast Atlantic Coast. Reston, VA: Geological Survey (U.S.), doi: 10.3133/ofr20051401
Murray, A. B. (2007). Reducing model complexity for explanation and prediction. Geomorphology 90, 178–191. doi: 10.1016/j.geomorph.2006.10.020
Nicholls, R. J., Hanson, S. E., Lowe, J. A., Warrick, R. A., Lu, X., and Long, A. J. (2014). Sea-level scenarios for evaluating coastal impacts. Wiley Interdiscip. Rev. Clim. Chang. 5, 129–150. doi: 10.1002/wcc.253
Nicholls, R. J., Woodroffe, C. D., Burkett, V., Hay, J., Wong, P. P., and Nurse, L. (2011). “12.14–scenarios for coastal vulnerability assessment,” in Treatise on Estuarine and Coastal Science: Ecological Economics of Estuaries and Coasts, eds E. Wolanski and D. S. McLusky (Waltham: Academic Press), 289–303. doi: 10.1016/B978-0-12-374711-2.01217-1
Oppenheimer, M., Glavovic, B. C., Hinkel, J., Van-de-Wal, R., Magnan, A. K., Abd-Elgawad, A., et al. (2019). “Sea level rise and implications for low-lying islands, coasts and communities,” in IPCC Special Report on the Ocean and Cryosphere in a Changing Climate, eds H.-O. Pörtner, D. C. Roberts, V. Masson-Delmotte, P. Zhai, M. Tignor, E. Poloczanska, et al. (Geneva: IPCC).
Palmer, M. A., Liermann, C. A. R., Nilsson, C., Flörke, M., Alcamo, J., Lake, P. S., et al. (2008). Climate change and the world’s river basins: anticipating management options. Front. Ecol. Environ. 6:81–89. doi: 10.1890/060148
Ranasinghe, R. (2016). Assessing climate change impacts on open sandy coasts: a review. Earth Sci. Rev. 160, 320–332. doi: 10.1016/j.earscirev.2016.07.011
Ranasinghe, R. (2020). On the need for a new generation of coastal change models for the 21st century. Sci. Rep. 10:2010. doi: 10.1038/s41598-020-58376-x
Ranasinghe, R., Duong, T. M., Uhlenbrook, S., Roelvink, D., and Stive, M. (2013). Climate-change impact assessment for inlet-interrupted coastlines. Nat. Clim. Chang. 3, 83–87. doi: 10.1038/nclimate1664
Ranasinghe, R., Wu, C. S., Conallin, J., Duong, T. M., and Anthony, E. J. (2019). Disentangling the relative impacts of climate change and human activities on fluvial sediment supply to the coast by the world’s large rivers: Pearl River Basin, China. Sci. Rep. 9:9236. doi: 10.1038/s41598-019-45442-2
Reeves, I. R. B., Moore, L. J., Murray, A. B., Anarde, K. A., and Goldstein, E. B. (2021). Dune dynamics drive discontinuous barrier retreat. Geophys. Res. Lett. 48:e2021GL092958. doi: 10.1029/2021GL092958
Rosati, J. D., Dean, R. G., and Stone, G. W. (2010). A cross-shore model of barrier island migration over a compressible substrate. Mar. Geol. 271, 1–16. doi: 10.1016/j.margeo.2010.01.005
Stocker, T. F., Qin, D., Plattner, G.-K., Alexander, L. V., Allen, S. K., Bindoff, N. L., et al. (2013a). “Technical summary,” in Climate Change 2013: The Physical Science Basis. Contribution of Working Group I to the Fifth Assessment Report of the Intergovernmental Panel on Climate Change, eds T. F. Stocker, D. Qin, G.-K. Plattner, M. Tignor, S. K. Allen, J. Boschung, et al. (Cambridge: Cambridge University Press).
Stocker, T. F., Qin, D., Plattner, G.-K., Tignor, M., Allen, S. K., and Boschung, J. et al. (eds), (2013b). “IPCC, 2013: summary for policymakers,” in Climate Change 2013: The Physical Science Basis. Contribution of Working Group I to the Fifth Assessment Report of the Intergovernmental Panel on Climate Change, (Cambridge: Cambridge University Press).
Stolper, D., List, J. H., and Thieler, E. R. (2005). Simulating the evolution of coastal morphology and stratigraphy with a new morphological-behaviour model (GEOMBEST). Mar. Geol. 218, 17–36. doi: 10.1016/j.margeo.2005.02.019
Stutz, M. L., and Pilkey, O. H. (2001). A review of global barrier island distribution. J. Coast. Res. 34, 15–22. doi: 10.2110/pec.98.61.0015
Stutz, M. L., and Pilkey, O. H. (2011). Open-ocean barrier islands: global influence of climatic, oceanographic, and depositional settings. J. Coast. Res. 72, 207–222. doi: 10.2112/09-1190.1
Syvitski, J. P. M., and Kettner, A. (2011). Sediment flux and the Anthropocene. Philosophical transactions. Ser. A Math. Phys. Eng. Sci. 369, 957–975. doi: 10.1098/rsta.2010.0329
Syvitski, J. P. M., Kettner, A. J., Overeem, I., Hutton, E. W. H., Hannon, M. T., Brakenridge, G. R., et al. (2009). Sinking deltas due to human activities. Nat. Geosci. 2, 681–686. doi: 10.1038/ngeo629
Syvitski, J. P. M., Vörösmarty, C. J., Kettner, A. J., and Green, P. (2005). Impact of humans on the flux of terrestrial sediment to the global coastal ocean. Science 308, 376–380. doi: 10.1126/science.1109454
Syvitski, J. P. M. M., and Milliman, J. D. (2007). Geology, geography, and humans battle for dominance over the delivery of fluvial sediment to the coastal ocean. J. Geol. 115, 1–19. doi: 10.1086/509246
Trenberth, K. E., Smith, L., Qian, T., Dai, A., and Fasullo, J. (2007). Estimates of the global water budget and its annual cycle using observational and model data. J. Hydrometeorol. 8, 758–769. doi: 10.1175/JHM600.1
Twichell, D. C., Flocks, J. G., Pendleton, E. A., and Baldwin, W. E. (2013). Geologic controls on regional and local erosion rates of three northern gulf of mexico barrier-island systems. J. Coast. Res. 63, 32–45. doi: 10.2112/SI63-004.1
van Heteren, S. (2014). “Barrier systems,” in Coastal Environments and Global Change, eds G. Masselink and R. Gehrels (Sussex: John Wiley & Sons, Ltd and American Geophysical Union), 194–226.
van Maanen, B., Nicholls, R. J., French, J. R., Barkwith, A., Bonaldo, D., Burningham, H., et al. (2016). Simulating mesoscale coastal evolution for decadal coastal management: a new framework integrating multiple, complementary modelling approaches. Geomorphology 256, 68–80. doi: 10.1016/j.geomorph.2015.10.026
Vörösmarty, C. J., Syvitski, J., Day, J., de Sherbinin, A., Giosan, L., and Paola, C. (2009). Battling to save the world’s river deltas. Bull. At. Sci. 65, 31–43. doi: 10.2968/065002005
Wicander, R., and Monroe, J. S. (2014). The Changing Earth: Exploring Geology and Evolution. Belmont, CA: Cengage Learning.
Wildlife Conservation Society [WCS] and Center for International Earth Science Information Network [CIESIN] - Columbia University, Wildlife Conservation Society-WCS, and Center for International Earth Science Information Network-Ciesin-Columbia University (2005). Last of the Wild Project, Version 2, 2005 (LWP-2): Global Human Footprint Dataset (Geographic). Palisades, NY: NASA Socioeconomic Data and Applications Center (SEDAC). doi: 10.7927/H4M61H5F
Keywords: barrier-island evolution, climate change, barrier drowning, probabilistic modeling, input uncertainties
Citation: Bamunawala J, van der Spek A, Dastgheib A, Murray AB and Ranasinghe R (2021) An Integrated, Probabilistic Modeling Approach to Assess the Evolution of Barrier-Island Systems Over the Twenty-First Century. Front. Mar. Sci. 8:755699. doi: 10.3389/fmars.2021.755699
Received: 09 August 2021; Accepted: 26 October 2021;
Published: 22 November 2021.
Edited by:
Pengfei Xue, Michigan Technological University, United StatesReviewed by:
José Pinho, University of Minho, PortugalLiqin Zuo, Nanjing Hydraulic Research Institute, China
Copyright © 2021 Bamunawala, van der Spek, Dastgheib, Murray and Ranasinghe. This is an open-access article distributed under the terms of the Creative Commons Attribution License (CC BY). The use, distribution or reproduction in other forums is permitted, provided the original author(s) and the copyright owner(s) are credited and that the original publication in this journal is cited, in accordance with accepted academic practice. No use, distribution or reproduction is permitted which does not comply with these terms.
*Correspondence: Janaka Bamunawala, YmFtdW5hd2FsYUB1b20ubGs=
†Present Address: Janaka Bamunawala, Department of Civil Engineering, University of Moratuwa, Moratuwa, Sri Lanka; Ali Dastgheib, International Marine and Dredging Consultants (IMDC), Van Immerseelstraat, Antwerp, Belgium