- 1College of Marine Sciences, Shanghai Ocean University, Shanghai, China
- 2Key Laboratory of Sustainable Exploitation of Oceanic Fisheries Resources, Ministry of Education, Shanghai, China
- 3National Engineering Research Centre for Oceanic Fisheries, Shanghai Ocean University, Shanghai, China
- 4Key Laboratory of Oceanic Fisheries Exploration, Ministry of Agriculture and Rural Affairs, Shanghai, China
- 5College of Marine Culture and Law, Shanghai Ocean University, Shanghai, China
- 6East China Sea Fisheries Research Institute, Chinese Academy of Fishery Sciences, Shanghai, China
With the continuous development of jellyfish fisheries and food products around the world, an effective traceability system has become increasingly prominent. This study provides insight into the origin traceability and authentication of two commercially important jellyfish species, flame jellyfish Rhopilema esculentum and Nomura’s jellyfish Nemopilema nomurai, while investigating the intra- and inter-specific variation in fatty acid (FA) profiles and carbon and nitrogen stable isotope ratios (δ13C and δ15N). Results showed significant differences in FA profiles and isotopic values in fresh bell tissues between wild and farmed R. esculentum and among geographic origins, possibly due to different food sources, nutritional status, and energy costs that each group experiences at a given location. The linear discriminant analysis indicated that δ13C, δ15N, C16:0, C17:0, C18:0, C16:1n7, and C20:5n3 were suitable discriminatory variables with a high rate of correct classification for distinguishing origins of R. esculentum. In addition, inter-specific FA profiles/biomarkers, combined with isotopic values, suggests the variety of dietary sources and trophic positions of sympatric similar-sized R. esculentum and N. nomurai and the potential use of biomarkers, especially stable isotope analysis, for distinguishing sympatric jellyfish species. These results highlighted the complementarity of FA and stable isotope analyses and provide an alternative approach for improving the origin traceability and authenticity evaluation of untreated edible jellyfish. Furthermore, this study adds new information regarding the biochemical compositions of jellyfish species.
Introduction
Edible jellyfish is a traditional seafood resource in Asia. In recent years, jellyfish fisheries have been successfully established in the American countries and Australia with new jellyfish species exploited (Brotz et al., 2017; Bleve et al., 2019). There are 19 countries currently fishing for jellyfish, with the commercial annual catch exceeded 1 million tons (Brotz et al., 2017). In China, jellyfish are also recognized as an important aquaculture species using saltwater ponds, and part of them are exported (You et al., 2007; Jiang et al., 2019). The Food and Agriculture Organization of the United Nations (FAO) has proposed an increase in the utilization of jellyfish as new seafood products and as feed for aquaculture, which can represent a possible strategy to improve the overall sustainability of the global fishery (Boero, 2013). The globalization of food markets opens up new possibilities for many companies involved in the production and import-export of edible jellyfish (Torri et al., 2020). Meanwhile, consumers are increasingly aware of the importance of seafood quality and safety control, for example, the production method (i.e., wild or farmed), origin traceability, and clear label information. These demands are also the regulatory controls in the international market (D’Amico et al., 2014). With the continuous development of jellyfish fisheries and food products, methods aimed to improve food quality and information, such as distinguishing wild and farmed individuals and tracing the geographic origins, are needed. Moreover, the market value and relative nutritional quality of jellyfish differs between production method and species (Jiang et al., 2019).
Several methods have been applied for traceability and authenticity of seafood. For example, DNA analysis is widely used to classify the species of seafood (Rasmussen and Morrissey, 2008), and have proven to be useful for distinguishing jellyfish species in food products (Armani et al., 2013, 2014). However, this technique may not be effective to differentiate farmed and wild individuals of the same jellyfish species. In the case of aquaculture, farmed jellyfish may be produced in one farm, but scyphistomae and/or ephyra may originate from wild areas. Biomarkers or biochemical tracers, such as fatty acid (FA) profiles and carbon and nitrogen stable isotope ratios (δ13C and δ15N, respectively) have proven to be powerful indicators to distinguish the geographic origin of target species and authentication (Kim et al., 2015; Gopi et al., 2019). These techniques are based on the concept that individuals have different foraging patterns and are exposed to different environmental conditions at a given location that leads to distinct biochemical characteristics (Vasconi et al., 2019; Gong et al., 2020). δ13C can be used to determine the carbon source as there is limited variation in values after a trophic transfer, while δ15N values exhibit stepwise enrichment across trophic levels and can be used to evaluate the trophic position (Post, 2002). Certain FAs mainly derive from foods, are absorbed with little change in the unique signature, making them suitable for use as biomarkers (Parrish, 2013). Several studies have shown that FA in combination with stable isotopes is effectively applied to trace geographic origins of wild and farmed individuals and authentication of marine organisms (Busetto et al., 2008; Thomas et al., 2008; Vasconi et al., 2019). However, as most studies have been conducted on marine fishes, knowledge of FA and stable isotope analyses for origin traceability and authenticity of jellyfish species is still incomplete.
In the present study, we focused on two commercially important species of edible jellyfish, Rhopilema esculentum and Nemopilema nomurai, which supports the jellyfish fisheries in Asia countries (e.g., China, Indonesia, Japan, and Malaysia) (Brotz et al., 2017). R. esculentum is also a major pond-cultured jellyfish species in China, as well as employing hatchery programs whereby hundreds of millions of juvenile R. esculentum are cultured and sea ranched (You et al., 2007; Jiang et al., 2019). For preservation and shipping, jellyfish are generally processed through a stepwise procedure of soaking in mixtures of salts and alum (Brotz et al., 2017). While in coastal areas, fresh jellyfish is often eaten directly as a salad with seasonings and dressings without prior treatment (You et al., 2007). This study aimed to examine the potential use of FA and stable isotope analyses and chemometrics to determine the origins of R. esculentum and to distinguish the sympatric R. esculentum and N. nomurai. To accomplish this objective, fresh R. esculentum and N. nomurai from three regions were studied and the intra- and inter-specific variations in FA profiles and the δ13C and δ15N values of bell tissues were estimated.
Materials and Methods
Jellyfish Sampling and Preparation
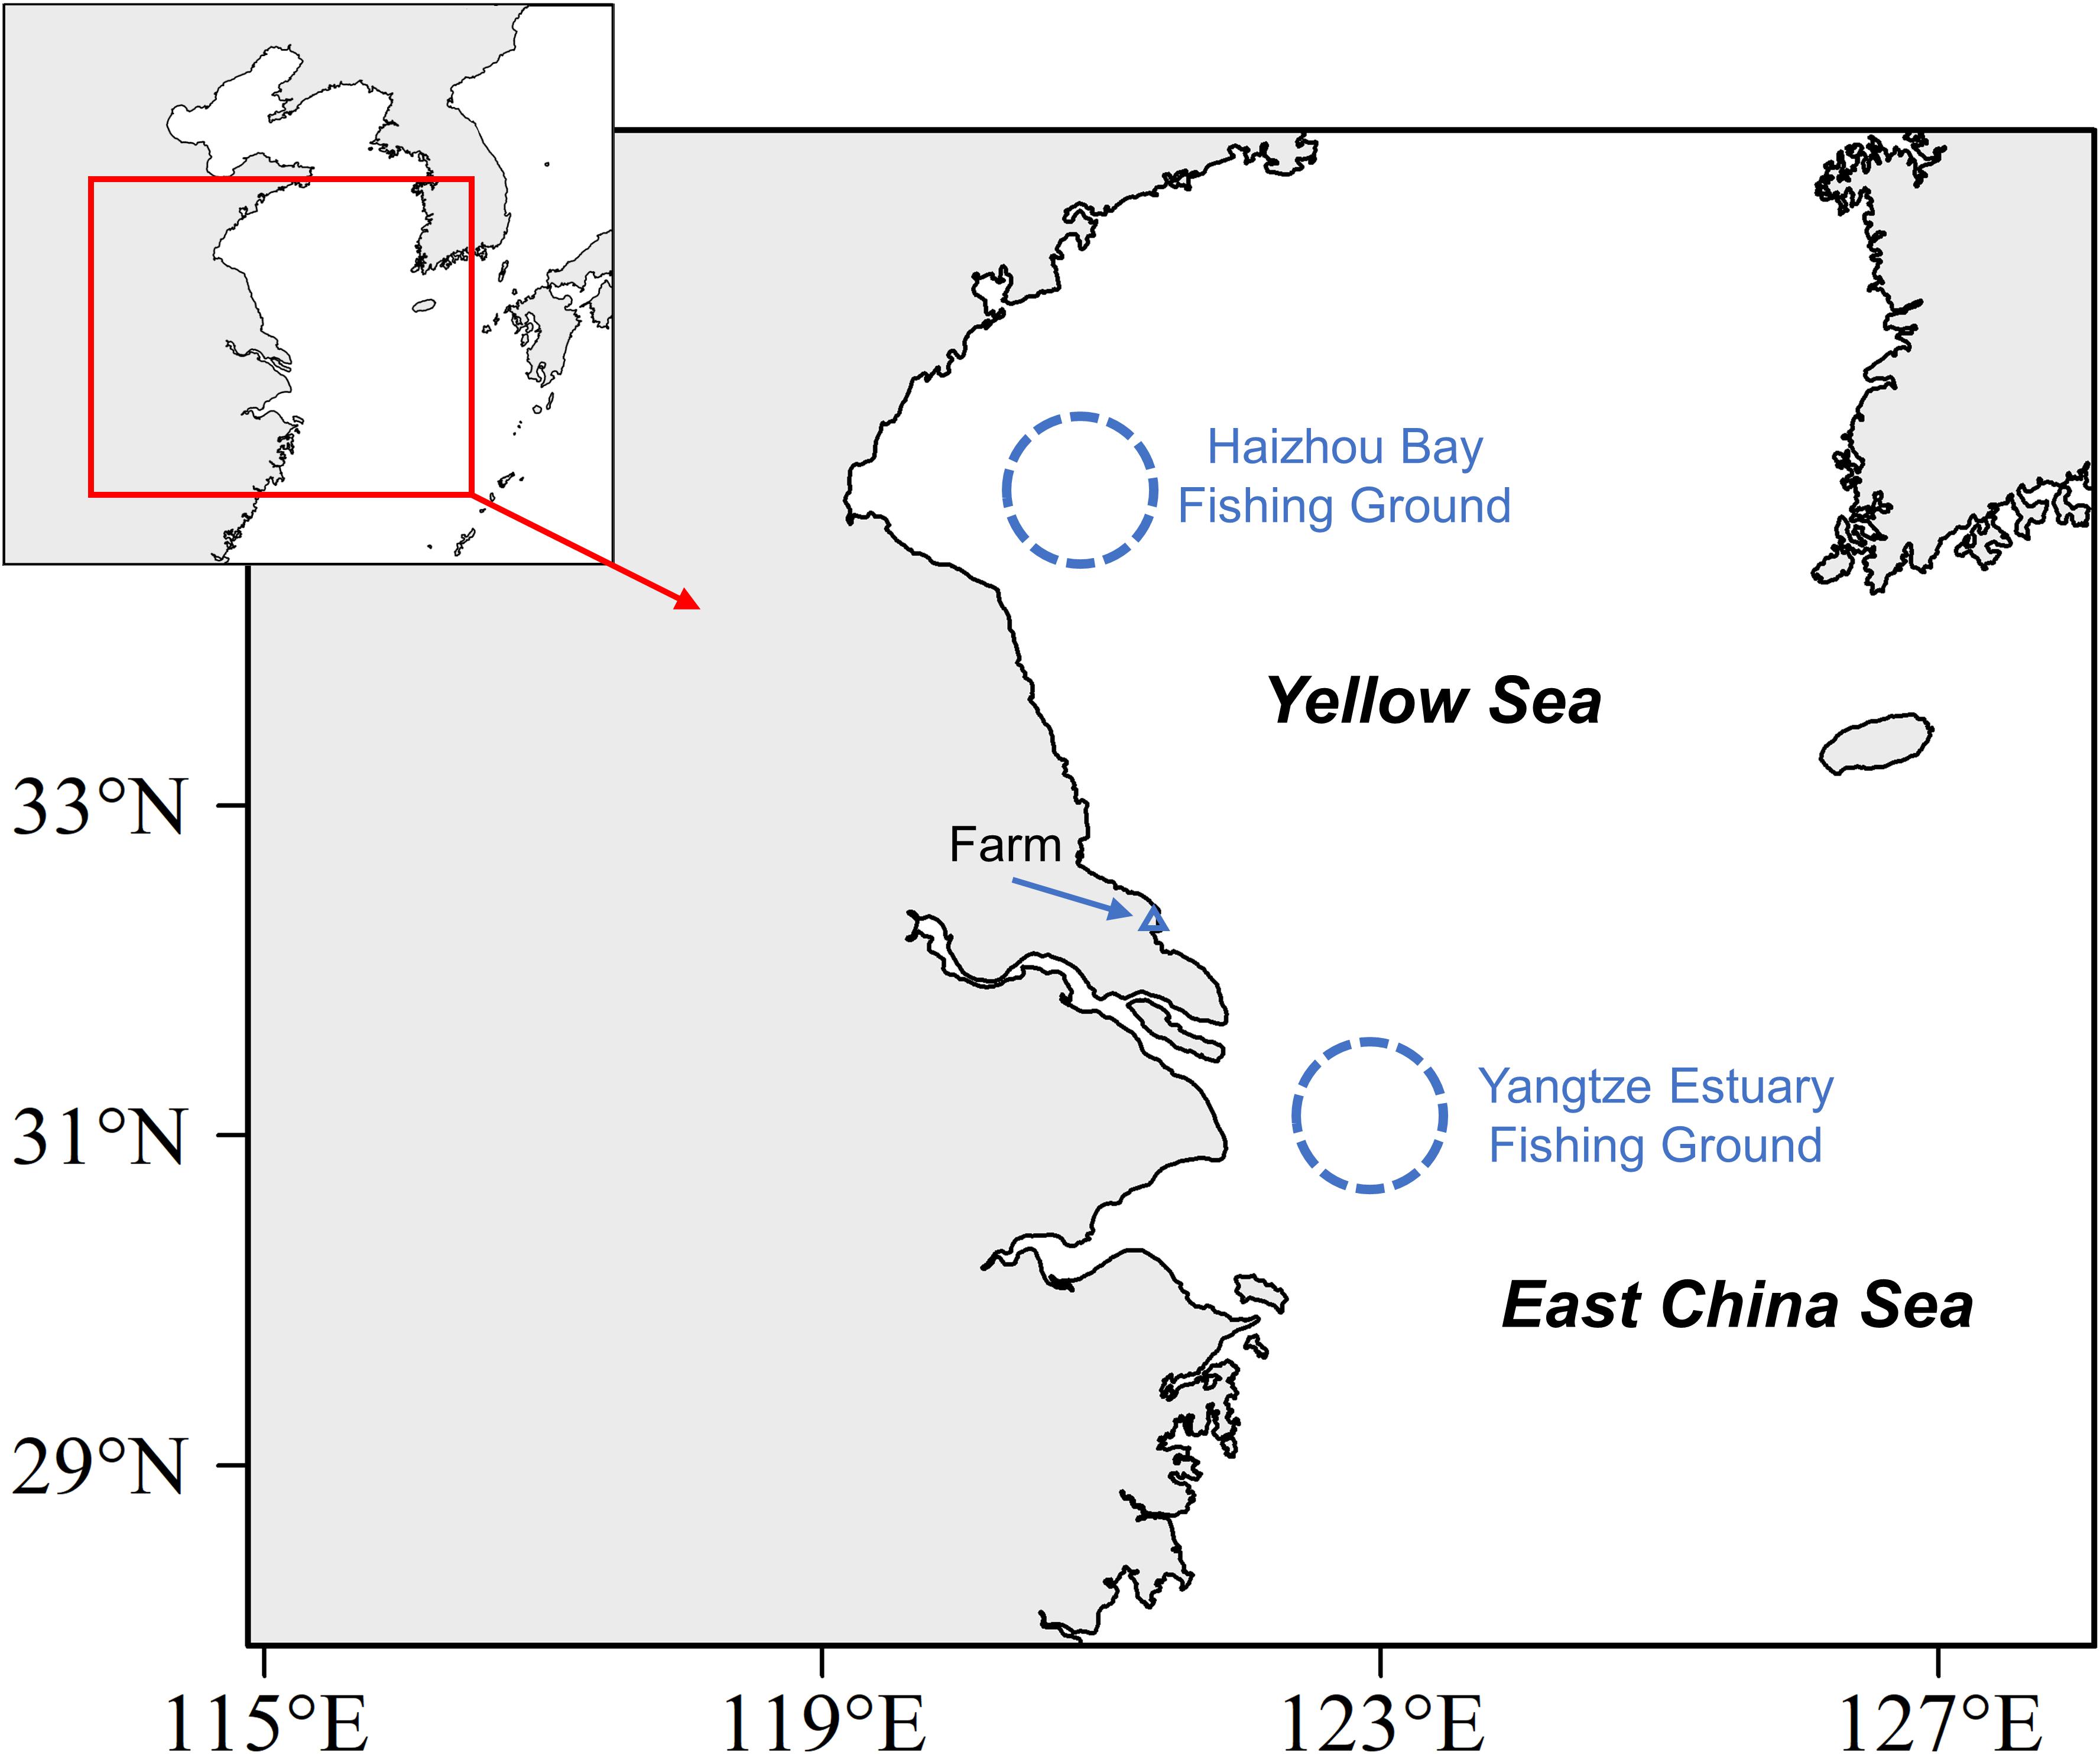
Wild Rhopilema esculentum and Nemopilema nomurai specimens were sampled in the waters off eastern China in July of 2019 (Table 1 and Figure 1). Forty R. esculentum were collected from two fishing grounds: Haizhou Bay and Yangtze Estuary. Twenty-three N. nomurai were sampled from similar locations of R. esculentum in Yangtze Estuary. In addition, thirty farmed R. esculentum were purchased from a local farm in September of 2019 in Nantong, Jiangsu province (Table 1). All samples were collected fresh and stored in aseptic food-grade plastic bags and immediately transport to the laboratory on ice. In the laboratory, the bell diameter of each specimen was measured. Bell tissues, a major portion of R. esculentum with edible value (Jiang et al., 2019), were extracted and washed thoroughly with ultrapure water (Javidpour et al., 2016; MacKenzie et al., 2017). Each bell piece was lyophilized and homogenized into a fine powder and then stored at −20°C prior to analyses.
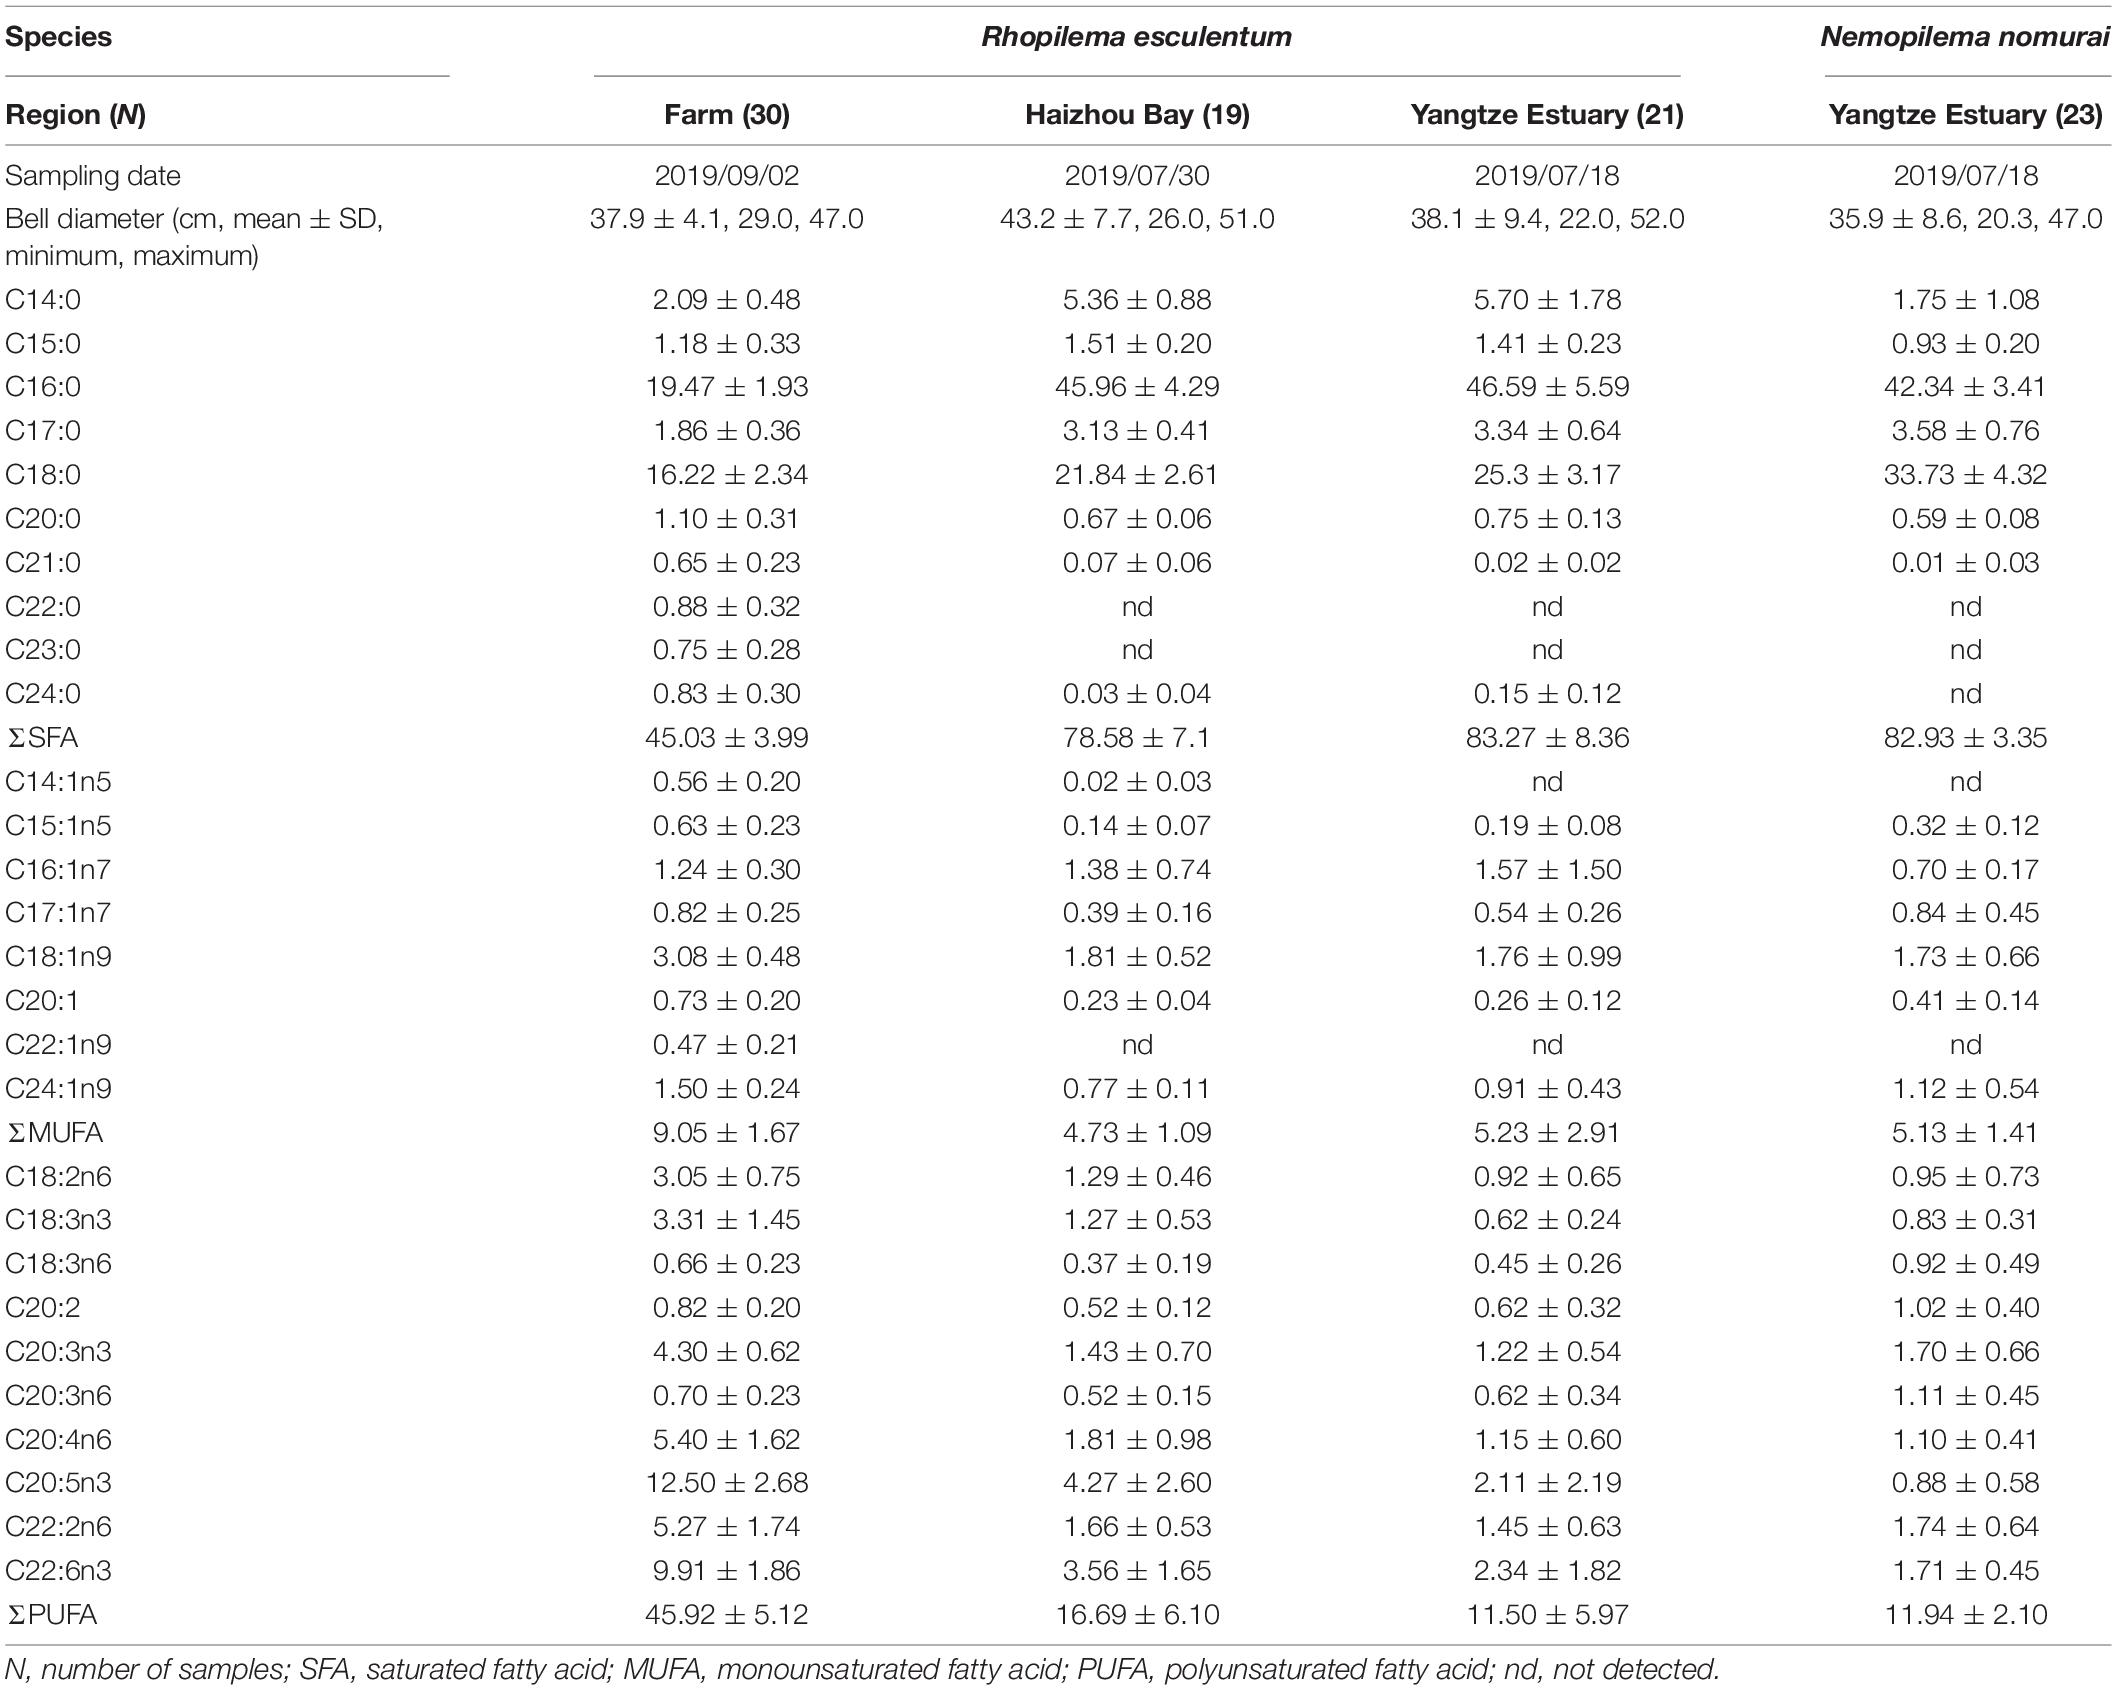
Table 1. Specimen characteristics and fatty acid profiles of the bell tissues of Rhopilema esculentum collected from three regions and Nemopilema nomurai collected from Yangtze Estuary.
Fatty Acid Analysis
The extraction of lipids was performed according to Folch et al. (1957) with CHCl3/MeOH (2:1, v/v) on 200 mg powdered bell tissues, the mixture was shaken for 5 min, and extracted overnight. The extract was washed with 0.9% (w/v) NaCl solution and then left to stand to allow separation. After each separation, the organic (lower) layer was collected and dried under a stream of nitrogen. The lipid sample was dissolved in 4 mL NaOH/MeOH solution (0.5 M) and refluxed for 10 min in an 80°C water bath. Subsequently, 4 mL BF3/MeOH (14%, w/v) was added and refluxed for 30 min. After cooling, 4 mL n-Heptane and 15 mL saturated NaCl solution was added and then left to stand to allow separation. The organic (upper) layer containing FA methyl esters (FAMEs) was transferred to a sample bottle. After the addition of an internal standard (19:0, Nonadecanoic), samples (10 μL) were injected at 250°C into a gas chromatography/mass spectrometer (7890B/5977A, Agilent Technologies) in split mode (split ratio 1:10), equipped with a capillary column (HP-88, 60 m × 0.25 mm × 0.20 μm, Agilent Technologies). The oven temperature program was from 125 to 145°C at 8°C/min and held for 26 min, then to 220°C at 2°C/min and held for 1 min, and finally raised at 1°C/min to 227°C and held for 1 min. The carrier gas was helium with a flow rate of 1.0 mL/min. FAME peaks were created using a mass spectrometer detector and visualized using MassHunter (B.07.00) software. FAMEs identification was made by comparison of the retention times and mass spectra to those of known standards of 37 FAMEs (GLC 37, Nu-Chek Prep, Inc.) and a NIST 14 mass spectral library. The multilevel (n = 8) calibration curves were established using GLC 37. Quantification of FAs was made according to the response factor determined for each FA in the calibration curves in relation to the internal standard.
Stable Isotope Analysis
Approximately 2.0 mg of dried bell tissue powder was used to determine the carbon-to-nitrogen ratios (C:N) and δ13C and δ15N values. Analysis of samples was conducted with a vario ISOTOPE cube elemental analyzer (Elementar Analysensysteme GmbH, Hanau, Germany) and IsoPrime 100 isotope ratio mass-spectrometer (Isoprime Corporation, Cheadle, United Kingdom). During analysis, samples were interspersed with triplicates of two laboratory working standards, acetanilide (C:N = 6.862) and protein (δ13C = −26.98‰ and δ15N = 5.94‰). The long-term standard deviation was 0.01, 0.03‰, and 0.05‰ for C:N, δ13C, and δ15N, respectively.
Lipids have more negative δ13C values compared to other biochemical compounds, e.g., proteins and carbohydrates (DeNiro and Epstein, 1977), and lipid content in bell may vary between individuals. In order to avoid any bias induced by lipid content in bell tissues of R. esculentum (i.e., the average C:N > 3.5 in all sampling areas, as discussed below), mathematical methods were used to correct the initial δ13C values (Post et al., 2007). The lipid-corrected δ13C value was evaluated using the equation proposed by D’Ambra et al. (2014) for jellyfish species with the C:N as a proxy for lipid content:
Statistical Analysis
Fatty acids were calculated as a percentage of total FAs in the sample, and FAs that accounted for greater than 0.5% in all origins and jellyfish species were selected for statistical analyses. To explore the effect of size on the dataset, R. esculentum individuals were classified by bell diameter grouped into 5 cm intervals. Multivariate analysis of variance (MANOVA) was performed to examine the difference in FA profiles of R. esculentum from the different sampling groups with the geographic origin and size-class as potential predictors. The Pillai trace test statistic from the MANOVAs was used to test significance; it is robust to violations of homogeneity of covariance. Principal component analysis (PCA) was used to determine the main FAs that contributed to the observed differences between wild and farmed R. esculentum and among origins. In addition, linear discriminant analysis (LDA) with a leave-one-out stepwise jack-knife procedure was performed on the FA profiles and isotopic datasets to identify the variables that would distinguish the origins of R. esculentum and calculate the classification rates. Similarity of percentages analysis (SIMPER) was used to identify the FAs that contributed most to the inter-specific FA profiles, by indicating the percentage contribution of each FA based on the Bray-Curtis dissimilarity of each pair. All statistical analyses and graphics were carried out by SPSS version 19.0 and OriginPro software Version 2021 (OriginLab Corp., Northampton, MA, United States). The significance level was set at 0.05. All results are presented as the mean value ± standard deviation (SD).
Results and Discussion
Intra-Specific Variation in Biomarkers of Rhopilema esculentum and Implications for Origin Traceability
The FA profiles and bell diameters of R. esculentum from three sampling areas are shown in Table 1. Across all bell diameter intervals (22-52 cm), R. esculentum individuals were grouped into 6 size-class. The MANOVA results showed that FA profiles of R. esculentum significantly influenced by origin (Pillai trace = 1.87, F = 14.80, p < 0.01), but not size-class (Pillai trace = 2.43, F = 1.12, p = 0.24) or the combined effect of origin and size-class (Pillai trace = 3.55, F = 1.04, p = 0.39). Different types of FAs were detected in the three sampling groups; e.g., C22:0, C22:1n9, and C23:0 were not observed in wild specimens, and C14:1n5 was not detected in R. esculentum from Yangtze Estuary. Nonetheless, similar proportions of the main FA classes were observed in both wild sampling groups. The dominant FAs of wild specimens were saturated fatty acids (SFAs), followed by polyunsaturated fatty acids (PUFAs) and monounsaturated fatty acids (MUFAs), which is consistent with the previous results reported for three wild Mediterranean jellyfish species (Leone et al., 2015). Other studies report higher levels of PUFAs (e.g., 57.2% for moon jellyfish Aurelia aurita, Ying et al., 2012; 68% for mauve stinger Pelagia noctiluca, Milisenda et al., 2018); however, such comparisons should be treated with caution given inherent differences in the type of species investigated, which possess different biological and ecological characteristics (e.g., size, nutritional status, and food resources) (Milisenda et al., 2018; Stenvers et al., 2020). These differences could also result in a divergence in FA profiles between wild and farmed specimens, the latter was characterized by a relatively high level of SFAs and PUFAs with the lowest level of MUFAs (Table 1). For example, it was reported that the diet of wild R. esculentum was mainly composed of plankton, suspended particles, and fish eggs (Sun et al., 2016), while farmed R. esculentum individuals were feed on an adequate supply of plankton, Artemia sp., rotifers, minced fish and other artificial feed (You et al., 2007).
From the 28 FAs detected, 18 FAs had a mean proportion greater than 0.5% in all origins of R. esculentum and N. nomurai specimens, consisting of six kinds of SFAs (C14:0, C15:0, C16:0, C17:0, C18:0, and C20:0), three MUFAs (C16:1n7, C18:1n9, and C24:1n9), and nine PUFAs (C18:2n6, C18:3n3, C20:2, C20:3n3, C20:3n6, C20:4n6, C20:5n3, C22:2n6, and C22:6n3), and accounted for 87.4 to 99.3%. PCA of these FAs provides an overview of the differences among sampling groups of R. esculentum (Figure 2A). The scatterplot (score plot) referred to the first two principal components, accounting for 70.54% of the total variance, showed a clear separation between wild and farmed specimens along with the first principal component. Meanwhile, the considerable overlap between individuals from Haizhou Bay and Yangtze Estuary suggests that FAs alone cannot be used to distinguish all origins. The main FAs counting for variation in the first principal component were SFAs (e.g., C16:0) and PUFAs (e.g., C18:1n9, C20:4n6, C22:2n6, and C22:6n3). SFAs are documented as predominant storage lipids for the growth and survival of marine organisms (Quérouil et al., 2013; Ricardo et al., 2015). Hence, variations in SFAs are probably due to divergent nutritional/energetic stages of jellyfish inhabiting distinct environmental conditions (e.g., water temperature and food availability), and wild R. esculentum may undertake relatively larger energy costs for the growth and/or capturing preys than that of farmed specimens. The ratio of omega-3 and omega-6 PUFAs (n3/n6) can be used in the nutritional analysis as a proxy of seafood quality (Nogueira et al., 2017). In this study, higher n3/n6 values occurred in Haizhou Bay (1.81 ± 0.54) and farmed (1.75 ± 0.63) individuals than that of R. esculentum from Yangtze Estuary (1.28 ± 0.57; ANOVA, F2,67 = 4.93, p < 0.01), indicating the variability in the relative nutritional quality of jellyfish of different origins.
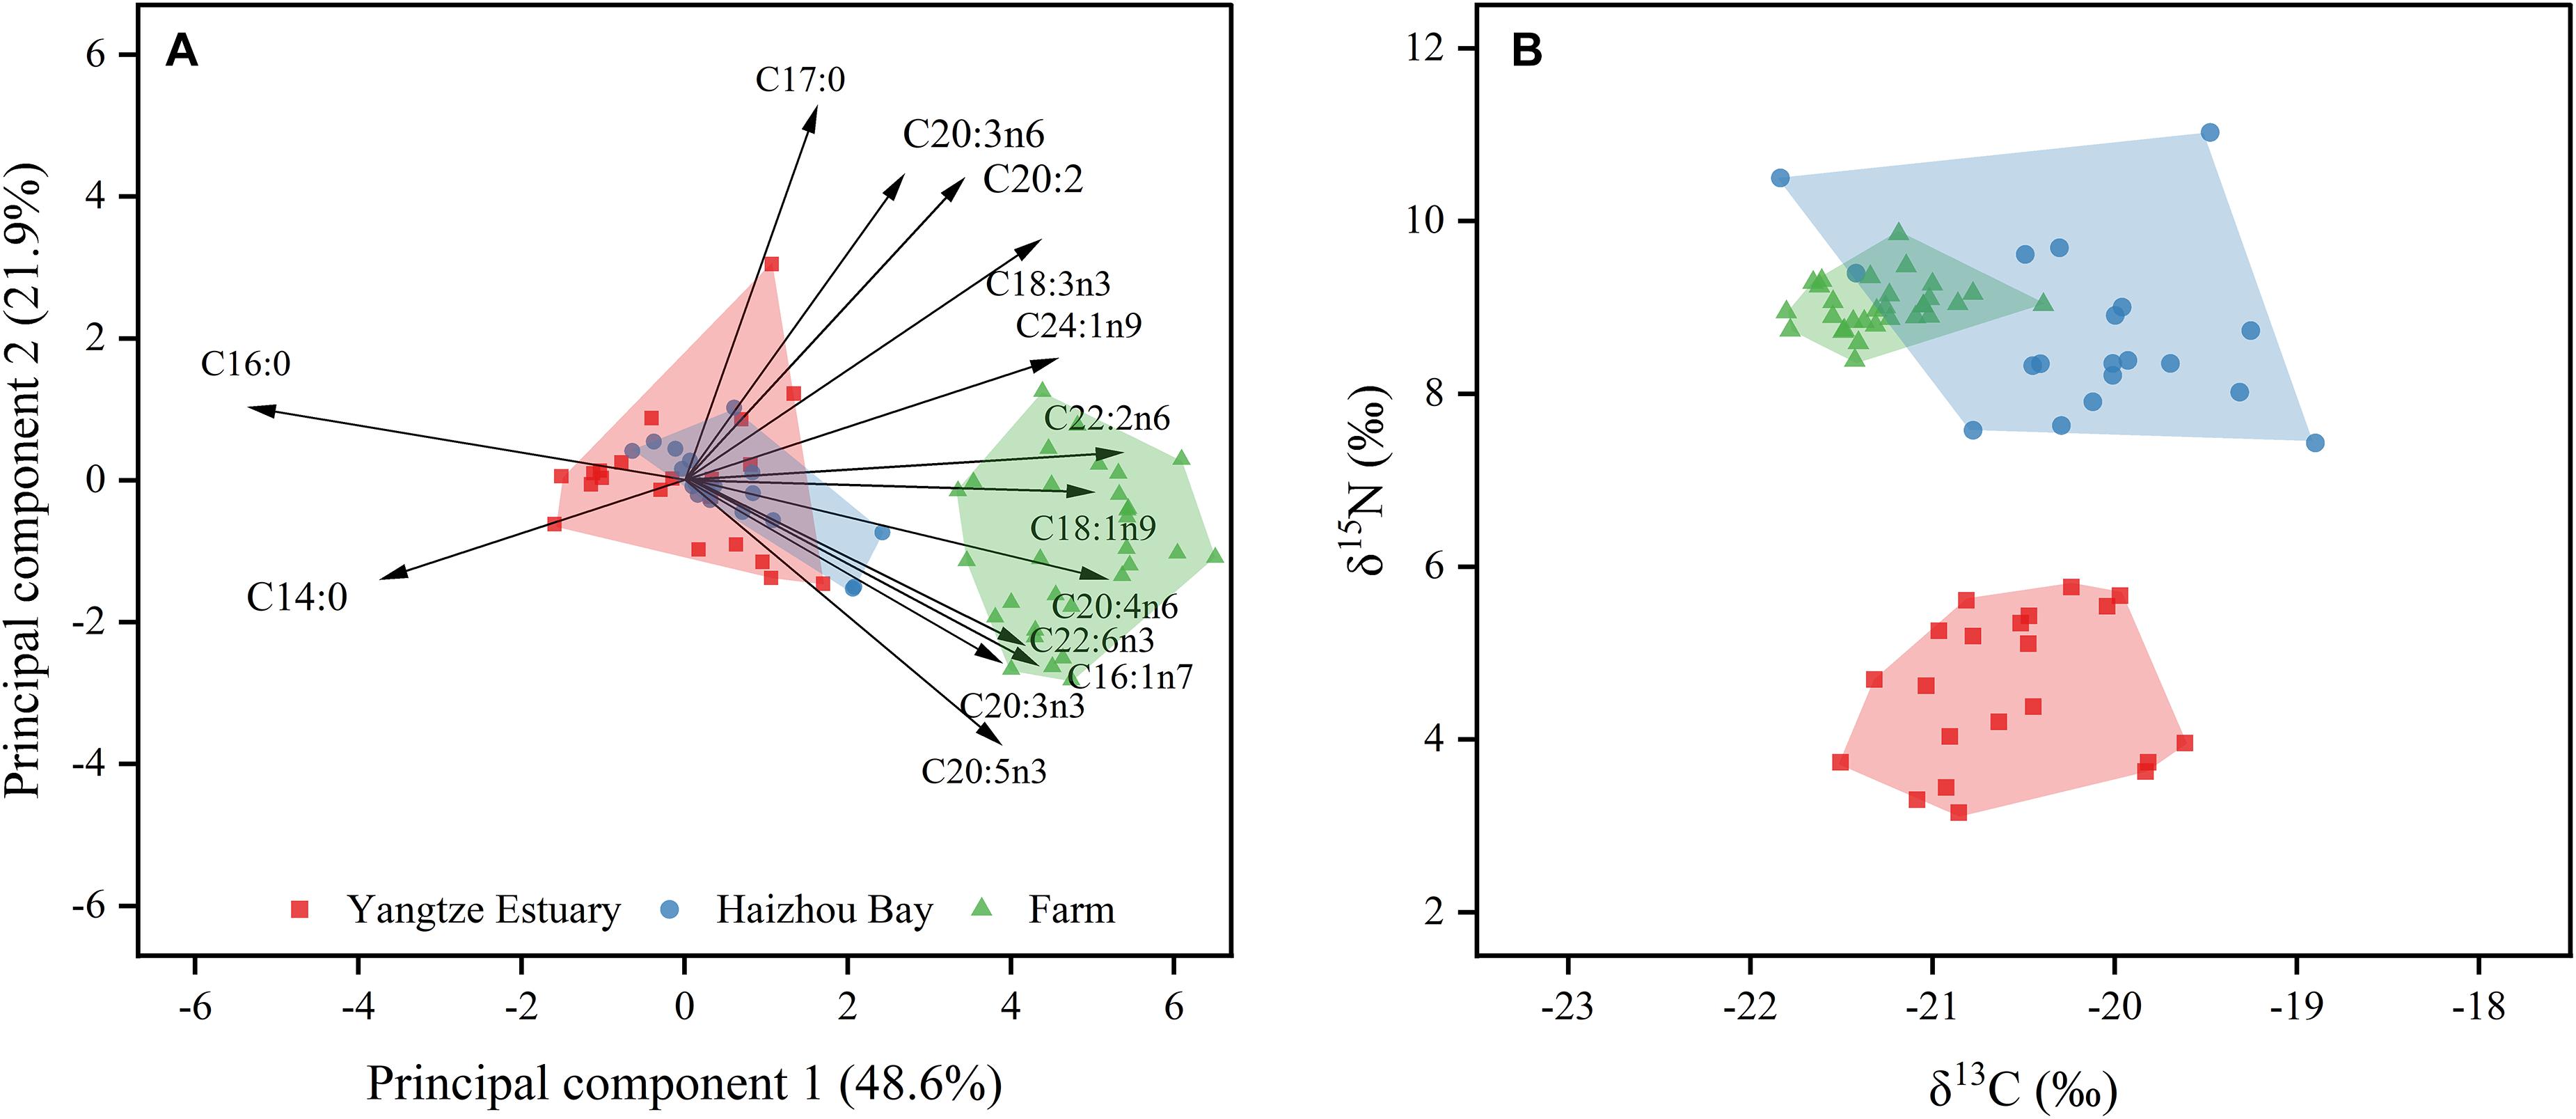
Figure 2. Principal component analysis of fatty acid profiles (A) and stable isotopic ratios (B) of Rhopilema esculentum collected from three origins. Black arrows represent the direction of the component loadings for each FA with factor weights >0.6 and <–0.6.
Rhopilema esculentum specimens collected from three origins revealed C:N ranging from 3.56 ± 0.11 to 3.74 ± 0.22 and thus lipid-corrected δ13C values were used in further analyses (Post et al., 2007; D’Ambra et al., 2014). The δ13C values for all specimens ranged from –21.84 to –18.90‰ (–20.76 ± 0.69‰), while R. esculentum had a much wider range of δ15N values, from 3.16 to 11.03‰ (7.60 ± 2.11‰) (Figure 2B). Previous analyses of the isotopic values of three jellyfish species in the Yellow Sea yield similar isotopic values: δ13C values ranging between –22.0 and –17.4‰ and δ15N values ranging between 4.8 and 10.6‰ (Ying et al., 2012). However, isotopic values of R. esculentum captured from Yangtze Estuary (δ13C: –20.58 ± 0.50‰, δ15N: 4.57 ± 0.85‰) are lower than those reported for similar-sized lion’s mane jellyfish Cyanea nozakii collected near Yangtze Estuary during 2017 (δ13C: –16.88 ± 0.39‰, δ15N: 10.46 ± 0.28‰, Wang et al., 2020). This may be explained by the intraguild predation of C. nozakii that N. nomurai and small medusae were the main prey items of this species (Wang et al., 2020), and N. nomurai was found to have higher δ13C and δ15N values (–16.80 ± 1.28‰ and 8.11 ± 1.45‰, respectively) than R. esculentum in our study (as discussed below). On the other hand, the differences in the sampling year might also lead to different δ13C and δ15N values between R. esculentum and C. nozakii since temporal variations of δ13C and δ15N values have been reported in several previous studies performed on jellyfish (Fleming et al., 2015; Javidpour et al., 2016; Marques et al., 2020). Significant spatial variations were found in δ13C and δ15N values among origins (ANOVA, δ13C: F2,65 = 66.66, p < 0.01; δ15N: F2,65 = 255.17, p < 0.01, Figure 2). Farmed R. esculentum displayed lower δ13C values (–21.28 ± 0.31‰) than specimens from Haizhou Bay (–20.14 ± 0.69‰) and Yangtze Estuary, with no significant differences between the two wild sampling groups (p = 0.99). Values for δ15N were significantly lower in Yangtze Estuary followed by Haizhou Bay (8.71 ± 0.95‰) and farm (9.02 ± 0.29‰). Spatial variability in isotopic values might also result from the variety of dietary sources, as displayed by the site-specific FA profiles. Niche overlap, measured by the convex hulls of isotopic values, was only observed between specimens from Haizhou Bay and farm (Figure 2B) indicated that the δ13C and δ15N values could be a potential tool to discriminate the origins of wild jellyfish.
To determine the most suitable variables that can classify the R. esculentum from three origins, the δ13C and δ15N values, and twelve of the most abundant FAs were combined and subjected to LDA with a leave-one-out stepwise jack-knife procedure. The LDA identified seven valid variables (δ13C, δ15N, C16:0, C17:0, C18:0, C16:1n7, and C20:5n3) that served as discriminatory variables for the three origins (Table 2). We obtained a 100% correct cross-validated classification rate within each of our sampling groups (Figure 3). This suggests that combined use of FAs and stable isotopes can improve the traceability of origins of wild and farmed jellyfish compared with the results using either analysis alone, as mentioned above. These findings also correspond with previous studies in which a combination of FA and stable isotope analyses was used to distinguish production method (i.e., wild or farmed) and origins of commercially important seafood and aquaculture species, such as turbot Psetta maxima (Busetto et al., 2008), Atlantic salmon Salmo salar (Thomas et al., 2008), and European eel Anguilla anguilla (Vasconi et al., 2019). However, it is relatively rare to discriminate the origin of the jellyfish species.
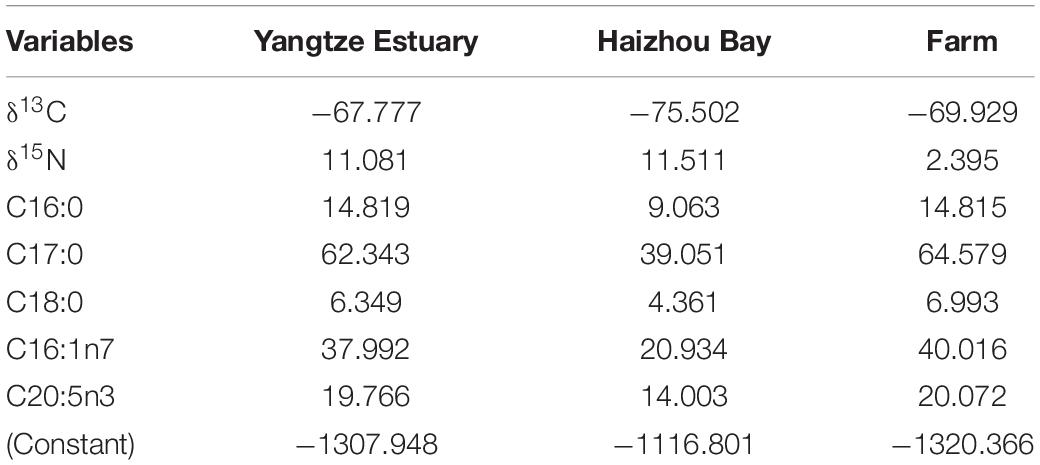
Table 2. Function coefficients of the linear discriminant analysis for three origins of jellyfish Rhopilema esculentum.
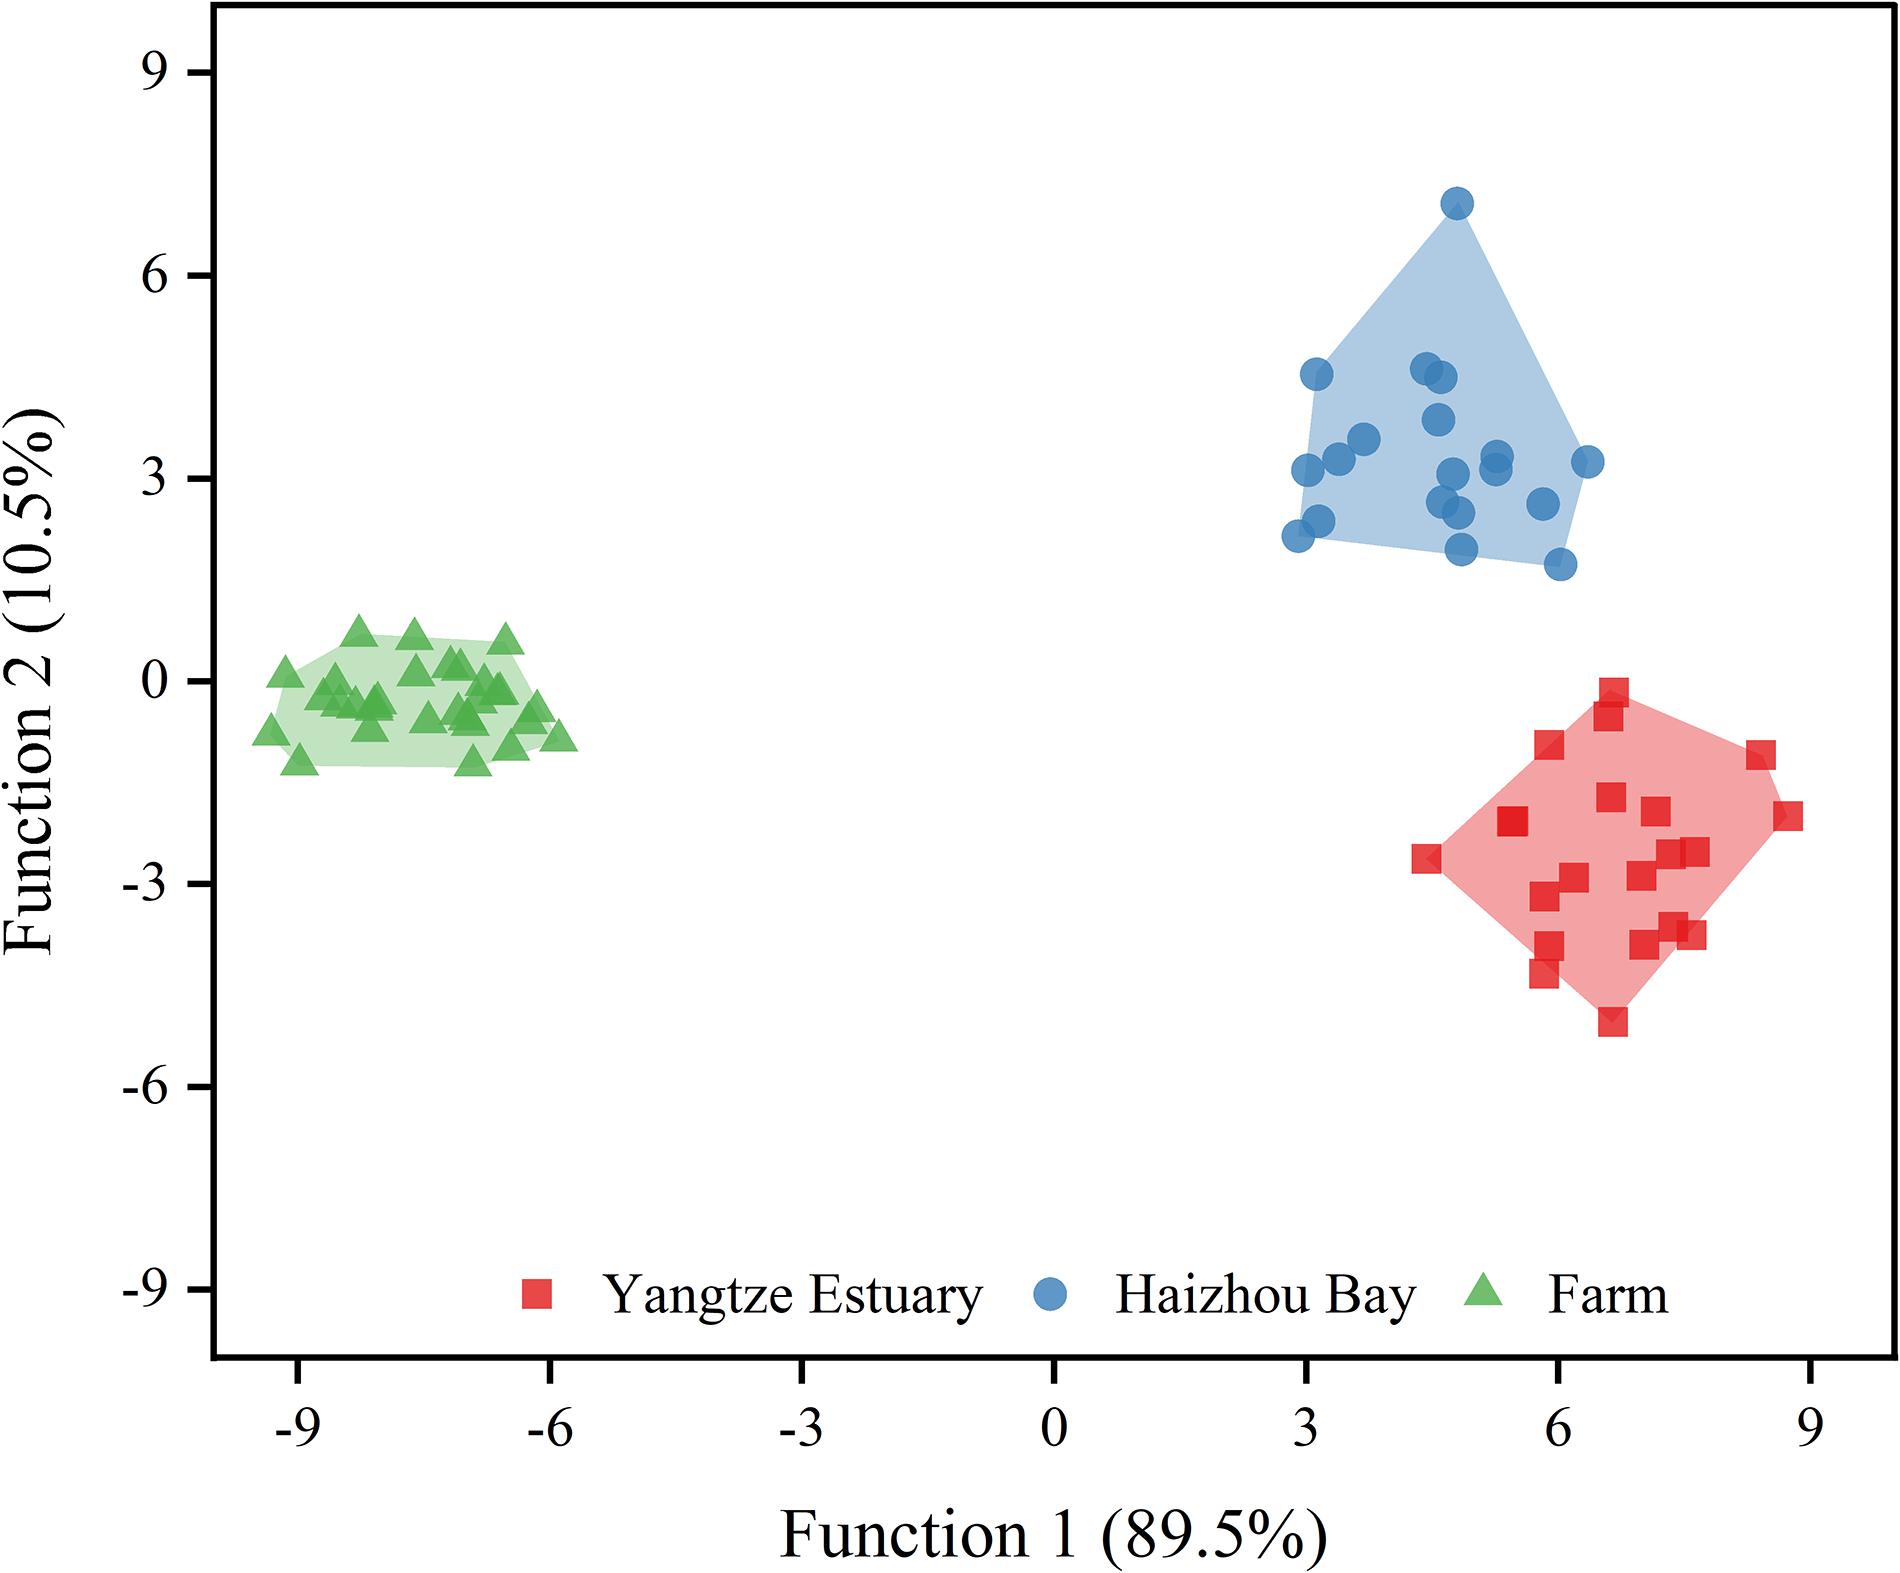
Figure 3. Linear discriminant analysis plots showing the distribution of Rhopilema esculentum from three origins.
Discrimination of Two Sympatric Jellyfish Species by Biomarkers
There was no significant difference in bell diameter between sympatric R. esculentum and N. nomurai from Yangtze Estuary (ANOVA, F1,42 = 3.60, p = 0.07). However, FA profiles differed significantly between the species. SIMPER analysis of the FA dataset showed that C14:0, C16:0, C18:0, and C20:5n3 contributed 67.8% of the Bray-Curtis dissimilarity between two jellyfish species. The higher level of C14:0 and C20:5n3 in R. esculentum individuals (Table 1) reflects the characteristic of dietary tracer for diatoms (Parrish, 2013). The FA biomarker ratio of C16:1n7/C16:0 typically used to infer a dominant diatom versus dinoflagellate (Auel et al., 2002), was also significantly higher in R. esculentum (0.037 ± 0.038). In contrast, N. nomurai had a relatively high level of the PUFA containing 18 carbon atoms (2.70 ± 0.66% and 1.99 ± 0.95% for N. nomurai and R. esculentum, respectively) and low C16:1n7/16:0 (0.017 ± 0.005), which are biomarkers of dinoflagellates (Dalsgaard et al., 2003; Patil et al., 2007). FA biomarkers of copepods were present in both jellyfish species. The values of certain biomarkers indicate that R. esculentum and N. nomurai consumed large (C20:1n9) and small (C16:0, C18:1n9, and C20:5n3) copepods (Dalsgaard et al., 2003). Besides the relatively low levels of C16:0 and C20:5n3, and high C20:1n9 in N. nomurai suggests a greater dietary intake of large calanoid copepods (Table 1). SFAs, particularly C16:0 and C18:0, are the basic FAs in the two jellyfish species and are generally documented as functional storage lipids to provide an adequate energy source for the growth and survival of marine organisms such as fish (Tocher, 2003). It is therefore likely that the inter-specific amounts of C16:0 and C18:0 are representing different nutritional/energetic stages between sympatric jellyfish species in a given area, perhaps in relation to the different dietary sources displayed by FA biomarkers. The PCA scatterplot showed separation of two jellyfish species was mostly driven by the second principal component (Figure 4A). Although differences were observed in specific FA and/or FA biomarkers, a slight overlap was observed in convex hulls between R. esculentum and N. nomurai based on the PCA results of FA profiles (Figure 4A), which indicates that FAs alone may not be able to fully distinguish two species.
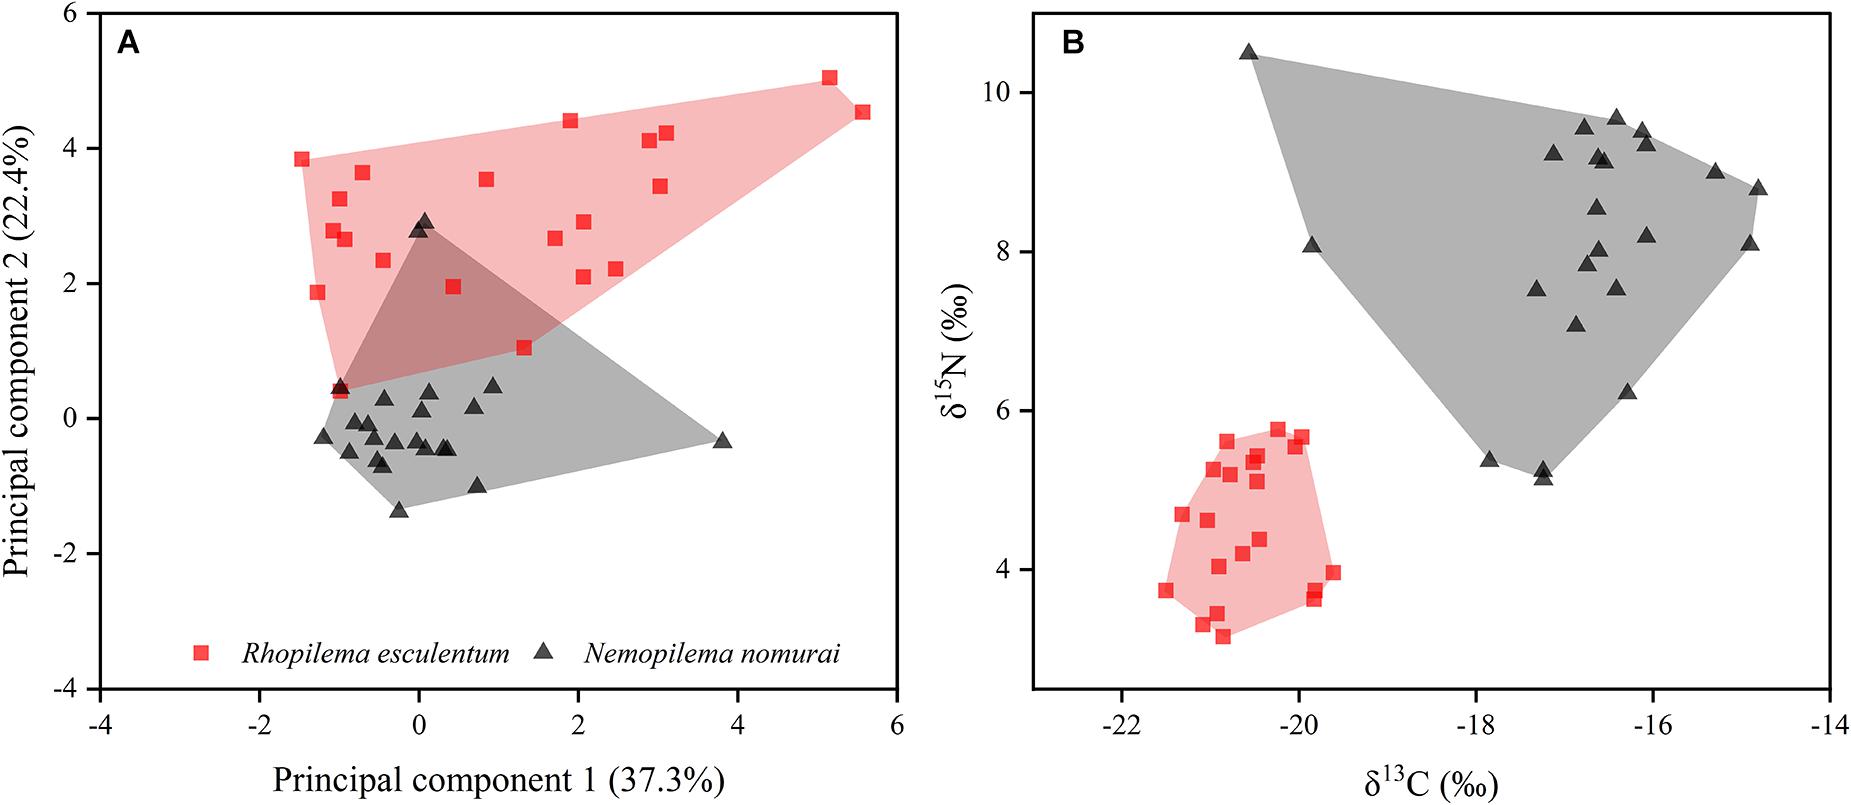
Figure 4. Principal component analysis of fatty acid profiles (A) and stable isotopic ratios (B) of sympatric Rhopilema esculentum and Nemopilema nomurai collected from Yangtze Estuary.
For stable isotope analysis, the average C:N of N. nomurai specimens was 3.20 ± 0.13 and thus initial δ13C values were used in further analyses (Post et al., 2007). The ANOVA results showed that δ13C and δ15N values were significantly different between species (δ13C: F1,42 = 154.4, p < 0.01; δ15N: F1,42 = 91.1, p < 0.01). R. esculentum had lower δ13C and δ15N values (–20.58 ± 0.50 ‰ and 4.57 ± 0.85‰, respectively) than those of N. nomurai (–16.80 ± 1.28‰ and 8.11 ± 1.45‰, respectively). These differences corroborate the previous findings in the FA biomarkers that two jellyfish species might have different food compositions, e.g., N. nomurai appears to uptake copepod of larger size or higher trophic positions with high δ13C values. Unlike the FA results, biplots of δ13C and δ15N values were effectively discriminate two jellyfish species, with no overlap found in isotopic convex hulls (Figure 4B). These results indicate that stable isotopes could be alternative biomarkers for distinguishing sympatric jellyfish species, which is also in agreement with previous studies on commercial fish (Kim et al., 2015; Gopi et al., 2019).
Conclusion
This study was the first to evaluate the effectiveness of multiple biomarkers (FAs and stable isotopes) to discriminate geographic origins of an edible jellyfish species, R. esculentum, and to distinguish the R. esculentum and another sympatric jellyfish N. nomurai. R. esculentum varied in their FA profiles and isotopic values of fresh bell tissues for the 3 origins, possibly due to different food sources, nutritional status, and energy costs that each sampling group experiences at a given location. The high rate of correct classification highlighted the complementarity of FA and stable isotope analyses for distinguishing the origin and production method of untreated R. esculentum. In addition, the differences in FA profiles and isotopic values emphasized the inter-specific foraging strategies of sympatric R. esculentum and N. nomurai, and stable isotope analysis has the potential to become an effective method for distinguishing the sympatric jellyfish species. However, given the temporal and spatial variability in isotopic values of jellyfish, including R. esculentum (Fleming et al., 2015; Javidpour et al., 2016; Milisenda et al., 2018), it is unknown whether the high classification rate in our study would also occur in other geographical locations and seasons. Moreover, the effectiveness of these biomarkers for distinguishing the origin and species of processed jellyfish remains to be explored.
Data Availability Statement
The original contributions presented in the study are included in the article/supplementary material, further inquiries can be directed to the corresponding author.
Ethics Statement
The animal study was reviewed and approved by the Institutional Animal Care and Use Committee of Shanghai Ocean University.
Author Contributions
YG and JZ conceived and designed the experiments. JZ, JS, and YT provided tissue samples. YG and XS performed the experiments and analyzed the data with the help of YW, YG, and JZ. YW and YG wrote the manuscript with the advice of JZ, YT, and JS. All authors provided editorial advice and agree that this version of the manuscript is acceptable for submission.
Funding
This work was supported by the National Key Research and Development Program of China (2020YFD0900803) and National Natural Science Foundation of China (31001138).
Conflict of Interest
The authors declare that the research was conducted in the absence of any commercial or financial relationships that could be construed as a potential conflict of interest.
Publisher’s Note
All claims expressed in this article are solely those of the authors and do not necessarily represent those of their affiliated organizations, or those of the publisher, the editors and the reviewers. Any product that may be evaluated in this article, or claim that may be made by its manufacturer, is not guaranteed or endorsed by the publisher.
Acknowledgments
We thank the observers who helped us with the collection and processing of samples. We also thank all our colleagues at SHOU for their assistance with stable isotope and fatty acid preparation and analysis.
References
Armani, A., Giusti, A., Castigliego, L., Rossi, A., Tinacci, L., Gianfaldoni, D., et al. (2014). A Pentaplex PCR as screening assay for jellyfish species identification in food products. J. Agric. Food Chem. 62, 12134–12143. doi: 10.1021/jf504654b
Armani, A., Tinacci, L., Giusti, A., Castigliego, L., Gianfaldoni, D., and Guidi, A. (2013). What is inside the jar? Forensically informative nucleotide sequencing (FINS) of a short mitochondrial COI gene fragment reveals a high percentage of mislabeling in jellyfish food products. Food Res. Int. 54, 1383–1393. doi: 10.1016/j.foodres.2013.10.003
Auel, H., Harjes, M., Da Rocha, R., Stübing, D., and Hagen, W. (2002). Lipid biomarkers indicate different ecological niches and trophic relationships of the Arctic hyperiid amphipods Themisto abyssorum and T. libellula. Polar Biol. 25, 374–383. doi: 10.1007/s00300-001-0354-7
Bleve, G., Ramires, F. A., Gallo, A., and Leone, A. (2019). Identification of safety and quality parameters for preparation of jellyfish based novel food products. Foods 8:263. doi: 10.3390/foods8070263
Boero, F. (2013). Review of Jellyfish Blooms in the Mediterranean and Black Sea. Report 92. General Fisheries Commission for the Mediterranean. Rome: FAO.
Brotz, L., Schiariti, A., López-Martínez, J., Álvarez-Tello, J., Peggy Hsieh, Y. H., Jones, R. P., et al. (2017). Jellyfish fisheries in the Americas: origin, state of the art, and perspectives on new fishing grounds. Rev. Fish Biol. Fish. 27, 1–29. doi: 10.1007/s11160-016-9445-y
Busetto, M. L., Moretti, V. M., Moreno-Rojas, J. M., Caprino, F., Giani, I., Malandra, R., et al. (2008). Authentication of farmed and wild turbot (Psetta maxima) by fatty acid and isotopic analyses combined with chemometrics. J. Agric. Food Chem. 56, 2742–2750. doi: 10.1021/jf0734267
Dalsgaard, J., John, M. S., Kattner, G., Müller-Navarra, D., and Hagen, W. (2003). Fatty acid trophic markers in the pelagic marine environment. Adv. Mar. Biol. 46, 225–340. doi: 10.1016/S0065-2881(03)46005-7
D’Ambra, I., Carmichael, R. H., and Graham, W. M. (2014). Determination of δ13C and δ15N and trophic fractionation in jellyfish: implications for food web ecology. Mar. Biol. 161, 473–480. doi: 10.1007/s00227-013-2345-y
D’Amico, P., Armani, A., Castigliego, L., Sheng, G., Gianfaldoni, D., and Guidi, A. (2014). Seafood traceability issues in Chinese food business activities in the light of the european provisions. Food Control 35, 7–13. doi: 10.1016/j.foodcont.2013.06.029
DeNiro, M. J., and Epstein, S. (1977). Mechanism of carbon isotope fractionation associated with lipid synthesis. Science 197, 261–263. doi: 10.1126/science.327543
Fleming, N. E. C., Harrod, C., Newton, J., and Houghton, J. D. R. (2015). Not all jellyfish are equal: isotopic evidence for inter- and intraspecific variation in jellyfish trophic ecology. PeerJ 3:e1110. doi: 10.7717/peerj.1110
Folch, J., Lees, M., and Stanley, G. H. S. (1957). A simple method for the isolation and purification of total lipides from animal tissues. J. Biol. Chem. 226, 497–509.
Gong, Y., Li, Y., Chen, X., and Yu, W. (2020). Trophic niche and diversity of a pelagic squid (Dosidicus gigas): a comparative study using stable isotope, fatty acid, and feeding apparatuses morphology. Front. Mar. Sci. 7:642. doi: 10.3389/fmars.2020.00642
Gopi, K., Mazumder, D., Sammut, J., Saintilan, N., Crawford, J., and Gadd, P. (2019). Isotopic and elemental profiling to trace the geographic origins of farmed and wild-caught Asian seabass (Lates calcarifer). Aquaculture 502, 56–62. doi: 10.1016/j.aquaculture.2018.12.012
Javidpour, J., Cipriano-Maack, A. N., Mittermayr, A., and Dierking, J. (2016). Temporal dietary shift in jellyfish revealed by stable isotope analysis. Mar. Biol. 163, 1–9. doi: 10.1007/s00227-016-2892-0
Jiang, X. Y., Wang, F. L., Zhao, C. C., Yan, J. N., Han, J. R., Shang, W. H., et al. (2019). Identification of two jellyfish species (Rhopilema esculentum kishinouye and Stomolophus meleagris) in Liaoning Province of China by a rapid, simple PCR-RFLP method. Food Control 105, 52–57. doi: 10.1016/j.foodcont.2019.05.018
Kim, H., Suresh Kumar, K., and Shin, K. H. (2015). Applicability of stable C and N isotope analysis in inferring the geographical origin and authentication of commercial fish (Mackerel, Yellow Croaker and Pollock). Food Chem. 172, 523–527. doi: 10.1016/j.foodchem.2014.09.058
Leone, A., Lecci, R. M., Durante, M., Meli, F., and Piraino, S. (2015). The bright side of gelatinous blooms: nutraceutical value and antioxidant properties of three Mediterranean jellyfish (Scyphozoa). Mar. Drugs 13, 4654–4681. doi: 10.3390/md13084654
MacKenzie, K. M., Trueman, C. N., Lucas, C. H., and Bortoluzzi, J. (2017). The preparation of jellyfish for stable isotope analysis. Mar. Biol. 164, 1–9. doi: 10.1007/s00227-017-3242-6
Marques, R., Bonnet, D., Carré, C., Roques, C., and Darnaude, A. M. (2020). Trophic ecology of a blooming jellyfish (Aurelia coerulea) in a Mediterranean coastal lagoon. Limnol. Oceanogr. 66, 141–157. doi: 10.1002/lno.11593
Milisenda, G., Rossi, S., Vizzini, S., Fuentes, V. L., Purcell, J. E., Tilves, U., et al. (2018). Seasonal variability of diet and trophic level of the gelatinous predator Pelagia noctiluca (Scyphozoa). Sci. Rep. 8:12140. doi: 10.1038/s41598-018-30474-x
Nogueira, N., Fernandes, I., Fernandes, T., and Cordeiro, N. (2017). A comparative analysis of lipid content and fatty acid composition in muscle, liver and gonads of Seriola fasciata Bloch 1793 based on gender and maturation stage. J. Food Compos. Anal. 59, 68–73. doi: 10.1016/j.jfca.2016.11.005
Parrish, C. C. (2013). Lipids in Marine Ecosystems. ISRN Oceanogr. 2013, 1–16. doi: 10.5402/2013/604045
Patil, V., Källqvist, T., Olsen, E., Vogt, G., and Gislerød, H. R. (2007). Fatty acid composition of 12 microalgae for possible use in aquaculture feed. Aquac. Int. 15, 1–9. doi: 10.1007/s10499-006-9060-3
Post, D. M. (2002). Using stable isotopes to estimate trophic position: models, methods, and assumptions. Ecology 83, 703–718.
Post, D. M., Layman, C. A., Arrington, D. A., Takimoto, G., Quattrochi, J., and Montaña, C. G. (2007). Getting to the fat of the matter: models, methods and assumptions for dealing with lipids in stable isotope analyses. Oecologia 152, 179–189. doi: 10.1007/s00442-006-0630-x
Quérouil, S., Kiszka, J., Cordeiro, A. R., Cascão, I., Freitas, L., Dinis, A., et al. (2013). Investigating stock structure and trophic relationships among island-associated dolphins in the oceanic waters of the North Atlantic using fatty acid and stable isotope analyses. Mar. Biol. 160, 1325–1337. doi: 10.1007/s00227-013-2184-x
Rasmussen, R. S., and Morrissey, M. T. (2008). DNA-based methods for the identification of commercial fish and seafood species. Compr. Rev. Food Sci. Food Saf. 7, 280–295. doi: 10.1111/j.1541-4337.2008.00046.x
Ricardo, F., Pimentel, T., Moreira, A. S. P., Rey, F., Coimbra, M. A., Rosário Domingues, M., et al. (2015). Potential use of fatty acid profiles of the adductor muscle of cockles (Cerastoderma edule) for traceability of collection site. Sci. Rep. 5:11125. doi: 10.1038/srep11125
Stenvers, V., Chi, X., and Javidpour, J. (2020). Seasonal variability of the fatty acid composition in Aurelia aurita (Cnidaria: scyphozoa): implications for gelativore food web studies. J. Plankton Res. 42, 440–452. doi: 10.1093/plankt/fbaa026
Sun, M., Wang, B., Li, Y. L., Wang, A. Y., Dong, J., Ma, T. Y., et al. (2016). Feeding habitats and trophic levels of Rhopilema esculentum Kishinouye in Liaodong Bay based on analyzing carbon and nitrogen stable isotopes. Chin. J. Appl. Ecol. 27, 1103–1108. doi: 10.13287/j.1001-9332.201604.007
Thomas, F., Jamin, E., Wietzerbin, K., Guérin, R., Lees, M., Morvan, E., et al. (2008). Determination of origin of atlantic salmon (Salmo salar): the use of multiprobe and multielement isotopic analyses in combination with fatty acid composition to assess wild or farmed origin. J. Agric. Food Chem. 56, 989–997. doi: 10.1021/jf072370d
Tocher, D. R. (2003). Metabolism and functions of lipids and fatty acids in teleost fish. Rev. Fish. Sci. 11, 107–184.
Torri, L., Tuccillo, F., Bonelli, S., Piraino, S., and Leone, A. (2020). The attitudes of Italian consumers towards jellyfish as novel food. Food Qual. Prefer. 79:103782. doi: 10.1016/j.foodqual.2019.103782
Vasconi, M., Lopez, A., Galimberti, C., Moreno Rojas, J. M., Muñoz Redondo, J. M., Bellagamba, F., et al. (2019). Authentication of farmed and wild european eel (Anguilla anguilla) by fatty acid profile and carbon and nitrogen isotopic analyses. Food Control 102, 112–121. doi: 10.1016/j.foodcont.2019.03.004
Wang, P., Zhang, F., Liu, M., Sun, S., and Xian, H. (2020). Isotopic evidence for size-based dietary shifts in the jellyfish Cyanea nozakii in the northern East China Sea. J. Plankton Res. 42, 689–701. doi: 10.1093/plankt/fbaa042
Ying, C., Ying, W., Jing, Z., and Na, W. (2012). Potential dietary influence on the stable isotopes and fatty acid compositions of jellyfishes in the Yellow Sea. J. Mar. Biol. Assoc. U. K. 92, 1325–1333. doi: 10.1017/S0025315412000082
Keywords: Rhopilema esculentum, Nemopilema nomurai, jellyfish, fatty acids, stable isotopes, origin traceability
Citation: Wang Y, Gong Y, Zhang J, Tang Y, Shi X and Shi J (2021) Intra- and Inter-Specific Variation in Edible Jellyfish Biomarkers and Implications for Origin Traceability and Authentication. Front. Mar. Sci. 8:755048. doi: 10.3389/fmars.2021.755048
Received: 07 August 2021; Accepted: 23 September 2021;
Published: 11 October 2021.
Edited by:
Thanos Dailianis, Institute of Marine Biology, Biotechnology and Aquaculture, Hellenic Centre for Marine Research, GreeceReviewed by:
Antonella Leone, Institute of Sciences of Food Production, Italian National Research Council, ItalyDörthe Müller-Navarra, University of Hamburg, Germany
Copyright © 2021 Wang, Gong, Zhang, Tang, Shi and Shi. This is an open-access article distributed under the terms of the Creative Commons Attribution License (CC BY). The use, distribution or reproduction in other forums is permitted, provided the original author(s) and the copyright owner(s) are credited and that the original publication in this journal is cited, in accordance with accepted academic practice. No use, distribution or reproduction is permitted which does not comply with these terms.
*Correspondence: Jian Zhang, ai16aGFuZ0BzaG91LmVkdS5jbg==
†These authors have contributed equally to this work
 Yaxin Wang1†
 Yi Gong
 Jian Zhang