 Goutam Kumar Kundu
 Changseong Kim
 Dongyoung Kim
 Riaz Bibi
 Heeyong Kim3
 Chang-Keun Kang
- 1Stable Isotope Ecology Laboratory, School of Earth Science and Environmental Engineering, Gwangju Institute of Science and Technology, Gwangju, South Korea
- 2Department of Fisheries, University of Dhaka, Dhaka, Bangladesh
- 3South Sea Fisheries Research Institute, National Institute of Fisheries Science, Yeosu-si, South Korea
Trophic contributions of diverse OM sources to estuarine and coastal food webs differ substantially across systems around the world, particularly for nekton (fish, cephalopods, and crustaceans), which utilize basal resources from multiple sources over space and time because of their mobility and feeding behaviors at multiple trophic levels. We investigated the contributions of putative OM sources to fish food webs and assessed the spatiotemporal patterns, structures, and trophic connectivity in fish food webs across four seasons from three closely spaced (10–15 km) sites: an estuarine channel (EC), a deep bay (DB), and an offshore (OS) region in Gwangyang Bay, a high-productivity, low-turbidity estuarine embayment off the Republic of Korea. While nearly all previous studies have focused on few representative species, we examined δ13C and δ15N values of whole nekton communities along with dominant benthic macro-invertebrates, zooplankton, and their putative primary food sources. The δ13C and δ15N values coupled with MixSIAR, a Bayesian mixing model, revealed that these communities utilized multiple primary producers, but phytoplankton comprised the primary trophic contributor (46.6–69.1%). Microphytobenthos (15.8–20.4%) and the seagrass Zostera marina (8.6–19.8%) made substantial contributions, but the role of river-borne terrestrial organic matter was negligible. Spatially different species composition and stable isotope values, but higher utilization of coastal phytoplankton by estuarine fish, indicated disparate food webs structures between the EC and DB/OS coastal areas, with considerable trophic connectivity. Greater overlaps in fish and cephalopod isotopic niches than among other consumers and a higher estimated carbon trophic enrichment factor for EC nekton confirmed feeding migration-mediated biological transport of coastal OM sources to the estuary. Further, the seasonally consistent structures and resource utilization patterns indicate that fish food webs are resilient to changes at lower trophic levels. Our results contrast with those for other highly turbid coastal systems depending highly on diversified basal sources, including exported terrestrial and wetland detritus alongside autochthonous phytoplankton. Finally, this study provides a novel perspective on the role of OM sources in such low turbidity and highly productive coastal embayments and enhances our understanding of marine ecosystems.
Introduction
Estuarine and coastal ecosystems are highly productive, and thus provide habitats to a wide range of fish, crustaceans, and cephalopods, which include species of considerable commercial and ecological importance (Costanza et al., 1997; Beck et al., 2001). These ecosystems are often exposed to riverine discharges and interconnected to diverse habitats (e.g., salt marshes, tidal mudflats, seagrass meadows) (Pihl et al., 2002). In addition to the autochthonous pelagic and benthic microalgae, estuarine and coastal embayments receive varying quality and quantities of organic matter (OM) from rivers, the ocean, and other adjacent watersheds (Hoffman and Bronk, 2006). Changes in the bioavailability of OM from various sources could alter the structure and functioning of estuarine and coastal ecosystems (Cloern, 2007), leading to changes in biomass at higher trophic levels, which has implications for commercial fisheries (Darnaude et al., 2004). Therefore, understanding the roles of OM source(s) in trophic dynamics is pivotal for predicting ecosystem responses to global environmental changes and implementing the sustainable management of marine resources (Hobson et al., 2002). However, the trophic contributions of such diverse autotrophs to estuarine and coastal secondary production are highly variable across ecosystems (Connolly et al., 2005, 2009; França et al., 2011; Whitney et al., 2018). Terrestrial/riverine OM contributes heavily alongside autochthonous phytoplankton in some nearshore food webs (Abrantes et al., 2013; Whitney et al., 2018), whereas it is negligible in others, even when highly available (Bouillon et al., 2003; Park et al., 2015). Such regional differences have also been demonstrated for seagrass meadows (Heck et al., 2008).
Physical processes, such as tidal inundation and riverine discharge, and organism movements can transport the OM and establish trophic connectivity between habitats or compartments within an ecosystem (Connolly et al., 2005; Kang et al., 2015). While the trophic contributions of OM from neighboring habitats to sessile consumers are limited (Connolly et al., 2009; Howe and Simenstad, 2015), the foraging migration patterns of nekton (i.e., actively swimming fish, cephalopods, crustaceans), facilitate such energy transfer (Howe and Simenstad, 2015; Carassou et al., 2016). The cross-ecotone movement of OM can even surpass the contribution of local OM to motile consumers such as fish (Selleslagh et al., 2015). Moreover, ontogenic changes in the habitats and diets of fish—which are highly species-specific—result in differences in the trophic dynamics of OM (Kimirei et al., 2015; Park et al., 2018). Therefore, the pathways of OM through nektonic food webs are particularly complex and require further comprehensive study. Although multiple studies have investigated trophic dynamics in estuarine and coastal ecosystems in terms of benthic invertebrates and a few nektonic species (Deegan et al., 2002; Kneib, 2002; Connolly et al., 2009; Abrantes et al., 2013; Selleslagh et al., 2015; Whitney et al., 2018), very few have examined the nektonic food web comprehensively on a community scale.
The wide variability in OM pathways across systems depends on river discharge, adjacent watershed characteristics, hydromorphology, and community composition (Hoffman et al., 2007; Elliott and Whitfield, 2011; Abrantes et al., 2013). Gwangyang Bay (GYB; Figure 1) in the Republic of Korea is a temperate embayment system with diverse habitats [e.g., common reed beds, bare intertidal mudflats covered with microphytobenthos (MPB), eelgrass beds] that is exposed to both riverine discharge and the open sea (Kim et al., 2010). GYB is known to be highly productive and provides habitats to numerous fish species (Jeong et al., 2005; Seo et al., 2013). Rainfall-induced variation in river discharge and seasonally variable autotroph biomass bring spatial and seasonal variabilities in OM composition in GYB (Choy et al., 2008; Sin et al., 2009). Unlike many temperate estuarine-bay systems with high river discharges, GYB is uniquely characterized by low turbidity and high primary productivity. The contribution of riverine/terrestrial sources to the bay particulate organic matter (POM) pool is very limited, and this pool is primarily composed of phytoplankton (Bibi et al., 2020). It has been also reported that the macrobenthic food webs in GYB are primarily supported by phytoplankton-derived OM (Kim et al., 2020). Therefore, the nektonic community in GYB is expected to be predominantly supported by autochthonous primary production, and its resource utilization pattern would reflect the spatiotemporal variation in OM sources across the estuarine–marine continuum. We also surmise that there are trophic connections between spatially separated communities within the GYB system.
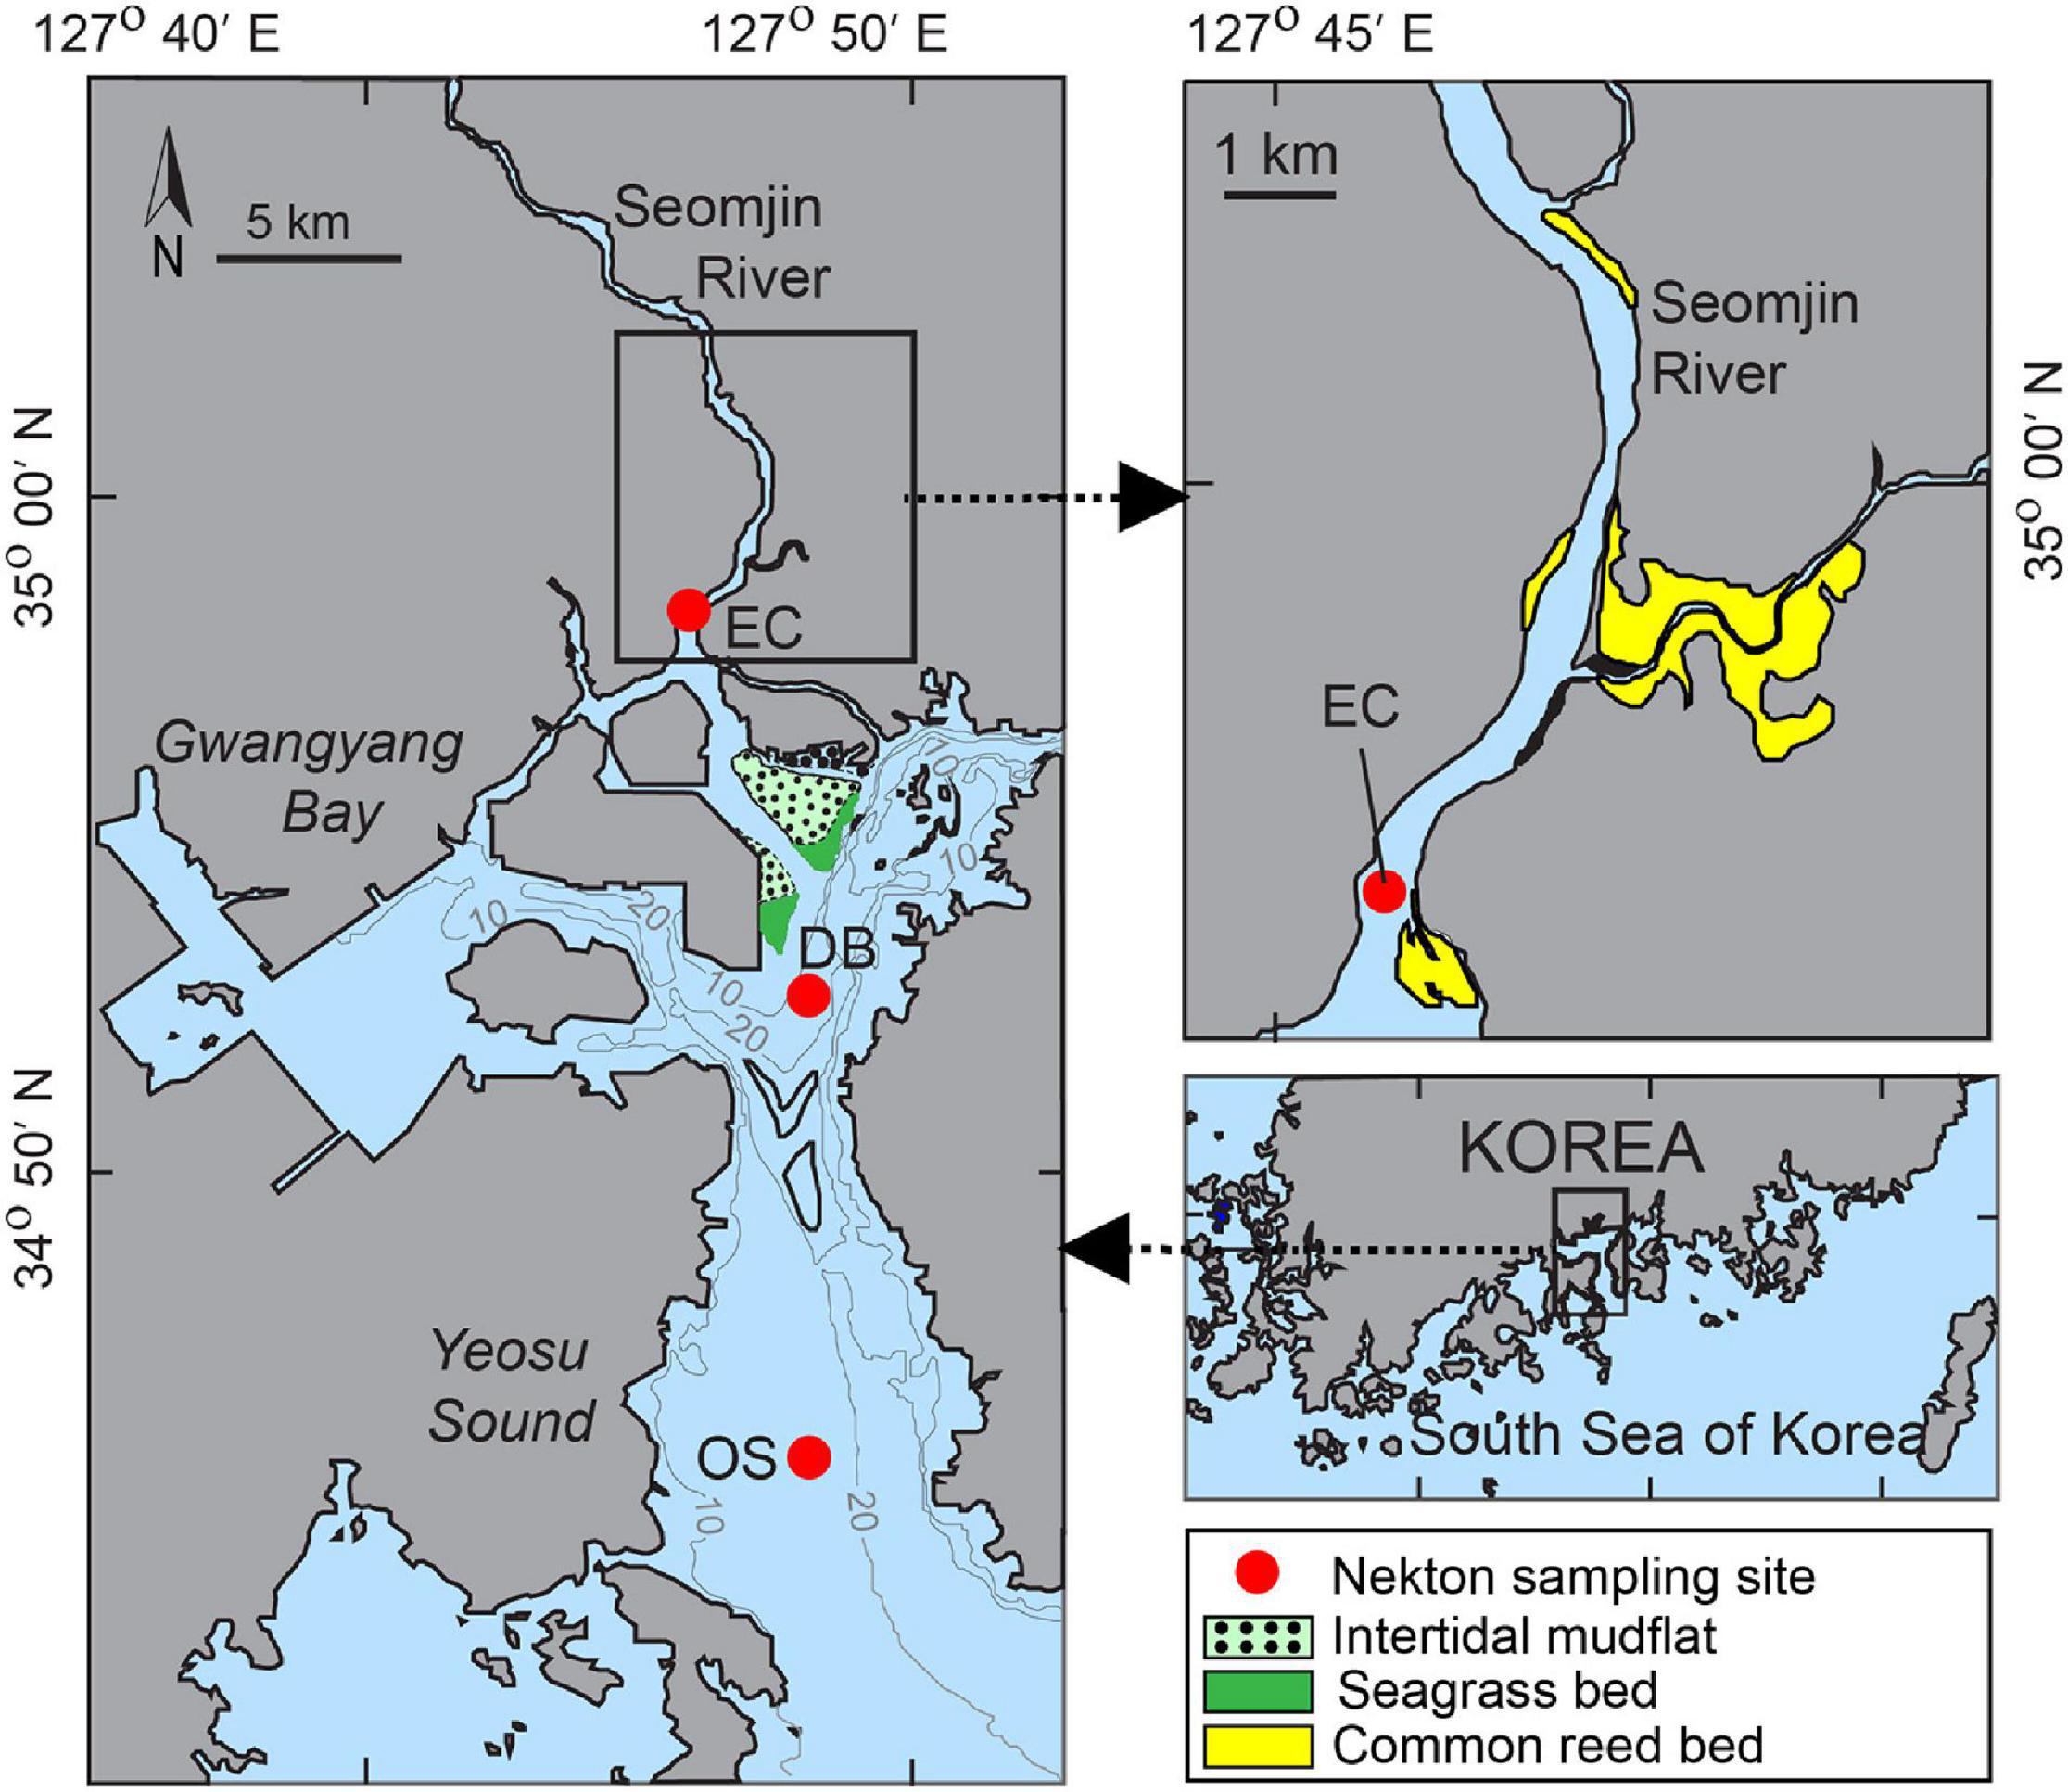
Figure 1. Study area and locations of the sampling sites at the estuarine channel (EC), deep bay (DB), and offshore (OS) areas of Gwangyang Bay. Gray lines represent water depth. Red dots represent nekton, plankton, sediment, and water collection sites. Microphytobenthos (MPB), Phragmites australis, and Zostera marina samples were collected from intertidal mudflat, common reed bed and seagrass bed, respectively.
Here, we investigated the OM sources fueling the nektonic food web in the GYB system and the trophic connectivity between the ecosystem compartments using carbon and nitrogen stable isotope (SI) tracers (termed δ13C and δ15N, respectively). The principles of SI application are that OM sources differ in isotopic composition and increase cumulatively with each trophic transfer (Fry and Sherr, 1989). SI values of a given OM source also differ among habitats, thereby allowing one to trace trophic connectivity between habitats (Fry et al., 2003; Herzka, 2005). The objectives of this study were to: (1) examine seasonal and spatial patterns of nekton communities and their SI signatures and (2) quantify the contribution of OM sources fueling the fish communities in this unique environment.
Materials and Methods
Study Area
GYB is a semi-enclosed basin in the middle of the southern coast of the Korean peninsula (Figure 1). It is connected to the Seomjin River to the north and the Southern Sea of Korea by the 4 km-wide Yeosu Channel to the south. Freshwater discharge from the Seomjin River ranges from 30 to 95 m3 s–1 in winter to 300–400 m3 s–1 in summer (Kim et al., 2014). While the northern estuarine channel is relatively shallow (2.4–8.0 m), the deep bay (DB) channel is 10–30 m (Shaha et al., 2012). The bay is subject to a semi-diurnal tidal cycle with a range of 3.4 and 1.1 m during maximum spring and neap tides, respectively (Korea Hydrography and Oceanographic Administration).1 The average flushing time in the estuarine channel is 7.0 days (Shaha et al., 2012). The catchment area consists of agricultural and forested lands, which also contribute high nutrient loads into the bay via runoff (Kwon et al., 2002). The runoff and seasonal precipitation decrease in spring and winter, but increase in summer (Bae et al., 2008). During the present study, the surface salinity was 6.1–9.8 ppt (in the upper estuarine channel) and 27.1–32.4 ppt (in the DB and offshore sites). The mean surface water temperature varied between 7.2°C in February and 29.5°C in August. The surface sediment is composed of sand near the river mouth, sandy mud and muddy sand in the mesohaline zone, and silty clay and clayey silt in the DB channel (Kang et al., 2014). There are diverse habitat types in the bay which are directly or indirectly connected to the main channel. There are common reed Phragmites australis colonies in the upper estuarine supralittoral wetland. The intertidal muddy sand flats on the northern coast are covered with benthic microalgae producing 35.3 ± 33.5 mg chlorophyll a m–2 y–1 (Kang et al., 2006). There are also patches of eelgrass beds consisting mostly (>99%) Zostera marina along the low tide line near the intertidal muddy sand flats (Kim et al., 2010).
Sample Collection and Processing
We collected samples from the estuarine channel (EC), deep bay (DB), and offshore (OS) sites in GYB (Figure 1). Considering the typical seasonal variability of this temperate region, we collected samples in February (winter), May (spring), and November (fall) 2015, and in August (summer) 2016. For isotopic measurements of OM sources, phytoplankton, suspended particulate organic matter (SPOM), sedimentary organic matter (SOM), MPB, riverine particulate organic matter (RPOM), and specimens of seagrass (Z. marina) and its epiphytes, as well as the dominant salt marsh plant (P. australis), were collected and processed. SPOM was sampled by filtering water through a 60 μm mesh and then onto precombusted (450°C for 4 h) Whatman GF/F filters under a gentle vacuum (150–200 mmHg). Samples of MPB, seagrass and its epiphytes, and salt marsh plant were collected from their respective habitats, while RPOM was sampled from an upper site of the river corridor (Figure 1). Phytoplankton and zooplankton were collected using conical plankton nets (mesh sizes 200 and 20 μm, respectively). Sediment was collected using a 0.12 m2 van Veen grab, and SOM samples were collected by scrapping the top 0.5 cm. The benthic macroinvertebrates (hereafter referred as benthos) were collected by sieving the sediment through a 1-mm mesh net. Collected benthos were identified by microscopy to the lowest possible taxon level and stored for isotopic analysis. Details of the OM sources and benthos sample collection and processing techniques were as described (Kim et al., 2020). Nekton species were collected using a beam trawl (8.5 1.1 m) towed for 1 h at a speed of ∼3.7 km h–1. The mesh size of the net was 18 mm on the wings and belly of the net and 10 mm at the cod end. All individuals were identified to the species level (Choi et al., 2002), counted and weighed on board, and stored on ice for tissue analysis in the laboratory. The abundances of individual species in each sample were adjusted against the trawling area.
For SI analysis, consumers were dissected and muscle tissues were collected. When direct tissue collection was not possible for small benthos, organisms were decalcified with 10% HCl (Ng et al., 2007). When possible, we divided fish individuals into small, medium, and large size classes for SI analyses because δ15N values vary depending on ontogeny (Vinagre et al., 2008). For fish, only white muscle tissues were collected and further defatted in a solution of methanol, chloroform, and water (2:1:0.8) (Bligh and Dyer, 1959) to avoid isotopically lighter fatty tissues (Focken and Becker, 1998). Invertebrate tissues are low in lipid content (<5% dry weight) (NFRDI, 2009), so were not defatted. Collected tissue samples were lyophilized and pulverized to a fine powder with a ball mill (Retsch MM200 Mixer Mill; Hyland Scientific, Stanwood, WA, United States).
Stable Isotope Analysis
The powdered and homogenized samples (∼1.0 mg for plant samples and ∼0.5 mg for animal tissues) were sealed in tin combustion cups, and the whole body of each GF/F filter was wrapped in a tin plate. Sealed samples were then analyzed using an automated elemental analyzer (vario MICRO cube; Hanau, Germany) coupled with an interfaced continuous-flow isotope ratio mass spectrometer (CF-IRMS; IsoPrime 100, Cheadle, United Kingdom). Isotopic values are expressed in delta (δ) notation as parts per million (‰) differences from the conventional standards (Vienna Pee Dee Belemnite and air N2 for carbon and nitrogen, respectively) according to equation (1) (Fry and Sherr, 1989):
where X is 13C or 15N and R is the 13C/12C or 15N/14N ratio, respectively. International standards (USGS-24 for carbon and IAEA-N1 for nitrogen) were used as reference materials for calibration. Analytical precision was ∼0.1‰ for δ13C and ∼0.2‰ for δ15N.
Trophic Level Estimation and Mixing Model Calculation
The trophic levels of consumers were estimated using formula (2).
where λ is the trophic level (TL) of the established baseline (here λ = 2), δ15Nconsumer is the δ15N value of the consumer considered, and δ15NPelagic baseline and δ15NBenthic baseline are the δ15N values of the pelagic and benthic primary consumer baselines, respectively. Because other known pelagic consumers were not consistently found across the sites, mean isotope values of zooplankton were considered to represent the pelagic primary consumer baseline. Similarly, because of the inconsistency of occurrence of any particular species, the mean value of all deposit-feeding invertebrates was used as the benthic primary consumer baseline (Kirstensen et al., 2016). For calculating individual trophic positions without prior information, we assumed equal reliance on the benthic and pelagic baseline (f = 0.5). We used a 15N trophic fractionation factor (TEF) of 3.4‰ as recommended for higher trophic level consumers such as fish (McCutchan et al., 2003).
To estimate the relative importance of pelagic and benthic pathways for OM flow, using both isotope markers, we ran the MixSIAR, a hierarchical Bayesian stable isotope mixing model (MixSIAR package v. 3.1.9; Stock and Semmens, 2016). This isotope modeling technique incorporates the uncertainty in source proportions, trophic enrichment and diet data (Philips et al., 2014). Since nekton move actively between habitats, we ran a 4 source mixing model using pelagic and benthic baseline consumers from both the EC and DB sites. The representative baseline consumers were the same consumers which were used in TL estimation mentioned above. The estimated median proportions of benthic baseline to a species were summed to estimate total benthic contributions to that species. The pelagic proportion was also estimated similarly. The contributions of OMs (estuarine and coastal phytoplankton, MPB, RPOM, P. australis, and Z. marina) to nekton communities were quantified using the MixSIAR model. We ran the mixing model using both isotope markers of consumers and sources with species as a random factor and, site and season as fixed factors. During the mixing model calculations, we used the widely recommended trophic enrichment factors (TEF) of 1.3 ± 0.3‰ and 3.3 ± 0.26 ‰ for δ13C and δ15N, respectively (McCutchan et al., 2003). Prior to use in the model, the consumer isotope values were adjusted with TEF to account the multiple trophic steps from primary consumers. In MixSIAR, we used uninformative priors (i.e., flat) because we did not use specific prey items as sources and intended to assess the flow of carbon from primary producers. The model ran Markov chain Monte Carlo sampling based on the following parameters: chain length = 100,000, burn = 50,000, thin = 50, and chains = 3. Diagnostic tests (Gelmin–Rubin, Heidelberger–Welch, and Geweke) and trace plots were applied to examine for any model convergence. The estimated median proportions of diet were reported as median (%) and associated 95% credible intervals (CI). Whenever the CI exceeded 100% while reporting the pooled values for a source or consumer groups, we reported 100%.
Data Analysis
The distribution of nekton assemblages was visualized with a two-dimensional ordination plot using non-metric multidimensional scaling (nMDS) based on the Bray–Curtis similarity matrix of species abundance. A stress value of 0.05 indicated very good representation of the similarity rankings in the two-dimensional nMDS plot (Clarke and Warwick, 2001). Spatial and seasonal differences in community composition were tested by a two-way crossed analysis of similarity (ANOSIM). The abundance data were transformed logarithmically [log10(x + 1)] before running the nMDS ordination and ANOSIM routines to reduce the effect of highly abundant species. The extents of any significant differences produced by ANOSIM were determined using the R-statistic, which can range from +1 when all species within each community are more similar to each other than to any of the species from other communities, down to approximately 0, when average similarities within and between the communities are the same (Clarke et al., 2014). Analysis of each taxon’s contribution to within-group similarities and between-group dissimilarities was performed by similarity percentages (SIMPER) (Clarke and Warwick, 2001).
The SI values of OM sources and consumers did not satisfy the assumptions of normal distribution (Shapiro–Wilk test; p < 0.05). Therefore, to test for differences among sites, seasons, or consumer groups, multivariate analyses of isotopic signatures were conducted by a permutational analysis of variance (PERMANOVA) based on a Euclidian distance matrix and 9999 permutations of the residuals in a reduced model (Anderson et al., 2008). Before operating PERMANOVA, a positive integer was added to the δ13C values, and both isotope values were transformed by log10 (x + 1). In addition, the homogeneity of dispersions was tested using permutational analysis of multivariate dispersions (PERMDISP). Significant terms were investigated using posteriori pairwise comparisons using the PERMANOVA t statistic.
To assess trophic interactions and resource utilization patterns among communities, isotopic niches were assessed based on Layman metrics (Layman et al., 2007). The isotopic niche is presented as an isotopic (convex) hull area as it does not require normal distribution (Jackson et al., 2011). Any overlap between niches was estimated by an isotopic nestedness (INe) analysis (Cucherousset and Villéger, 2015).
To evaluate trophic connectivity among the fish communities, we estimated the enrichment of δ13C values from their local immobile benthic prey using analysis of covariance (ANCOVA). The site and season were used as fixed factors, and the TL values of nekton were used as co-factors. The coefficient for the covariate (b) from ANCOVA was the observed TEF for the respective site was compared with the widely used TEF value of 1.3‰ (McCutchan et al., 2003).
nMDS, ANOSIM, SIMPER, and PERMANOVA were performed using PRIMER 6 and PERMANOVA + (PRIMER-E Ltd., Plymouth, United Kingdom). Unless otherwise stated in the text, all other tests were performed using IBM SPSS Statistics (v. 21; IBM Corp., Armonk, NY, United States).
Results
Nekton Community Assemblages
In total, 79 species of nekton were identified, consisting of 55 fish, 19 crustaceans, and 5 cephalopod species (Supplementary Table 1). Nekton communities consisted of very few dominant, but many rare species at all three sites. The nMDS ordination indicated that the EC nekton community was separated from the DB and OS ones, except during summer, when all communities were more similar to each other (Figure 2). The ANOSIM statistic also indicated that the community composition was notably different among sites (ANOSIM, R = 0.75, p = 0.043). On the other hand, the communities were highly similar among seasons (ANOSIM, R = 0.20, p = 0.219). All communities were composed predominantly of resident species along with very few migrants at the DB sampling site. The EC community displayed very low abundance and consisted of very few (n = 35) species, with Leiognathus nuchalis (83.2%) being the most dominant. On the other hand, both of the marine communities had more than five times higher abundance and consisted of 56 and 73 species of nekton. The dominant species were L. nuchalis (59.5%) and Setipinna tenuifilis (11.1%) at the DB, and Metapenaeus joyneri (39.6%), Thryssa kammalensis (10.4%), and Trachysalambria curvirostis (9.3%) at the OS site. The SIMPER test revealed that L. nuchalis was the most discriminating species among the three communities (15.3–42.9%) and between seasons (20.9–60.1%).
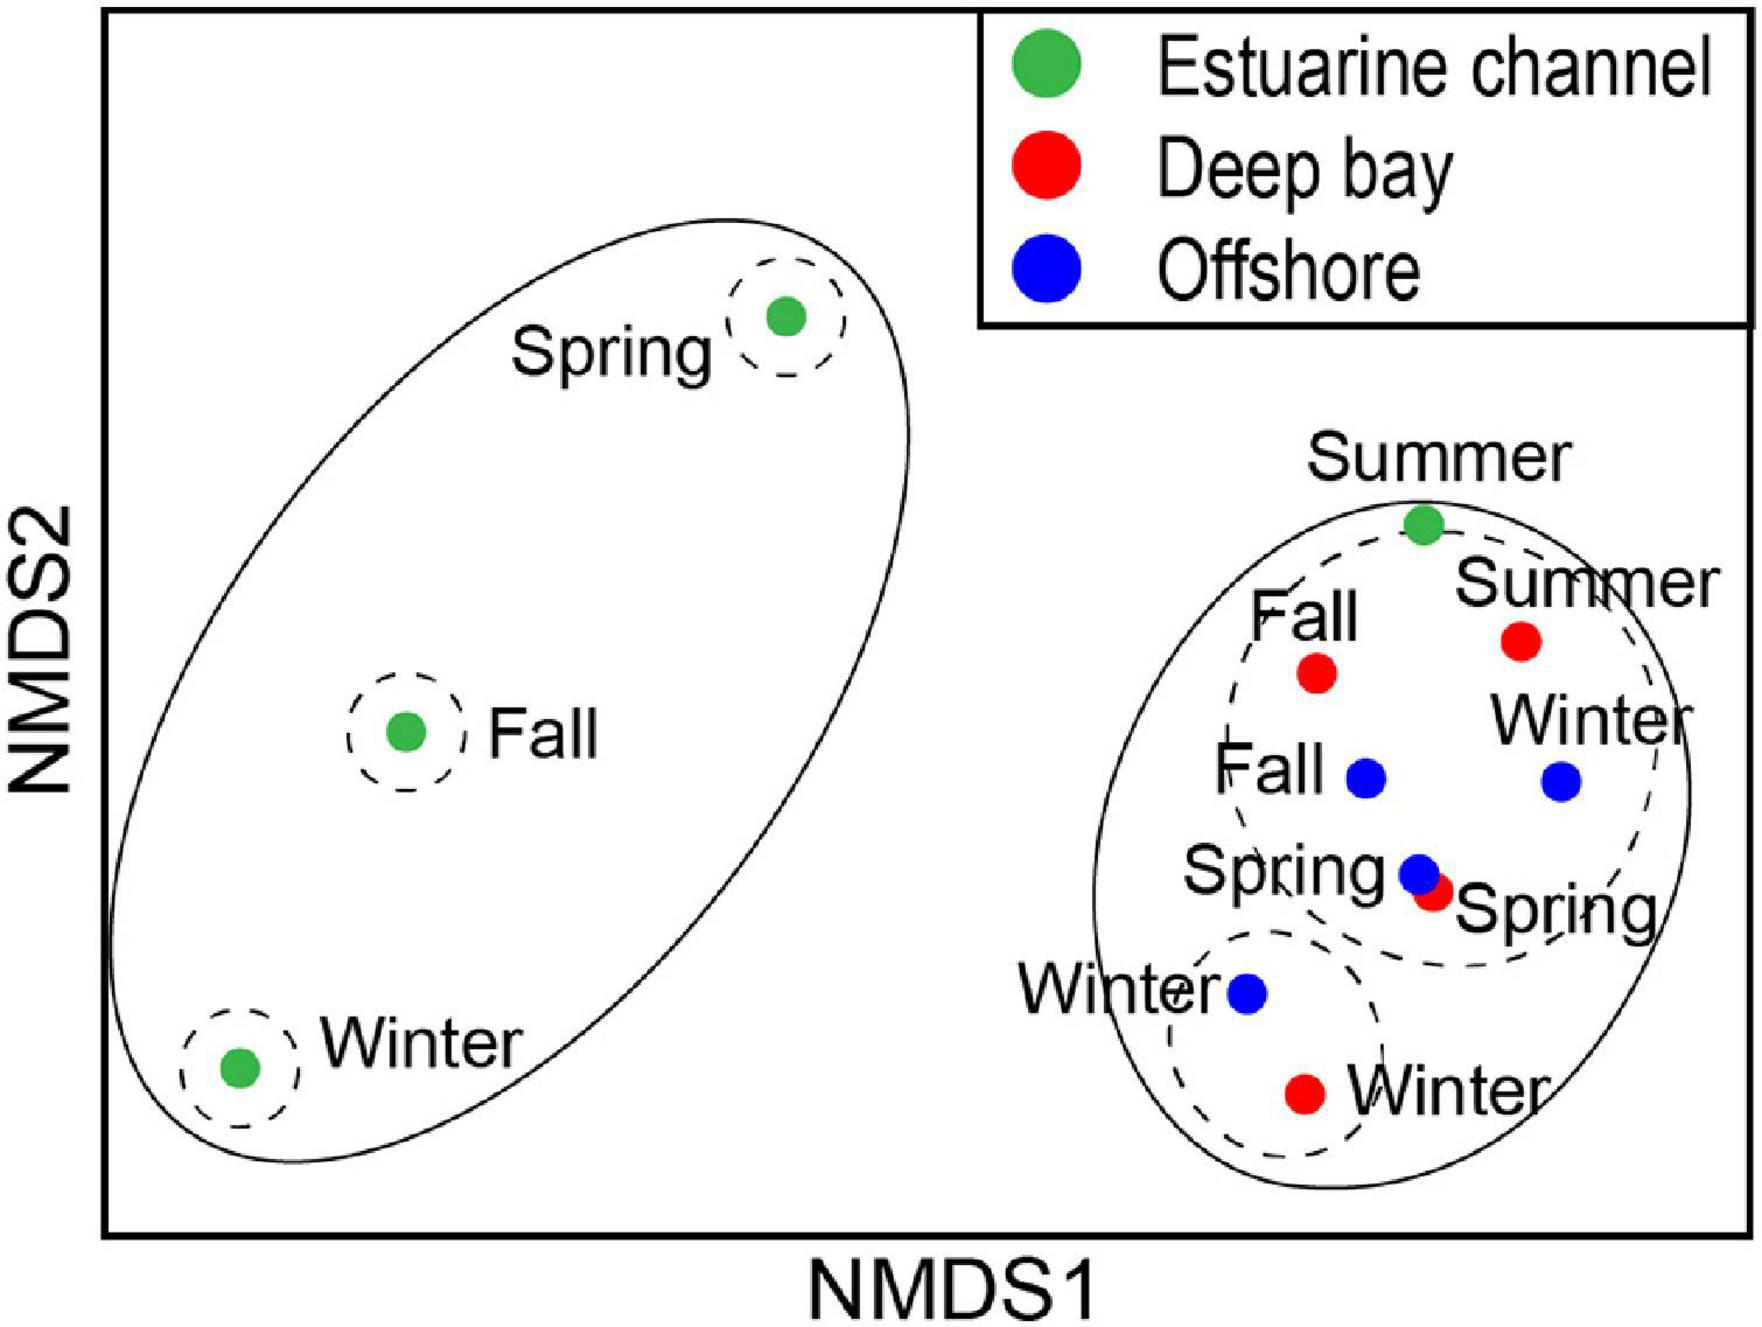
Figure 2. Two-dimensional non-metric multidimensional scaling (nMDS) ordination showing spatially separated nekton community assemblages between estuarine and coastal sites of Gwangyang Bay over four seasons. Solid and dashed lines represent 20 and 40% similarity boundaries, respectively.
δ13C and δ15N Values of Primary Organic Matter Sources
Primary OM sources had statistically distinct δ13C and δ15N values from each other [PERMANOVA, Pseudo-F(7, 54) = 31.219, p = 0.001] ranging from –27.7 to –7.9‰ and from 2.9 to 10.3‰, respectively (Figure 3 and Supplementary Table 1). While P. australis displayed the most negative δ13C value (–27.5 ± 0.2‰), followed by RPOM (–25.7 ± 1.1‰), Z. marina and its epiphytes recorded the highest values (–8.5 ± 0.5‰ and –8.7 ± 0.7‰, respectively), followed by MPB (–14.9 ± 0.5‰). The δ13C values of phytoplankton (–20.9 ± 2.5‰) and SPOM (–22.6 ± 1.9‰) were intermediate between Z. marina-MPB and P. australis-RPOM groups, with that of phytoplankton being slightly higher than that of SPOM (pairwise PERMANOVA, t = 2.921, p = 0.026). While the SOM and SPOM δ13C values were significantly different among sites [PERMANOVA, Pseudo-F(2, 10) = 48.106, p = 0.002 and Pseudo-F(2, 10) = 15.050, p = 0.009, respectively], the seasonal variations were not statistically significant [PERMANOVA, Pseudo-F(3, 10) = 2.327, p = 0.193 and Pseudo-F(3, 10) = 2.231, p = 0.210, respectively]. Indeed, the δ13C values of phytoplankton and SPOM showed broad ranges of –26.3 to –18.4‰ and –26.2 to –20.4‰, respectively. Although there was no statistically significant difference [PERMANOVA, Pseudo-F(2, 10) = 0.547, p = 0.613], the δ13C values of phytoplankton apparently increased from the EC to DB and OS sites. However, the DB and OS phytoplankton values were very overlapping. Therefore, DB and OS phytoplankton values were pooled, and are presented as coastal phytoplankton (CP) (Figure 3). Both SOM and SPOM showed significantly higher δ13C values at the DB and OS than at the ES sites (pairwise PERMANOVA, p < 0.050). At the EC, the mean δ13C value of SPOM (–24.8 ± 0.9‰) was nearly identical to those of RPOM (–25.7 ± 1.1‰) and SOM, but slightly more negative than that of phytoplankton (–22.5 ± 3.5‰), suggesting a high contribution of riverine and/or P. australis-derived POM to the SPOM and SOM pools. By contrast, at the DB and OS sites, the mean δ13C values of SPOM (–21.4 ± 0.9‰ and –21.5 ± 1.0‰) were close to those of SOM (–21.4 ± 1.0‰ and –20.8 ± 0.2‰) and phytoplankton (–20.6 ± 1.9‰ and –19.5 ± 0.9‰).
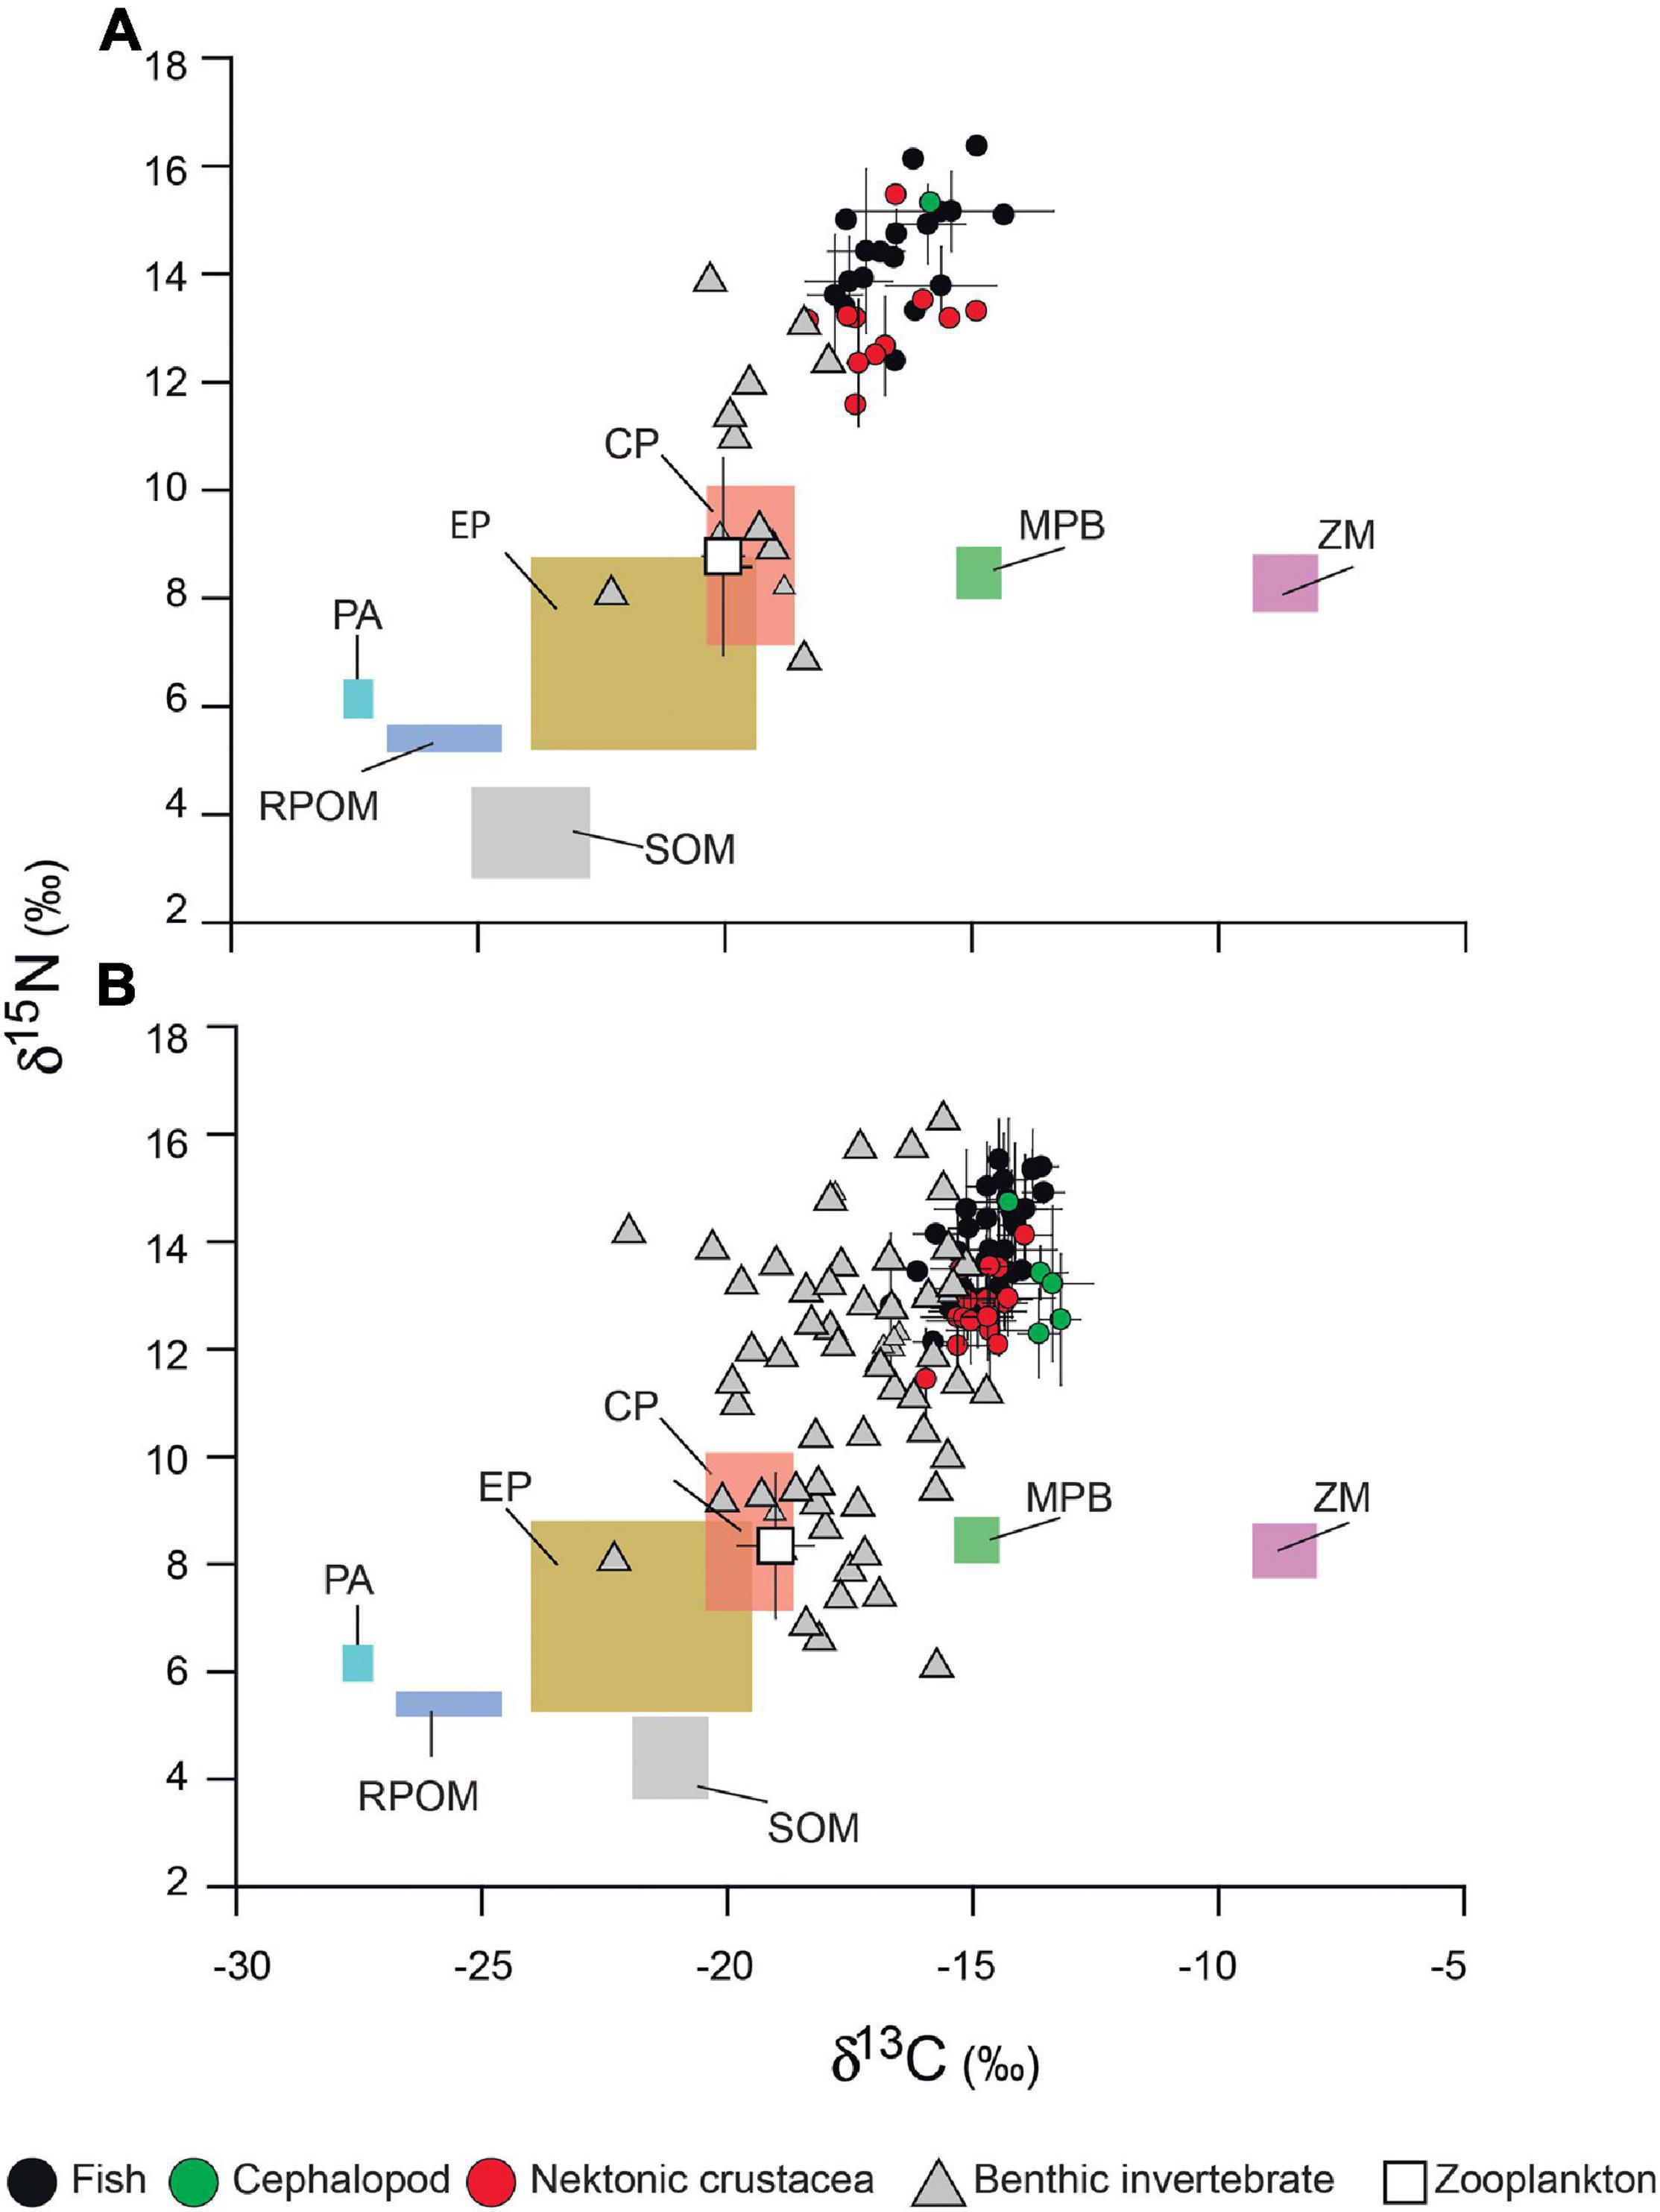
Figure 3. Biplots of δ13C and δ15N values (‰) of primary organic matter sources (color boxes) and consumers from (A) estuarine channel and (B) coastal sites of Gwangyang Bay. When n > 1, data are shown as the mean ± 1 standard deviation. Abbreviations: EP, estuarine phytoplankton; CP, coastal phytoplankton; MPB, microphytobenthos; SOM, sedimentary organic matter; RPOM, riverine particulate organic matter; PA, Phragmites australis; and ZM, Zostera marina.
Similarly, the δ15N values of OM sources exhibited three apparent groups. However, there were no statistically significant spatial or seasonal differences in the δ15N values of OM (PERMANOVA, p > 0.050 for all cases). At the DB site, the mean δ15N value of phytoplankton (6.9 ± 1.7‰) was nearly identical to that of SPOM (7.1 ± 1.3‰). By contrast, at both the EC and OS sites, the mean δ15N value of SPOM (4.4 ± 1.1‰ and 5.9 ± 1.8‰, respectively) was lower than that of phytoplankton (7.5 ± 2.7‰ and 8.6 ± 1.4‰, respectively) by ∼3‰.
Stable Isotope Values of Consumers
The δ13C and δ15N values of nekton lay within narrow ranges of 7.5 and 7.7‰ between the minimum and maximum values, respectively (Figure 3 and Supplementary Table 1). By contrast, the δ13C and δ15N values of sessile benthic invertebrates ranged widely over 9.4 and 12.1‰, respectively. The consumer groups (fish, cephalopods, crustaceans, and benthos) differed significantly in SI values [PERMANOVA, Pseudo-F(4, 327) = 79.110, p = 0.000] (Supplementary Table 2). While both the sessile (low-motility benthos) and motile (nekton) consumers showed a statistically significant spatial difference in δ13C values as revealed by PERMANOVA (p < 0.050 for both groups), there was no statistically significant seasonal difference except cephalopods [PERMANOVA, Pseudo-F(3, 25) = 4.894, p = 0.013 for cephalopods and p > 0.050 for other consumers; Supplementary Table 3A]. However, zooplankton showed no significant difference between sites [PERMANOVA, Pseudo-F(2, 11) = 3.360, p = 0.116]. A pairwise PERMANOVA analysis revealed that the δ13C values of benthos communities differed significantly (p < 0.050) between all sites. On the other hand, the δ13C signatures of nekton at the two marine communities (DB and OS) were not statistically different (pairwise PERMANOVA, p > 0.050), and thus appeared together in the isotopic bi-plot (Figure 3B).
The δ15N values of benthos displayed no spatial or seasonal differences [PERMANOVA, F(2, 61) = 0.691, p = 0.499 and F(2, 61) = 1.054, p = 0.370, respectively; Supplementary Table 3B]. Nekton δ15N values were different between the two marine communities (pairwise PERMANOVA, p = 0.020), although by a very small margin (0.3‰). The nekton δ15N values also varied significantly among seasons (PERMANOVA, p < 0.050 for all groups), with no conspicuous pattern.
Isotopic Niche of Consumers
The consumer isotopic niche of different communities overlapped among them, indicating resource sharing by motile consumers. Because there was no seasonal difference in the δ13C for all consumer groups and δ15N values for most groups (see section “Stable Isotope Values of Consumers”), seasonal isotopic values were pooled at each site. The isotopic niche of benthos communities exhibited a broader total area (TA = 24.9–27.5) compared with that of nekton (TA = 13.6–17.8). The isotopic niches of the two marine communities overlapped closely (INes > 0.700). Niche overlap of EC with DB and OS communities varied among consumer groups (Figure 4). While fish and cephalopods communities shared a considerable isotopic niche area (INes = 0.241–0.388), the relatively less-motile crustaceans and sessile benthos had very low or negligible overlap (INes = 0.000–0.235) between the EC and marine communities (Figure 4).
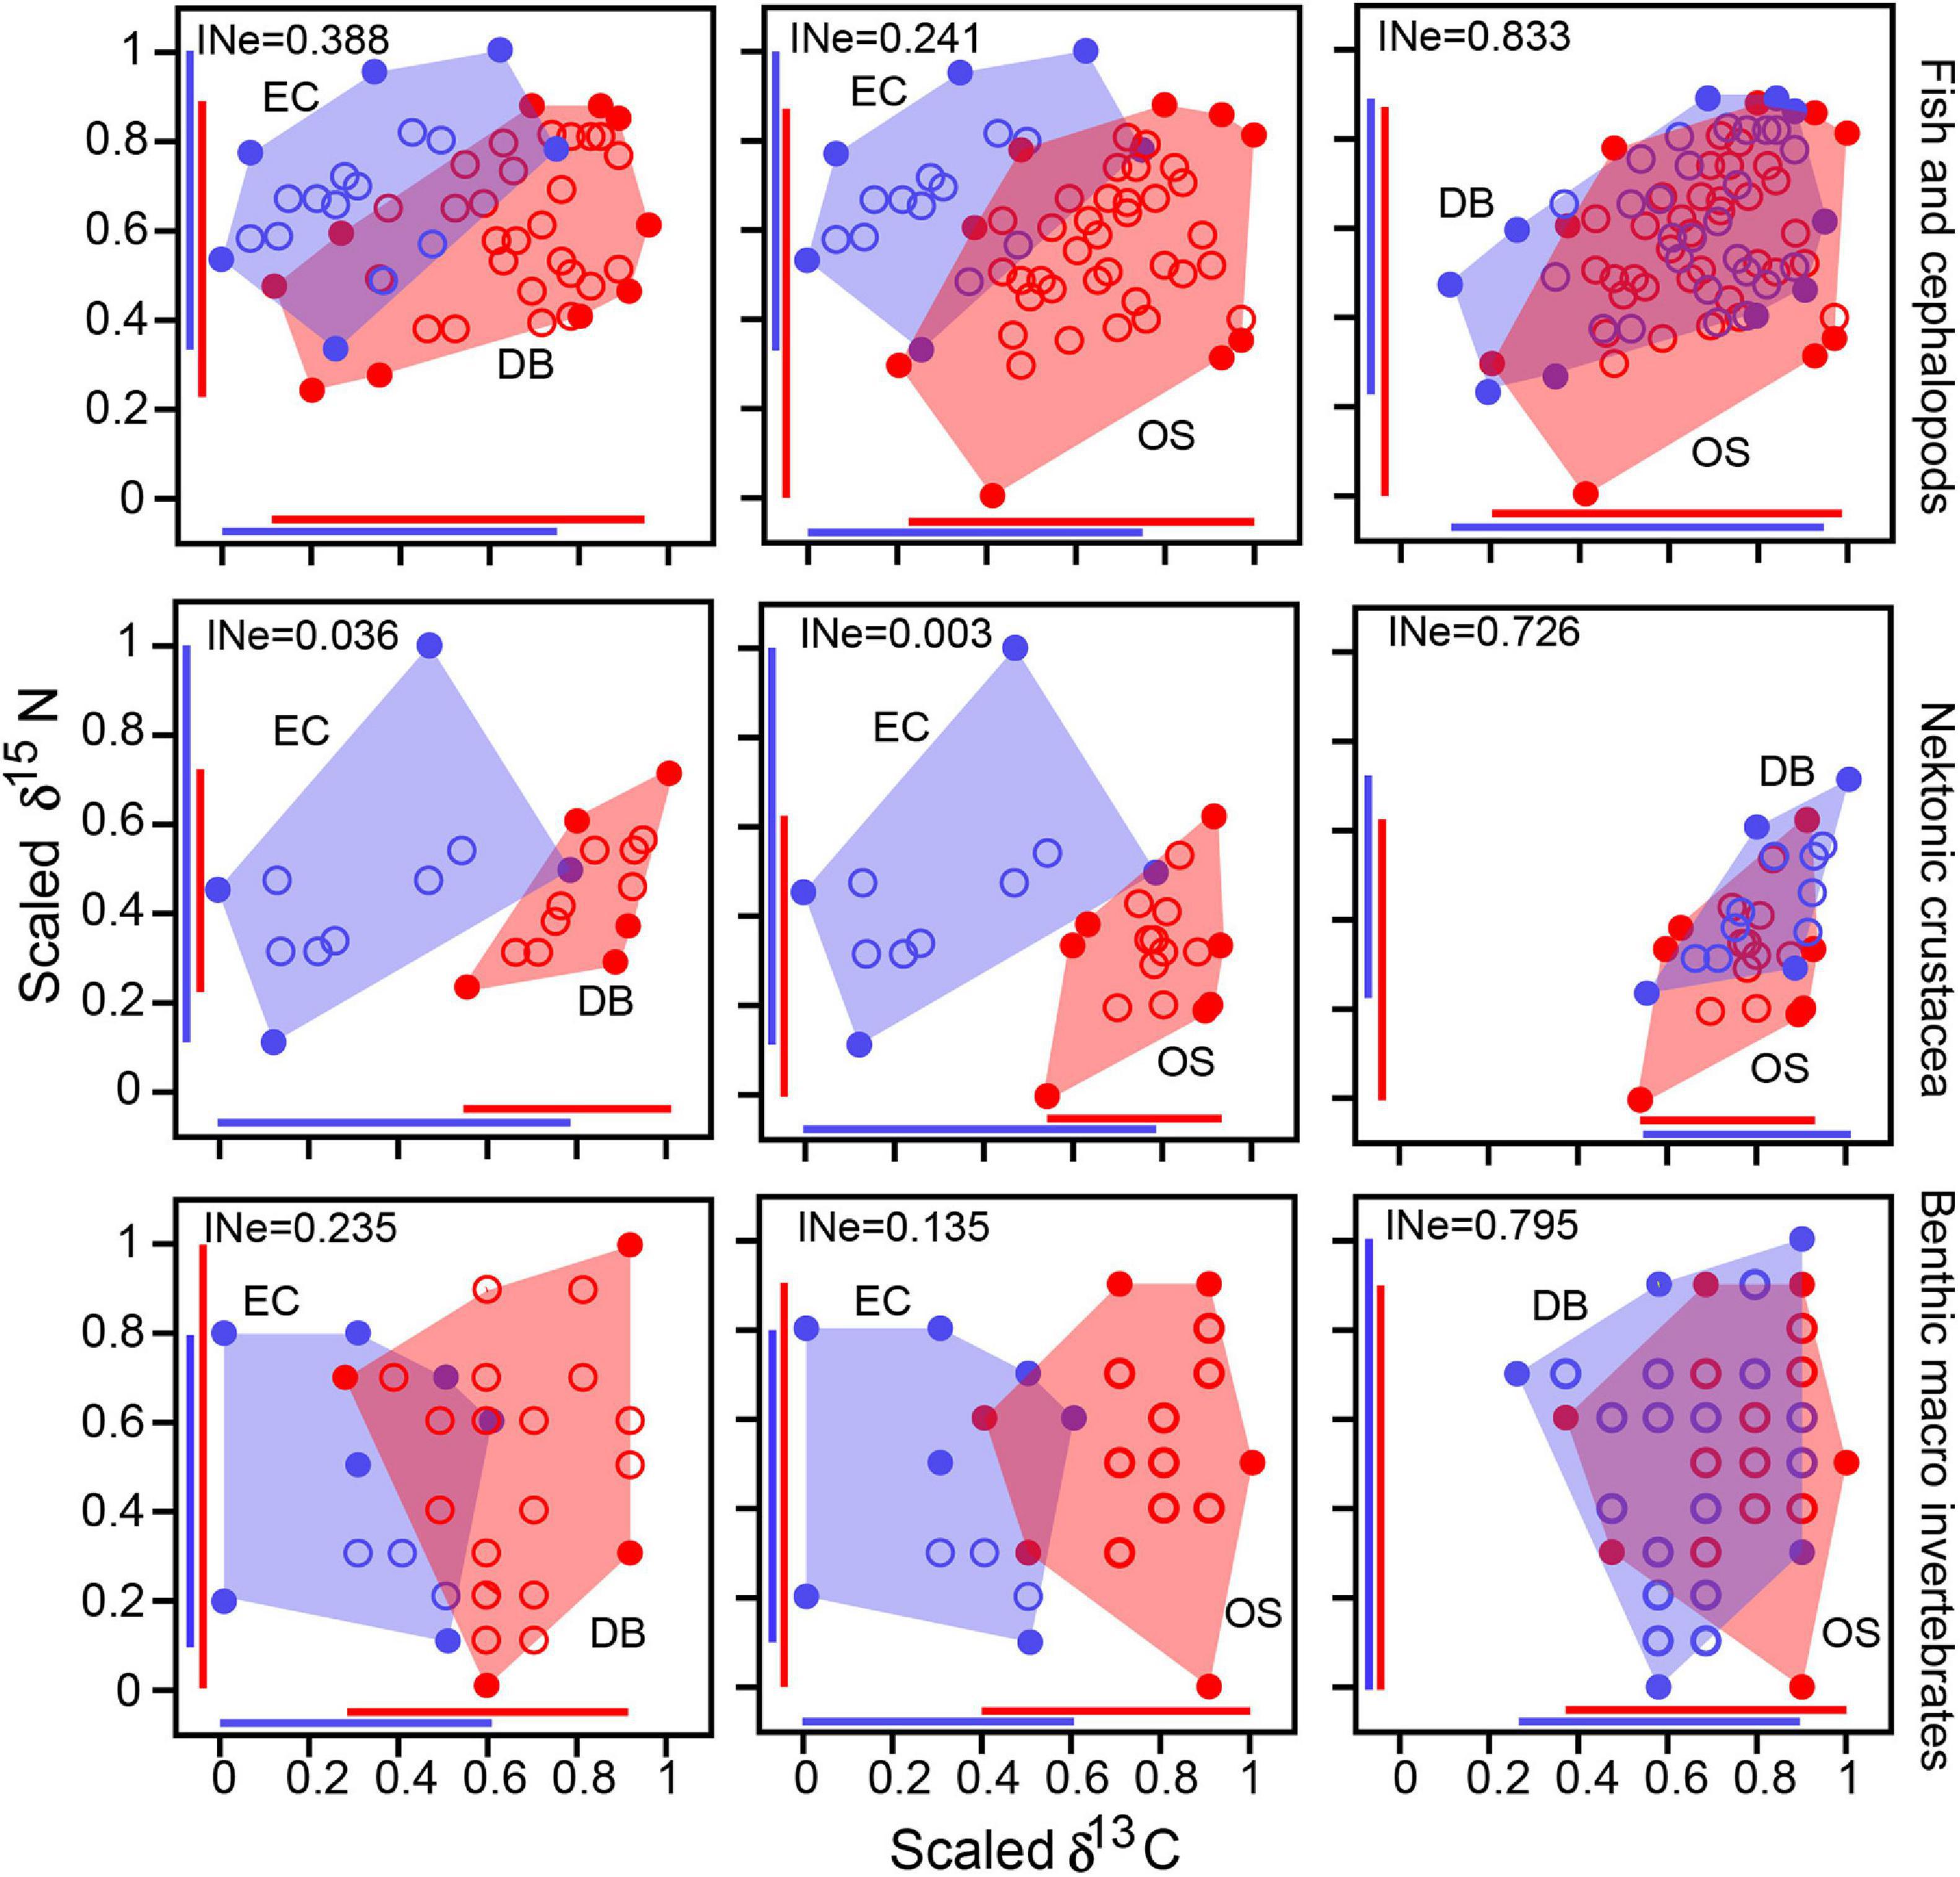
Figure 4. Isotopic niche overlap and estimated isotopic nestedness (INe), illustrating greater resource sharing by highly mobile nekton than that of sessile consumers of three sites from Gwangyang Bay.
Nekton Trophic Level and Proportion of Benthic and Pelagic Pathways
The estimated mean TL of nekton was 3.3 ± 0.4, with a range of 2.4–4.1 (Supplementary Table 1), revealing that they fed at multiple TLs and were mostly carnivorous. The small pelagic cardinalfish (Apogon lineatus) and several small omnivorous crustacean species, including Fenneropenaeus chinensis, Portunus trituberculatus, and Crangon hakodatei, were among the low TL nekton species (2.5–2.7). By contrast, piscivorous fish species, such as the Japanese sea bass Lateolabrax japonicas, rockfish Sebastes koreanus, and Grass puffer Takifugu niphobles, were among the high TL consumers (3.8–4.2). The TL of nekton differed among sites as well as groups [fish, cephalopods, and crustaceans; PERMANOVA, Pseudo-F(2, 140) = 7.847, p = 0.001 and Pseudo-F(2, 140) = 21.593, p = 0.001, respectively]. On a community scale, fish and cephalopods displayed higher TL values than did crustacean nekton (pairwise PERMANOVA, p > 0.050). The community-wide TL was higher at the OS site (3.4 ± 0.4) compared with the other two communities (3.2 ± 0.3 and 3.0 ± 0.3 for DB and OS, respectively; pairwise PERMANOVA, p < 0.050).
The SI mixing model revealed that most fish species and all crustacean species showed extremely high benthic dependency (BP > 0.8), while few pelagic fish species, such as Saurida undosquamis and Thryssa kammalensis, showed considerable pelagic-affinity dependency (BP < 0.7) (Supplementary Table 1).
Trophic Enrichment of δ13C in Nekton
The SI values of DB and OS nekton and their benthic invertebrate prey were closely related and aligned with the isotopic enrichment line from prey to predator (Figure 3). By contrast, the EC nekton species showed a split alignment from the primary consumers and had relatively higher δ13C values. The estimated TEFs of δ13C were 2.2 ± 0.4‰, 1.7 ± 0.3‰, and 1.1 ± 0.2‰ for the EC, DB, and OS sites, respectively (Supplementary Table 4). The calculated δ13C value based on the observed TEF for estuarine nekton was higher than expected, displaying a positive shift from the expected mixing line (Figure 5). By contrast, the observed mixing lines at the DB and OS sites were similar to the expected ones.
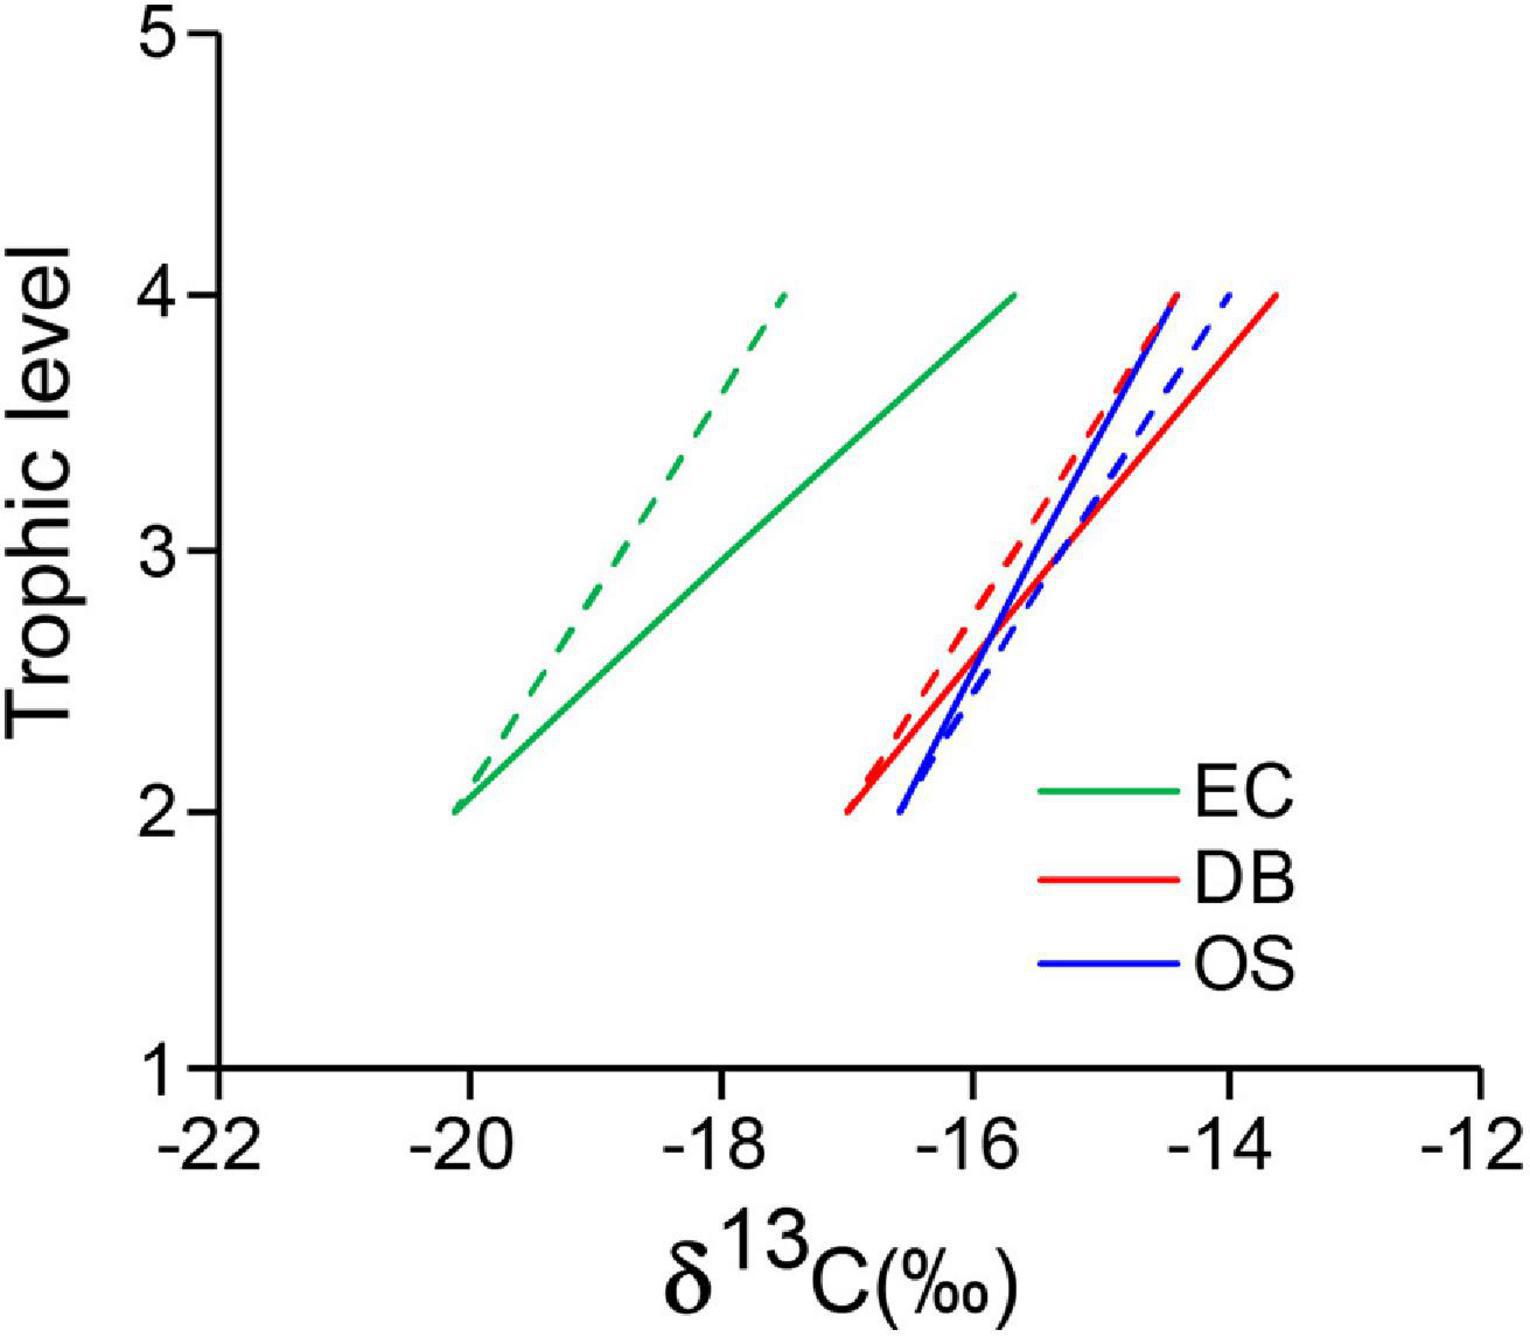
Figure 5. The isotopic alignments from primary consumer to higher trophic level consumers showing, a positive deviation of observed δ13C values (solid lines) from the expected (dashed lines) values, indicating assimilation of δ13C-enriched coastal resources (DB and OS) in estuarine (EC) nekton.
Isotope Mixing Model Calculations
Posterior densities of proportional contribution estimates of OMs revealed that phytoplankton were the primary OM sources fueling the nektonic food web, followed by MPB (Figure 6). The relative contribution of each OM source to the diet of consumers differed between sites and nekton types. The median contribution of phytoplankton ranged from 49.9% (CI, 10.1–100%) in EC crustaceans to 63.7% (CI, 20–100%) in the DB/OS fish and cephalopods (Supplementary Table 5). In general, the median contribution of coastal phytoplankton was substantially higher than that of estuarine phytoplankton in all cases, except for the EC crustaceans. While the highest contribution of estuarine phytoplankton in terms of the median proportion was to EC crustaceans, it was very low (<5.0%) to fish and cephalopods at both sites. The median proportion of MPB ranged between 2.3% (CI, 0.0–52.4%) and 21.8% (CI, 0.0–44.6%). While the role of RPOM (0.3–2.0%) was negligible, other OM sources made substantial contributions (3.0–17.8%) and were mostly restricted to sites closer to the habitats of respective OM sources. For instance, the contribution of P. australis was higher to the EC site nekton, and Z. marina mostly supported the DB and OS communities (Figure 6 and Supplementary Table 5).
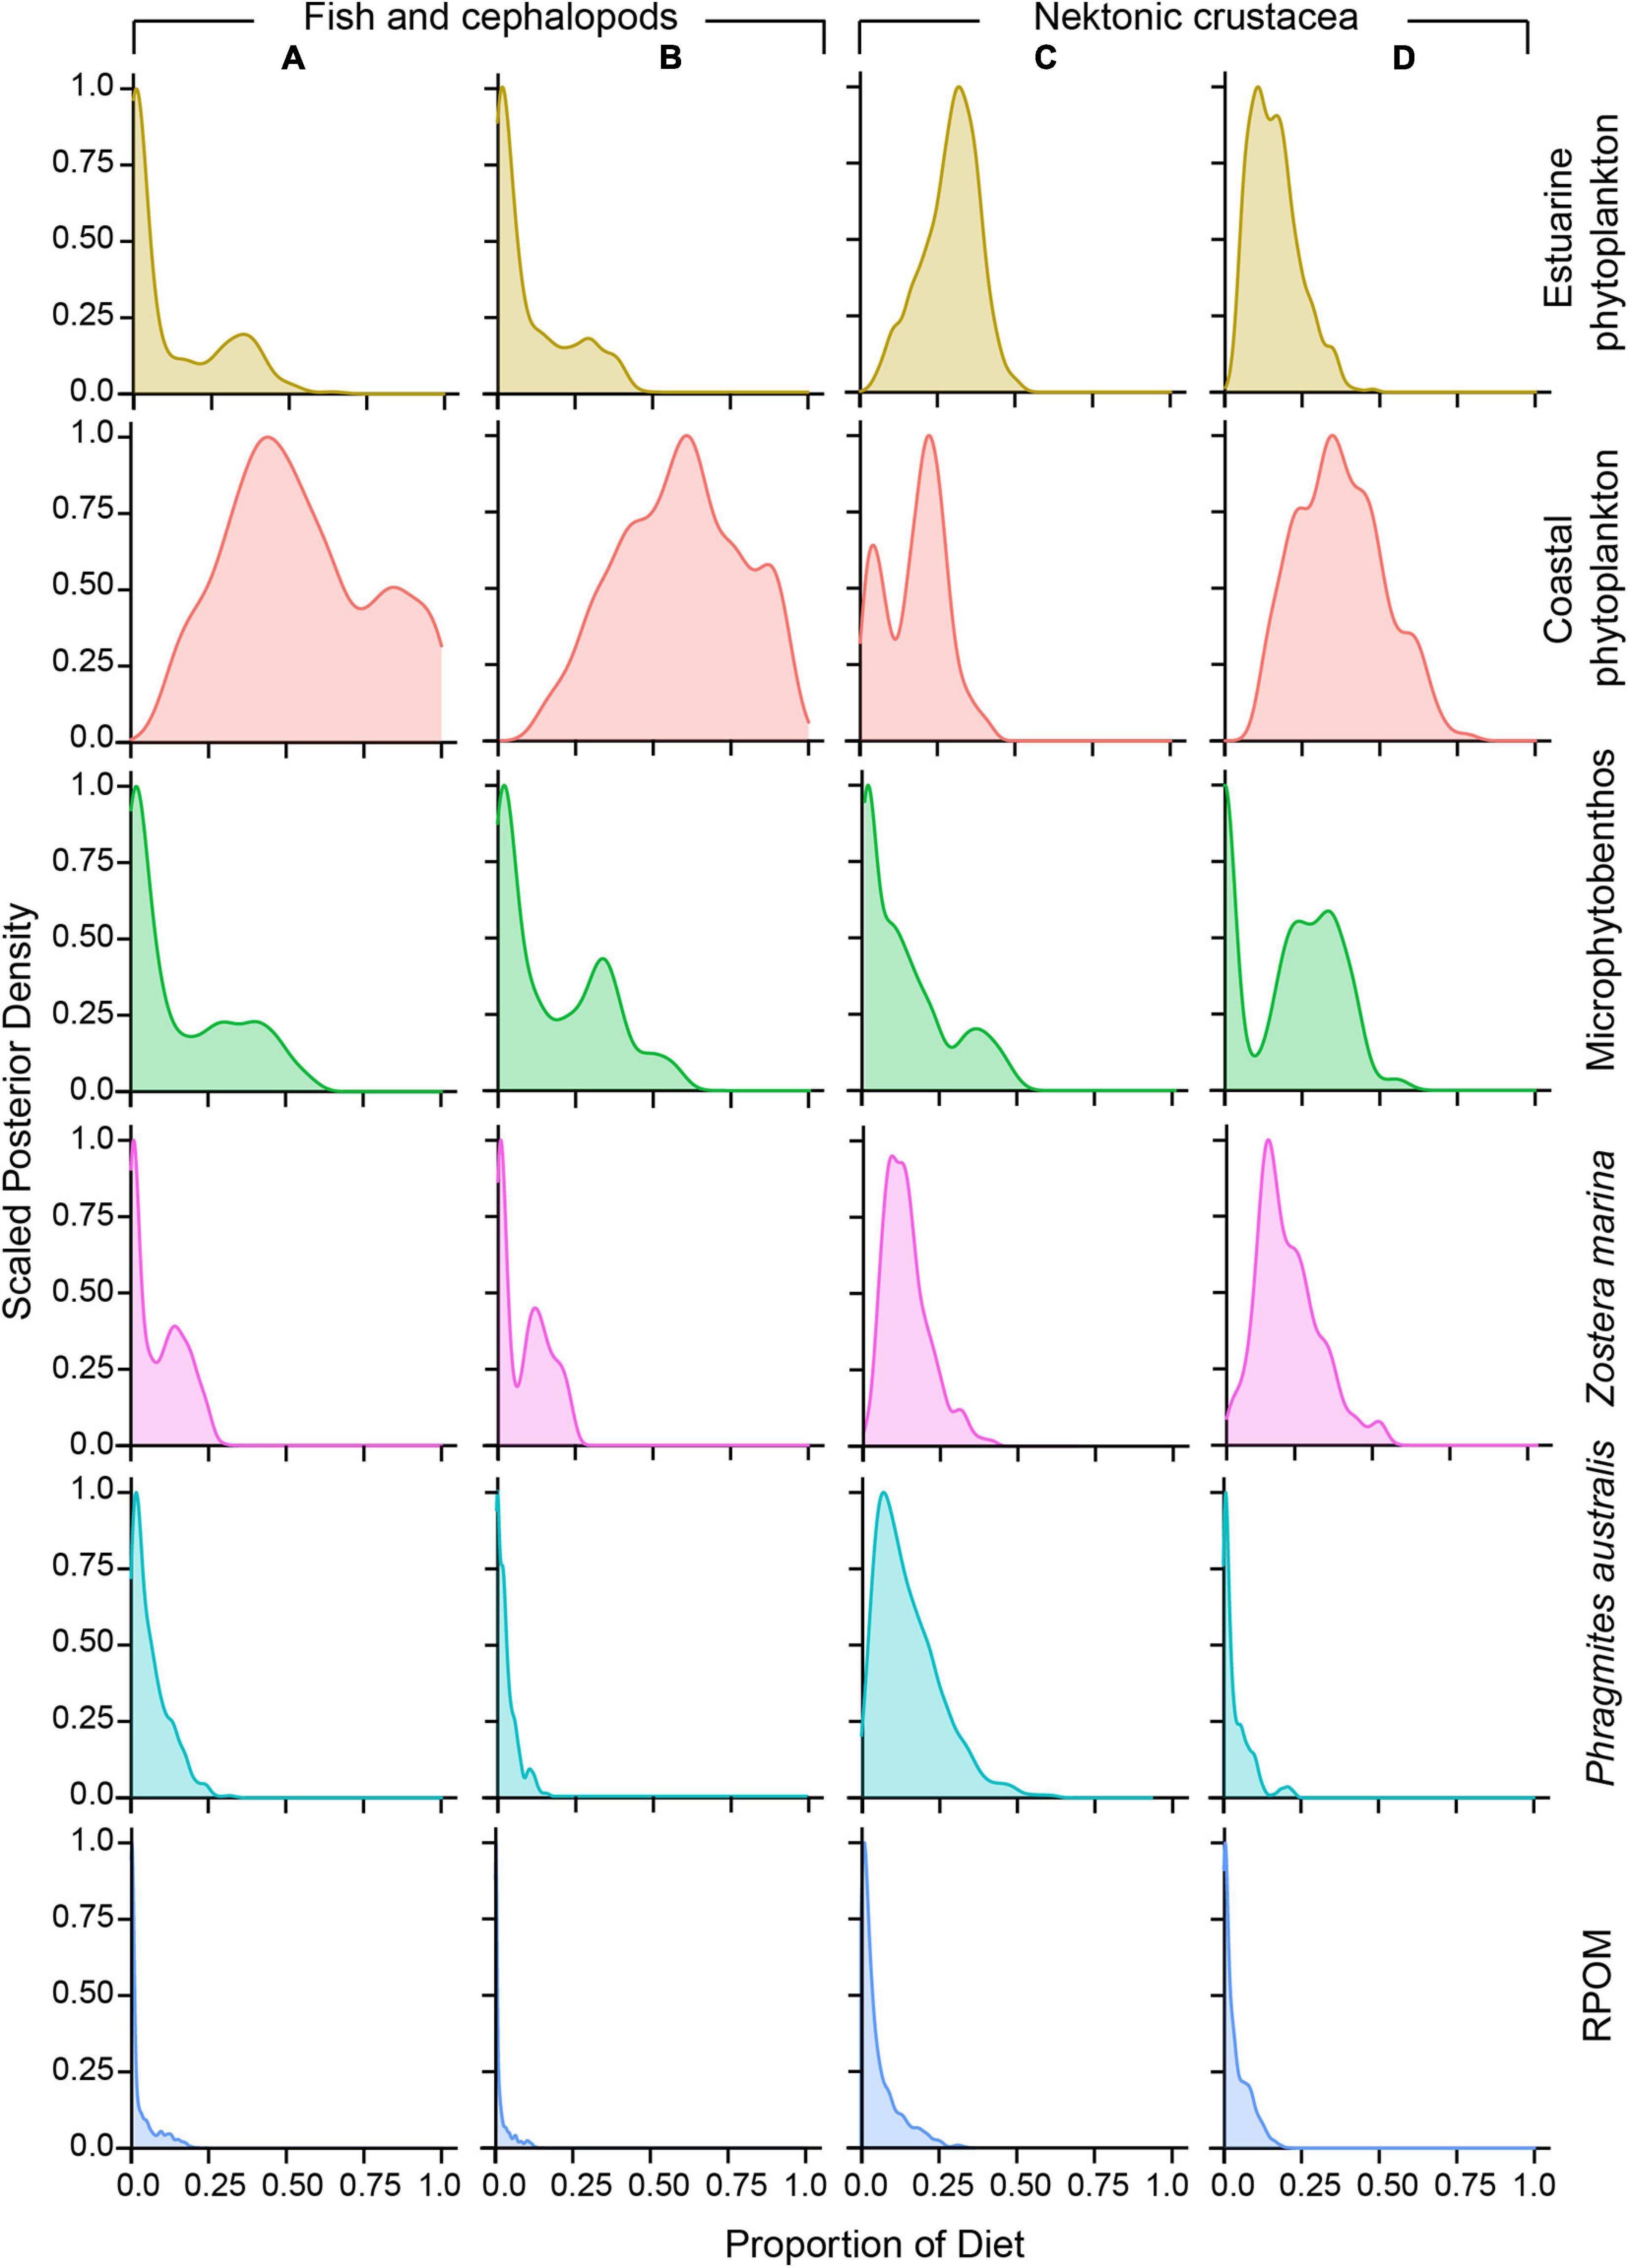
Figure 6. Scaled posterior density of the proportions of the contribution of putative primary organic matter sources fueling the estuarine channel (EC; A,C) and deep-bay and offshore (DB and OS sites; B,D) nekton communities.
Discussion
Our results demonstrated that fish food webs were primarily fueled by phytoplankton-derived OM in this temperate coastal embayment exposed to high riverine discharge. Other primary producers, including benthic microalgae, seagrass (eelgrass), and salt marsh plants (common reeds), provided considerable trophic subsidies (Figure 6). The terrestrial-origin OM made very limited contributions to estuarine and coastal food webs. The dominance of phytoplankton-derived OM was consistent across estuarine, deep-bay, and offshore fish food webs, despite substantial spatiotemporal heterogeneity in habitat characteristics and community assemblages. Our results provide a contrasting perspective to other estuarine and nearshore ecosystems whose food webs are highly dependent on exported terrestrial and wetland detritus with high river discharges (Odum, 1980; Lee, 2000; Connolly et al., 2009; Young et al., 2020). We further demonstrated that highly mobile adult estuarine fish fed more on coastal resources over the estuarine ones, highlighting the importance of coastal food webs for such species.
In GYB, previously reported studies have evaluated the dynamics of OM sources and their biotic-abiotic drivers (Lee et al., 2017; Bibi et al., 2020). The flow of OM to the benthic primary consumers has been reported in similar space and time frame to this study (Kim et al., 2020). However, the mobility of nekton adds more dimensions to dynamics of higher trophic level consumers like fish, which are limited within the lower trophic level macroinvertebrates. Although we have reported the OM flow to dominant fish taxa through primary consumers in order to explain the patterns of multitrophic (plankton, primary and secondary consumers) community structures (Kang et al., 2020), the scope for incorporating community wide approach for nekton was limited. In this study, we quantified and elaborately evaluated the OM sources supporting nekton food web by incorporating intergroup variability and mobility of consumers, and further established the findings in multitrophic study (Kang et al., 2020).
Estuarine and coastal nekton communities are generally characterized by many rare species (Magurran and Henderson, 2003) and spatiotemporally distributed species assemblages (Whitfield et al., 2012; Rees et al., 2018). The low species abundance and the spatial pattern in community composition found here were very similar to other studies in GYB and surrounding coastal areas (Seo et al., 2013; Kim et al., 2018). However, we observed inconclusive seasonal patterns in species composition, which could arise from the highly random distribution of species, very low numbers of seasonal migrants, and stable prey communities for resident species. For instance, the summer nekton community at the EC site had a greater similarity with DB than with EC communities in other seasons (Figure 2). Increased species richness at the EC site during summer indicated that elevated water depth and higher upstream salinity during high tides in summer (Lee et al., 2018) facilitated daily migration of small juvenile fish species from the DB. Furthermore, the low abundance at the EC site and very few dominant species across sites in GYB restricted the selection of ecologically meaningful indicator species in this study. While dominant species are good for the interpretation of many ecosystem processes, rare species often provide a unique functional diversity that is crucial for sustainable ecosystems (Chapman et al., 2018). Therefore, a multispecies approach was needed to understand the use of OM by nekton. In a multispecies assessment, species are often categorized into functional groups based on existing knowledge on their feeding habits (Kang et al., 2015; Park et al., 2015). However, the lack of reliable information on feeding habits of many species and their ontogenic classes restricted such grouping of species in the present study. Very narrow ranges of SI values within sites also limited the scope for meaningful SI-based cluster analysis (Supplementary Figures 1A,B). Therefore, individual SI values were used for multivariate and other numerical analyses.
Primary Organic Matter Sources
Six different primary OM sources (estuarine and coastal phytoplankton, benthic microalgae, seagrass, saltmarsh plant, and riverine OM) those were isotopically distinct and therefore suitable for tracing trophic contributions to consumers, were identified in the present study. The mean SI values of P. australis, Z. marina, and MPB were highly distinguishable from each other, and the ranges of each OM source were similar to those reported by previous studies in GYB and other systems around the Korean peninsula (Kang et al., 2003, 2006; Park et al., 2017; Kim et al., 2020). At the EC site, the extremely low δ13C values of RPOM and P. australis clearly represented river-born terrestrial OM (Connolly et al., 2009). However, we regarded P. australis as a separate OM source considering the potential on-site consumption of fresh or decomposed plant material. While the primary producers (P. australis, Z. marina, and MPB) from the interconnected habitats were highly separated in the iso-space, the main channel pelagic OM (phytoplankton and SPOM) were very close in δ13C values (Figure 3). In shallow estuarine and coastal waters, SPOM samples primarily represent a mixture of resuspended SOM, fresh and decomposed small plankton forms, and other detritus. In this study, the SI values of estuarine SPOM indicated a mixture of RPOM, resuspended SOM, and phytoplankton (Figure 3; Kim et al., 2020). Although SOM showed considerably lower δ15N values than did pelagic sources at the three sites, SOM primarily depend on deposition of SPOM, as indicated by negligible riverine–terrestrial OM transport by the Seomjin River and high pelagic chlorophyll a concentrations (Bibi et al., 2020). The benthic microalgae have been reported to contribute significantly to SOM in shallow areas similar to our EC site (Bergamino et al., 2018). However, the considerable difference between MPB and SOM δ13C values suggests very limited or no contribution of intertidal MPB to main channel SOM pool in our study area. Previous studies of SI and biochemical composition confirmed that phytoplankton determine the composition of SPOM and SOM in GYB (Kwon et al., 2002; Lee et al., 2017; Bibi et al., 2020; Kim et al., 2020).
Previous studies also suggested that the SPOM represents a dynamic pool of autochthonous and allochthonous sources and is not sufficiently robust to be used as a food source, especially in estuaries (Kobayashi et al., 2011). Therefore, SPOM and SOM were ruled out as distinct primary suppliers, leaving phytoplankton as the only meaningful pelagic OM source within GYB. The δ13C values of EC phytoplankton displayed greater seasonal variability with a broader range (4.9‰) compared with the DB and OS sites. This difference in seasonal variability of phytoplankton δ13C values could be explained by increased marine influence at the EC site during high tides in dry seasons (Lee et al., 2018), which resulted in the accumulation of 13C-enriched isotope signatures of marine origin (Fry, 2002). Although the abovementioned seasonal variability resulted in overlaps in SI ranges of phytoplankton between the EC and DB/OS sites (Figure 3), phytoplankton δ13C values demonstrated a classical increase along the salinity gradient from estuarine to marine sites because of the higher utilization of bicarbonate than of CO2 by marine algae (Fry, 2002). Therefore, the estuarine and coastal phytoplankton were considered distinct sources, which allowed us to distinguish resource utilization patterns between the two habitat compartments.
Contribution of Organic Matter Sources to Fish Food Webs
We found that the SI values of nekton were similar to those reported previously in this coastal area (Kang et al., 2015), but differed from other large estuarine and nearshore ecosystems where nekton display broad ranges of δ13C values (Connolly et al., 2009; França et al., 2011; Young et al., 2020). Furthermore, the higher δ13C values of nekton found here were similar to those of open coastal ecosystems heavily supported by autochthonous pelagic primary production (Selleslagh et al., 2015; Park et al., 2020). Nekton δ13C values were closer to benthic primary consumers (3.2‰ and 2.3‰ at EC and DB/OS sites, respectively) than to that of the pelagic zooplankton (4.4 and 3.6‰ at the EC and DB/OS sites, respectively), suggesting that nekton depended more on benthic than on pelagic prey. Indeed, the estimated high benthic affinity prey value (BP > 0.8 for most species) confirms the prevalence of benthic pathways for nektonic consumers (Supplementary Table 1). This high benthic dependency is common in shallow coastal and estuarine food webs (Claudino et al., 2013; Vinagre et al., 2019).
The alignment of phytoplankton, primary consumers (zooplankton and benthos), and nekton on the C and N iso-space (Figure 3) illustrate their trophic connection, suggesting that nekton most likely obtain their basal nutrition from phytoplankton through prey–predator interactions with primary consumers. The nekton, particularly fish and cephalopods, had higher δ13C values (on average 5.0 and 2.3‰ at the EC and DB/OS sites, respectively) than did benthos with similar δ15N values. This result suggests that motile consumers obtain a considerable proportion of their diets from prey that utilize 13C-enriched OM, such as MPB or ZM. By contrast, isotopically distant marsh plant- and RPOM-derived OM are less likely to contribute to nekton with higher δ13C values. Indeed, our MixSIAR mixing model estimates also demonstrate dominant trophic contributions by estuarine and coastal phytoplankton, followed by MPB and ZM. However, the bimodal posterior density distributions of OM source proportions, particularly coastal phytoplankton, MPB and Z. marina indicate within-group differences in resource utilization patterns (Figure 6). Therefore, in addition to median values, the mean values of diet proportions were considered to describe the trophic contributions of individual sources to particular groups of consumers (Figure 7). The dominance of phytoplankton-driven OM to fish food webs in our study were clearly different from other studies in nearshore and coastal areas (Connolly et al., 2009; de Lecea et al., 2016; McMahon et al., 2021), but was similar to coastal lagoon food webs (Mont’Alverne et al., 2016) and offshore food webs of Daya Bay (Ying et al., 2020). The low phytoplankton contribution to other temperate food webs were mostly associated with low phytoplankton production due to high turbidity despite nutrient availability (Hoffman et al., 2008; Shang et al., 2008). In the Upper San Francisco Estuary, at low turbid areas, phytoplankton was the most important OM source, but higher emergent vegetation coverage limits the contribution to below 50% (Young et al., 2020), a much lower value than GYB, where emergent vegetation is limited. The high abundance of anthropogenic OM sources, as in the case of Yellow River Estuary (Liu et al., 2020) and Pearl River Estuary (Lee, 2000) reduced the phytoplankton driven OM contribution during some seasons. The short residence time of water mass in the GYB further makes the already limited anthropogenic OM even more unavailable (Bibi et al., 2020). On the other hand, the contributions of MPB were substantially lower than the intertidal nekton in GYB (Kang et al., 2015). The within-group variability in resource utilization indicated in the calculated bimodal density distributions could be explained by factors such as differences in the degree of motility, direction of foraging migration, preferential feeding on pelagic or benthic sources, and transient vs. resident species. For example, T. kammalensis, is nearly fully dependent on phytoplankton because of its exclusive planktivorous feeding habit (Baek et al., 2014), whereas another small fish, L. nuchalis, can feed on benthic isopods and amphipods and incorporate non-phytoplankton sources via detritus food webs (Choi et al., 2020). Large and active predatory fish mostly prey in the MC, but small fish often move to intertidal areas and obtain MPB-derived OM (Kang et al., 2015).
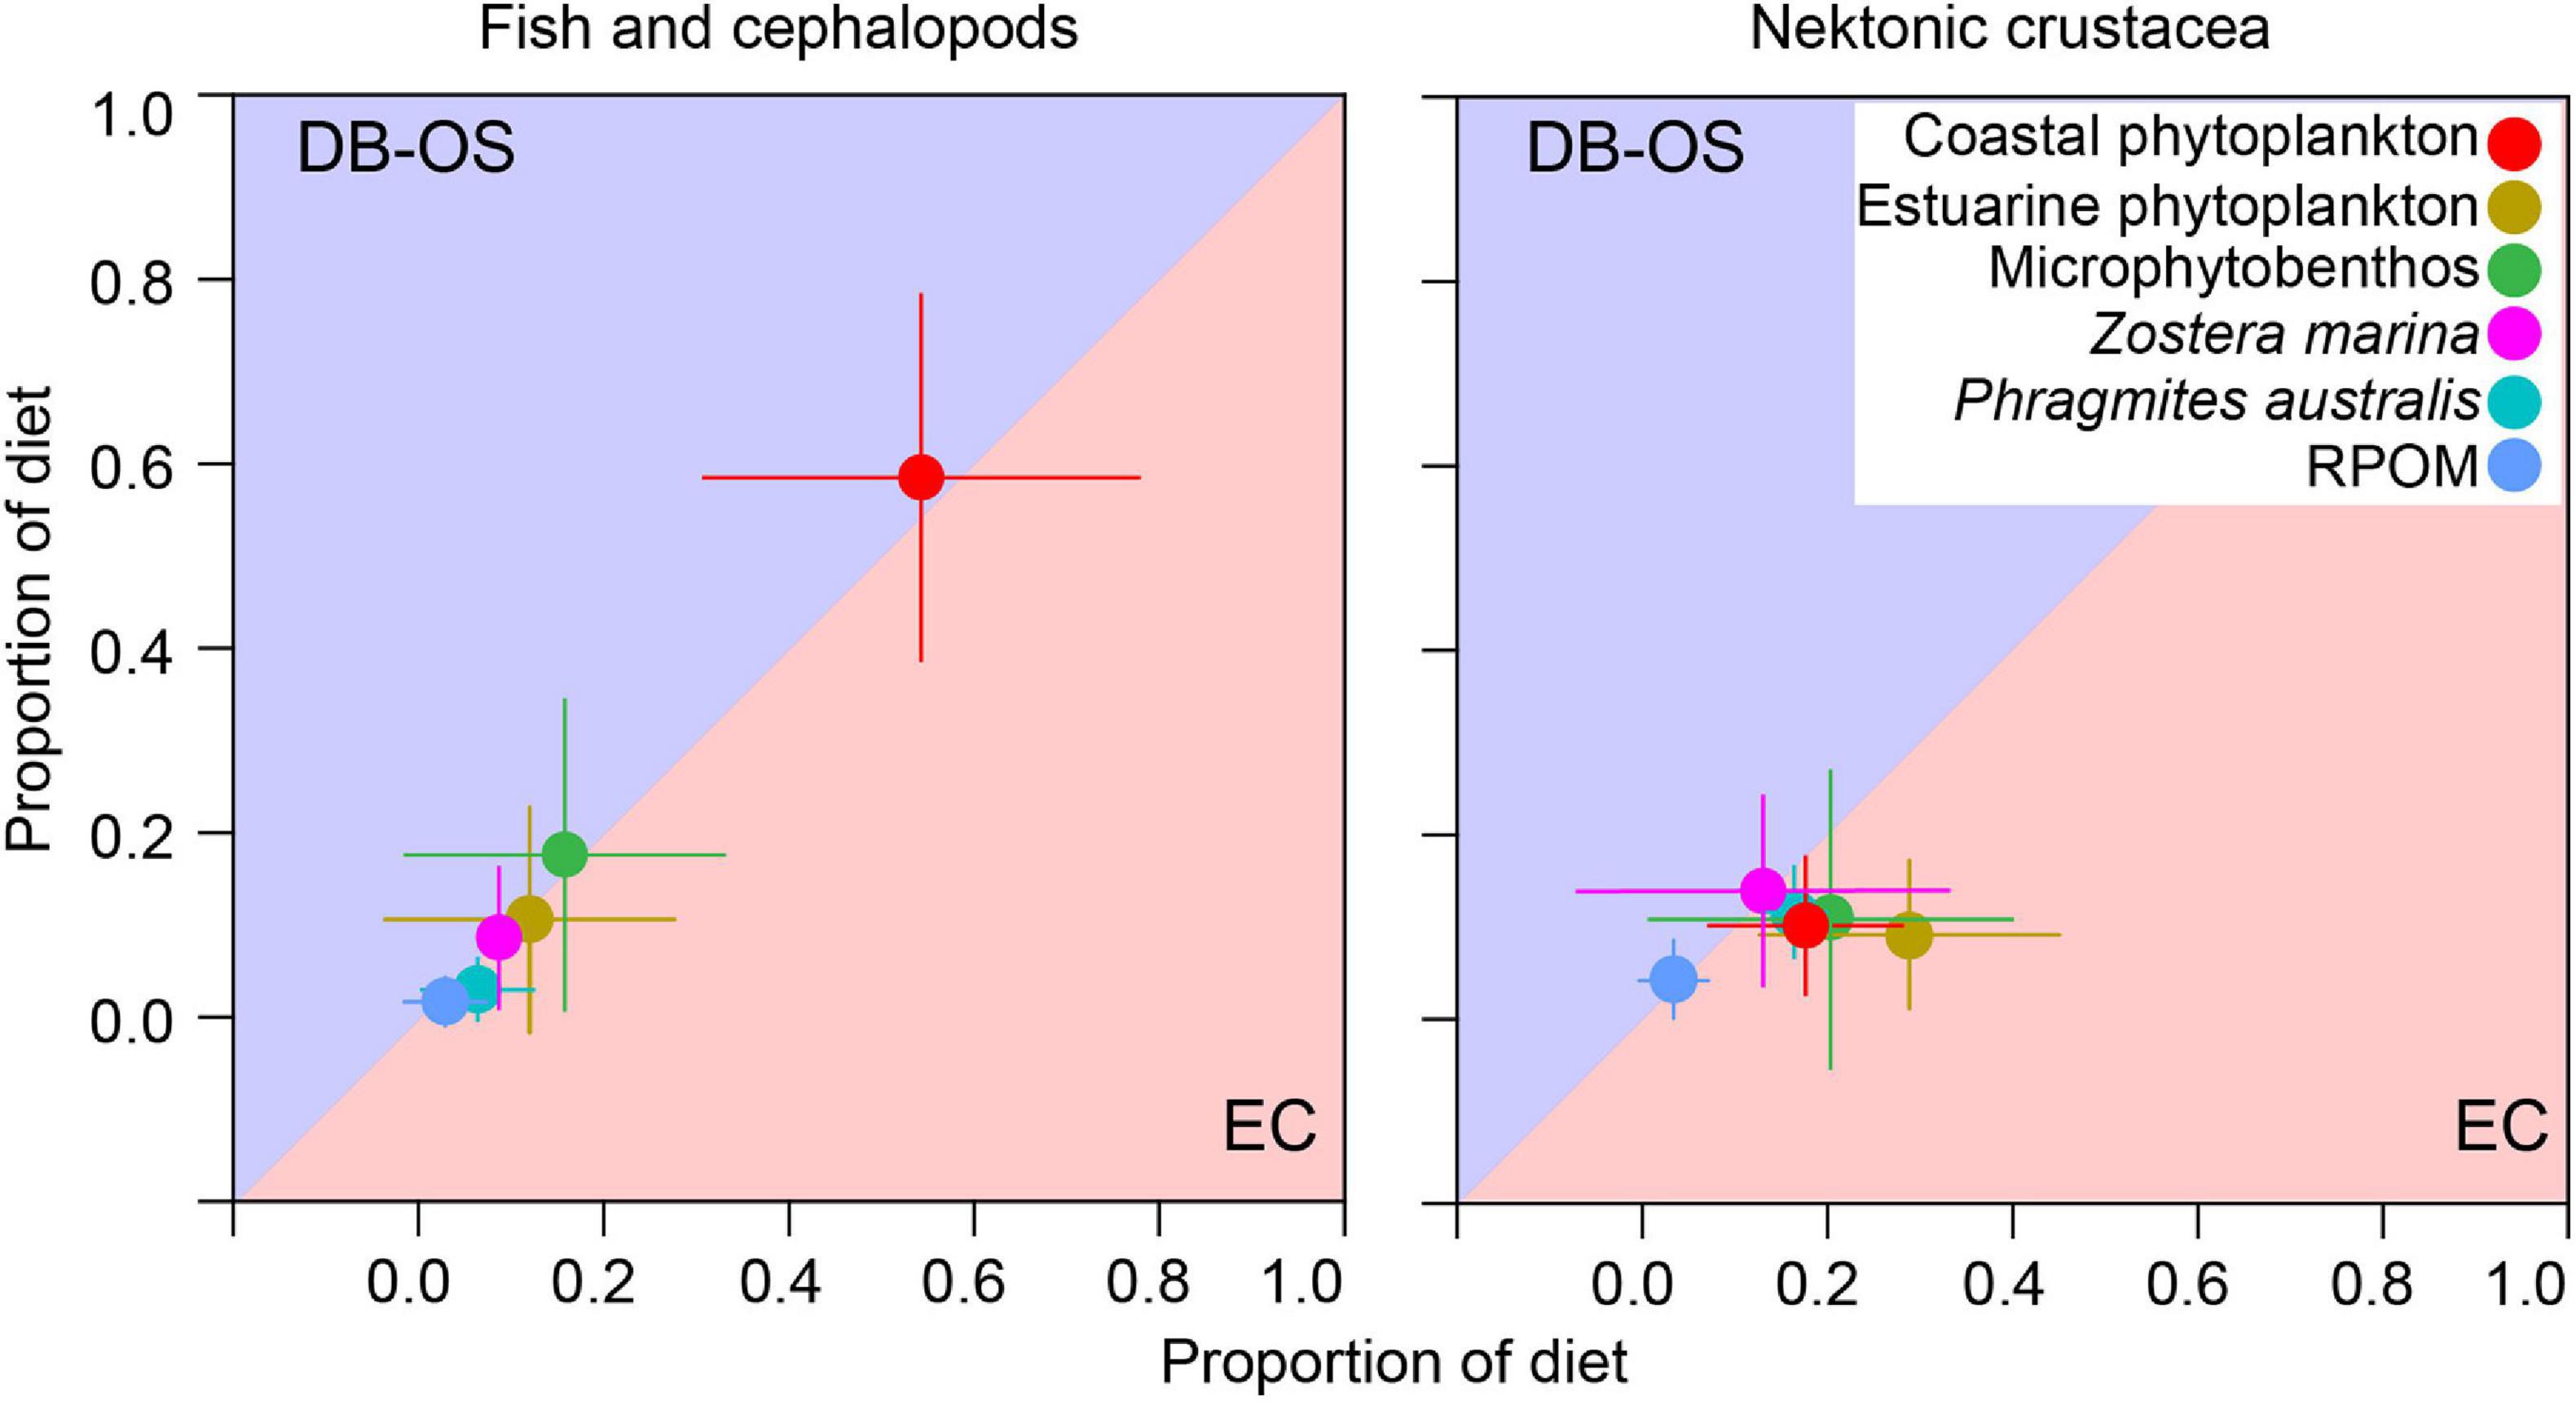
Figure 7. Comparison of estimated trophic contributions (mean ± 1SD) of putative primary organic matter sources to nektonic consumers of the estuarine channel (EC) and coastal (DB/OS) sites, indicating higher trophic connectivity in the highly mobile fish and cephalopods than that of nektonic crustaceans.
Interestingly, consumers at the EC site relied more on sources from the DB and OS sites than from local sources, as suggested by the higher contribution of coastal rather than estuarine phytoplankton (Figures 6, 7 and Supplementary Table 5). This can be interpreted in two ways. First, physical processes—including advection and strong tidal currents in dry seasons—could have transported marine phytoplankton from the DB into the EC (Antonio et al., 2012). Second, limited prey availability in the EC might have induced foraging migrations of fish toward the DB area, as evident from the low abundance and limited diversity of primary consumers. This potential connectivity between the EC and coastal food webs are discussed further in section “Spatial Differences in Food Web Structure and Trophic Connectivity”. On the other hand, higher contributions by local phytoplankton to EC crustaceans (Figure 7) could be explained by more on-site feeding, given their relatively limited movement. Bottom-dwelling small crustaceans move less frequently and for shorter distances than do most pelagic fish with higher swimming efficiency. Higher proportions of Z. marina and P. australis to crustacean diets could arise from the characteristic detritivory of many crab and shrimp species consuming fresh food or detritus originating from those two OM sources (Seo and Hong, 2009; Maher et al., 2013; Bang et al., 2019). The higher benthic affinity by crustacean consumers also explain higher contribution by transported OM (P. australis and RPOM) to crustacean than that to the pelagic fish species. Higher allochthones OM utilization by benthic consumers was also reported in the shallow coastal ecosystem in the Baltic Sea (Bartels et al., 2018). The MPB and ZM contributions to consumer nutrition were slightly higher at the DB and OS sites than at the EC sites because of the proximity of the DB site to tidal flats and seagrass meadows. The very low or insignificant contribution from salt marsh plants could have been caused by the low availability of P. australis-derived OM in the SPM pool (Kim et al., 2020), as well as inferior nutritional quality (Deegan et al., 2002).
The lack of seasonal variation in consumer δ13C values is also reflected in similar source contributions across seasons, as revealed by the isotope mixing model estimation, indicating trophic consistency over time. By contrast, seasonal variations in nekton δ15N values could be caused by changes in TL as a result of ontogenic dietary change (de la Morinière et al., 2003), which was absent in the relatively short-lived macrobenthic invertebrates. Indeed, our estimates clearly indicated that nekton, particularly fish, feed at different TLs (Supplementary Table 1). However, the size (as a proxy for age group) dependency of nektonic isotopic values was insignificant, although the results are not considered robust because nearly all fish collected in this study were small, and individuals of many sizes were available for only few species (<5% of all samples). Therefore, the ontogenic influences on fish diets were ambiguous.
The lack of seasonality in higher trophic level consumers suggests that the nektonic trophic structure was resilient to seasonal variability at the base of the food web. The high productivity and high chlorophyll a concentration across seasons in GYB indicate that phytoplankton production was sufficient across all seasons to support fish food webs consistently (Bibi et al., 2020).
Spatial Differences in Food Web Structure and Trophic Connectivity
Spatial patterns of communities and their associated food webs are largely driven by the available OM sources (Deegan and Garritt, 1997). While different δ13C values of OM sources and consumers (Figure 3) suggest a segregation in food web structures between the EC and DB/OS sites, the very small differences between nekton δ13C values indicate some degree of similarity. Although our isotope mixing model results showed that nekton communities assimilated OM from all three regions, crustaceans relied more on local pelagic or nearby benthic primary producers (Figures 6, 7), which highlights the spatial difference in food web structures. By contrast, the similarity in OM utilization by fish and cephalopods provides evidence of trophic connectivity between the EC and OS (Figure 7). Indeed, the estimated INe indices support the concept of resource sharing by motile consumers, as the trophic niches of these two adjacent communities overlapped (Figure 4). Because the DB and OS nekton had nearly identical δ13C values, the respective fish food webs were also expected to be highly similar. By contrast, the EC and OS consumers had little connectivity because those sites are > 20 km apart from each other (Figure 1). Nearly negligible for nektonic crustaceans, the sizable trophic niche overlap in fish and cephalopods suggest that the EC food web is connected to adjacent deep-bay food web by species that are more active swimmers. Highly mobile fish species are known to move among adjacent habitats and forage on multiple distinct habitats (Herzka, 2005; Kang et al., 2015; Selleslagh et al., 2015). Earlier studies conducted in this region and other systems in the world have also reported that coastal food webs are connected through passive or active biological process (Vinagre et al., 2011; Bergamino et al., 2014; Kang et al., 2015; Dias et al., 2016).
Because the δ15N values of basal sources and primary consumers were similar across sites, spatially different δ13C signatures would maintain similar spatial differences at higher TL values because of the principle of conservative increase in isotope signatures per TL (i.e., TEF values). However, the EC site nekton (particularly fish and cephalopods) were aligned further from the phytoplankton–primary consumer–nekton isotope mixing line toward higher δ13C values (Figure 3). Therefore, relatively more positive δ13C values of nekton resulted in higher estimated TEF values than the expected value of 1.3‰ per TL in EC nekton (Figure 5). This explains the higher contribution of coastal phytoplankton than that of estuarine origin phytoplankton to EC fish and cephalopods, although local phytoplankton food was more important to crustaceans (Figure 7). An earlier study by Hansson et al. (1997) also examined the site fidelity of motile consumers and found similar results. In contrast to the EC site, the nearly identical mixing lines obtained from the estimated TEF for DB/OS nekton suggested that the bay-to-channel movements of fish were limited. Therefore, it is evident that the DB is an important feeding ground for estuarine fish and cephalopods and that biological transport plays a major role in establishing trophic connections between adjacent food webs in GYB. The variability in freshwater input into the estuary as a result of climate change is highly likely to alter the existing food web connectivity between freshwater and marine ecosystems (Fraley et al., 2021).
Conclusion
In this study, we evaluated the spatiotemporal patterns of food web structures and quantified the trophic contribution of potential POM sources to different fish, cephalopods, and nektonic crustacean communities. Fish food webs are primarily fueled by phytoplankton-driven OM, followed by important secondary contributions from microphytobenthos and Z. marina. River-born terrestrial OM made an insignificant contribution. The low availability and inferior nutritional quality of terrestrial materials (Deegan et al., 2002) coupled with high chlorophyll a concentration in GYB across seasons (Bibi et al., 2020) ensures a consistent supply of phytoplankton-driven OM to consumers. Furthermore, our isotopic evidence suggests that fish food webs in GYB are separated between the estuarine (EC) and coastal sites (DB/OS), with considerable trophic connections between them. Significantly higher overlaps among the three fish and cephalopod isotopic niches than for other consumers suggested trophic connectivity among the estuarine and coastal food webs. The estimated carbon trophic enrichment factor for EC nekton confirmed the utilization of 13C-enriched marine food sources by EC nekton, particularly fish and cephalopods. The difference in trophic enrichment between estuarine and coastal nekton highlights the biological transport of coastal OM to the estuary. Notable seasonal patterns have been reported in primary producers and lower TL consumers from GYB (Kang et al., 2020). Therefore, the apparent consistency in the nekton species composition, stable isotope values, and trophic contribution of OM sources indicates the resilience of fish food webs in GYB under changing environments. Finally, our results provide new perspectives on the role of OM sources in estuary and nearshore food webs, contrasting with other highly turbid coastal systems depending highly on non-phytoplankton OM, such as exported terrestrial and wetland detritus. The findings of this study can enhance our understanding of marine ecosystem structures and processes and be incorporated in predictive modeling of marine ecosystems for the sustainable utilization of marine fisheries.
Data Availability Statement
The original contributions presented in the study are included in the article/Supplementary Material, further inquiries can be directed to the corresponding author/s.
Ethics Statement
This animal study was reviewed and approved by the Ministry of Oceans and Fisheries, Korea.
Author Contributions
GKK and C-KK designed the study, wrote the manuscript, and identified overarching research goals. GKK, CK, DK, and RB conducted field observations and performed the experiments. HK conducted sorting and identification of fish species and feeding habits. GKK analyzed the data and performed statistics. All authors reviewed the manuscript and approved the submitted version.
Funding
This research was supported by “Long-term change of structure and function in marine ecosystems of South Korea” funded by the Ministry of Oceans and Fisheries, Korea.
Conflict of Interest
The authors declare that the research was conducted in the absence of any commercial or financial relationships that could be construed as a potential conflict of interest.
Publisher’s Note
All claims expressed in this article are solely those of the authors and do not necessarily represent those of their affiliated organizations, or those of the publisher, the editors and the reviewers. Any product that may be evaluated in this article, or claim that may be made by its manufacturer, is not guaranteed or endorsed by the publisher.
Acknowledgments
We thank fishermen Sang Gil Jung and Jong Sool Kim for providing fishing facilities (i.e., boats and gill nets, etc.). We also thank the reviewers for their insightful comments and suggestions to improve the manuscript.
Supplementary Material
The Supplementary Material for this article can be found online at: https://www.frontiersin.org/articles/10.3389/fmars.2021.751551/full#supplementary-material
Footnotes
References
Abrantes, K. G., Barnett, A., Marwick, T. R., and Bouillon, S. (2013). Importance of terrestrial subsidies for estuarine food webs in contrasting East African catchments. Ecosphere 4, 1–33. doi: 10.1890/ES12-00322.1
Anderson, M. J., Clarke, K. R., and Gorley, R. N. (2008). PERMANOVA+ for Primer. Guide to Software and Statistical Methods. Plymouth: University of Auckland and PRIMER-E Ltd.
Antonio, E. S., Kasai, A., Ueno, M., Ishihi, Y., Yokoyama, H., and Yamashita, Y. (2012). Spatial-temporal feeding dynamics of benthic communities in an estuary-marine gradient. Estuar. Coast. Shelf Sci. 112, 86–97. doi: 10.1016/j.ecss.2011.11.017
Bae, D. H., Jung, I. W., and Chang, H. (2008). Long-term trend of precipitation and runoff in Korean river basins. Hydrol. Proc. 22, 2644–2656. doi: 10.1002/hyp.6861
Baek, G. W., Park, J. M., Huh, S. H., Kim, H. J., and Jeong, J. M. (2014). Feeding habits of Kammal thryssa Thryssa kammalensis (Bleeker, 1849) in the coastal waters of Gadeok-do, Korea. Animal Cells Syst. 18, 154–159. doi: 10.1080/19768354.2014.907206
Bang, J. H., Joo, S., Lee, E. J., Kim, M. S., Jeong, S., and Park, S. (2019). Diet of the mud-flat crab helice tientsinensis in a Korean salt marsh. Wetlands 2, 311–319. doi: 10.1007/s13157-019-01193-4
Bartels, P., Ask, J., Andersson, A., Karlsson, J., and Giesler, R. (2018). Allochthonous organic matter supports benthic but not pelagic food webs in shallow coastal ecosystems. Ecosystems 21, 1459–1470. doi: 10.1007/s10021-018-0233-5
Beck, M. W., Heck, K. L., Able, K. W., Childers, D. L., Eggleston, D. B., Gillanders, B. M., et al. (2001). The identification, conservation, and management of estuarine and marine nurseries for fish and invertebrates: a better understanding of the habitats that serve as nurseries for marine species and the factors that create site-specific variability in nursery quality will improve conservation and management of these areas. Bioscience 51, 633–641.
Bergamino, L., Dalu, T., Whitfield, A. K., Carassou, L., and Richoux, N. B. (2014). Stable isotope evidence of food web connectivity by a top predatory fish (Argyrosomus japonicus: Sciaenidae: Teleostei) in the Kowie Estuary, South Africa. Afr. J. Mar. Sci. 36, 207–213. doi: 10.2989/1814232X.2014.923782
Bergamino, L., Rodríguez-Gallego, L., Pérez-Parada, A., Chialanza, M. R., Amaral, V., Perez, L., et al. (2018). Autochthonous organic carbon contributions to the sedimentary pool: a multi-analytical approach in Laguna Garzón. Org. Geochem. 125, 55–65. doi: 10.1016/j.orggeochem.2018.08.015
Bibi, R., Kang, H. Y., Kim, D., Jang, J., Kundu, G. K., Kim, Y. K., et al. (2020). Dominance of autochthonous phytoplankton-derived particulate organic matter in a low-turbidity temperate estuarine embayment, Gwangyang Bay, Korea. Front. Mar. Sci. 7:580260. doi: 10.3389/fmars.2020.580260
Bligh, E. G., and Dyer, W. J. (1959). A rapid method of total lipid extraction and purification. Can. J. Biochem. Phys. 37, 911–917. doi: 10.1139/o59-099
Bouillon, S., Dahdouh-Guebas, F., Rao, A. V. V. S., Koedam, N., and Dehairs, F. (2003). Sources of organic carbon in mangrove sediments: variability and possible ecological implications. Hydrobiologia 495, 33–39. doi: 10.1023/A:1025411506526
Carassou, L., Whitfield, A., Bergamino, L., Moyo, S., and Richoux, N. (2016). Trophic dynamics of the cape stumpnose (Rhabdosargus holubi, Sparidae) across three adjacent aquatic habitats. Estuar. Coast. 39, 1221–1233. doi: 10.1007/s12237-016-0075-3
Chapman, A. S., Tunnicliffe, V., and Bates, A. E. (2018). Both rare and common species make unique contributions to functional diversity in an ecosystem unaffected by human activities. Divers. Distrib. 24, 568–578. doi: 10.1111/ddi.12712
Choi, B., Jo, H., Park, K., and Kwak, I. S. (2020). Isotopic evidence for ontogenetic shift in food resource utilization during the migration of the slipmouth Leiognathus nuchalis in Gwangyang Bay, Korea. Korean J. Ichthyology. 32, 84–90. doi: 10.35399/ISK.32.2.7
Choi, Y., Kim, J. H., and Park, J. Y. (2002). Marine Fishes of Korea. Seoul: Kyo-Hak Publishing Co., Ltd.
Choy, E. J., An, S., and Kang, C. K. (2008). Pathways of organic matter through food webs of diverse habitats in the regulated Nakdong River estuary (Korea). Estuar. Coast. Shelf Sci. 78, 215–226. doi: 10.1016/j.ecss.2007.11.024
Clarke, K. R., Tweedley, J. R., and Valesini, F. J. (2014). Simple shade plots aid better long-term choices of data pre-treatment in multivariate assemblage studies. J. Mar. Biol. Assoc. UK. 94, 1–16. doi: 10.1017/S0025315413001227
Clarke, K. R., and Warwick, R. M. (2001). Change in Marine Communities. An Approach to Statistical Analysis and Interpretation. Plymouth: PRIMER-E.
Claudino, M. C., Abreu, P. C., and Garcia, A. M. (2013). Stable isotopes reveal temporal and between-habitat changes in trophic pathways in a southwestern Atlantic estuary. Mar. Ecol. Prog. Ser. 489, 29–42. doi: 10.3354/meps10400
Cloern, J. E. (2007). Habitat connectivity and ecosystem productivity: implications from a simple model. Am. Nat. 169, E21–E33. doi: 10.1086/510258
Connolly, R. M., Gorman, D., and Guest, M. A. (2005). Movement of carbon among estuarine habitats and its assimilation by invertebrates. Oecologia 144, 684–691. doi: 10.1007/s00442-005-0167-4
Connolly, R. M., Schlacher, T. A., and Gaston, T. F. (2009). Stable isotope evidence for trophic subsidy of coastal benthic fisheries by river discharge plumes off small estuaries. Mar. Biol. Res. 5, 164–171. doi: 10.1080/17451000802266625
Costanza, R., d’Arge, R., de Groot, R., Farber, S., Grasso, M., Hannon, B., et al. (1997). The value of the world’s ecosystem services and natural capital. Nature 387, 253–260. doi: 10.1038/387253a0
Cucherousset, J., and Villéger, S. (2015). Quantifying the multiple facets of isotopic diversity: new metrics for stable isotope ecology. Ecolo. Indic. 56, 152–160. doi: 10.1016/j.ecolind.2015.03.032
Darnaude, A. M., Salen-Picard, C., Polunin, N. V. C., and Harmelin-Vivien, M. L. (2004). Trophodynamic linkage between river runoff and coastal fishery yield elucidated by stable isotope data in the Gulf of Lions (NW Mediterranean). Oecologia 138, 325–332. doi: 10.1007/s00442-003-1457-3
de la Morinière, E. C., Pollux, B. J. A., Nagelkerken, I., Hemminga, M. A., Huiskes, A. H. L., and Van der Velde, G. (2003). Ontogenetic dietary changes of coral reef fishes in the mangrove-seagrass-reef continuum: stable isotopes and gut-content analysis. Mar. Ecol. Prog. Ser. 246, 279–289. doi: 10.3354/meps246279
de Lecea, A. M., Smit, A. J., and Fennessy, S. T. (2016). Riverine dominance of a nearshore marine demersal food web: evidence from stable isotope and C/N ratio analysis. Afr. J. Mar. Sci. 38, S181–S192. doi: 10.2989/1814232X.2016.1142898
Deegan, L. A., and Garritt, R. H. (1997). Evidence for spatial variability in estuarine food webs. Mar. Ecol. Prog. Ser. 147, 31–47. doi: 10.3354/meps147031
Deegan, L. A., Hughes, J. E., and Rountree, R. A. (2002). “Salt marsh ecosystem support of marine transient species,” in Concepts and Controversies in Tidal Marsh Ecology, eds M. P. Weinstein and D. A. Kreeger (Dordrecht: Springer), 333–365. doi: 10.1007/0-306-47534-0_16
Dias, E., Morais, P., Cotter, A. M., Antunes, C., and Hoffman, J. C. (2016). Estuarine consumers utilize marine, estuarine and terrestrial organic matter and provide connectivity among these food webs. Mar. Ecol. Prog. Ser. 554, 21–34. doi: 10.3354/meps11794
Elliott, M., and Whitfield, A. K. (2011). Challenging paradigms in estuarine ecology and management. Estuar.Coast. Shelf Sci. 94, 306–314. doi: 10.1016/j.ecss.2011.06.016
Focken, U., and Becker, K. (1998). Metabolic fractionation of stable carbon isotopes: implications of different proximate compositions for studies of the aquatic food webs using δ13C data. Oecologia 115, 337–343. doi: 10.1007/s004420050525
Fraley, K. M., Robards, M. D., Rogers, M. C., Vollenweider, J., Smith, B., Whiting, A., et al. (2021). Freshwater input and ocean connectivity affect habitats and trophic ecology of fishes in Arctic coastal lagoons. Polar Biol. 44, 1–14. doi: 10.1007/s00300-021-02895-4
França, S., Vasconcelos, R. P., Tanner, S., Máguas, C., Costa, M. J., and Cabral, H. N. (2011). Assessing food web dynamics and relative importance of organic matter sources for fish species in two portuguese estuaries: a stable isotope approach. Mar. Env. Res. 72, 204–215. doi: 10.1016/j.marenvres.2011.09.001
Fry, B. (2002). Conservative mixing of stable isotopes across estuarine salinity gradients: a conceptual framework for monitoring watershed influences on downstream fisheries production. Estuar. Coast. 25, 264–271. doi: 10.1007/BF02691313
Fry, B., Baltz, D. M., Benfield, M. C., Fleeger, J. W., Gace, A., Haas, H. L., et al. (2003). Stable isotope indicators of movement and residency for brown shrimp (Farfantepenaeus aztecus) in coastal Louisiana marshscapes. Estuaries 26, 82–97. doi: 10.1007/BF02691696
Fry, B., and Sherr, E. B. (1989). “δ13C measurements as indicators of carbon flow in marine and freshwater ecosystems,” in Stable Isotopes in Ecological Research Ecological Studies (Analysis and Synthesis), eds P. W. Rundel, J. R. Ehleringer, and K. A. Nagy (New York: Springer), 196–229. doi: 10.1007/978-1-4612-3498-2_12
Hansson, S., Hobbie, J. E., Elmgren, R., Larsson, U., Fry, B., and Johansson, S. (1997). The stable nitrogen isotope ratio as a marker of food-web interactions and fish migration. Ecology 78, 2249–2257.
Heck, K. L., Carruthers, T. J., Duarte, C. M., Hughes, A. R., Kendrick, G., Orth, R. J., et al. (2008). Trophic transfers from seagrass meadows subsidize diverse marine and terrestrial consumers. Ecosystems 11, 1198–1210. doi: 10.1007/s10021-008-9155-y
Herzka, S. (2005). Assessing connectivity of estuarine fishes based on stable isotope ratio analysis. Estuar. Coast. Shelf Sci. 64, 58–69. doi: 10.1016/j.ecss.2005.02.006
Hobson, K. A., Fisk, A., Karnovsky, N., Holst, M., Gagnon, J. M., and Fortier, M. (2002). A stable isotope (δ13C, δ15N) model for the North Water food web: implications for evaluating trophodynamics and the flow of energy and contaminants. Deep Sea Res. 49, 5131–5150. doi: 10.1016/S0967-0645(02)00182-0
Hoffman, J. C., and Bronk, D. A. (2006). Interannual variation in stable carbon and nitrogen isotope biogeochemistry of the Mattaponi River, Virginia. Limnol. Oceanogr. 51, 2319–2332. doi: 10.4319/lo.2006.51.5.2319
Hoffman, J. C., Bronk, D. A., and Olney, J. E. (2007). Contribution of allochthonous carbon to American shad production in the Mattaponi River, Virginia, using stable isotopes. Estuar. Coast. 30, 1034–1048. doi: 10.1007/BF02841394
Hoffman, J. C., Bronk, D. A., and Olney, J. E. (2008). Organic matter sources supporting lower food web production in the tidal freshwater portion of the York River estuary, Virginia. Estuar. Coast. 30, 898–911. doi: 10.1007/s12237-008-9073-4
Howe, E. R., and Simenstad, C. A. (2015). Using stable isotopes to discern mechanisms of connectivity in estuarine detritus-based food webs. Mar. Ecol. Prog. Ser. 518, 13–29. doi: 10.3354/meps11066
Jackson, A. L., Inger, R., Parnell, A. C., and Bearhop, S. (2011). Comparing isotopic niche widths among and within communities: SIBER–stable isotope bayesian ellipses in R. J. Anim. Ecol. 80, 595–602. doi: 10.1111/j.1365-2656.2011.01806.x
Jeong, S. B., Hwang, D. J., Kim, Y. J., Shin, H. H., and Son, Y. U. (2005). Species composition of the catches collected by a bottom trawl in the southern waters of Korea in summer, 2004. J. Korean Soc. Fish. Ocean Technol. 41, 35–45. doi: 10.3796/KSFT.2005.41.1.035
Kang, C. K., Kim, J. B., Lee, K. S., Kim, J. B., Lee, P. Y., and Hong, J. S. (2003). Trophic importance of benthic microalgae to macrozoobenthos in coastal bay systems in Korea: dual stable C and N isotope analyses. Mar. Ecol. Prog. Ser. 259, 79–92. doi: 10.3354/meps259079
Kang, C. K., Lee, Y. W., Choy, E. J., Shin, J. K., Seo, I. S., and Hong, J. S. (2006). Microphytobenthos seasonality determines growth and reproduction in intertidal bivalves. Mar. Ecol. Prog. Ser. 315, 113–127. doi: 10.3354/meps315113
Kang, C. K., Park, H. J., Choy, E. J., Choi, K. S., Hwang, K., and Kim, J. B. (2015). Linking intertidal and subtidal food webs: consumer-mediated transport of intertidal benthic microalgal carbon. PLoS One 10:e0139802. doi: 10.1371/journal.pone.0139802
Kang, H. Y., Kim, C., Kim, D., Lee, Y. J., Park, H. J., Kundu, G. K., et al. (2020). Identifying patterns in the multitrophic community and food-web structure of a low-turbidity temperate estuarine bay. Sci. Rep. 10, 1–16. doi: 10.1038/s41598-020-73628-6
Kang, S. H., Lee, J. H., Park, S. W., and Shin, H. C. (2014). Temporal and spatial distribution of benthic polychaetous communities in Seomjin River Estuary. Sea 19, 243–255. doi: 10.7850/jkso.2014.19.4.243
Kim, B. J., Ro, Y. J., Jung, K. Y., and Park, K. S. (2014). Numerical modeling of circulation characteristics in the kwangyang estuarine system. J. Korean Soc. Coast. Ocean Eng. 26, 253–266. doi: 10.9765/KSCOE.2014.26.4.253
Kim, C., Kang, H. Y., Lee, Y. J., Yun, S. G., and Kang, C. K. (2020). Isotopic variation of macroinvertebrates and their sources of organic matter along an estuarine gradient. Estuar. Coast. 43, 496–511. doi: 10.1007/s12237-019-00543-z
Kim, H. Y., Han, I. W., Oh, W. S., Choi, J. H., and Lee, K. H. (2018). Distribution and seasonal changes of fisheries resources in the Gwangyang bay. J. Fish. Mar. Sci. Edu. 30, 2163–2175.
Kim, J. B., Park, J. I., Choi, W. J., Lee, J. S., and Lee, K. S. (2010). Spatial distribution and ecological characteristics of Zostera marina and Zostera japonica in the Seomjin estuary. Korean J. Fish. Aqua. Sci. 43, 351–361. doi: 10.5657/kfas.2010.43.4.351
Kimirei, I. A., Nagelkerken, I., Slooter, N., Gonzalez, E. T., Huijbers, C. M., Mgaya, Y. D., et al. (2015). Demography of fish populations reveals new challenges in appraising juvenile habitat values. Mar. Ecol. Prog. Ser. 518, 225–237. doi: 10.3354/meps11059
Kneib, R. T. (2002). “Salt marsh ecoscapes and production transfers by estuarine nekton in the southeastern united states,” in Concepts and Controversies in Tidal Marsh Ecology, eds M. P. Weinstein and D. A. Kreeger (Dordrecht: Springer), doi: 10.1007/0-306-47534-0_13
Kobayashi, S., Akamatsu, F., Amano, K., Nakanishi, S., and Oshima, Y. (2011). Longitudinal changes in δ13C of riffle macroinvertebrates from mountain to lowland sections of a gravel-bed river. Freshwater Biol. 56, 1434–1446. doi: 10.1111/j.1365-2427.2011.02582.x
Kirstensen, P. B., Riis, T., Dylmer, H. E., Kristensen, E. A., Meerhoff, M., Olesen, B., et al. (2016). Baseline identification in stable-isotope studies of temperate lotic systems and implications for calculated trophic positions. Freshwater Sci. 35, 909–921. doi: 10.1086/687284
Kwon, K. Y., Moon, C. H., Kang, C. H., and Kim, Y. N. (2002). Distribution of particulate organic matters along the salinity gradients in the Seomjin River estuary. J. Korean Fish. Soc. 35, 86–89. doi: 10.5657/kfas.2002.35.1.086
Layman, C. A., Arrington, D. A., Montaña, C. G., and Post, D. M. (2007). Can stable isotope ratios provide for community-wide measures of trophic structure? Ecology 88, 42–48.
Lee, J. H., Lee, D., Kang, J. J., Joo, H. T., Lee, J. H., Lee, H. W., et al. (2017). The effects of different environmental factors on the biochemical composition of particulate organic matter in Gwangyang Bay, South Korea. Biogeosciences 214, 1903–1917. doi: 10.5194/bg-14-1903-2017
Lee, M., Park, B. S., and Baek, S. H. (2018). Tidal influences on biotic and abiotic factors in the Seomjin River estuary and Gwangyang bay, Korea. Estuar. Coast. 41, 1977–1993. doi: 10.1007/s12237-018-0404-9
Lee, S. Y. (2000). Carbon dynamics of deep bay, eastern pearl river estuary, China. II: trophic relationship based on carbon-and nitrogen-stable isotopes. Mar. Ecol. Prog Ser 205, 1–10. doi: 10.3354/meps205001
Liu, Q., Yi, Y., Hou, C., Wu, X., and Song, J. (2020). Response of trophic structure and isotopic niches of the food web to flow regime in the Yellow River estuary. Mar. Geol. 430:106329. doi: 10.1016/j.margeo.2020.106329
Magurran, A. E., and Henderson, P. A. (2003). Explaining the excess of rare species in natural species abundance distributions. Nature 422, 714–716. doi: 10.1038/nature01547
Maher, I., Song, K. J., Park, H. M., and Oh, C. W. (2013). Feeding ecology of the sand shrimp crangon hakodatei Rathbun, 1902 (decapoda: crangonidae) in the east sea of Korea. Anim. Cells Sys. 17, 44–52. doi: 10.1080/19768354.2013.769897
McCutchan, J. H., Lewis, W. M., Kendall, C., and McGrath, C. C. (2003). Variation in trophic shift for stable isotope ratios of carbon, nitrogen, and sulfur. Oikos 102, 378–390. doi: 10.1034/j.1600-0706.2003.12098.x
McMahon, K. W., Ambrose, W. G. Jr., Reynolds, M. J., Johnson, B. J., Whiting, A., and Clough, L. M. (2021). Arctic lagoon and nearshore food webs: relative contributions of terrestrial organic matter, phytoplankton, and phytobenthos vary with consumer foraging dynamics. Estuar. Coast. Shelf Sci. 257: 107388. doi: 10.1016/j.ecss.2021.107388
Mont’Alverne, R., Pereyra, P. E. R., and Garcia, A. M. (2016). Trophic segregation of a fish assemblage along lateral depth gradients in a subtropical coastal lagoon revealed by stable isotope analyses. J. Fish Biol. 89, 770–792. doi: 10.1111/jfb.12903
NFRDI (2009). Chemical Composition of Marine Products in Korea, 2nd Edn. Busan: National fisheries Research and Development Institute.
Ng, J. S., Wai, T. C., and Williams, G. A. (2007). The effects of acidification on the stable isotope signatures of marine algae and molluscs. Mar. Chem. 103, 97–102. doi: 10.1016/j.marchem.2006.09.001
Odum, E. P. (1980). “The status of three ecosystem level hypothesis regarding salt marsh estuaries: tidal subsidy, outwelling, and detritus based food chains,” in Estuarine perspectives, ed. V. S. Kennedy (New York: Academic Press), 485–495. doi: 10.1016/B978-0-12-404060-1.50045-9
Park, H. J., Kang, H. Y., Park, T. H., and Kang, C. K. (2017). Comparative trophic structures of macrobenthic food web in two macrotidal wetlands with and without a dike on the temperate coast of Korea as revealed by stable isotopes. Mar. Env. Res. 131, 134–145. doi: 10.1016/j.marenvres.2017.09.018
Park, H. J., Kwak, J. H., and Kang, C. K. (2015). Trophic consistency of benthic invertebrates among diversified vegetational habitats in a temperate coastal wetland of Korea as determined by stable isotopes. Estuar. Coast. 38, 599–611. doi: 10.1007/s12237-014-9834-1
Park, H. J., Park, T. H., Lee, C. I., and Kang, C. K. (2018). Ontogenetic shifts in diet and trophic position of walleye pollock, theragra chalcogramma, in the western east sea (Japan sea) revealed by stable isotope and stomach content analyses. Fish. Res. 204, 297–304. doi: 10.1016/j.fishres.2018.03.006
Park, T. H., Lee, C. I., Kang, C. K., Kwak, J. H., Lee, S. H., and Park, H. J. (2020). Seasonal variation in food web structure and fish community composition in the east/Japan sea. Estuar. Coast. 43, 615–629. doi: 10.1007/s12237-019-00530-4
Philips, D. L., Inger, R., Bearhop, S., Jackson, A. L., Moore, J. W., Parnell, A. C., et al. (2014). Best practices for use of stable isotope mixing models in food-web studies. Can. J. Zool. 92, 823–835. doi: 10.1139/cjz-2014-0127
Pihl, L., Cattrijsse, A., Codling, I., Mathieson, S., McLusky, D. S., and Roberts, C. (2002). “Habitat use by fishes in estuaries and other brackish areas,” in Fishes in Estuaries, eds M. Elliott and K. L. Hemingway (Blackwell Science), 10–53.
Rees, M. J., Knott, N. A., and Davis, A. R. (2018). Habitat and seascape patterns drive spatial variability in temperate fish assemblages: implications for marine protected areas. Mar. Ecol. Prog. Ser. 607, 171–186. doi: 10.3354/meps12790
Selleslagh, J., Blanchet, H., Bachelet, G., and Lobry, J. (2015). Feeding habitats, connectivity and origin of organic matter supporting fish populations in an estuary with a reduced intertidal area assessed by stable isotope analysis. Estuar. Coast. 38, 1431–1447. doi: 10.1007/s12237-014-9911-5
Seo, I. S., and Hong, J. S. (2009). Food habits of the Asian paddle crab, Charybdis japonica (a. Milne-Edwards) on the Jangbong tidal flat, Incheon, Korea. Korean J. Env. Biol. 27, 297–305.
Seo, Y. I., Lee, J. H., Oh, T. Y., Lee, J. B., Choi, Y. M., and Lee, D. W. (2013). Distribution and seasonal variations of fisheries resources captured by the beam trawl in Namhae Island, Korea. J. Korean Soc. Fish. Ocean Technol. 49, 419–431. doi: 10.3796/KSFT.2013.49.4.419
Shaha, D. C., Cho, Y. K., and Kim, T. W. (2012). Effects of river discharge and tide driven sea level variation on saltwater intrusion in Sumjin River estuary: an application of finite-volume coastal ocean model. J. Coast. Res. 29, 460–470. doi: 10.2112/JCOASTRES-D-12-00135.1
Shang, X., Zhang, G. S., and Zhang, J. (2008). Relative importance of vascular plants and algal production in the food web of a Spartina-invaded salt marsh in the Yangtze River estuary. Mar. Ecol. Prog. Ser. 367, 93–107. doi: 10.3354/meps07566
Sin, Y., Ryu, S. O., and Song, E. (2009). Characteristics of benthic chlorophyll a and sediment properties in the tidal flats of Kwangyang bay, Korea. Algae 24, 149–161. doi: 10.4490/ALGAE.2009.24.3.149
Vinagre, C., Madeira, C., Dias, M., Narciso, L., and Mendonça, V. (2019). Reliance of coastal intertidal food webs on river input–current and future perspectives. Ecol. Indic. 101, 632–639. doi: 10.1016/j.ecolind.2019.01.064
Vinagre, C., Salgado, J., Cabral, H. N., and Costa, M. J. (2011). Food web structure and habitat connectivity in fish estuarine nurseries-impact of river flow. Estuar. Coast. 34, 663–674. doi: 10.1007/s12237-010-9315-0
Vinagre, C., Salgado, J., Costa, M. J., and Cabral, H. N. (2008). Nursery fidelity, food web interactions and primary sources of nutrition of the juveniles of solea solea and S. senegalensis in the tagus estuary (Portugal): a stable isotope approach. Estuar. Coast. Shelf Sci. 76, 255–264. doi: 10.1016/j.ecss.2007.07.006
Whitfield, A. K., Elliott, M., Basset, A., Blaber, S. J. M., and West, R. J. (2012). Paradigms in estuarine ecology–a review of the Remane diagram with a suggested revised model for estuaries. Estuar. Coast. Shelf Sci. 97, 78–90. doi: 10.1016/j.ecss.2011.11.026
Whitney, E. J., Beaudreau, A. H., and Howe, E. R. (2018). Using stable isotopes to assess the contribution of terrestrial and riverine organic matter to diets of nearshore marine consumers in a glacially influenced estuary. Estuar. Coast. 41, 193–205. doi: 10.1007/s12237-017-0260-z
Ying, R., Cao, Y., Yin, F., Guo, J., Huang, J., Wang, Y., et al. (2020). Trophic structure and functional diversity reveal pelagic-benthic coupling dynamic in the coastal ecosystem of Daya bay, China. Ecol. Indic. 113:106241. doi: 10.1016/j.ecolind.2020.106241
Keywords: organic matter sources, trophic contribution, food web structure, connectivity, MixSIAR, low turbidity bay, estuarine and coastal ecology
Citation: Kundu GK, Kim C, Kim D, Bibi R, Kim H and Kang C-K (2021) Phytoplankton Fuel Fish Food Webs in a Low-Turbidity Temperate Coastal Embayment: A Stable Isotope Approach. Front. Mar. Sci. 8:751551. doi: 10.3389/fmars.2021.751551
Received: 01 August 2021; Accepted: 11 October 2021;
Published: 28 October 2021.
Edited by:
Paolo Magni, National Research Council, Consiglio Nazionale delle Ricerche (CNR), ItalyReviewed by:
Ke Pan, Shenzhen University, ChinaGiulio Careddu, Sapienza University of Rome, Italy
Charles Simenstad, University of Washington, United States
Copyright © 2021 Kundu, Kim, Kim, Bibi, Kim and Kang. This is an open-access article distributed under the terms of the Creative Commons Attribution License (CC BY). The use, distribution or reproduction in other forums is permitted, provided the original author(s) and the copyright owner(s) are credited and that the original publication in this journal is cited, in accordance with accepted academic practice. No use, distribution or reproduction is permitted which does not comply with these terms.
*Correspondence: Chang-Keun Kang, Y2trYW5nQGdpc3QuYWMua3I=