 Anna M. Jażdżewska1*†
 Tammy Horton2†
 Ed Hendrycks3
 Tomasz Mamos1†
 Amy C. Driskell4†Saskia Brix5†Pedro Martínez Arbizu6†
- 1Department of Invertebrate Zoology and Hydrobiology, Faculty of Biology and Environmental Protection, University of Lodz, Lodz, Poland
- 2National Oceanography Centre, Southampton, United Kingdom
- 3Canadian Museum of Nature, Research and Collections, Ottawa, ON, Canada
- 4Laboratories of Analytical Biology, National Museum of Natural History, Smithsonian Institution, Washington, DC, United States
- 5Senckenberg am Meer, Department for Marine Biodiversity Research (DZMB), c/o Biocenter Grindel, CeNak: Zoological Museum, Hamburg, Germany
- 6German Center for Marine Biodiversity Research (DZMB), Senckenberg am Meer, Wilhelmshaven, Germany
Paralicella tenuipes Chevreux, 1908 and Paralicella caperesca Shulenberger and Barnard, 1976 are known as widely distributed deep-sea scavenging amphipods. Some recent studies based on genetic data indicated the presence of high intraspecific variation of P. caperesca suggesting it is a species complex. Based on published molecular data from the Pacific and Indian oceans and new material obtained from the North and South Atlantic, we integrated the knowledge on the intraspecific variation and species distribution of the two nominal taxa. The study included analysis of three genes (COI, 16S rRNA, 28S rRNA) and revealed the existence of a single Molecular Operational Taxonomic Unit (MOTU) within P. tenuipes and six different MOTUs forming P. caperesca. The distribution pattern of the recognized lineages varied with three (P. tenuipes, MOTU 1 and MOTU 5 of P. caperesca) being widely distributed. There was evidence of contemporary population connectivity expressed by the share of the same COI haplotypes by individuals from very distant localities. At the same time no signal of recent demographic changes was observed within the studied taxa. The time-calibrated phylogeny suggested the emergence of species to be at the time of Mesozoic/Cenozoic transition that may be associated with global changes of the ocean circulation and deep sea water cooling.
Introduction
The deep sea, the largest ecosystem in the World, has received particular attention in recent decades. Apart from scientific curiosity, advances in technology allowing the collection of deep-sea mineral or biological resources (e.g., deep-sea mining or fisheries) have rendered this ecosystem of interest also for commerce (Victorero et al., 2018; Hein et al., 2020). At the same time, signs of human impact (both direct and indirect) and low recovery rate of the deep-sea communities have been observed (Fischer et al., 2015; Gollner et al., 2017; Jones et al., 2017; Chiba et al., 2018). Despite the large efforts that scientists have put into the exploration and characterization of the deep-sea ecosystem, it is still insufficiently understood (Ramirez-Llodra et al., 2010). Central among the still poorly known factors are the identities, distributional ranges and population connectivity of the species that live there. Rex et al. (2005) concluded that the abyssal fauna is constituted by the populations of survivors from the bathyal and as such it is less diverse. Recent analyses of abyssal benthic communities have partly challenged the paradigm, reporting very high diversities of several invertebrate groups, especially when applying molecular studies (e.g., Brandt et al., 2007; Janssen et al., 2015; Jażdżewska and Mamos, 2019; Brix et al., 2020). It was also observed that underwater physiographic features, although not being surmountable barriers for species connectivity, may restrict dispersal, particularly for those taxa lacking a free-living larval stage (Bober et al., 2018; Riehl et al., 2018; Jakiel et al., 2019; Jażdżewska and Mamos, 2019; Brix et al., 2020). Comparison of the geographic range sizes of shallow-water and deep-sea fauna revealed that they are smaller in the former, however the differences are not that large and the results are significantly biased by the low availability of deep-sea data (Baco et al., 2016). Other studies have provided evidence for deep-sea species ranges that reach 500–2000 km, with several species having much more limited distributions (Taylor and Roterman, 2017; Brix et al., 2018; Janssen et al., 2019; Washburn et al., 2021). Moreover, application of molecular methods in studies of some presumed cosmopolitan deep-sea species revealed that they are complexes of taxa with more restricted ranges (Havermans, 2016; Verheye et al., 2016).
Marine scavengers play an important role in the deep-sea food web, recycling carbon reaching the seafloor as carrion and making it available for other fauna (Havermans and Smetacek, 2018). The macrobenthic deep-sea scavenger community is dominated by amphipod crustaceans (De Broyer et al., 2004; Jamieson et al., 2011; Havermans and Smetacek, 2018; Horton et al., 2020). Members of this specialist amphipod feeding guild are well adapted by the possession of chemosensory organs allowing for better localization of the carcass, and good swimming abilities (Premke et al., 2003; De Broyer et al., 2004). Amphipods are in the superorder Peracarida, a diverse group of small shrimp-like taxa that brood their young in a pouch, with no independent larval dispersal stage. Brandt et al. (2012) summarized the distribution ranges of deep-sea peracarids, and revealed that only 45 taxa were found in multiple regions, among them 11 species of Amphipoda. One of the species listed by these authors, Eurythenes gryllus (Mandt, 1822), appeared to be a species complex (Havermans, 2016) challenging former understanding of its cosmopolitan distribution. Of the amphipod species listed as widely distributed, half belong to the mobile deep-sea scavenger guild. Notable among these are Paralicella caperesca Shulenberger and Barnard, 1976 and Paralicella tenuipes Chevreux, 1908 that have been reported in large numbers from baited traps in all oceans except the Arctic and the Southern Ocean south of the Antarctic Polar Front (e.g., Chevreux, 1908; Shulenberger and Barnard, 1976; Ritchie et al., 2015; Duffy et al., 2016; Horton et al., 2020; Patel et al., 2020).
The genus Paralicella currently contains six accepted species (Table 1). The genus was created by Chevreux in 1908 for the species Paralicella tenuipes, which was collected in large numbers from baited traps in the North Atlantic (the lectotype was selected from a trap set in the region of the Canary Islands at 5285 m) (Chevreux, 1908).
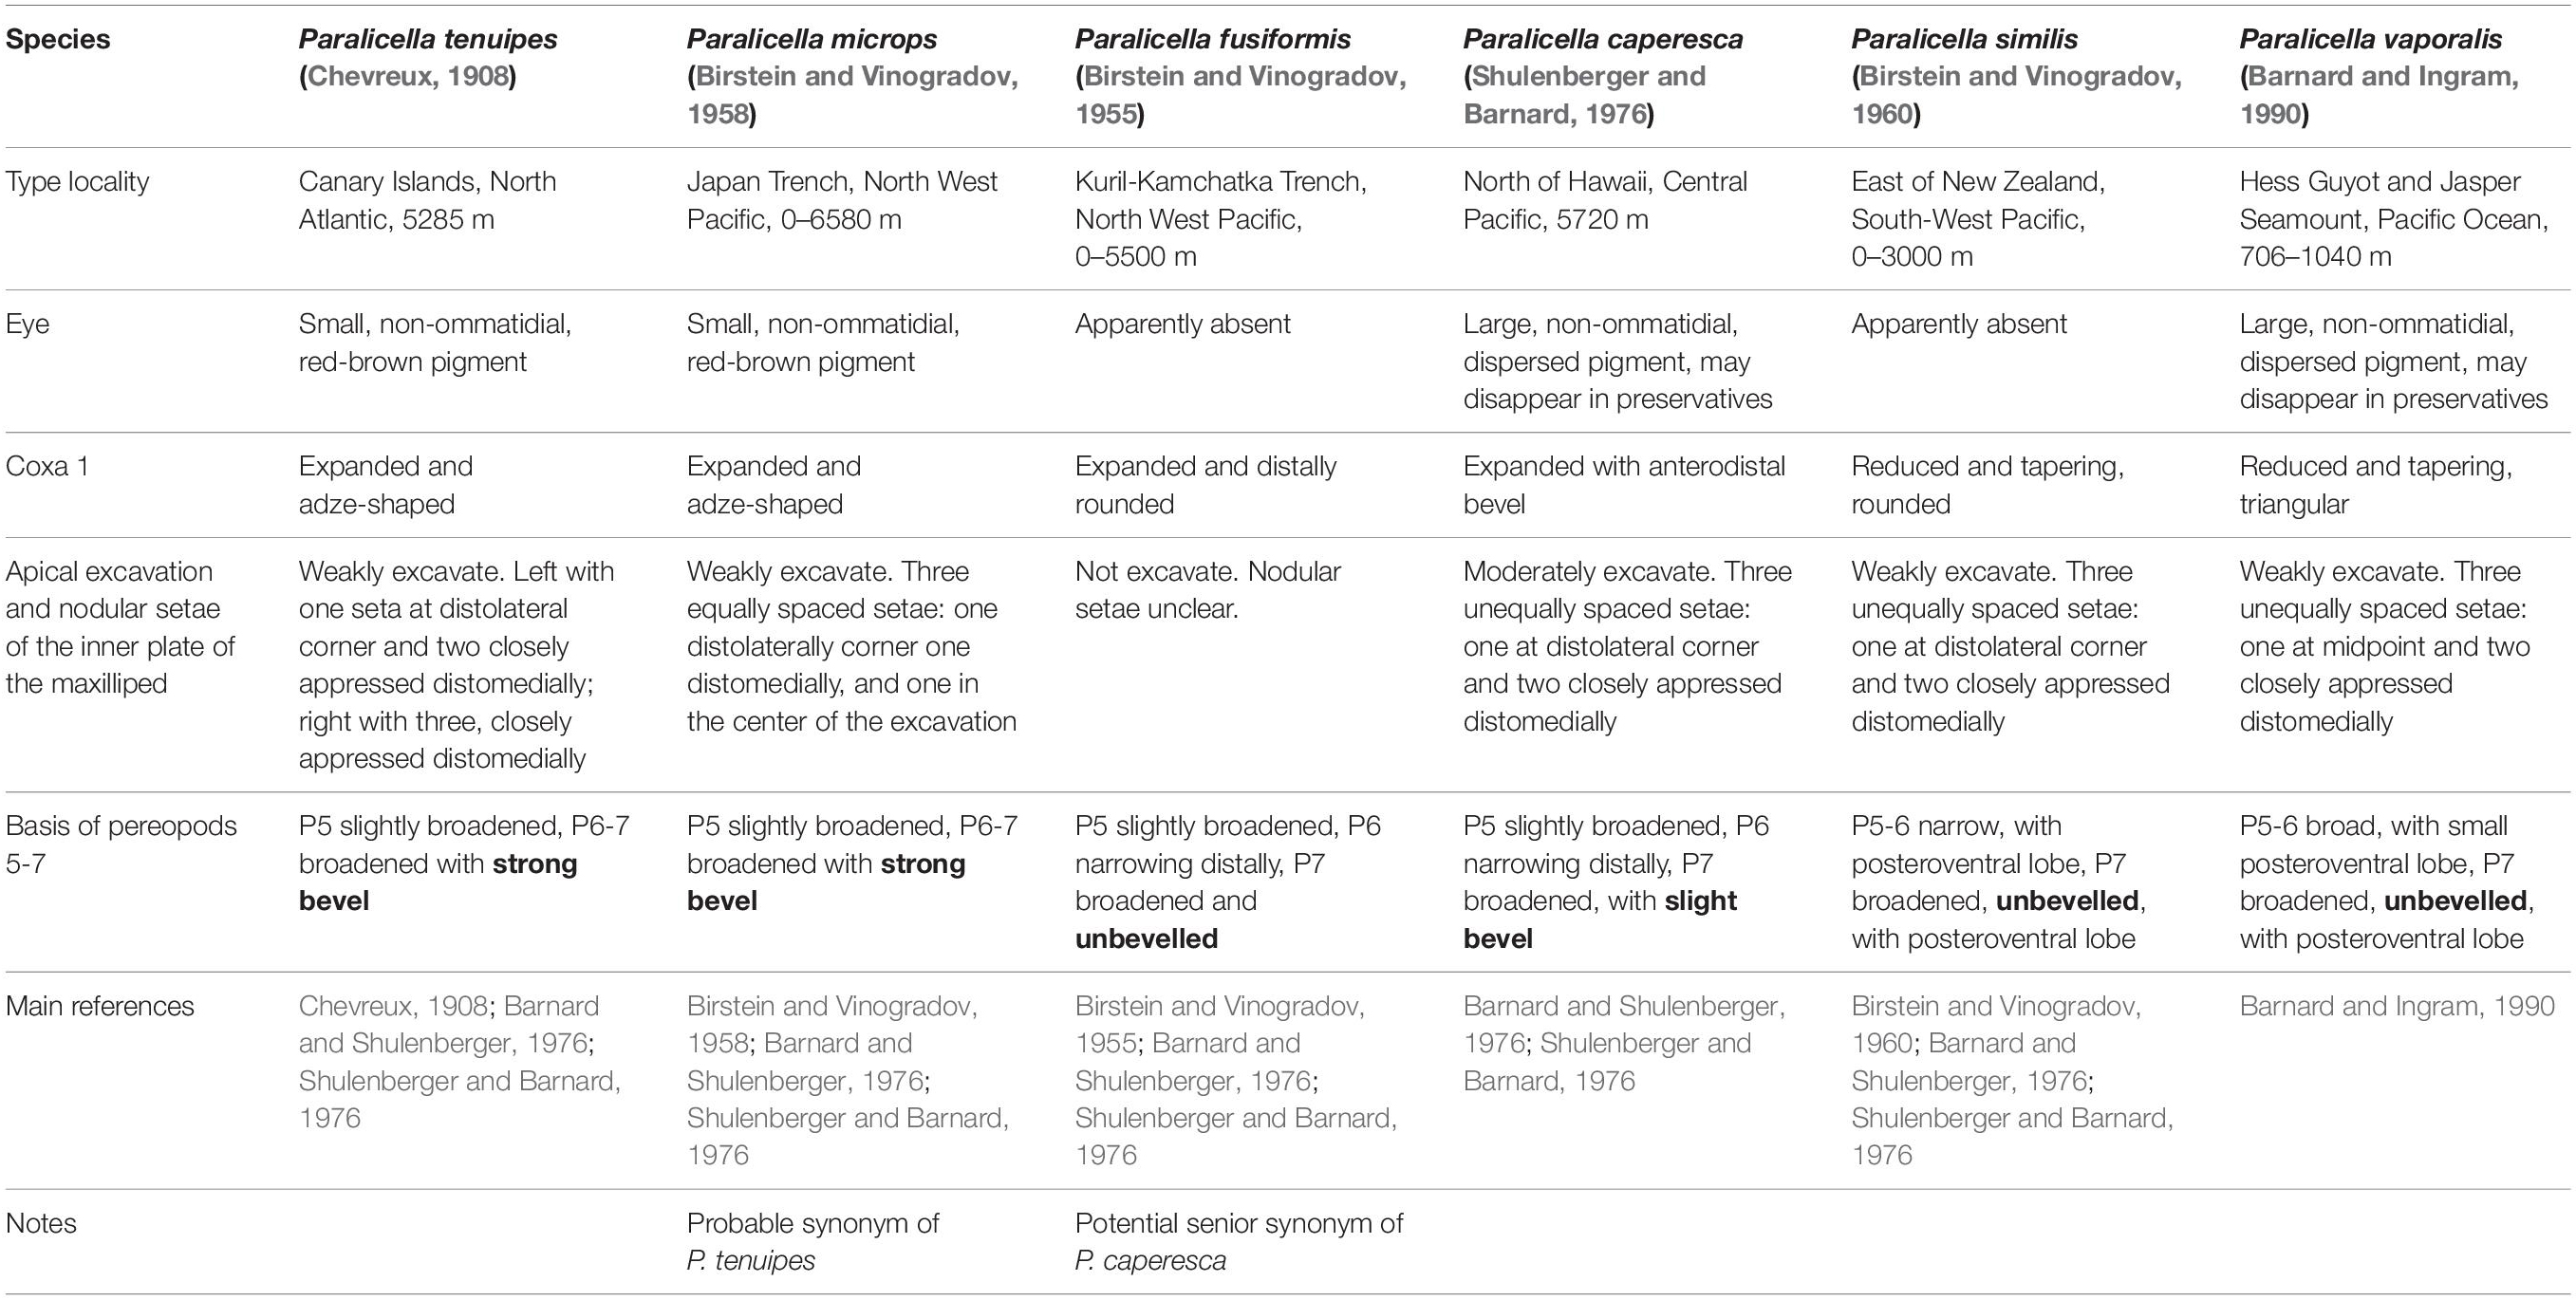
Table 1. The currently accepted Paralicella species with type localities and distinguishing morphological characters.
A second species, Paralicella fusiformis (Birstein and Vinogradov, 1955), was described based on an ovigerous female of 17 mm length collected in a catch from 0 to 5500 m from the Kuril-Kamchatka Trench in the Pacific Ocean (Birstein and Vinogradov, 1955). The species was originally placed in the genus Eurythenes. A third species, Paralicella microps (Birstein and Vinogradov, 1958), was added, again in the genus Eurythenes (Birstein and Vinogradov, 1958). In 1960, a fourth species Paralicella similis Birstein and Vinogradov, 1960, was described, and the authors, recognizing Chevreux’s earlier work, transferred their species to the genus Paralicella, and incorrectly synonymized the species P. fusiformis with P. tenuipes (Birstein and Vinogradov, 1960). The authors noted the lack of eyes in their specimens of P. fusiformis and the presence of them in Chevreux’s P. tenuipes (but see note page 12 regarding presence/absence of eyes in preserved material). The authors also indicated the similarity between the beveled basis of the pereopod 7 of their species P. microps, and that of P. tenuipes.
In 1976, Shulenberger and Barnard described the new species Paralicella caperesca, from a collection of 220 specimens taken in a trap set north of Oahu, Hawaii, at 5720 m. Barnard and Shulenberger (1976) discussed the genus Paralicella, designating a lectotype specimen for the species Paralicella tenuipes, after noting that Chevreux’s original material contained specimens of both P. tenuipes and P. caperesca. They also provide a key to the genus and discuss the validity of two of Birstein and Vinogradov’s species (P. fusiformis and P. microps) indicating the possibility that these species are conspecific with P. caperesca and P. tenuipes respectively. Barnard and Ingram (1990) added the last species, Paralicella vaporalis, from the Pacific Ocean at the Hess Guyot and Jasper Seamount from 706 to 1040 m, and provided an updated key to the genus.
The separation of the six known species can be managed morphologically using a number of characters (Table 1). The presence of a small, red-brown eye and a strongly beveled basis on pereopod 7, separate P. tenuipes and P. microps from the remaining four species. These species can be separated by the arrangement of the nodular setae in the middle of the apical excavation of the inner plate of the maxilliped. This single, very minor difference was postulated to be a phenotypic anomaly by Barnard and Shulenberger (1976), and the species is in all probability a synonym of P. tenuipes. The remaining four species all lack a beveled basis on pereopod 7 and can be separated into two groups using coxa 1, which is reduced and tapering in P. similis and P. vaporalis, and expanded and adze-shaped in P. fusiformis and P. caperesca. P. similis can be separated from P. vaporalis on the shape of coxa 1 (rounded in P. similis, triangular in P. vaporalis), and the basal articles of pereopods 5–7 (narrow in P. similis). Separation of the two remaining species P. fusiformis and P. caperesca is more difficult and relies on a number of quantitative characters which may be the result of ontogenetic variation. If they are conspecific, the name P. fusiformis would take priority over the more recently described P. caperesca.
Barnard and Shulenberger (1976) studied both Pacific and Atlantic specimens of P. caperesca and noted that there were indeed some minor morphological differences, e.g., in the basal articles of the antenna 2 flagellum, the right lacinia mobilis, spination of the palp of maxilla 1, and cuticular spines and setules. Minor differences in the slope on the ventral margin of the basis of pereopod 7 were also noted, but these variations were common to specimens from both Atlantic and Pacific collections.
No further detailed morphological studies on the genus have been undertaken and there have been no further records of the any of the other four Paralicella species in literature since their original descriptions. It is now apparent from the recent molecular studies (Ritchie et al., 2015; Bribiesca-Contreras et al., 2021; Mohrbeck et al., 2021) that there are likely to be more species residing in the P. caperesca complex. Determining the true P. caperesca and P. fusiformis (if these do indeed represent valid separate species), and clarifying the morphological characters that separate the molecularly defined species will require very detailed study of specimens of a variety of sizes and sexes from each of the clearly defined MOTUs.
Owing to the availability of extensive published molecular data and new material of Paralicella tenuipes and P. caperesca from the Atlantic, Pacific and Indian Oceans we provide a synthesis of the knowledge of the two species. We investigate the hypothesis that these two apparently widely distributed deep-sea species are actually complexes of molecularly uniform and geographically and/or bathymetrically restricted taxa, and provide an analysis of the phylogenetic relationships and historical evolution of the genus.
Materials and Methods
Data Assembly
In the present study, the datasets of two mitochondrial (cytochrome c oxidase subunit I [COI] and 16S rRNA) as well as one nuclear (28S rRNA) marker were analyzed. The material was obtained from published articles available by March 2021 (Ritchie et al., 2015; Jażdżewska and Mamos, 2019; Iguchi et al., 2020; Mohrbeck et al., 2021; Weston et al., 2021) supplemented by newly produced sequences. Figure 1 summarizes all datasets that have been used in this study, and information on new material collection, DNA extraction, amplification and sequencing is presented below.
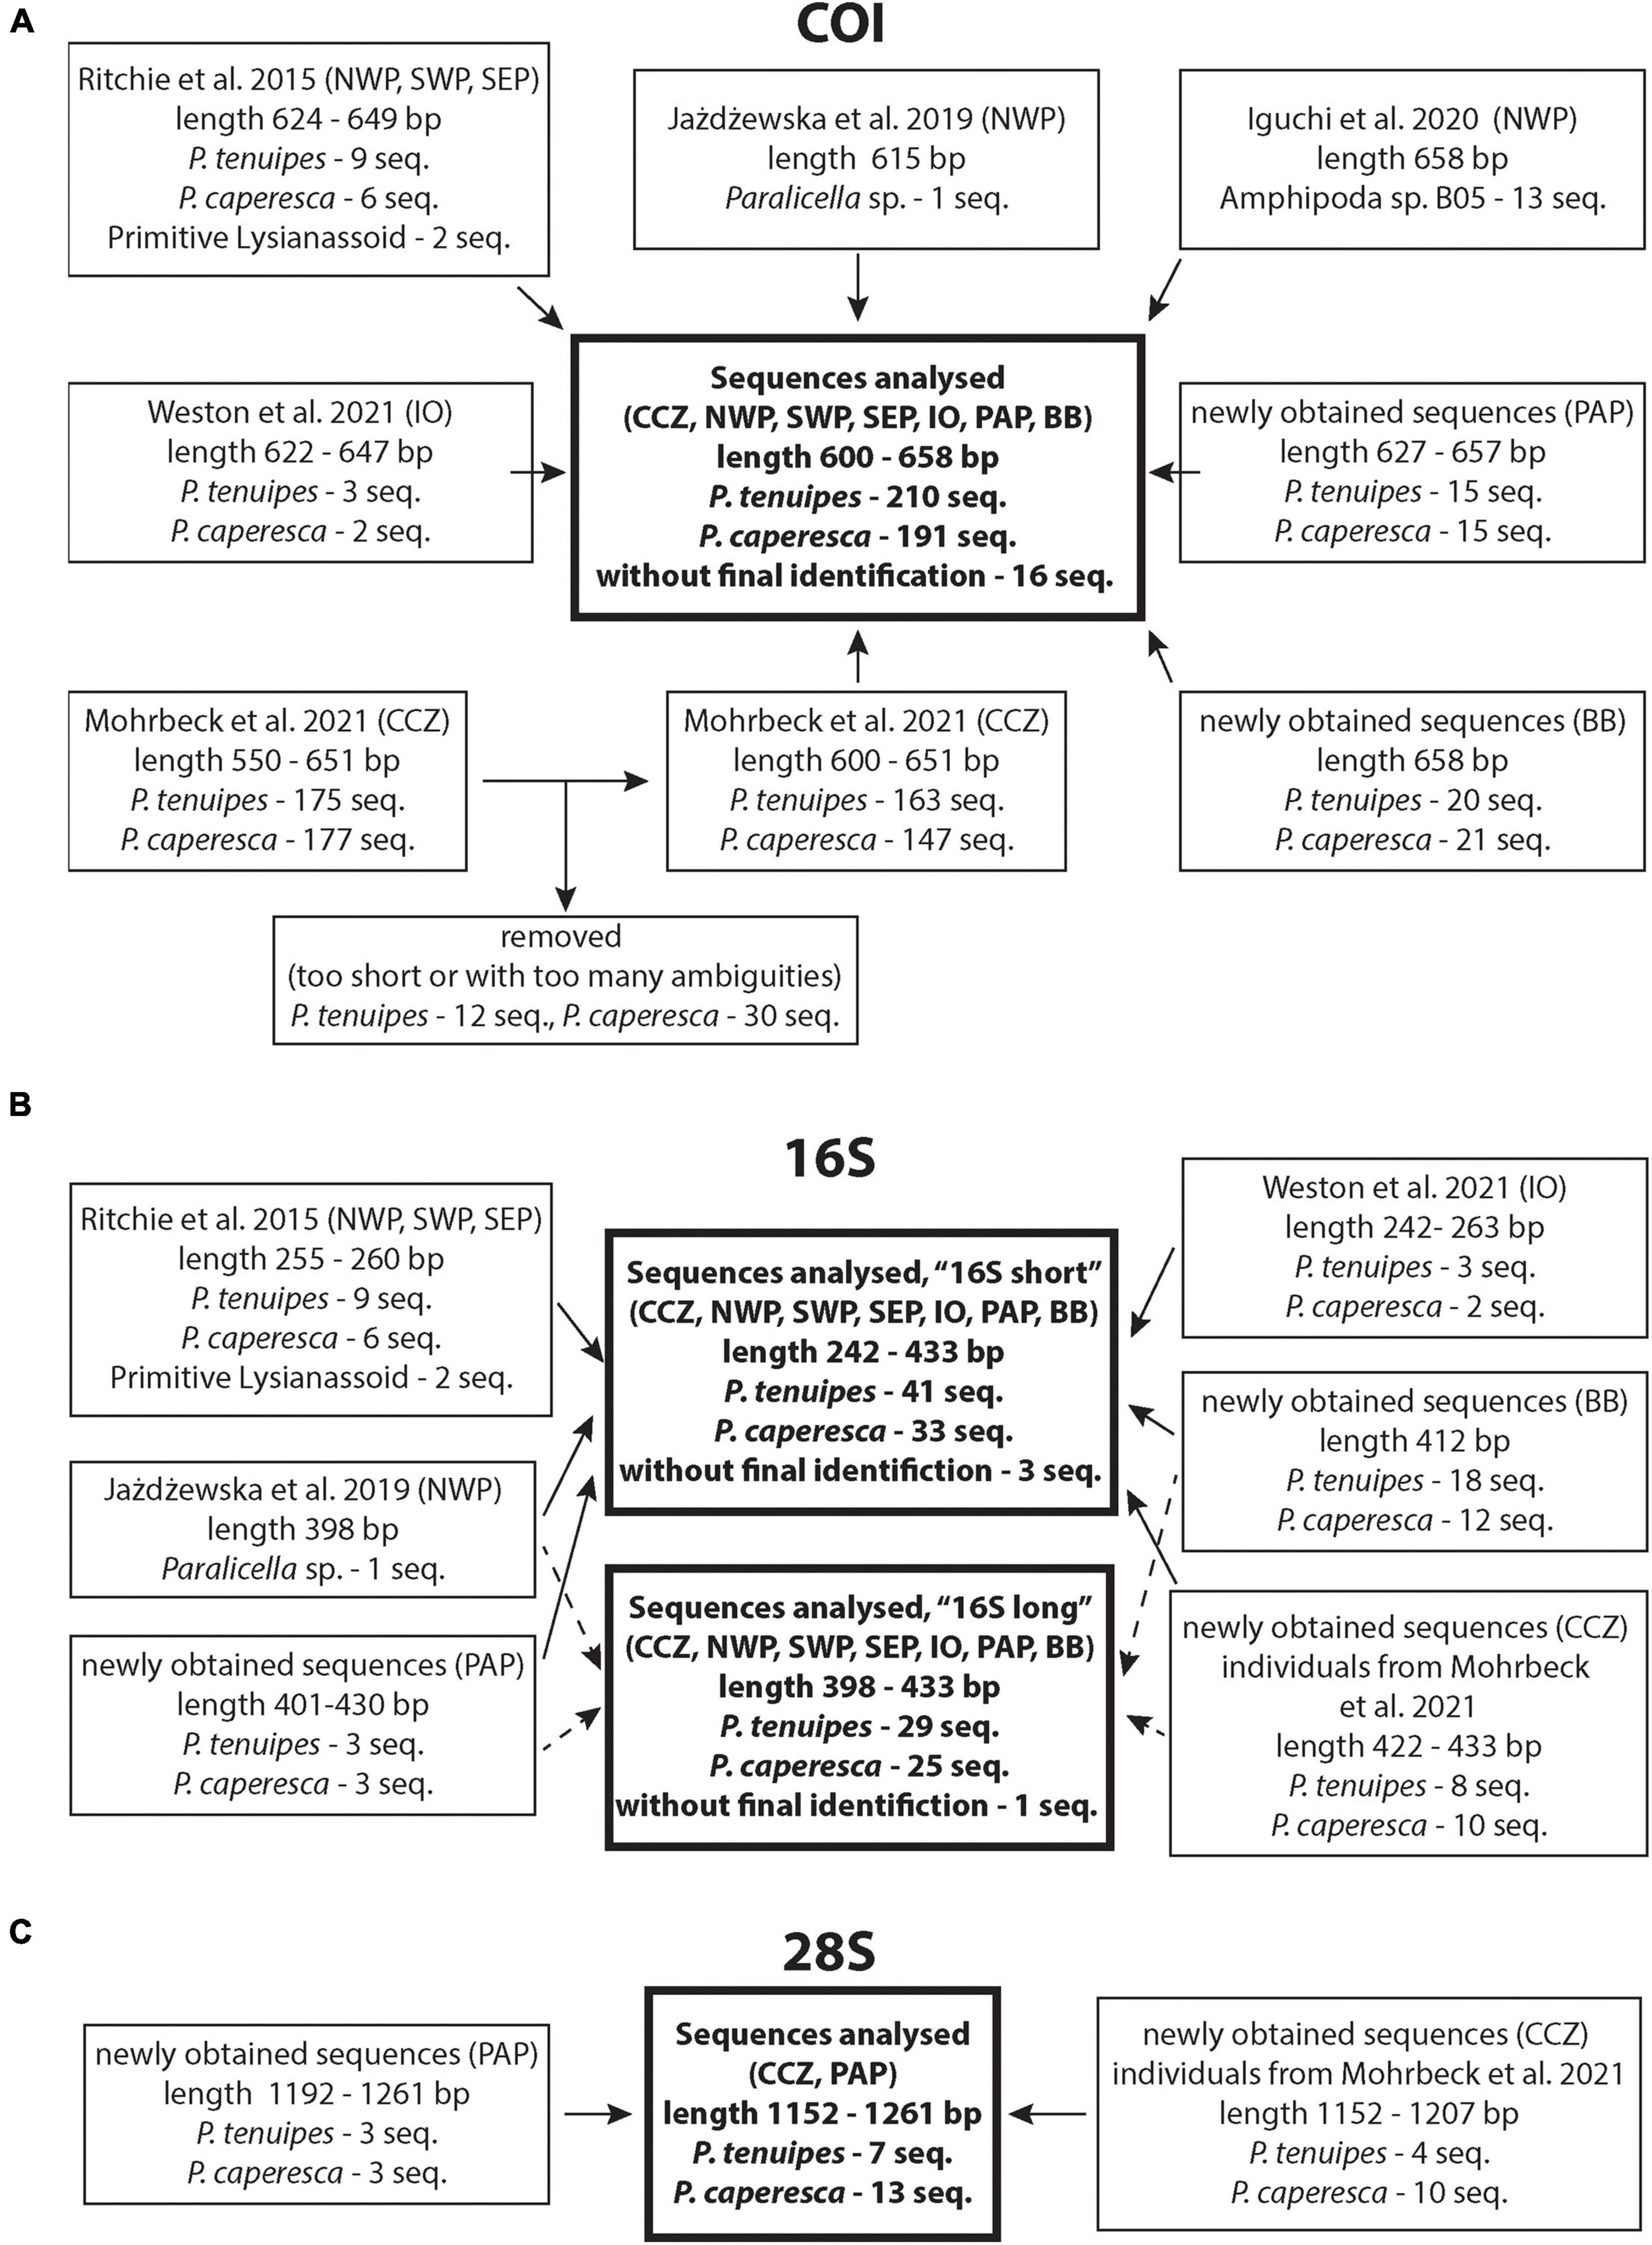
Figure 1. Summary of data used in the study with indication of the literature source, number of sequences and their initial length, general locality and original identification. (A) COI gene dataset, (B) 16S rRNA gene dataset, (C) 28S rRNA gene dataset. Geographic codes: BB, Brazilian Basin; South Atlantic; CCZ, Clarion-Clipperton Zone, Central Pacific; IO, Indian Ocean; NWP, North-West Pacific; SEP, South-East Pacific; SWP, South-West Pacific; PAP, Porcupine Abyssal Plain, North Atlantic.
All chromatograms of the newly obtained sequences were visually inspected, edited when reading mistakes happened in Geneious 10.1.2, and primer sequences were trimmed. These sequences were uploaded to GenBank under accession numbers: COI: MZ655819–MZ655889, 16S: MZ655914–MZ655967, 28S: MZ655890–MZ655910. Relevant voucher information, taxonomic classifications, and sequences of all studied genes (except for already published 16S sequences) are deposited in the dataset “DS-PCAPTEN” in the Barcode of Life Data System (BOLD)1 (Ratnasingham and Hebert, 2007)2. Additional summary that includes GenBank accession numbers for all sequences is available in the Supplementary Material S1.
New Material Collection and DNA Extraction
Thirty specimens of Paralicella (15 of each of P. caperesca and P. tenuipes) were analyzed from samples collected at the Porcupine Abyssal Plain Sustained Observatory (PAP-SO), situated in the subpolar North-East Atlantic, at 48°50′N 16°30′W and a water depth of 4850 m. Samples were collected by means of baited trap (for trap details see Horton et al., 2020, and sampling details in Hartman, 2019; Ruhl et al., 2019). In the South Atlantic, 41 individuals were collected at one station in the Brazilian Basin during the DIVA-3 expedition. These individuals were collected using a baited trap (its description and sampling procedure is described in Martínez Arbizu et al., 2015).
In the case of North Atlantic amphipods, the total genomic DNA was extracted from one-two pleopods using a mixture of 150 μl pure H2O with 0.015 g Chelex® (SIGMA-ALDRICH Co.) and 10 μl proteinase K. The digestion at 55°C lasted for 6 h. The DNA of individuals from the Brazilian Basin were extracted using an AutoGenprep 965 extraction robot after overnight digestion at 55° in the AutoGen buffers with proteinase-K.
Cytochrome c Oxidase Subunit I Gene Amplification and Sequencing
For North Atlantic individuals, the barcoding fragment of the COI gene amplification was conducted with the degenerated LCO1490-JJ and HCO2198-JJ primer pair (Table 2) and the reaction conditions described in Hou et al. (2007). Sequences were obtained by Macrogen Inc., the Netherlands on the Applied Biosystems 3730xl capillary sequencer. One-way (forward) sequencing was the standard procedure for all samples, but in addition, at least one individual of each recognized MOTU was sequenced in both directions.
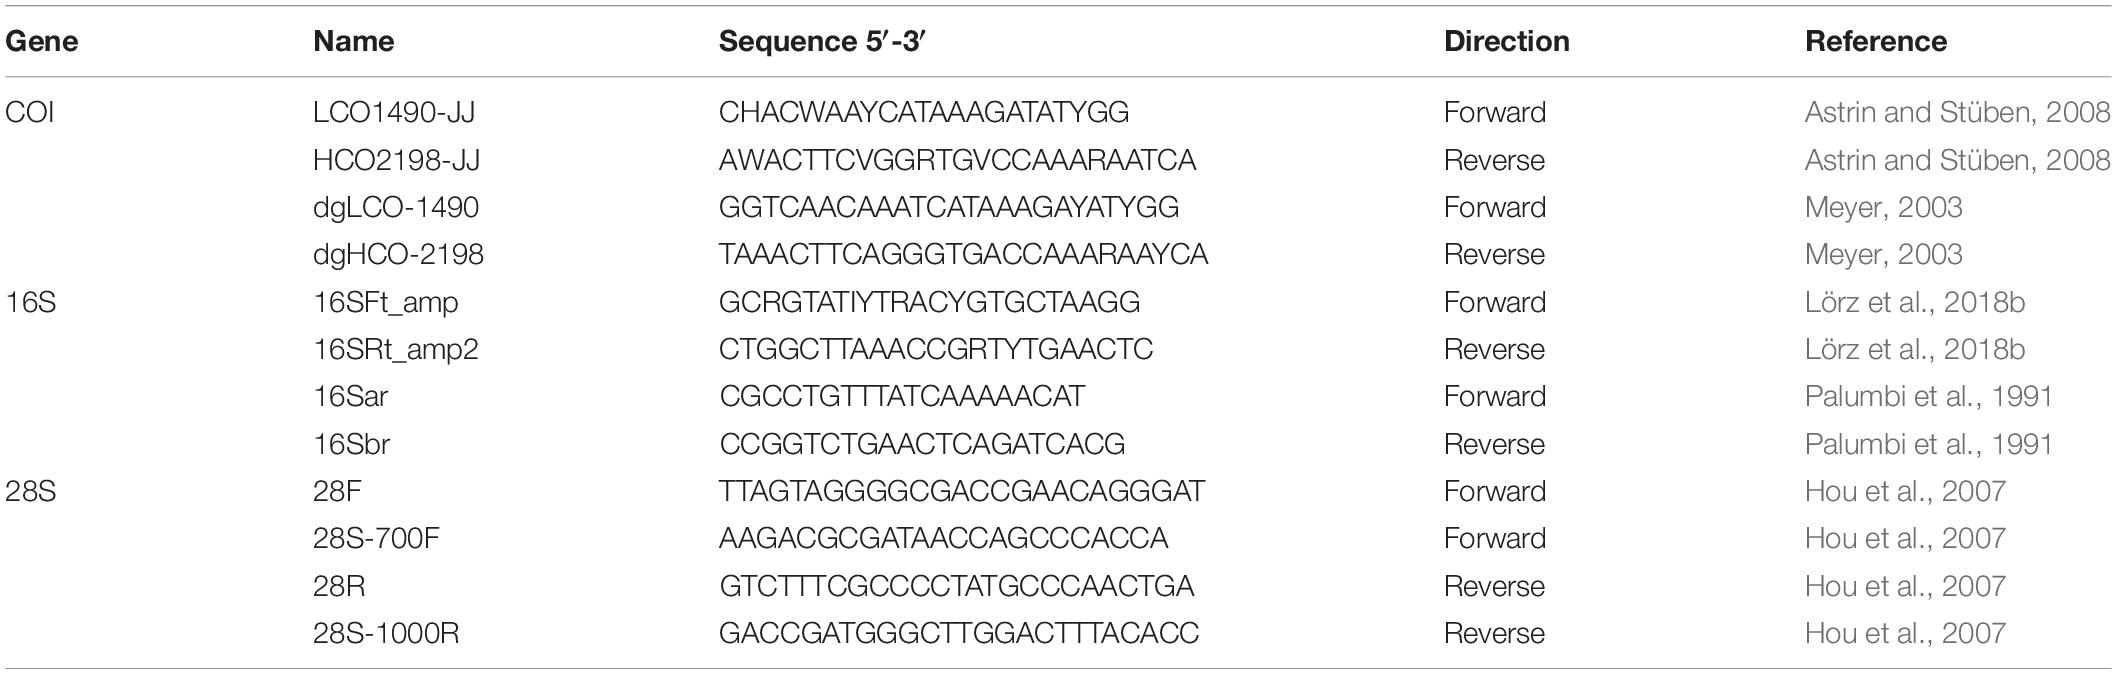
Table 2. Summary of the primers used in the present study.
The barcode fragment of the COI gene for the South Atlantic specimens of the studied species was amplified and sequenced with degenerate primers (dgLCO-1490/dgHCO-2198, Table 2) according to the protocol described in Riehl et al. (2014).
Sequences were initially blasted using default parameters on NCBI BLASTn and translated into amino acid sequences to confirm that no stop codons were present.
16S rRNA Gene Amplification and Sequencing
The 16S marker of 24 individuals (18 from the Central Pacific and six from North Atlantic, preferably one-two per each recognized BIN) was amplified using the primer pair 16SFt_amp/16SRt_amp2 (Table 2) in the conditions presented by Lörz et al. (2018b). In the case of the Central Pacific specimens, polymerase chain reaction was performed with AccuStart II PCR SuperMix (Quantabio), while for North Atlantic ones DreamTaq Green PCR Mastermix (Thermo Scientific) was used. Sequences were obtained from Macrogen Inc., the Netherlands, with the Applied Biosystems 3730xl capillary sequencer. Similarly to the COI gene, one-way (forward) sequencing was the standard procedure for all samples, but in addition, some individuals were sequenced in both directions. Additionally, 30 sequences of the specimens from the South Atlantic were successfully amplified and sequenced using the primer pair 16Sar/16Sbr (Table 2) at the Smithsonian Institution’s Laboratories of Analytical Biology. The protocol was as detailed in Riehl et al. (2014).
28S rRNA Gene Dataset
The analysis of the nuclear gene fragment was done on a restricted number of individuals from the central Pacific and North Atlantic. Twenty specimens representing 14 BINs (up to three individuals per BIN) were chosen, for which both COI and 16S sequences were already available. The fragment of 28S gene sequence amplification was conducted with the combination of two forward (28F, 28S-700F) and two reverse (28R, 28S-1000R) primers (Table 2) and reaction conditions published by Hou et al. (2007). Polymerase chain reaction was performed with AccuStart II PCR SuperMix (Quantabio) for central Pacific individuals, and DreamTaq Green PCR Mastermix (Thermo Scientific) for North Atlantic specimens. Sequencing in both directions was performed by Macrogen Inc., the Netherlands, while the editing of the sequences was similar to the procedure for COI and 16S genes, resulting in 20 sequences of 1152–1261 bp length.
Data Analysis
Separate alignments of the sequences of each gene were performed with MAFFT 7 (Katoh et al., 2002; Katoh and Standley, 2013) using the G-INS-i algorithm, the sequences were trimmed to have all of them of the same length. The RNA was homologous enough to use MAFFT software, the alignment was carefully inspected by eye and no ambiguous columns were found. Four alignments were produced: (1) full dataset of all COI sequences with the alignment length of 594 bp, (2) dataset of all available 16S sequences (“short”: length 267 bp), (3) restricted dataset of 16S sequences (“long”: length 398 bp), (4) dataset of all available 28S sequences (length: 1168 bp). Additionally, COI haplotypes were identified and a COI haplotype dataset generated using DNA SP v6 (Librado and Rozas, 2009).
Species Delimitation
Five molecular species delimitation methods were applied to reveal the Molecular Operational Taxonomic Units (MOTUs). Two methods were distance-based: Barcode Index Number (BIN) System (Ratnasingham and Hebert, 2013), and the Assemble Species by Automatic Partitioning (ASAP) (Puillandre et al., 2021). The following three were tree-based phylogenetic approaches using Generalized Mixed Yule Coalescent (GMYC) model-based method (Pons et al., 2006), according to Monaghan et al. (2009), the Bayesian implementation of the Poisson Tree Processes (bPTP) (Zhang et al., 2013) and multirate Poisson Tree Process (mPTP) (Kapli et al., 2017). The dataset of all COI sequences was used for BIN, ASAP and mPTP. Short 16S sequences were analyzed with ASAP and GMYC, while both the long ones and the 28S sequences were used for the above two methods and mPTP. The restricted datasets of haplotypes of all three markers were the basis for ASAP, bPTP, mPTP, and GMYC analyses.
The BIN method is implemented as part of the Barcode of Life Data system (BOLD; Ratnasingham and Hebert, 2007). It compares newly submitted sequences with the sequences already available. They are clustered according to their molecular divergence using distance-based algorithms (single linkage clustering followed by Markov clustering) that aim at finding discontinuities between Operational Taxonomic Units (OTUs). Each OTU receives a unique and specific code (aka Barcode Index Number or BIN), either already available or new if the submitted sequences do not cluster with already known BINs. Each BIN is registered in BOLD.
The Assemble Species by Automatic Partitioning (ASAP) (Puillandre et al., 2021) is a method that uses pairwise genetic distances to assemble individuals into groups and proposes species partitioning ranked according to a scoring system.
The GMYC method defines MOTUs through identification of the switch from intraspecific branching patterns (coalescent) to interspecific species branching patterns (Yule process) on a phylogenetic tree. Because for GMYC an ultrametric tree is required, as an input, a Bayesian tree was reconstructed in BEAST 2.6.3 (Bouckaert et al., 2019). The site model was set up with bModelTest (Bouckaert and Drummond, 2017). The tree prior was set to Birth-Death following Bayes factors. Two runs of Markov chain Monte Carlo (MCMC) were performed each 20 M generations-long, sampled every 2,000 generations. Runs were examined for convergence in Tracer 1.7 (Rambaut et al., 2018). All runs reached the effective sample size (ESS) above 200 and were combined using LogCombiner 2.6.3. The final tree was summarized with TreeAnnotator 2.6.3, all being part of BEAST 2.6.3 package. The Bayesian tree was uploaded into the R 4.0.5 (R Core Team, 2021) software package ‘SPLITS’ (Species Limits by Threshold Statistics) (Ezard et al., 2009) and analyzed using the single threshold model.
For the following methods, a phylogenetic tree was reconstructed with Maximum Likelihood (ML) approach using RAxML 8.2.8 (Stamatakis, 2014) through raxmlGUI 2.0 (Edler et al., 2021). The best-scoring ML trees were produced using the GTRGAMMA substitution model. Bipartition information was drawn from the phylogenies obtained with the rapid hill climbing tree search algorithm. Statistical supports were estimated with thorough bootstrap tests set to 1000 repetitions.
The bPTP incorporates the number of substitutions in the model of speciation and assumes that the probability that a substitution gives rise to a speciation event follows a Poisson distribution (Zhang et al., 2013). The analysis was performed on the bPTP webserver3 with 500,000 iterations of MCMC and 10% burn-in.
The mPTP method incorporates different levels of intraspecific genetic diversity deriving from differences in either the evolutionary history or sampling of each species. The method implements MCMC sampling that provides a fast and comprehensive evaluation of the inferred delimitation (Kapli et al., 2017). Five runs of 100 M MCMC generations long chain with a burn in of 10% were performed on a local server.
Pairwise p-distances between all recognized MOTUs and P. tenuipes were calculated on the complete COI dataset and on the restricted dataset of COI haplotypes. Within MOTUs, distances were also calculated using p-distance separately for six datasets (two for COI, three for 16S, and one for 28S). To visualize the MOTUs Neighbor-Joining (NJ) tree of all COI sequences was generated based on p-distances (transition and transversion substitution included and complete deletion) with 1000 bootstrap replicates (Felsenstein, 1985) in MEGA V7.0.18 (Kumar et al., 2016).
Molecular Operational Taxonomic Unit Distribution and Population Connectivity
The distribution of each recognized MOTU was plotted on the World map using QGIS 3.16 (QGIS.org, 2021). The distributions included all records of both nominal species extracted from the relevant literature (Supplementary Material S2). Furthermore, to present the molecular divergence of haplotypes and their geographical allocation, Median Joining Networks were generated in PopART 1.7 (Bandelt et al., 1999) separately for the two nominal species and independently for each recognized MOTU within P. caperesca.
Reconstruction of Phylogeny and Demography
Up to three individuals of each BIN were used to produce a time-calibrated phylogeny. It was based on the combined COI and 16S dataset, so only the individuals with sequences of both genes were included (except for the two BINs AEG2603 and ACZ4873, for which only COI sequence was available). The analysis was conducted in Beast 2.6.3 (Bouckaert et al., 2014). The molecular clock was set using a strict clock and general for gammarid amphipods the COI rate based on multiple calibration points (including fossils) of 0.01773 substitutions/site Ma-1 (Copilaş-Ciocianu et al., 2019). The value is in congruence with other works on Amphipoda (e.g. Mamos et al., 2016). The substitution model was selected via bModelTest (Bouckaert and Drummond, 2017). Birth-Death process was selected as a tree prior. Four runs of the MCMC, each 20 million generations long and sampled every 2,000 generations, were performed and examined for convergence in Tracer 1.7 (Rambaut et al., 2018). All runs reached the effective sample size (ESS) above 200 and were combined using LogCombiner2.6.3. The final tree was summarized with TreeAnnotator 2.6.3, all being part of BEAST 2.5.2 package.
Sampling of the studied taxa in different areas of the World Ocean differed, but it was possible to separate geographic populations for some of the MOTUs (MOTU 1, 4, and 5 of P. caperesca and P. tenuipes) and they were further studied for molecular diversity and demography. In this case, the minimum number of individuals of a particular population was seven. The COI molecular diversity of each population was calculated as the total number of haplotypes and haplotype diversity. Historical demographic patterns were explored using the COI data set employing two approaches. First, to test for a recent demographic expansion, Tajima’s D (Tajima, 1989) and Fu’s Fs (Fu, 1997), Fu and Li’s D (Fu and Li, 1993), Fu and Li’s F (Fu and Li, 1993; Achaz, 2009) Ramos-Onsins and Rozas’s (Ramos-Onsins and Rozas, 2002) indices were calculated using DNASP 6. Their statistical significance was evaluated using 1000 simulated samples. Second, the extended Bayesian skyline plot (eBSP) (Drummond et al., 2005) in BEAST 2.5.2 was used to visualize the demographic changes through time. The clock model, as well as the rate and priors on the substitution models for each group, were determined in the same way as for the time-calibrated phylogeny population model was set to 0.5. The MCMC chain was run two times to ensure convergence for 20 million generations, sampled every 20,000 generations. One run for each data set was used to plot the eBSP in R script4 after a 10% burn-in phase.
In order to assess putative relation between geographic and molecular distances we used linear regression model in R 4.0.5 (see footnote 4). The visualization was performed for Paralicella tenuipes and two MOTUs of P. caperesca (MOTU 1 and 5). Sampling locations were divided into the following groups (putative populations): CCZ (Clarion-Clipperton Zone, central Pacific), APEI 6 (North of CCZ, Central Pacific), NWP (North-West Pacific), BB (Brazilian Basin, South Atlantic), PAP (Porcupine Abyssal Plain, North Atlantic). Geographic distances were estimated using Google Earth Pro. Within an ocean they were measured by drawing straight line between central points of each station group. Considering that in the case of the distances between Pacific and Atlantic populations such method would draw the line across the continent, for calculating the distances between these groups of stations the line was drawn to surround South America through the Drake Passage. Because of the low number of groups to compare (max 10) we decided only to run a simple linear regression visualization instead of correlation and isolation by distance tests.
Results
Species Delimitation
All species delimitation methods clearly separated the two main lineages leading to the nominal Paralicella tenuipes and P. caperesca (Figure 2). A few sequences identified as P. tenuipes that grouped with P. caperesca seem to be associated with identification mistakes and will be discussed later in the text. The interspecies distances of COI between the two species varied from 0.156 to 0.188 (Table 3).
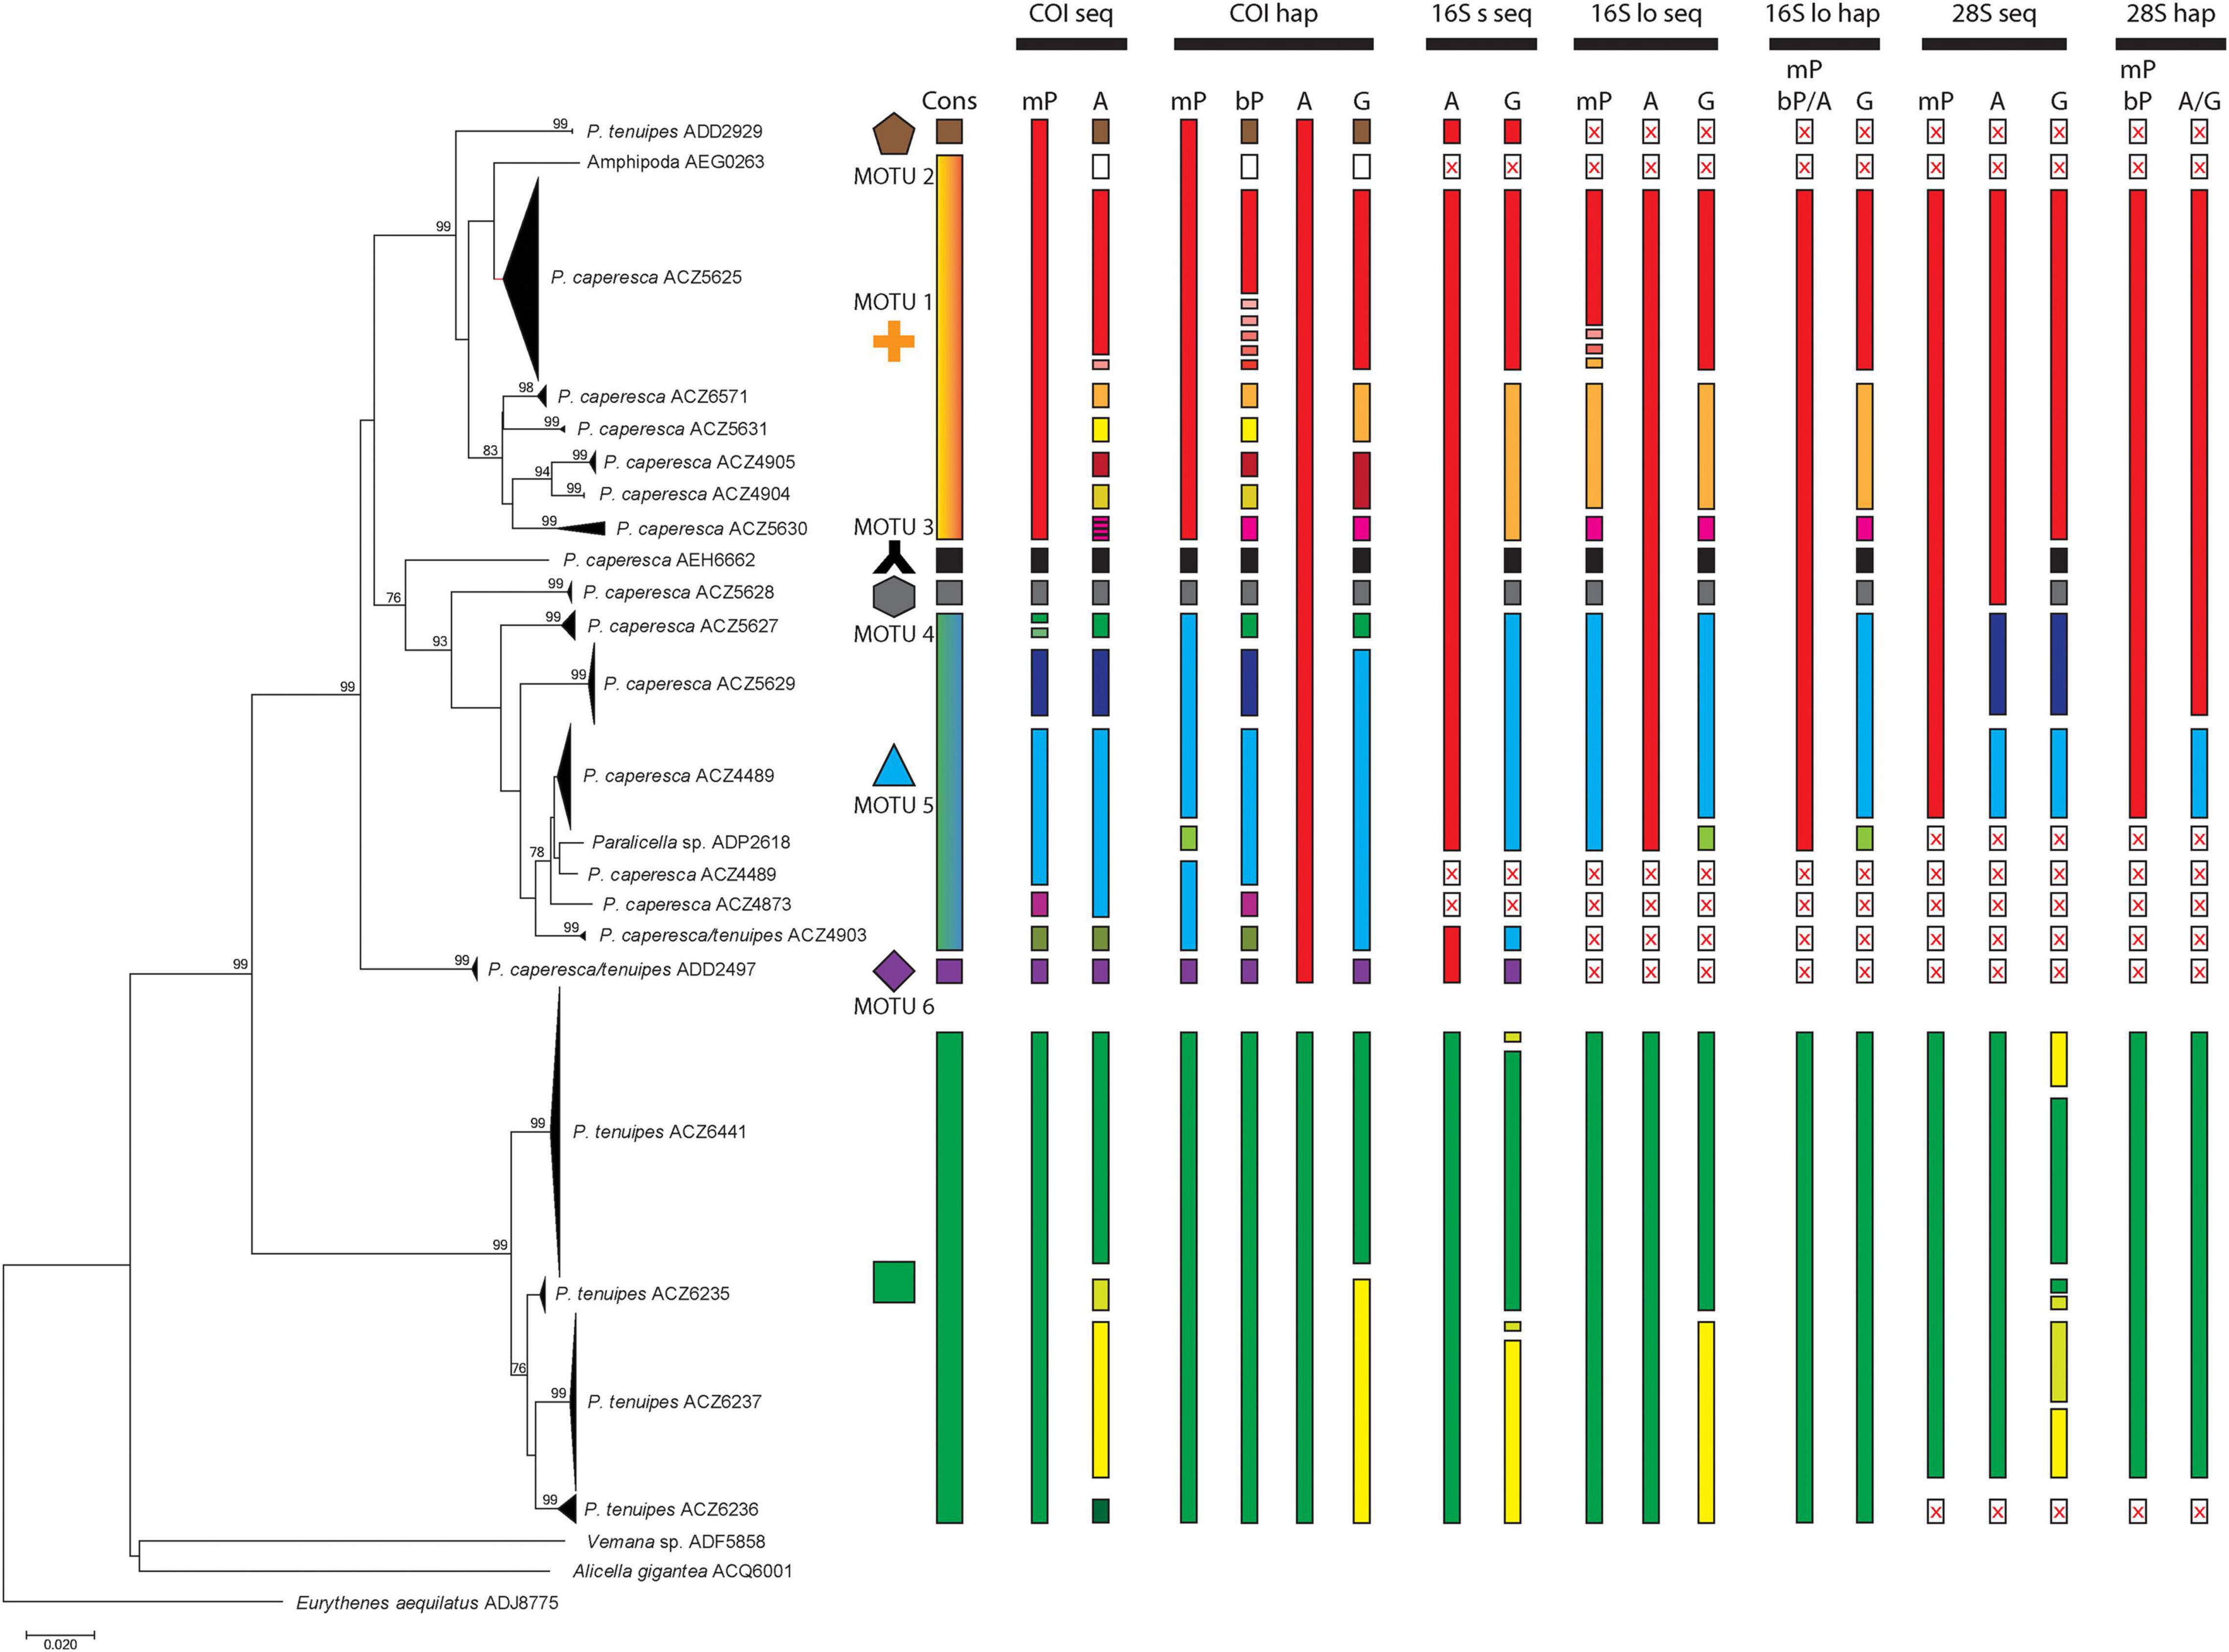
Figure 2. Neighbor-Joining tree presenting the clustering of all studied sequences and indication of different species delimitation. The branches were collapsed according to the Barcode Index Numbers ascribed by BOLD. Cons, consensus MOTU delimitation. Data: COI seq, all COI sequences; COI hap, COI haplotypes; 16S s seq, 16S sequences (short ones); 16S lo seq, 16S sequences (long ones); 16S lo hap, 16S haplotypes (long sequences); 28S seq, 28S sequences; 28S hap, 28S haplotypes. Delimitation methods: mP, mPTP; bP, bPTP; A, ASAP; G, GMYC. Bootstrap support (1000 replicates), only values higher than 75 shown. Box with red X inside – missing data.
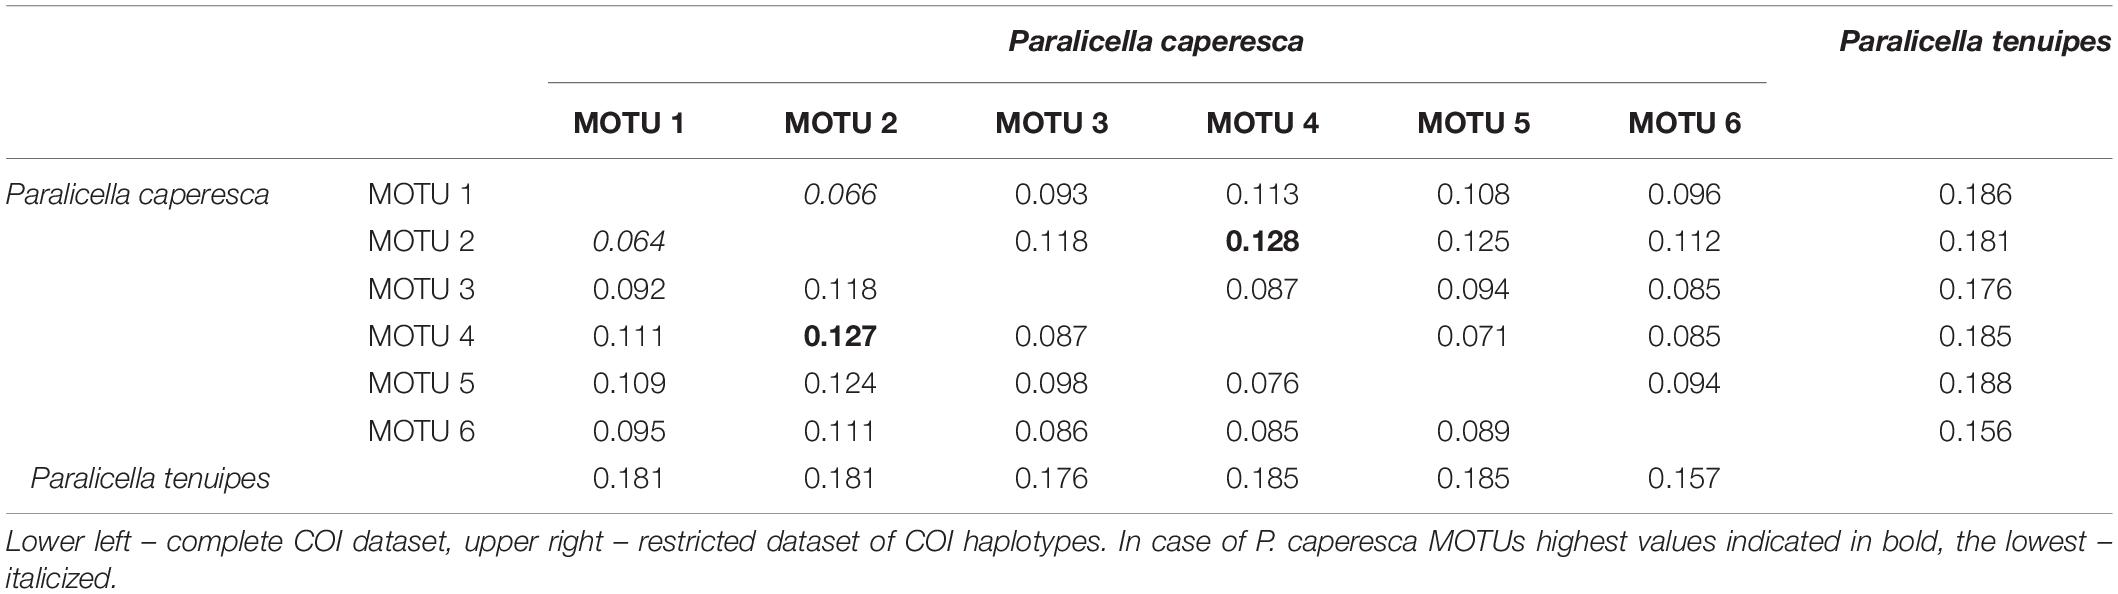
Table 3. Inter-species COI p-distances between MOTUs identified within P. caperesca.
Delimitation within P. tenuipes recognized from one (majority of methods) to four molecular units (Figure 2). The least conservative were BIN system and ASAP based on COI sequences that have recognized four units. GMYC recognized either three (16S short sequences, 28S sequences) or two (16S long sequences) MOTUs. The mean intraspecific p-distance of COI sequences was 0.018 (0.000-0.040), while for COI haplotypes – 0.021 (0.002–0.040) (Table 4). For the 16S dataset, in the case of short sequences the mean distance was 0.009, in the case of long sequences it was 0.005 (0.007 for haplotypes). All 28S sequences were identical.
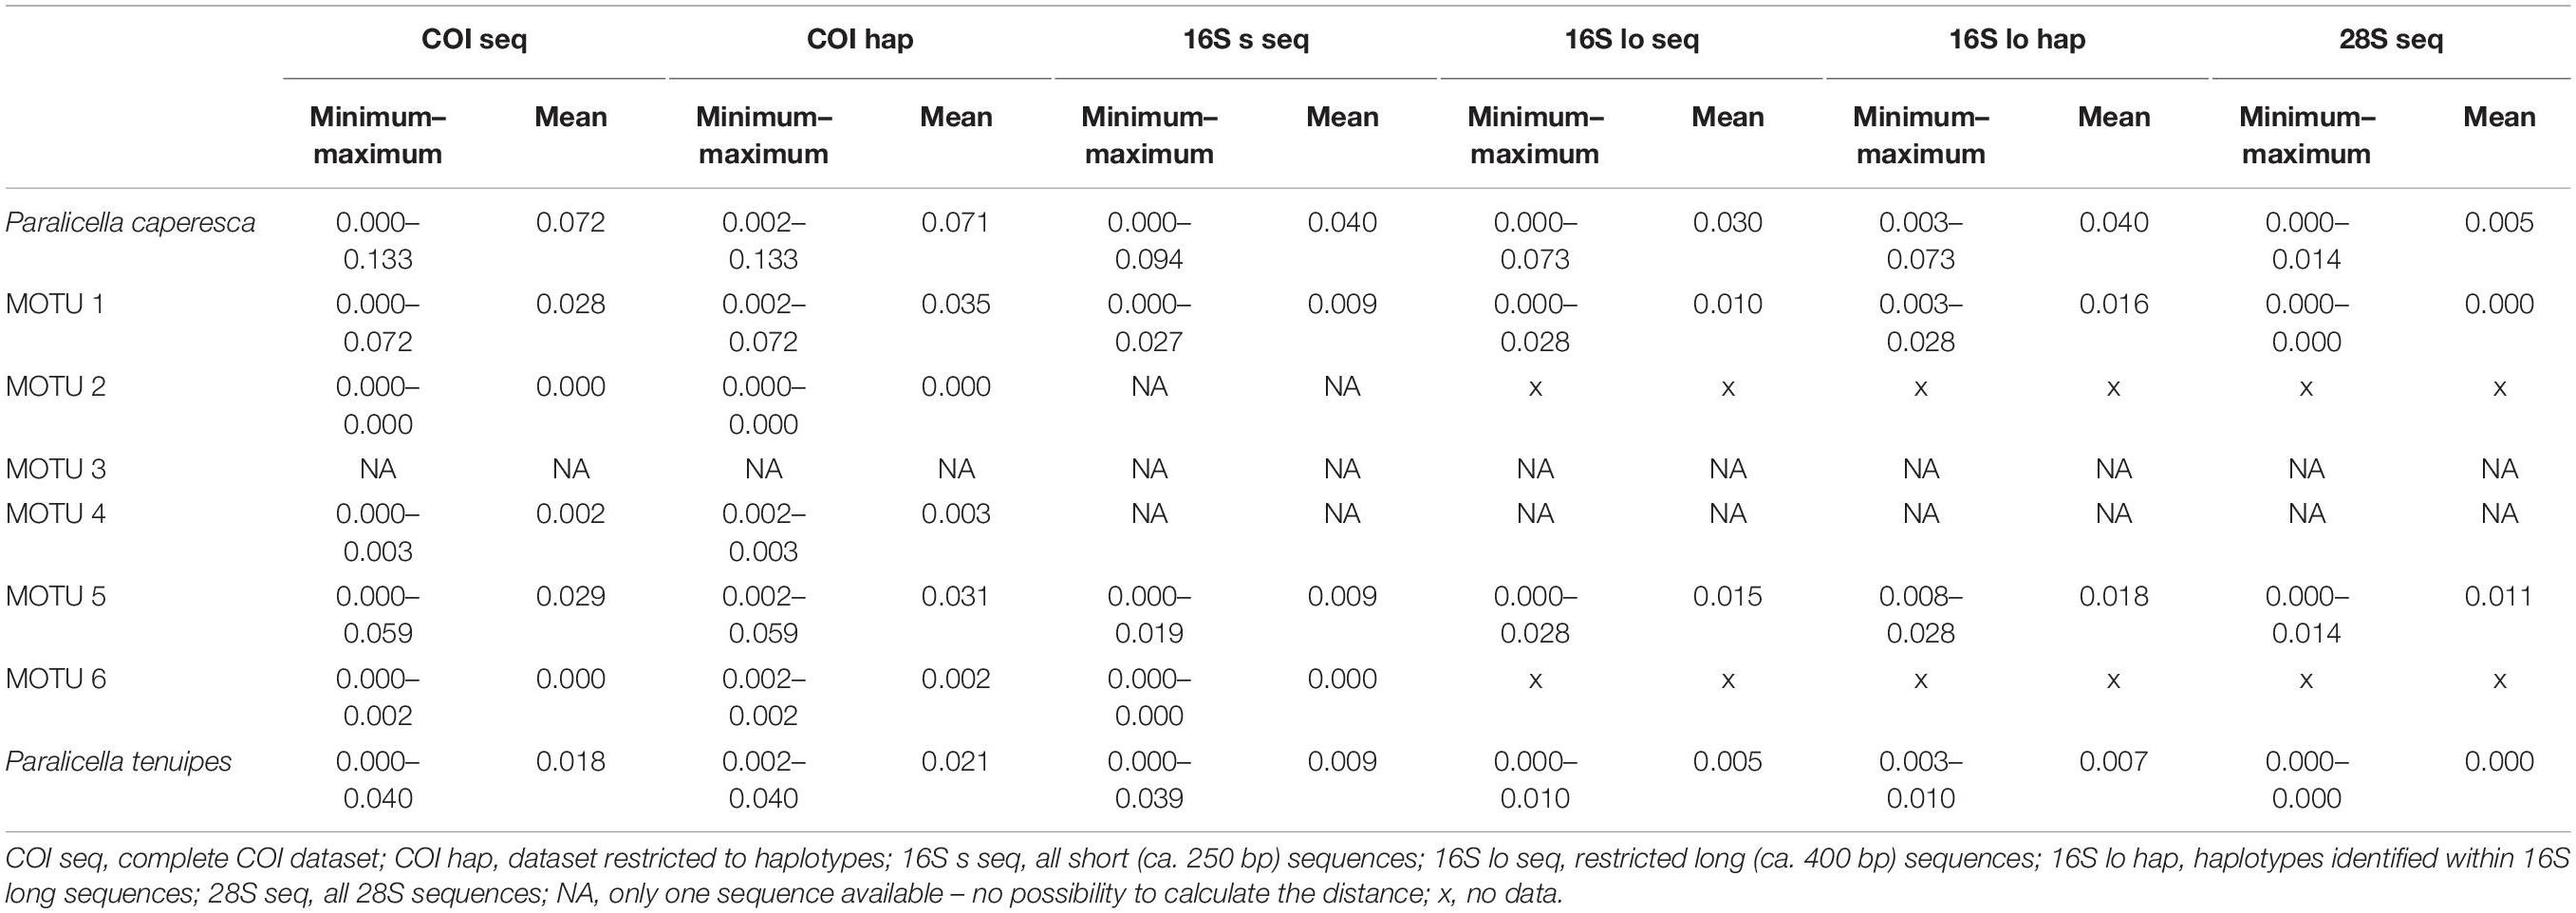
Table 4. Minimum, maximum, and mean p-distances calculated for the nominal species studied and the MOTUs identified within P. caperesca.
Delimitation of MOTUs within P. caperesca varied strongly from the recognition of a single unit (ASAP on COI haplotypes and on all 16S combinations, mPTP on 16S haplotypes as well as on 28S sequences and haplotypes, bPTP on 16S and 28S haplotypes) to as many as 21 groups (bPTP on COI haplotypes) (Figure 2). It confirms the existence of separate lineages. After removing the extreme unifications and divisions, it may be observed that four lineages represented by the following BINs: BOLD:ADD2929 (MOTU 2), BOLD:AEH6662 (MOTU 3), BOLD:ACZ5628 (MOTU 4), BOLD:ADD2497 (MOTU 6) were most commonly separated from the rest of the groups. The lineages forming the remaining two groups did not present a stable pattern of unification/separation and for this study were treated as two separate MOTUs. MOTU 1 consisted of seven BINs (BOLD:AEG0263, BOLD:ACZ5625, BOD:ACZ5671, BOLD:ACZ5631, BOLD:ACZ4905, BOLD:ACZ4904, BOLD:ACZ5630), whereas MOTU 5 grouped six BINs (BOLD:ACZ5627, BOLD:ACZ5629, BOLD:ACZ4489, BOLD:ADP2618, BOLD:ACZ4873, BOLD:ACZ4903). The COI p-distances between discriminated MOTUs of P. caperesca ranged from 0.064 (between MOTU 1 and 2) to 0.128 (observed for the MOTU 2 and 4 pair) (Table 3). The intraspecific p-distances within nominal P. caperesca varied from 0.000 up to 0.133 of COI, from 0.000 to 0.094 of 16S and from 0.000 to 0.014 of 28S (Table 4). These values were clearly reduced when the species were divided into suggested MOTUs. Within MOTU 1 p-distance of COI reached up to 0.072 (mean 0.028 for sequences and 0.035 for haplotypes). Within 16S, the maximum p-distance was 0.027, when the dataset of short (ca. 250 bp) sequences was used, while it slightly raised up to 0.028 when the longer fragment (ca. 400 bp) was analyzed. The 28S sequences within MOTU 1 are identical. MOTUs 2, 3, 4, and 6 showed intraspecific p-distances not higher than 0.003 no matter the dataset explored. In the case of MOTU 5, the maximum p-distance of COI reached 0.059 (mean 0.029 for sequences, 0.031 for haplotypes). For the 16S gene, the dataset of short sequences showed lower values of p-distance (max – 0.019, mean – 0.009), while they reached up to 0.028 (mean 0.015 for sequences, 0.018 for haplotypes) in case of longer sequences. The nuclear gene was diverse with a mean p-distance of 0.011 (maximum – 0.014). MOTU 1 and 3 shared a 28S sequence, while MOTU 5 was represented by three clearly different sequences, additionally separated by the 28S sequence of MOTU 4 (Supplementary Figure S1).
Molecular Operational Taxonomic Unit Distribution and Populations Connectivity
The literature records of both nominal species come from all three oceans; the molecular study confirmed the pan-oceanic distribution of P. tenuipes (Figure 3) and MOTU 1 of P. caperesca (Figure 4). MOTU 5 was widely distributed in both Atlantic and Pacific oceans, whereas MOTUs 4 and 6 were observed at a few localities in the Pacific only. The most restricted geographically appeared to be MOTU 2 and MOTU 3, each recognized from a single station, the first in South-West Pacific and the second in the North Atlantic. Although in some localities only a single MOTU were observed, in the areas where more individuals of P. caperesca were collected and studied, different lineages co-occurred (Figure 4).
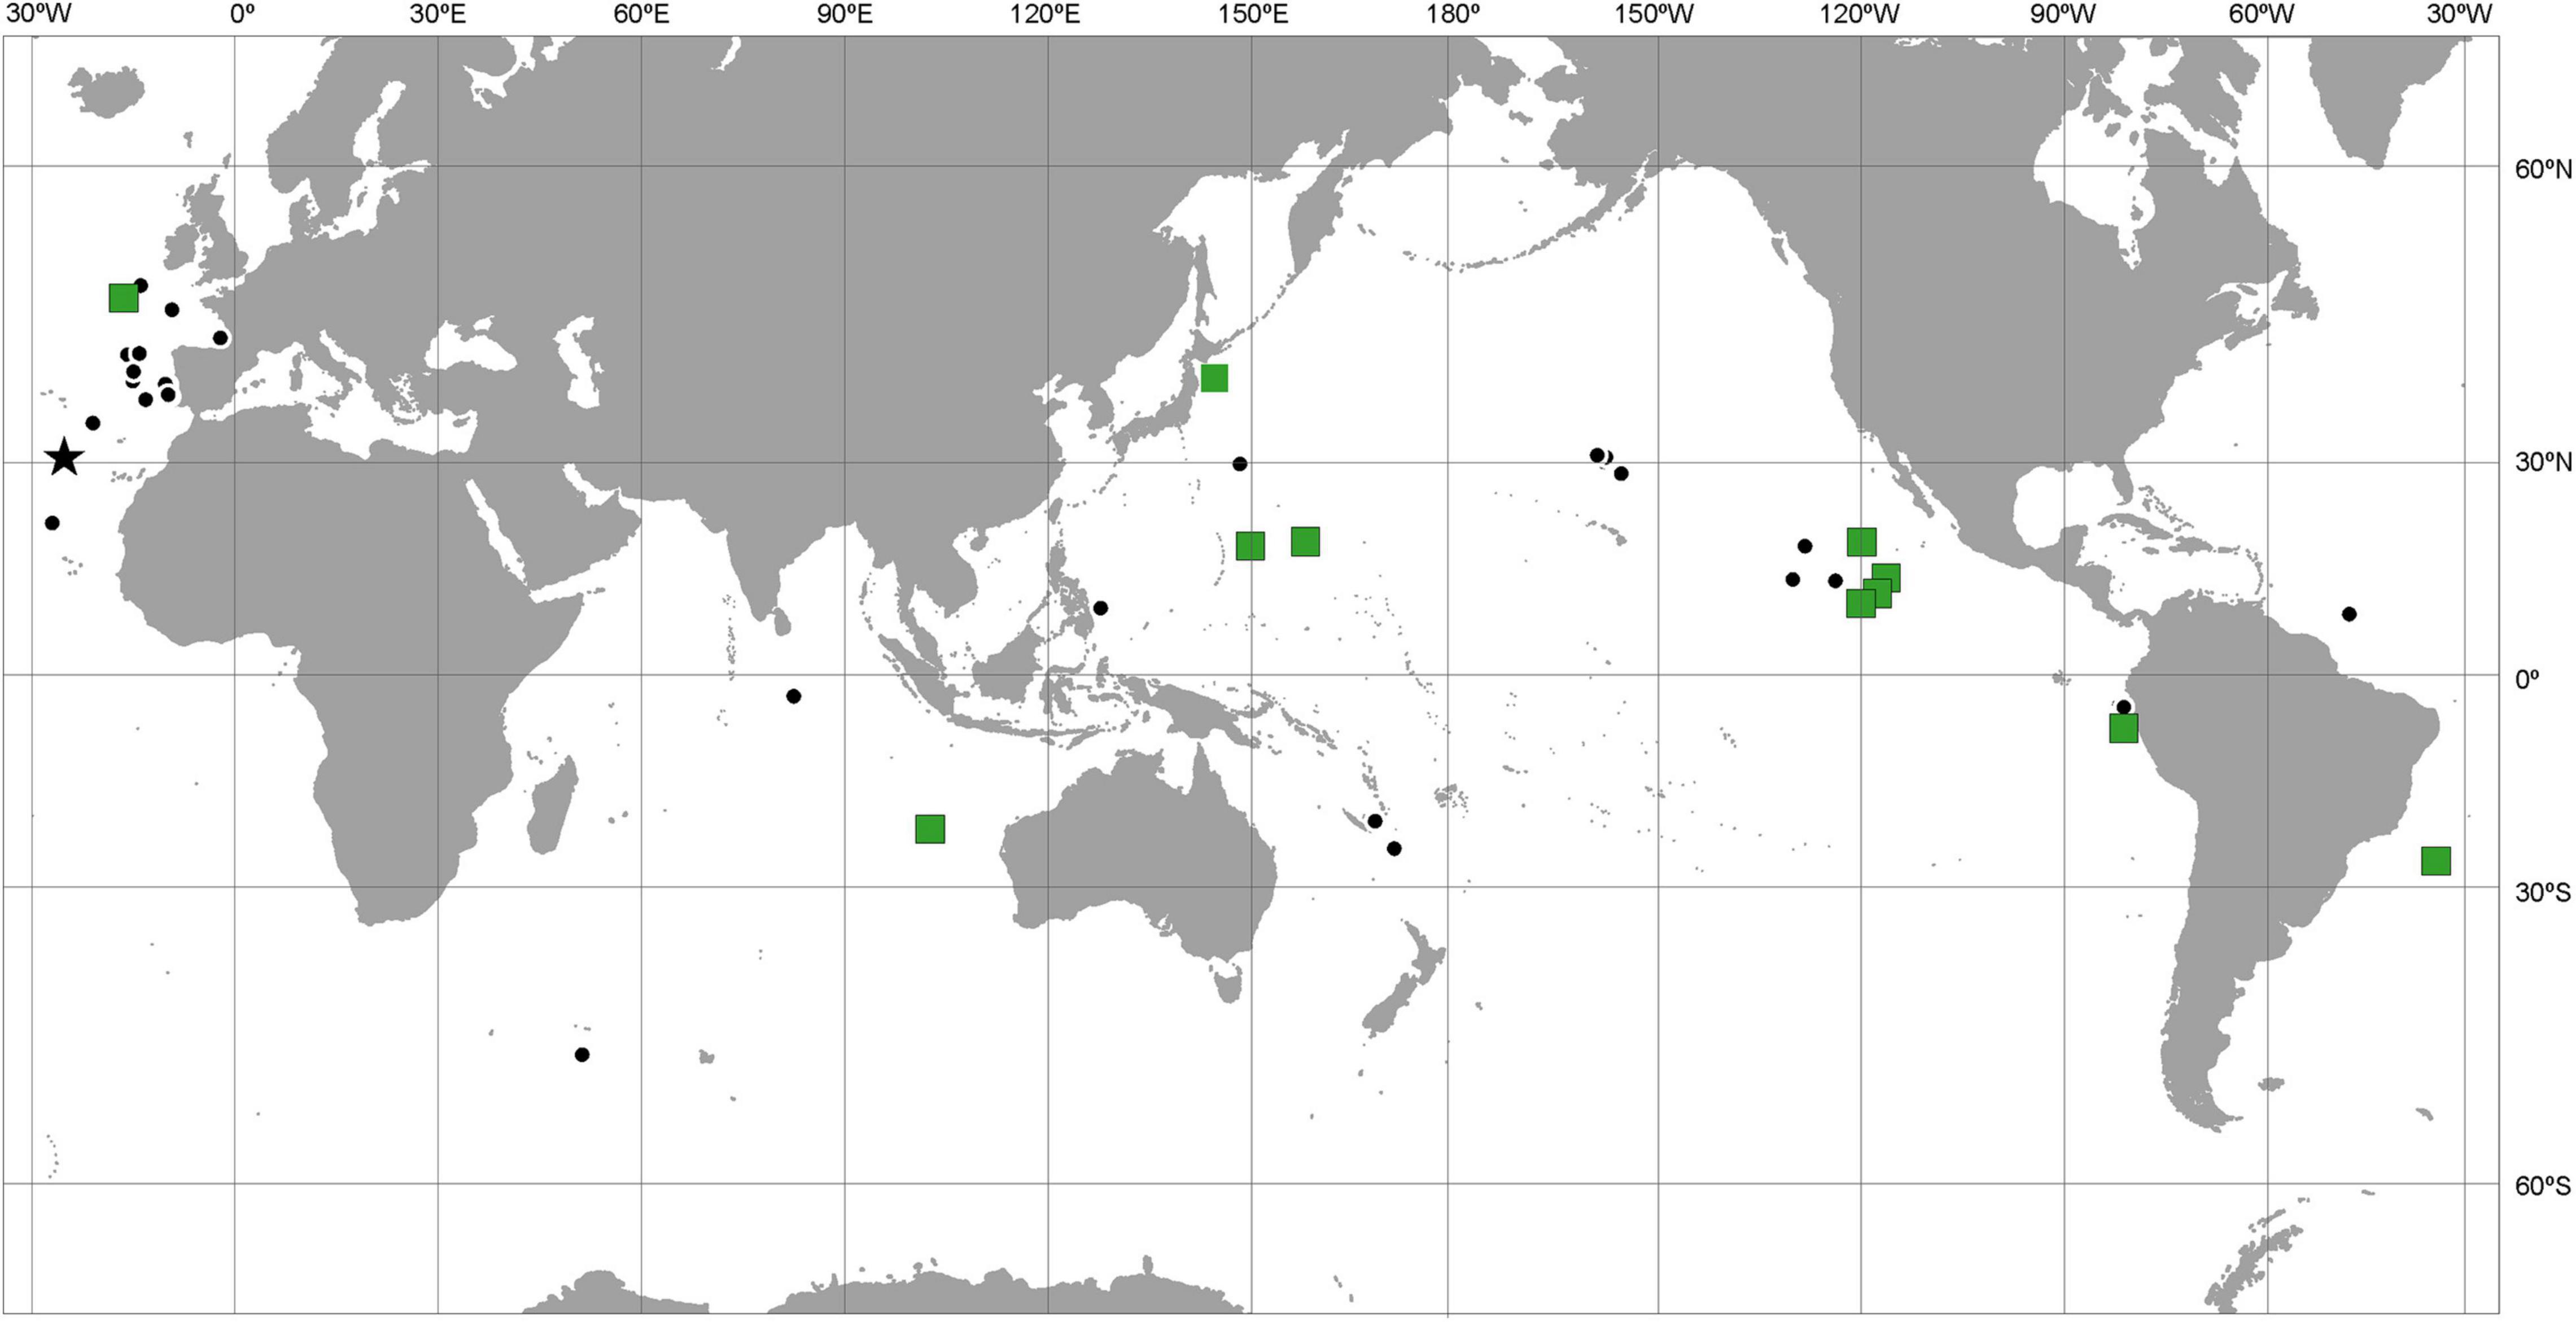
Figure 3. Distribution map of Paralicella tenuipes. Black dots indicate literature records. Green squares show stations from where the individuals for molecular studies were obtained. Star – type locality of the species. Full list of references used to prepare the map in Supplementary File S2.
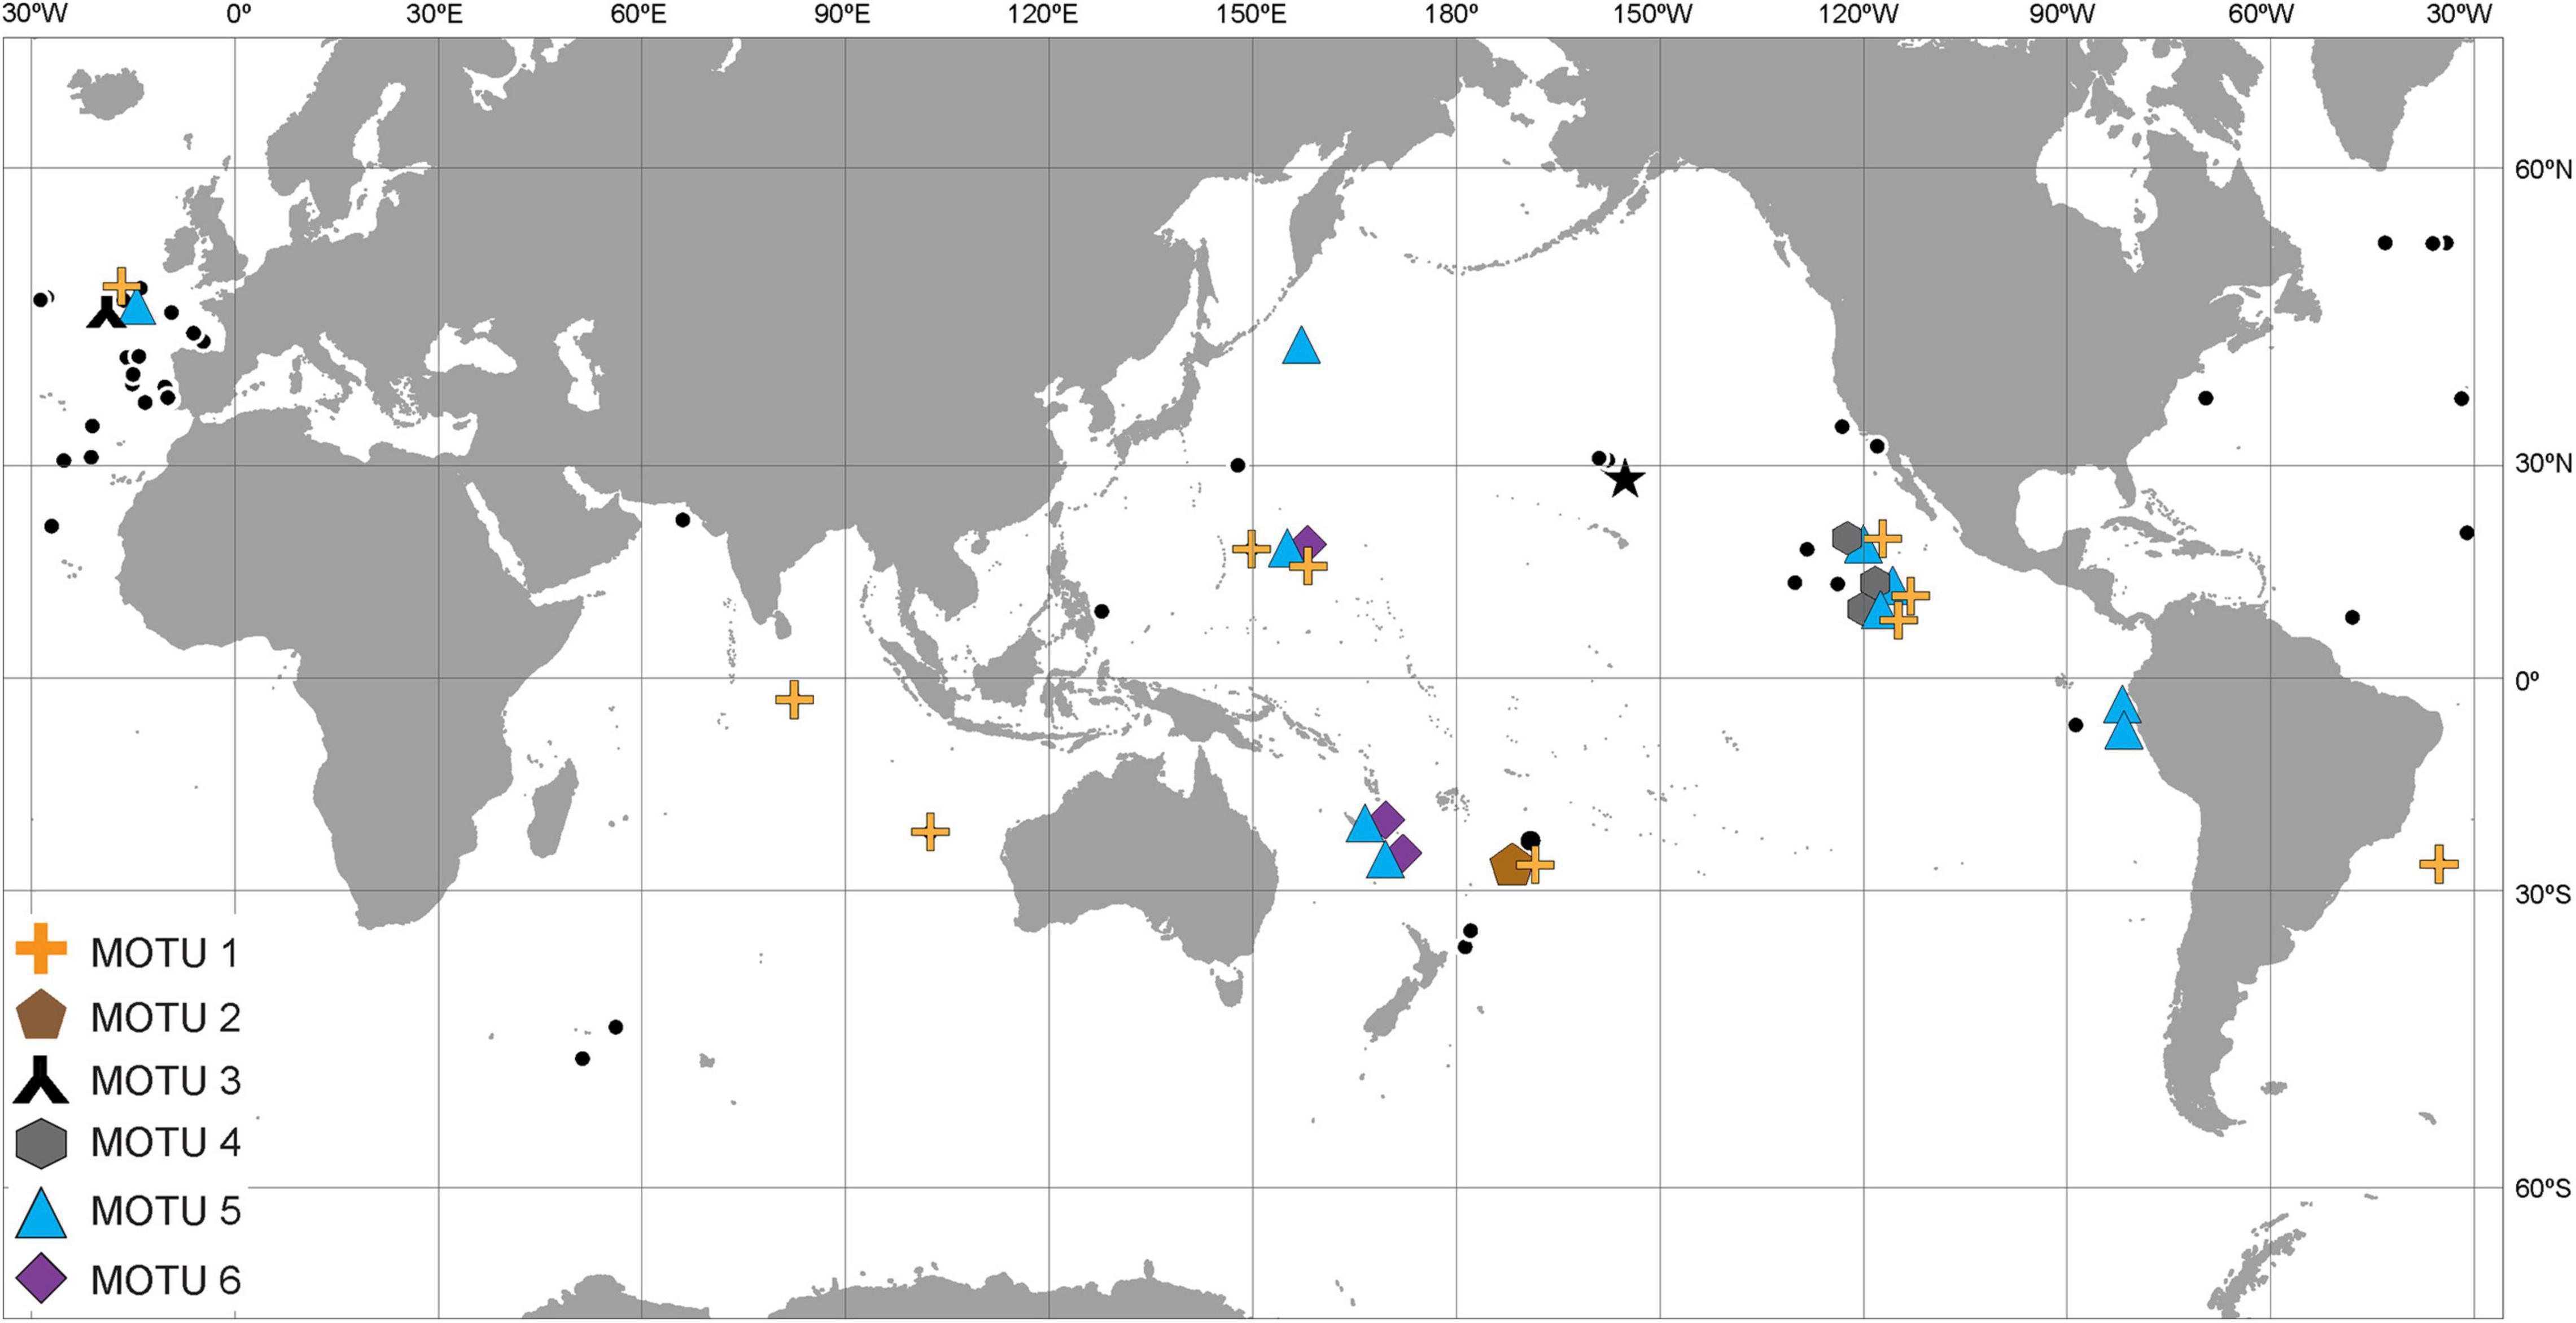
Figure 4. Distribution map of Paralicella caperesca. Black dots indicate literature records. Color symbols (same as in Figure 1) show localities from where the individuals for molecular study were obtained. Star – type locality of the species. Full list of references used to prepare the map in Supplementary File S2.
Out of the 19 haplotypes identified within P. tenuipes, seven were singletons, the remaining ones were often shared between the studied regions (Figure 5). As many as 171 individuals represented one of the five dominant haplotypes, 34 individuals characterized the remaining 14 haplotypes. The majority of haplotypes of P. caperesca (56 out of 80) were singletons. Within MOTU 1, there were four haplotypes shared between geographical regions, with one almost equally represented in Pacific and Atlantic oceans. One additional haplotype was shared between North and South Atlantic, while another one was found in South Atlantic and Indian Ocean (Figure 6). The structure of the haplotype network of MOTU 1 has a partially star-like topology with one central haplotype present in Central Pacific and several haplotypes, differing from it by a few mutations only, being widely distributed geographically. MOTU 2, MOTU 3, and MOTU 4 were each restricted to a single region, but all of them were represented by a few individuals only. Among the 22 haplotypes recognized within MOTU 5, only two were shared between regions, one identified in Central and South-East Pacific, while the second present in North-West and South-West Pacific. MOTU6 was represented by two haplotypes, one of them present in North-West and South-West Pacific.
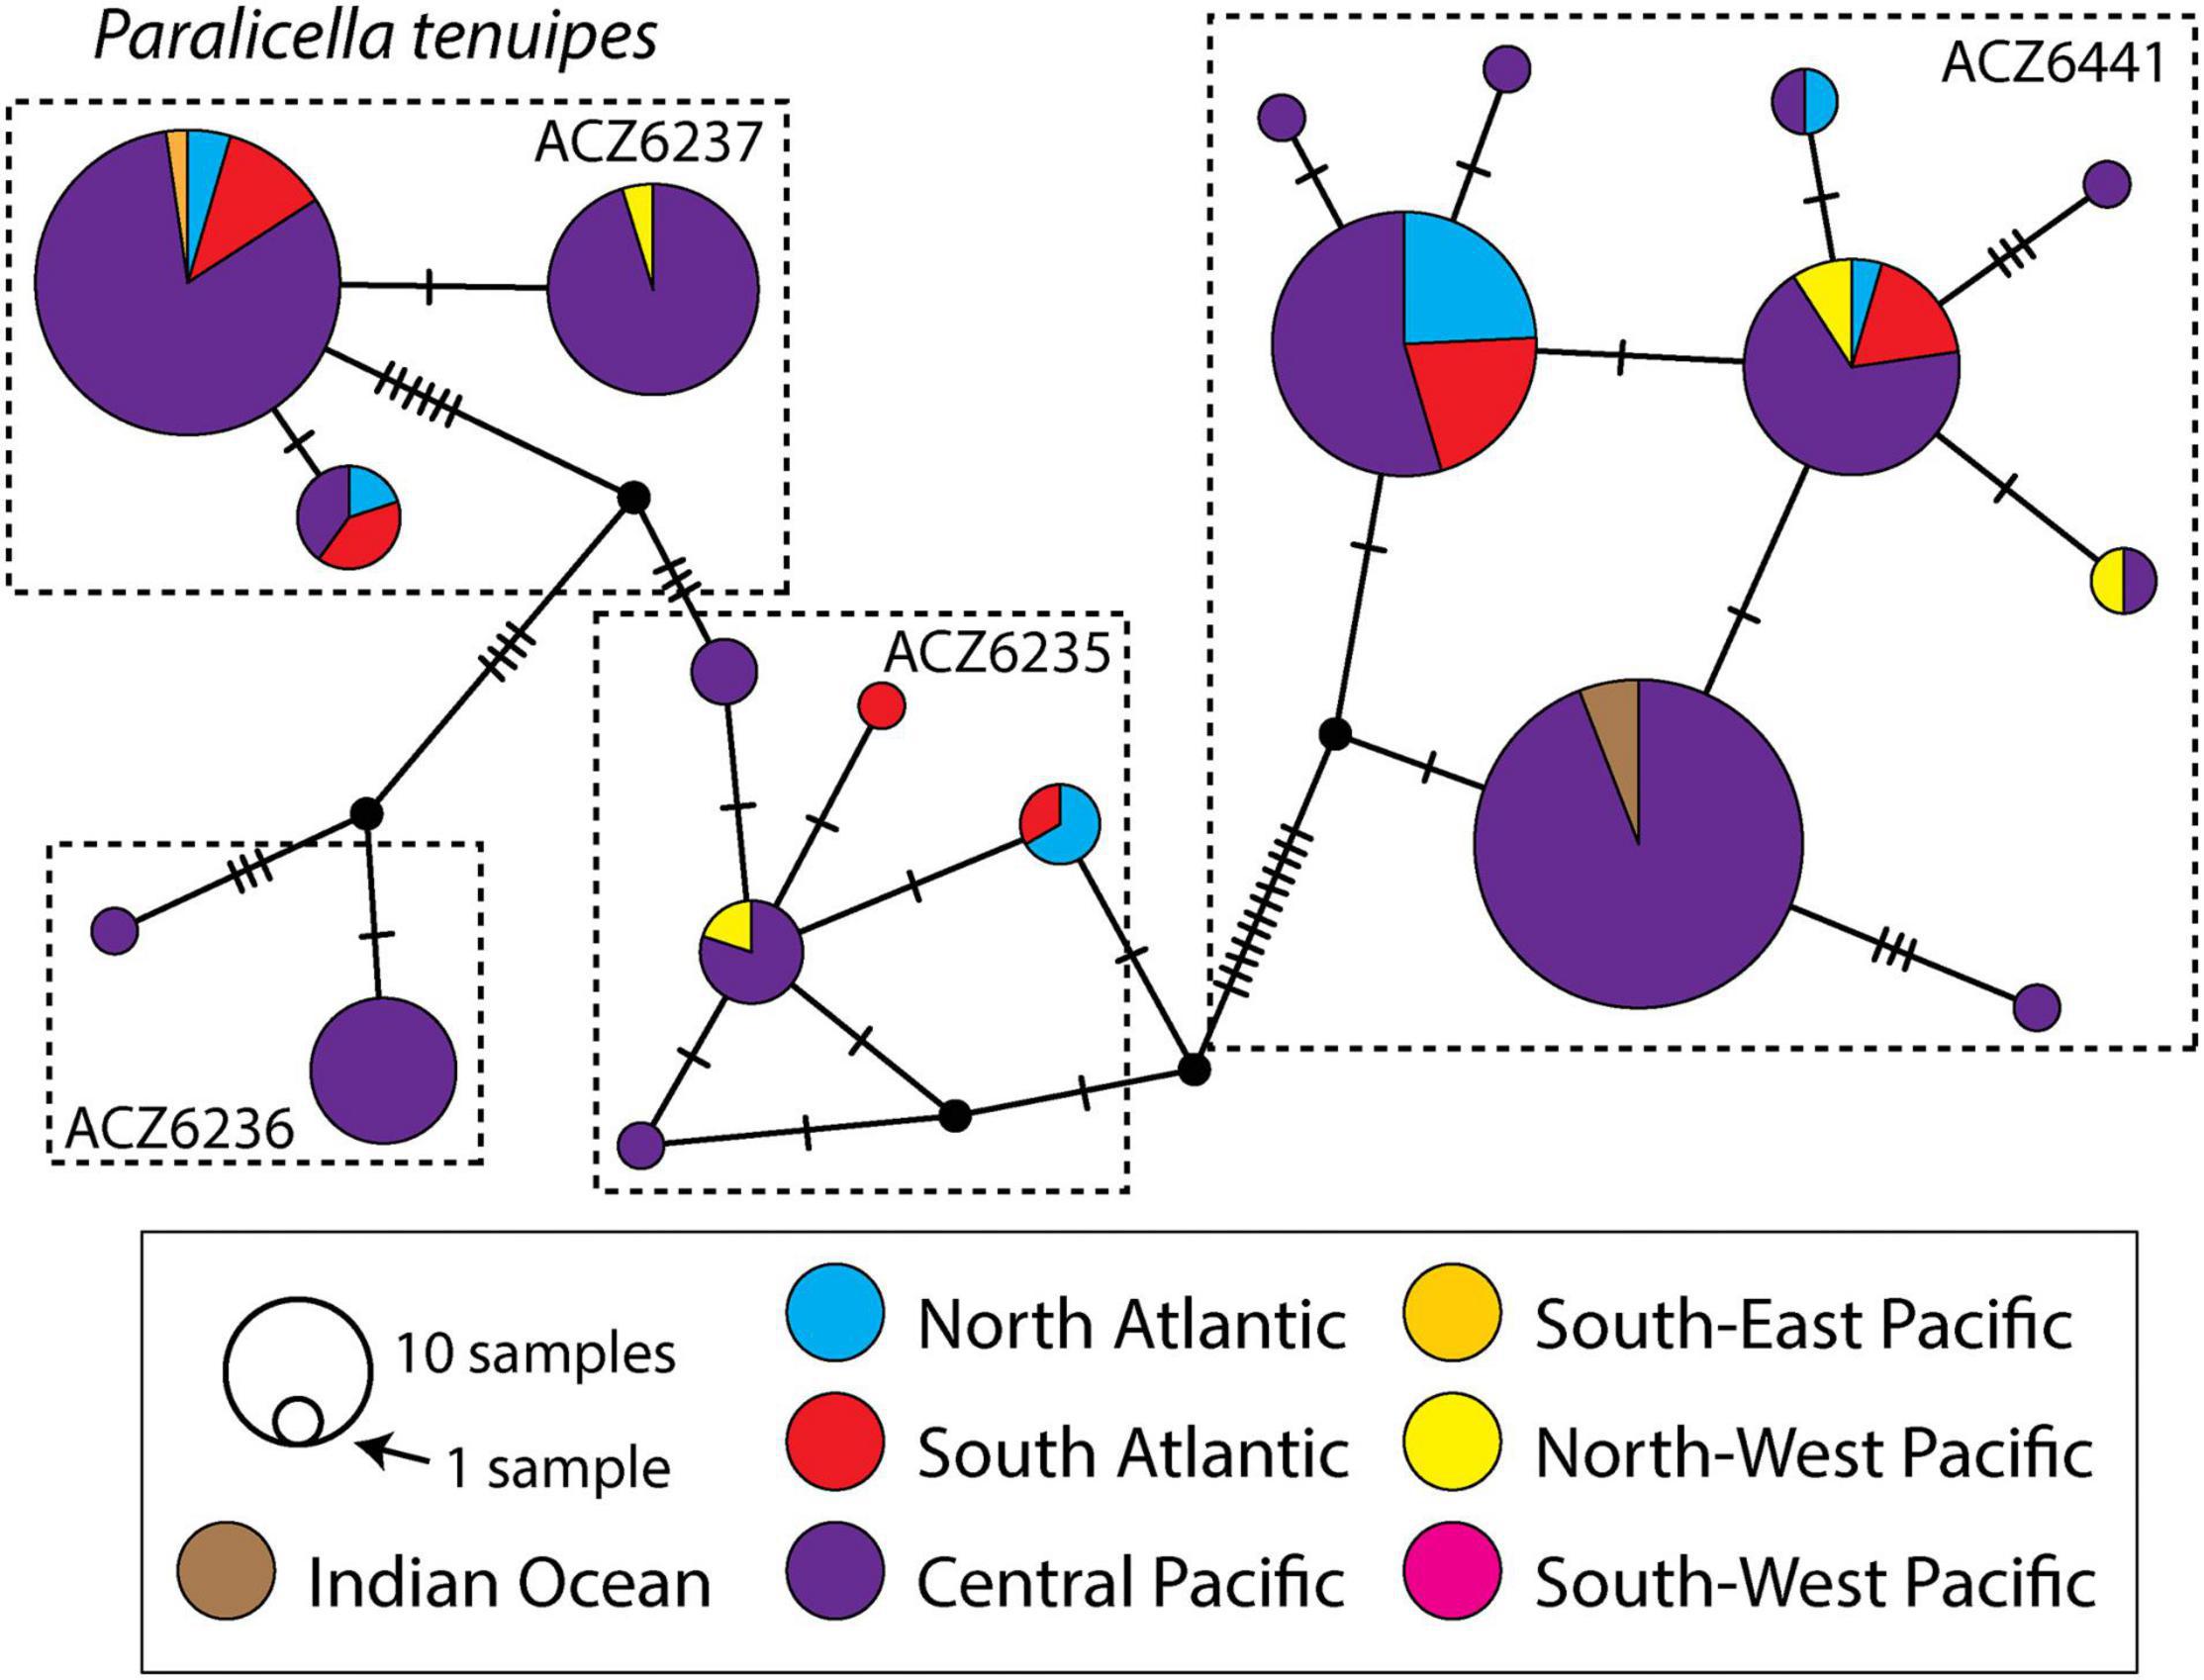
Figure 5. Median Joining Network of all Paralicella tenuipes COI haplotypes with indication of the division of the taxon into BINs. Colors indicate geographic origin of haplotype.
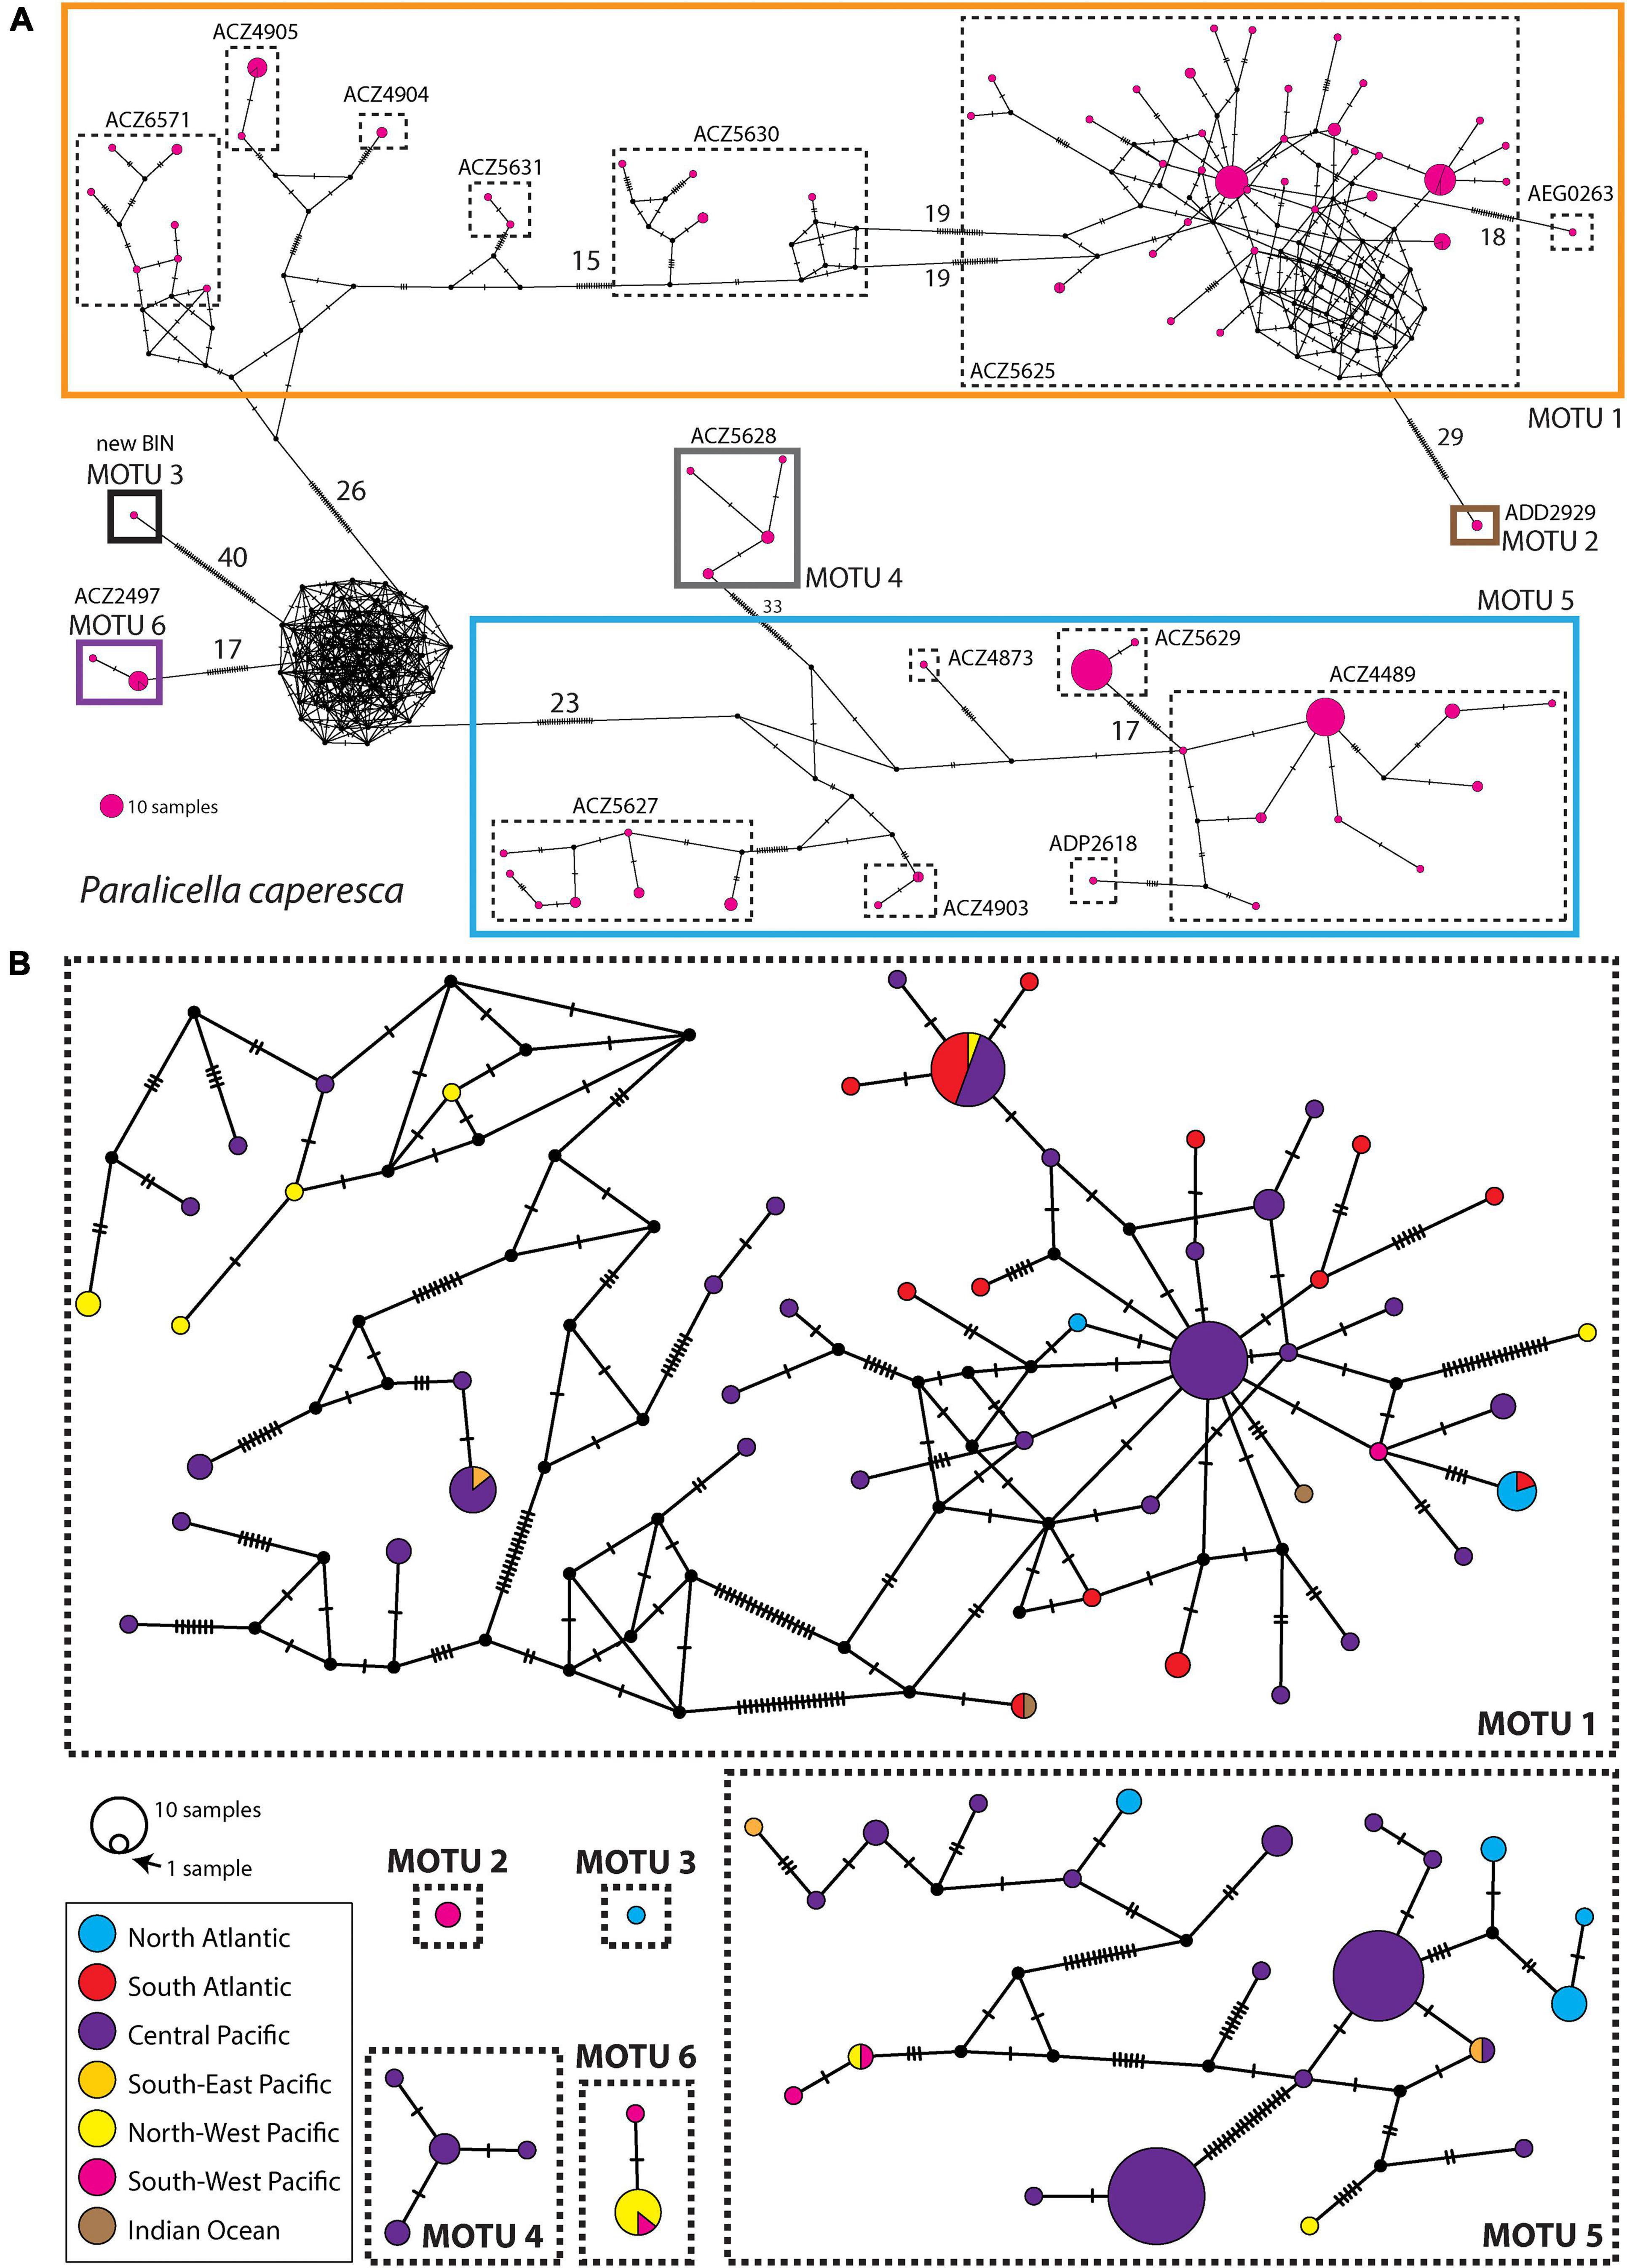
Figure 6. (A) Median Joining Network of all Paralicella caperesca COI haplotypes with indication of the division of the taxon into BINs and final MOTUs studied. The numbers indicate mutation steps larger than 15. (B) Median Joining Networks of each studied MOTU of P. caperesca. Colors indicate geographic origin of haplotype.
Reconstruction of Phylogeny and Demography
The Bayesian phylogenetic reconstruction confirmed the existence of two main lineages leading to the nominal Paralicella caperesca and P. tenuipes (Figure 7). This separation can be estimated at ca. 37 Ma. The differentiation within P. tenuipes can be estimated as happening within the recent 1 Ma. The diversification within P. caperesca appeared between eight to two Ma. Around eight million years ago, the lineages were divided into two groups: combining MOTUs 1–3 and MOTUs 4–6. Soon after this, the MOTU 6 separated from the rest, and six million years ago MOTU 3 diverged. Division between MOTU 4 and 5 happened ca. four Ma, while the most recent separation was of MOTU 2 and MOTU 1, estimated at ca. two million years ago.
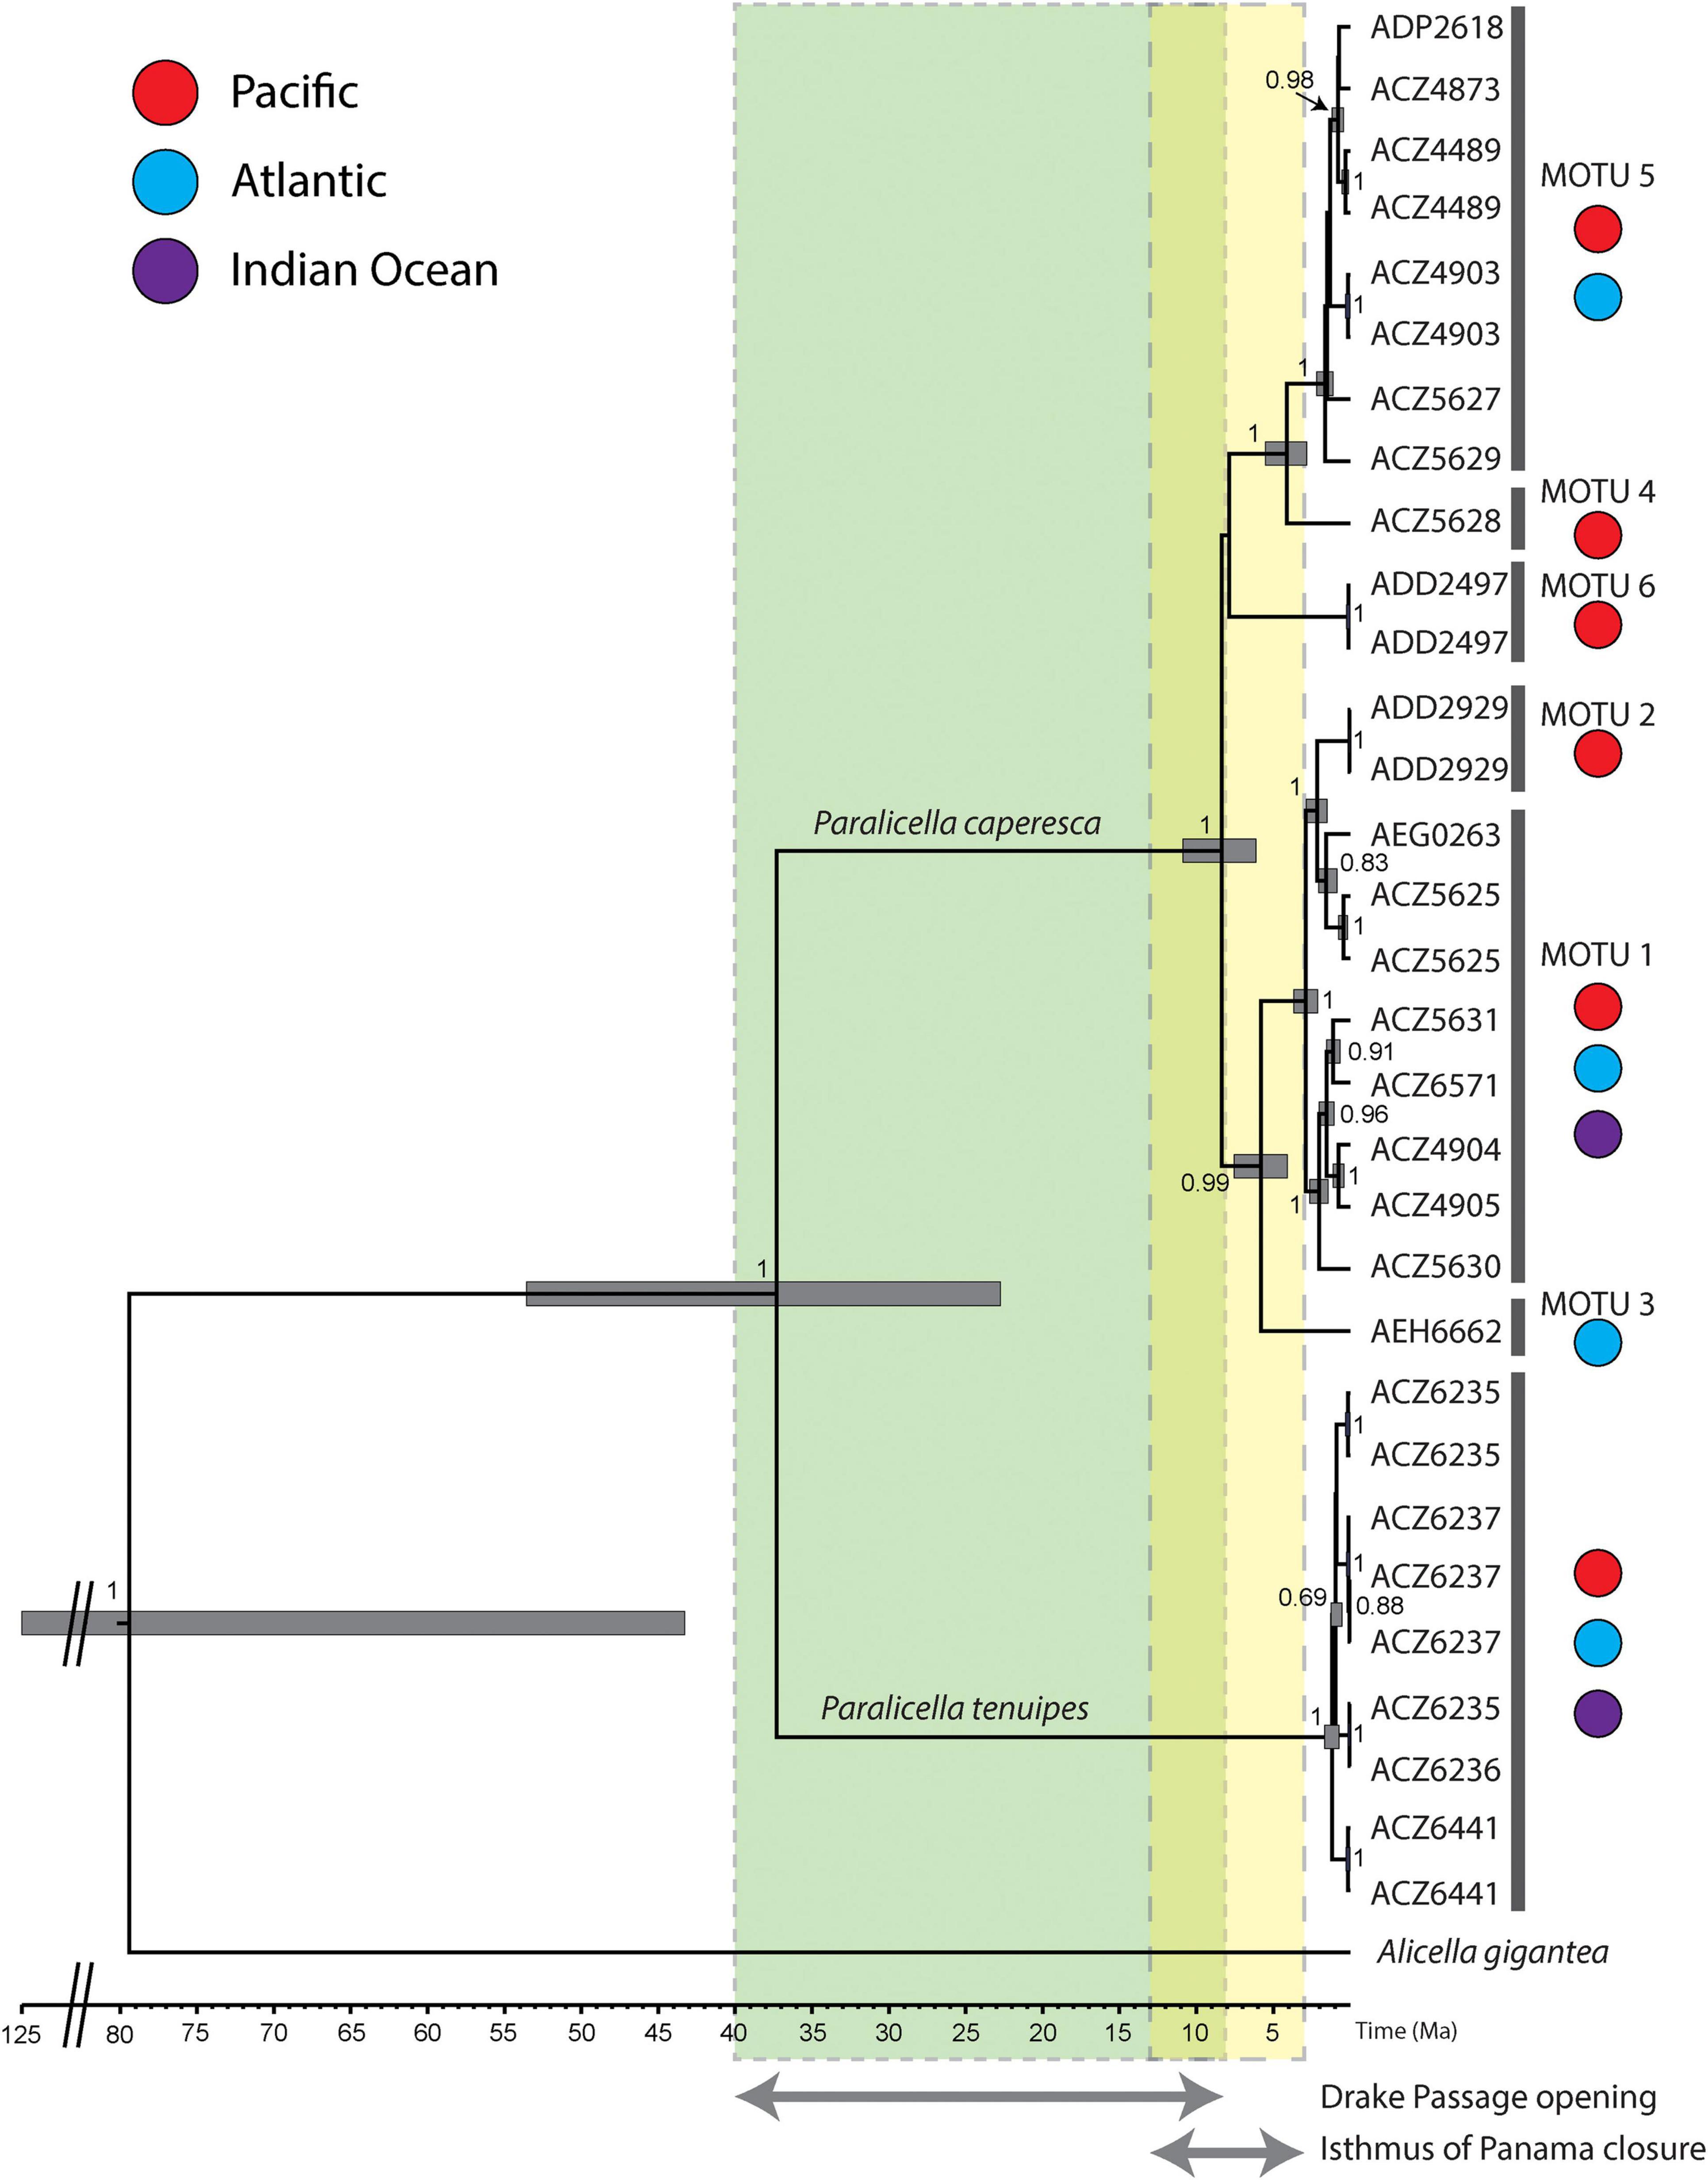
Figure 7. Time-calibrated phylogeny of Paralicella caperesca and P. tenuipes. Maximum clade credibility chronogram was inferred from a strict molecular clock model based on the COI + 16S data set of studied taxa. The numbers given next to the respective main nodes indicate Bayesian posterior probabilities (>0.5). MOTUs 1–6 as separated by delimitation methods (in Figure 2). Colors indicate geographic distribution of given MOTU, while codes represent different BINs. Light green box indicate potential timeline of Drake Passage opening, light yellow box – the closure of the Isthmus of Panama, the overlap time marked in yellowish green.
All values of haplotype diversity of P. tenuipes were significant with the highest observed in the Central Pacific and the lowest in the North Atlantic (Table 5). Haplotype diversity of MOTU 1 of P. caperesca (represented by 104 individuals in our study) was highest in the North-West Pacific, but this value was not statistically significant (Table 4). In the Central Pacific population this measure was lower than in the North-West Pacific, but in contrast to this region it was significant. The Atlantic population was the least diverse of the three and the value was insignificant. Within MOTU 5, the haplotype diversity of the North Atlantic population was distinctly higher than that of the Central Pacific (both values significant), however, only nine individuals of MOTU 5 were collected in the whole Atlantic. From the results of neutrality tests, some recent population contraction of Paralicella tenuipes may be seen, particularly in South Atlantic. Whereas, in the case of MOTU 1 of P. caperesca, a slight population expansion in the Atlantic appeared. MOTU 5 seemed to have a stable population in the Central Pacific, while in the North Atlantic it was a sign of recent population contraction. The neutrality tests were significant only in a few cases of MOTU 1 of P. caperesca. The results of eBSP confirmed no significant drops or sudden expansion of populations of both species (Supplementary Figures S2, S3), whereas linear regression revealed no separation of the populations of P. tenuipes and MOTU 5 of P. caperesca and a weak signal of differentiation for MOTU 1 of the second species (Supplementary Figure S4).
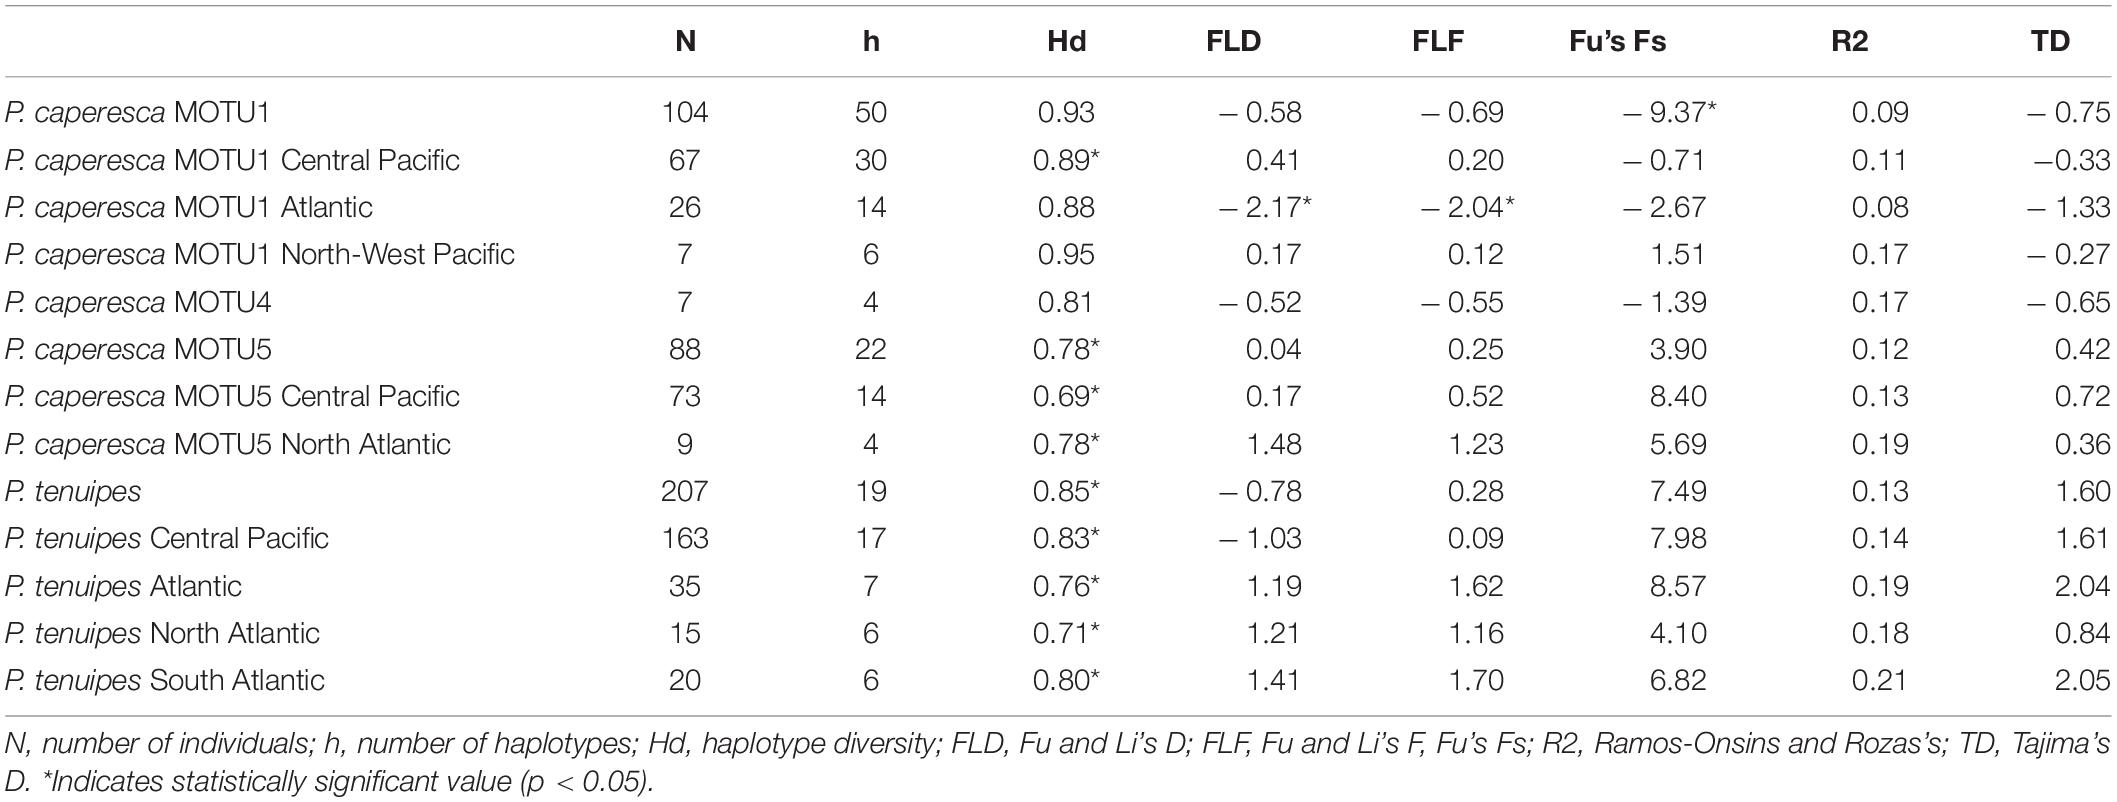
Table 5. Summary of genetic diversity and neutrality tests of three MOTUs within P. caperesca (MOTU1, MOTU4, and MOTU5) and P. tenuipes including separation of the geographic populations.
Discussion
Species Identification
Our study undoubtedly confirmed the separation of P. tenuipes and P. caperesca. All individuals identified morphologically by the taxonomists (TH, EH) as certain species were molecularly ascribed to the correct group. This confirms the former findings by Mohrbeck et al. (2021) and is in contrast with Ritchie et al. (2015), who indicated that the characters used for morphological species identification are not separating these two taxa correctly. Because the publication of wrongly identified sequences may have a large influence on future studies, it is important to clarify these issues which we have done here (Table 6). Using the sequence information of both COI and 16S, it can be seen that four individuals from Ritchie et al. (2015) identified as P. tenuipes and two presented as “unidentified primitive lysianassoid” appear to be representatives of different clades of P. caperesca. Moreover, one individual cited as Valettietta anacantha is represented by the COI sequence (GenBank accession number: KP713950) belonging to MOTU 1 (BOLD:ACZ5625) of P. caperesca. The 16S of the same individual does not show similarity to any Paralicella species but it groups with sequences of V. anacantha from the study of Ritchie et al. (2015). The relatively short fragment of the 18S gene (591 bp, GenBank accession number KT372893) is the only available sequence of 18S of the genus Valettietta and the whole family Valettiopsidae and presents 93-95% similarity to various species of Alicellidae from the same study. There are no sequences of this gene provided by other researchers to cross-validate the sequence identity. As a result, it is impossible to determine the reason why the COI sequence is almost identical to those of P. caperesca while the 16S resembles another taxon. As such, we recommend that this record be removed from GenBank, or updated with proper comment, to avoid further confusion. In a study by Iguchi et al. (2020), the identifications were of Amphipoda at the order level. The comparison of COI sequences obtained by these researchers with our data revealed 12 individuals to be P. caperesca (three different MOTUs) and one individual of P. tenuipes (Table 6). There are also two sequences of P. caperesca from the region of the Crozet Islands, provided by Corrigan et al. (2014). They are both short (COI – 262 bp, 16S – 301 bp) and do not group with any available sequence of Paralicella stored either in GenBank or BOLD. These records should also be removed from public databases.
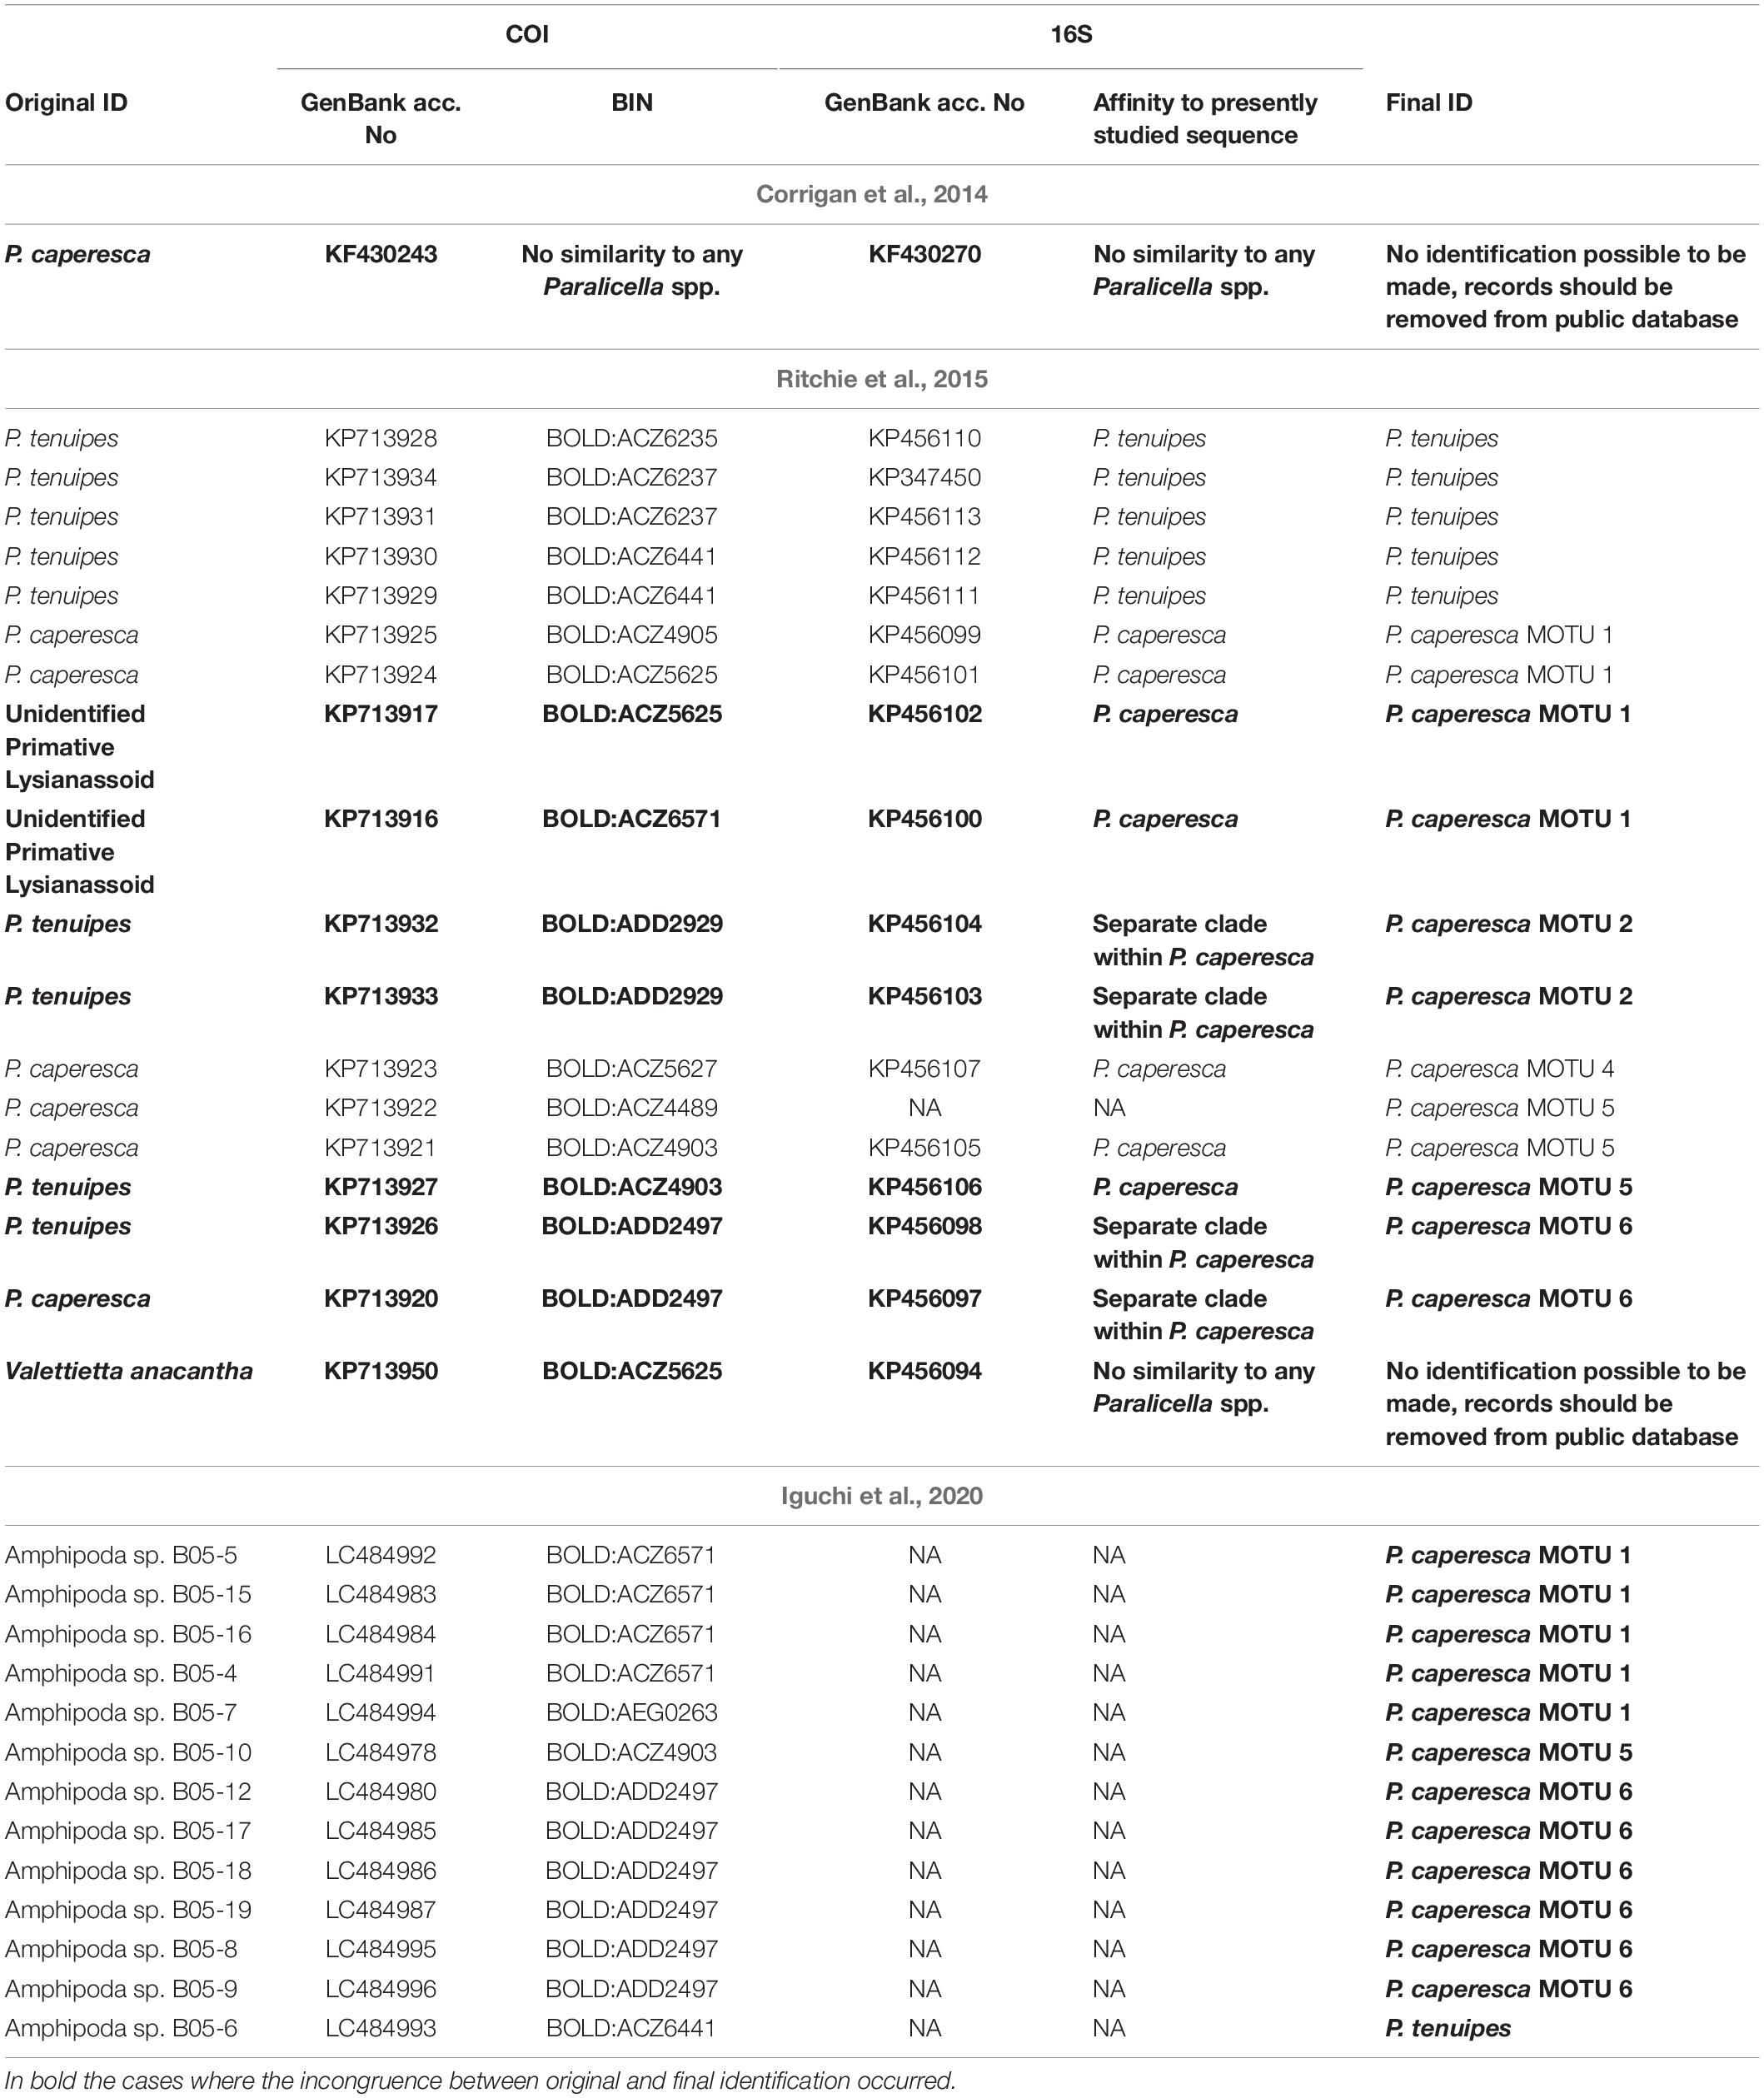
Table 6. Molecular identification of sequences from Corrigan et al. (2014); Ritchie et al. (2015), and Iguchi et al. (2020).
Cryptic Diversity
The diversity patterns of the two nominal species studied differ considerably. Recent work by Bribiesca-Contreras et al. (2021) and some species delimitation methods used by us (BINs, ASAP on sequences, and GMYC) suggested further division of P. tenuipes, but this is not supported by the majority of methods and should be treated as so-called oversplitting of taxa. The fact that mostly one unit was recognized and the observation of low intraspecific distances confirm that no further division of P. tenuipes is justified. Oversplitting has been reported for other deep-sea species of Amphipoda from the North-West Pacific (Lörz et al., 2018a; Jażdżewska and Mamos, 2019) and could partly be explained by unequal sampling of all populations of certain species. It is worth noting also that the length of the studied fragment of the gene may have an influence on the final delimitation results. In our study, it can be seen that in the case of 16S sequences, when the shorter fragment was considered (ca. 250 bp), both the mean and maximum uncorrected p-distance were higher than when the longer (ca. 400 bp) sequences were analyzed (Table 4). It derives from the higher concentration of variable sites (4.5%) in the shorter fragment of 16S amplified by former authors studying P. tenuipes (Ritchie et al., 2015; Weston et al., 2021).
The opposite situation can be seen within the nominal P. caperesca that was further divided into separate MOTUs by the majority of analytical methods (Figure 2) that suggests the existence of cryptic speciation. The least conservative methods suggested that P. caperesca consists of as many as 18-21 units (e.g., BINs in BOLD). In this case, it appears that the BIN system applied in BOLD may oversplit the taxa, which derives from the fact that the threshold used is set at ca. 2% of COI sequence similarity (Ratnasingham and Hebert, 2013). The threshold values for this gene more successfully separating amphipod species are set at 3–7% of molecular similarity and are suggested to be family specific (Costa et al., 2009; Knox et al., 2012; Lobo et al., 2017; Tempestini et al., 2018; Jażdżewska and Mamos, 2019). As a result, the best justified division suggests the existence of six separate MOTUs within P. caperesca. Apart from two dominant MOTUs (MOTU 1 and MOTU 5), the remaining ones are represented by one to eight individuals. Samples containing Paralicella generally contain very large numbers of individuals (hundreds to thousands of specimens in each sample) and the sorting and identification is therefore generally carried out by the use of rapidly assessed morphological characters, indicating initially that the specimen belongs to the genus Paralicella. This is followed by separation at the species level as either P. tenuipes (with a distinct small red/brown eye and a strong bevel on P7) or P. caperesca (lacking the distinct small red/brown eye and lacking a bevel on P7). It should be noted that P. caperesca specimens possess a white or orange pigmented diffuse non-ommatidial eye in fresh material, but this often fades after preservation, and therefore it cannot be relied on for species determination.
The fine characters which are needed to distinguish between the two nominal species in this study and the other members of the genus (P. fusiformis, P. microps, P. similis, and P. vaporalis) are not routinely checked during the sorting process. Now that there is a clear indication that the P. caperesca complex comprises more than a single entity, extra care will need to be taken when sorting and identifying Paralicella samples, including examination of coxa 1, uropods and possibly some mouthpart characters to determine the species of Paralicella that is being dealt with. Attention will need to be paid to the means by which it will be possible to clearly discriminate between the MOTUs, particularly considering the likelihood that they co-occur throughout their range. This will mean revisiting the already collected samples of many thousands of individuals, to first determine a means to distinguish between the MOTUs morphologically and to describe each in full (whilst in alignment with the known 6 species), only then will we be able to clarify their distribution and depth ranges. Presently, only a small group of specimens representing four of the MOTUs defined here was available for morphological study. Detailed description of the available molecularly defined specimens is now underway.
Until such work can be completed, where studies involve morphological species delimitation, P. caperesca should be treated as a species complex, and cited as such in all publications. It is also important to note that as for P. tenuipes, the length of the 16S sequence fragment influences the uncorrected p-distance results. In the case of MOTU 1, the use of a short fragment suggests only a slightly higher diversity of sequences in comparison to longer ones because the extension of the studied fragment does not change the proportion of the variable sites reaching in both cases ca. 4.5%. For MOTU 5 the opposite pattern may be observed (Table 4) deriving from the considerable increase of variable sites (from two to six percent) in the longer sequence. The results derived from the longer fragment of 16S seem to be more congruent with the results from the other two genes studied, so it is highly recommended to use the longer fragment of 16S in future molecular studies.
Intraspecific diversification has already been observed by Ritchie et al. (2015) who distinguished four clades within the studied Paralicella specimens. ‘Group 1’ recognized in that study corresponds to P. tenuipes, ‘Group 2’ relates to our MOTU 6 of P. caperesca, ‘Group 3’ corresponds to our MOTU 5, whereas ‘Group 4’ combines individuals from our MOTU 1 and 2. In the subsequent paper, presenting the population structure of two Paralicella species collected in five distant Pacific trenches (Ritchie et al., 2017) this division was only partly used – Group 1 (P. tenuipes) was named RFLP sp. 1, while groups 2–4 (P. caperesca) were combined into a single unit – RFLP sp. 2.
One of the important issues emerging from the use of molecular tools to identify species, particularly when cryptic diversity is noticed and the type collection used for species description is not available for genetic analysis, is to decide which of the molecularly recognized units represents the originally described taxon. For P. tenuipes, described from the region of Canary Islands (Chevreux, 1908), the closest area presently studied was the North Atlantic where representatives of three BINs were identified (Figure 5). Nevertheless, they all constitute a single species, and most probably they all inhabit the type locality of this taxon, which is further justified by the presence of the same BINs and haplotypes in the South Atlantic. Since cryptic diversity has been recognized within P. caperesca, deciding which of the lineages constitutes that originally described (Shulenberger and Barnard, 1976) is more difficult. This species was described from a large collection of amphipods from North of Hawaii; molecular analysis was not considered at that time. France and Kocher (1996) attempted to extract and study DNA of certain deep-sea scavenging species including P. caperesca and P. tenuipes collected in 1977 and 1978 in the Central North Pacific, most probably near the locus typicus of the first species. Their study resulted in four sequences of a short fragment of the 16S gene (ca. 160 bp) (GenBank accession numbers: U92692, U92693, U92694, U92695). The single sequence of P. tenuipes groups with sequences of individuals representing BOLD:ACZ6441 confirming its identity. Two sequences of P. caperesca have affinity to the 16S sequences of individuals ascribed to BOLD:ACZ5625, while the third is almost identical to the sequences of two individuals, one representing BOLD:ACZ6571, the second – BOLD:ACZ4905. All of these BINs belong to MOTU 1 of P. caperesca, which may suggest that the species description was based on individuals of this molecular unit. However, since the original collection studied by Shulenberger and Barnard (1976) consisted of several individuals and our study has already revealed that different MOTUs of P. caperesca co-exist in the Central Pacific, any decision on which MOTU can represent P. caperesca sensu stricto must be preceded by detailed morphological examination and, if possible, molecular study of the types.
Species Distribution and Population Genetics
Based on morphological studies, both studied species have been considered as widely spread or even cosmopolitan (Table 7; Shulenberger and Barnard, 1976; Brandt et al., 2012). Our study is the first that provides molecular evidence for the cosmopolitanism of P. tenuipes, as well as a very wide distribution of two of the MOTUs within P. caperesca. It confirms also the wide bathymetric ranges (2189–3673 vertical metres) of these species, mainly collected at abyssal depths (Table 7). It should be underlined that the restricted number of individuals (five in total) from the Indian Ocean for which the sequences were available might have an influence on our knowledge of these species’ distributions. However, a recent molecular study of scavenging amphipods from hydrothermal vent fields in South-East and Central Indian Ridge did not reveal the presence of either P. tenuipes or any MOTU of P. caperesca there (Kniesz et al., in review5). The specific conditions of the areas adjacent to vent fields may influence the composition of the scavenging fauna and may be the reason for not recording the presently studied species. Additionally, the traps used in that study were placed relatively shallow (2500–2900 m) while P. tenuipes and P. caperesca seem to prefer greater depths. P. tenuipes was not recorded south of Antarctic Convergence, whereas individuals resembling P. caperesca have been recorded in the area of South Shetland and South Sandwich Islands as well as in the Lazarev Sea (De Broyer et al., 2004). Those animals however, possessed certain characters that differed from the described species (De Broyer, personal communication), since they were not studied molecularly, we have not included these distribution records in our study.
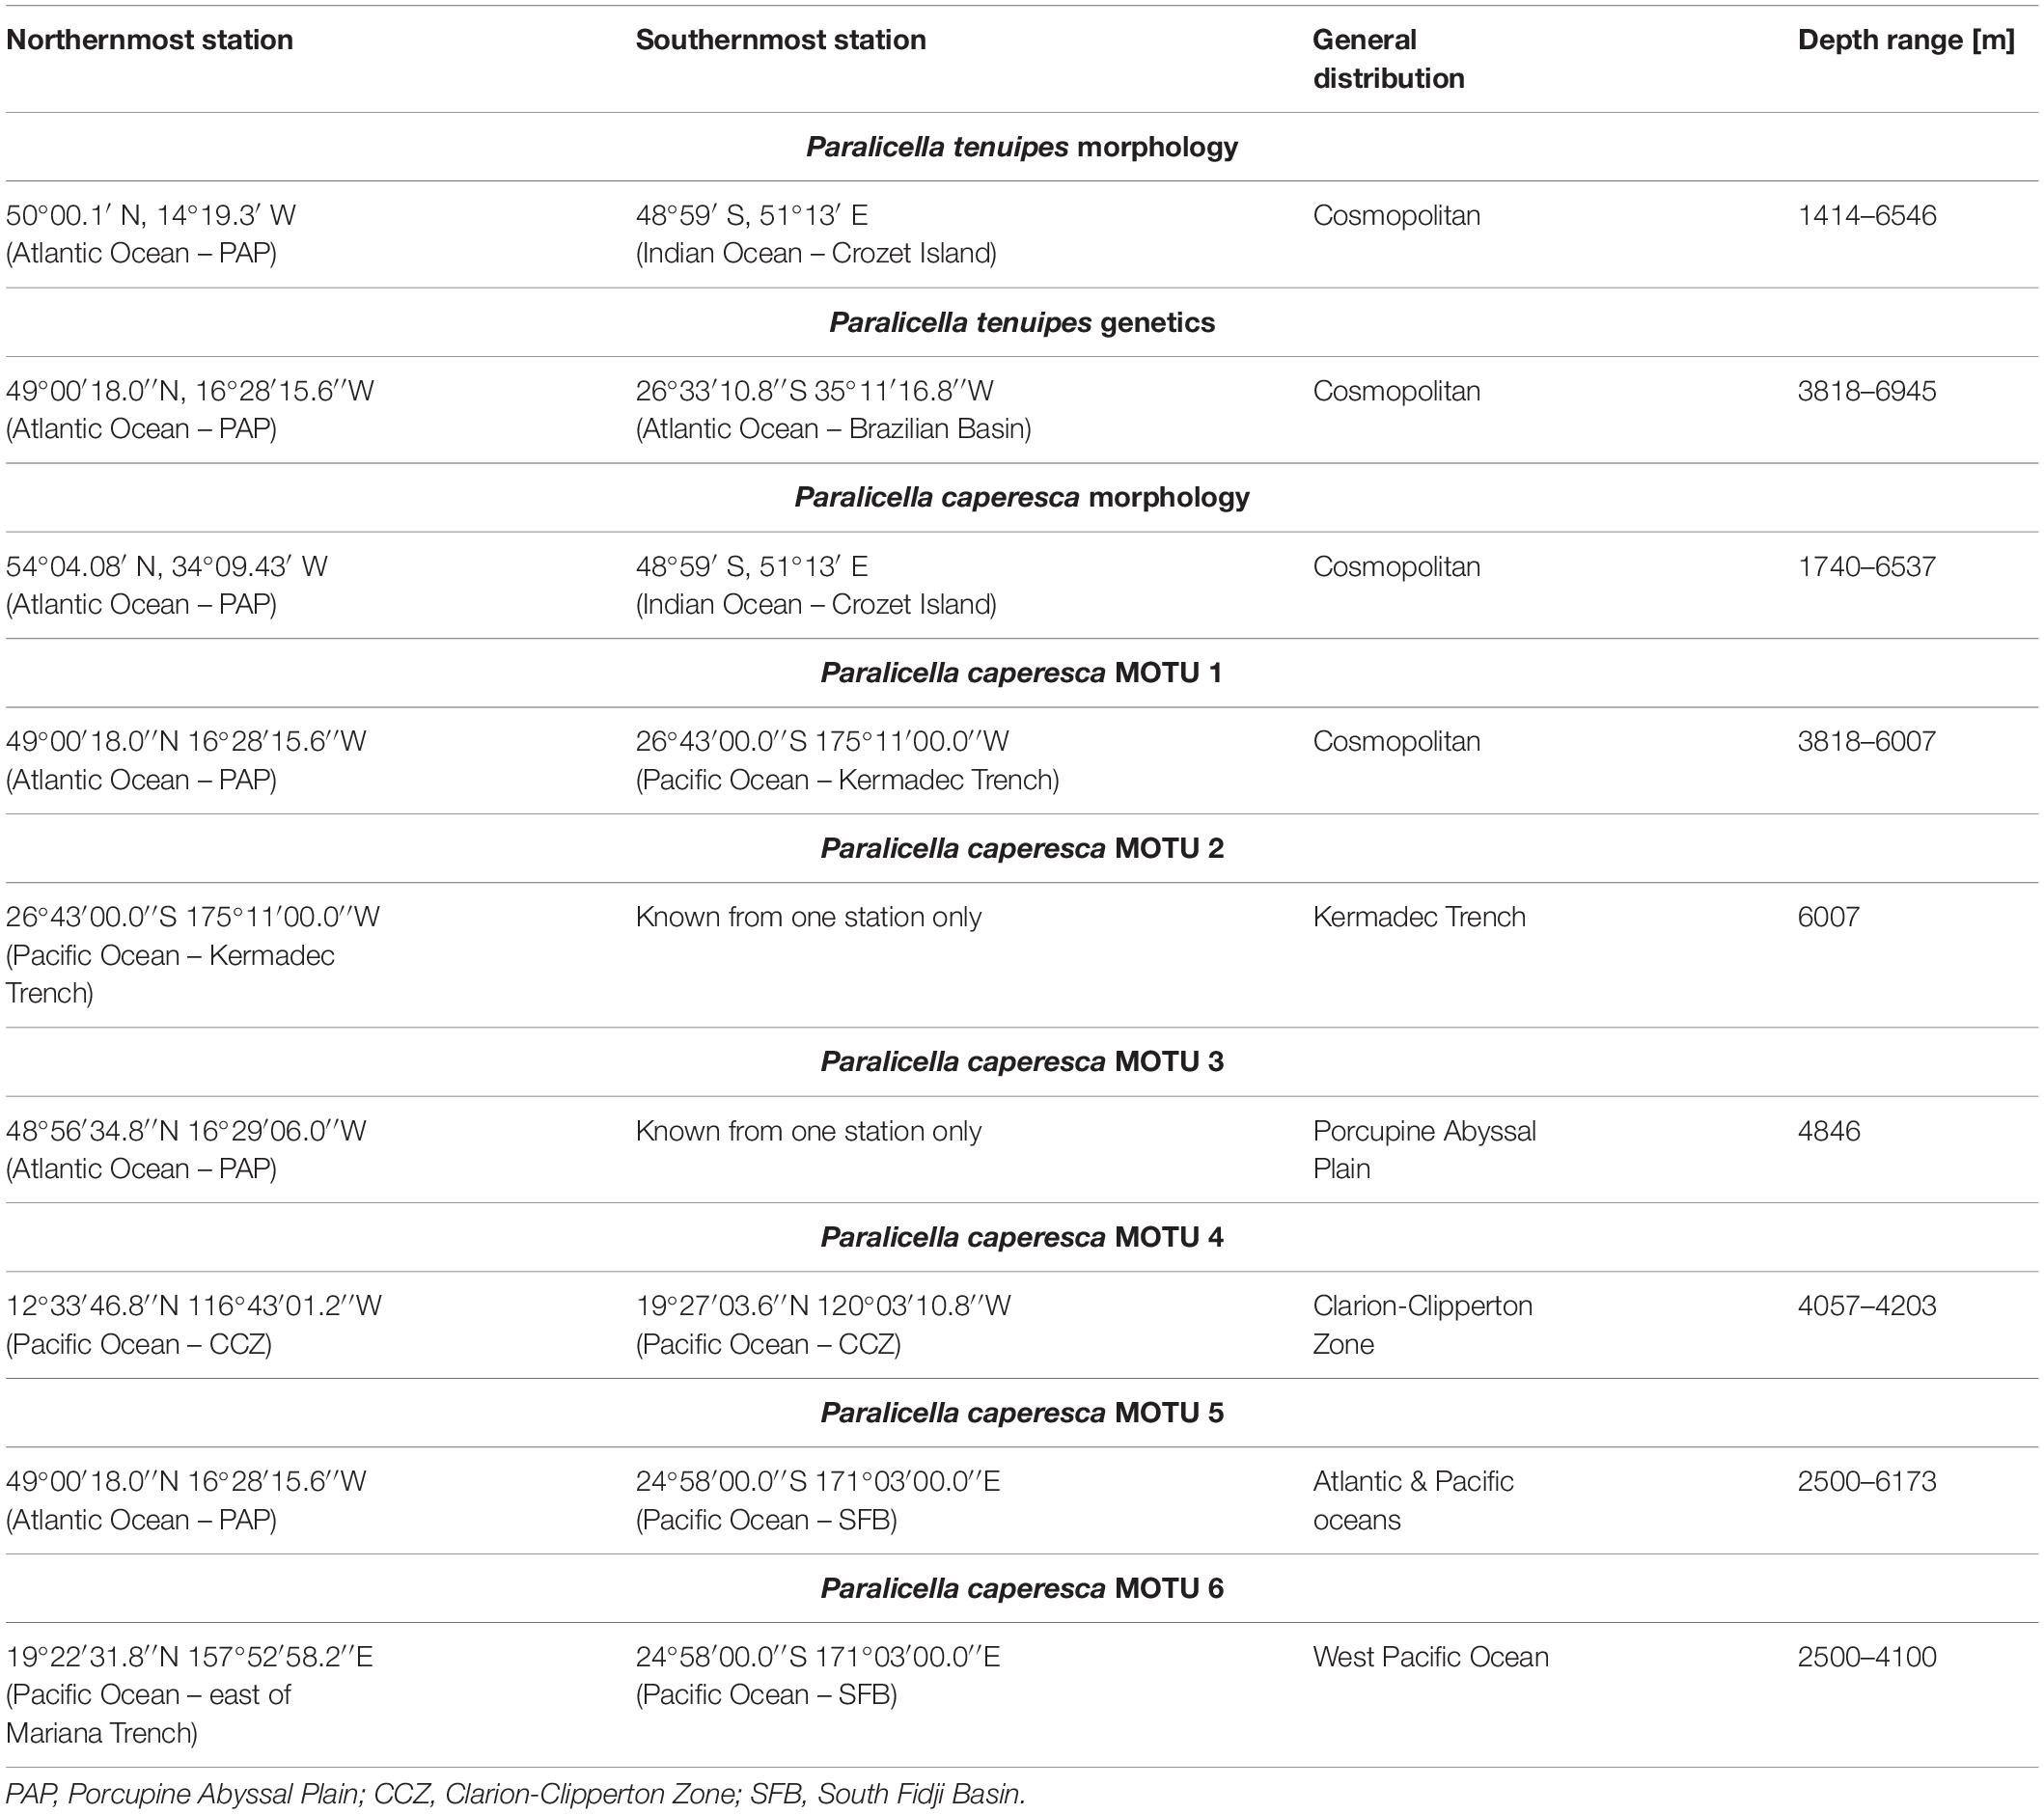
Table 7. Summary of distribution of both species with respect to results based on morphology and molecular methods.
Low genetic diversity and wide distribution of deep-sea species have been postulated by various authors (Zardus et al., 2006; McClain and Hardy, 2010; Etter et al., 2011) however, only a relatively low number of peracarid species are reported to present large horizontal ranges (Brandt et al., 2012). Recent studies of widely distributed species identified solely by morphology have revealed species complexes of multiple taxa with more restricted ranges when molecular methods are applied (Havermans et al., 2013; Verheye et al., 2016; Jakiel et al., 2019). Although cosmopolitanism of deep-sea species appears to be less common than previously thought, certain scavenging amphipod species have been confirmed by molecular studies as widely distributed. These include Abyssorchomene distinctus (Birstein and Vinogradov, 1960), Eurythenes magellanicus (Milne Edwards, 1848), E. maldoror (d’Udekem d’Acoz and Havermans, 2015), Bathycallisoma schellenbergi (Birstein and Vinogradov, 1958) and Haptocallisoma abyssi (Oldevig, 1959) (Havermans, 2016; Jażdżewska et al., 2020; Mohrbeck et al., 2021; Weston et al., 2021; Kniesz et al., in review5). Very few amphipod species have had a very wide (>2 km) vertical distribution molecularly confirmed, as has been observed here for Paralicella. Similar to the situation of wide geographic ranges inferred from morphological identification, several taxa previously listed as recorded from a wide bathymetric range appear to be more restricted when their genetic intraspecific structure is checked. Among amphipod species of confirmed wide bathymetric range are Abyssododecas styx Takeuchi et al., 2016 and Rhachotropis saskia Lörz & Jażdżewska (Takeuchi et al., 2016; Lörz et al., 2018a). These two species inhabit abyssal and hadal depths of North-West Pacific, whereas the Paralicella species from our study are mainly abyssal taxa that are also collected in bathyal depths. There is a report of the collection of P. caperesca in the Indian Ocean that reached the research vessel deck still alive (Treude et al., 2002) suggesting high resistance of this species to decompression, however, this was an incidental case as the majority of collected individuals were dead on arrival at deck. However, other studies have confirmed the resistance of this species to decompression (Macdonald and Gilchrist, 1980; Yayanos, 1981). It is known that these species do cross the bathyal-abyssal border and have often been collected in the water column several metres above the seafloor (Ingram and Hessler, 1983; Thurston, 1990). Amphipods of the genus Paralicella are known to be obligate scavengers (Havermans and Smetacek, 2018; Horton et al., 2020). Carrion (particularly large carcasses of nekton), although providing nutrition for a long time and being more common in the deep sea than previously expected, is believed to be irregularly deposited and unevenly distributed over the seafloor (Smith and Baco, 2003; Havermans and Smetacek, 2018). Near feeding or spawning grounds as well as along species migration corridors, the availability of carrion is high (Smith, 2007) but in other open ocean areas this may not be the case. The irregularity of food availability implies their special adaptations including, their well-developed chemosensory system and good swimming abilities allowing quick access to available food sources (Hessler et al., 1978; Thurston, 1979; Ingram and Hessler, 1983; Klages et al., 2002; Premke et al., 2003). These adaptations may partly explain the wide horizontal ranges of the studied species, and to consider that resistance to changing pressure may also allow these amphipods to profit from food at different depths.
The separation of the two studied nominal Paralicella species from another species from the family Alicellidae (the supergiant amphipod, Alicella gigantea Chevreux, 1899) appeared to be ca. 80 Ma, which is earlier than recorded by Copilaş-Ciocianu et al. (2020). However, when considering the highest posterior density intervals in both cases the time of lineage separation overlap. The separation of the two nominal Paralicella species is reported here at ca. 35–37 Ma, which is similar to the divergence of Paralicella caperesca and Valettietta anacantha recorded by Copilaş-Ciocianu et al. (2020). However, in that study P. tenuipes was not considered. The time of diversification within Alicellidae, occurring from the Late Mesozoic to Middle Cenozoic (Figure 7), is congruent with the global climatic cooling during that period, and the transition from a halothermal ocean circulation into thermohaline one (McClain and Hardy, 2010; Copilaş-Ciocianu et al., 2020). The thermohaline ocean circulation is driven by high-latitude deep-water formation and results in cold, oxygenated waters at the bottom. Because amphipods are considered as well adapted to cold conditions with low tolerance to hypoxia (Copilaş-Ciocianu et al., 2020) the change of environmental conditions that has “opened” vast deep-sea bottom areas for colonization could have promoted the speciation of the studied species. The speciation of the two nominal species of Paralicella occurred at the time of serious reconfiguration of continents, when the Isthmus of Panama was still open, while the Drake Passage and the West Wind Drift was in the process of formation (Brandt et al., 2007; O’Dea et al., 2016; Straume et al., 2020). The fact that both species emerged already at that time may partly explain their present wide distribution – there was enough time to spread and different oceanic gateways were available. It should be considered that these species might have originated from shallow waters and only during the further stages of speciation submerged, so at the initial stage of expansion they might have been less dependent on the water depth both in the area of Isthmus of Panama and Drake Passage. The further speciation within P. caperesca is predicted as happening from ca. 7 Ma. At that time, only small and shallow water basins were present in the area of Isthmus of Panama, preventing the connection of the Central Pacific populations and may be responsible for the speciation of lineages geographically restricted to the Pacific (MOTUs 2, 4, 6) or to the Atlantic (MOTU 3). The full opening of the Drake Passage (reaching abyssal depths) and the formation of the West Wind Drift would have allowed maintenance of intraspecific connectivity. This contemporary Atlantic and Pacific population connectivity of P. tenuipes, as well as between MOTU 1 and MOTU 5 of P. caperesca, is confirmed by the distribution of haplotypes that are often shared between very distant regions (Figures 5, 6) as well as by the lack, or very weak signal, of population separation within each of them (Supplementary Figure S4). On a more local scale, the constant gene flow within P. tenuipes and the two most widely distributed MOTUs of P. caperesca was recently observed by Bribiesca-Contreras et al. (2021) studying scavenging Amphipoda from three Areas of Particular Environmental Interest in the Clarion-Clipperton Zone. A similar pattern was recorded by Ritchie et al. (2017) for Paralicella RFLP sp. 1 that corresponds to P. tenuipes. In that case, although generally bidirectional, North-West direction of migration predominated. At the same time, a very weak signal of migration was observed for Paralicella RFLP sp. 2, but this may be explained by the fact that the taxon combined four different MOTUs of which two have a very restricted distribution. It should not be overlooked that the authors considered the studied species as the “trench” ones, not considering that from morphology-based literature both were reported from Central Pacific abyssal plain (Ritchie et al., 2017). It is also worth noting no evidence for recent population size changes of the P. tenuipes and the two MOTUs of P. caperesca that remains in contrast with other findings for deep-sea species. The significantly negative Tajima’s D values observed for certain vent and non-vent taxa were interpreted as resulting from recent expansion of populations after disturbance events, suggestive of the instability of deep-sea habitats (Vrijenhoek, 2010; Taylor and Roterman, 2017). Although we are aware that some of the populations studied by us consist of a small number of individuals it appears that the populations of studied Paralicella species are stable over time, implying robustness and high plasticity of these taxa. It may be expected that they are less prone to unfavorable (human or non-human induced) events that occur in the abyss.
Conclusion
Our study has provided a detailed synthesis of the extensive published molecular data and incorporated new data on species in the genus Paralicella. We have shown that the two studied species have different intraspecific structures, with Paralicella tenuipes constituting a single molecular unit, while P. caperesca is a complex of potentially cryptic species. In terms of biogeography we have confirmed that P. tenuipes and two MOTUs of P. caperesca are widely distributed or even cosmopolitan taxa, while some of the lineages appear to have a more limited distribution. The two studied species’ divergence occurred in the Eocene at the time of reconfiguration of the continents which might have allowed both species to colonize all oceans. The further speciation within P. caperesca is predicted as happening in the Miocene when the connection of the Atlantic and Pacific deep sea was already restricted, which may explain the recognition of some lineages with limited geographic ranges.
Data Availability Statement
The datasets presented in this study can be found in online repositories. The names of the repository/repositories and accession number(s) can be found below: https://www.ncbi.nlm.nih.gov/genbank/, MZ655819–MZ655910, MZ655914–MZ655967, https://dx.doi.org/10.5883/DS-PCAPTEN, Barcode of Life Datasystems.
Author Contributions
TH, EH, SB, and PMA collected and processed the samples. AJ and AD generated the genetic sequences. TH and EH carried out detailed morphological examination. AJ conceived the idea, with AJ and TM carrying out the analyses. All the authors contributed to drafting and reviewing the manuscript.
Funding
We thank the Masters and crew of the R/V Meteor, the R/V Melville and the R/V Thomas G. Thompson, and the RRS James Cook Cruise 165 and RRS Discovery Cruise 103 for their assistance during Meteor 79/1 DIVA-3, ABYSSLINE-1, ABYSSLINE-2, and expeditions to the Porcupine Abyssal Plain Sustained Observatory, respectively. The M79/1 DIVA-3 expedition was carried out with the support of German Science Foundation. The participation of EH in DIVA-3 was supported by the Canadian Museum of Nature funding numbers RS01, RS16 and RCZ09. Both ABYSSLINE cruises were funded by the UK Seabed Resources Ltd., while expeditions to the Porcupine Abyssal Plain Sustained Observatory were supported by the NERC National Capability funding to the National Oceanography Centre, as part of the Climate Linked Atlantic Section Science (CLASS) program (Grant Reference NE/R015953/1). The sorting of the material from DIVA-3 expedition took place at the DZMB Hamburg with help of Karen Jeskulke and Antje Fischer. The molecular work was conducted with the support of Smithsonian Institution and Canadian Centre for DNA Barcoding/Guelph, the CeDaMar “DNA barcoding deep-sea Peracarida” project and internal funds of the University of Lodz (B2011000000069). This is publication 82 of the Senckenberg am Meer Metabarcoding and DNA Laboratory.
Conflict of Interest
The authors declare that the research was conducted in the absence of any commercial or financial relationships that could be construed as a potential conflict of interest.
Publisher’s Note
All claims expressed in this article are solely those of the authors and do not necessarily represent those of their affiliated organizations, or those of the publisher, the editors and the reviewers. Any product that may be evaluated in this article, or claim that may be made by its manufacturer, is not guaranteed or endorsed by the publisher.
Supplementary Material
The Supplementary Material for this article can be found online at: https://www.frontiersin.org/articles/10.3389/fmars.2021.750180/full#supplementary-material
Supplementary Material S1 | The summary of all sequences used in the study including identification (in case of published material presented as in the original papers), Barcode Index Numbers (BIN), station data and GenBank Accession Numbers.
Supplementary Material S2 | The full list of publications used to prepare the distribution maps of both Paralicella species.
Supplementary Figure S1 | Median Joining Network of 28S sequences. Colors of the circle according to the MOTU identified with delimitation methods. Codes indicate the BIN from which particular sequence type come from.
Supplementary Figure S2 | Extended Bayesian Skyline Plot of Paralicella tenuipes.
Supplementary Figure S3 | Extended Bayesian Skyline Plot of MOTUs 1, 4 and 5 of Paralicella caperesca.
Supplementary Figure S4 | Linear regression between geographic and molecular distances of Paralicella tenuipes, MOTU 1 and MOTU 5 of Paralicella caperesca. Below the graphs the summary of geographic distances between populations is presented (calculated with GoogleEarth Pro). Geographic codes: CCZ, Clarion-Clipperton Zone, Central Pacific; APEI 6, Area of Particular Environmental Interest 6, North of CCZ, Central Pacific; BB, Brazilian Basin, South Atlantic; NWP, North-West Pacific; PAP, Porcupine Abyssal Plain, North Atlantic. Genetic distances calculated with Kimura 2-parameter (K2P) for COI sequences.
Footnotes
- ^ www.boldsystems.org
- ^ dx.doi.org/10.5883/DS-PCAPTEN
- ^ https://species.h-its.org/ptp/
- ^ http://www.r-project.org
- ^ Kniesz, K., Jażdżewska, A. M., Martinez Arbizu, P., and Kihara, T. C. (in review). DNA barcoding of scavenging amphipod community at active and inactive hydrothermal vents in the Indian Ocean. Front. Mar. Sci.
References
Achaz, G. (2009). Frequency spectrum neutrality tests: one for all and all for one. Genetics 183, 249–258. doi: 10.1534/genetics.109.104042
Astrin, J. J., and Stüben, P. E. (2008). Phylogeny in cryptic weevils: molecules, morphology and new genera of western Palaearctic Cryptorhynchinae (Coleoptera: Curculionidae). Invertebr. Syst. 22, 503–522. doi: 10.1071/is07057
Baco, A. R., Etter, R. J., Ribeiro, P. A., von der Heyden, S., Beerli, P., and Kinlan, B. P. (2016). A synthesis of genetic connectivity in deep-sea fauna and implications for marine reserve design. Mol. Ecol. 25, 3276–3298. doi: 10.1111/mec.13689
Bandelt, H. J., Forster, P., and Rohl, A. (1999). Median-joining networks for inferring intraspecific phylogenies. Mol. Biol. Evol. 16, 37–48. doi: 10.1093/oxfordjournals.molbev.a026036
Barnard, J. L., and Ingram, C. L. (1990). Lysianassoid Amphipoda (Crustacea) from deep-sea thermal vents. Smithsonian Contrib. Zool. 499, 1–80. doi: 10.5479/si.00810282.499
Barnard, J. L., and Shulenberger, E. (1976). Clarification of the abyssal amphipod Paralicella tenuipes Chevreux. Crustaceana 31, 267–274. doi: 10.1163/156854076X00053
Birstein, J. A., and Vinogradov, M. E. (1955). Pelagic gammarids (Amphipoda – Gammaridea) from Kuril-Kamchatka Trench. Tr. Inst. Okeanologii 12, 210–287. (in Russian)
Birstein, J. A., and Vinogradov, M. E. (1958). Pelagic gammarids (Amphipoda, Gammaridea) of NW Pacific. Tr. Inst. Okeanologii 27, 219–257. (in Russian)
Birstein, Y. A., and Vinogradov, M. E. (1960). Pelagic Gammaridea of the tropical part of the Pacific Ocean. Tr. Inst. Okeanologii Akad. Nauk SSSR 34, 165–241. [in Russian]
Bober, S., Brix, S., Riehl, T., Schwentner, M., and Brandt, A. (2018). Does the Mid-Atlantic Ridge affect the distribution of abyssal benthic crustaceans across the Atlantic Ocean? Deep Sea Res. II Top. Stud. Oceanogr. 148, 91–104. doi: 10.1016/j.dsr2.2018.02.007
Bouckaert, R. R., and Drummond, A. J. (2017). bModelTest: Bayesian phylogenetic site model averaging and model comparison. BMC Evol. Biol. 17:42. doi: 10.1186/s12862-017-0890-6
Bouckaert, R., Heled, J., Kühnert, D., Vaughan, T., Wu, C. H., Xie, D., et al. (2014). BEAST 2: a software platform for Bayesian evolutionary analysis. PLoS Comput. Biol. 10:e1003537. doi: 10.1371/journal.pcbi.1003537
Bouckaert, R., Vaughan, T. G., Barido-Sottani, J., Duchêne, S., Fourment, M., Gavryushkina, A., et al. (2019). BEAST 2.5: an advanced software platform for Bayesian evolutionary analysis. PLoS Comput. Biol. 15:e1006650. doi: 10.1371/journal.pcbi.1006650
Brandt, A., Błażewicz-Paszkowycz, M., Bamber, R., Mühlenhardt-Siegel, U., Malyutina, M., Kaiser, S., et al. (2012). Are there widespread peracarid species in the deep sea (Crustacea: Malacostraca)? Pol. Polar Res. 33, 139–162. doi: 10.2478/v10183-012-0012-5
Brandt, A., De Broyer, C., De Mesel, I., Ellingsen, K., Gooday, A., Hilbig, B., et al. (2007). The biodiversity of the deep Southern Ocean benthos. Philos. Trans. R. Soc. B Biol. Sci. 362, 39–66. doi: 10.1098/rstb.2006.1952
Bribiesca-Contreras, G., Dahlgren, T. G., Horton, T., Drazen, J. C., Drennan, R., Jones, D. O. B., et al. (2021). Biogeography and connectivity across habitat types and geographical scales in Pacific abyssal scavenging amphipods. Front. Mar. Sci. 8:705237. doi: 10.3389/fmars.2021.705237
Brix, S., Bober, S., Tschesche, C., Kihara, T. C., Driskell, A., and Jennings, R. M. (2018). Molecular species delimitation and its implications for species descriptions using desmosomatid and nannoniscid isopods from the VEMA fracture zone as example taxa. Deep Sea Res. II Top. Stud. Oceanogr. 148, 180–207. doi: 10.1016/j.dsr2.2018.02.004
Brix, S., Osborn, K. J., Kaiser, S., Truskey, S. B., Schnurr, S. M., Brenke, N., et al. (2020). Adult life strategy affects distribution patterns in abyssal isopods – implications for conservation in Pacific nodule areas. Biogeosciences 17, 6163–6184. doi: 10.5194/bg-17-6163-2020
Chevreux, E. (1899). Sur deux espèces géantes d’amphipodes provenant des campagnes du yacht princesse Alice. Bull. Soc. Zool. Fr. 24, 152–158.
Chevreux, E. (1908). Diagnoses d’amphipodes nouveaux provenant des campagnes de la “Princesse-Alice” dans l’ Atlantique nord. Bull. Inst. Océanogr. Monaco 117, 1–13.
Chiba, S., Saito, H., Fletcher, R., Yogi, T., Kayo, M., Miyagi, S., et al. (2018). Human footprint in the abyss: 30 year records of deep-sea plastic debris. Mar. Policy 96, 204–212. doi: 10.1016/j.marpol.2018.03.022
Copilaş-Ciocianu, D., Borko, S., and Fiser, C. (2020). The late blooming amphipods: global change promoted post-Jurassic ecological radiation despite Palaeozoic origin. Mol. Phylogenet. Evol. 143:106664. doi: 10.1016/j.ympev.2019.106664
Copilaş-Ciocianu, D., Sidorov, D., and Gontcharov, A. (2019). Adrift across tectonic plates: molecular phylogenetics supports the ancient Laurasian origin of old limnic crangonyctid amphipods. Org. Divers. Evol. 19, 191–207. doi: 10.1007/s13127-019-00401-7
Corrigan, L. J., Horton, T., Fotherby, H., White, T. A., and Hoelzel, A. R. (2014). Adaptive evolution of deep-sea amphipods from the superfamily Lysianassoidea in the North Atlantic. Evol. Biol. 41, 154–165. doi: 10.1007/s11692-013-9255-2
Costa, F. O., Henzler, C. M., Lunt, D. H., Whiteley, N. M., and Rock, J. (2009). Probing marine Gammarus (Amphipoda) taxonomy with DNA barcodes. Syst. Biodivers. 7, 365–379. doi: 10.1017/S1477200009990120
De Broyer, C., Nyssen, F., and Dauby, P. (2004). The crustacean scavenger guild in Antarctic shelf, bathyal and abyssal communities. Deep Sea Res. II Top. Stud. Oceanogr. 51, 1733–1752. doi: 10.1016/j.dsr2.2004.06.032
Drummond, A. J., Rambaut, A., Shapiro, B. E. T. H., and Pybus, O. G. (2005). Bayesian coalescent inference of past population dynamics from molecular sequences. Mol. Biol. Evol. 22, 1185–1192. doi: 10.1093/molbev/msi103
d’Udekem d’Acoz, C., and Havermans, C. (2015). Contribution to the systematics of the genus Eurythenes S.I. Smith in Scudder, 1882 (Crustacea: Amphipoda: Lysianassoidea: Eurytheneidae). Zootaxa 3971, 1–80. doi: 10.11646/zootaxa.3971.1.1
Duffy, G. A., Gutteridge, Z. R., Thurston, M. H., and Horton, T. (2016). A comparative analysis of canyon and non-canyon populations of the deep-sea scavenging amphipod Paralicella caperesca. J. Mar. Biol. Assoc. U. K. 96, 1687–1699. doi: 10.1017/S0025315415002064
Edler, D., Klein, J., Antonelli, A., and Silvestro, D. (2021). raxmlGUI 2.0: a graphical interface and toolkit for phylogenetic analyses using RAxML. Methods Ecol. Evol. 12, 373–377. doi: 10.1111/2041-210X.13512
Etter, R. J., Boyle, E. E., Glazier, A., Jennings, R. M., Dutra, E., and Chase, M. R. (2011). Phylogeography of a pan-Atlantic abyssal protobranch bivalve: implications for evolution in the deep Atlantic. Mol. Ecol. 20, 829–843. doi: 10.1111/j.1365-294X.2010.04978.x
Ezard, T., Fujisawa, T., and Barraclough, T. G. (2009). Splits: Species’ Limits by Threshold Statistics. R Package Version 1.0-18/r45.
Felsenstein, J. (1985). Phylogenies and the comparative method. Am. Nat. 125, 1–15. doi: 10.2307/2461605
Fischer, V., Elsner, N. O., Brenke, N., Schwabe, E., and Brandt, A. (2015). Plastic pollution of the Kuril–Kamchatka Trench area (NW pacific). Deep Sea Res. II Top. Stud. Oceanogr. 111, 399–405. doi: 10.1016/j.dsr2.2014.08.012
France, S. C., and Kocher, T. D. (1996). DNA sequencing of formalin-fixed crustaceans from archival research collections. Mol. Mar. Biol. Biotechnol. 5, 304–313.
Fu, Y.-X. (1997). Statistical tests of neutrality of mutations against population growth, hitchhiking and background selection. Genetics 147, 915–925. doi: 10.1093/genetics/147.2.915
Fu, Y.-X., and Li, W.-H. (1993). Statistical tests of neutrality of mutations. Genetics 133, 693–709. doi: 10.1093/genetics/133.3.693
Gollner, S., Kaiser, S., Menzel, L., Jones, D. O. B., Brown, A., Mestre, N. C., et al. (2017). Resilience of benthic deep-sea fauna to mining activities. Mar. Environ. Res. 129, 76–101. doi: 10.1016/j.marenvres.2017.04.010
Hartman, S. E. (2019). RRS Discovery Cruise 103 21 Jun- 10 Jul 2019. Water Column and Seafloor Time-Series Studies at the Porcupine Abyssal Plain Sustained Observatory. National Oceanography Centre Cruise Report, No. 61. Southampton: National Oceanography Centre, Southampton, 146.
Havermans, C. (2016). Have we so far only seen the tip of the iceberg? Exploring species diversity and distribution of the giant amphipod Eurythenes. Biodiversity 17, 12–25. doi: 10.1080/14888386.2016.1172257
Havermans, C., and Smetacek, V. (2018). Bottom-up and top-down triggers of diversification: a new look at the evolutionary ecology of scavenging amphipods in the deep sea. Prog. Oceanogr. 164, 37–51. doi: 10.1016/j.pocean.2018.04.008
Havermans, C., Sonet, G., d’Udekem d’Acoz, C., Nagy, Z. T., Martin, P., Brix, S., et al. (2013). Genetic and morphological divergences in the cosmopolitan deep-sea amphipod Eurythenes gryllus reveal a diverse abyss and a bipolar species. PLoS One 8:e74218. doi: 10.1371/journal.pone.0074218
Hein, J. R., Koschinsky, A., and Kuhn, T. (2020). Deep-ocean polymetallic nodules as a resource for critical materials. Nat. Rev. Earth Environ. 1, 158–169. doi: 10.1038/s43017-020-0027-0
Hessler, R. R., Ingram, C. L., Yayanos, A. A., and Burnett, B. R. (1978). Scavenging amphipods from the floor of the Philippine Trench. Deep Sea Res. 25, 1029–1047. doi: 10.1016/0146-6291(78)90585-4
Horton, T., Thurston, M. H., Vlierboom, R., Gutteridge, Z., Pebody, C. A., Gates, A. R., et al. (2020). Are abyssal scavenging amphipod assemblages linked to climate cycles? Progr. Oceanogr. 184:102318. doi: 10.1016/j.pocean.2020.102318
Hou, Z. G., Fu, J. H., and Li, S. Q. (2007). A molecular phylogeny of the genus Gammarus (Crustacea: Amphipoda) based on mitochondrial and nuclear gene sequences. Mol. Phylogenet. Evol. 45, 596–611. doi: 10.1016/j.ympev.2007.06.006
Iguchi, A., Nishijima, M., Yoshioka, Y., Miyagi, A., Miwa, R., Tanaka, Y., et al. (2020). Deep-sea amphipods around cobalt-rich ferromanganese crusts: taxonomic diversity and selection of candidate species for connectivity analysis. PLoS One 15:e0228483. doi: 10.1371/journal.pone.0228483
Ingram, C. L., and Hessler, R. R. (1983). Distribution and behavior of scavenging amphipods from the central North Pacific. Deep Sea Res. A Oceanogr. Res. Pap. 30, 683–706. doi: 10.1016/0198-0149(83)90017-1
Jakiel, A., Palero, F., and Błażewicz, M. (2019). Deep ocean seascape and Pseudotanaidae (Crustacea: Tanaidacea) diversity at the Clarion-Clipperton Fracture Zone. Sci. Rep. 9:17305. doi: 10.1038/s41598-019-51434-z
Jamieson, A. J., Kilgallen, N. M., Rowden, A. A., Fujii, T., Horton, T., Lörz, A. N., et al. (2011). Bait-attending fauna of the Kermadec Trench, SW Pacific Ocean: evidence for an ecotone across the abyssal–hadal transition zone. Deep Sea Res. I Oceanogr. Res. Pap. 58, 49–62. doi: 10.1016/j.dsr.2010.11.003
Janssen, A., Kaiser, S., Meißner, K., Brenke, N., Menot, L., and Martínez Arbizu, P. (2015). A reverse taxonomic approach to assess macrofaunal distribution patterns in abyssal pacific polymetallic nodule fields. PLoS One 10:e0117790. doi: 10.1371/journal.pone.0117790
Janssen, A., Stuckas, H., Vink, A., and Martínez Arbizu, P. (2019). Biogeography and population structure of predominant macrofaunal taxa (Annelida and Isopoda) in abyssal polymetallic nodule fields: implications for conservation and management. Mar. Biodiver. 49, 2641–2658. doi: 10.1007/s12526-019-00997-1
Jażdżewska, A. M., and Mamos, T. (2019). High species richness of Northwest Pacific deep-sea amphipods revealed through DNA barcoding. Prog. Oceanogr. 178:102184. doi: 10.1016/j.pocean.2019.102184
Jażdżewska, A. M., Thurston, M., and Ziemkiewicz, A. (2020). “Amphipoda. distribution of deep-sea benthic Amphipoda along the NW Pacific,” in Biogeographic Atlas of the Deep NW Pacific Fauna, eds H. Saeedi and A. Brandt (Sofia: Pensoft), 377–414. doi: 10.3897/ab.e51315
Jones, D. O., Kaiser, S., Sweetman, A. K., Smith, C. R., Menot, L., Vink, A., et al. (2017). Biological responses to disturbance from simulated deep-sea polymetallic nodule mining. PLoS One 12:e0171750. doi: 10.1371/journal.pone.0171750
Kapli, P., Lutteropp, S., Zhang, J., Kobert, K., Pavlidis, P., Stamatakis, A., et al. (2017). Multi-rate Poisson tree processes for single-locus species delimitation under maximum likelihood and Markov chain Monte Carlo. Bioinformatics 33, 1630–1638. doi: 10.1093/bioinformatics/btx025
Katoh, K., and Standley, D. M. (2013). MAFFT multiple sequence alignment software version 7: improvements in performance and usability. Mol. Biol. Evol. 30, 772–780. doi: 10.1093/molbev/mst010
Katoh, K., Misawa, K., Kuma, K., and Miyata, T. (2002). MAFFT: a novel method for rapid multiple sequence alignment based on fast Fourier transform. Nucleic Acids Res. 30, 3059–3066. doi: 10.1093/nar/gkf436
Klages, M., Muyakshin, S., Soltwedel, T., and Arntz, W. E. (2002). Mechanoreception, a possible mechanism for food fall detection in deep-sea scavengers. Deep Sea Res. I Oceanogr. Res. Pap. 49, 143–155. doi: 10.1016/S0967-0637(01)00047-4
Knox, M. A., Hogg, I. D., Pilditch, C. A., Lörz, A. N., Hebert, P. D. N., and Steinke, D. (2012). Mitochondrial DNA (COI) analyses reveal that amphipod diversity is associated with environmental heterogeneity in deep-sea habitats. Mol. Ecol. 21, 4885–4897. doi: 10.1111/j.1365-294X.2012.05729.x
Kumar, S., Stecher, G., and Tamura, K. (2016). MEGA7: molecular evolutionary genetics analysis version 7.0 for bigger datasets. Mol. Biol. Evol. 33, 1870–1874. doi: 10.1093/molbev/msw054
Librado, P., and Rozas, J. (2009). DnaSP v5: a software for comprehensive analysis of DNA polymorphism data. Bioinformatics 25, 1451–1452. doi: 10.1093/bioinformatics/btp187
Lobo, J., Ferreira, M. S., Antunes, I. C., Teixeira, M. A. L., Borges, L. M. S., Sousa, R., et al. (2017). Contrasting morphological and DNA barcode-suggested species boundaries among shallow-water amphipod fauna from the southern European Atlantic coast. Genome 60, 147–157. doi: 10.1139/gen-2016-0009
Lörz, A. N., Tandberg, A. H. S., Willassen, E., and Driskell, A. (2018b). Rhachotropis (Eusiroidea, Amphipoda) from the North East Atlantic. Zookeys 2018, 75–101. doi: 10.3897/zookeys.731.19814
Lörz, A.-N., Jażdżewska, A. M., and Brandt, A. (2018a). A new predator connecting the abyssal with the hadal in the Kuril-Kamchatka Trench, NW Pacific. PeerJ 6:e4887. doi: 10.7717/peerj.4887
Macdonald, A. G., and Gilchrist, I. (1980). Effects of hydraulic decompression and compression on deep-sea amphipods. Comp. Biochem. Phys. A 67, 149–153. doi: 10.1016/0300-9629(80)90420-X
Mamos, T., Wattier, R., Burzyński, A., and Grabowski, M. (2016). The legacy of a vanished sea: a high level of diversification within a European freshwater amphipod species complex driven by 15 My of Paratethys regression. Mol. Ecol. 3, 795–810. doi: 10.1111/mec.13499
Mandt, M. W. (1822). Observationes in Historiam Naturalem et Anatomiam Comparatam in Itinere Groenlandico Factae. Dissertatio Inauguralis Quam Consensu et Auctoritate Gratiosi Micorum Ordinis in Universitate Literaria Berolinensi ut Summi in Medicina et Chirurgia Honores Rite. 40.
Martínez Arbizu, P., Brix, S., Kaiser, S., Brandt, A., George, K., Arndt, H., et al. (2015). Deep-Sea Biodiversity, Current Activity, and Seamounts in the Atlantic – Cruise No. M79/1 – June 10 – August 26, 2009 – Montevideo (Uruguay) – Ponta Delgada (Portugal). METEOR-Berichte, M79/1, 92 pp., DFG-Senatskommission für Ozeanographie. doi: 10.2312/cr_m79_1
McClain, C. R., and Hardy, S. M. (2010). The dynamics of biogeographic ranges in the deep sea. Proc. R. Soc. B Biol. Sci. 277, 3533–3546. doi: 10.1098/rspb.2010.1057
Meyer, C. P. (2003). Molecular systematics of cowries (Gastropoda: Cypraeidae) and diversification patterns in the tropics. Biol. J. Linn. Soc. 79, 401–459. doi: 10.1046/j.1095-8312.2003.00197.x
Milne Edwards, H. (1848). Sur un crustacé amphipode, remarquable par sa grande taille. Ann. Sci. Nat. Zool. Ser. 3 9:398.
Mohrbeck, I., Horton, T., Jażdżewska, A. M., and Martínez Arbizu, P. (2021). DNA-barcoding and cryptic diversity of deep-sea acavenging amphipods in the Clarion-Clipperton Zone (Eastern Equatorial Pacific). Mar. Biodiver. 51:26. doi: 10.1007/s12526-021-01170-3
Monaghan, M. T., Wild, R., Elliot, M., Fujisawa, T., Balke, M., Inward, D. J., et al. (2009). Accelerated species inventory on Madagascar using coalescent-based models of species delineation. Syst. Biol. 58, 298–311. doi: 10.1093/sysbio/syp027
O’Dea, A., Lessios, H. A., Coates, A. G., Eytan, R. I., Restrepo-Moreno, S. A., Cione, A. L., et al. (2016). Formation of the Isthmus of Panama. Sci. Adv. 2:e1600883. doi: 10.1126/sciadv.1600883
Oldevig, H. (1959). Arctic, Subarctic and Scandinavian Amphipods in the Collections of the Swedish Natural History Museum in Stockholm. Goteborgs Kungliga Vetenskaps- och Vitterhets-Samhalles Handlingar, Sjatte Foljden, (Ser B.), Vol. 8. Göteborg: Elanders boktr, 1–132.
Palumbi, S. R., Martin, A., Romano, S., McMillan, W. O., Stice, L., and Grabowski, G. (1991). The Simple Fool’s Guide to PCR. Version 2. Honolulu, HI: University of Hawaii Press, 45.
Patel, T., Robert, H., d’Udekem d’Acoz, C., Martens, K., De Mesel, I., Degraer, S., et al. (2020). Biogeography and community structure of abyssal scavenging Amphipoda (Crustacea) in the Pacific Ocean. Biogeosciences 17, 2731–2744. doi: 10.5194/bg-17-2731-2020
Pons, J., Barraclough, T. G., Gomez-Zurita, J., Cardoso, A., Duran, D. P., Hazell, S., et al. (2006). Sequence-based species delimitation for the DNA taxonomy of undescribed insects. Syst. Biol. 55, 595–609. doi: 10.1080/10635150600852011
Premke, K., Muyakshin, S., Klages, M., and Wegner, J. (2003). Evidence for long-range chemoreceptive tracking of food odour in deep-sea scavengers by scanning sonar data. J. Exp. Mar. Biol. Ecol. 285–286, 283–294. doi: 10.1016/S0022-0981(02)00533-6
Puillandre, N., Brouillet, S., and Achaz, G. (2021). ASAP: assemble species by automatic partitioning. Mol. Ecol. Res. 21, 609–620. doi: 10.1111/1755-0998.13281
QGIS.org (2021). QGIS Geographic Information System. QGIS Association. Available online at: http://www.qgis.org
R Core Team (2021). R: A Language and Environment for Statistical Computing. Vienna: R Foundation for Statistical Computing.
Rambaut, A., Drummond, A. J., Xie, D., Baele, G., and Suchard, M. A. (2018). Posterior summarization in Bayesian phylogenetics using Tracer 1.7. Syst. Biol. 67, 901–904. doi: 10.1093/sysbio/syy032
Ramirez-Llodra, E., Brandt, A., Danovaro, R., De Mol, B., Escobar, E., German, C. R., et al. (2010). Deep, diverse and definitely different: unique attributes of the world’s largest ecosystem. Biogeosciences 7, 2851–2899. doi: 10.5194/bg-7-2851-2010
Ramos-Onsins, S. E., and Rozas, J. (2002). Statistical properties of new neutrality tests against population growth. Mol. Biol. Evol. 19, 2092–2100. doi: 10.1093/oxfordjournals.molbev.a004034
Ratnasingham, S., and Hebert, P. D. N. (2007). The barcode of life data system. (http://www.barcodinglife.org). Mol. Ecol. Res. 7, 355–364. doi: 10.1111/j.1471-8286.2007.01678.x
Ratnasingham, S., and Hebert, P. D. N. (2013). A DNA-based registry for all animal species: the barcode index number (BIN) system. PLoS One 8:e66213. doi: 10.1371/journal.pone.0066213
Rex, M. A., McClain, C. R., Johnson, N. A., Etter, R. J., Allen, J. A., Bouchet, P., et al. (2005). A source-sink hypothesis for abyssal biodiversity. Am. Nat. 165, 163–178. doi: 10.1086/427226
Riehl, T., Brenke, N., Brix, S., Driskell, A., Kaiser, S., and Brandt, A. (2014). Field and laboratory methods for DNA studies on deep-sea isopod crustaceans. Pol. Polar Res. 35, 203–224. doi: 10.2478/popore-2014-0018
Riehl, T., Lins, L., and Brandt, A. (2018). The effects of depth, distance, and the Mid-Atlantic Ridge on genetic differentiation of abyssal and hadal isopods (Macrostylidae). Deep Sea Res. II Top. Stud. Oceanogr. 148, 74–90. doi: 10.1016/j.dsr2.2017.10.005
Ritchie, H., Jamieson, A. J., and Piertney, S. B. (2015). Phylogenetic relationships among hadal amphipods of the superfamily Lysianassoidea: implications for taxonomy and biogeography. Deep Sea Res. I Oceanogr. Res. Pap. 105, 119–131. doi: 10.1016/j.dsr.2015.08.014
Ritchie, H., Jamieson, A. J., and Piertney, S. B. (2017). Population genetic structure of two congeneric deep-sea amphipod species from geographically isolated hadal trenches in the Pacific Ocean. Deep Sea Res. I Oceanogr. Res. Pap. 119, 50–57. doi: 10.1016/j.dsr.2016.11.006
Ruhl, H. A., Ballinger, T., Barone, G., Benoist, N., Bett, B., Biede, V., et al. (2019). RRS James Cook Cruise 165 19 May - 12 Jun 2018. Water Column and Seafloor Time-Series Studies at the Porcupine Abyssal Plain Sustained Observatory. National Oceanography Centre Cruise Report, No. 57. Southampton: National Oceanography Centre, Southampton, 15
Shulenberger, E., and Barnard, J. L. (1976). Amphipods from an abyssal trap set in the North Pacific Gyre. Crustaceana 31, 241–258. doi: 10.1163/156854076X00035
Smith, C. R. (2007). “Bigger is better: the role of whales as detritus in marine ecosystems,” in Whales, Whaling and Ocean Ecosystems, eds P. D. Estes, D. P. De Master, R. L. Brownell, D. F. Doak, T. M. William, and D. Berkeley (Berkeley, CA: University of California Press), 286–301. doi: 10.1525/9780520933200-026
Smith, C. R., and Baco, A. R. (2003). Ecology of whale falls at the deep-sea floor. Oceanogr. Mar. Biol. Ann. Rev. 41, 311–354.
Stamatakis, A. (2014). RAxML version 8: a tool for phylogenetic analysis and post-analysis of large phylogenies. Bioinformatics 30, 1312–1313. doi: 10.1093/bioinformatics/btu033
Straume, E. O., Gaina, C., Medvedev, S., and Nisancioglu, K. H. (2020). Global cenozoic paleobathymetry with a focus on the northern hemisphere oceanic gateways. Gondwana Res. 86, 126–143. doi: 10.1016/j.gr.2020.05.011
Tajima, F. (1989). Statistical method for testing the neutral mutation hypothesis by DNA polymorphism. Genetics 123, 585–595. doi: 10.1093/genetics/123.3.585
Takeuchi, I., Tomikawa, K., and Lindsay, D. (2016). A new genus and species of Phtisicidae (Crustacea: Amphipoda) from abyssal depths in the Japan Trench, with special reference to similarities with Southern Ocean genera. J. Crust. Biol. 36, 469–506. doi: 10.1163/1937240X-00002457
Taylor, M. L., and Roterman, C. N. (2017). Invertebrate population genetics across Earth’s largest habitat: the deep-sea floor. Mol. Ecol. 26, 4872–4896. doi: 10.1111/mec.14237
Tempestini, A., Rysgaard, S., and Dufresne, F. (2018). Species identification and connectivity of marine amphipods in Canada’s three oceans. PLoS One 13:e0197174. doi: 10.1371/journal.pone.0197174
Thurston, M. H. (1979). Scavenging abyssal amphipods from the North-East Atlantic Ocean. Mar. Biol. 51, 55–68. doi: 10.1007/BF00389031
Thurston, M. H. (1990). Abyssal necrophagous amphipods (Crustacea: Amphipoda) in the northeast and tropical Atlantic Ocean. Progr. Oceanogr. 24, 257–274. doi: 10.1016/0079-6611(90)90036-2
Treude, T., Janßen, F., Queisser, W., and Witte, U. (2002). Metabolism and decompression tolerance of scavenging lysianassoid deep-sea amphipods. Deep Sea Res. I Oceanogr. Res. Pap. 49, 1281–1289. doi: 10.1016/S0967-0637(02)00023-7
Verheye, M. L., Backeljau, T., and d’Udekem d’Acoz, C. (2016). Looking beneath the tip of the iceberg: diversification of the genus Epimeria on the Antarctic shelf (Crustacea, Amphipoda). Polar Biol. 39, 925–945. doi: 10.1007/s00300-016-1910-5
Victorero, L., Watling, L., Deng Palomares, M. L., and Nouvian, C. (2018). Out of sight, but within reach: a global history of bottom-trawled deep-sea fisheries from >400m depth. Front. Mar. Sci. 5:98. doi: 10.3389/fmars.2018.00098
Vrijenhoek, R. C. (2010). Genetic diversity and connectivity of deep-sea hydrothermal vent metapopulations. Mol. Ecol. 19, 4391–4411. doi: 10.1111/j.1365-294X.2010.04789.x
Washburn, T. W., Menot, L., Bonifácio, P., Pape, E., Błażewicz, M., Bribiesca-Contreras, G., et al. (2021). Patterns of macrofaunal biodiversity across the Clarion-Clipperton Zone: an area targeted for seabed mining. Front. Mar. Sci. 8:626571. doi: 10.3389/fmars.2021.626571
Weston, J. N. J., Peart, R. A., Stewart, H. A., Ritchie, H., Piertney, S. B., Linley, T. D., et al. (2021). Scavenging amphipods from the Wallaby-Zenith Fracture Zone: extending the hadal paradigm beyond subduction trenches. Mar. Biol. 168:1. doi: 10.1007/s00227-020-03798-4
Yayanos, A. A. (1981). Reversible inactivation of deep-sea amphipods (Paralicella capresca) by a decompression from 601 bars to atmospheric pressure. Comp. Biochem. Phys. A 69, 563–565. doi: 10.1016/0300-9629(81)93020-6
Zardus, J. D., Etter, R. J., Chase, M. R., Rex, M. A., and Boyle, E. E. (2006). Bathymetric and geographic population structure in the pan-Atlantic deep-sea bivalve Deminucula atacellana (Schenck, 1939). Mol. Ecol. 15, 639–651. doi: 10.1111/j.1365-294X.2005.02832.x
Keywords: biodiversity, biogeography, species connectivity, abyss, COI barcoding, 16S rRNA gene, 28S rRNA gene, species delimitation
Citation: Jażdżewska AM, Horton T, Hendrycks E, Mamos T, Driskell AC, Brix S and Martínez Arbizu P (2021) Pandora’s Box in the Deep Sea –Intraspecific Diversity Patterns and Distribution of Two Congeneric Scavenging Amphipods. Front. Mar. Sci. 8:750180. doi: 10.3389/fmars.2021.750180
Received: 30 July 2021; Accepted: 20 October 2021;
Published: 07 December 2021.
Edited by:
Kevin M. Kocot, University of Alabama, United StatesReviewed by:
Gustavo Fonseca, Federal University of São Paulo, BrazilJon Thomassen Hestetun, Norwegian Research Institute (NORCE), Norway
Copyright © 2021 Jażdżewska, Horton, Hendrycks, Mamos, Driskell, Brix and Martínez Arbizu. This is an open-access article distributed under the terms of the Creative Commons Attribution License (CC BY). The use, distribution or reproduction in other forums is permitted, provided the original author(s) and the copyright owner(s) are credited and that the original publication in this journal is cited, in accordance with accepted academic practice. No use, distribution or reproduction is permitted which does not comply with these terms.
*Correspondence: Anna M. Jażdżewska, YW5uYS5qYXpkemV3c2thQGJpb2wudW5pLmxvZHoucGw=
†ORCID: Anna M. Jażdżewska, orcid.org/0000-0003-2529-0641; Tammy Horton, orcid.org/0000-0003-4250-1068; Tomasz Mamos, orcid.org/0000-0002-0524-3015; Amy C. Driskell, orcid.org/0000-0001-8401-7923; Saskia Brix, orcid.org/0000-0002-3269-8904; Pedro Martínez Arbizu, orcid.org/0000-0002-0891-1154