- 1College of Harbor, Coastal and Offshore Engineering, Hohai University, Nanjing, China
- 2School of Science and Engineering, University of Dundee, Dundee, United Kingdom
- 3School of Engineering, University of Liverpool, Liverpool, United Kingdom
The flocculation of cohesive sediments represents a critical process in coastal sediment transport, with its appropriate representation in numerical models crucial for the prediction of contaminant transport, coastal morphodynamics and engineering problems. In this study, a flocculation model considering the effects of multiple fractal dimensions is incorporated into a two-phase numerical modelling framework and used to investigate the effects of spatio-temporal variations in sediment concentrations on the temporal evolution of local floc sizes. Initially, the model is applied to simulate the aggregation of clay suspensions in a vertical grid-stirred settling column, with results confirming the importance of multiple fractal dimensions when predicting the time evolution of floc sizes. The adoption of multiple fractal dimensions, in particular, allows the two-phase numerical model to better match the measured settling column data with improved overall correlation. This is especially the case when predicting initial floc size growth during the early period of settling when the flocs tend to adjust more rapidly to their equilibrium sizes. The two-phase model is then applied to simulate field measurements of mud resuspension process in a tidally driven channel. Again, by considering multiple fractal dimensions within the flocculation model, better agreement is obtained between observed and modelled suspended sediment concentrations, while predicted floc sizes are also in general accord with previous field measurements made within the same estuary.
Introduction
Understanding the flocculation of cohesive sediments is very important for the accurate prediction of suspended sediment and contaminant transport in coastal environments, and associated impacts initiated by coastal engineering works (Mayerle et al., 2015; Guo et al., 2017; Watson et al., 2018). Flocculation occurs when fine primary particles of cohesive sediment or small particle aggregates combine, due to electrochemical or biological attraction, to form larger agglomerations, widely known as flocs. These flocculation processes play a crucial role in influencing other cohesive sediment transport processes, such as settling, deposition, consolidation, erosion, and resuspension within estuaries and coastal waters (Lick et al., 1992; Cuthbertson et al., 2010; Zhang and Zhang, 2011; Wan et al., 2015; Li et al., 2017). Flocculation effects are also of significant importance to the assessment of aquatic science and water treatment applications, as well as for coastal engineering applications involving sediment management, such as maintenance dredging of waterways and the reclamation of mudflats (Mikkelsen and Pejrup, 2000; Son and Hsu, 2011; Zhu et al., 2014; Reisinger et al., 2017; Li et al., 2020).
An added complexity in cohesive sediment flocculation arises from the fact that the physical floc properties (e.g., size, density and structure) are continually changing both temporally and spatially within coastal waters (Manning, 2004; Manning et al., 2010; Keyvani and Strom, 2014; Shen and Maa, 2016). According to Winterwerp (1998), the water column residence time Tr and the time TT during which flow turbulence characteristics remain constant are two constraints affecting the possibility of cohesive sediment flocs reaching their equilibrium floc size (i.e., where aggregation and floc break-up processes balance). When the water column residence time is limited, even if the flow turbulence remains more or less homogenous (i.e., TT > Tr), the resulting flocs may remain in a non-equilibrium state due to continual temporal changes in the suspended sediment concentration (SSC) (Cuthbertson et al., 2010). Furthermore, the effective density and yield strengths of the flocs, determined by the solids content, the size and density of primary particles, and the irregular shape and porous structure of the flocs, can also vary during sedimentation, thus affecting deposition, consolidation, and erosion processes within cohesive sediment beds (He et al., 2016; Xu, 2019; Yang et al., 2019). This spatio-temporal variability therefore suggests that mere reliance on information associated with equilibrium floc sizes or SSC may be insufficient to fully characterize flocculation processes in highly dynamic coastal waters. Consequently, in order to accurately predict the transport and fate of cohesive sediments within such aquatic environments, the transient nature of the physical floc properties throughout their life cycle needs to be better accounted for in predictive numerical models.
Flocculation is governed by two main processes, namely aggregation and break up (Winterwerp, 2002; Son and Hsu, 2008), and many flocculation models have been proposed that account quantitatively for these competing effects. Earlier flocculation models (Thorn, 1981; Dyer, 1989) were rather simplistic in their approach, with sediment floc settling velocities correlated directly to other physical factors influencing sediment flocculation, such as turbulent shear rate G and suspended sediment concentration c. Although these early flocculation models were readily incorporated into cohesive sediment transport models, their equations do not take any account of the spatio-temporal variation in floc sizes and, as such, they are not always applicable for a wide range of SSC values or variable hydrodynamic conditions.
A more rigorous type of flocculation model is provided by population balance equations (PBE), within which physical properties such as floc sizes, densities, and even floc size distributions (FSD) are obtained by accounting more specifically for the physical aggregation and break up mechanisms that influence flocculation processes (Verney et al., 2011). A major disadvantage of these PBE models is that they are computationally demanding as both the floc density and FSD evolve both temporally and spatially and are thus difficult to incorporate efficiently into standard cohesive sediment transport models. These PBE models also require many more empirical assumptions to be made regarding the aggregation and break up processes controlling the evolution of the FSD and are therefore limited to a relatively small number of floc size classes and simple configurations (e.g., flocculation in a vertical settling column, Cuthbertson et al., 2018). The third type of flocculation model is based on a semi-empirical approach, first proposed by Winterwerp (1998), where temporally and spatially varying averaged floc sizes can be obtained. These types of models are less computationally demanding than PBE models, as they only track the evolution of a single representative floc size rather than the whole FSD. A downside of these models is that they still contain several empirical coefficients for sediment properties and aggregation and break-up rates that require prior calibration. In these models, the fractal dimension and yield strength of the cohesive sediment flocs are either assumed to be constant (Winterwerp, 1998) or variable parameters (Khelifa and Hill, 2006). Recently, both laboratory experiments and field measurements have indicated that similar-sized flocs may have different fractal dimensions or yield strengths (i.e., multiple floc structures) due to the fact that they may have formed under different physical mechanisms or have different masses and/or mass distributions within them (Vahedi and Gorczyca, 2012, 2014; Moruzzi et al., 2017; Fall et al., 2021). It has thus been suggested recently that flocculation models incorporating multiple fractal dimensions may account more realistically for the physical relationships between floc sizes, settling velocities, and yield strengths (Xu and Dong, 2017a).
For the validation of cohesive sediment transport models, most studies have focused on the prediction of SSC, as cohesive sediment flocculation characteristics are often not measured directly (Winterwerp, 2002; Son and Hsu, 2011). Other studies have used only zero-dimension data to validate the flocculation model (i.e., where flocculation processes are considered only under constant shearing conditions) (Son and Hsu, 2009; Strom and Keyvani, 2016; Xu and Dong, 2017a). Within coastal areas, however, the mean floc sizes measured at a fixed point are influenced by the incoming or outgoing sediment (or floc) fluxes that contribute to the formation of different floc characteristics. Few studies to-date have included the effects of variable sediment concentrations, and thus volumetric floc fluxes, on the prediction of floc evolution in space and time (Cuthbertson et al., 2018).
In this study, a one-dimensional-vertical (1DV) two-phase flow model is coupled with two flocculation models that consider unique (i.e., constant) and multiple (i.e., variable) fractal dimensions for a given floc size, respectively, to simulate the spatio-temporal evolution of flocs. The previously derived 1DV two-phase flow model by Xu and Dong (2017b) did not consider any time evolution of floc sizes. Therefore, the new developed models are applied, for the first time, to simulate a controlled 1D flocculation-sedimentation experiment conducted within a grid-stirred settling column. Subsequently, the models are applied to predict flocculation and cohesive sediment resuspension processes in a tidal channel of the Ems/Dollard estuary (Van Der Ham et al., 2001). The main aim of the current study is to capture floc development under variable sediment concentrations and, thus, its influence on the modelling of cohesive sediment dynamics in a tidally driven channel. Within these model simulations, the effects of multiple fractal dimensions and yield strengths on the flocculation and settling processes under variable sediment concentrations, as well as the influence of volumetric floc fluxes on the spatial-temporal evolution of local floc sizes, are considered.
Model Formulation
Within this section, the governing equations for the 1DV Reynold-averaged two-phase model for cohesive sediment suspensions (see section “Two-Phase Flow Model”), the two flocculation models used to predict unsteady cohesive sediment floc development (see section “Cohesive Sediment Flocculation models”), the floc number density equation (see section “Number Density of Flocs”), and the coupling procedures between these models (see section “Model Coupling Procedure”) are presented in detail.
Two-Phase Flow Model
The 1DV two-phase model used in this study is a simplified version of Xu and Dong (2017b). Eq. 1 represents the momentum equation for both the fluid and solid phases in the horizontal direction, Eqs 2, 3 represent the continuity equations, and Eqs 4, 5 represent the momentum equations for both phases in the vertical direction. Note that Eq. 1 only applies to field measurements where the rate of change of mean horizontal flow velocity (∂U/∂t) and horizontal pressure (∂P/∂x) need to be considered. For modelling the simplified case of cohesive sediment settling vertically (i.e., within a settling column), the horizontal flow terms and terms involving horizontal gradients are omitted.
Within Eqs 1–6, U is the horizontal velocity for both phases (i.e., fluid phase is denoted with subscript f and the solid phase with subscript S), ρmix = αsρs + αfρf is the bulk density of the fluid-sediment mixture, αs and αf are the volume fractions of solid and fluid phase, ρs and ρf are the solid and fluid phase densities, respectively, T is time, ws and wf are the floc settling velocities and fluid velocities, respectively, P is the pressure of mixture (with pf corresponding to the fluid pressure), g is the gravitational acceleration, τv is the viscous shear stress of the mixture, and fi is the momentum transfer between two phases. In this study, fi is used to describe the drag force from the other phase (i.e., the drag force exerted on the fluid phase from the solid phase, or vice versa). The modified classical mixing length method is adopted to calculate turbulent eddy viscosity (υT) and eddy diffusivity (ΓT):
where σT is the turbulent Prandtl-Schmidt number (usually specified as 0.7 or 1.0), κ is the Karman constant, Fν and Fd are the correction coefficients for eddy viscosity and eddy diffusivity, respectively, to describe the buoyancy effects caused by suspended sediments, and h is the height of vertical water column. Here, the eddy viscosity is modified by the formulation presented by Busch (1973), while the Munk-Anderson formula is applied for the calculation of Fd:
where, Ri is the gradient Richardson number, defined as:
Here, we assume the shear stress for the solid and fluid phases are equal (Chauchat et al., 2013; Xu and Dong, 2017b), and is presented as:
where is the volume-averaged velocity and μmix = μf(1 + βaαs) is the augmented viscosity, where βa is the amplification factor. With an increase of the solid fraction, the mixture goes through the transition from Newtonian to non-Newtonian fluid. To account for the non-Newtonian effects, the amplification factor βa is specified as (Graham, 1981):
where d* is defined as non-dimensional inter-particle distance. From geometrical considerations, it is expressed as a function of sediment volumetric concentration , where is the maximum solid volume of simple cubic packed spheres (Chauchat et al., 2013). The calculated viscosity from Eqs 12, 13 are suitable for sediment transport with large variation of sediment concentration, as the model results are consistent with results from both the classic formulae μmix = μf(1 + 2.5αs) and for the dilute case (Einstein, 1905) and for the dense case (Frankel and Acrivos, 1967), respectively.
In considering the aggregation and break up of flocs, Chauchat et al. (2013) suggested that the drag force should be given from a macroscopic point of view for the two-phase model. As the inverse of water flow resistance can be measured using the permeability parameter K, here the generalized Darcy law is adopted to describe the drag force (Toorman, 1996):
Permeability K is usually applied only when the sediment concentration reaches the gelling concentration (Winterwerp and Van Kesteren, 2004). Based on the stress balance equation, Toorman (1999) also extended the permeability K to the cases of dilute sediment concentration, the sedimentation and consolidation processes giving a unified expression as:
where, W is the settling velocity including the hindered settling effects and specified as:
where, ϕf is the volumetric concentration of cohesive sediment flocs and ϕfmax is the maximum value. The fractal dimension is denoted as nf. In the right-hand side of Eq. 16, the first two terms represent the effects of buoyancy, viscosity, and wake on the settling process of sediment particles. The ϕfmax is introduced to describe that the settling velocity of sediment particles approaches zero when ϕf is approaching ϕfmax. Following Chauchat et al. (2013), the value of 0.85 is adopted for ϕfmax, while w0 is the settling velocities of cohesive sediment flocs in the dilute case. To be consistent with the flocculation models adopted in this work, the settling velocities of cohesive sediment flocs are calculated based on fractal theory presented by Winterwerp (1998) as follows:
where, α1 is a coefficient depending on the sphericity of cohesive sediment flocs, Re is the particle Reynold number and defined as Re = wsD/ν, with D being the representative sizes of flocs. The boundary condition for sediment concentration, which also serves as the bed erodibility, is specified by van der Ham and Winterwerp (2001):
where, τb is the bed shear stress, τcr is the critical bed shear stress for sediment erosion, and M is the erosion coefficient.
Cohesive Sediment Flocculation models
Flocculation Model With Constant Fractal Dimension (Model A)
Based on the assumption of a constant fractal dimension nf and yield strength Fy for floc development, Winterwerp (1998) proposed a semi-empirical flocculation model that considered the effects of SSC c and fluid turbulent shear intensity G on the temporal evolution of floc size:
where d is the representative sizes of primary particles, while p, q, , and are model coefficients (for more details, see Winterwerp, 1998), G = is the shear rate (with ε the turbulent dissipation rate of the fluid), and μ is the dynamic viscosity. The aggregation term (i.e., first term on right-hand side of Eq. 19) and break up term (i.e., second term on right-hand size of Eq. 19) are proportional to sediment concentration c and yield strength Fy, respectively. Within Eq. 19, the fractal dimension nf and yield strength Fy are therefore required to be constant values for flocs of the same size. For application of the flocculation model to the laboratory settling column experiments, as the measured FSD is relatively narrow, and the time history of flocculation relatively short, the fractal dimension remains almost constant over the range of floc sizes. However, within field measurements, where the FSD can be considerably larger, and the time history of flocculation longer, the fractal dimension might be expected to change with the variation of floc sizes (Khelifa and Hill, 2006). To account for the effects of fractal dimension variation with floc size, the constant floc yield strength Fy can be replaced, such that:
where, τy is the yield stress of cohesive sediment flocs and B1 is an empirical coefficient.
Flocculation Model With Multiple Fractal Dimensions (Model B)
As discussed in the introduction, the fractal dimension nf does not appear to be unique for any given floc size, with multiple fractal dimensions having been shown to exist due to different flocculation mechanisms and/or mass distributions within specific floc structures. Specifically, the concept of a normal distribution of fractal dimensions to represent these multiple fractal dimensions has been introduced and incorporated into a settling velocity model, the results of which were found to compare well with measured data (Vahedi and Gorczyca, 2012). The normal distribution for fractal dimensions can be defined as follows:
where P(nf)D is the probability density function for fractal dimensions of floc size D, and μnf and σD are the mean and standard deviation of fractal dimensions nf for a given floc size D, respectively.
In order to incorporate the effects of multiple fractal dimensions on cohesive sediment flocculation processes, Eq. 21 is adopted within the flocculation model. As such, to determine the probability of a specific nf value in Eq. 21, the mean and standard deviation of fractal dimensions for all flocs of size D need to be specified. For floc populations composed of the same size D, multiple fractal dimensions therefore implies that multiple floc structures, and thus multi-yield strengths, may exist within the floc population (Vahedi and Gorczyca, 2012). Consequently, some flocs (with lower Fy values) may break up while others (with higher Fy) may not under the same turbulent shear rate G. It is also therefore important to determine the maximum fractal dimension nfmax that allows flocs of size D to break up under a specific imposed turbulent shear condition (note: larger fractal dimensions normally correspond to larger yield strengths) (Khelifa and Hill, 2006). If we assume that only flocs with yield strengths τy lower than the turbulent shear strength μG break up, then from Eq. 20, the maximum fractal dimension nfmax can be calculated using . Thus, the break-up term of the flocculation model with constant fractal dimension (i.e., second term on the right hand side of Eq. 19) can be revised using an integral form to include the influence of multiple fractal dimensions, such that:
This flocculation model with multiple fractal dimensions is denoted as Model B. The empirical aggregation and break-up coefficients k′A and k′B adopted in the two flocculation models (Eqs 19, 22) are constant values that are calibrated to match both the initial flocculation rate and the maximum equilibrium floc size attained in settling column experiment under steady state conditions (i.e., constant turbulent shear and sediment concentration); further details are given in section “Laboratory Model Setup.” Following Winterwerp (1998), the empirical model coefficients p and q are adopted as 1.0 and 0.5, respectively.
Number Density of Flocs
The two flocculation models outlined in section “Two-Phase Flow Model” relate to the time evolution of a representative floc size, while the two-phase model calculates the SSC. Therefore, the number density N of flocs may be introduced as an intermediate variable to link these models. The volumetric floc concentration ϕf can be linked to the number concentration of flocs N via the equation:
where, fs is a floc shape factor. During the flocculation process, ϕf varies with floc size D and fractal dimension nf, and can be calculated from the sediment volumetric concentration αs as follows:
where, ρfloc is the density of flocs. According to fractal theory, the floc density can be presented as (Kranenburg, 1994):
From Eqs 23–25, the variable floc size D can therefore be determined if the sediment volumetric concentration αs and the number concentration N of flocs are known. Furthermore, the settling velocity of cohesive sediment flocs in a dilute suspension w0 can be calculated from Eq. 17. Therefore, the floc settling velocities can be linked to their number concentration N. As discussed above, the floc number concentration N also needs to be resolved. Here, following Winterwerp (2002), we propose the balance equation for number density as:
where ΓT is the turbulent diffusion coefficient and FN is the flocculation term. The two flocculation models (i.e., Model A and Model B, section “Cohesive Sediment Flocculation models”) are examined, in turn, by combining each with the 1DV two-phase model (see section “Two-Phase Flow Model”). These flocculation models are first-order differential equations for floc size D, while FN is in the form of a first-order differential equation for number density N. As such, Eq. 19 can be rewritten as (see Winterwerp, 1998 for more details):
Based on Eq. 27, flocculation Model B has the form:
Model Coupling Procedure
The flow chart in Figure 1 shows the coupling procedures between the flocculation models and the 1DV two-phase model. For each time step, the governing equations of the two-phase model (Eqs 1–6) are firstly solved to obtain the sediment concentration. This concentration, and other relevant parameters, are then input into the flocculation models to solve the number density equation (Eq. 26). From Eqs 23–25, information on the floc size D, fractal dimension nf and floc density ρfloc is obtained. Based on fractal theory, the settling velocities w0 of the cohesive sediment flocs are then calculated by Eq. 17. Finally, these settling velocities are used to determine the drag force closure for the 1DV two-phase model (Eqs 14–16).
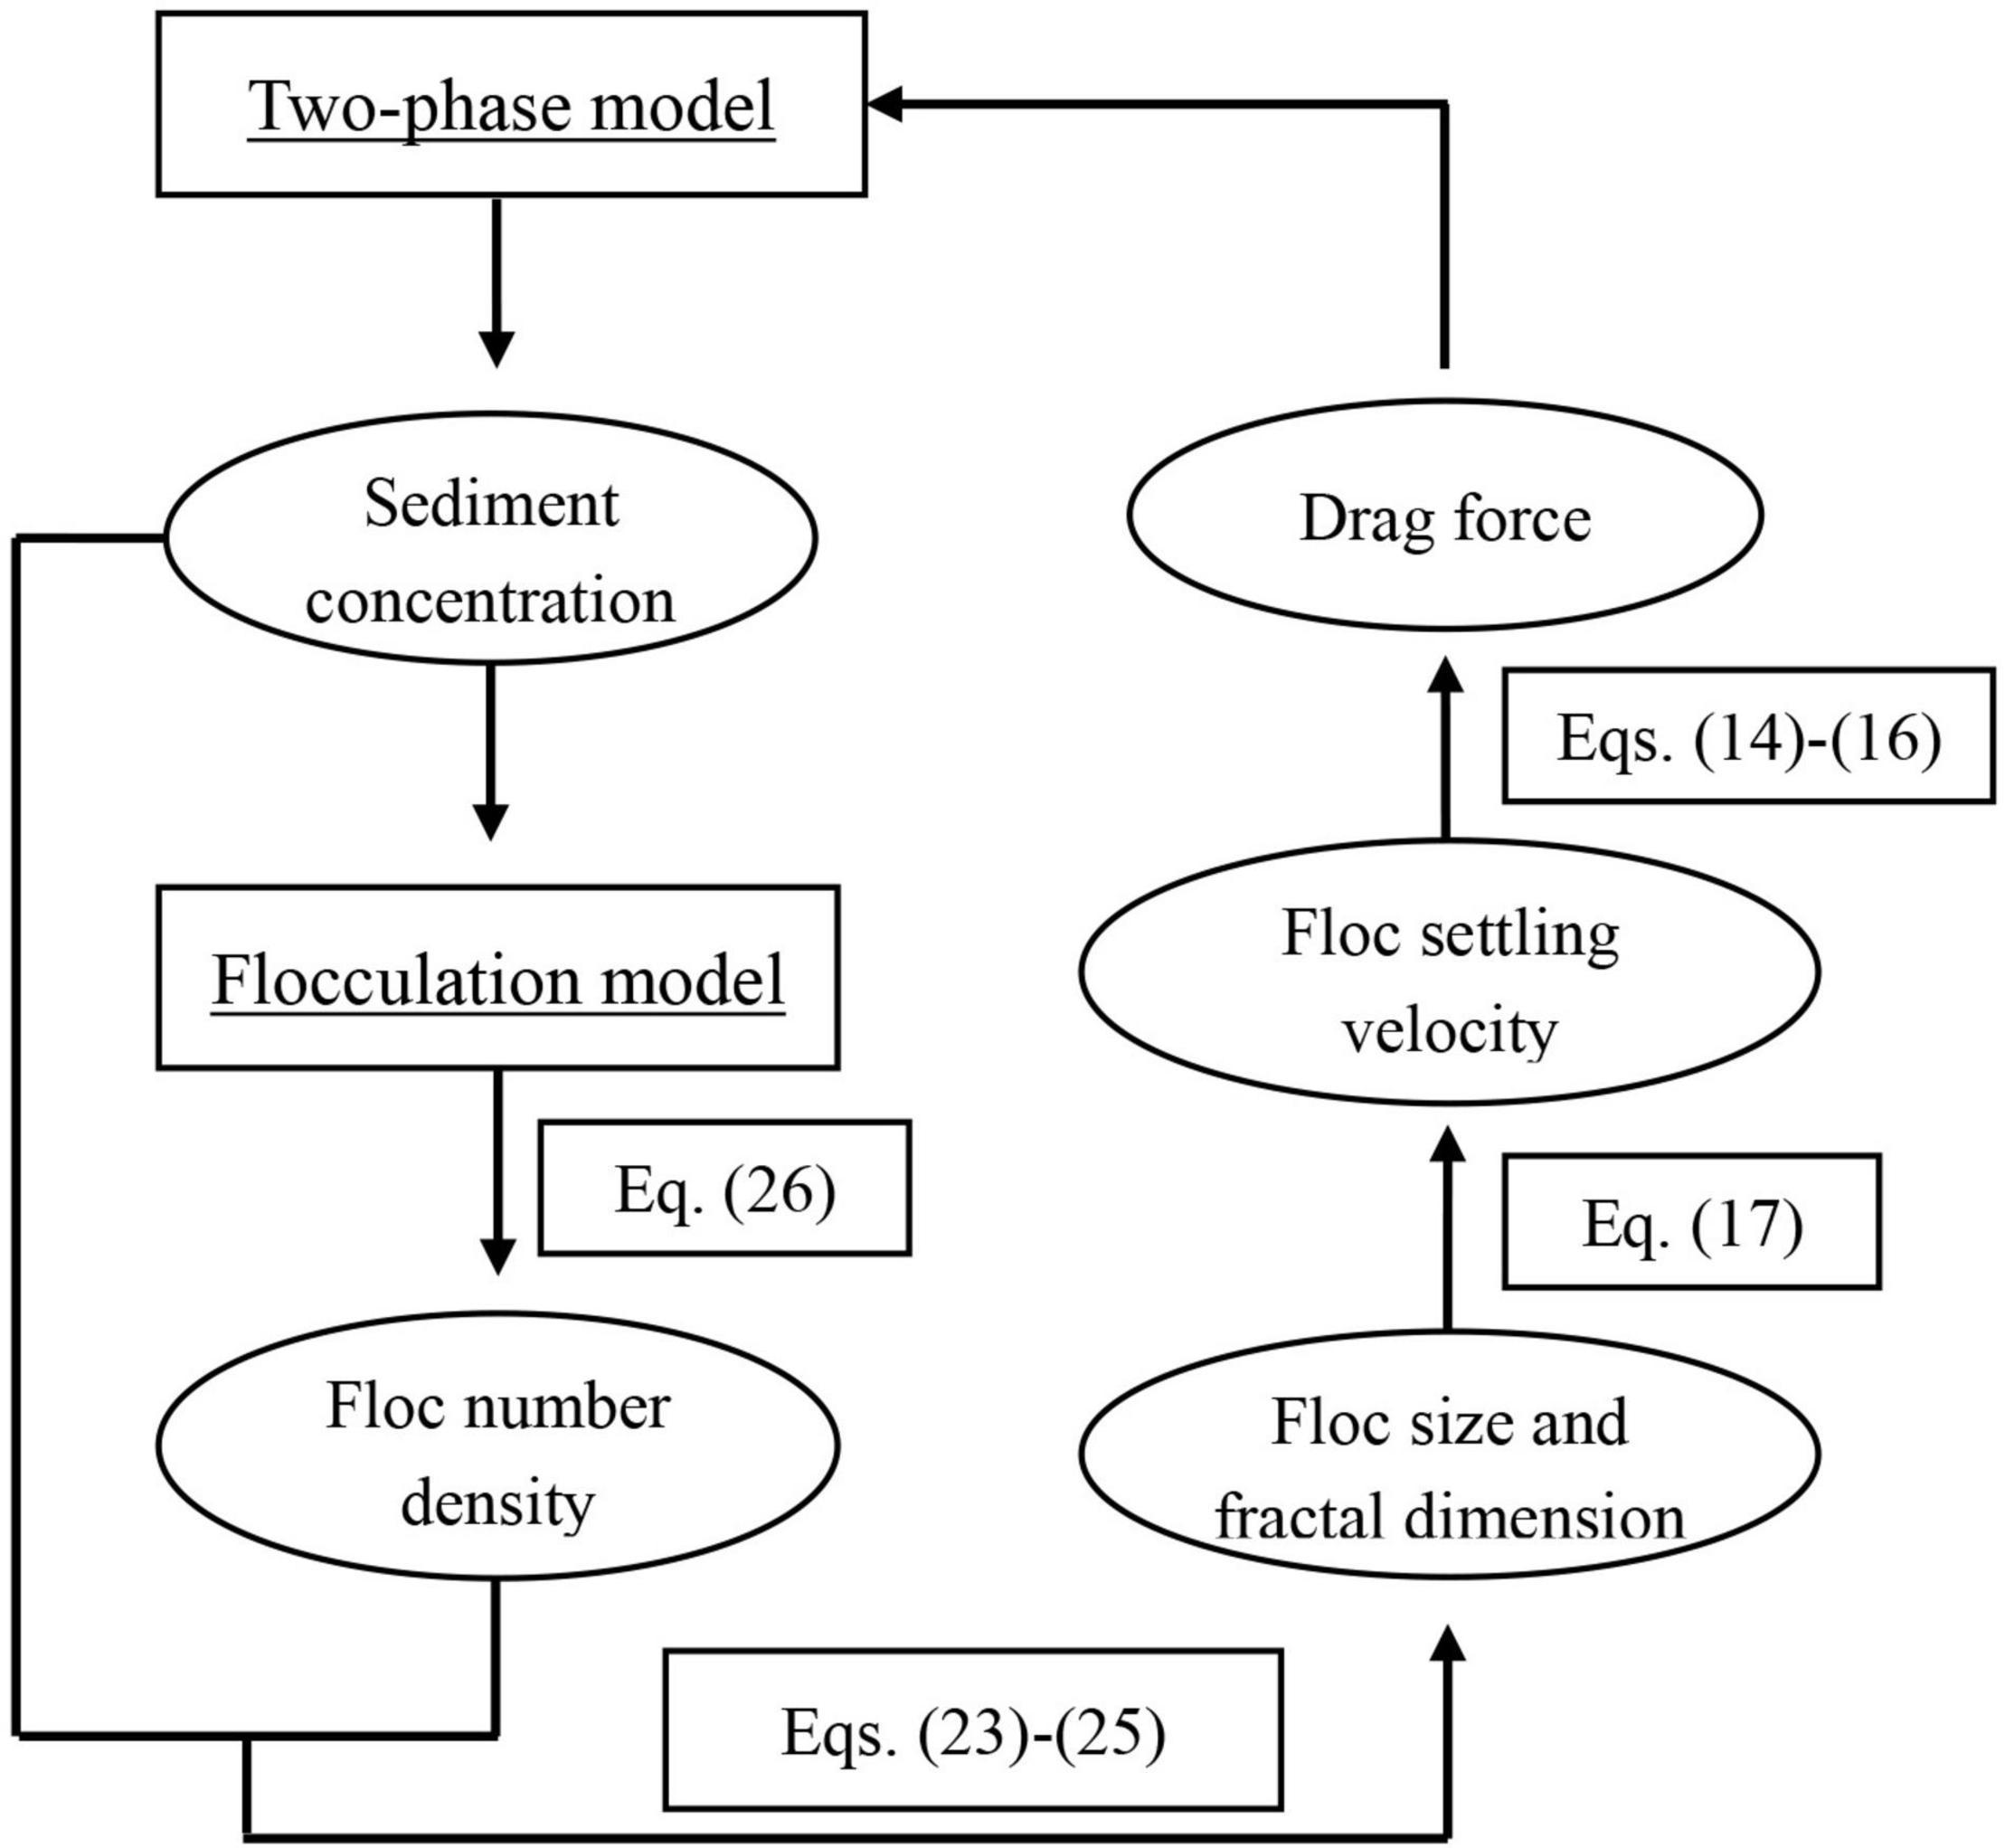
Figure 1. The flow chart of cohesive sediment transport model showing how the flocculation models are coupled within the 1DV two-phase modelling framework.
Model Application
Laboratory Model Setup
As discussed above in the introduction, most previous laboratory experiments on cohesive sediment flocculation have been conducted under controlled, idealized conditions within mixing tanks with pre-determined constant sediment concentrations, turbulent shear rates and/or water salinities. However, under non-equilibrium conditions, where sediment concentrations vary in both time and space, flocculation processes become more complicated due to the relative influence of residence and flocculation times on the floc sizes generated.
For this reason, the 1DV two-phase model is applied to simulate recent grid-stirred flocculation experiments conducted by Cuthbertson et al. (2018) for pure kaolin clay suspensions within a vertical, grid-stirred settling column (details of the experimental arrangement are given in Cuthbertson et al., 2010 and Cuthbertson et al., 2018). In this case, the calculations are focused in the vertical direction, therefore horizontal flow terms and other terms involving horizontal gradients in the two-phase model (Eqs 1–6) are omitted. During individual experimental runs, a highly concentrated kaolin suspension was fed at a constant inflow rate via a peristaltic pump from an external mixing tank into the upper buffer mixing tank at the top of the main grid-stirred settling column section. Two counter-rotating mixing paddles within the buffer mixing tank generated an established circulation that diluted the kaolin suspension within the preset volume water (50 L) and gradually transferred the dilute clay suspension into the main column section via a gate opening. Time series measurements of sediment concentrations were collected using optical backscatter (OBS) probes located at 0.5 and 1.2 m above the bottom of the main column section. These OBS probes were calibrated over a wide range of pure kaolin clay suspensions (with mass concentrations ranging from C = 0–1 g.l–1), and relationships were established between turbidity (NTU) and suspended sediment concentration (Cuthbertson et al., 2018). The time evolution of floc sizes was collected 0.4 m above the base of the column, via a macro-CCD camera (see Cuthbertson et al., 2018).
Three datasets from the laboratory settling column experiments, denoted Cases 1–3, are used for validation of the 1DV two-phase flocculation model. In the model simulations of the settling column cases, the temporal variation of clay concentration at the upper model boundary is determined by specifying (i) the clay input conditions (see Table 1) and (ii) the upper buffer tank volume and specified mass transfer rate of clay from the buffer tank to the main column (i.e., through calibration with time series clay concentrations measured within the column by the OBS probes). The initial floc size of the clay suspension is set as the primary clay particle size d = 2.0 μm, which is a regarded as a conservative value as it assumes no flocculation occurs in the buffer tank. The turbulent shear rate G adopted in the simulations, and representing the turbulence intensity, is set as a constant value for each case (see Table 1). These represent the average shear rate values within the central flow region between the oscillating grid pairs (Cuthbertson et al., 2010), which vary depending on the grid oscillation stroke and frequency (for the fixed grid arrangement). The resulting zero-mean shear turbulence fields are demonstrated to be quasi-homogeneous and near-isotropic within the central flow region between the oscillating grid pairs (i.e., away from the grids themselves). To determine the mean fractal dimension within the two flocculation, according to Cuthbertson et al. (2010), for floc sizes of pure clay smaller than 100, the majority of the fractal dimensions lie in the range of 1.7 ≤ nf ≤ 2.0 (see Figure 11 in Cuthbertson et al., 2010). As in a normal distribution the probability P(μ−3σ < x < μ + 3σ) is larger than 99%, the standard deviation is estimated as (2.0-1.7)/6 = 0.05. The mean fractal dimension is adopted as 1.85. The constant fractal dimension in Model A is thus specified as 1.85, while the specific flocculation parameters adopted in Models A and B for the three experimental cases considered are summarized in Table 2.
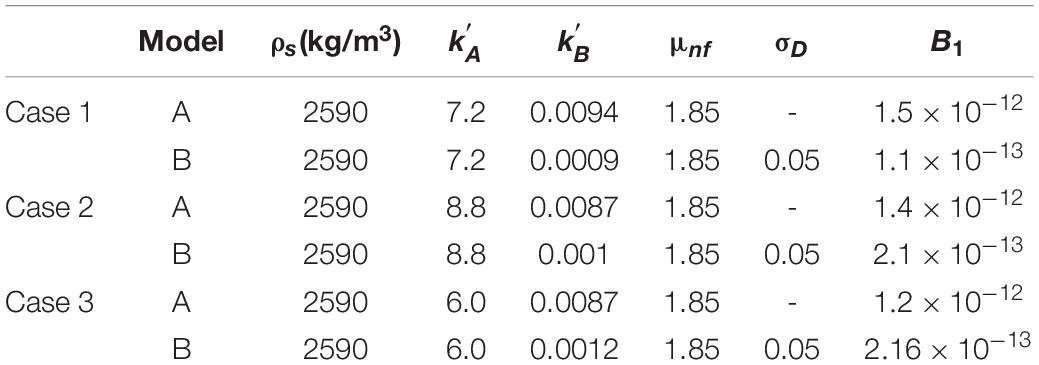
Table 2. Calibrated flocculation model coefficients and prescribed parameters for the simulations of grid-stirred settling column experiments.
To ensure a rational comparison between the two flocculation models (i.e., Model A and B) for the reproduced time evolution of clay flocs in the settling column experiments, it is necessary to establish the baseline model parameters through calibration. Here, the flocculation model coefficients are obtained by adopting the same final equilibrium floc size generated under the same fixed sediment concentration and turbulent shear rate for each data set. Under these steady-state conditions, the ratio between the aggregation and break-up parameters, and , can be determined. Secondly, the value for is selected (i.e., so is the value of , because the ratio of these two and has been determined) to fit best to the initial flocculation rate.
Computational Results
The time series measurements and model results of sediment concentration at 0.5 and 1.2 m above the bottom of the main grid-stirred settling column section are shown in Figure 2 for Case 1 (Table 1). Using these measured time series of sediment concentration to calibrate the upper clay input boundary condition (where t = 0 refers to start of the sediment input into the column), the two flocculation models are capable of reproducing the vertical profiles of sediment concentration. In the experimental data, the measured concentrations at 0.5 and 1.2 m converge around 12,000 s (Figure 2), with the results from both Models A and B converging around 13,000 s. It is also noted that a smaller vertical gradient of sediment concentration was obtained by Model B than that of Model A before convergence. Similar trends were also obtained in the model simulations of Cases 2 and 3 (Table 1).
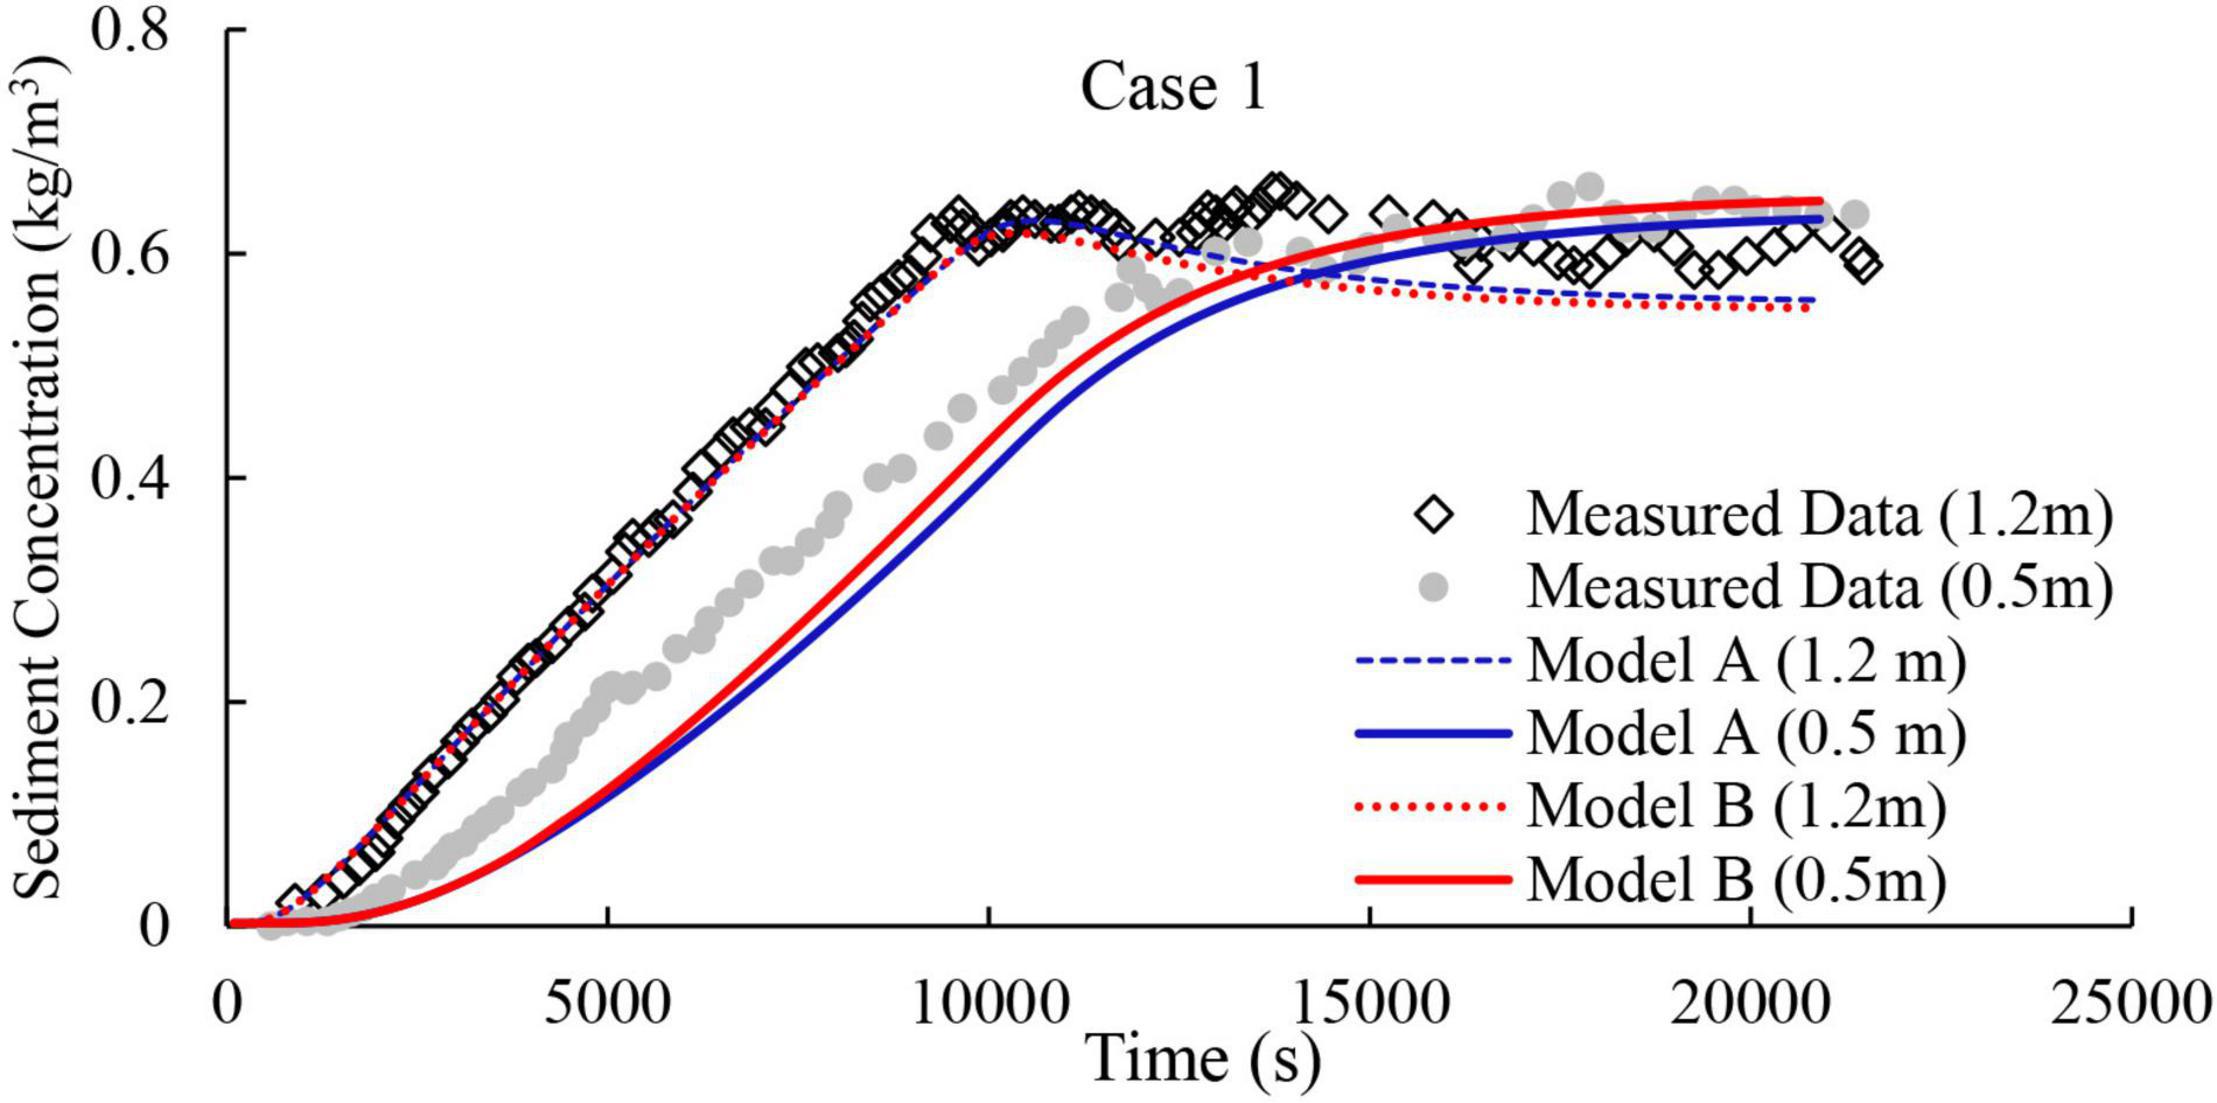
Figure 2. Modelled and measured time series of SSC at elevations 0.5 and 1.2 m within the grid-stirred settling column for Case 1 (see Table 1).
The measured and modelled temporal variations in the root-mean-square (rms) floc sizes generated in the settling column at z = 0.4 m, where the floc size measurements were obtained, are shown in Figures 3A–C for Cases 1–3, respectively. The main feature of these measured data is that near quasi-equilibrium floc sizes are already attained within the column by the time the flocs are first detected in the floc viewing chamber within the lower part of the settling column (Cuthbertson et al., 2010). The corresponding 1DV two-phase flocculation model results indicate that Model B (i.e., multiple fractal dimension) provides far closer agreement with the measured time evolution of rms floc sizes, both in terms of the initial rapid flocculation and equilibrium floc size attained, while Model A significantly underpredicts the initial flocculation rate before reaching the same equilibrium floc size at a later elapsed time. Indeed, Model A is shown to be incapable of reproducing the measured temporal evolution with of floc sizes with the settling column no matter what combination of and are used. Specifically, the root-mean-square errors (RMSE) of the calculated time series of floc sizes are 18.5 (Case 1), 26.6 (Case 2), and 26.9 (Case 3) for the results of Model A. While for the results of Model B, the RMSEs are 4.3 (Case 1), 3.5 (Case 2), and 5.7 (Case 3), respectively. By incorporating multiple fractal dimensions and thus variable yield strengths, Model B is able to capture better the temporal characteristics of the rapid initial floc size adjustment at earlier stages of the runs (i.e., T < 5000 s), after which the calculated floc sizes increase only slowly and approach the quasi-equilibrium floc size.
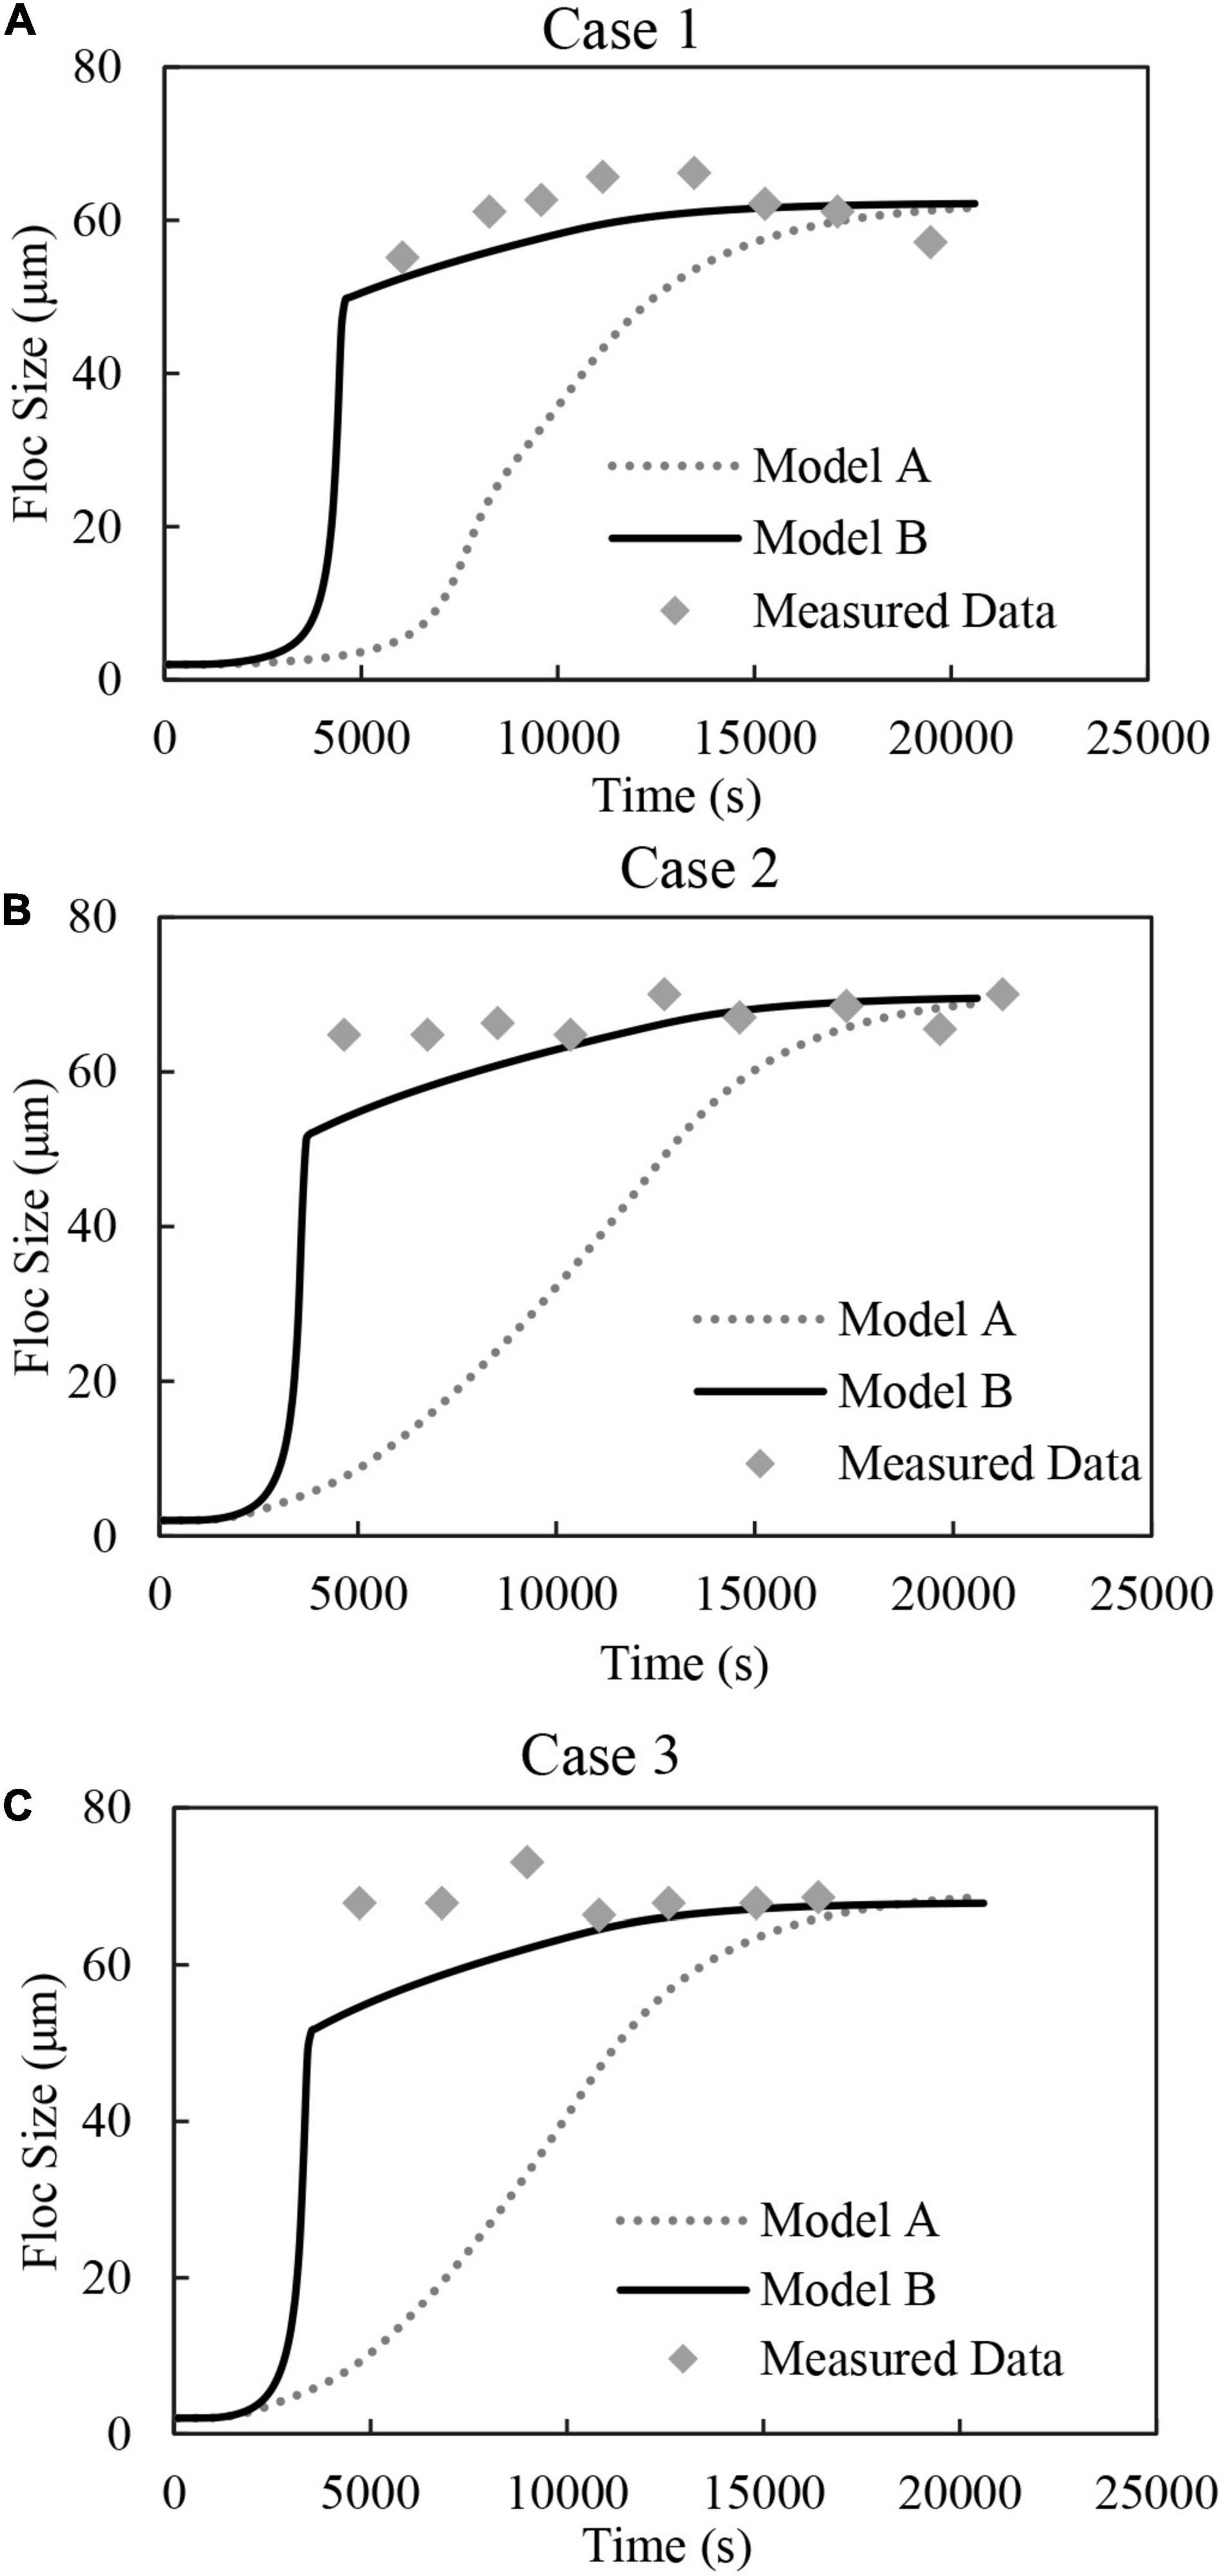
Figure 3. Modelled and measured time evolution of floc size at 0.4 m elevation in grid-stirred settling column for (A) Case 1, (B) Case 2, and (C) Case 3 (see Table 1 for details).
To further demonstrate the temporal evolution of clay flocs in the settling column simulations, vertical profiles of floc sizes calculated by Models A and B are compared in Figures 4A–C with the floc size measurements (at z = 0.4 m in the settling column) at three different elapsed times for Case 3 (Table 1). In addition, the corresponding calculated vertical distributions of SSC are compared with the measured OBS data obtained at the two elevations (z = 0.5 and 1.2 m) at the same elapsed times in Figures 4D–F (Note: as the vertical profiles of sediment concentration predicted by Models A and B are very similar, only Model B profiles are shown). In all cases, these reproduced concentration distributions show excellent agreement with the equivalent measured concentrations at the two elevations in the column.
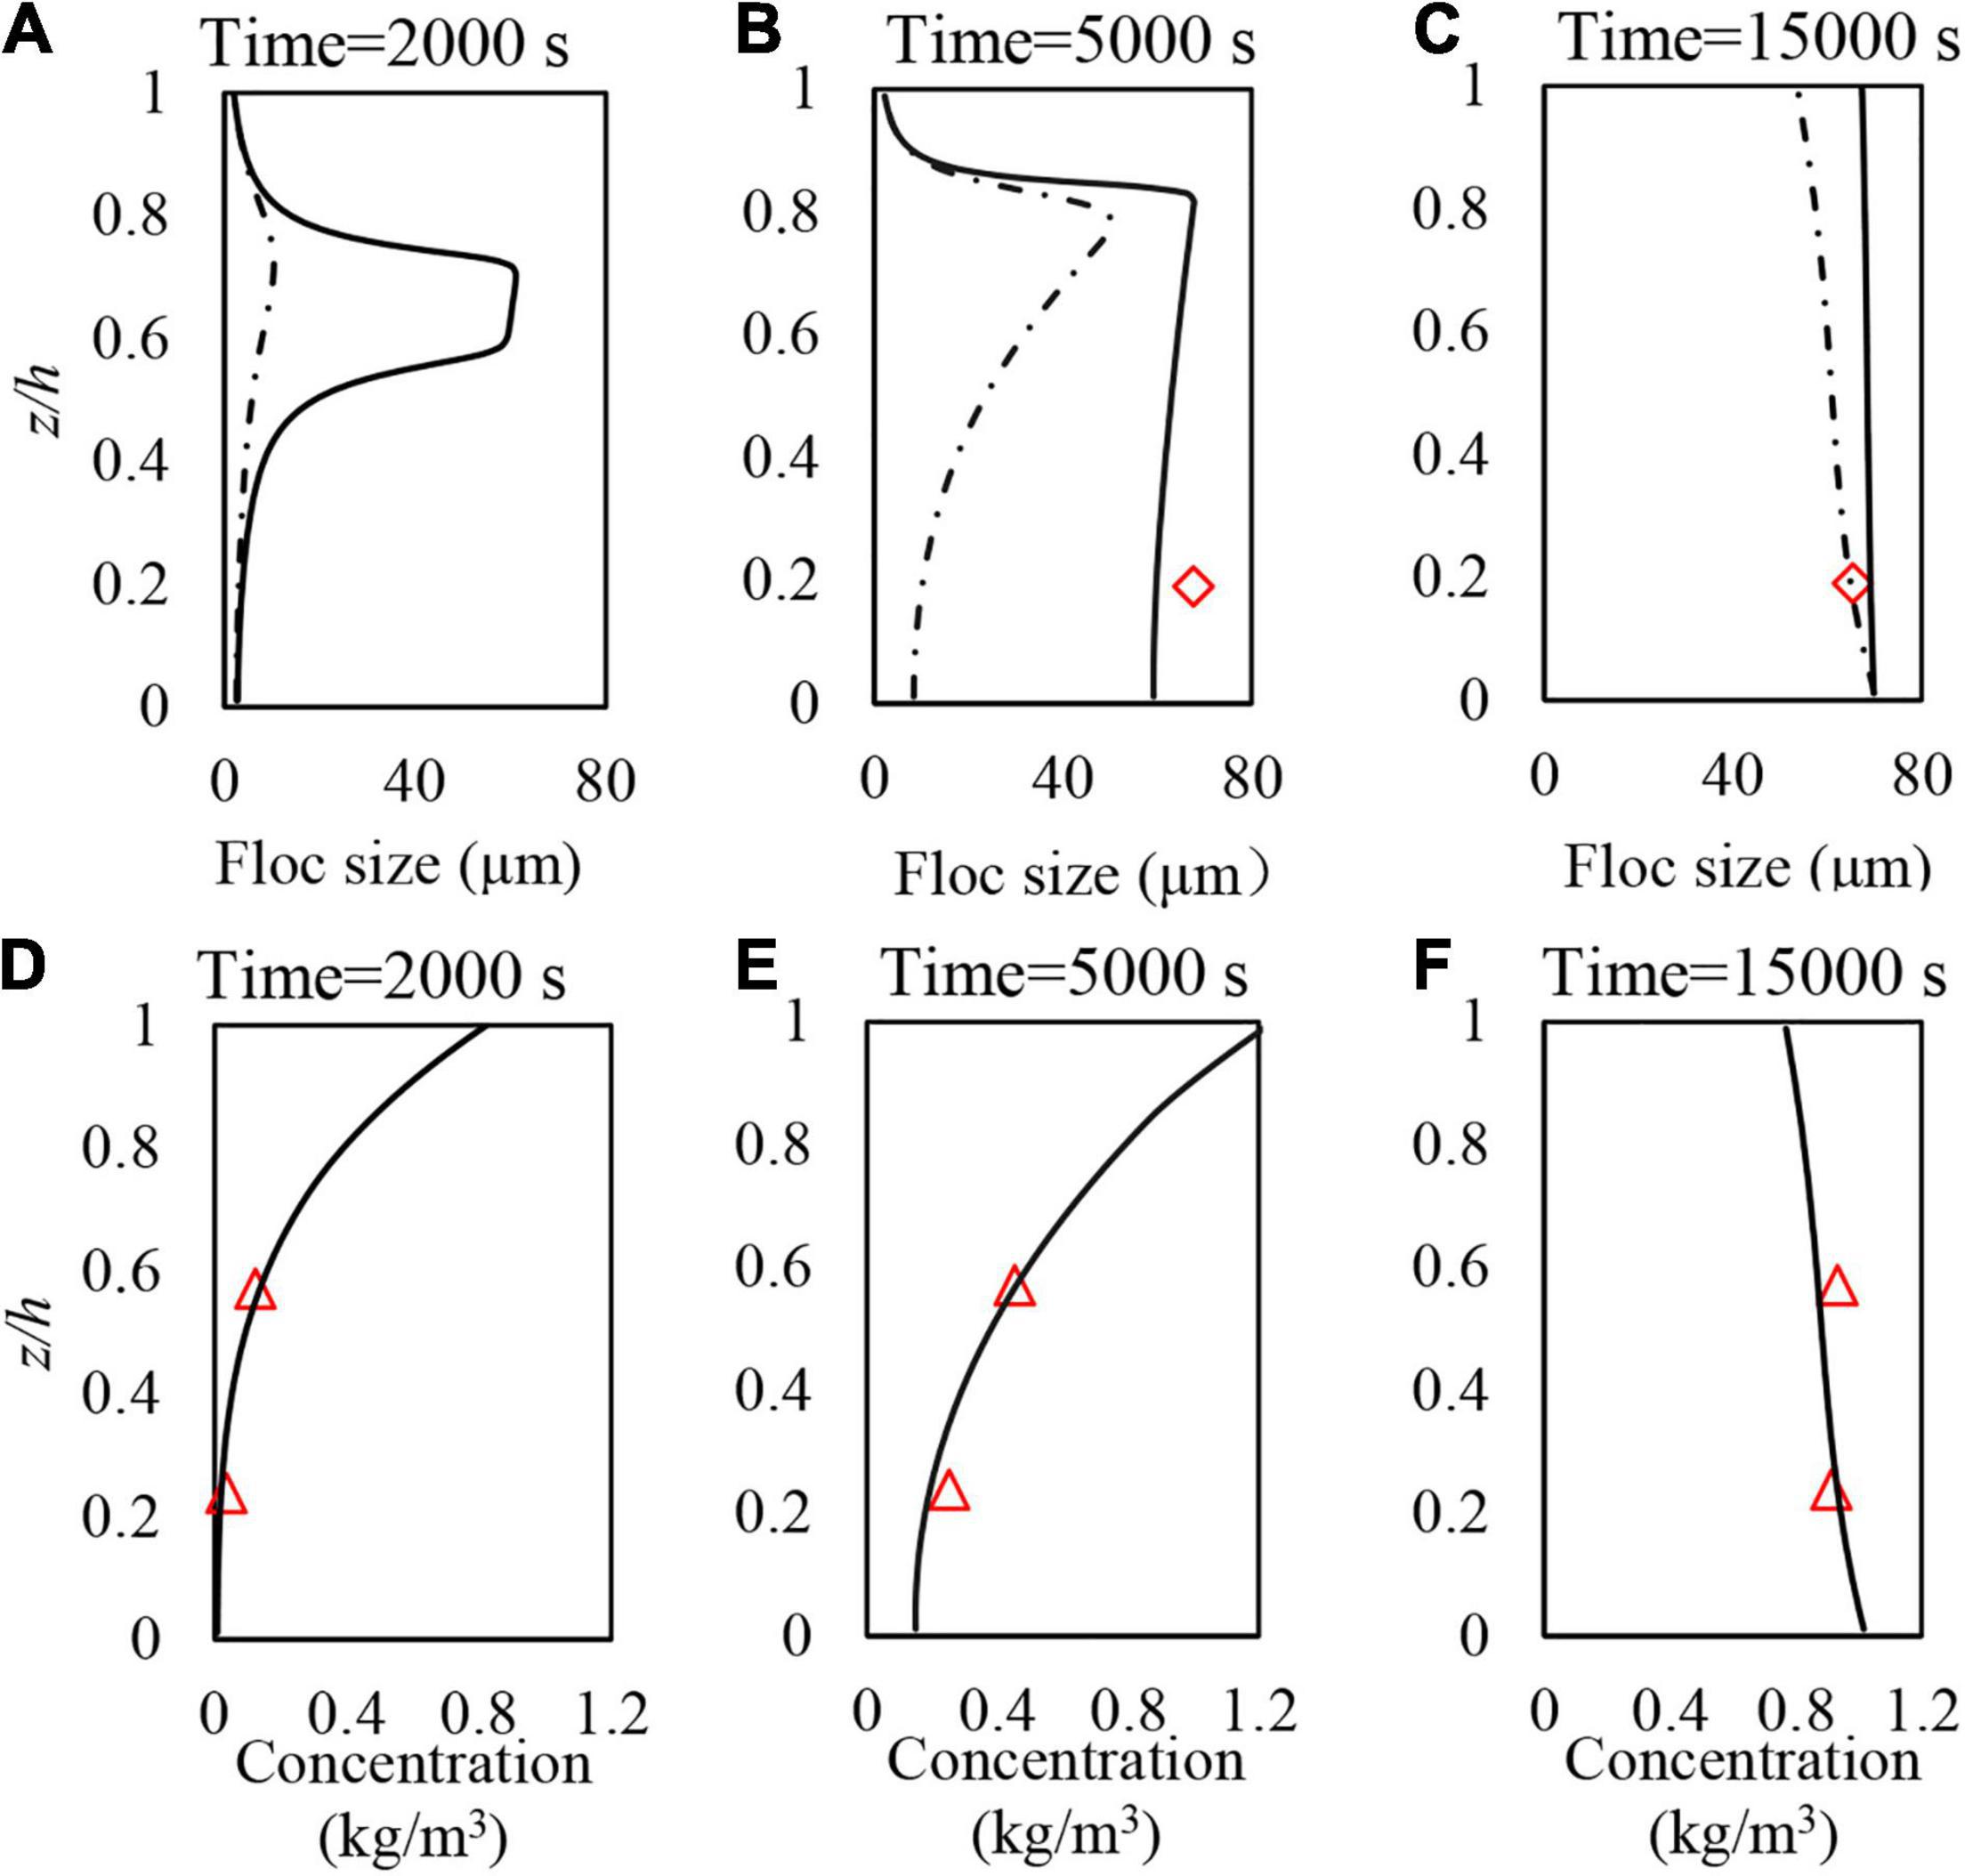
Figure 4. Vertical profiles of reproduced floc sizes (models A and B) and SSC (model B only) at elapsed times of (A,D) 2000 s, (B,E) 5000 s, and (C,F) 15000 s for Case 1 (see Table 1). Red diamonds and triangles denote measured floc sizes and SSC levels, respectively.
During the experiments, the sediment feed into, and mixing within, the buffer mixing tank was assumed to keep cohesive sediments in a largely unflocculated state (Cuthbertson et al., 2018), resulting in very small floc sizes at the very top of the column over the experimental run duration. In this modelling study of the settling column experiments, the effects of the volumetric floc flux on the evolution of local floc size are fully accounted for by solving sediment concentration and floc number concentration simultaneously. With this imposed upper boundary condition, the predicted maximum floc sizes are shown to occur in the upper-middle part of the settling column [i.e., z/h = ∼0.7 at T = 2000 s and z/h = ∼0.8 at T = 5000 s (for Models A and B), Figures 4A,B]. This floc size maximum is therefore shown to occur at a different elevation within the settling column compared to the elevation of the maximum SSC (i.e., z/h = 1.0) at these elapsed times.
At the later stages of the experimental run (i.e., T = 15000 s, Figure 4C), a quasi-equilibrium value of the floc size is reproduced by Models A and B in the vertical column profile, which becomes consistent with the overall shape of the sediment concentration distribution in the column (Figure 4F). However, as indicated previously, during earlier stages of the experimental run (i.e., T = 5000 s, Figure 4B), only the floc size results from Model B agree well with the measured floc size data and is, thus, to only model capable of reproducing the rapid initial floc size adjustment within the settling column.
Model Application to Field Measurements
In terms of the validation of flocculation models against field data from estuarine sites, it is difficult to find complete and synchronous datasets that include all hydrodynamic conditions (i.e., flow velocities, bed shear stresses), suspended sediment concentrations (SSC), and the physical characteristics of flocs (i.e., floc sizes, settling velocities) generated throughout the tidal cycle. Van Der Ham et al. (2001) reported high frequency SSC measurements and flow velocities in the tidal channel of the Ems/Dollard estuary over a 24 h period. Within this measurement area, the horizontal gradients of SSC are known to be negligible, with horizontal and vertical salinity gradients also small when the river discharge is low (Van Der Ham et al., 2001), making this an appropriate field site for the application of the 1DV two-phase model developed in the current study. This data set alone, however, cannot provide full validation of the flocculation model as no corresponding floc information was available over the same time period covered by Van Der Ham et al. (2001).
Most recent field studies on floc characterization in estuaries have tended to focus on relating measured floc sizes directly to their corresponding settling velocities. Within this context, our multiple fractal dimension model (Model B) has been validated against such field-based floc measurements (i.e., Khelifa and Hill, 2006 data) within Xu and Dong (2017a). Furthermore, previous field studies conducted by Dyer et al. (2000) in the Ems/Dollard estuary also provide measured floc sizes and settling velocities during the flood phase of the tidal cycle, that can be compared qualitatively with the current model predictions, albeit under different tidal conditions. These findings and comparisons are discussed in detail within section “Model Application to Field Measurements” of the paper.
For the current field application, the empirical coefficients for both flocculation models need to be calibrated again. Based on previous studies, we assume that the sediment density ρs = 2650 kg/m3 and the size of primary particles is set as d = 4 μm (Winterwerp, 1998). For direct comparison between the predictive capabilities of models A and B, the same baseline conditions need to be set. Thus, the two flocculation models are calibrated to achieve the same equilibrium floc size of 300 μm (Figure 5A), under the shear rate condition of G = 2 s–1 and for a sediment concentration c = 0.3 kg/m3. These represent appropriate values for the typical field measurement conditions found in the tidal channel of Ems/Dollard estuary (Van Der Ham et al., 2001). It is noted that, in the modelling of the settling column experiments conducted with pure kaolin clay suspensions, the constant fractal dimension (in Model A) and mean fractal dimension (in Model B) remained unchanged with an increase in the floc size. By contrast, Khelifa and Hill (2006) collected more than 26 laboratory and field site measurements of flocs to assess the size-dependency of fractal dimensions; their results suggesting that the fractal dimension decreases with increasing floc size. Thus, Eq. 29 is adopted for the calculation of both the constant fractal dimension (in Model A) and the mean fractal dimension (in Model B) for their application to field measurements (see Figure 5B). It should be noted that for a given floc size D, the fractal dimension is unique in Model A, while, in Model B multiple fractal dimensions are adopted.
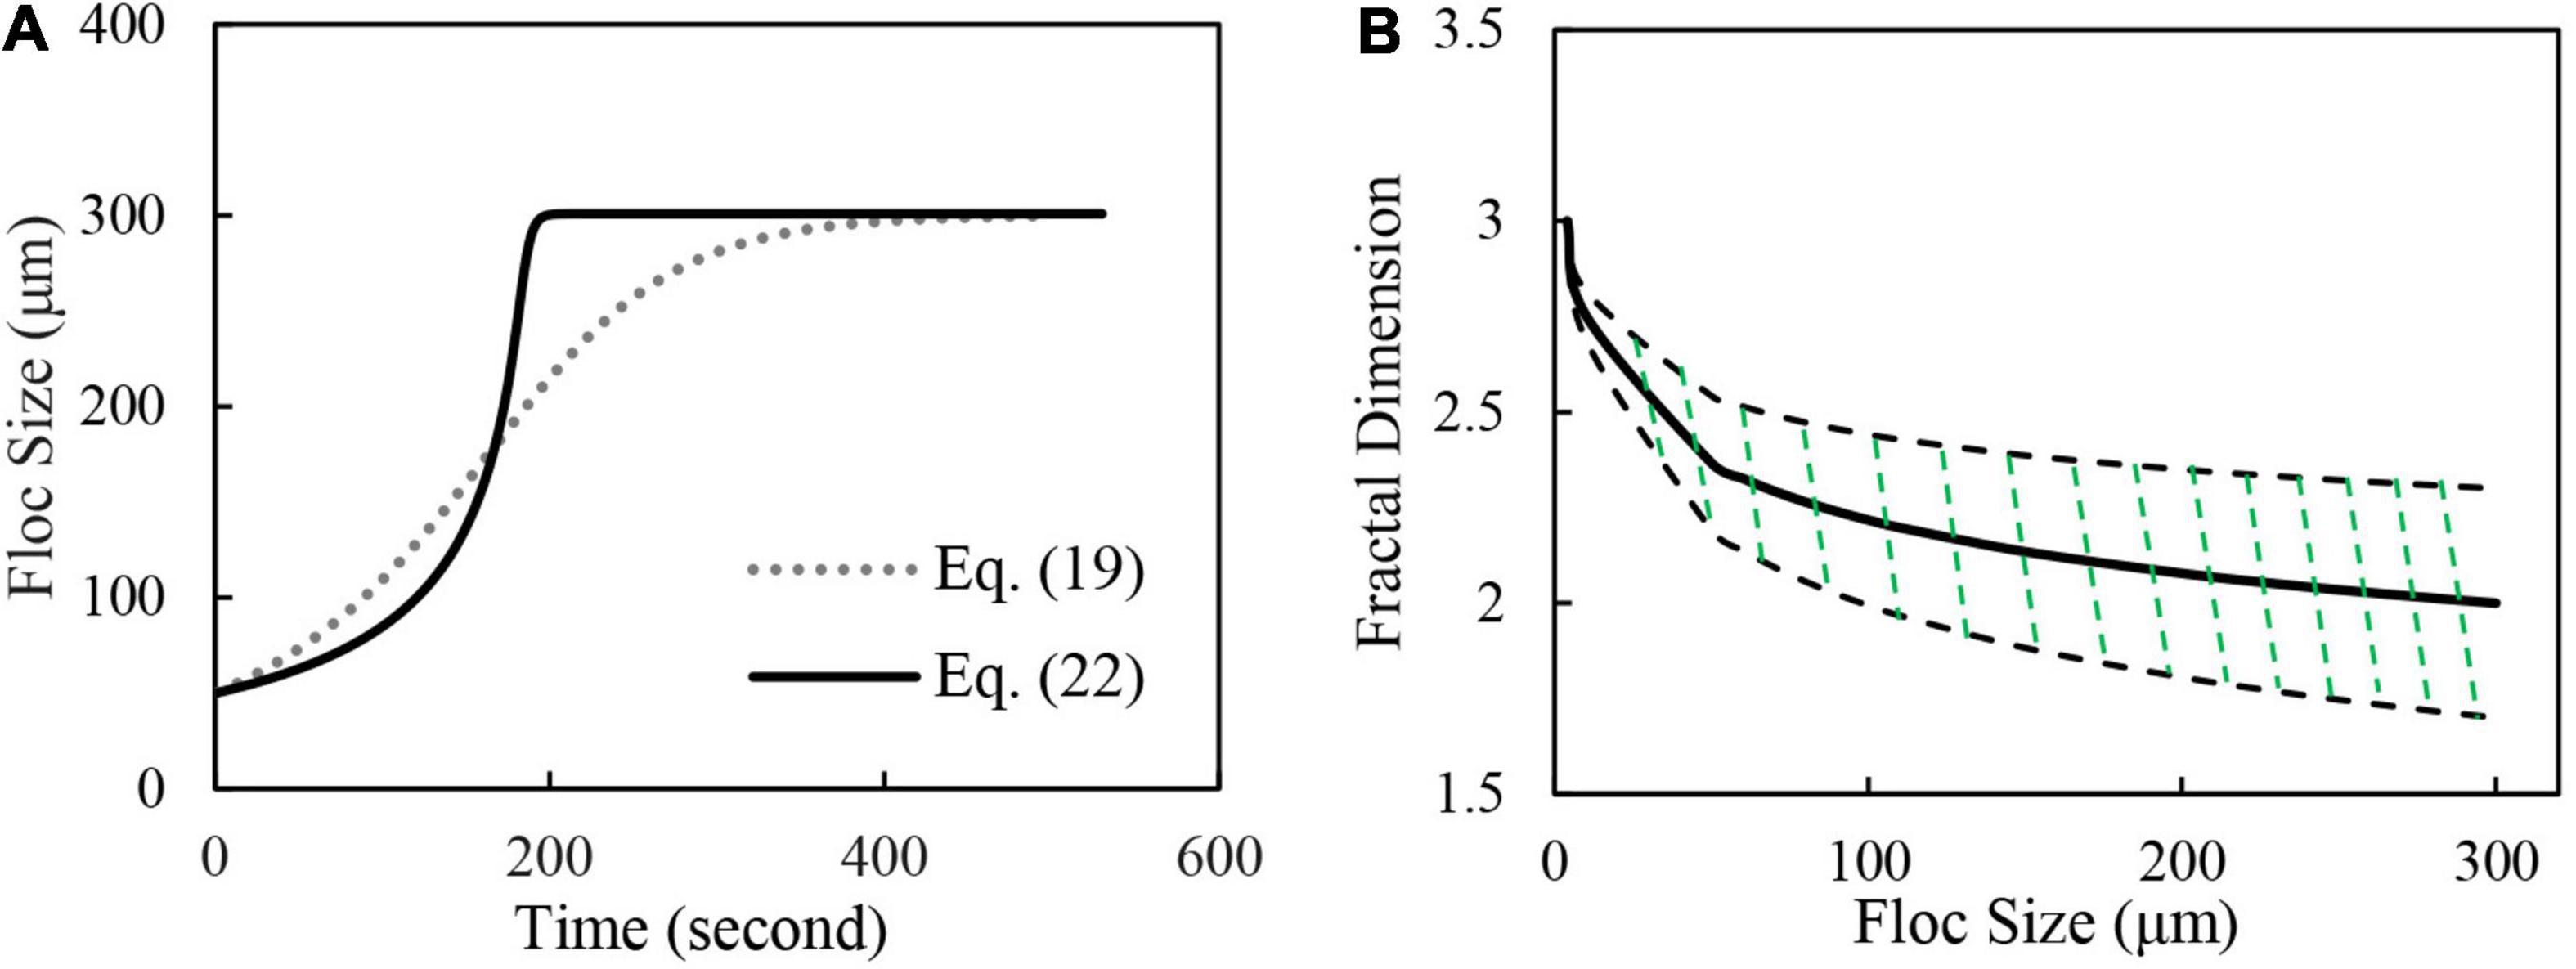
Figure 5. (A) Temporal evolution of floc sizes calculated by model Eqs 19, 22 for Elms/Dollard estuary calibration run with fixed shear rate condition of G = 2 s–1 and constant SSC of c = 0.3 kg/m3, and (B) Variability in fractal dimensions adopted by Eqs 19, 22. In panel (B), solid line shows mean fractal dimension, while green shaded area shows the wide distribution of fractal dimensions adopted in Eq. 22.
where, α and β are coefficients and specified using following boundary conditions:
where, nfc is a characteristic fractal dimension when floc size D equals a characteristic floc size Dc. In Eq. 29, the fractal dimension takes the maximum value of 3 when floc size approaches the primary particle size d and takes a lower value nfc when floc size approaches the characteristic floc size Dc. The value of nfc = 2.0 is adopted when the characteristic floc size Dc → 300 μm, which is the typical value selected to calibrate the flocculation models (e.g., Winterwerp, 1998). As to the variance of the fractal dimension, a logarithmic function is found to be physically more realistic (Vahedi and Gorczyca, 2012):
where, α2 is an empirical coefficient. When the floc size approaches primary particle size, the variance in fractal dimension is assumed to be zero (i.e., nf = 3.0), while for floc sizes approaching the characteristic size Dc, it is set at 0.6 (Winterwerp, 1998) (i.e., 1.7 ≤ nf ≤ 2.3). Therefore, according to Eq. 31, α2 can be determined as 0.0174. In contrast to the settling column experiments, the shear rate G = within the tidal channel is no longer constant, instead varying with the tidal cycles. As such, Eqs 32, 33 are adopted to describe the turbulent kinetic energy k and dissipation ε, as follows:
where L is the Prandtl’s mixing length, CD and Cu are set at 0.1925 and 0.09 (Rodi, 1980), respectively. The coefficients adopted in the two flocculation models are summarized in Table 3. In terms of the two-phase model, following van der Ham and Winterwerp (2001), the erosion rate for the cohesive sediment bed M = 1.5×10⁻⁸ m/s is selected. The critical shear stress for the cohesive sediment erosion τcr = 0.1 Pa, which is the averaged critical shear stress suggested by Kornman and De Deckere (1998), based on erosion studies conducted at an adjacent tidal flat in the Ems/Dollard estuary. The critical shear stress for the deposition is also specified as τb = 0.1 Pa, while a maximum depth-averaged sediment concentration Cmax = 0.5 kg.m–3 is applied in both models to account for the limited sediment availability from the bed (van der Ham and Winterwerp, 2001).

Table 3. Calibrated flocculation model coefficients and prescribed parameters for the simulations of the Elms/Dollard estuary tidal channel.
Model Results for Field Measurements
Figure 6A presents the time series measurements of depth-averaged velocities and elevations over a 24 h period, while Figures 6B–D present corresponding measured velocities (red circles) and modelled velocity profiles (black lines, calculated by Model B) at three different elapsed times. These represent hydrodynamic conditions at (high) slack water (08:00, Figure 6B), 1 h after peak ebb flow (12:00, Figure 6C), and 1 h before peak flood flow (16:00, Figure 6D), respectively. The measured velocities (red circles) are obtained at elevations of 0.1, 0.4, and 1.0 m above the bed surface. As the relative height z/h is adopted for the vertical axis, and the overall water depth h varies over the measurement duration (i.e., see elevations in Figure 6A), the velocity measurements are located at different relative heights in the individual figures. The RMSEs of the calculated time series of velocities and shear stresses are 0.163 and 0.115, respectively, for the results of Model B. For Model A, RMSEs are 0.165 (velocities) and 0.114 (shear stresses). The predicted results from Model B compare very well with the measured data (Note: equivalent results from Model A are found to be very similar and, as such, are not shown here). The measured and predicted shear stresses (calculated by Model B) at 0.4 m above the bed are shown in Figure 7. Again, the equivalent results predicted by Model A are very similar (not plotted) and thus both models are capable of reproducing the velocity profiles and shear stresses during the different tidal phases.
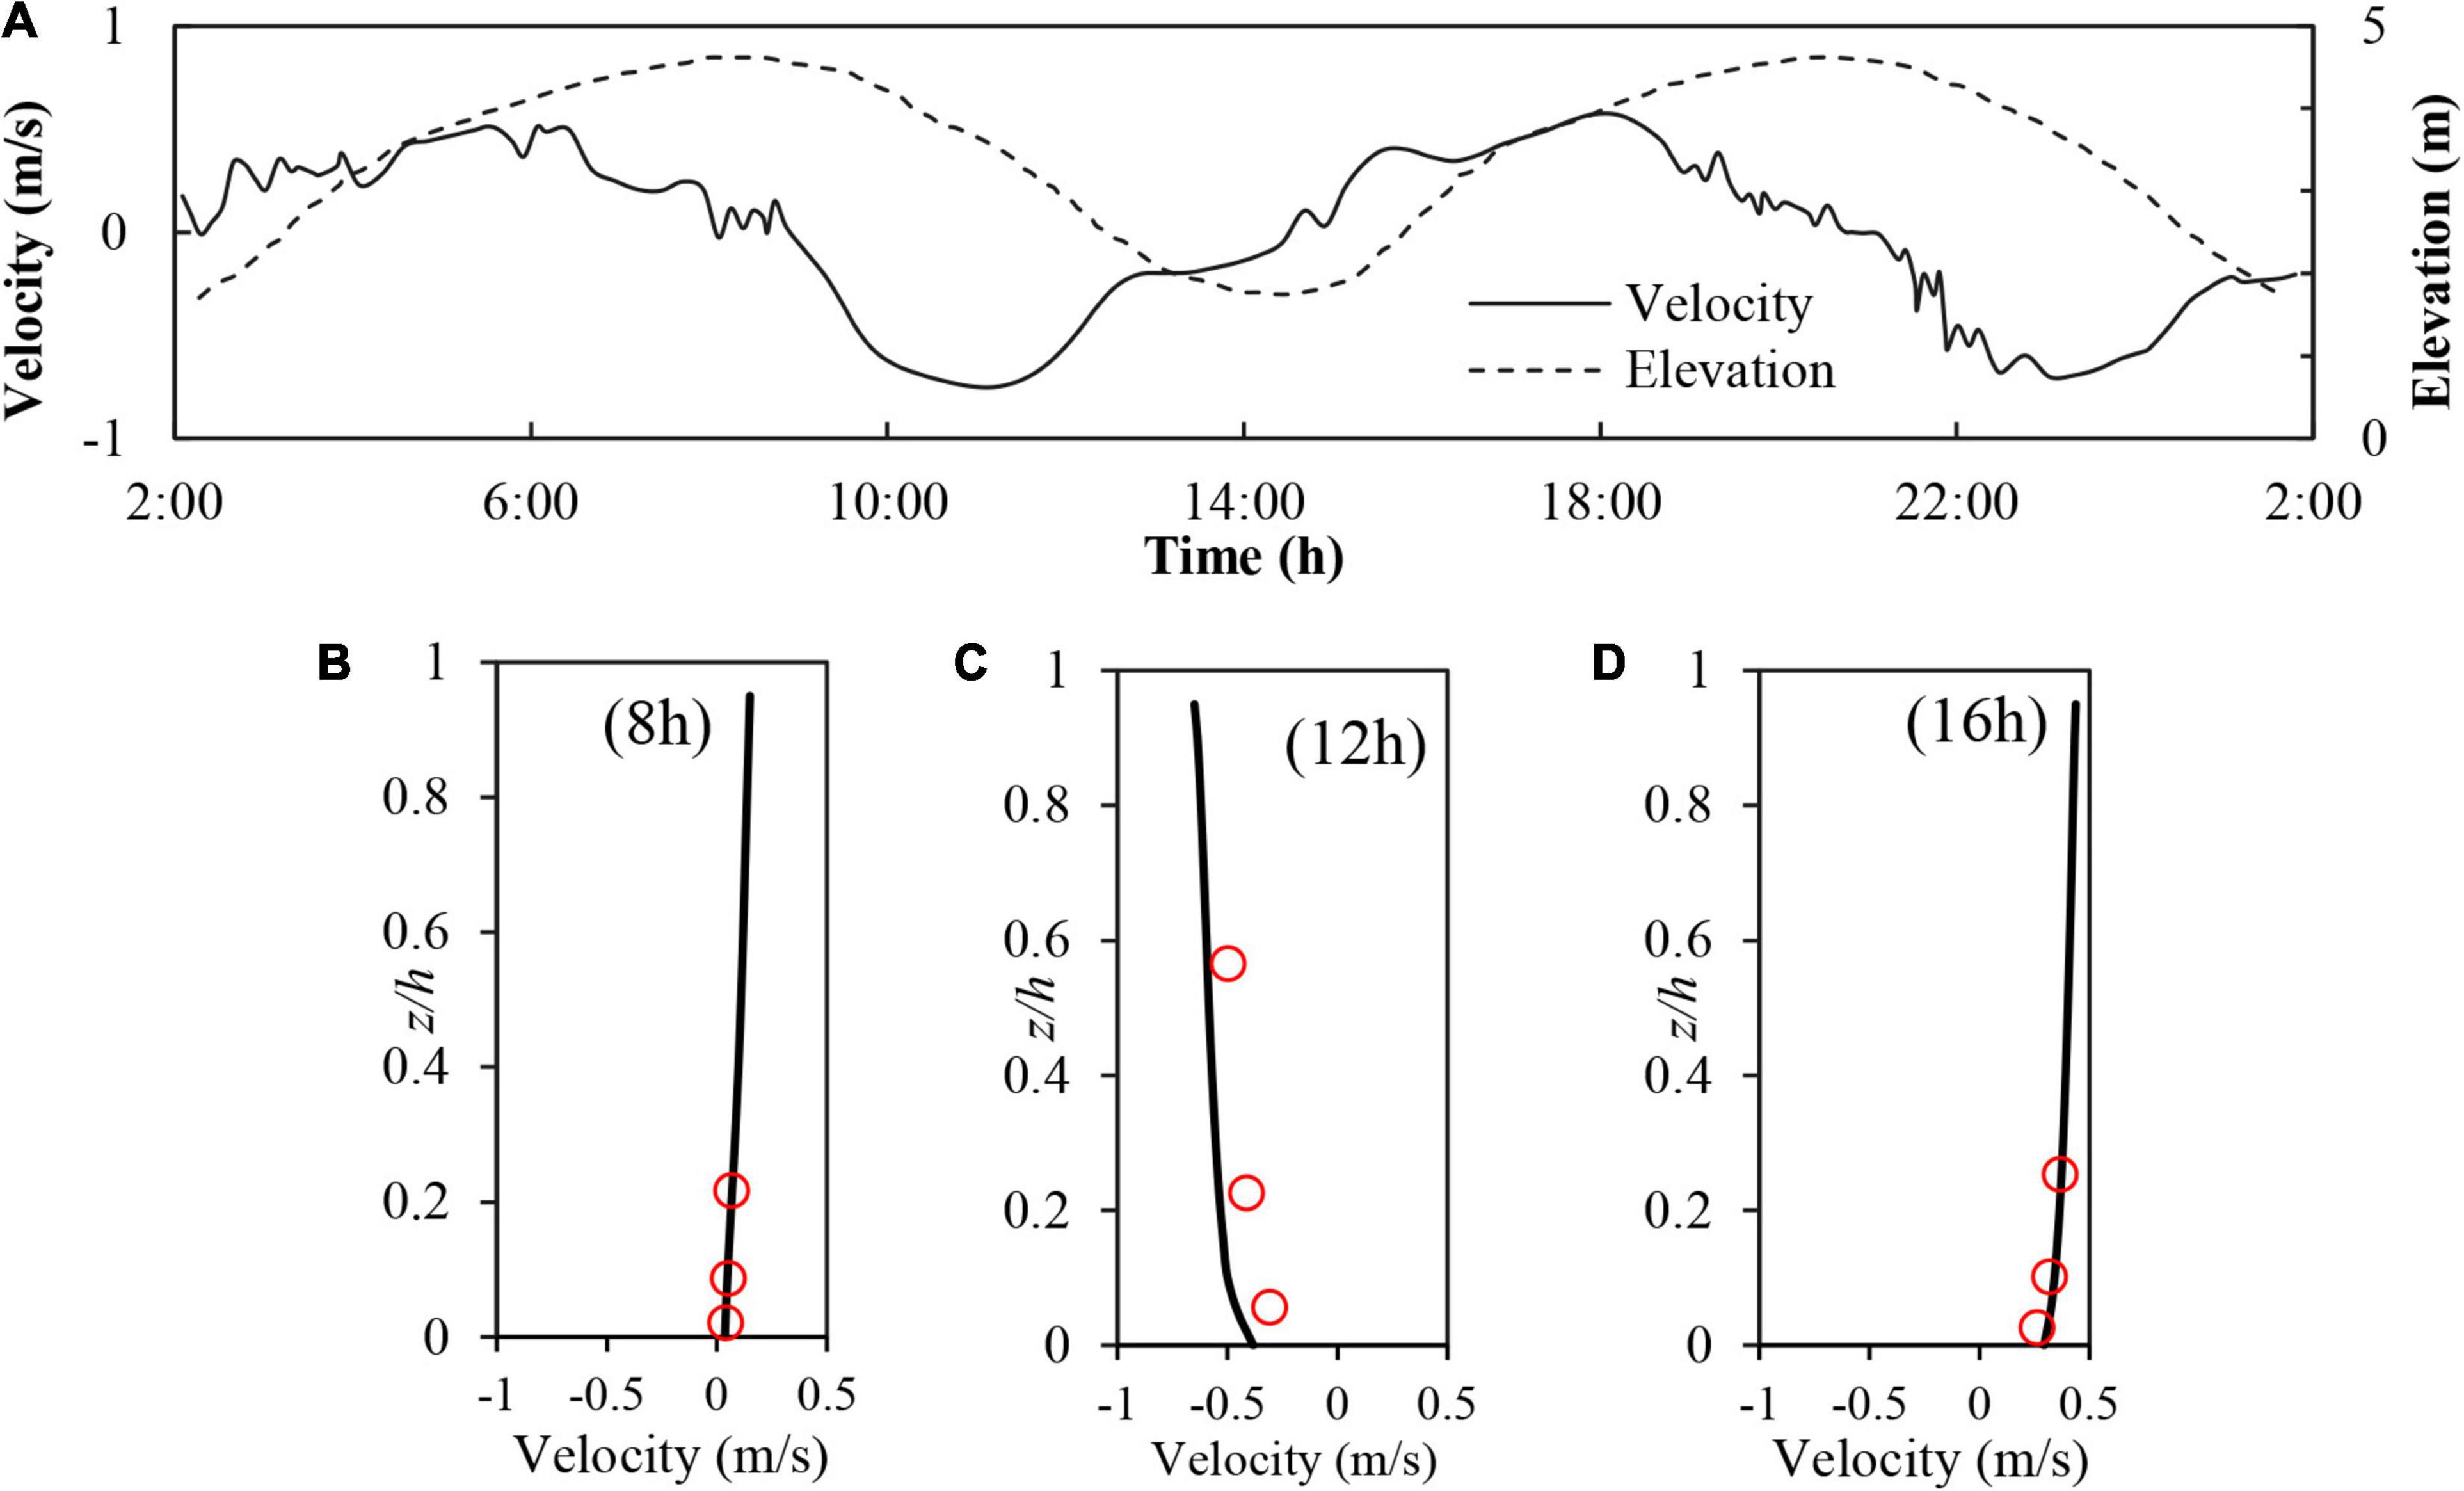
Figure 6. (A) Water surface elevations and depth-averaged flow velocities in Elms/Dollard estuary tidal channel over approximately two tidal cycles, (B–D) Measurements (red circles) and predicted vertical profiles (solid black lines) of flow velocity at 08:00, 12:00, and 16:00 h.
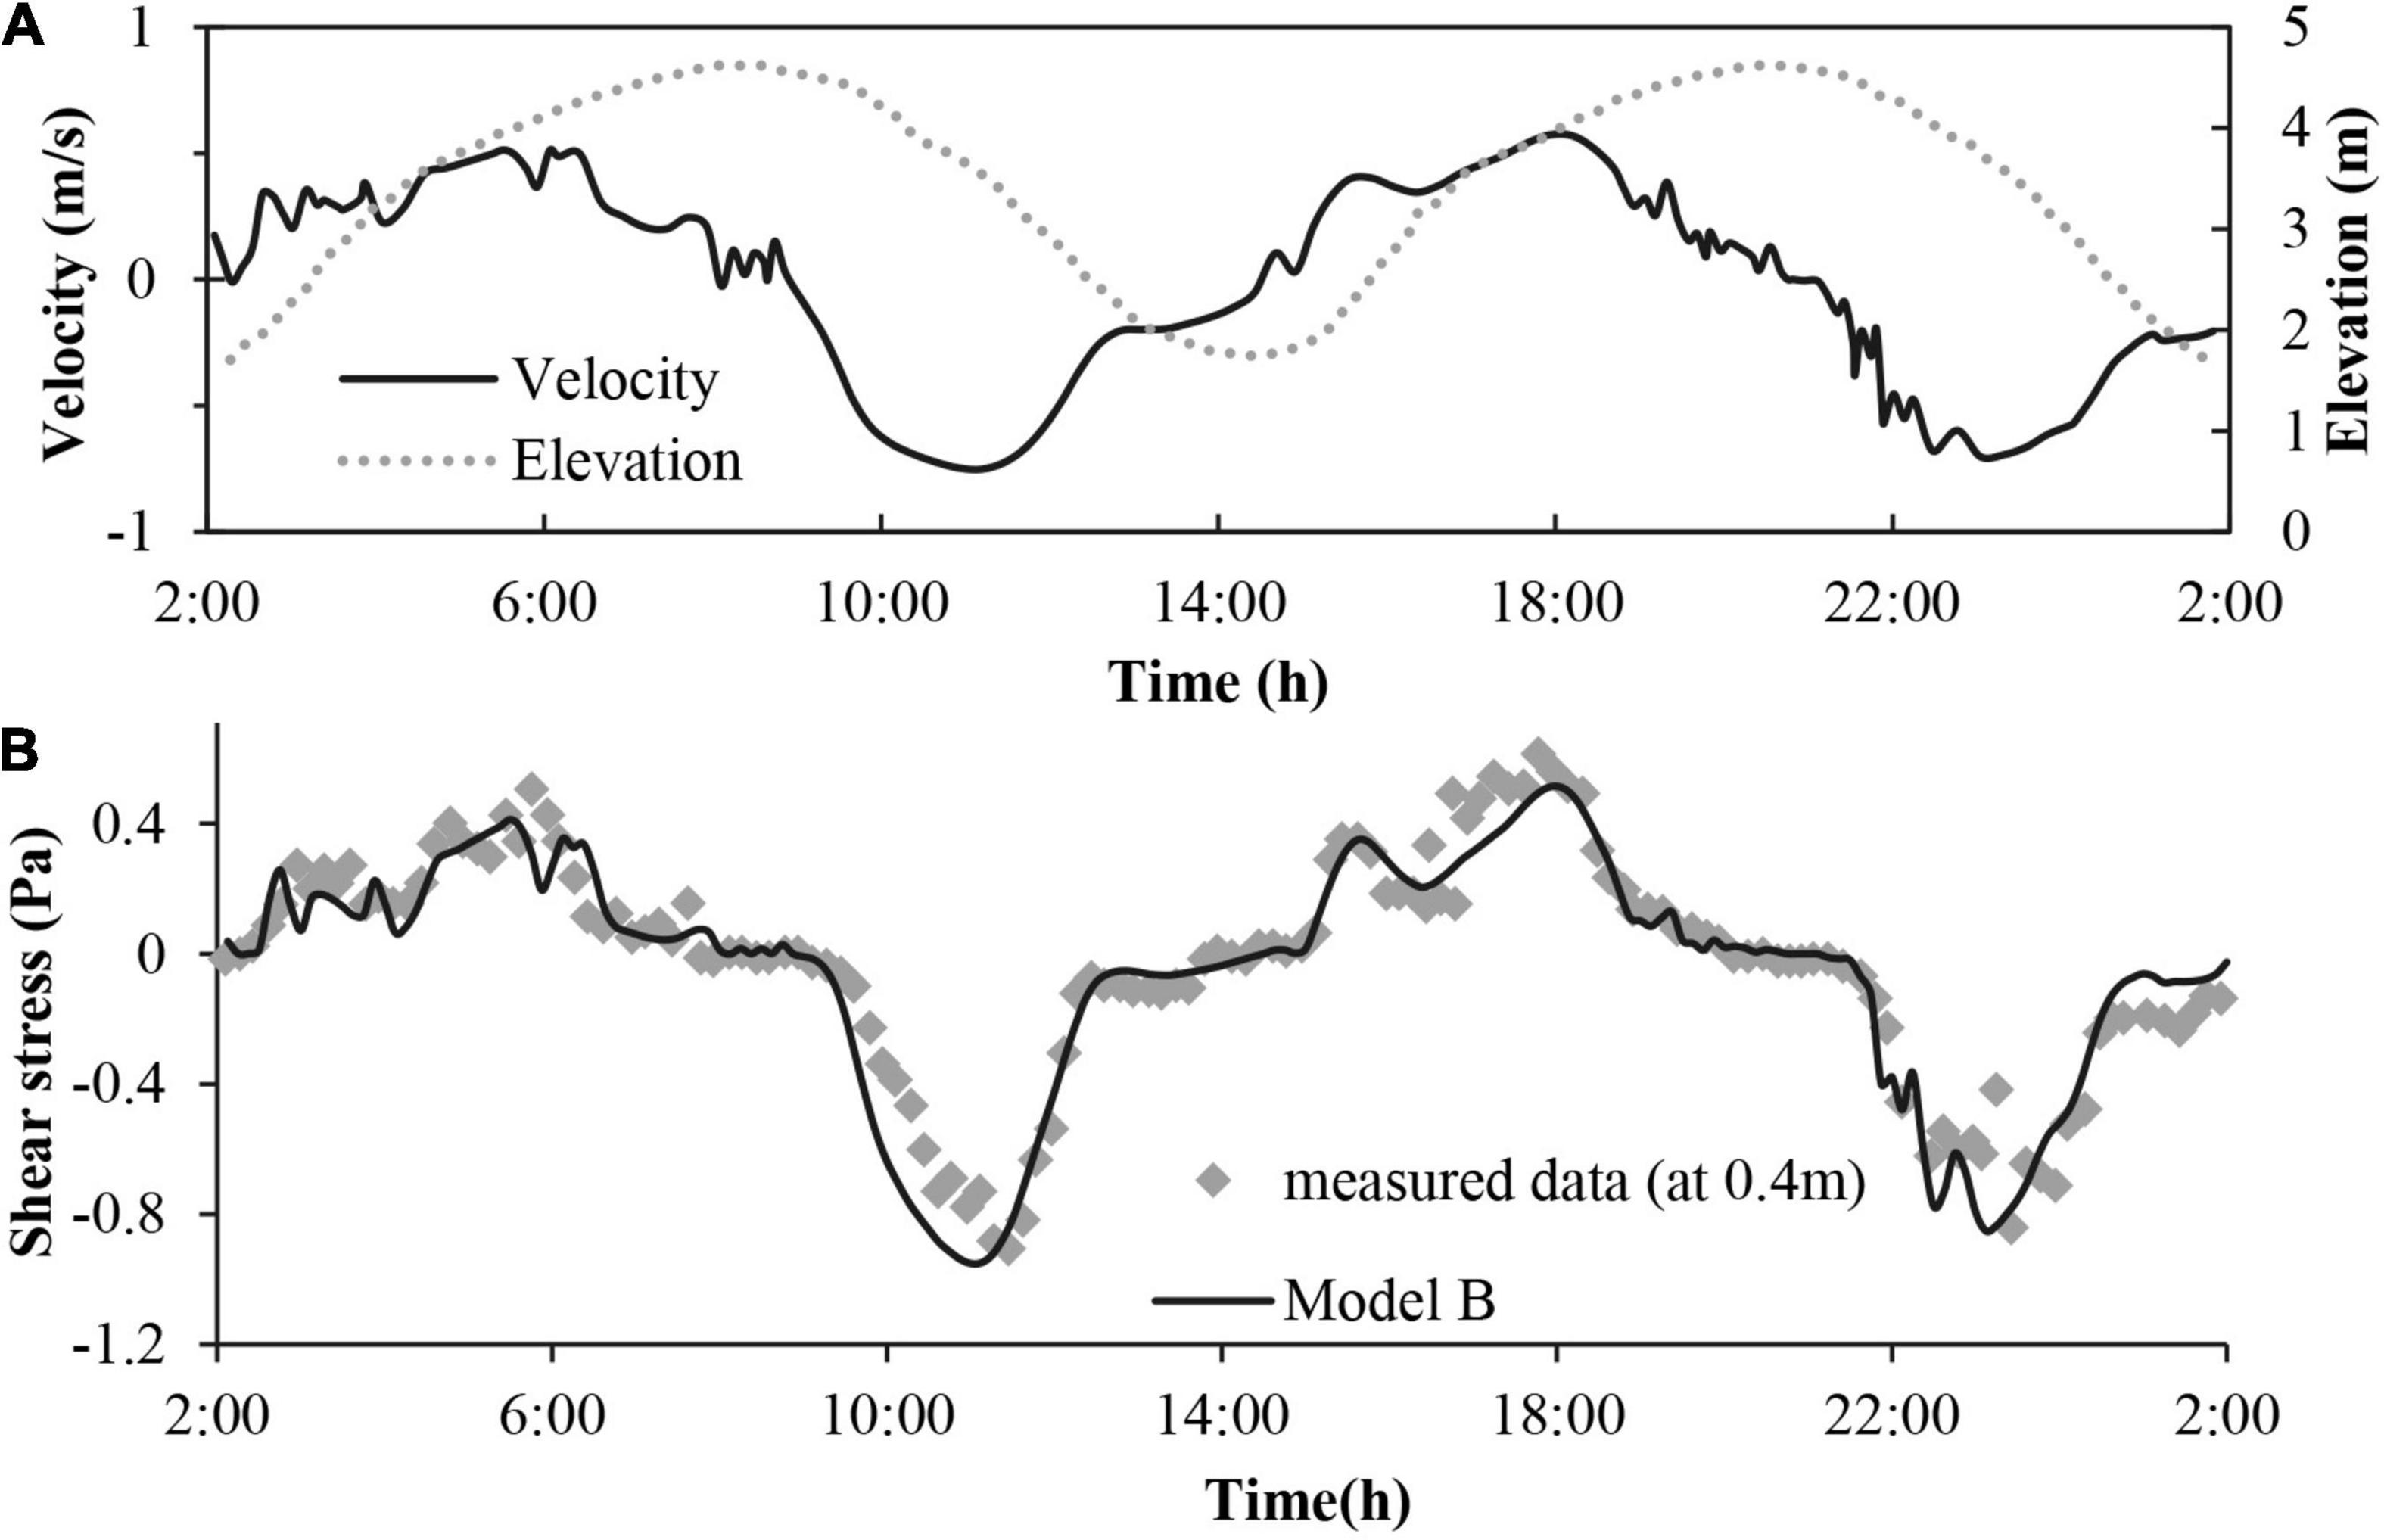
Figure 7. (A) As above in caption for Figure 6A, (B) Time series of measured and calculated shear stresses at elevation 0.4 m above the bed. Equivalent shear stress predictions by Model A are very similar to Model B and are thus not plotted.
The measured and modelled SSC timeseries at elevations of 0.3 and 1.4 m above the bed level, corresponding to the same period of measured depth-averaged velocities and elevations (Figure 8A), are shown in Figures 8B,C, respectively. The coefficients in both flocculation models are calibrated here to enable the model results to capture the peak SSC values at the 0.3 m elevation above the bed. As such, the SSC time series produced by both models (i.e., Models A and B) at 0.3 and 1.4 m above the bed are shown to broadly follow the temporal trend of the measured SSC data. The exception to this is around 04:00 and just after 16:00 in the SSC measurements at 0.3 m (Figure 8B), where there are abrupt increases in SSC values [note: similar, but less abrupt increases are also seen 03:00 and 16:00 in SSC measurements at 1.4 m (Figure 8C)]. These abrupt changes in SSC are explained as local increases in sediment availability (van der Ham and Winterwerp, 2001), while similar maximum SSC values occur during the flood and ebb tides, despite larger shear stresses being generated during the ebb tide (Figure 7B). When compared with the results of Model A, Model B showed better overall prediction and fit to these field measurements. The RMSE values for the SSC timeseries results from both models, when compared directly with the field measurements are calculated at the 0.3 and 1.4 m elevation above the bed as 0.296 and 0.177 (for Model A) and 0.223 and 0.130 (for Model B).
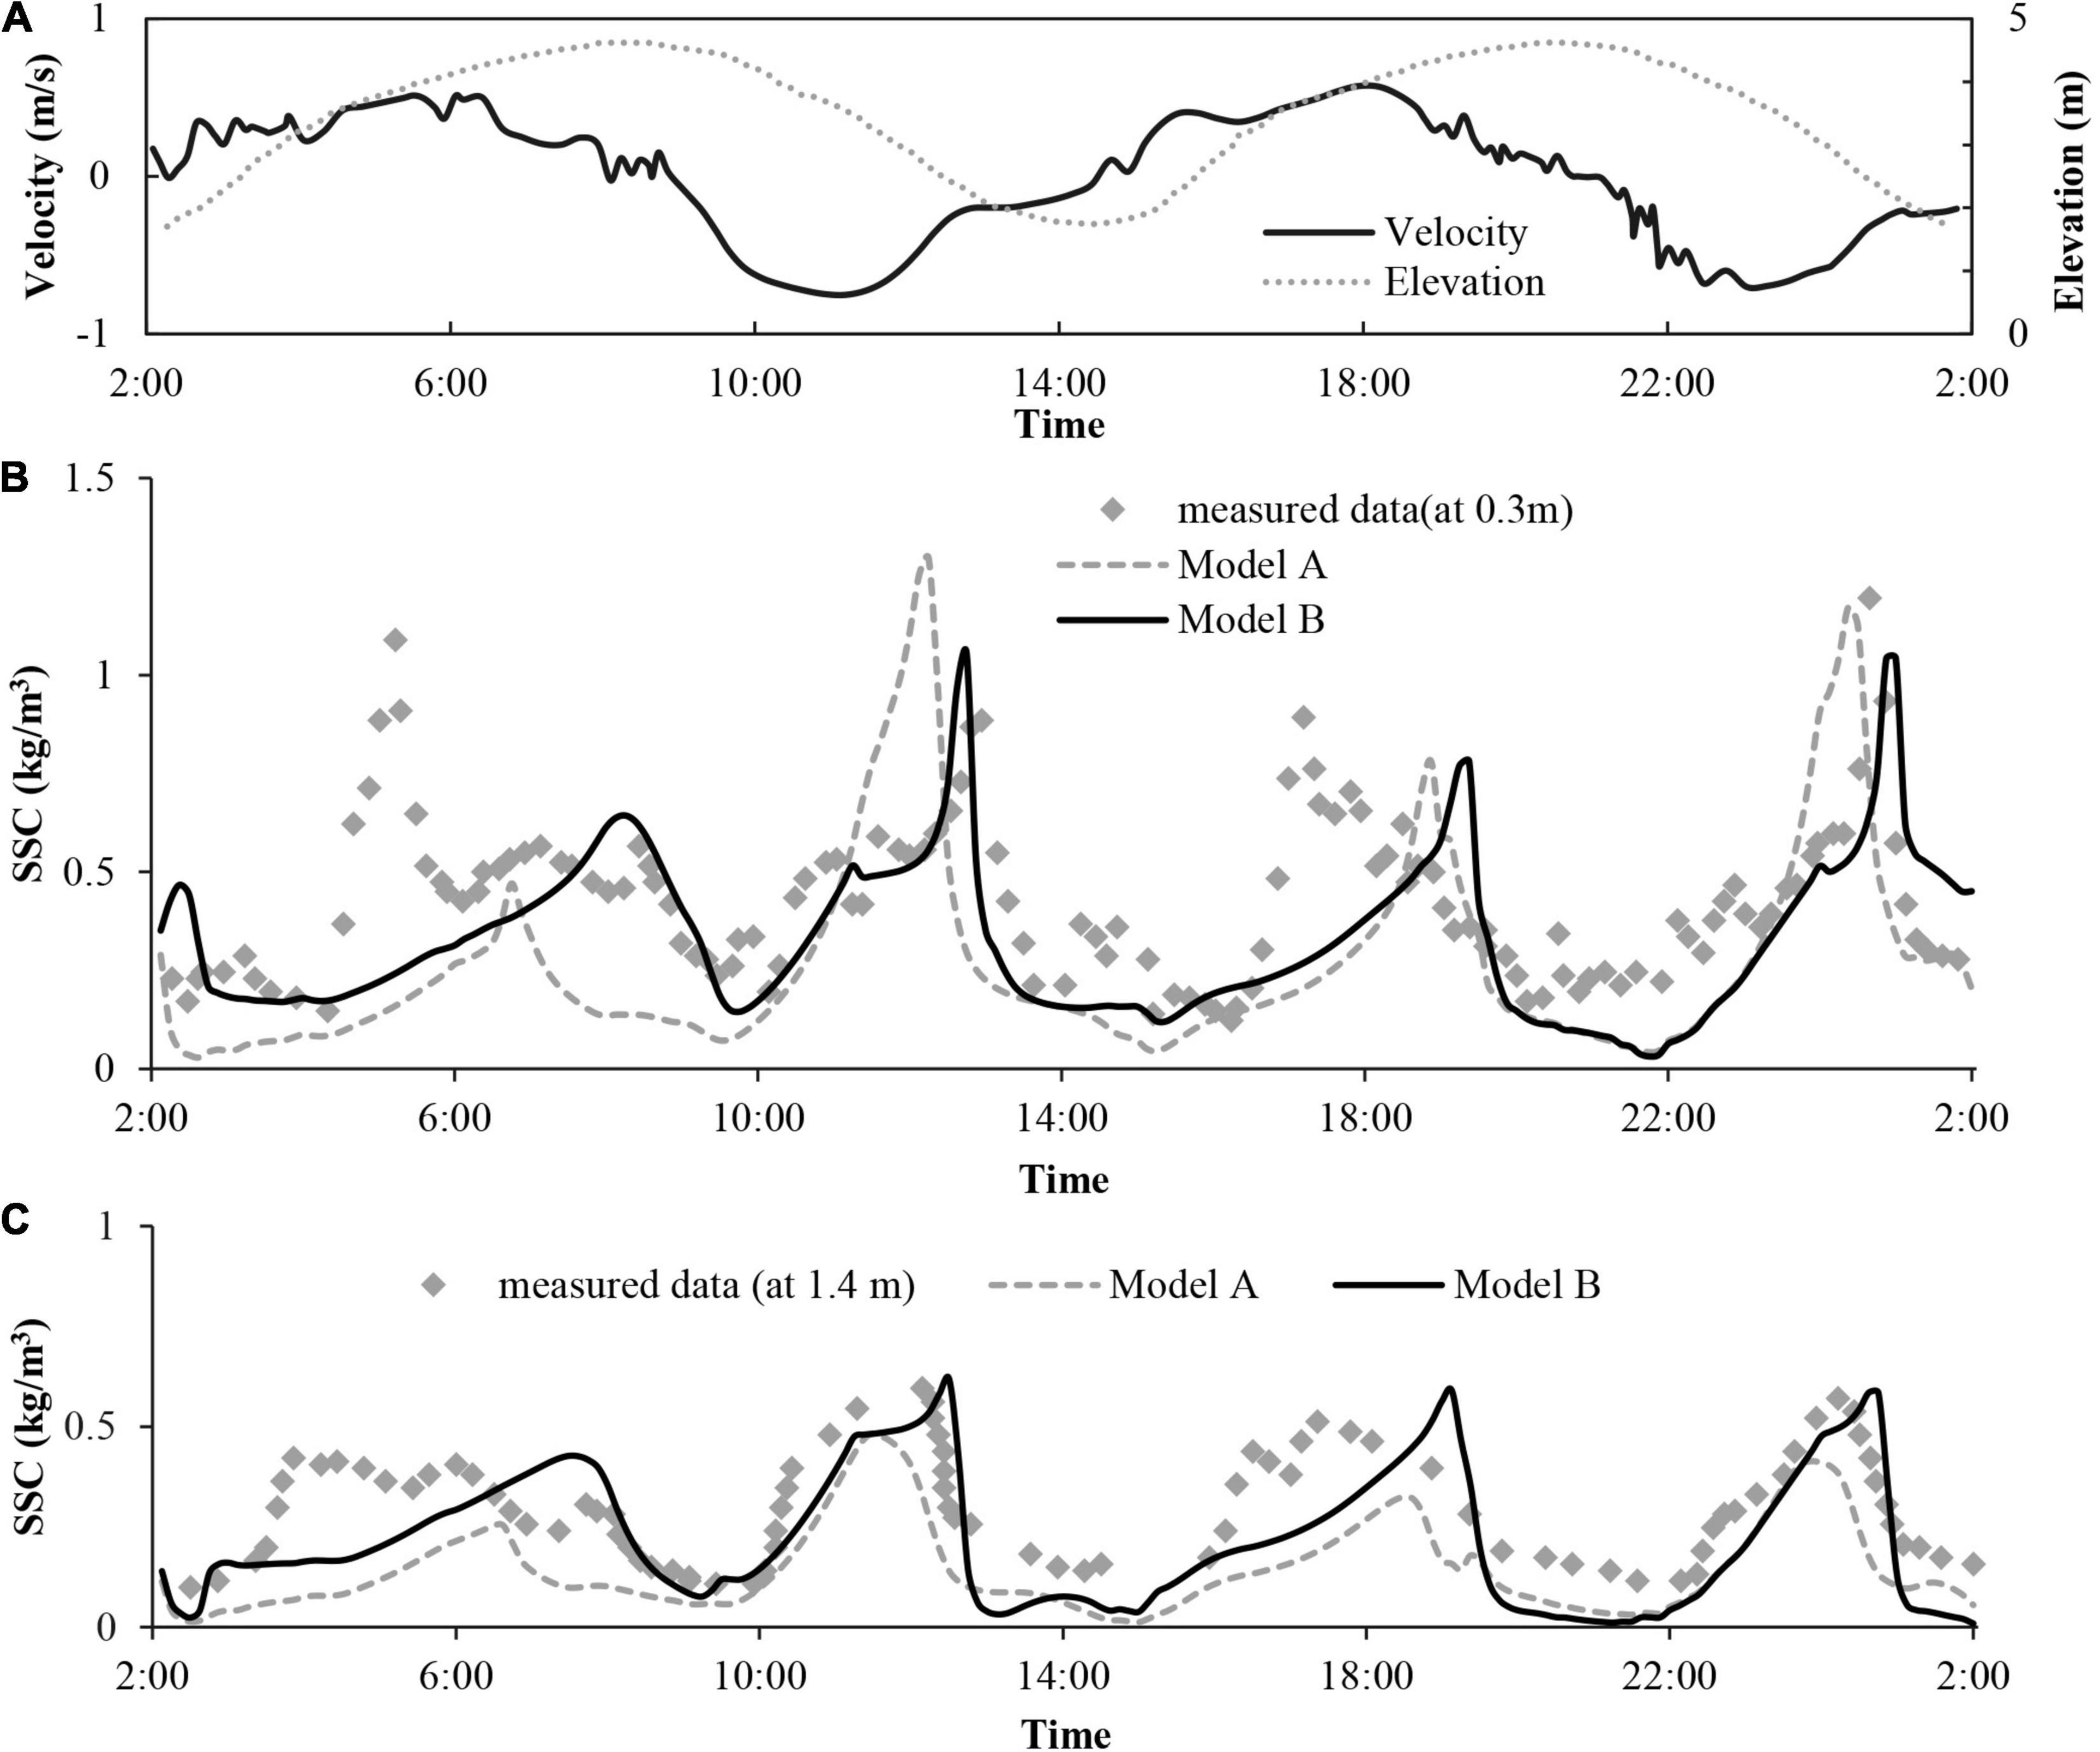
Figure 8. (A) As above in caption for Figure 6A, (B,C) Measurements (Van Der Ham et al., 2001) and predictions (Models A and B) of time series variations in SSC at elevations (B) 0.3 m and (C) 1.4 m above the bed in Elms/Dollard estuary tidal channel.
According to Van Der Ham et al. (2001), a main feature of the measured concentration data is a small vertical gradient in SSC values that suggests well-mixed conditions exist within the estuary (at least in terms of SSC). The results from Model B again appear to capture this feature best [e.g., at around 13:00 (i.e., ebb tidal phase), the difference in calculated SSC values at the 0.3 and 1.4 m elevations is 0.8 kg.m–3 for Model A and 0.5 kg.m–3 for Model B, see Figures 8B,C]. TheRMSEs for both models predictions of SSC are calculated when compared directly with the field measurements. At the 0.3 m elevation above the bed, the RMSE values for Model A and B predictions are 0.296 and 0.223, respectively, while at 1.4 m elevation, the corresponding RMSE values are 0.177 and 0.130, respectively. To further illustrate the vertical structure of physical properties predicted Model B, vertical profiles of SSC during both the slack (high) water period and subsequent peak (ebb) tidal velocity period are presented in Figures 9A,B. For slack water conditions, Model B results show lower SSC values remain in the upper part of the water column, with larger SSC gradients formed in the near-bed flow region (Figure 9A). By contrast, during the peak ebb tidal velocity period, the vertical distribution of SSC represents well mixed conditions (Figure 9B). Overall, the suspended sediment concentration profiles predicted by Model B match well the measured SSC data at 0.3 and 1.4 m elevations above the bed (i.e., black triangles, Figures 9A,B).
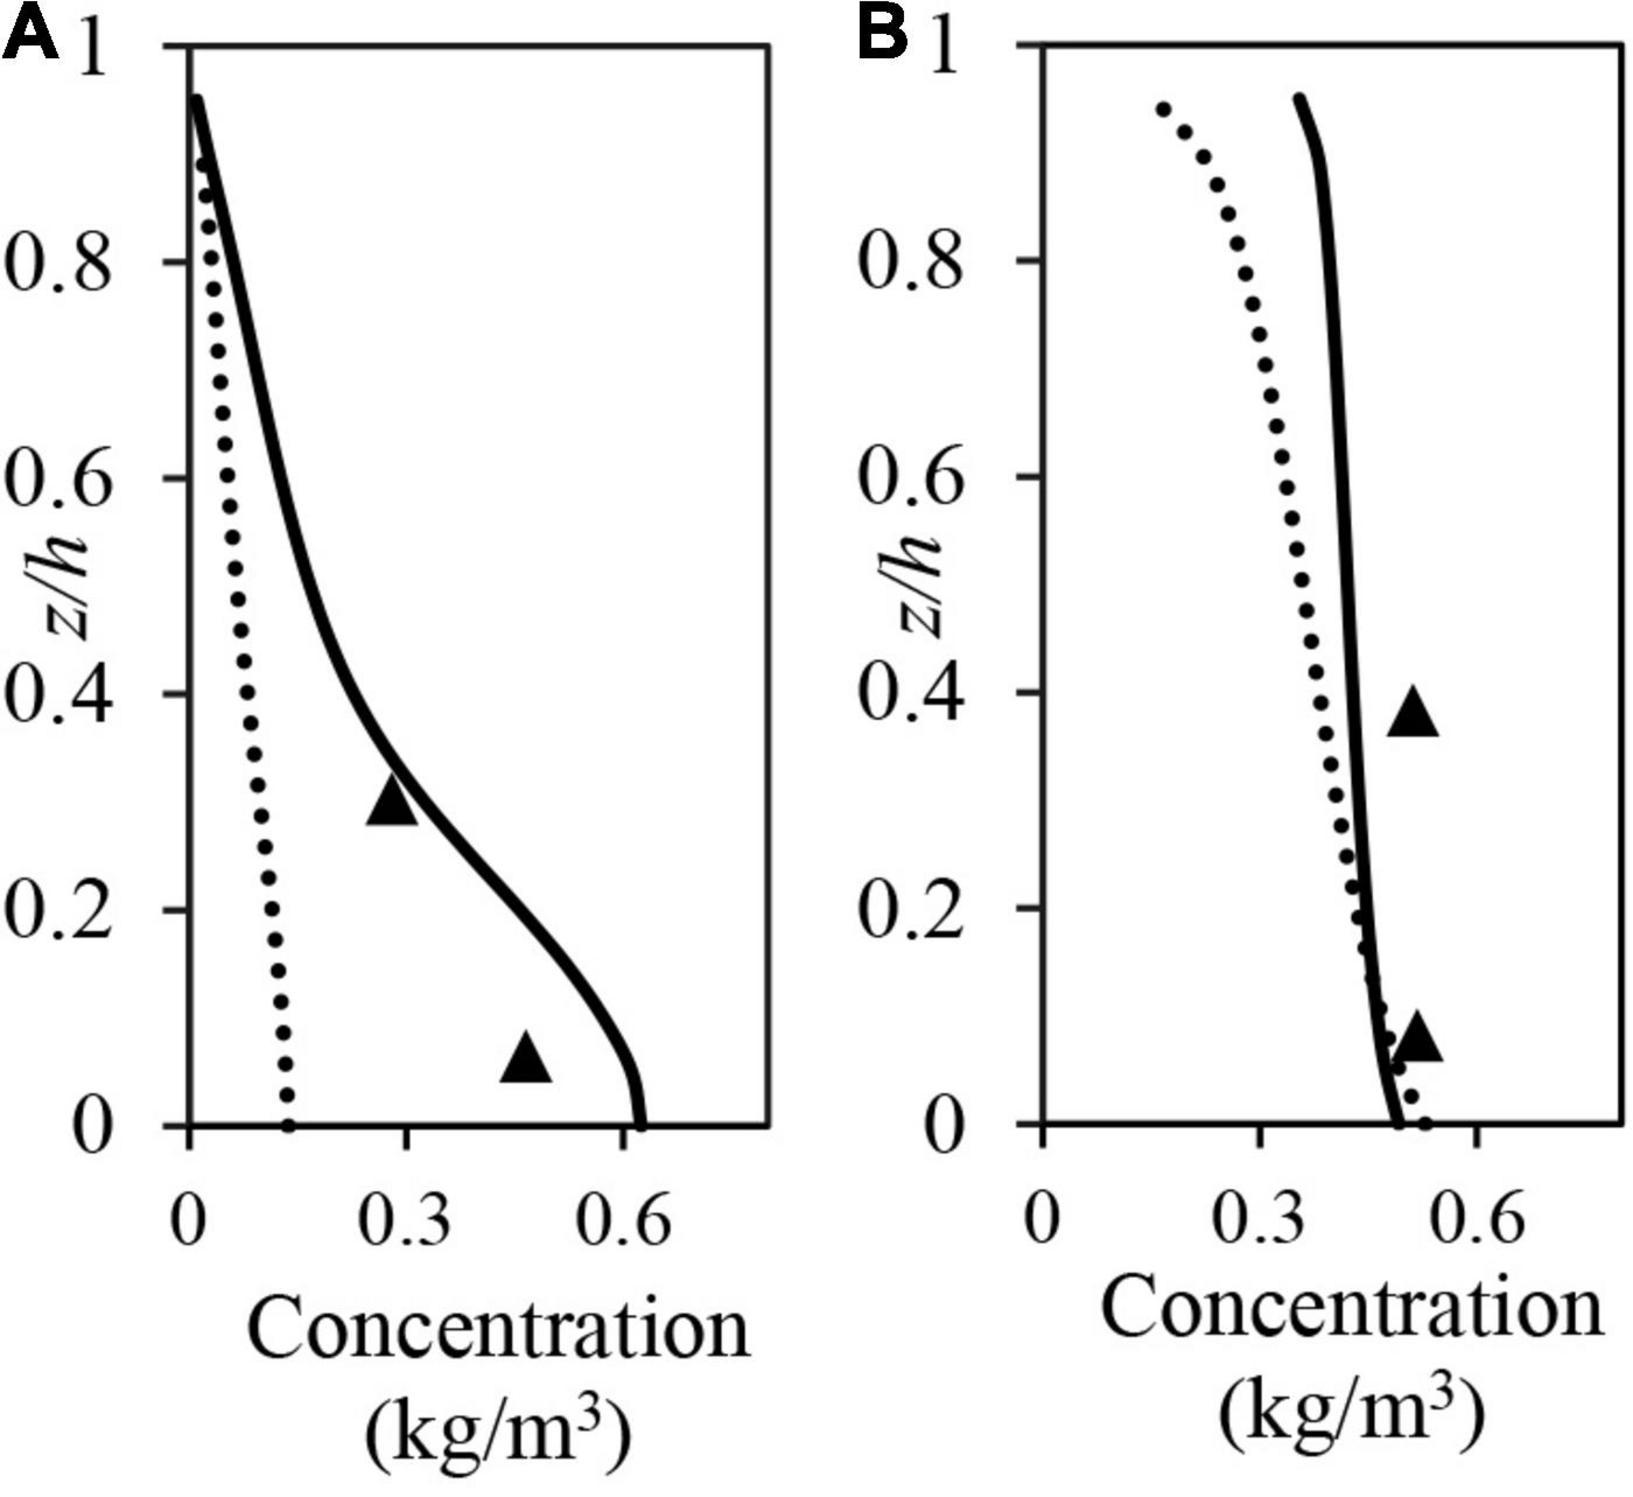
Figure 9. Model predictions of the vertical distributions of SSC in Elms/Dollard estuary tidal channel. Dotted and solid lines represent Model A and B predictions, respectively, at (A) 08:00 and (B) 11:00 h, while the solid triangles are the measured SSC data.
Discussion
Model Application to Settling Column Experiments
In the simulation of the grid-stirred settling column experiments with pure kaolin clay suspensions, the development of sediment concentration profiles within the column was shown to be well-represented by the 1DV two-phase model with either of the two flocculation models (i.e., with fixed or variable fractal dimensions) incorporated (Figure 2). By contrast, significant variability in the temporal development of rms floc sizes between the two models suggested that the adoption of a multiple fractal dimension approach (i.e., Model B) better replicated the floc size development in the settling column. Though direct measurements of floc settling velocities of kaolin clay generated in the grid-stirred settling column are not presented by Cuthbertson et al. (2018), they are shown in a previous study by Cuthbertson et al. (2010). Here, the measured kaolin clay flocs sizes and their corresponding settling velocities lay between two predicted settling rate curves (with fractal dimensions nf = 1.7 and nf = 2.3, see Figure 11 in Cuthbertson et al., 2010). The corresponding Model B results for floc sizes and settling velocities measured in the settling column tests were found to be consistent with this conclusion.
A conservative value of the initial floc size (D0 = 2 μm) was adopted for simulations with both flocculation models. However, sensitivity of the model predictions to the specification of D0 needs to be tested. Figure 10 shows sensitivity analysis runs of the predicted temporal development of the rms floc size for both flocculation models, where D0 is set at 2, 5, and 10 μm. It is apparent that the different D0 values influence floc development in both models, particularly during the initial stages of floc size evolution. Specifically, by increasing the initial floc size D0 in Model B, the initial rapid floc size development occurs earlier, with the final floc adjustment to quasi-equilibrium floc sizes shown to converge for all D0 after T = ∼5000 s. The initial rapid growth in floc sizes occurs as smaller flocs, with higher density and larger yield strengths, are more difficult to break up [i.e., with the aggregation term in Model B (Eq. 22) thus dominant]. Specification of larger D0 therefore takes a shorter time to reach floc sizes where the break-up term in Model B (Eq. 22) becomes more important (i.e., represented by the change in gradient of the temporal floc size development) and floc sizes then adjust more gradually to their quasi-equilibrium floc size. For Model A, the effect of D0 on the initial floc development is less consistent. Indeed, when D0 is set at 10.0 μm (i.e., blue dotted line, Figure 10), the predicted rms floc size actually decreases initially before increasing steadily with time. This floc size reduction is due to the sediment concentration being initially very low in the column, resulting in low aggregation rates, while the initial break-up term for the D0 = 10 μm flocs is higher (i.e., break-up > aggregation on right-hand side of Eq. 19). This initial reduction in rms floc size also means that convergence with the temporal floc size evolution for D0 = 5 μm occurs significantly earlier than with the D0 = 2 μm condition. As with Model B, once the temporal development of rms floc sizes have converged for all D0 values (at T = ∼8000 s, Figure 10), the subsequent adjustment to the quasi-equilibrium floc size again also coincide.
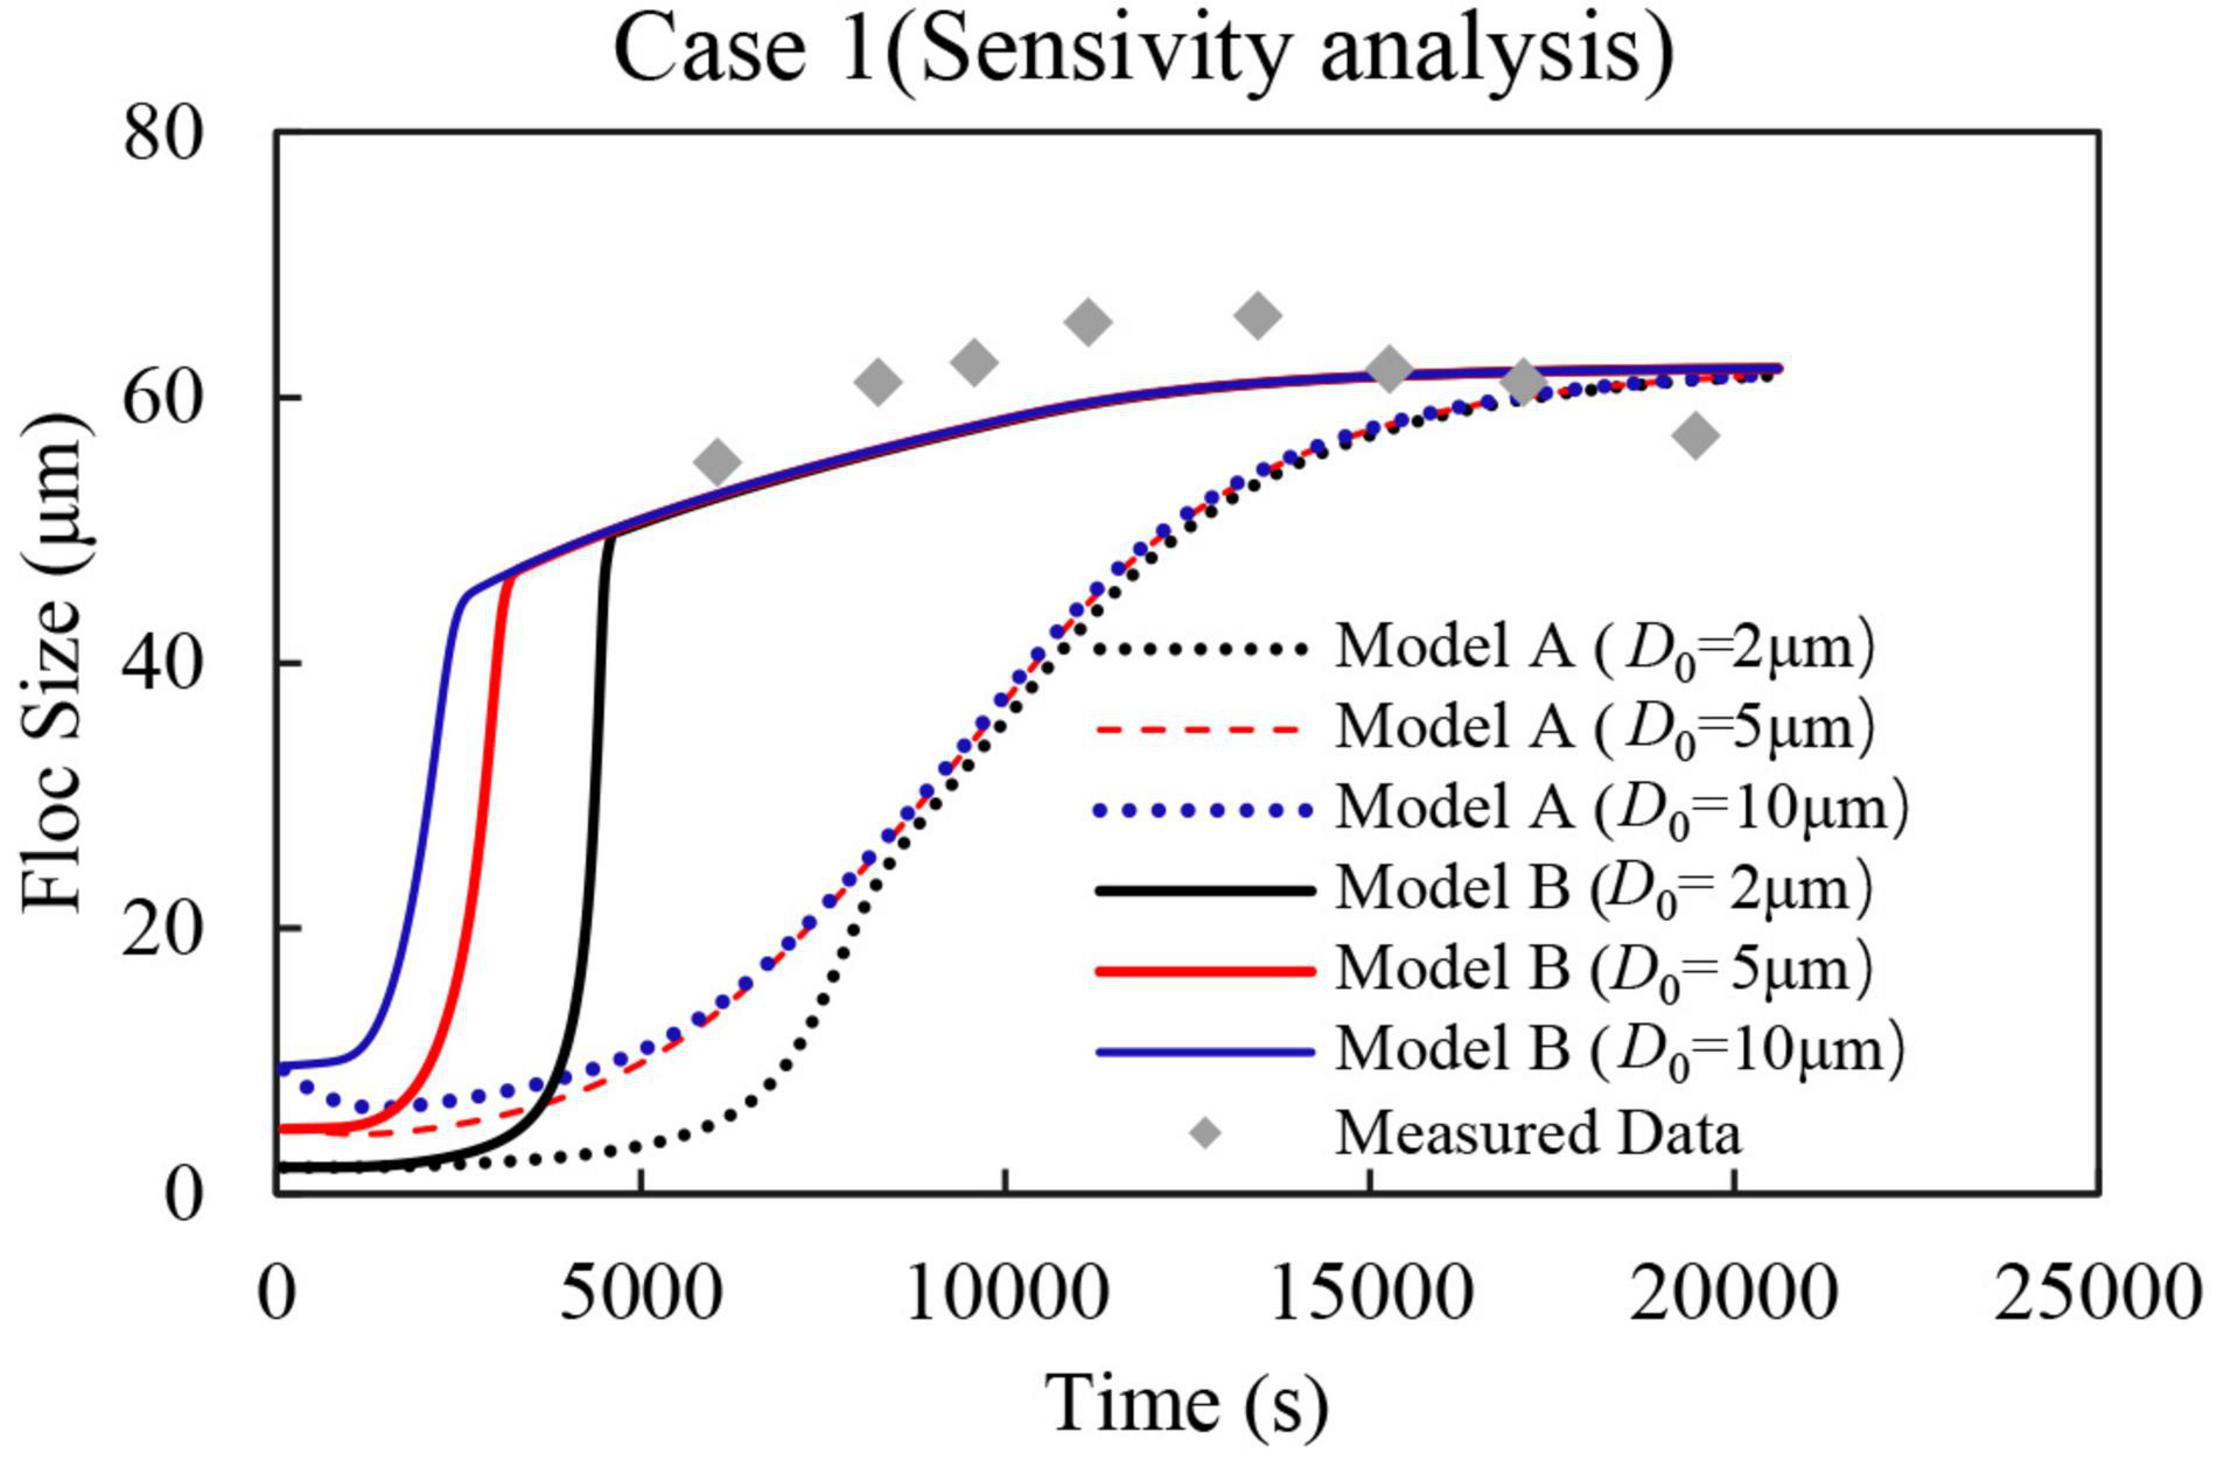
Figure 10. Time series plots of measured and predicted floc sizes generated in the grid-stirred settling column (Case 1, Table 1) showing the sensitivity of Model A and B predictions to the initial clay floc size specified at the upper column boundary.
To better explain the results of the settling column experiments by Model B, both flocculation models can be presented in the simplified general form F = Af–Bf, where Af and Bf represent the aggregation and break up terms, respectively. As indicated previously, smaller flocs with sizes approaching that of the primary particles (or small particle aggregates) have a denser structure (i.e., higher fractal dimension) and larger yield strength, making them more difficult to break up. For this particular condition, the turbulent stress μG is less than the floc yield strength τy, and the maximum fractal dimension nfmax [i.e., from ], is smaller than the value at which the flocs will break up. In other words, this indicates that the break up term Bf → 0 in Model B and, hence, the aggregation term will be dominant when floc sizes are small. This is the primary reason for the predicted rapid increase in floc size by Model B during the earlier stages of the runs.
Model Application to Field Measurements
Variations in the calculated floc sizes during slack water (Figure 11A) and ebb (Figure 11D) tidal phases indicate, firstly, a greater spatio-temporal variability in floc sizes is obtained with Model B than with Model A. This finding reflects (i) increased aggregation rates in Model B during slack water periods (i.e., floc sizes D up to ∼55 μm at z/h = 0.4, Figure 11A), compared to Model A (i.e., D up to ∼30 μm at z/h = 0.4, Figure 11A), and (ii) increased break up rates in Model B during high (ebb) tidal velocity periods (i.e., D ≈ 5–14 μm over z/h range, Figure 11D), compared to Model A (i.e., D ≈ 7–22 μm over z/h range, Figure 11D). This clearly suggests that the inclusion of variable fractal dimensions for all floc sizes (Model B) provides a more responsive flocculation model that better represents spatio-temporal floc evolution due to changing hydrodynamic conditions and SSC values (Figures 11C,F) within the tidal channel.
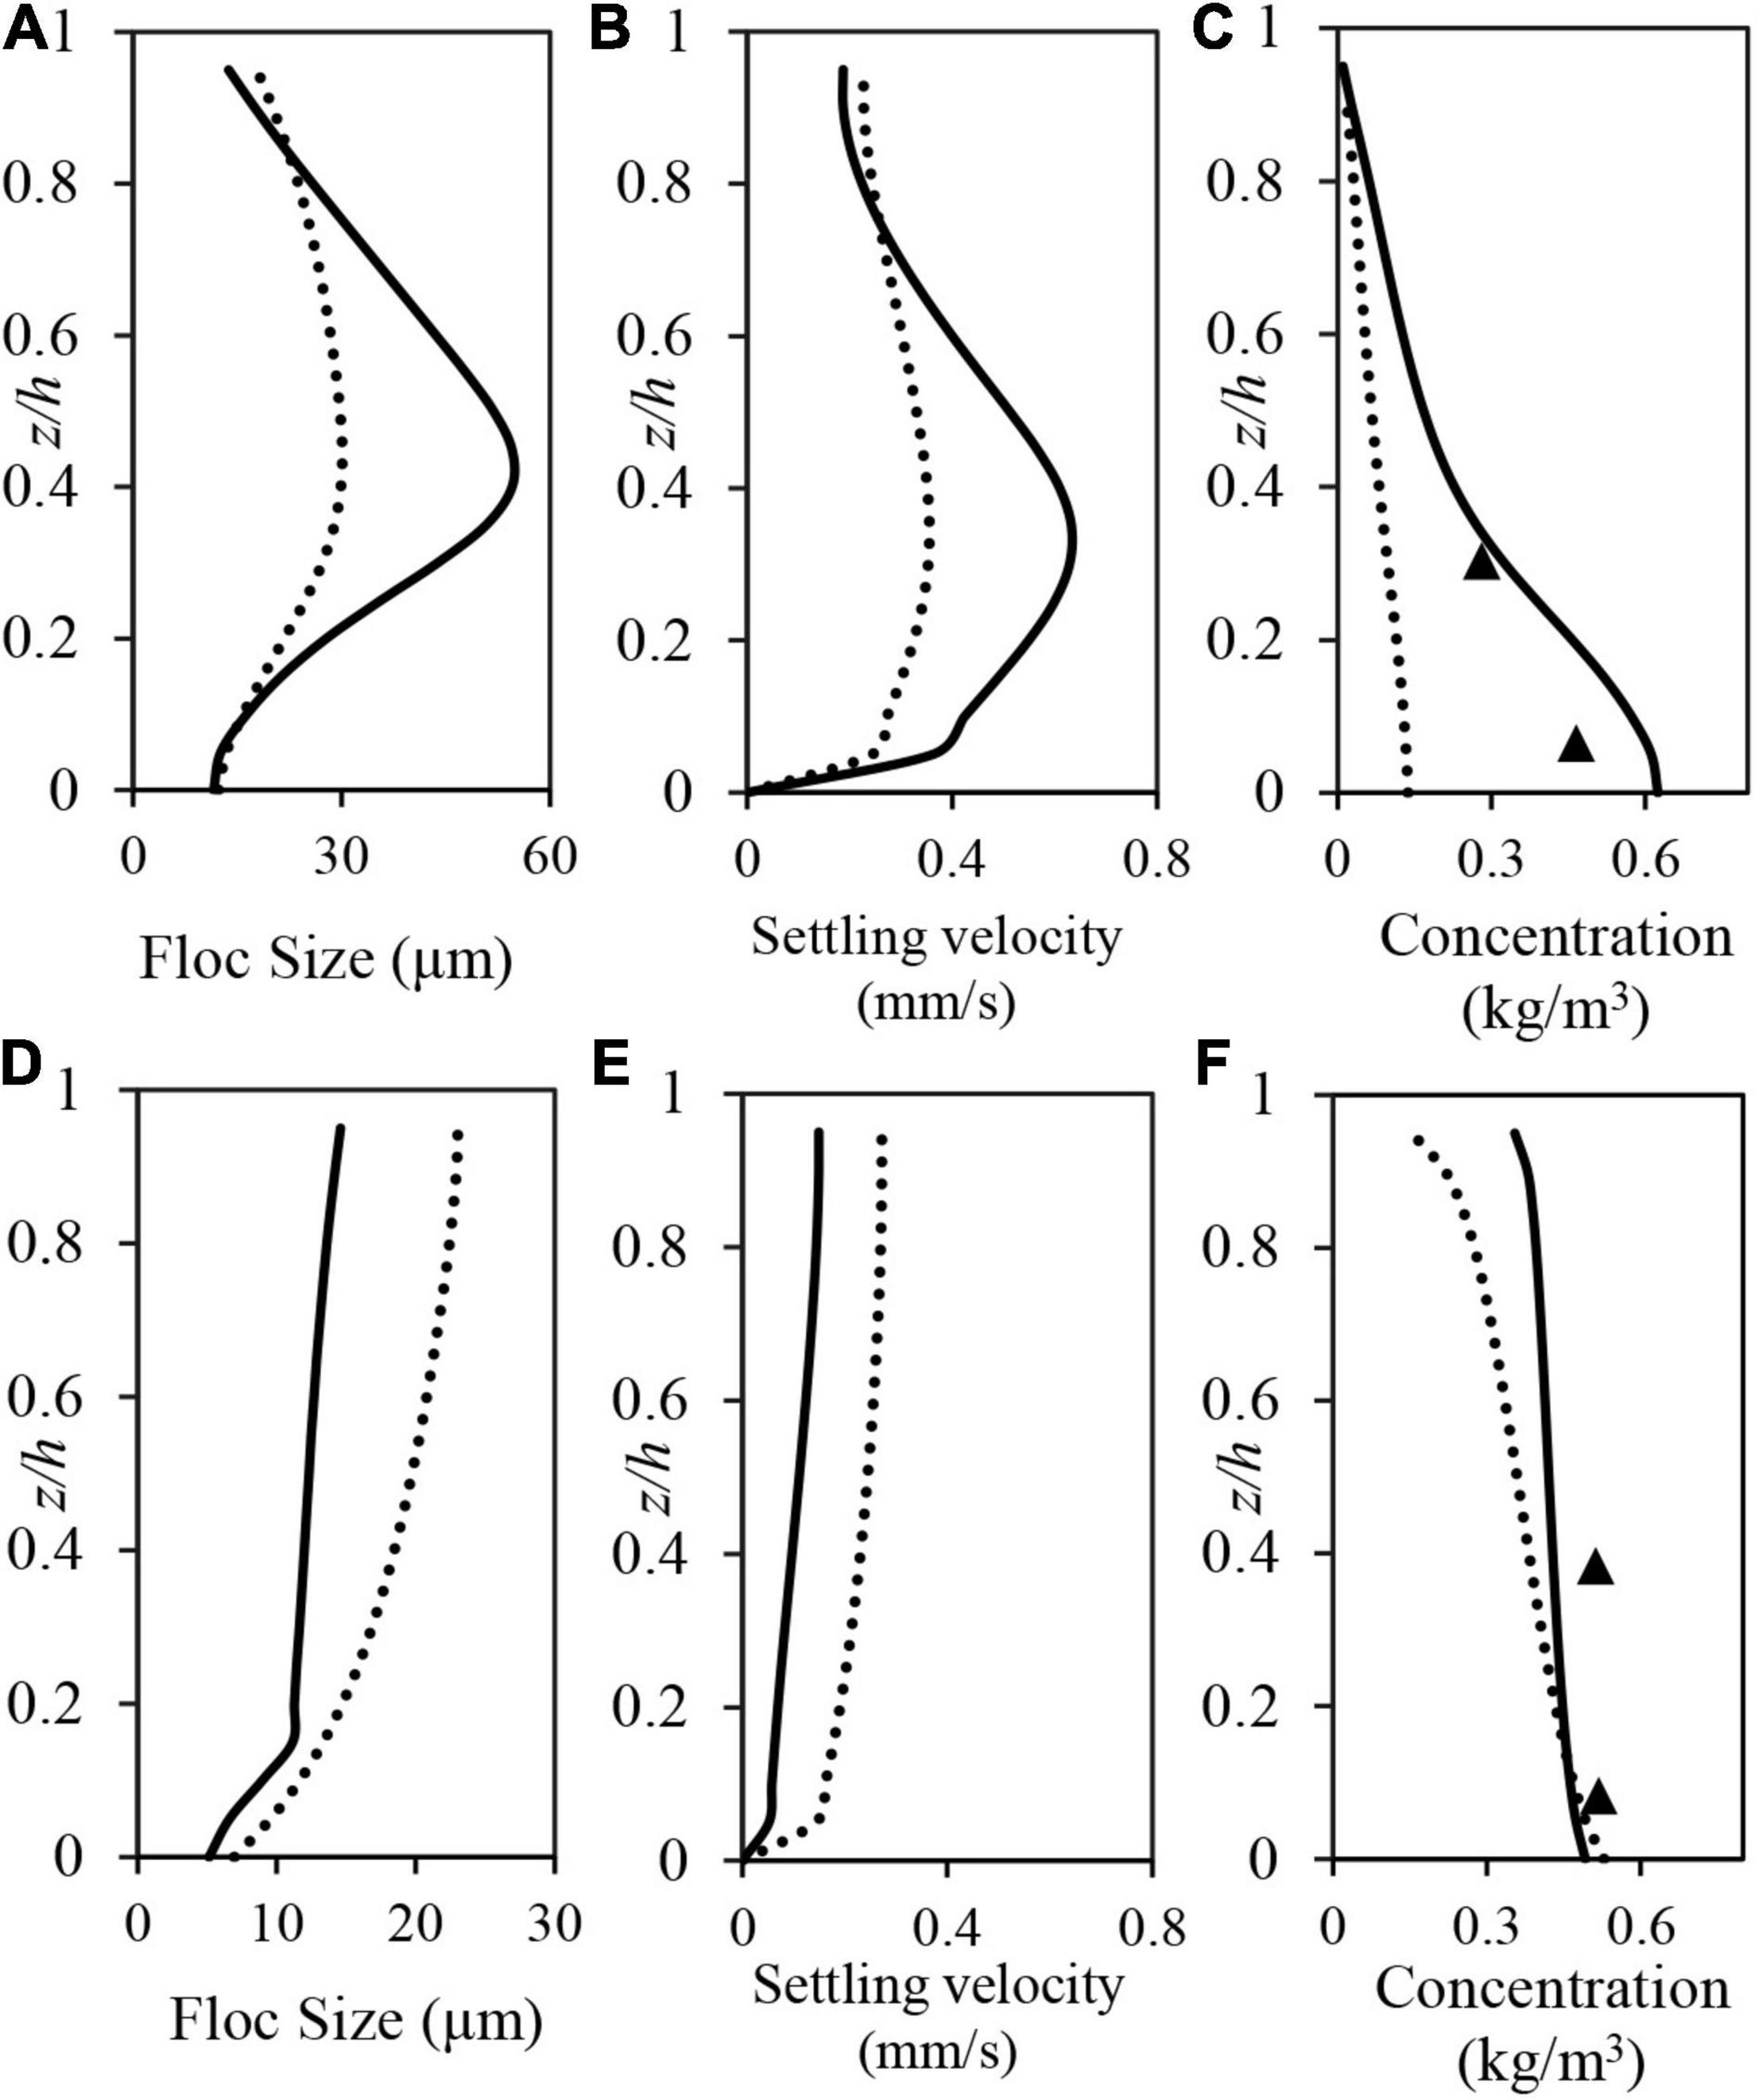
Figure 11. Model predictions of the vertical distributions of (A,D) floc size, (B,E) settling velocities, and (C,F) SSC in Elms/Dollard estuary tidal channel. Dotted and solid lines represent Model A and B predictions, respectively, at (A–C) 08:00 and (D–F) 11:00 h, while the solid triangles are the measured SSC data.
An interesting feature of the vertical distributions of floc sizes in Figure 11D (i.e., during the ebb tidal flow) is the general uniform and even a slight reduction in predicted floc size by both models from the water surface to the bed surface (i.e., z/h = 1 → 0). As, the largest turbulent shear rates are generated near bed, which result in smaller flocs, while the strong diffusion effects (ebb tidal flow) result in a more general uniform distribution. In this regard, the current model results for floc distributions within the water column are entirely consistent with previous observations by Guo et al. (2017) in the Yangtze river estuary. According to Guo et al. (2017), during the flood/ebb phase acceleration in tidal currents, the vertical distributions in measured mean floc sizes were relatively uniform (i.e., decreasing only slightly from the upper water column to the bed surface) and generally smaller than flocs generated under slack water conditions.
By contrast, Figure 11A shows that vertical floc size distributions are more variable during slack water (so as the settling velocity as shown in Figure 11B), with the largest floc sizes shown to occur at z/h = 0.4, and significant size reductions observed both in the water column above (approaching the water surface, z/h → 1) and below (approaching the bed surface, z/h → 0) this maximum. It is anticipated that this variable FSD occurs as larger flocs tend to settle out more quickly under quiescent conditions (i.e., during slack water) leaving only smaller flocs in the upper water column. The model results also show that average floc sizes are larger during the slack water than during the peak flood/ebb phases (and, thus the same with settling velocities as shown in Figures 11B,E), a trend that is again entirely consistent with the field measurements by Guo et al. (2017).
The floc sizes and effective floc densities are two key parameters that determine the settling velocities of flocs. Previous field studies in the Ems/Dollard estuary by Dyer et al. (2000) provided direct measurements of floc sizes and settling velocities during the flood phase of the tidal cycle (i.e., 2.13 and 0.14 h before HW). These can be compared, at least in a qualitative sense, with the current model predictions, albeit under different tidal conditions. Dyer et al. (2000) found that most smaller flocs measured in the estuary (d < 80 μm) had effective floc densities between 160 and 1600 kg.m–3, with corresponding settling velocities between 0.01 and 1.0 mm.s–1. By comparison, the calculated mean floc sizes within the Ems/Dollard estuary from the present modelling study (using Model B) during both peak flood/ebb phases and slack water periods are shown to typically vary between D = 10–60 μm, with effective densities between 160 and 1600 kg.m–3 and settling velocities between 0.01 and 1.0 mm.s–1. These values are therefore in broad agreement with the field measurements by Dyer et al. (2000) within the same estuary and provide further validation of the flocculation Model B with variable fractal dimensions.
Fettweis et al. (2006) also conducted field measurements of SSC, flow velocity, and floc size in the Belgian coastal zone and concluded that the Kolmogorov turbulent length scale was typically 3–10 times larger than the cohesive sediment flocs generated. Considering the field measurements from the Elms/Dollard estuary tidal channel used in the current study, the Model B predicted time series of average floc sizes at 0.4, 0.7, and 1.0 m elevations above the bed (i.e., equivalent to the elevations of the velocity measurements in Figures 6B–D) are shown in Figure 12, along with the predicted Kolmogorov scales at these elevations. It is shown that the predicted averaged floc sizes are generally significantly smaller than the Kolmogorov length scale, and only during periods of high SSC levels (i.e., on the flood and ebb phases, prior to slack water, Figures 8B,C) do we see significant floc growth (D ≈ 80–220 μm, Figure 12) at the three measurement elevations, which diminishes rapidly again at slack water, primarily due to floc settlement and the corresponding rapid reduction in SSC values (Figures 8B,C). Importantly, the corresponding Kolmogorov length scales at these elapsed times with high SSC values (and largest floc sizes) vary between about 400 and 720 μm, with the Kolmogorov length scale to peak floc size length ratio therefore varying between 3 and 5, in full accord with the findings of Fettweis et al. (2006). The current findings are also consistent with the assumption in the Winterwerp (1998) semi-empirical flocculation model (Eq. 19) that the Kolmogorov length represents the upper limit on the attainable equilibrium floc size generated under steady state conditions (i.e., constant concentration c and shear rate G).
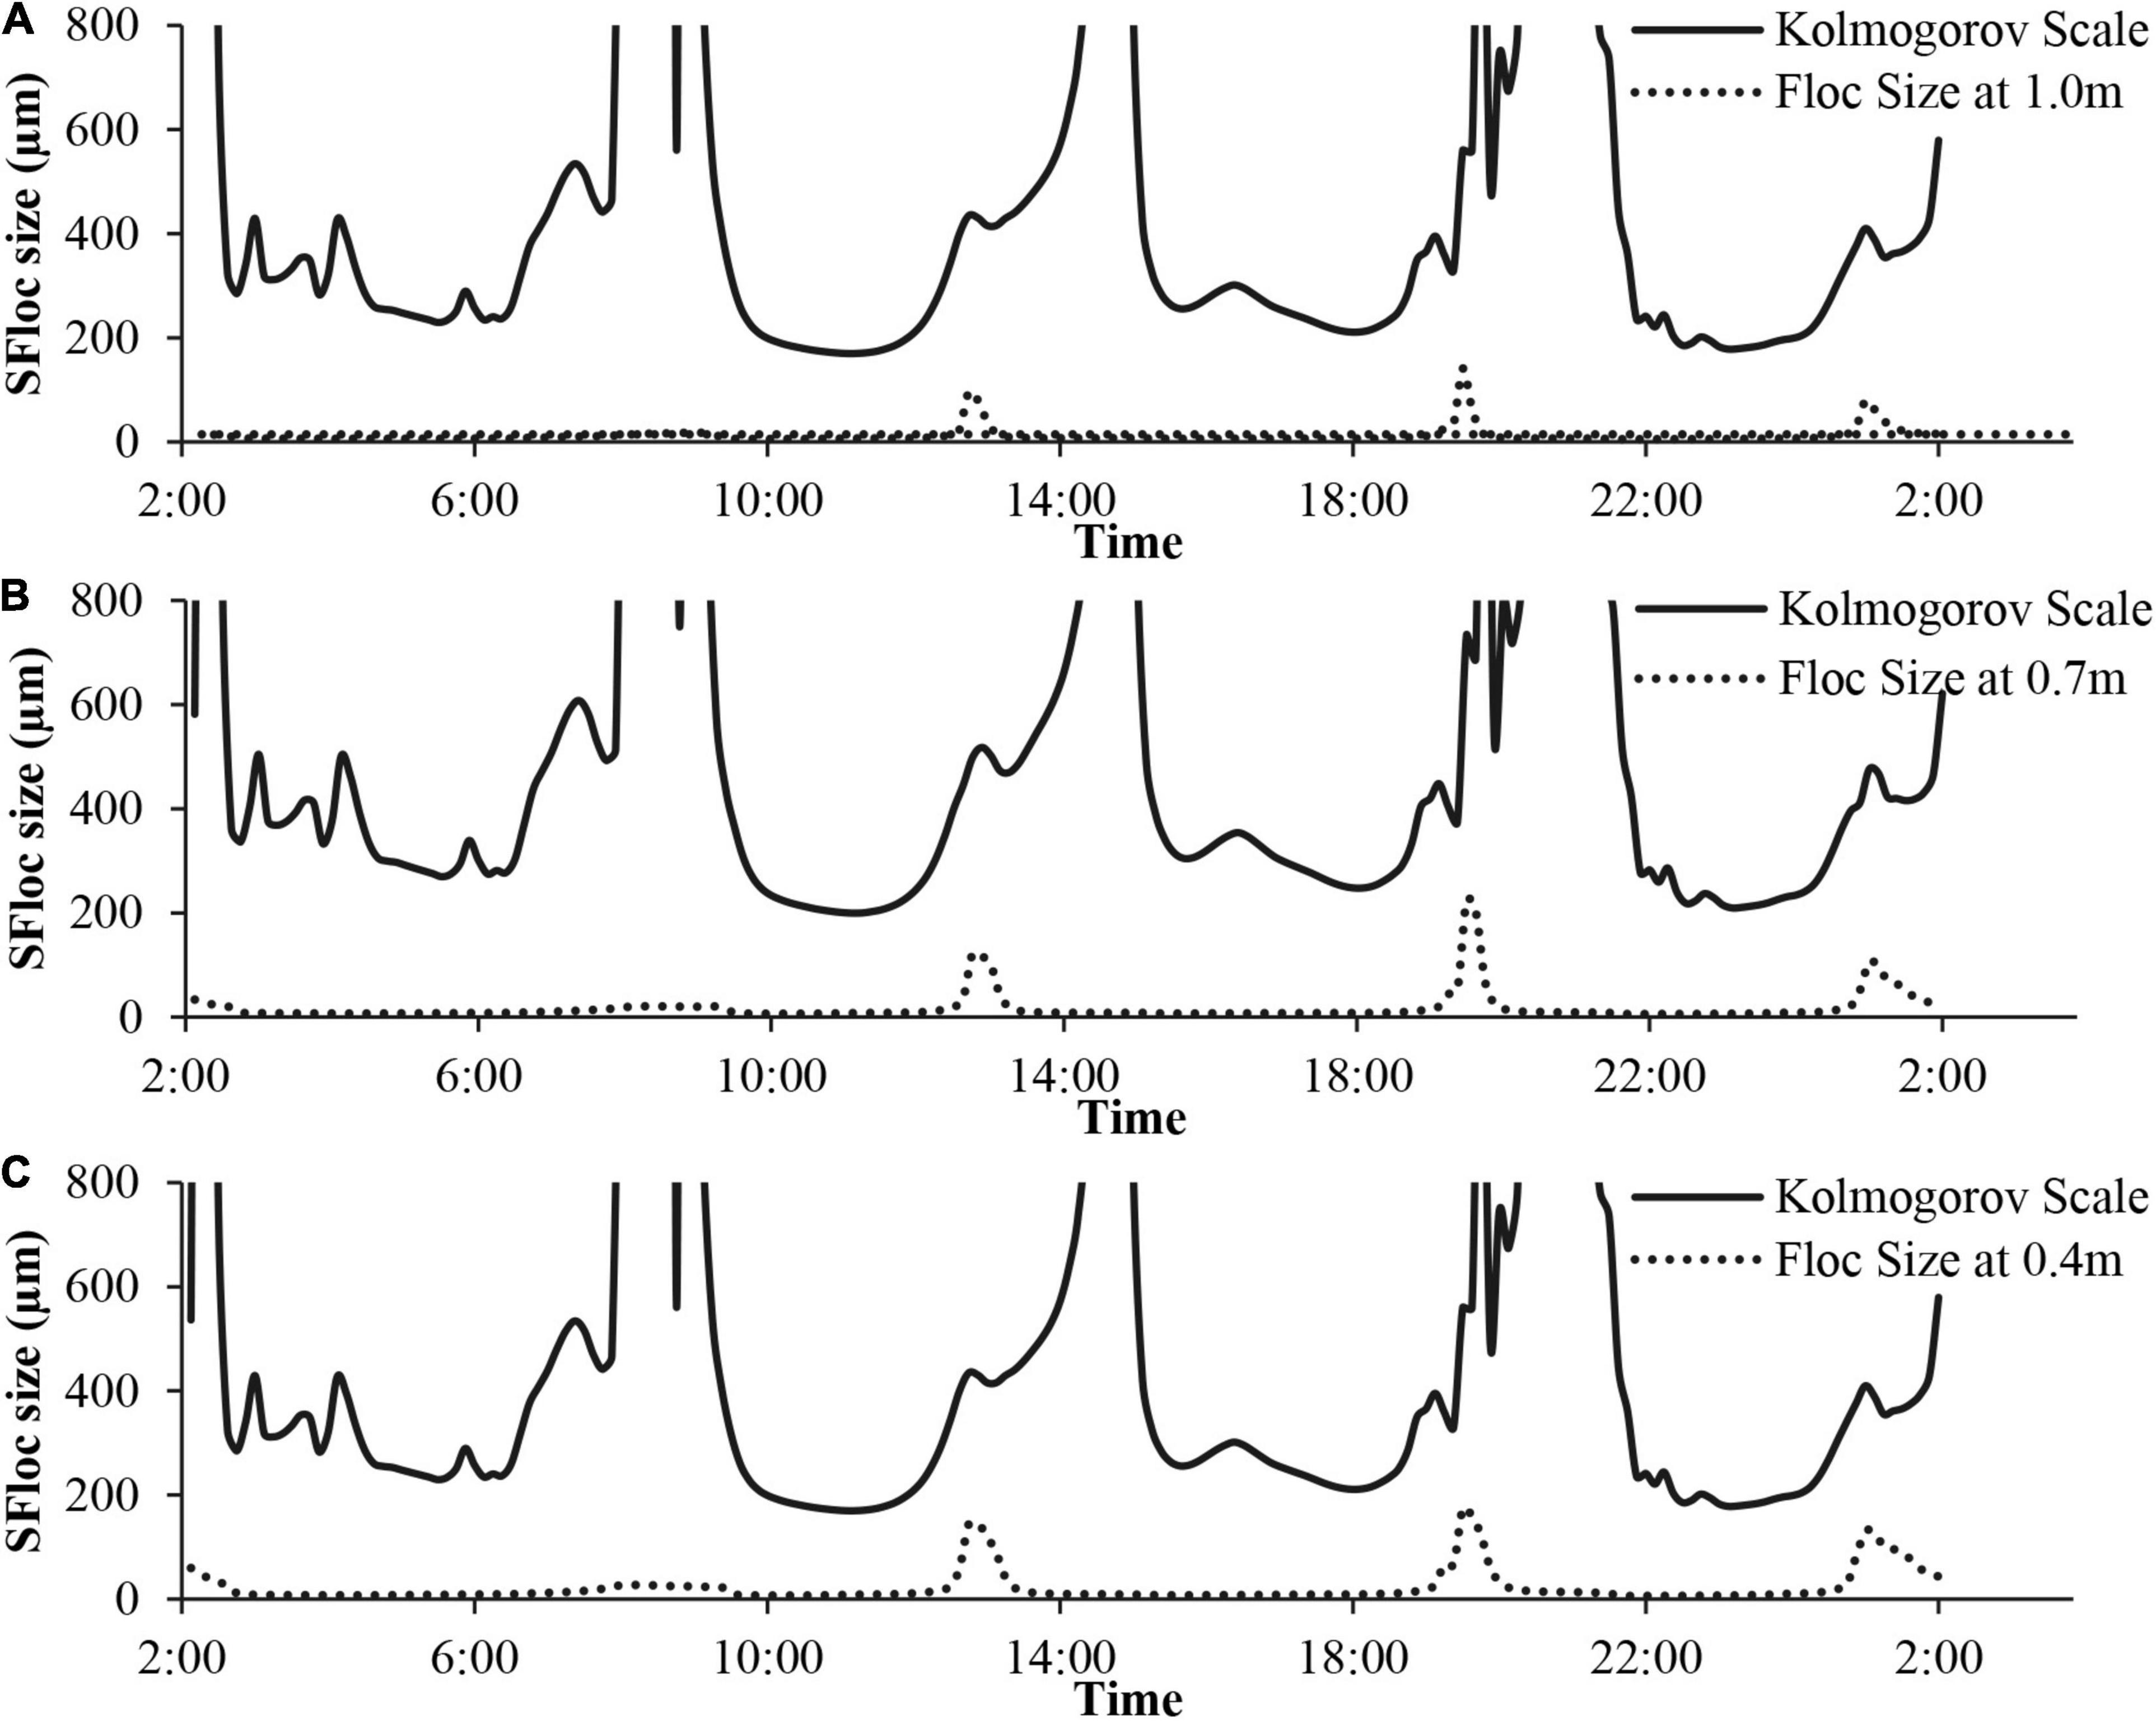
Figure 12. Time series plots of predicted average floc sizes (Model B, dotted lines) and calculated Kolmogorov turbulent scale (solid lines) at elevations (A) 1.0 m, (B) 0.7 m, and (C) 0.4 m above the bed.
Conclusion
A new two-phase model that accounts for detailed cohesive sediment flocculation processes was applied to simulate the time evolution of floc sizes measured in an idealized, grid-stirred settling column. The effects of spatio-temporal variations in SSC on the evolution of floc sizes were shown to be particularly well reproduced by flocculation Model B, where multiple fractal dimensions and yield strengths were incorporated for different floc sizes. These predictions captured the rapid increase of floc sizes during the initial stage of the experimental run, as well as the more gradual increase to quasi-equilibrium floc sizes observed as SSC levels continue to increase in the settling column during the latter stages of the experimental runs. The flocculation model is then successfully applied to simulate field measurements of cohesive sediment resuspension processes within the tidal channel of the Elms/Dollard estuary. The predicted time series of SSC at two elevations in the water column are shown to compare well with measured data. More importantly, Model B, with multiple fractal dimensions and floc yield strengths, predicts a lower SSC gradient in the vertical direction during the peak ebb tidal velocities, demonstrating better overall correlation coefficient with the measured SSC data. This model also provides reasonable predictions of temporal variations and vertical distributions of floc sizes within the water column, although only limited field measurements of floc sizes and settling rates were available for validation. The predictive capabilities of Model B, however, appear to better support the hypothesis that flocs with the same overall size may have entirely different structures that can only be represented by the incorporation of multiple fractal dimensions. As such, the model simulations reported herein conclude that this structural variability in cohesive sediment flocs should be accounted for in all operational flocculation models in order to provide improved representation of flocculation, settling and resuspension processes in cohesive sedimentary environments.
Data Availability Statement
The raw data supporting the conclusions of this article will be made available by the authors, without undue reservation.
Author Contributions
CX and AC designed the work, wrote the manuscript, and managed communication among all the authors. CX and YZ built and ran the model. CX, PD, and YC performed the analysis of model results. YZ prepared the figures. YC, PD, and AC contributed to the revision of the manuscript. All authors reviewed and agreed to the final manuscript.
Funding
This research was supported by the Natural Science Foundation of China (Nos. 51979076 and 5151001005), Fundamental Research Funds for the Central Universities (B200204017), United Kingdom Engineering and Physical Science Research Council (EP/R02491X/1), and Natural Science Foundation of China (No. 51709084).
Conflict of Interest
The authors declare that the research was conducted in the absence of any commercial or financial relationships that could be construed as a potential conflict of interest.
Publisher’s Note
All claims expressed in this article are solely those of the authors and do not necessarily represent those of their affiliated organizations, or those of the publisher, the editors and the reviewers. Any product that may be evaluated in this article, or claim that may be made by its manufacturer, is not guaranteed or endorsed by the publisher.
Acknowledgments
We would like to thank Wen Luo and Lu Jiang for helping with the data collection and editing equations.
References
Busch, N. E. (1973). “On the mechanics of atmospheric turbulence,” in Proceedings of the Workshop on Micrometeorology, ed. D. A. Haugen (Boston, MA: American Meteorological Society).
Chauchat, J., Guillou, S., Pham Van Bang, D., and Dan Nguyen, K. (2013). Modelling sedimentation–consolidation in the framework of a one-dimensional two-phase flow model. J. Hydraul. Res. 51, 293–305. doi: 10.1080/00221686.2013.768798
Cuthbertson, A. J. S., Dong, P., and Davies, P. A. (2010). Non-equilibrium flocculation characteristics of fine-grained sediments in grid-generated turbulent flow. Coast. Eng. 57, 447–460. doi: 10.1016/j.coastaleng.2009.11.011
Cuthbertson, A. J. S., Samsami, F., and Dong, P. (2018). Model studies for flocculation of sand-clay mixtures. Coast. Eng. 132, 13–32. doi: 10.1016/j.coastaleng.2017.11.006
Dyer, K. R. (1989). Sediment processes in estuaries: future research requirements. J. Geophys. Res. Oceans 94, 14327–14339.
Dyer, K. R., Christie, M. C., Feates, N., Fennessy, M. J., and Pejrup, M. van der Lee, W. (2000). An investigation into processes influencing the morphodynamics of an intertidal mudflat, the Dollard Estuary, The Netherlands: I. hydrodynamics and suspended sediment. Estuar. Coast. Shelf Sci. 50, 607–625. doi: 10.1006/ecss.1999.0596
Einstein, A. (1905). Eine neue bestimmung der moleküldimensionen. Ann. Phys. 324, 289–306. doi: 10.1002/andp.19063240204
Fall, K. A., Friedrichs, C. T., Massey, G. M., Bowers, D. G., and Smith, S. J. (2021). The importance of organic content to fractal floc properties in estuarine surface waters: insights from video, LISST, and pump sampling. J. Geophys. Res. Oceans 126:e2020JC016787. doi: 10.1029/2020jc016787
Fettweis, M., Francken, F., Pison, V., and Van den Eynde, D. (2006). Suspended particulate matter dynamics and aggregate sizes in a high turbidity area. Mar. Geol. 235, 63–74. doi: 10.1016/j.margeo.2006.10.005
Frankel, N. A., and Acrivos, A. (1967). On the viscosity of a concentrated suspension of solid spheres. Chem. Eng. Sci. 22, 847–853.
Graham, A. L. (1981). On the viscosity of suspensions of solid spheres. Appl. Sci. Res. 37, 275–286.
Guo, C., He, Q., Guo, L., and Winterwerp, J. C. (2017). A study of in-situ sediment flocculation in the turbidity maxima of the Yangtze Estuary. Estuar. Coast. Shelf Sci. 191, 1–9. doi: 10.1016/j.ecss.2017.04.001
He, J., Chu, J., Tan, S. K., Vu, T. T., and Lam, K. P. (2016). Sedimentation behavior of flocculant-treated soil slurry. Mar. Georesour. Geotechnol. 35, 593–602. doi: 10.1080/1064119x.2016.1177625
Keyvani, A., and Strom, K. (2014). Influence of cycles of high and low turbulent shear on the growth rate and equilibrium size of mud flocs. Mar. Geol. 354, 1–14. doi: 10.1016/j.margeo.2014.04.010
Khelifa, A., and Hill, P. S. (2006). Models for effective density and settling velocity of flocs. J. Hydraul. Res. 44, 390–401. doi: 10.1080/00221686.2006.9521690
Kornman, B. A., and De Deckere, E. M. G. T. (1998). Temporal variation in sediment erodibility and suspended sediment dynamics in the Dollard estuary. Geol. Soc. Lond. Spec. Publ. 139, 231–241.
Kranenburg, C. (1994). The fractal structure of cohesive sediment aggregates. Estuar. Coast. Shelf Sci. 39, 451–460.
Li, D., Li, Y., and Xu, Y. (2017). Observations of distribution and flocculation of suspended particulate matter in the Minjiang River Estuary, China. Mar. Geol. 387, 31–44. doi: 10.1016/j.margeo.2017.03.006
Li, G., Wang, J., Liu, B., Meng, X., Kan, G., Han, G., et al. (2020). In situ acoustic properties of fine-grained sediments on the northern continental slope of the South China Sea. Ocean Eng. 218:108244. doi: 10.1016/j.oceaneng.2020.108244
Lick, W., Lick, J., and Ziegler, C. K. (1992). Flocculation and its effect on the vertical transport of fine-grained sediments. Hydrobiologia 235, 1–16.
Manning, A. (2004). The observed effects of turbulence on estuarine flocculation. J. Coast. Res. 41, 90–104.
Manning, A. J., Baugh, J. V., Spearman, J. R., and Whitehouse, R. J. S. (2010). Flocculation settling characteristics of mud: sand mixtures. Ocean Dynam. 60, 237–253. doi: 10.1007/s10236-009-0251-0
Mayerle, R., Narayanan, R., Etri, T., and Abd Wahab, A. K. (2015). A case study of sediment transport in the Paranagua Estuary Complex in Brazil. Ocean Eng. 106, 161–174. doi: 10.1016/j.oceaneng.2015.06.025
Mikkelsen, O. A., and Pejrup, M. (2000). In situ particle size spectra and density of particle aggregates in a dredging plume. Mar. Geol. 170, 443–459. doi: 10.1016/S0025-3227(00)00105-5
Moruzzi, R. B., de Oliveira, A. L., da Conceição, F. T., Gregory, J., and Campos, L. C. (2017). Fractal dimension of large aggregates under different flocculation conditions. Sci. Total Environ. 609, 807–814. doi: 10.1016/j.scitotenv.2017.07.194
Reisinger, A., Gibeaut, J. C., and Tissot, P. E. (2017). Estuarine suspended sediment dynamics: observations derived from over a decade of satellite data. Front. Mar. Sci. 4:233. doi: 10.3389/fmars.2017.00233
Rodi, W. (1980). Turbulence Models and Their Application in Hydraulics: A State of the Art Review. Delft: International Association for Hydraulic Research.
Shen, X., and Maa, J. P. Y. (2016). A camera and image processing system for floc size distributions of suspended particles. Mar. Geol. 376, 132–146. doi: 10.1016/j.margeo.2016.03.009
Son, M., and Hsu, T. (2011). The effects of flocculation and bed erodibility on modeling cohesive sediment resuspension. J. Geophys. Res. 116:C03021. doi: 10.1029/2010jc006352
Son, M., and Hsu, T.-J. (2008). Flocculation model of cohesive sediment using variable fractal dimension. Environ. Fluid Mech. 8, 55–71. doi: 10.1007/s10652-007-9050-7
Son, M., and Hsu, T. J. (2009). The effect of variable yield strength and variable fractal dimension on flocculation of cohesive sediment. Water Res. 43, 3582–3592. doi: 10.1016/j.watres.2009.05.016
Strom, K., and Keyvani, A. (2016). Flocculation in a decaying shear field and its implications for mud removal in near-field river mouth discharges. J. Geophys. Res. Oceans 121, 2142–2162. doi: 10.1002/2015jc011169
Thorn, M. F. C. (1981). “Physical processes of siltation in tidal channels,” in Proceedings for Hydraulic Modelling applied to Maritime Engineering Problems (London: ICE), 47–55.
Toorman, E. (1999). Sedimentation and self-weight consolidation: constitutive equations and numerical modelling. Geotechnique 49, 709–726.
Toorman, E. A. (1996). Sedimentation and self-weight consolidation: general unifying theory. Geotechnique 46, 103–113.
Vahedi, A., and Gorczyca, B. (2012). Predicting the settling velocity of flocs formed in water treatment using multiple fractal dimensions. Water Res. 46, 4188–4194. doi: 10.1016/j.watres.2012.04.031
Vahedi, A., and Gorczyca, B. (2014). Settling velocities of multifractal flocs formed in chemical coagulation process. Water Res. 53, 322–328.
Van Der Ham, R., Fontijn, H., Kranenburg, C., and Winterwerp, J. (2001). Turbulent exchange of fine sediments in a tidal channel in the Ems/Dollard estuary. Part I: turbulence measurements. Cont. Shelf Res. 21, 1605–1628.
van der Ham, R., and Winterwerp, J. C. (2001). Turbulent exchange of fine sediments in a tidal channel in the Ems/Dollard estuary. Part II. Analysis with a 1DV numerical model. Cont. Shelf Res. 21, 1629–1647. doi: 10.1016/S0278-4343(01)00011-5
Verney, R., Lafite, R., Claude Brun-Cottan, J., and Le Hir, P. (2011). Behaviour of a floc population during a tidal cycle: laboratory experiments and numerical modelling. Cont. Shelf Res. 31, S64–S83. doi: 10.1016/j.csr.2010.02.005
Wan, Y., Wu, H., Roelvink, D., and Gu, F. (2015). Experimental study on fall velocity of fine sediment in the Yangtze Estuary, China. Ocean Eng. 103, 180–187. doi: 10.1016/j.oceaneng.2015.04.076
Watson, S. J., Cade-Menun, B. J., Needoba, J. A., and Peterson, T. D. (2018). Phosphorus forms in sediments of a river-dominated estuary. Front. Mar. Sci. 5:302. doi: 10.3389/fmars.2018.00302
Winterwerp, J. C. (1998). A simple model for turbulence induced flocculation of cohesive sediment. J. Hydraul. Res. 36, 309–326. doi: 10.1080/00221689809498621
Winterwerp, J. C. (2002). On the flocculation and settling velocity of estuarine mud. Cont. Shelf Res. 22, 1339–1360.
Winterwerp, J. C., and Van Kesteren, W. G. (2004). Introduction to the Physics of Cohesive Sediment in the Marine Environment. Amsterdam: Elsevier Science Limited.
Xu, C., and Dong, P. (2017a). A dynamic model for coastal mud flocs with distributed fractal dimension. J. Coast. Res. 33, 218–225. doi: 10.2112/JCOASTRES-D-15-00110.1
Xu, C., and Dong, P. (2017b). Two-phase flow modelling of sediment suspension in the Ems/Dollard estuary. Estuar. Coast. Shelf Sci. 191, 115–124. doi: 10.1016/j.ecss.2017.04.011
Xu, Y. (2019). Approach to the erosion threshold of cohesive sediments. Ocean Eng. 172, 183–190. doi: 10.1016/j.oceaneng.2018.11.036
Yang, Z., Zhu, Y., Liu, T., Sun, Z., Ling, X., and Yang, J. (2019). Pumping effect of wave-induced pore pressure on the development of fluid mud layer. Ocean Eng. 189:106391. doi: 10.1016/j.oceaneng.2019.106391
Zhang, J.-F., and Zhang, Q.-H. (2011). Lattice Boltzmann simulation of the flocculation process of cohesive sediment due to differential settling. Cont. Shelf Res. 31, S94–S105. doi: 10.1016/j.csr.2010.03.009
Keywords: flocculation, multifractal dimensions, cohesive sediment, grid-stirred settling column, mud resuspension, tidal channel
Citation: Xu C, Cuthbertson AJS, Zhou Y, Dong P and Chen Y (2021) Modelling the Effects of Multiple Fractal Dimensions on the Flocculation and Resuspension Processes of Cohesive Sediment. Front. Mar. Sci. 8:746630. doi: 10.3389/fmars.2021.746630
Received: 24 July 2021; Accepted: 15 December 2021;
Published: 24 December 2021.
Edited by:
Alejandro Jose Souza, Center for Research and Advanced Studies - Mérida Unit, MexicoReviewed by:
Rafael Ramírez-Mendoza, Center for Scientific Research and Higher Education in Ensenada (CICESE), MexicoDavid Todd, HR Wallingford, United Kingdom
Copyright © 2021 Xu, Cuthbertson, Zhou, Dong and Chen. This is an open-access article distributed under the terms of the Creative Commons Attribution License (CC BY). The use, distribution or reproduction in other forums is permitted, provided the original author(s) and the copyright owner(s) are credited and that the original publication in this journal is cited, in accordance with accepted academic practice. No use, distribution or reproduction is permitted which does not comply with these terms.
*Correspondence: Yongping Chen, eXBjaGVuQGhodS5lZHUuY24=
 Chunyang Xu
 Alan J. S. Cuthbertson
 Yan Zhou3
 Yongping Chen