 Carmen J. Ritter1,2*
 Leah M. Harper1,2
 Jonathan S. Lefcheck1,2
 Valerie J. Paul3
 Ross Whippo1,4
 Scott Jones3
 Matthew B. Ogburn2
 J. Emmett Duffy1,2
- 1Tennenbaum Marine Observatories Network and MarineGEO Program, Smithsonian Institution, Edgewater, MD, United States
- 2Smithsonian Environmental Research Center, Edgewater, MD, United States
- 3Smithsonian Marine Station, Fort Pierce, FL, United States
- 4Oregon Institute of Marine Biology, Charleston, OR, United States
Herbivores, omnivores, and predators transfer energy and structure the communities of many coastal marine ecosystems, and the intensity with which they consume prey and contribute to ecosystem functioning varies substantially among habitats over short time periods. Whether generalities across habitats might emerge for longer time series and using standard methods remains largely untested. Here, we deployed standardized assays of consumption using dried squid (“squidpops”) and five common macrophytes (“weedpops”) to quantify consumption across coral fore reef and patch reefs, mangroves, seagrass meadows, and bare sand from 2015 to 2019 around Carrie Bow Cay, Belize. We also used video in 2017 to identify the species responsible for consumption. We found that both squid- and weedpop consumption were consistently highest on patch and fore reef habitats, moderate in mangroves, and lowest in seagrass and sand across all years of the survey. Videos showed that the majority of consumption on the reefs in 2017 could be attributed to < 5 fish species, and the identity of the dominant consumers differed among habitats. This study validates a key but implicit assumption in marine ecology that relative patterns in consumption across habitats are consistent through space and time in tropical nearshore environments, and reveals that high consumption rates may be the consequence of one or few species in each location.
Introduction
Both herbivory and predation are key processes within food webs that control biomass distribution and species composition within and across communities (Borer et al., 2006; Halpern et al., 2006). Understanding spatial and temporal variation in consumption is crucial for predicting how ecosystems will respond to global and local change, including warming climate and fishing impacts (Ling et al., 2009; Vergés et al., 2011). Although relative variation in primary production and producer biomass can be compared efficiently in both terrestrial and marine environments, the mobility, diet, and behavior of consumers (e.g., fishes) make their distribution and top-down impacts challenging to quantify, especially in marine habitats (Duffy et al., 2015; Fraser et al., 2020; Whalen et al., 2020). However, an increasing number of studies have demonstrated that top-down processes vary predictably across latitude within a handful of marine habitats (Freestone et al., 2011; Rodemann and Brandl, 2017; Musrri et al., 2019; Whalen et al., 2020; Lefcheck et al., 2021), which may give insight into fish presence and behaviors, and help with the interpretation of consumption processes (Ferreira et al., 2004; Navarrete et al., 2005).
Tropical marine seascapes contain a patchwork of nearshore habitats and therefore are an ideal test bed for understanding variation in consumption among habitat types and trophic guilds, including various types of consumers. In the past decade, a landscape-level perspective has informed the value of coastal habitats as nurseries (Nagelkerken et al., 2015), and this perspective could also help to unite the large body of literature examining within-habitat variation in consumption rates. Coral reefs, for example, are among the best-studied marine ecosystems with respect to trophic processes, and there is a long history exploring how grazing by herbivorous fishes is critical in maintaining a coral-dominated state (Lewis, 1986; Burkepile and Hay, 2010; Tootell and Steele, 2016). Seagrasses have also long been the focus of comparative experiments to understand how predation—generally in the form of tethered prey—varies across space and through time (Heck and Wilson, 1987). Nevertheless, fewer studies explore how consumption changes across multiple habitats within the same coastal seascape, and those that do have revealed inconsistent patterns in terms of the degree of consumption observed in different habitats (Chittaro et al., 2005; Hammerschlag et al., 2010). Indeed, a recent meta-analysis on nursery function uncovered only a dozen or so studies comparing among multiple habitats (coral reefs, mangroves, and/or seagrasses), and these failed to reveal any general patterns in terms of juvenile survival/predation risk associated with each (Lefcheck et al., 2019a). One potential explanation is that studies to date have rarely had temporal breadth to uncover such generalities, as longer time series may reduce natural variability enough to resolve differences among habitats in trophic processes.
The question of how consumption varies across tropical seascapes is timely, as both the habitats and the species they support are changing rapidly and might lead to substantial changes in ecosystem functioning. Caribbean marine ecosystems in particular have suffered declines in coral cover and structural complexity (Gardner et al., 2003; Alvarez-Filip et al., 2009), seagrass cover and density (Stallings, 2009), and mangrove forest extent (Wilson, 2017). Concurrently, herbivorous, omnivorous, and predatory fishes have all declined in abundance, biomass, and diversity in the Caribbean (Paddack et al., 2009; Stallings, 2009), leaving them less able to control macroalgal accumulation on coral reefs (Rasher et al., 2013; Adam et al., 2015; Lefcheck et al., 2019b). Establishing a strong baseline for consumption throughout the region is a critical step in evaluating change, including recovery. Belize, for example, has recently banned the harvest of parrotfishes and surgeonfishes, leading to a recovery in parrotfish abundance and consequent reductions in macroalgae and increases in coral cover (Mumby et al., 2021).
To better understand how the intensity of consumption by herbivores and predators varies with habitat, over time, and with fish assemblage across a Caribbean seascape, we deployed standard assays of macrophyte and dried squid consumption annually over five consecutive years (2015–2019) across seventeen sites and five habitats around Carrie Bow Cay, Belize, including fore reef, patch reef, mangrove, seagrass, and sand. Additionally, we conducted visual surveys of fish communities annually in habitats to quantify fish biomass and diversity and, in 2017, used video analysis at a subset of habitats to directly identify the fish species responsible for consumption. Our primary goal was to establish a baseline of relative consumption, and further we expected that—as in previous studies (e.g., Hay, 1984; Duffy et al., 2015)—consumption would be highest on highly structured reefs and lowest on unstructured sand flats, and that most consumption would be attributable to a small number of consumer species (Adam et al., 2015).
Materials and Methods
Study Sites
We conducted consumption assays at sites off the coast of Belize surrounding the Smithsonian Institution’s field station at Carrie Bow Cay (Figure 1 and Supplementary Table 1). We chose 3–4 representative sites in each of: fore reef, patch reef, mangrove, sand, and seagrass habitats. Sites within each habitat were selected to be as similar to one another as possible, taking into account areal extent, sessile species cover, and depth. Lagoonal patch reef sites are distinguished from fore reef sites by having generally lower wave energy, higher turbidity (Koltes and Opishinski, 2009), and smaller areal extent. Patch reefs were leeward of the fore reef sites and approximately 3 m shallower in depth.
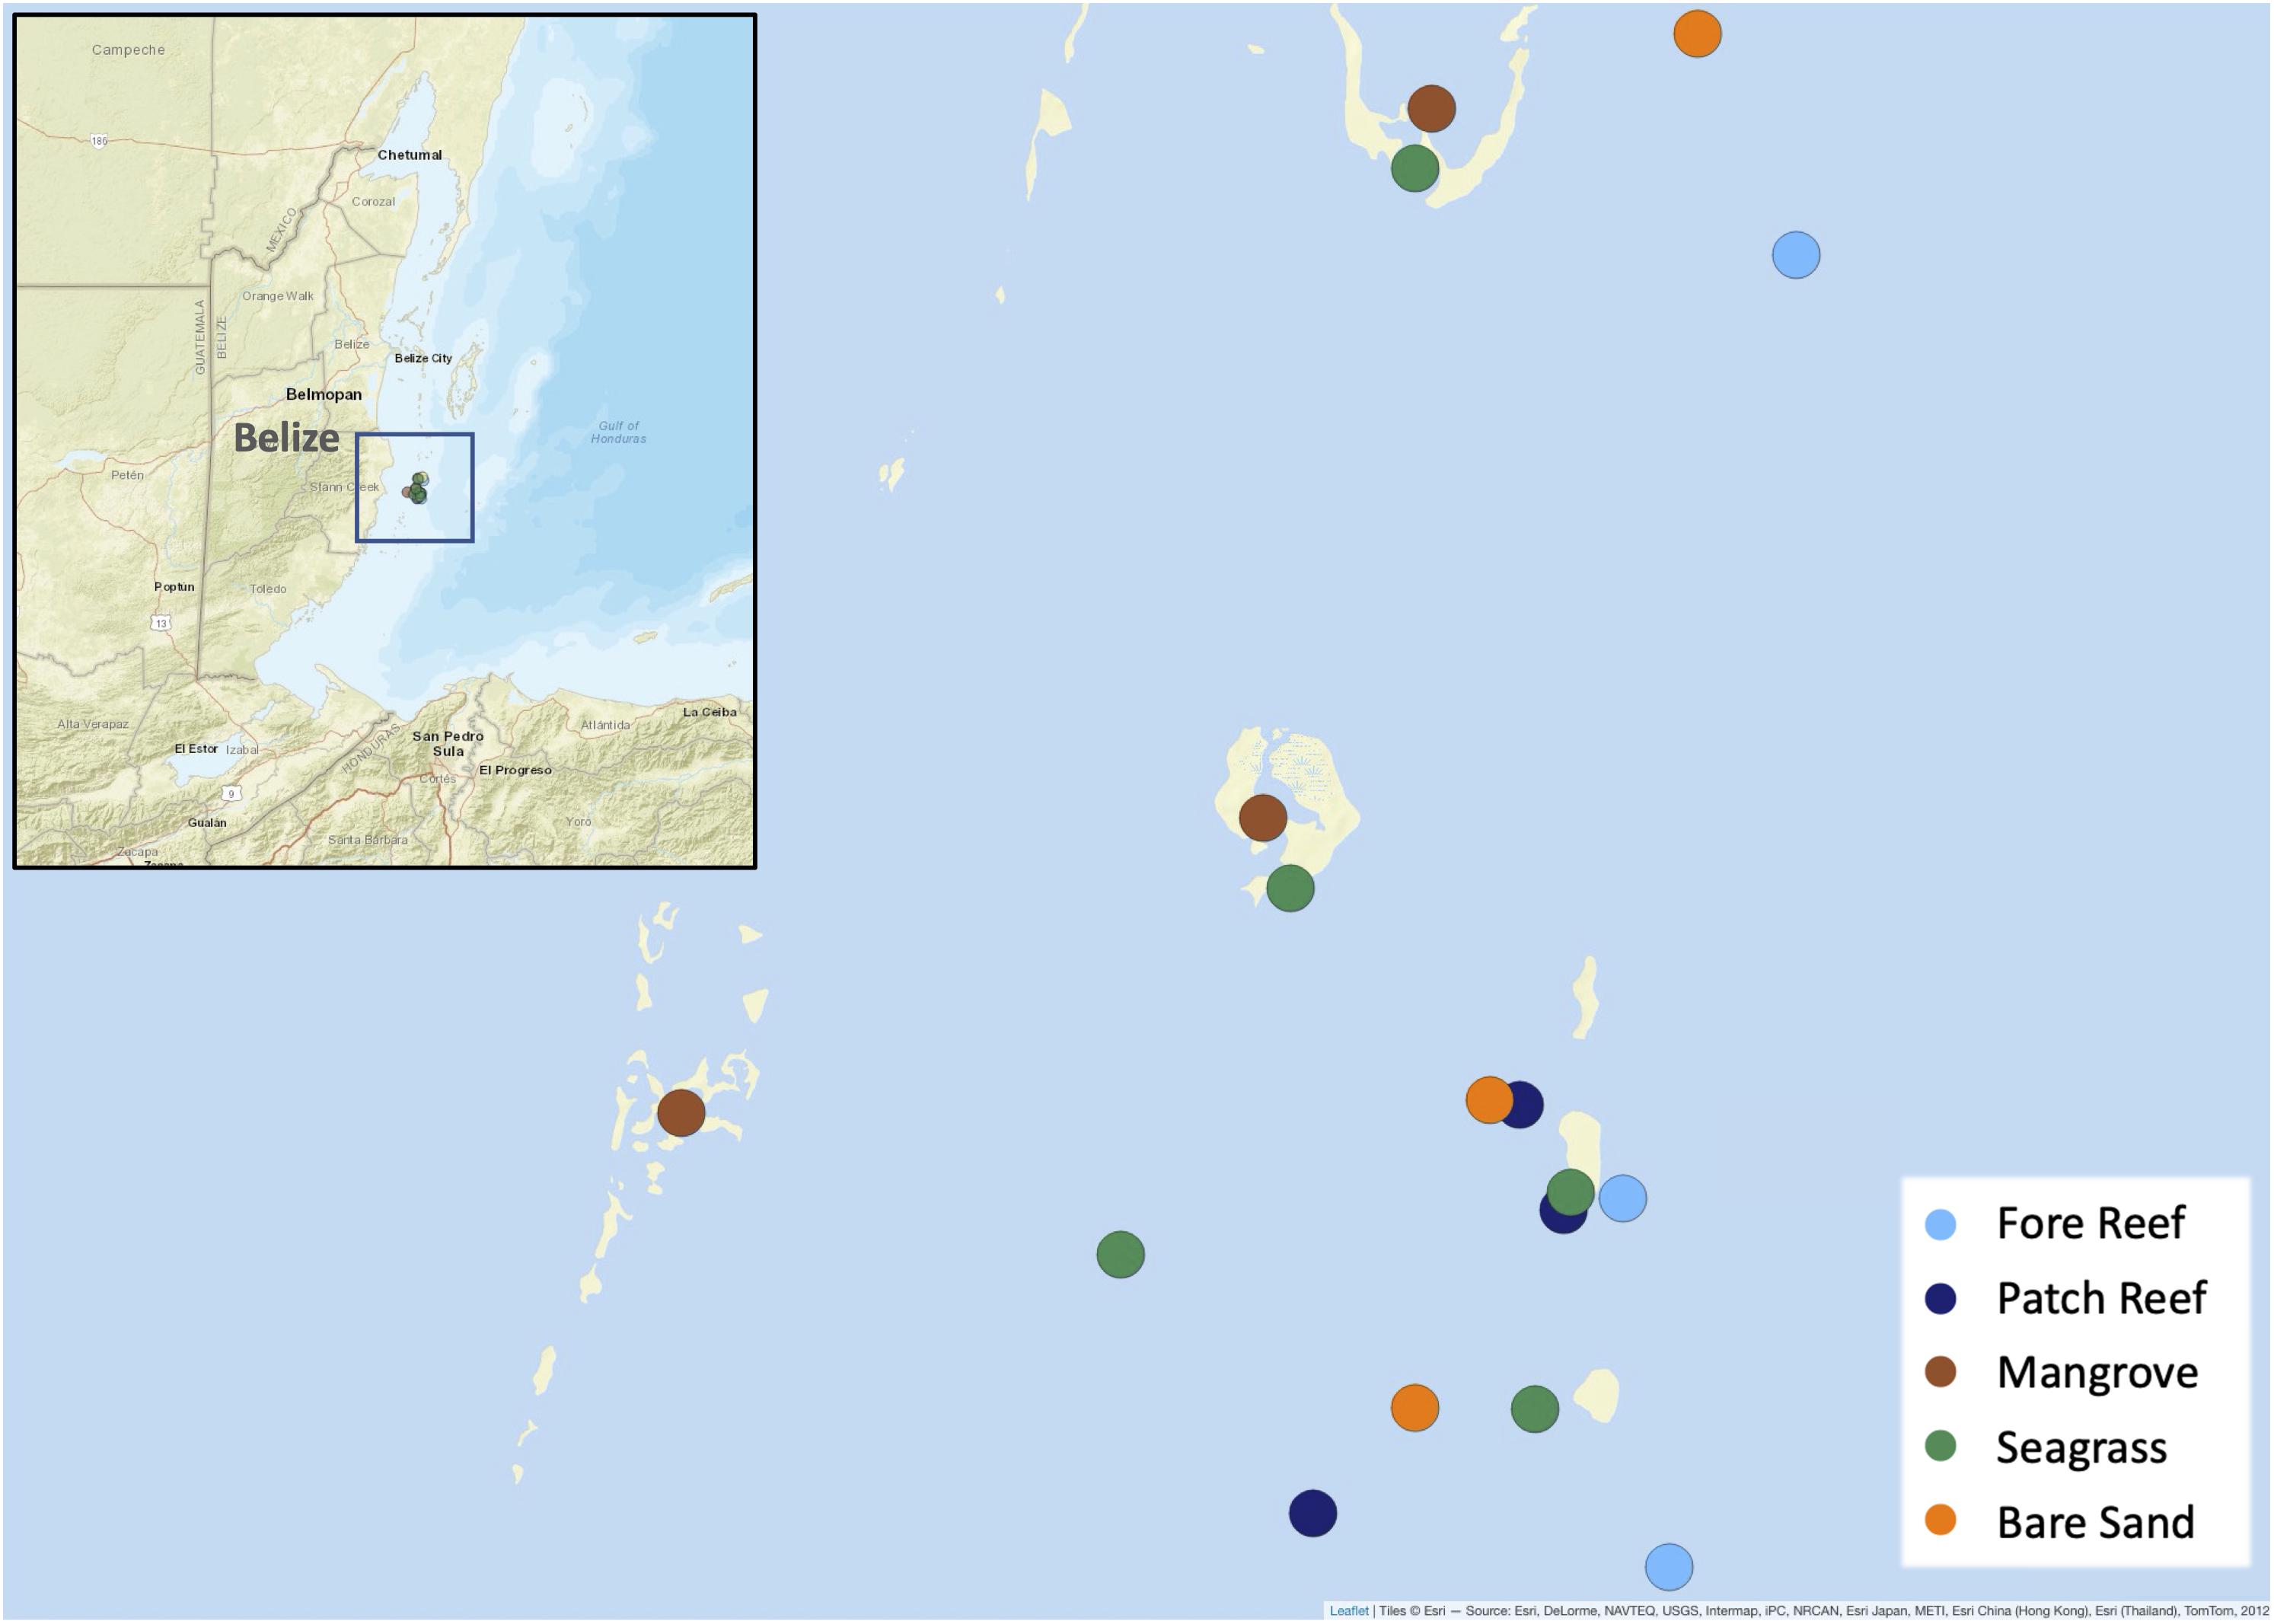
Figure 1. Map of all Carrie Bow Cay sites off the coast of Belize.
Predation Assays (Squidpops)
We quantified relative prey consumption by mid-level generalist carnivores using the “squidpop” method, offering dried squid as a standard prey item (Duffy et al., 2015). This method has been used successfully in the past to examine spatial and temporal variation in consumer pressure (Rodemann and Brandl, 2017; Gauff et al., 2018), and has the advantage of using a single standard bait type consistently across all habitats and years. To craft a squidpop, whole dried squid mantle was cut into 1.3 cm diameter discs of 1–2 mm width, and each disc was attached to a 60 cm garden stake using a 1 cm length of monofilament, which was fixed to the stake with electrical tape. Twenty to twenty-five squidpops were deployed at each location, near the weedpops (see next section). Squidpop stakes were planted vertically into soft substrate 2 m apart along a single 50 m transect and scored for presence or absence of squid at 1 and 24 h.
Herbivory Assays (Weedpops)
To quantify relative herbivory rates, we constructed “weedpops” by selecting a set of local macrophytes and weaving a 4–5 cm portion of each into a braided nylon rope, which was then deployed on the reef following established protocol (Hay, 1981). We used five common macrophytes known to vary in palatability and defenses against grazers (Paul and Hay, 1986) representing different functional groups of macrophytes that are widely distributed across the world’s tropical reefs (Littler et al., 1983): a palatable red alga (Acanthophora spicifera), a common brown macroalga (Dictyota sp.), a calcareous green alga (Halimeda opuntia or Halimeda tuna), a tough brown alga (Sargassum histrix), and the most locally common seagrass (Thalassia testudinum). This selection offers a range in toughness, appearance, palatability, growth form, chemical and structural defenses, and nutrient content, and includes algal species previously used in similar choice assays (Hay, 1981; Lewis, 1985; Paul and Hay, 1986). The natural form of these five distinct macrophytes was preserved when cutting them to similarly sized pieces, which were then inserted in random positions along a single braided nylon rope and gently looped into the braid to secure them in place.
Weedpops were deployed vertically with a weight attached to the bottom of the rope and a small float attached to the top, and were spaced approximately 2 m apart along a single 50 m transect at each location in the fall (mid-September through early November) within a 2 week period of each year from 2015 to 2019 (Supplementary Table 1). Twenty-five weedpops were deployed in 2015, and twenty were deployed each year from 2016 to 2019. After 1 and 24 h, each weedpop was scored for the presence or absence of each macrophyte species to obtain the overall proportion of each macrophyte lost in each habitat.
Video Capture of Consumption Assays
In 2017, we deployed video cameras to record the identity and numbers of consumers visiting the baits. At each site, we positioned a GoPro (Hero 3 +, San Mateo, CA, United States) such that two squidpops or weedpops were visible in the frame (n = 10 videos in total) and recorded 1 h of video footage. Weedpops were filmed at three sites each in fore reef and patch reef habitats. Squidpops were filmed at three sites each in fore reef, patch reef, mangrove, and seagrass habitats (Supplementary Table 1). Filming habitats were chosen based upon higher levels of consumption activity observed in previous years of the survey.
Each video period began after divers placed the squidpops or weedpops in view of the camera and left the scene, minimizing human interference. A single observer scored all videos by watching the footage and recording each “bite event.” Because fish occasionally mouthed the bait without consuming it, or immediately rejected it, we defined a bite event as the visually apparent removal and ingestion of some portion of the bait. For squidpops, a bite event was defined as the total removal of the bait from the stake, as all observed consumption events removed the bait in one piece. For each observed bite, we recorded the species of fish, the species of macrophyte (for weedpops), and the time elapsed after the start of the video.
Fish Assemblage Surveys
At each site from 2015 to 2019, during the same 2-week period that assays were deployed, fish community composition and size structure were assessed using a visual census following the Reef Life Survey method (Edgar and Stuart-Smith, 2014). SCUBA divers surveyed one 50 m x 10 m transect at each site, identifying, counting, and visually estimating the total length (categorized into size classes) of each fish observed within the transect. Visual reach of surveyors varied by habitat but was consistently greater than 5 m (range 5–35 m) for all habitats except for the mangrove fringe. Because of limited visibility (6 m on average) in the mangroves and because divers were unable to swim through the center of a mangrove forest, the mangrove sites were divided into two 50 m × 5 m transects along the prop root boundary, and fish were surveyed within the root-containing side of each transect. Fish lengths were converted to biomass using length-weight regression equations with coefficients sourced from Fishbase (Froese and Pauly, 2021), following methods described by Edgar et al. (2020), with length corrected for diver bias (Edgar et al., 2004).
Statistical Analysis
To test for differences in macrophyte consumption among habitats, we fit a generalized linear model (GLM) regressing the proportion of each macrophyte type lost (number lost out of total number of ropes) in a deployed set of weedpops at 1 and 24 h against year, habitat, macrophyte type, and the interactions between habitat and macrophyte type, and habitat and year, to test whether certain items were more heavily preferred in certain habitats, and if consumption pressure changed significantly between years (Table 1). We additionally modeled location as a fixed effect to account for any spatial autocorrelation. The GLM was fit to a quasibinomial distribution using a logit-link, and model assumptions were assessed visually. To determine the significance of our effects (with an experiment-wide α = 0.05), we applied Analysis of Deviance to the GLM using Type II Sums-of-Squares as implemented in the car package (Fox and Weisberg, 2019) in R version 4.0.3 (R Core Team., 2020). To test for differences in squidpop bait loss among habitats, we fit separate GLMs regressing the proportion bait lost at the 1 and 24 h time points against the interaction between habitat and year, with location as a fixed effect using a quasibinomial distribution due to observed variance substantially greater than the mean (Supplementary Table 2).
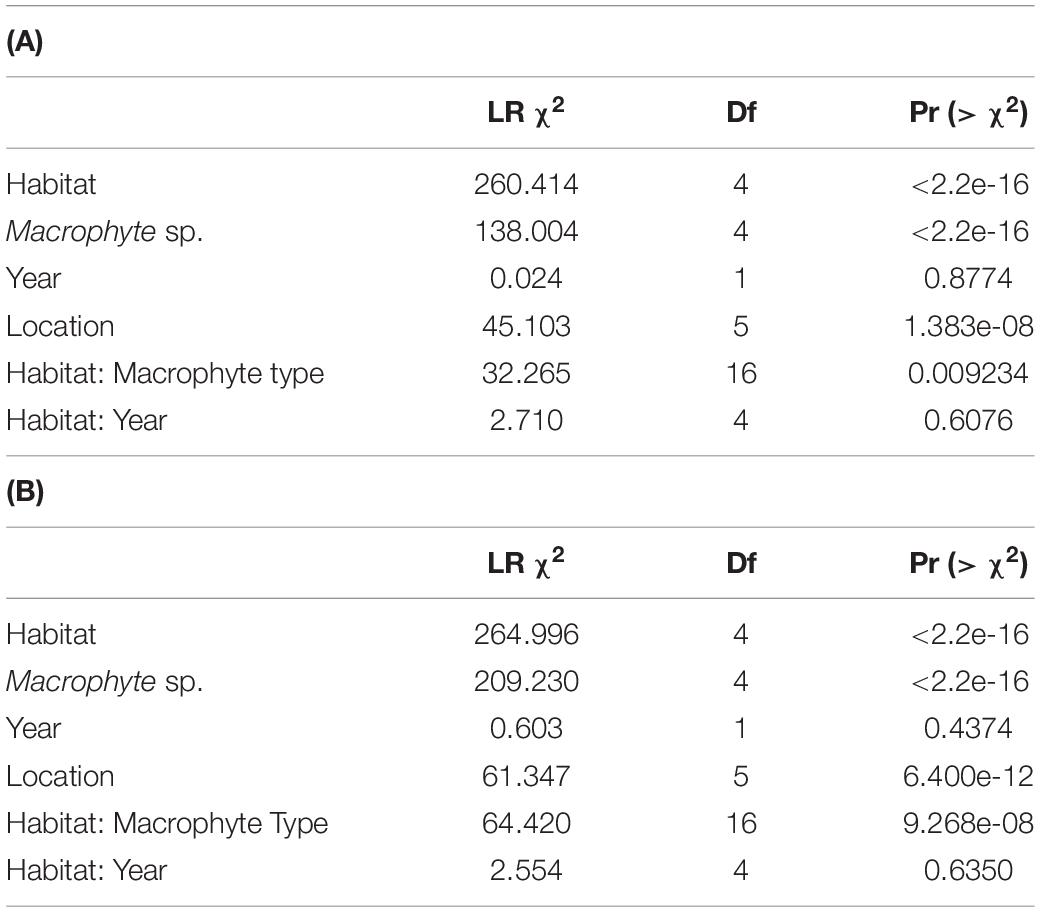
Table 1. Type II Analysis of Deviance predicting the proportion of macrophyte types lost after 1 h (A) and 24 h (B).
To analyze the weedpops video data, we fit a generalized linear mixed effects model (GLMM) of the log10-transformed number of bites per hour (bite rate) against the habitat type (fore vs. patch reef), macrophyte species, and their interaction, plus location as a fixed covariate, and camera as a varying-intercept random effect (Table 2). Fish species with fewer than five documented bites on any macrophyte across all videos were removed from the data set. As with the GLM, the model assumptions were assessed visually, and the significance of fixed effects was determined using Type II Analysis of Variance. We further calculated the marginal (fixed effects only) R2 using the piecewiseSEM package (Lefcheck, 2016).
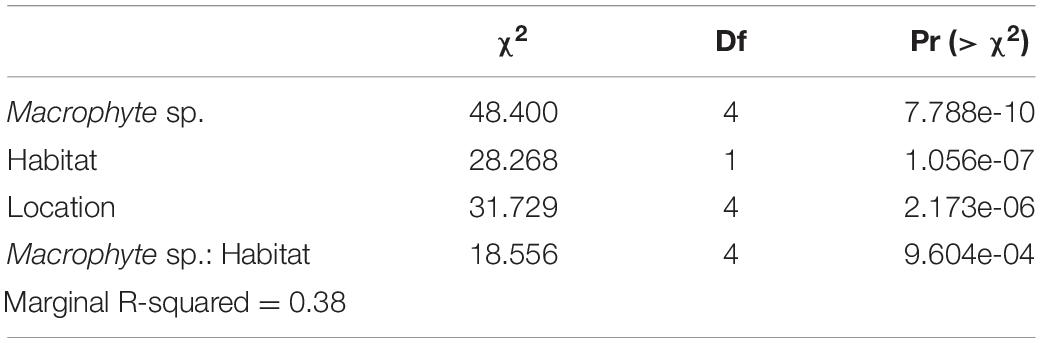
Table 2. Type II Analysis of Variance predicting the number of bites on the macrophyte types observed over a 1 h period using video assays.
To identify the key herbivore species responsible for the bites in the video assays, we conducted a redundancy analysis (RDA) using the vegan package (Oksanen et al., 2020), predicting the species-by-site matrix of total bites per hour from a presence-absence matrix of fish species.
To quantify temporal stability in proportion of bait lost across the habitat types, we calculated a coefficient of variation for each site by dividing the variance across all 5 years by the mean across all 5 years (n = 3 sites per habitat) (Supplementary Table 3 and Figure 2). For weedpops assays, we first calculated the mean loss of all algal types to arrive at a single mean macrophyte bait loss value for each site. Finally, we calculated a mean and standard error of the coefficient of variation for squid and macrophyte bait loss in each habitat. For both squidpops and weedpops, we conducted pairwise tests to determine significance of difference between habitats using the emmeans package (Lenth, 2020).
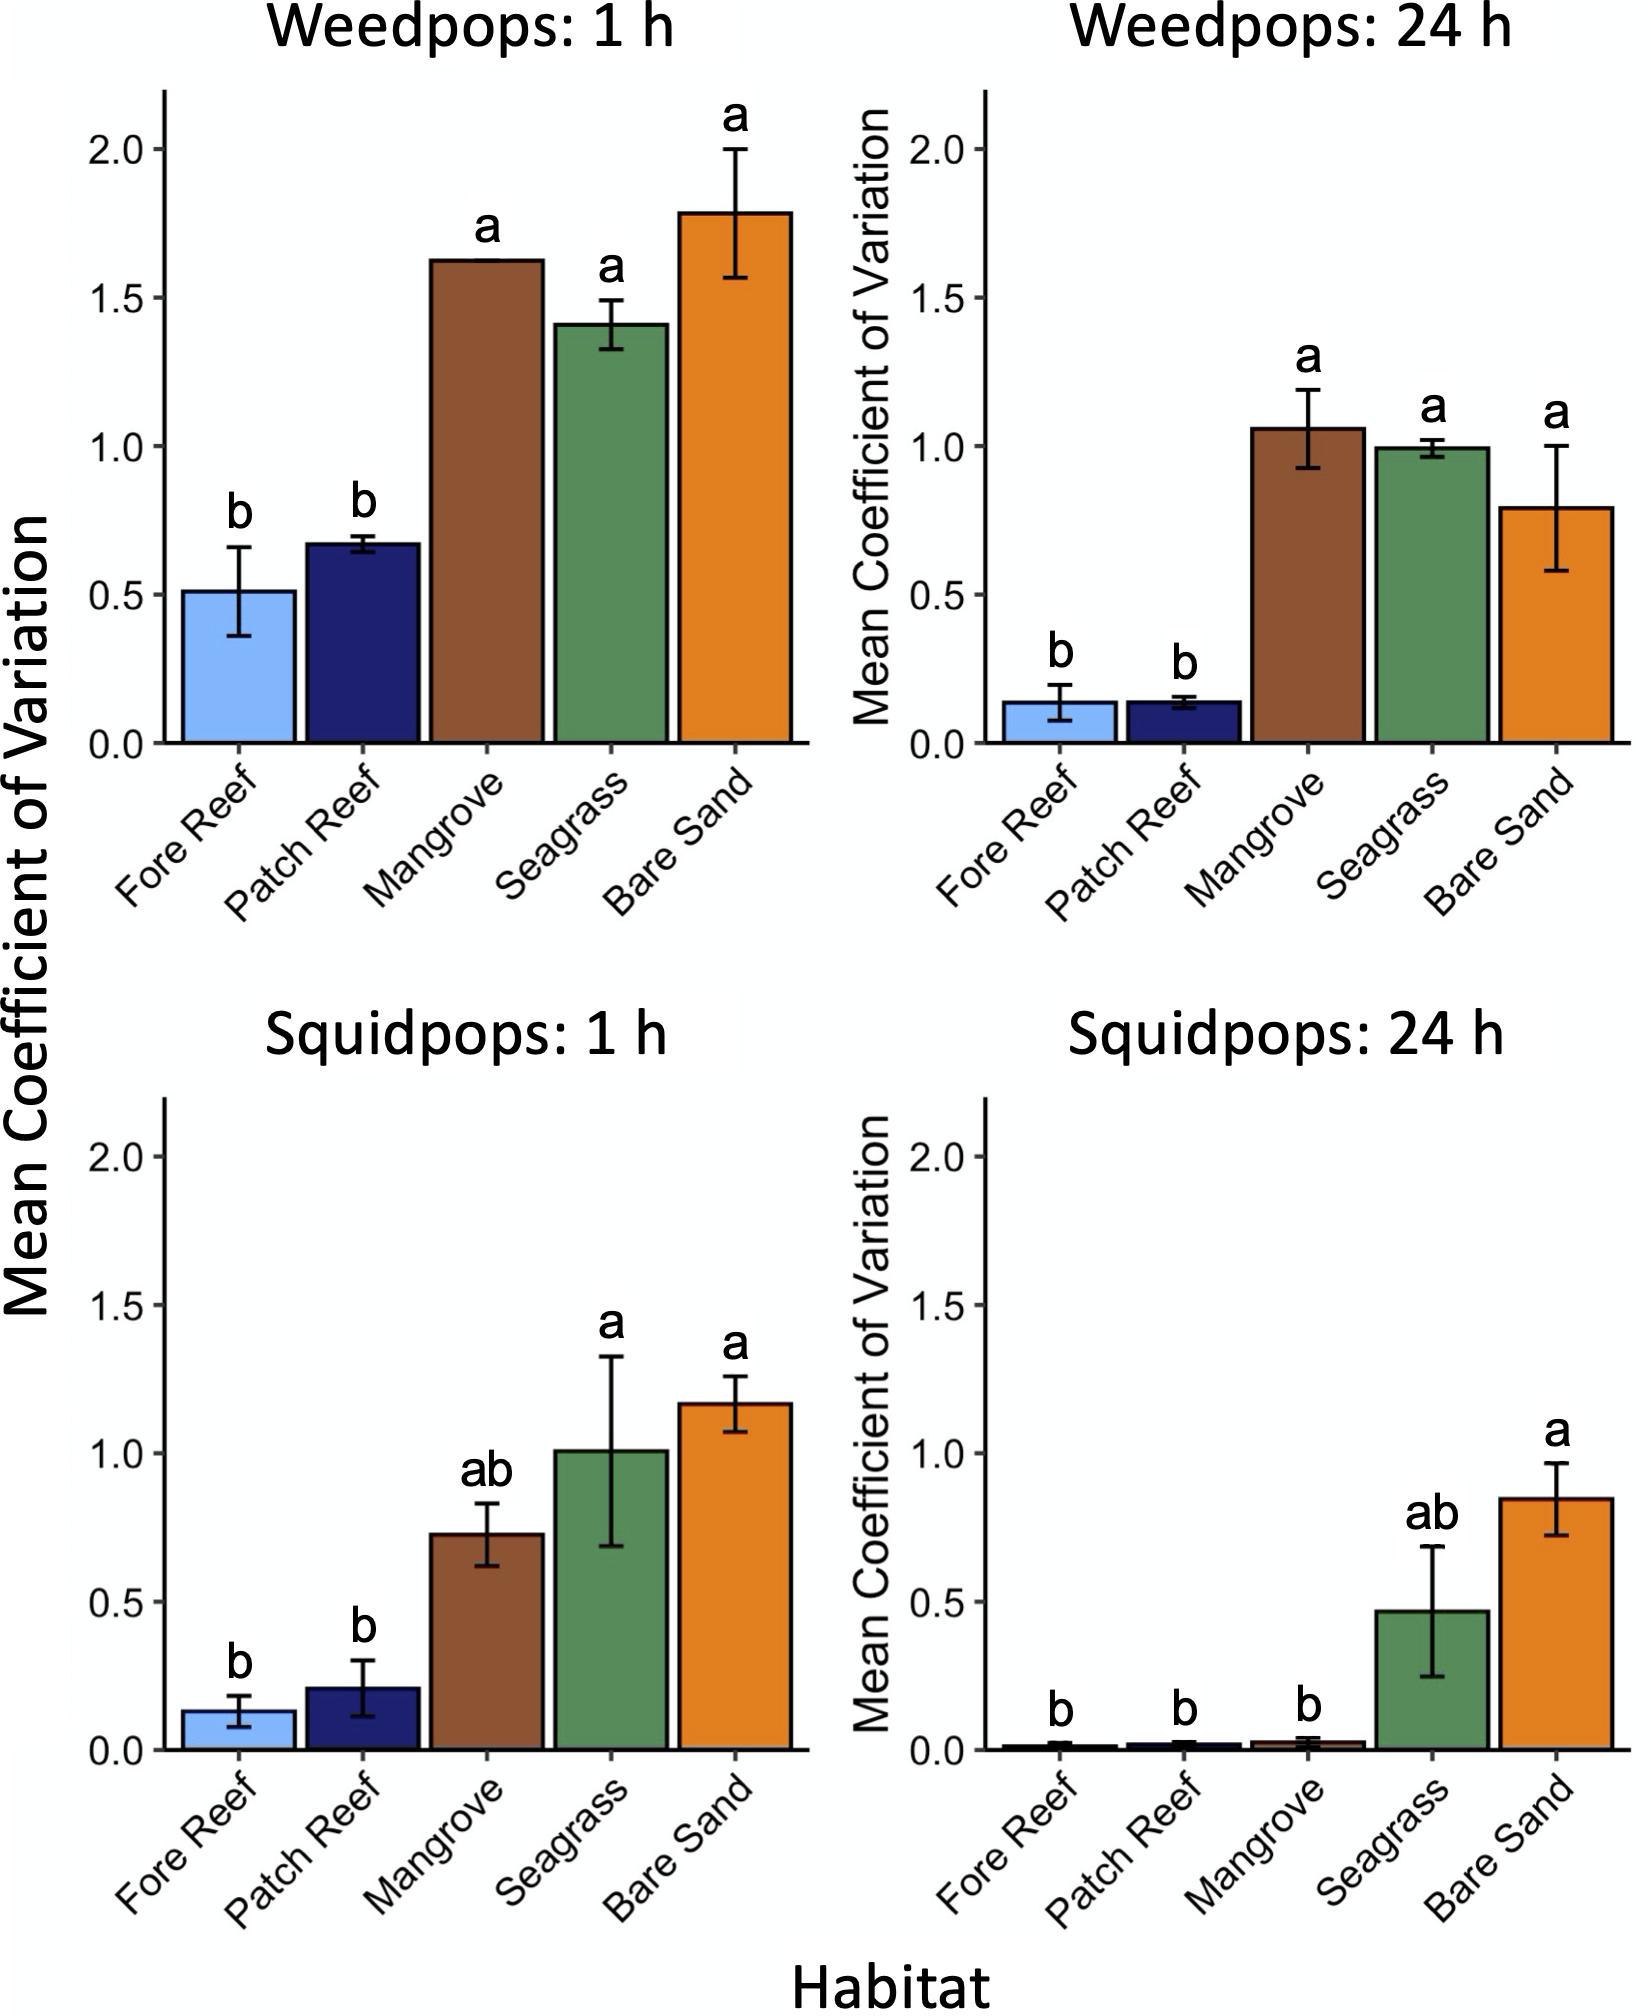
Figure 2. Mean coefficients of variation for sites (n = 3) within each habitat over 5 years (± 1 S.E.). Differing letters denote significant differences between values.
We tested for relationships between consumer biomass and bait loss after 24 h for both squid and macrophyte baits using a series of GLMs fit with quasibinomial distributions (Supplementary Tables 4, 5). Each GLM included year, habitat, location, and fish biomass as fixed covariates, allowing for an interaction between habitat and fish biomass. For squidpops, the biomass terms included all fish in the first model, only carnivores, invertivores, and omnivores in the second model, and only key families identified as key consumers in video assays (Lutjanidae, Haemulidae, and Labridae) in the third model. For weedpops, the biomass terms included all fish in the first model, only herbivorous and omnivorous taxa in the second model, and only key families identified as key consumers in video assays (Acanthuridae and Scaridae) in the third model. The same was done to test for a relationship between log10-transformed biomass of dominant herbivore families (Acanthuridae and Scaridae) from the surveys and macrophyte loss across weedpop deployments in fore reef and patch reef habitats, without the location fixed covariate, and with an added interaction between habitat and macrophyte species (Table 3). We calculated significance of effects within each of these models using a Type II ANOVA.
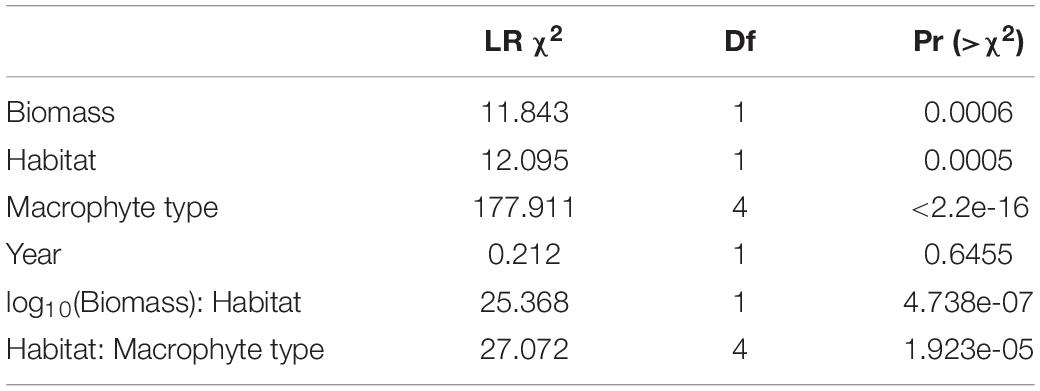
Table 3. Type II Analysis of Deviance comparing the effects of habitat type (patch reef vs. fore reef), macrophyte type, key macrophyte consumer (Acanthuridae and Scaridae) biomass (log10-transformed), and year on the proportion of macrophyte types lost after 24 h.
All data and R code necessary to reproduce the analyses are included in Supplementary Material and at 10.25573/serc.16744585.
Results
Consumption Across Time and Space
Loss of both squid bait and macrophytes varied among habitats with consistent trends through time, being generally highest in structured reef habitats and lowest in unstructured sand (Figures 2–4 and Supplementary Figure 2). The consistency through time was corroborated by a non-significant effect of year in our GLM analysis of macrophytes (P = 0.88 and P = 0.44 for 1 and 24 h; Table 1). An exception was the near total loss of squid in sand habitats in 2017 after 24 h, leading to a significant effect of year in our GLM (P < 0.01, Supplementary Table 2). However, squid consumption returned to pre-2017 levels in the following 2 years and consumption in other habitats remained consistent through time (Figure 4). Macrophyte consumption varied significantly among habitats after 24 h (P < 0.001) and was consistently highest in the structured habitats of fore and patch reefs (mean% lost ± 1 SD = 45 ± 5% and 56 ± 6%), lower in seagrasses (8 ± 5%) and mangroves (5 ± 4%), and minimal (< 2%) in bare sand. There was also a clear preference for certain macrophytes after 24 h, with Acanthophora being the most preferred (46 ± 5% consumed, on average), followed by the seagrass Thalassia (35 ± 5%), Dictyota (19 ± 5%), and Sargassum (17 ± 5%), and Halimeda was rarely consumed (4 ± 3%) (Figure 3). Similarly, squid baits were consumed the most in more structured habitats, with 94% or greater average loss of squid after 24 h on reefs and in mangroves in all years (Figure 4).
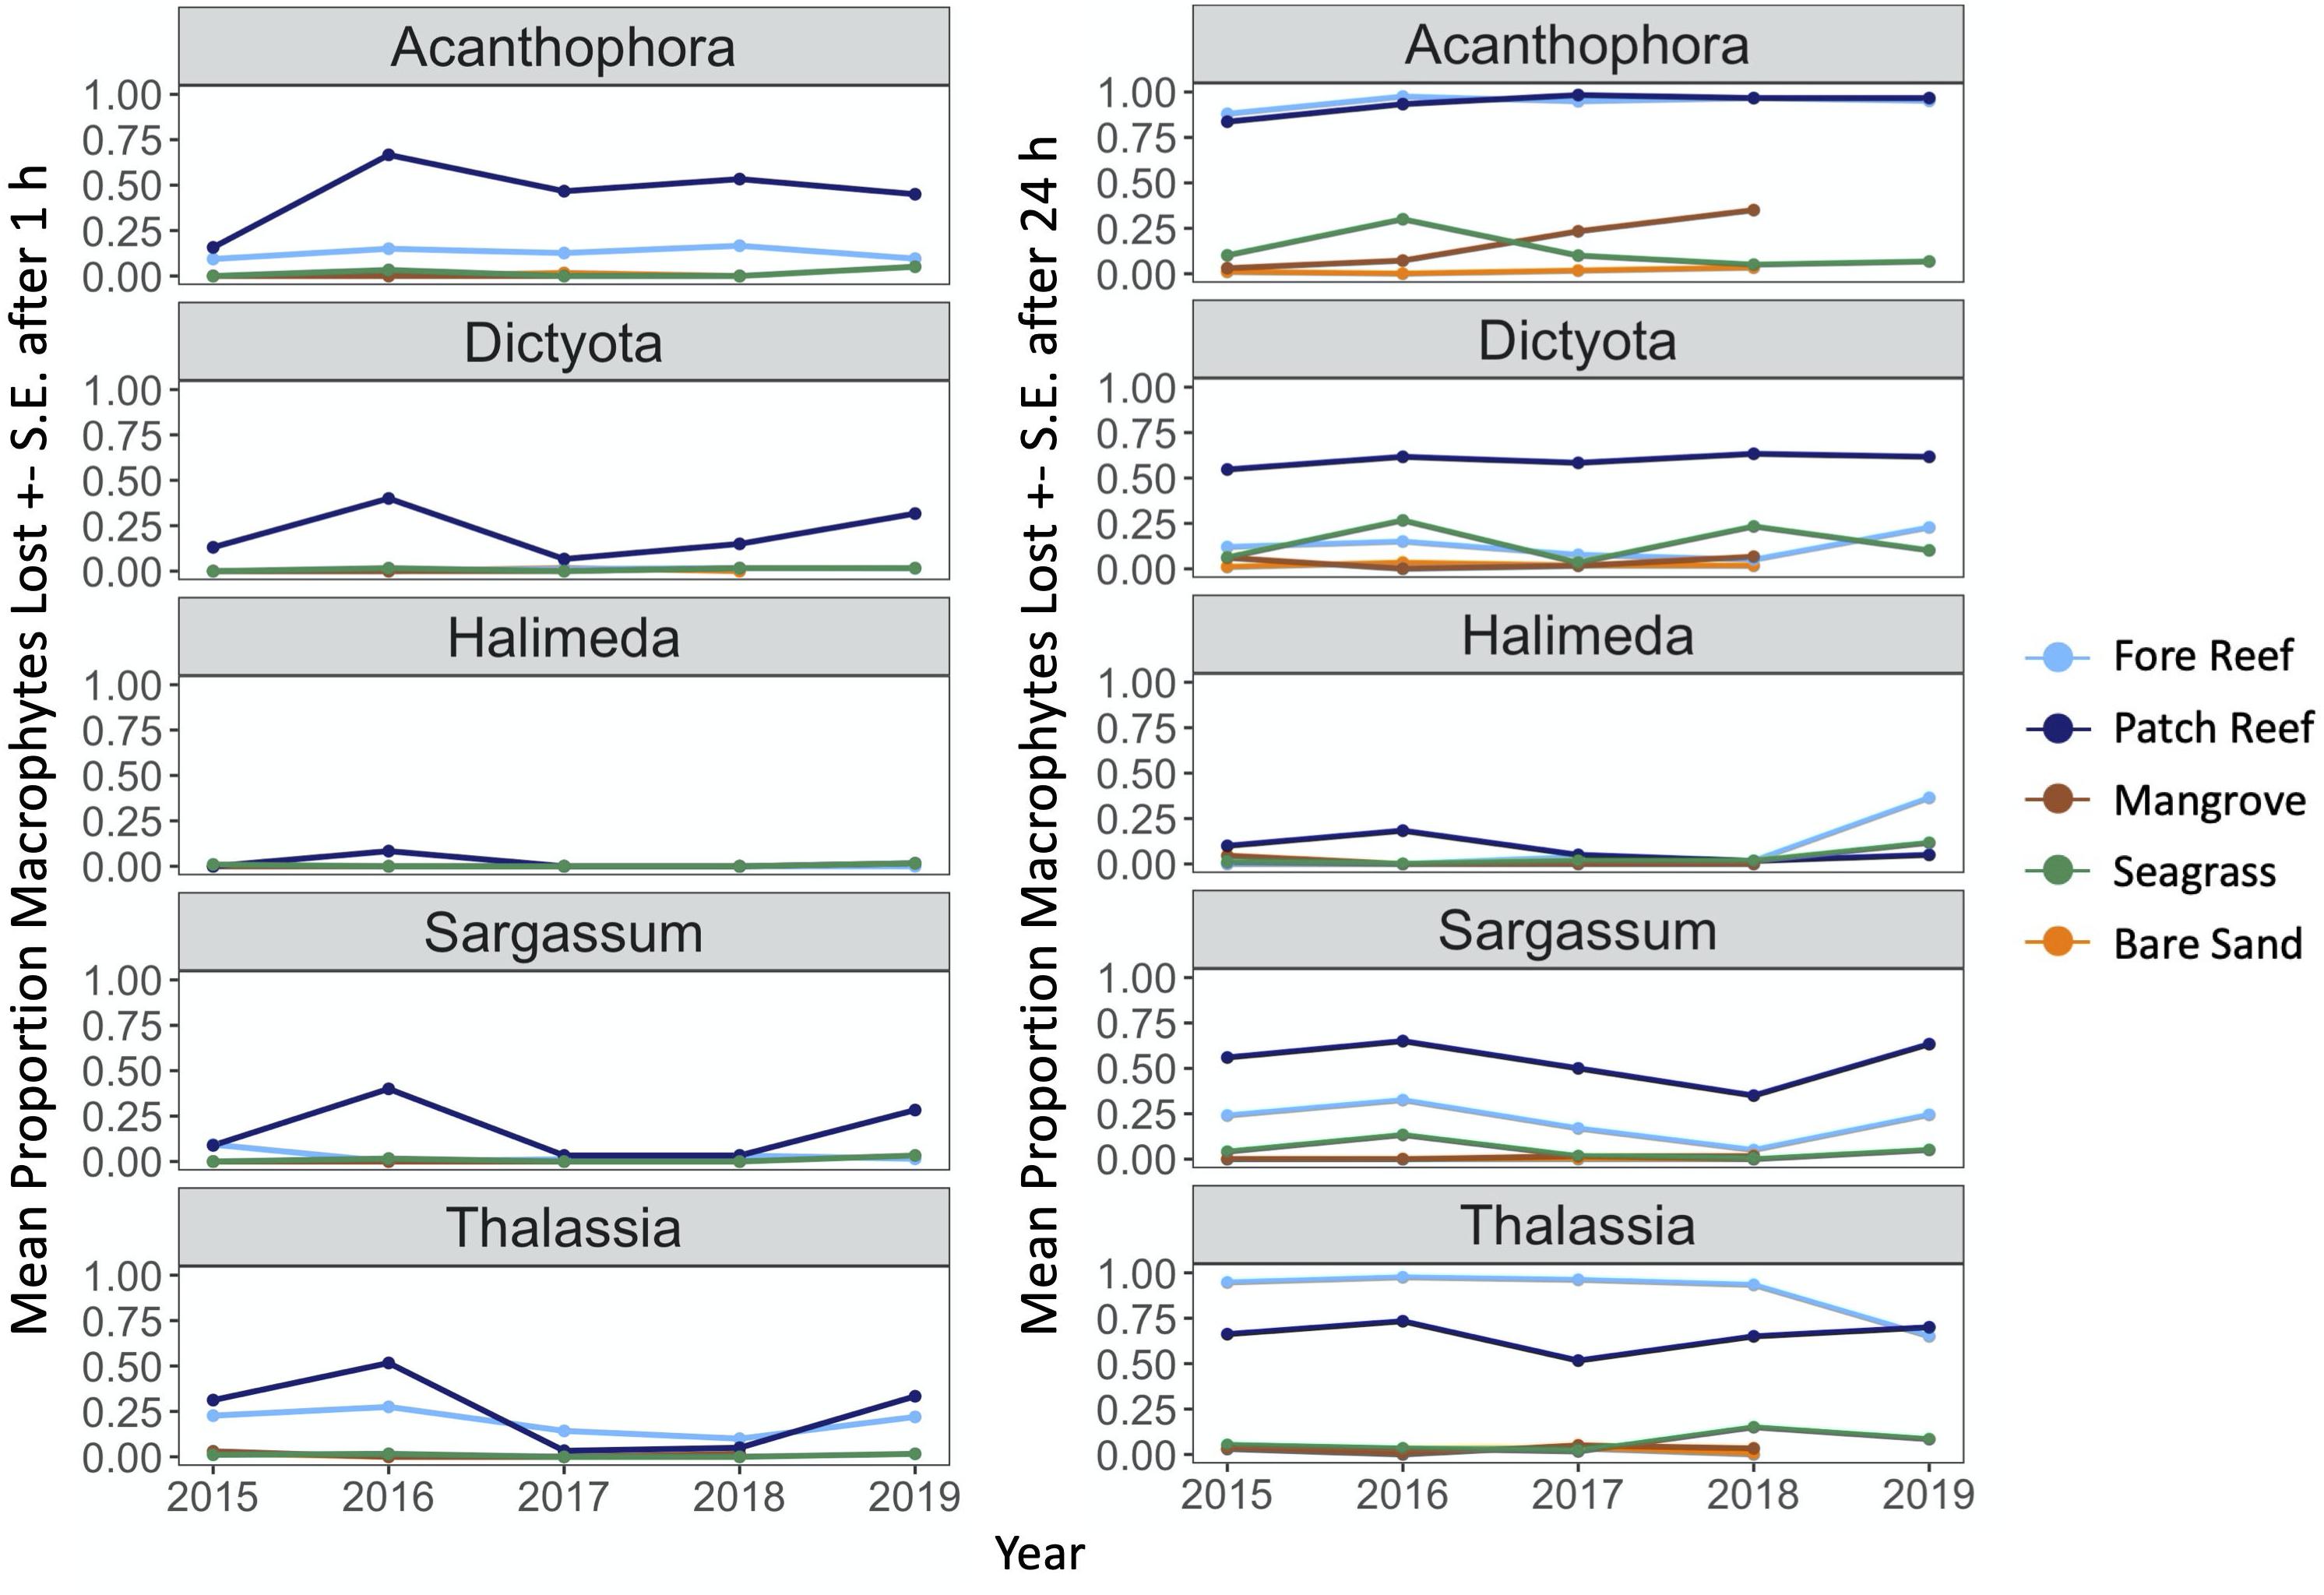
Figure 3. Mean proportion of each macrophyte type consumed after 1 and 24 h (± 1 S.E.) across each year of the study, parsed by macrophyte type and habitat.
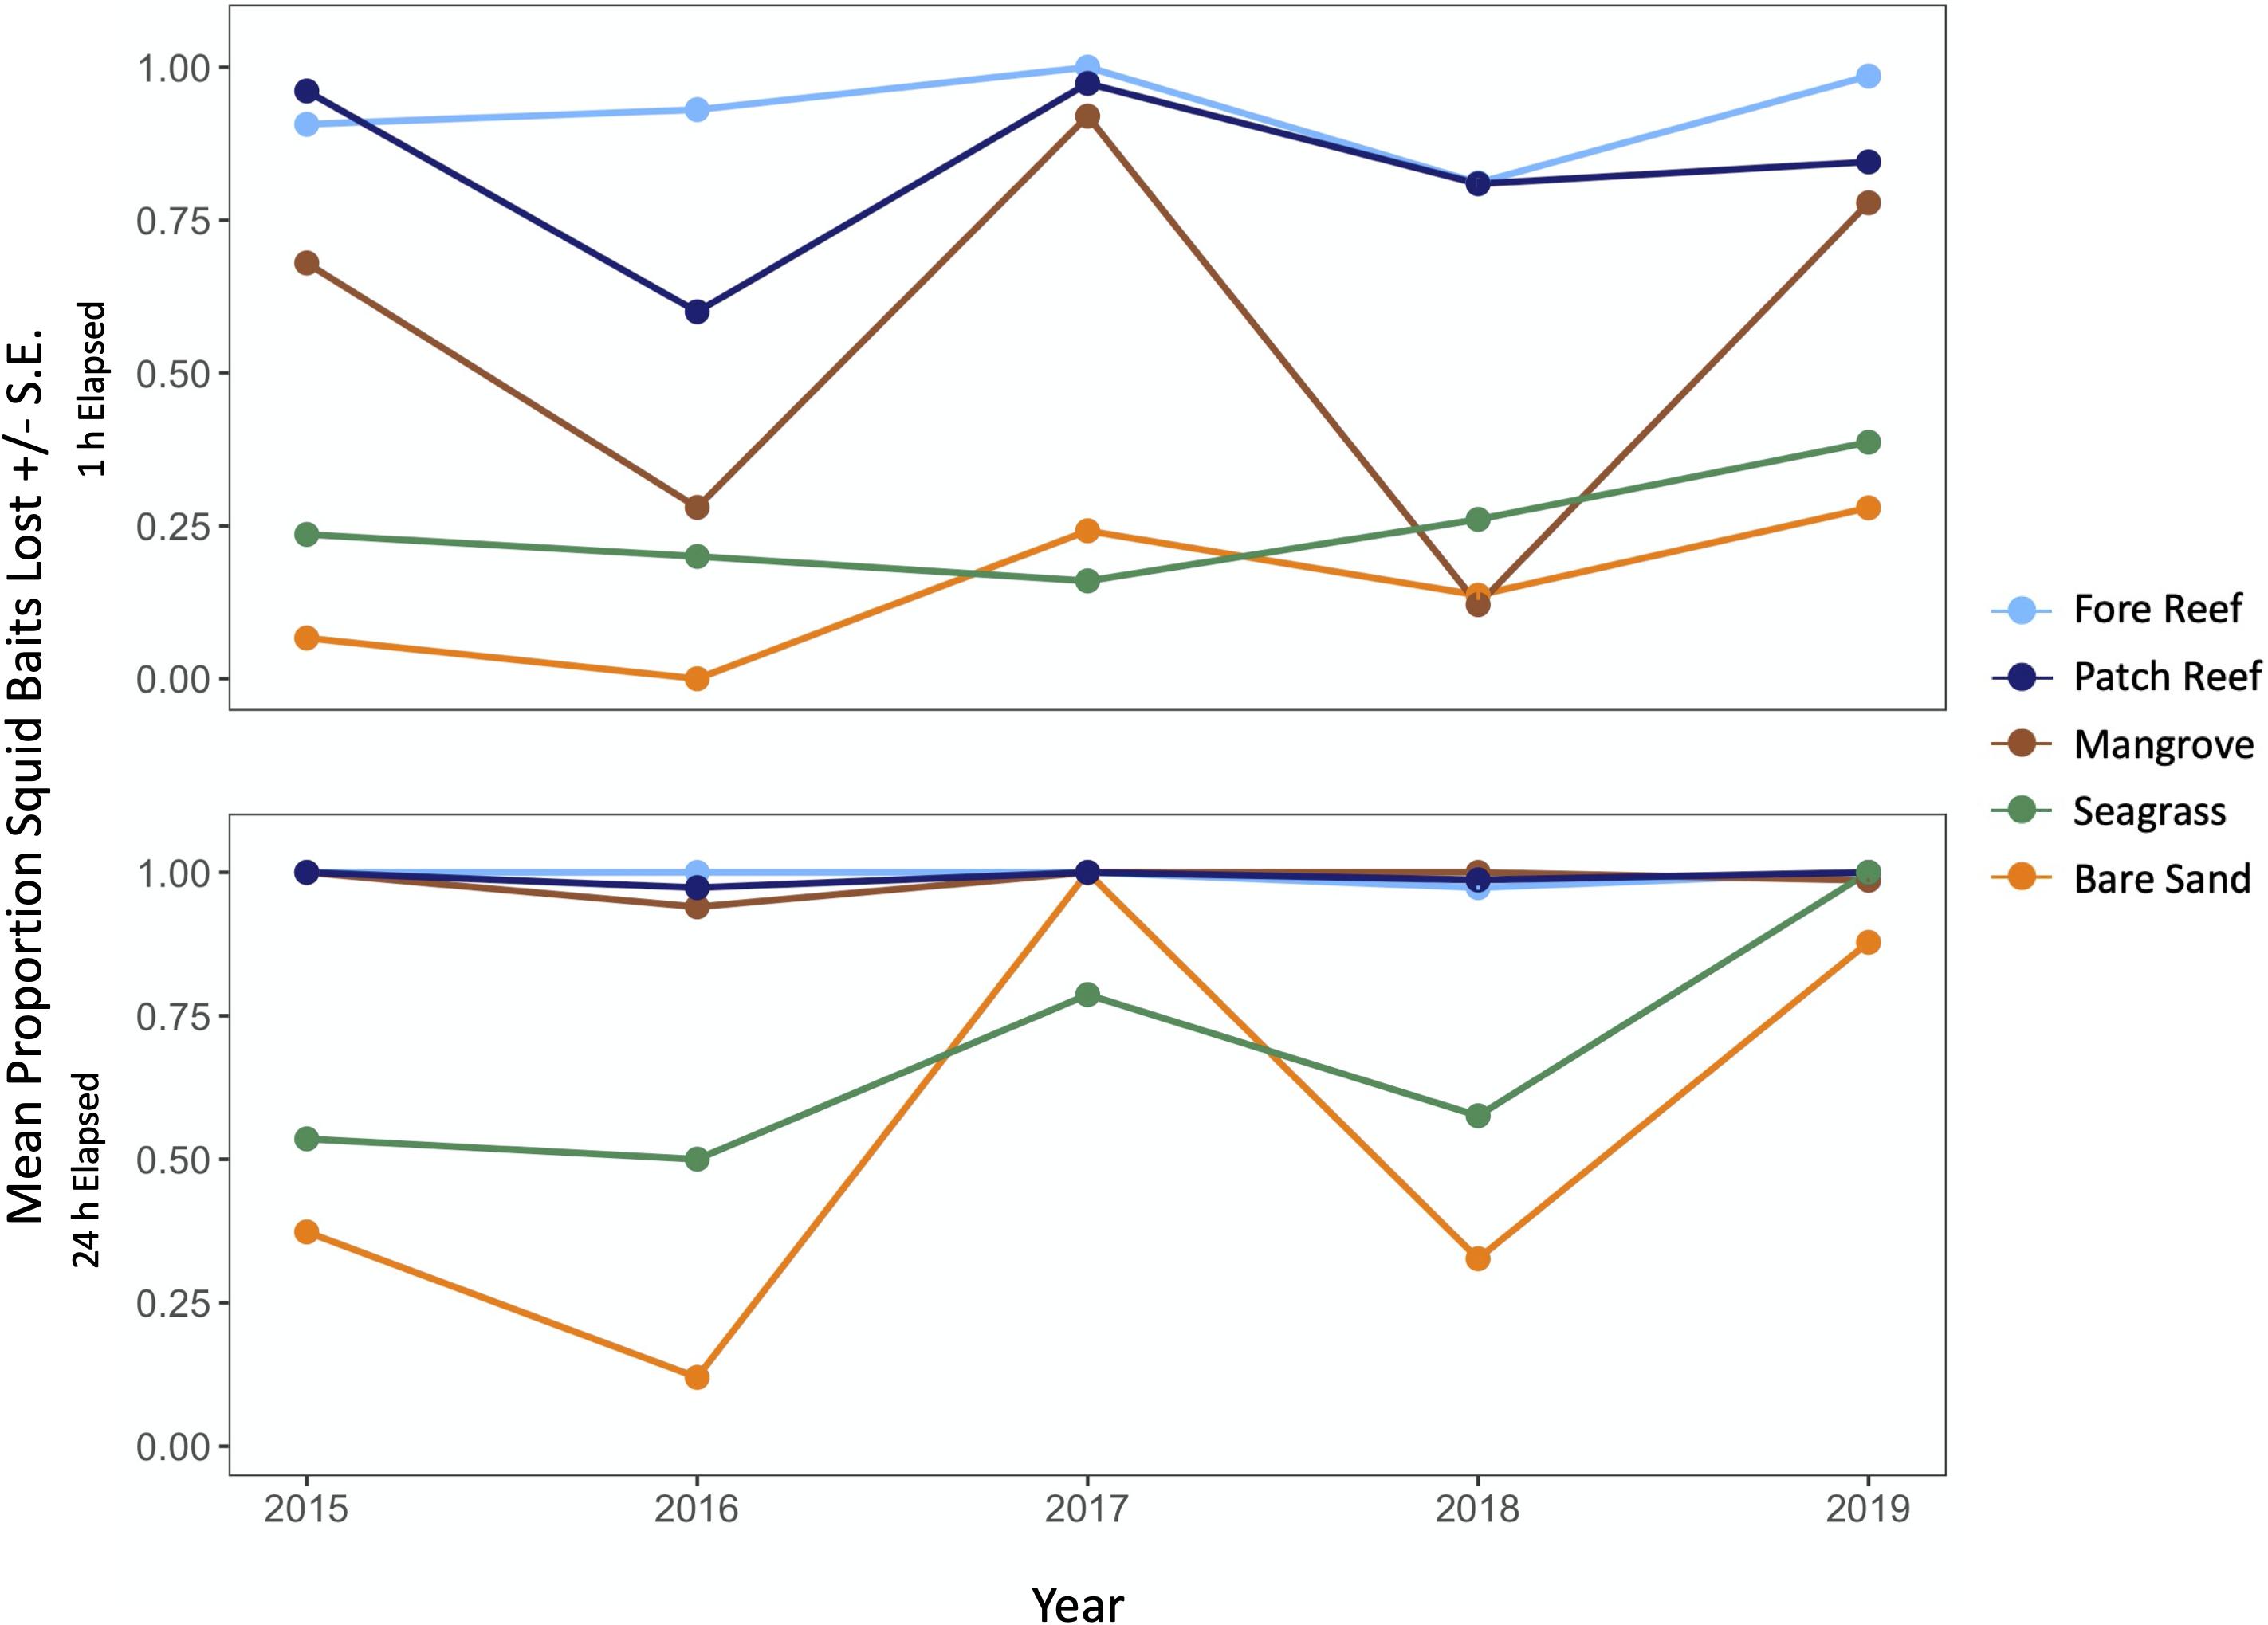
Figure 4. Mean proportion of squid baits consumed after 1 and 24 h (± 1 S.E.) across each year of the study, parsed by habitat.
Video Assays of Herbivory
One-hour video observations of the macrophyte assays in 2017 generally corroborated the patterns of macrophyte loss in the 1 and 24 h macrophyte assays, showing that grazing differed among fore reef and patch reef habitats and with a preference for Acanthophora, Dictyota, and Sargassum. Thalassia was grazed at a similar but slow rate in patch and fore reef habitats, and consumption rates of all macrophytes varied by both habitat and macrophyte type (interactive P < 0.001, Table 2): Dictyota, Halimeda, and particularly Sargassum were all grazed at significantly higher rates on the patch reef than on the fore reef (Figure 5).
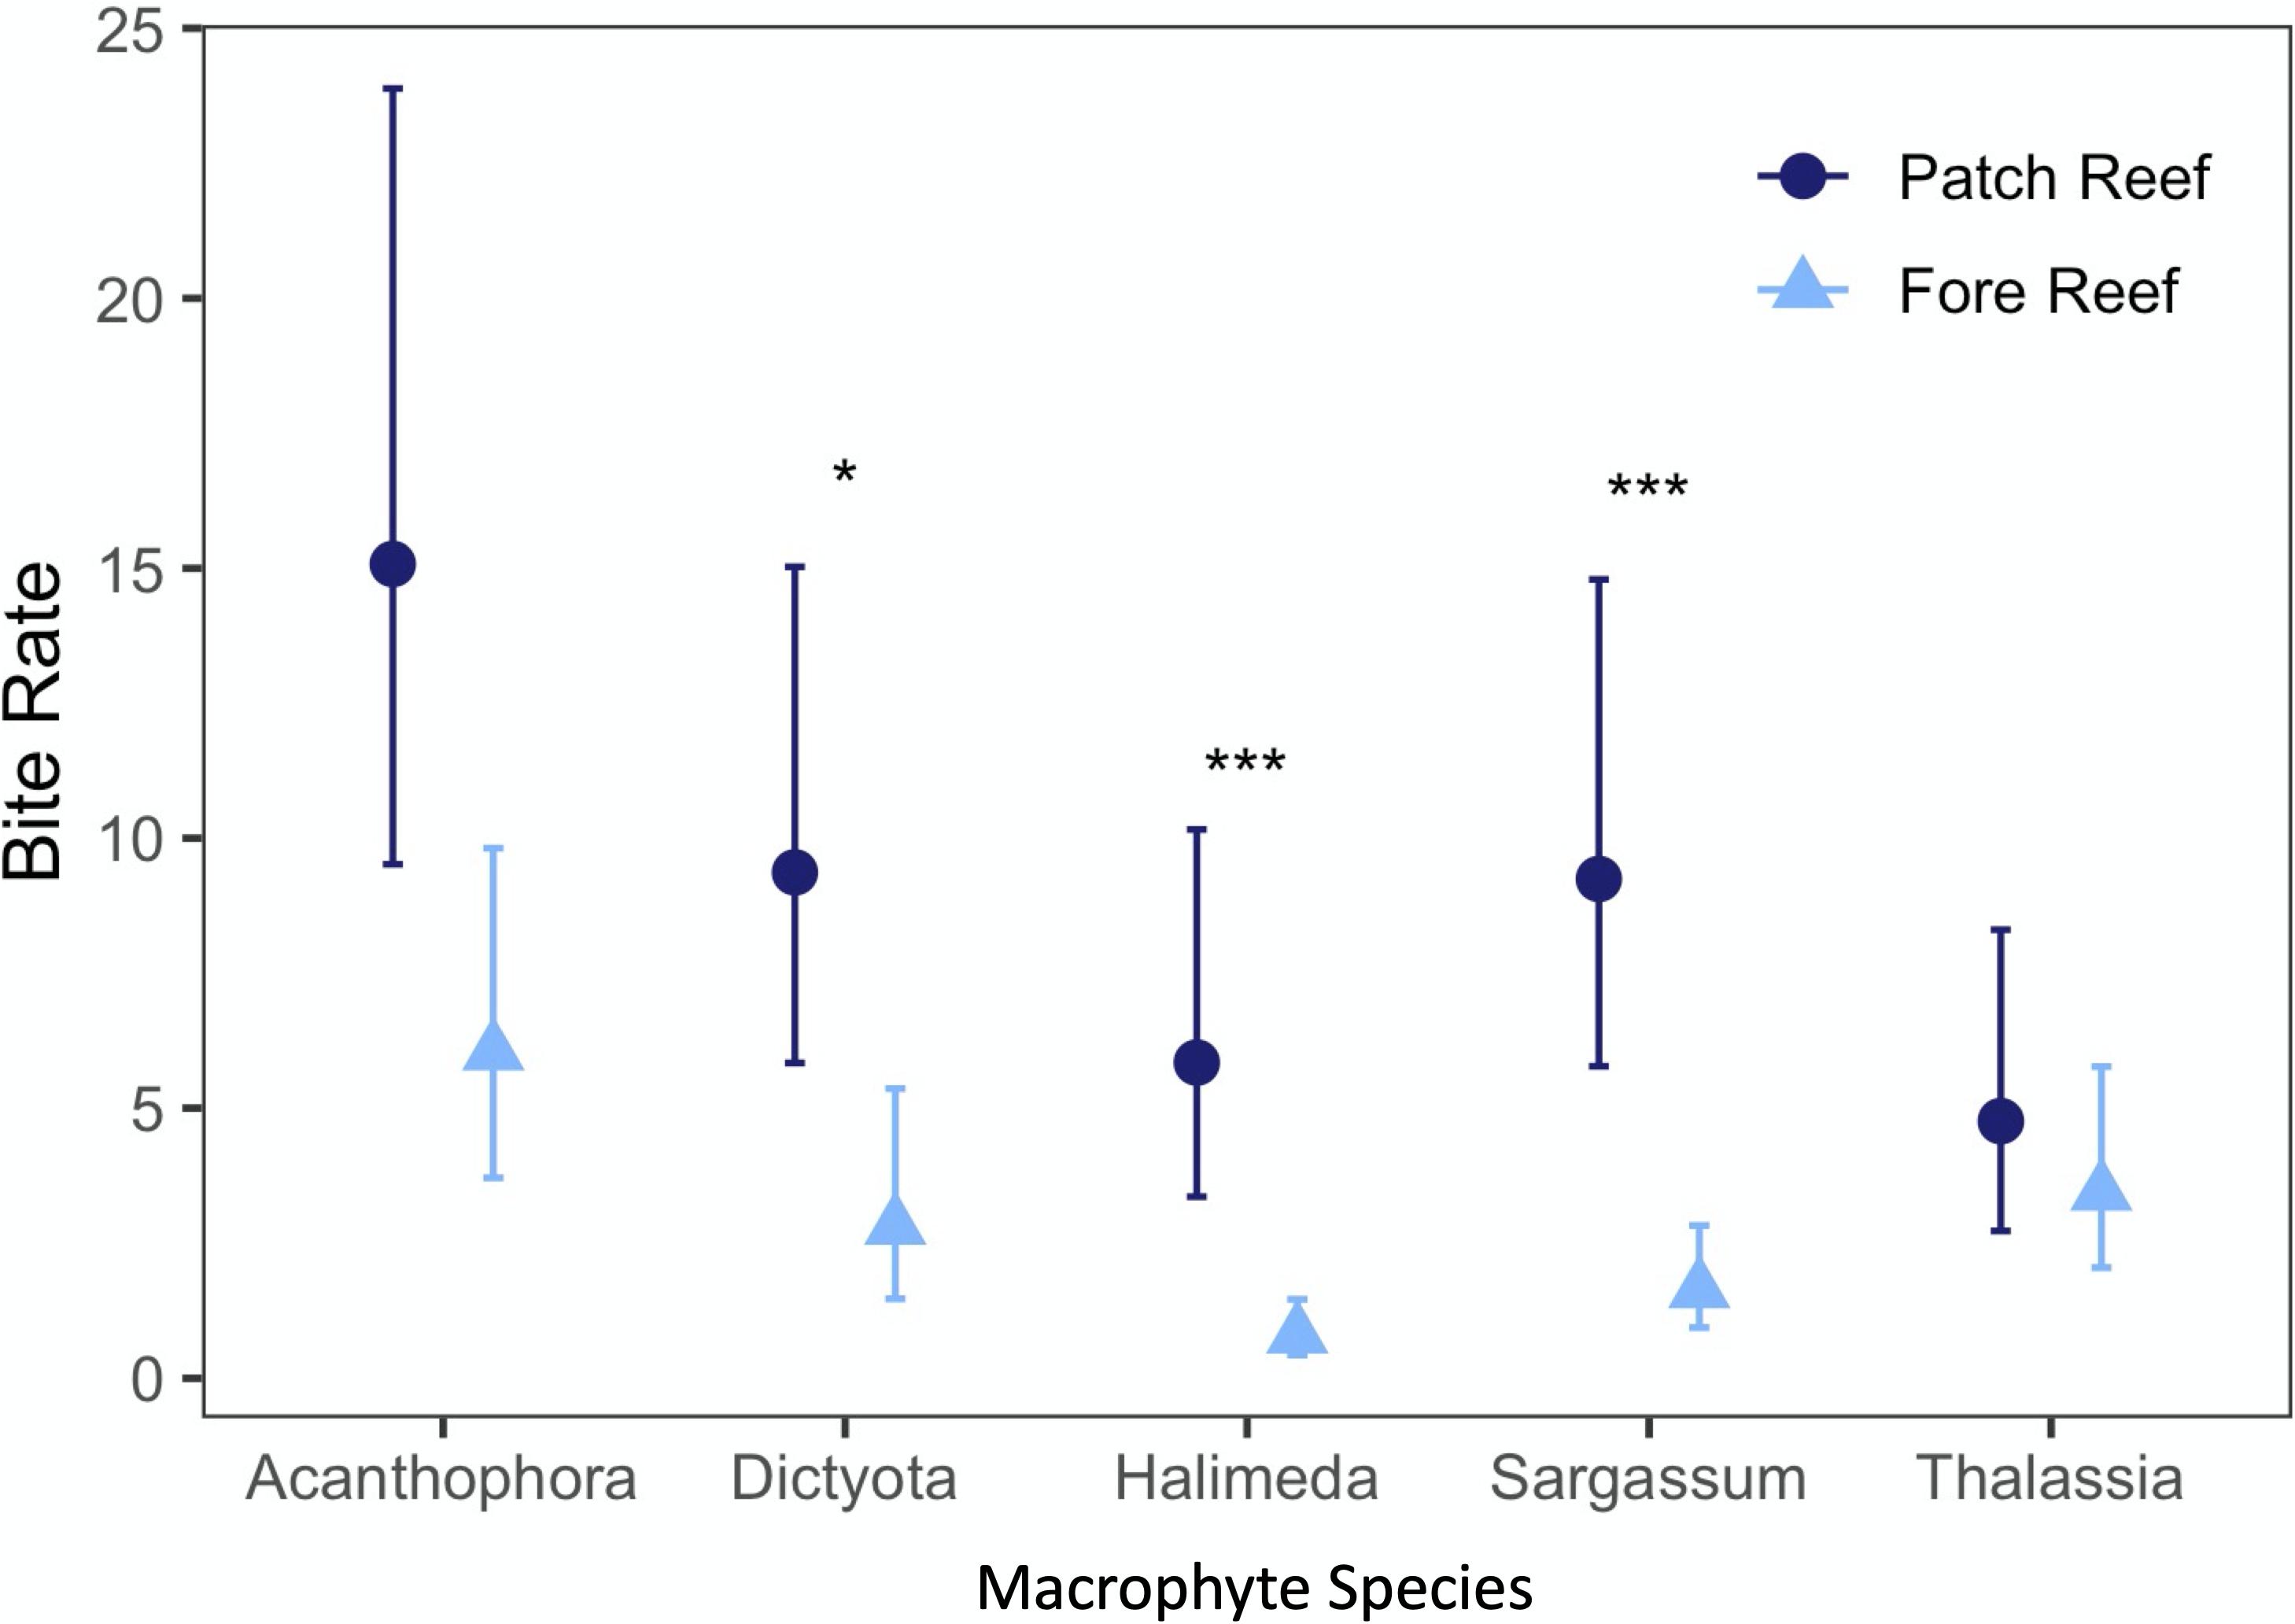
Figure 5. Differences in bites per hour by location during a 1-h video survey in 2017 on patch and fore reef sites. Asterisks denote significance in pairwise contrasts conducted post hoc (* = < 0.05, *** = < 0.001).
In the weedpop video assays, eight fish species were observed consuming macrophytes in fore reef habitats, while 14 species were observed feeding on them in patch reefs, and the dominant herbivores varied by both macrophyte type and habitat. These species were previously identified in diver visual surveys over all 5 years of the study period (Supplementary Figure 3B). Because the videos had a limited viewing window and fish would often pass in and out of frame while interacting with the assays, we could not differentiate between individual fish and potentially new consumers of the same species. Surgeonfishes (Acanthurus spp.) were the dominant grazers of Acanthophora in fore reef habitats. Sparisoma aurofrenatum was the dominant herbivore on patch reefs, consuming Sargassum and to a lesser extent Dictyota (Figure 6). Supporting Figure 6, our redundancy analysis (Supplementary Figure 4) also shows strong resource partitioning of the macrophytes among both habitats and herbivore species (F14 = 2.913, P = 0.003).
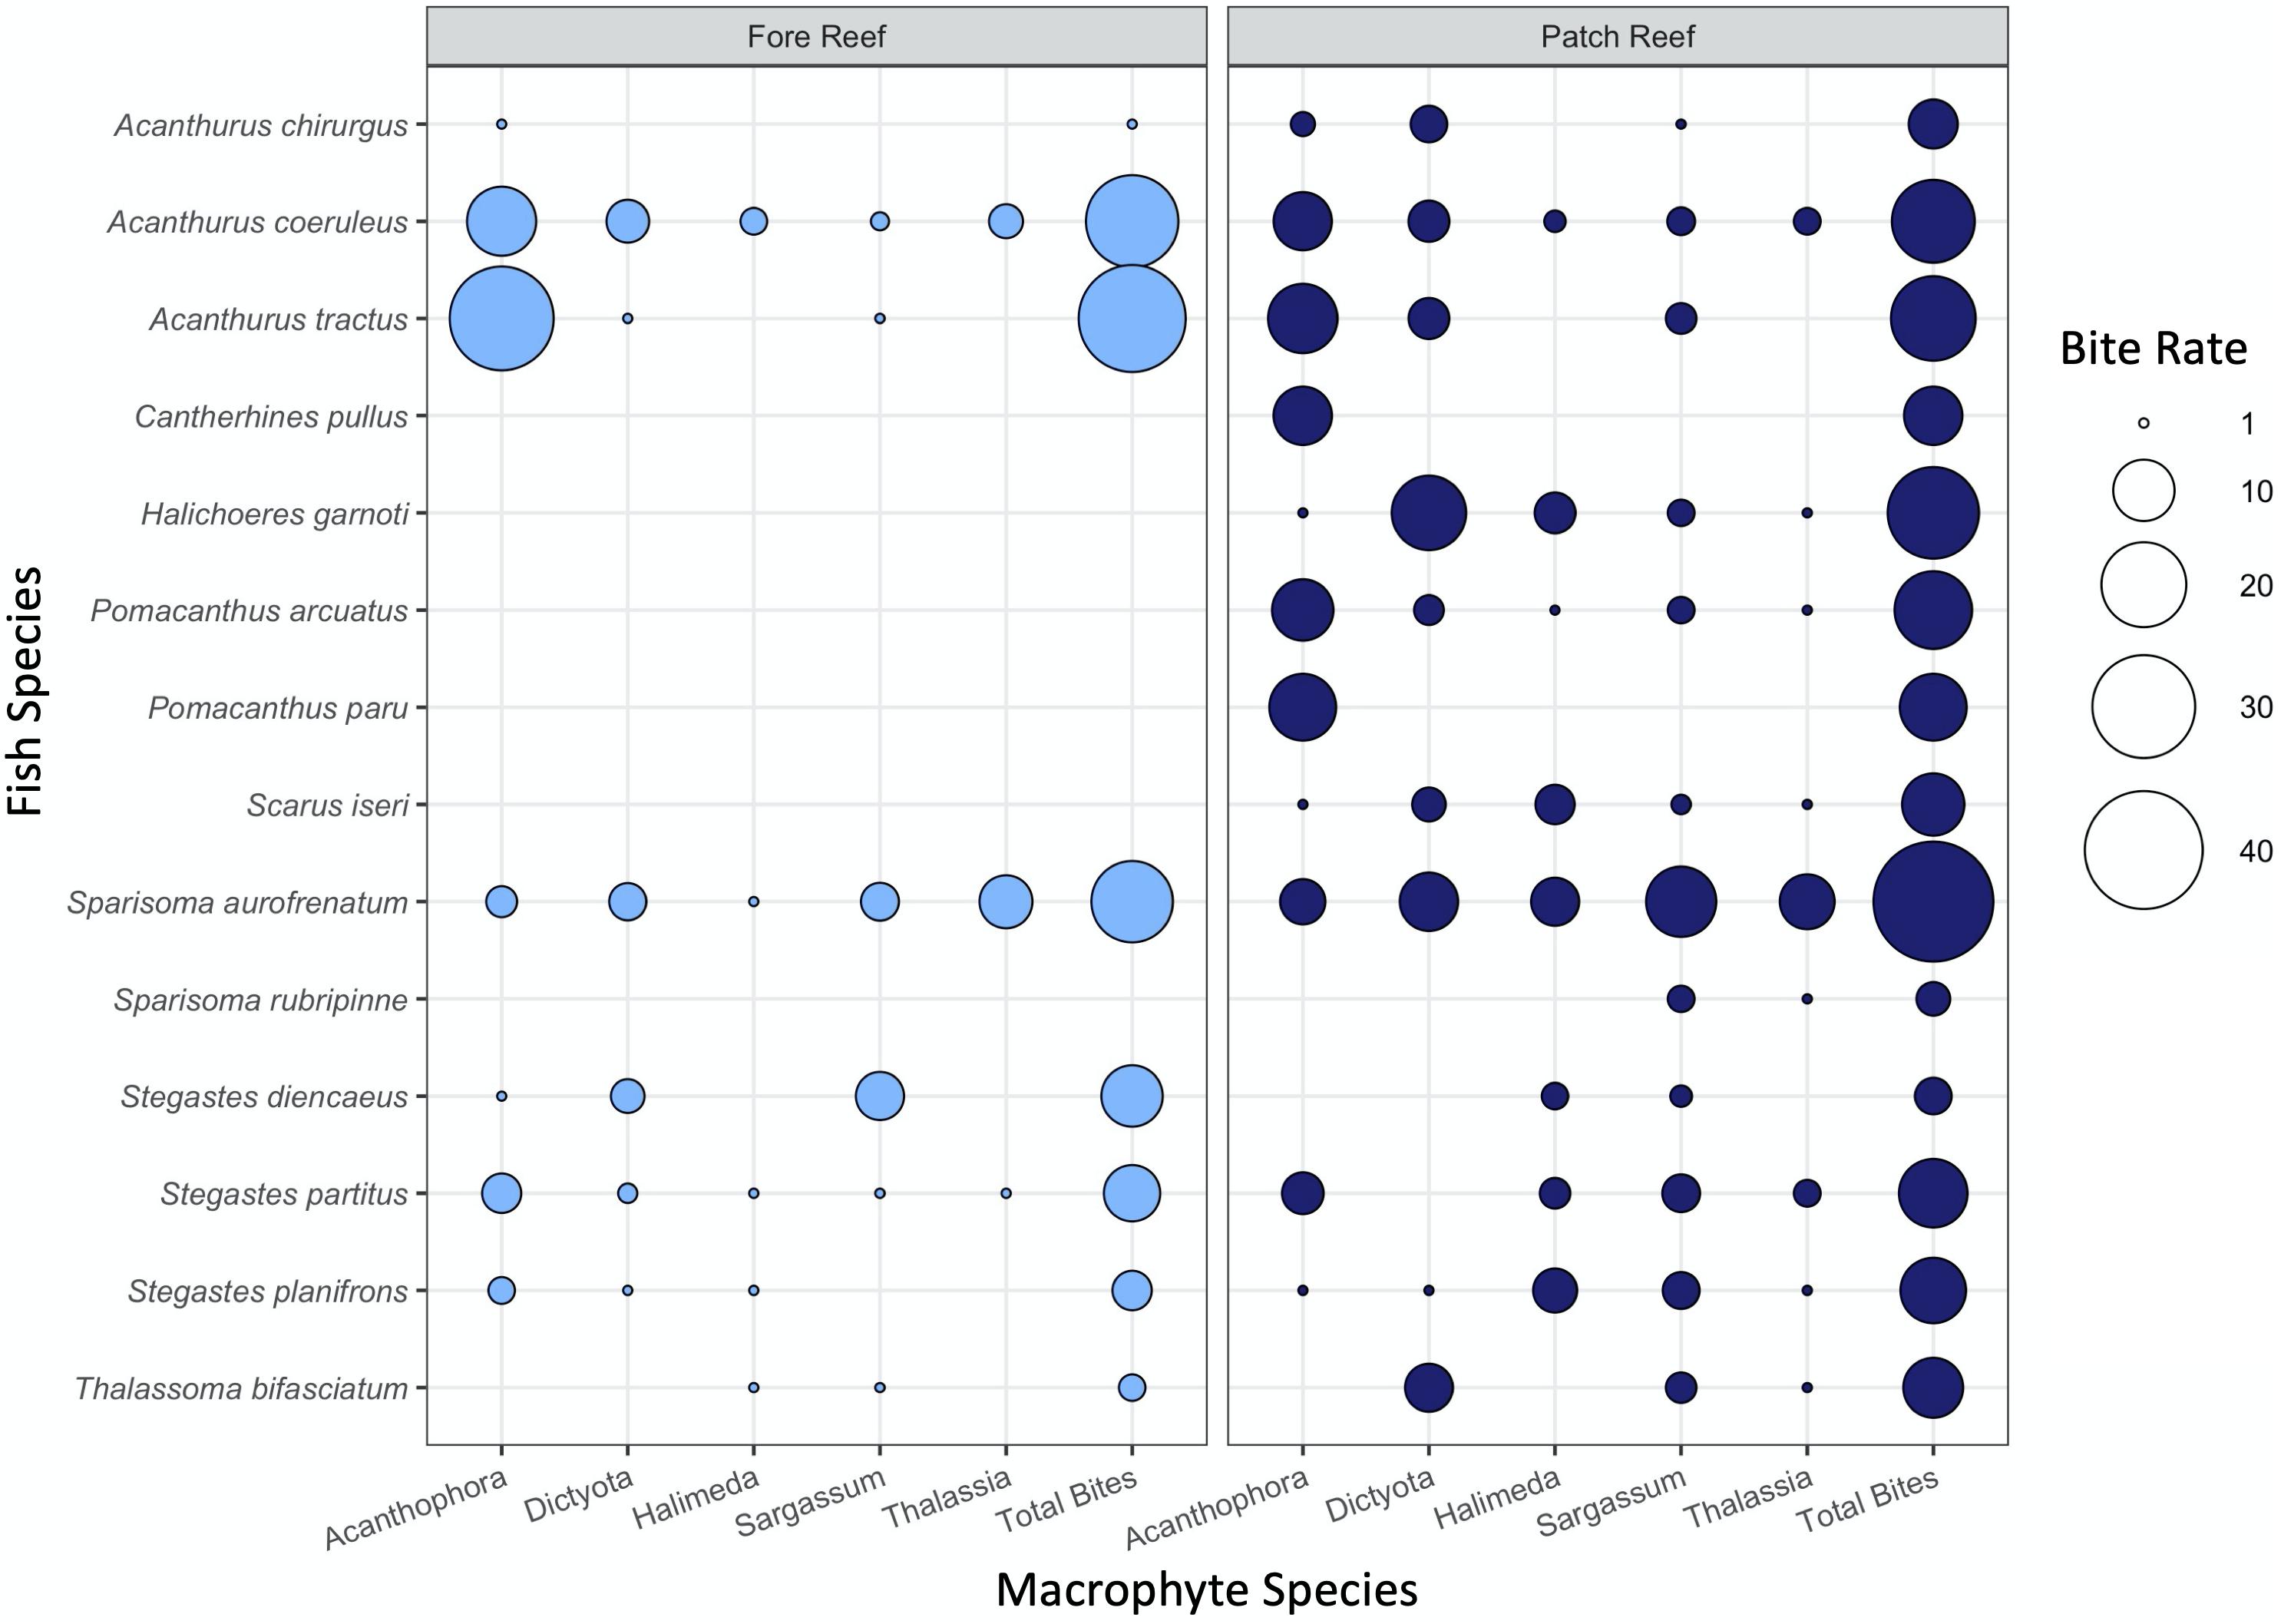
Figure 6. Mean bite rate for each fish herbivore per 1 h on each macrophyte observed in 2017 patch and fore reef. The size of the point is scaled by the total number of bites across all species and colored by habitat.
In squidpop video assays, consumption on fore reefs was dominated by the wrasses Halichoeres garnoti and Halichoeres bivittatus, whereas consumption on patch reef habitats was attributable to a more diverse assemblage including species of wrasse (H. garnoti), grunt (Haemulon plumierii), and snapper (Lutjanus apodus) (Figure 7). In mangrove habitats, three species of snappers (Lutjanus spp.) were responsible for nearly all bait consumption caught on video. Few squid baits were consumed in seagrass habitats, all by H. bivittatus.
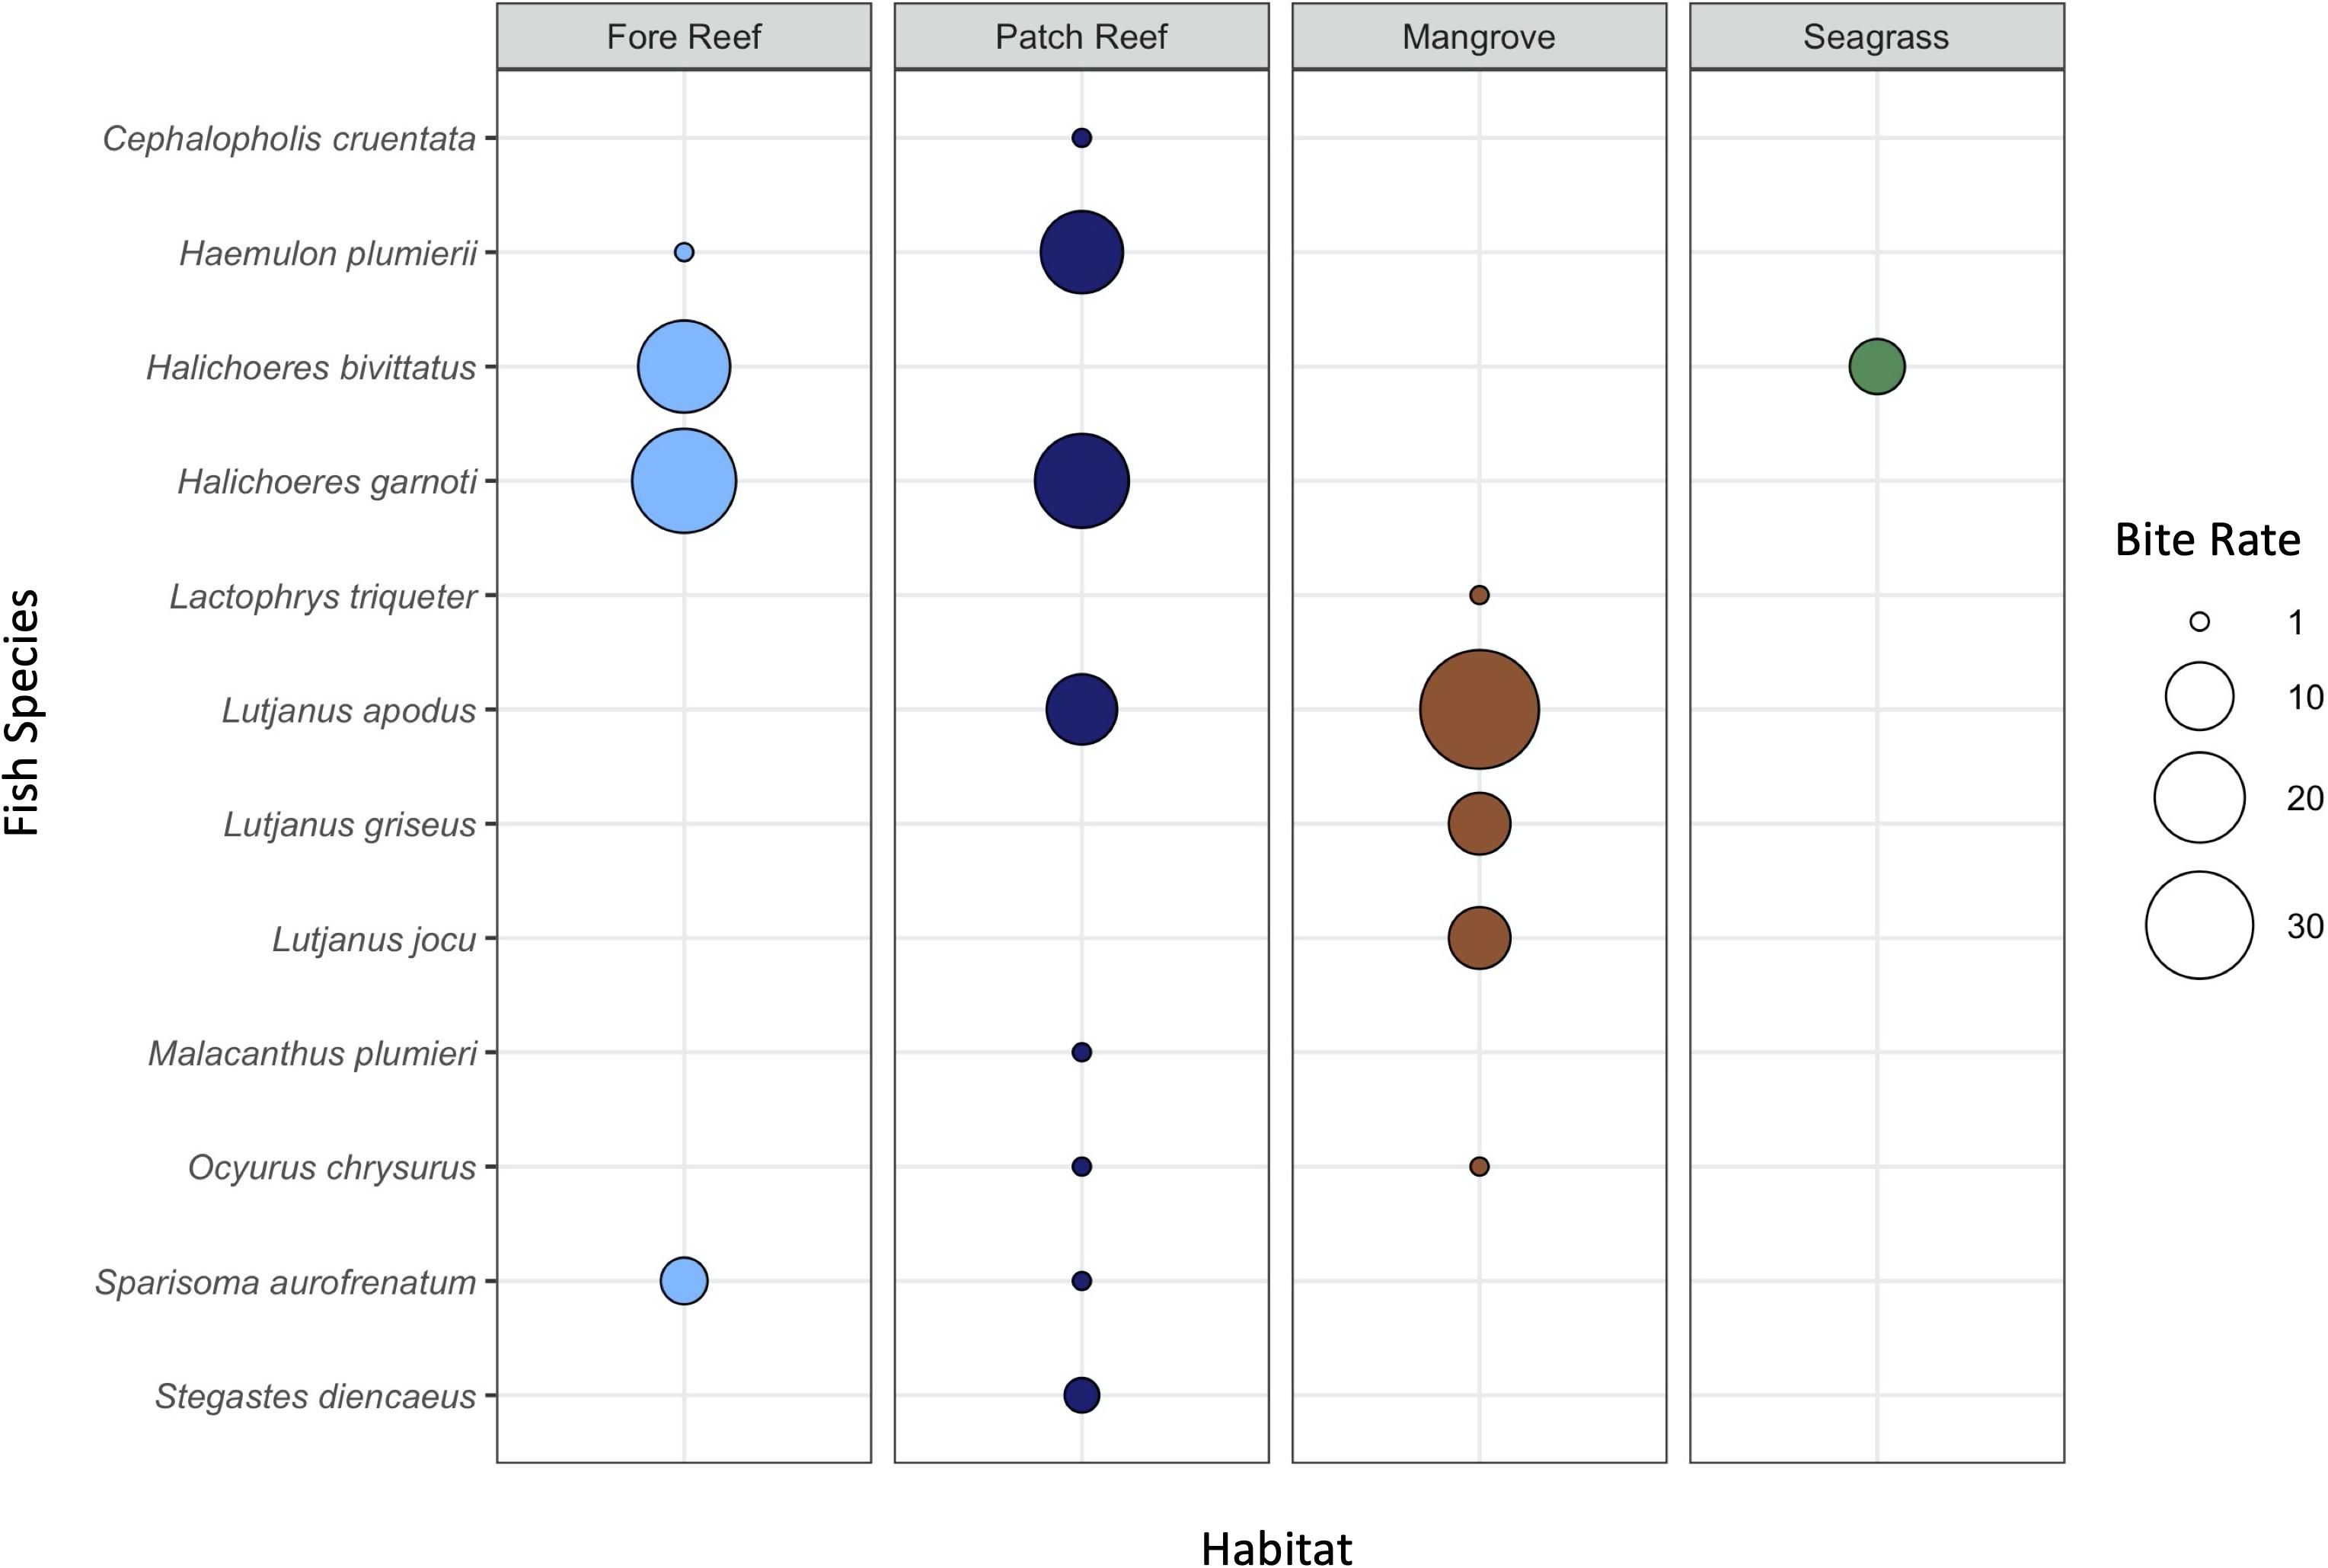
Figure 7. Total number of squid baits consumed by each fish species observed on video in 2017. The size of the point is scaled by the total number of bites across all species and colored by habitat.
Fish Assemblage Characteristics
Within habitats, consumption of squid baits was not significantly related to either the biomass of all fishes observed in visual surveys (P = 0.7575), nor to biomass of squid consumers (P = 0.8697), nor biomass of wrasses, snappers, and grunts specifically (P = 0.5886) (Supplementary Table 4). Rather, habitat and year were the only consistently significant predictors of squid bait loss in the model (Supplementary Table 4). For weedpop assays, total consumption of macrophytes differed among habitats but was unrelated to total fish biomass (P = 0.1660, Supplementary Table 5). However, when the fish assemblage was reduced to the subset of herbivores in the families Acanthuridae and Scaridae, there was a significant interaction between herbivorous fish log10-transformed biomass and habitat type (P < 0.001, Figure 8 and Supplementary Table 5). Specifically, on patch reefs, consumption of all macrophyte types (except for Acanthophora) was greater where the herbivorous fish community biomass was highest, whereas in fore reefs, herbivorous fish biomass had no correlation with consumption (Figure 8).
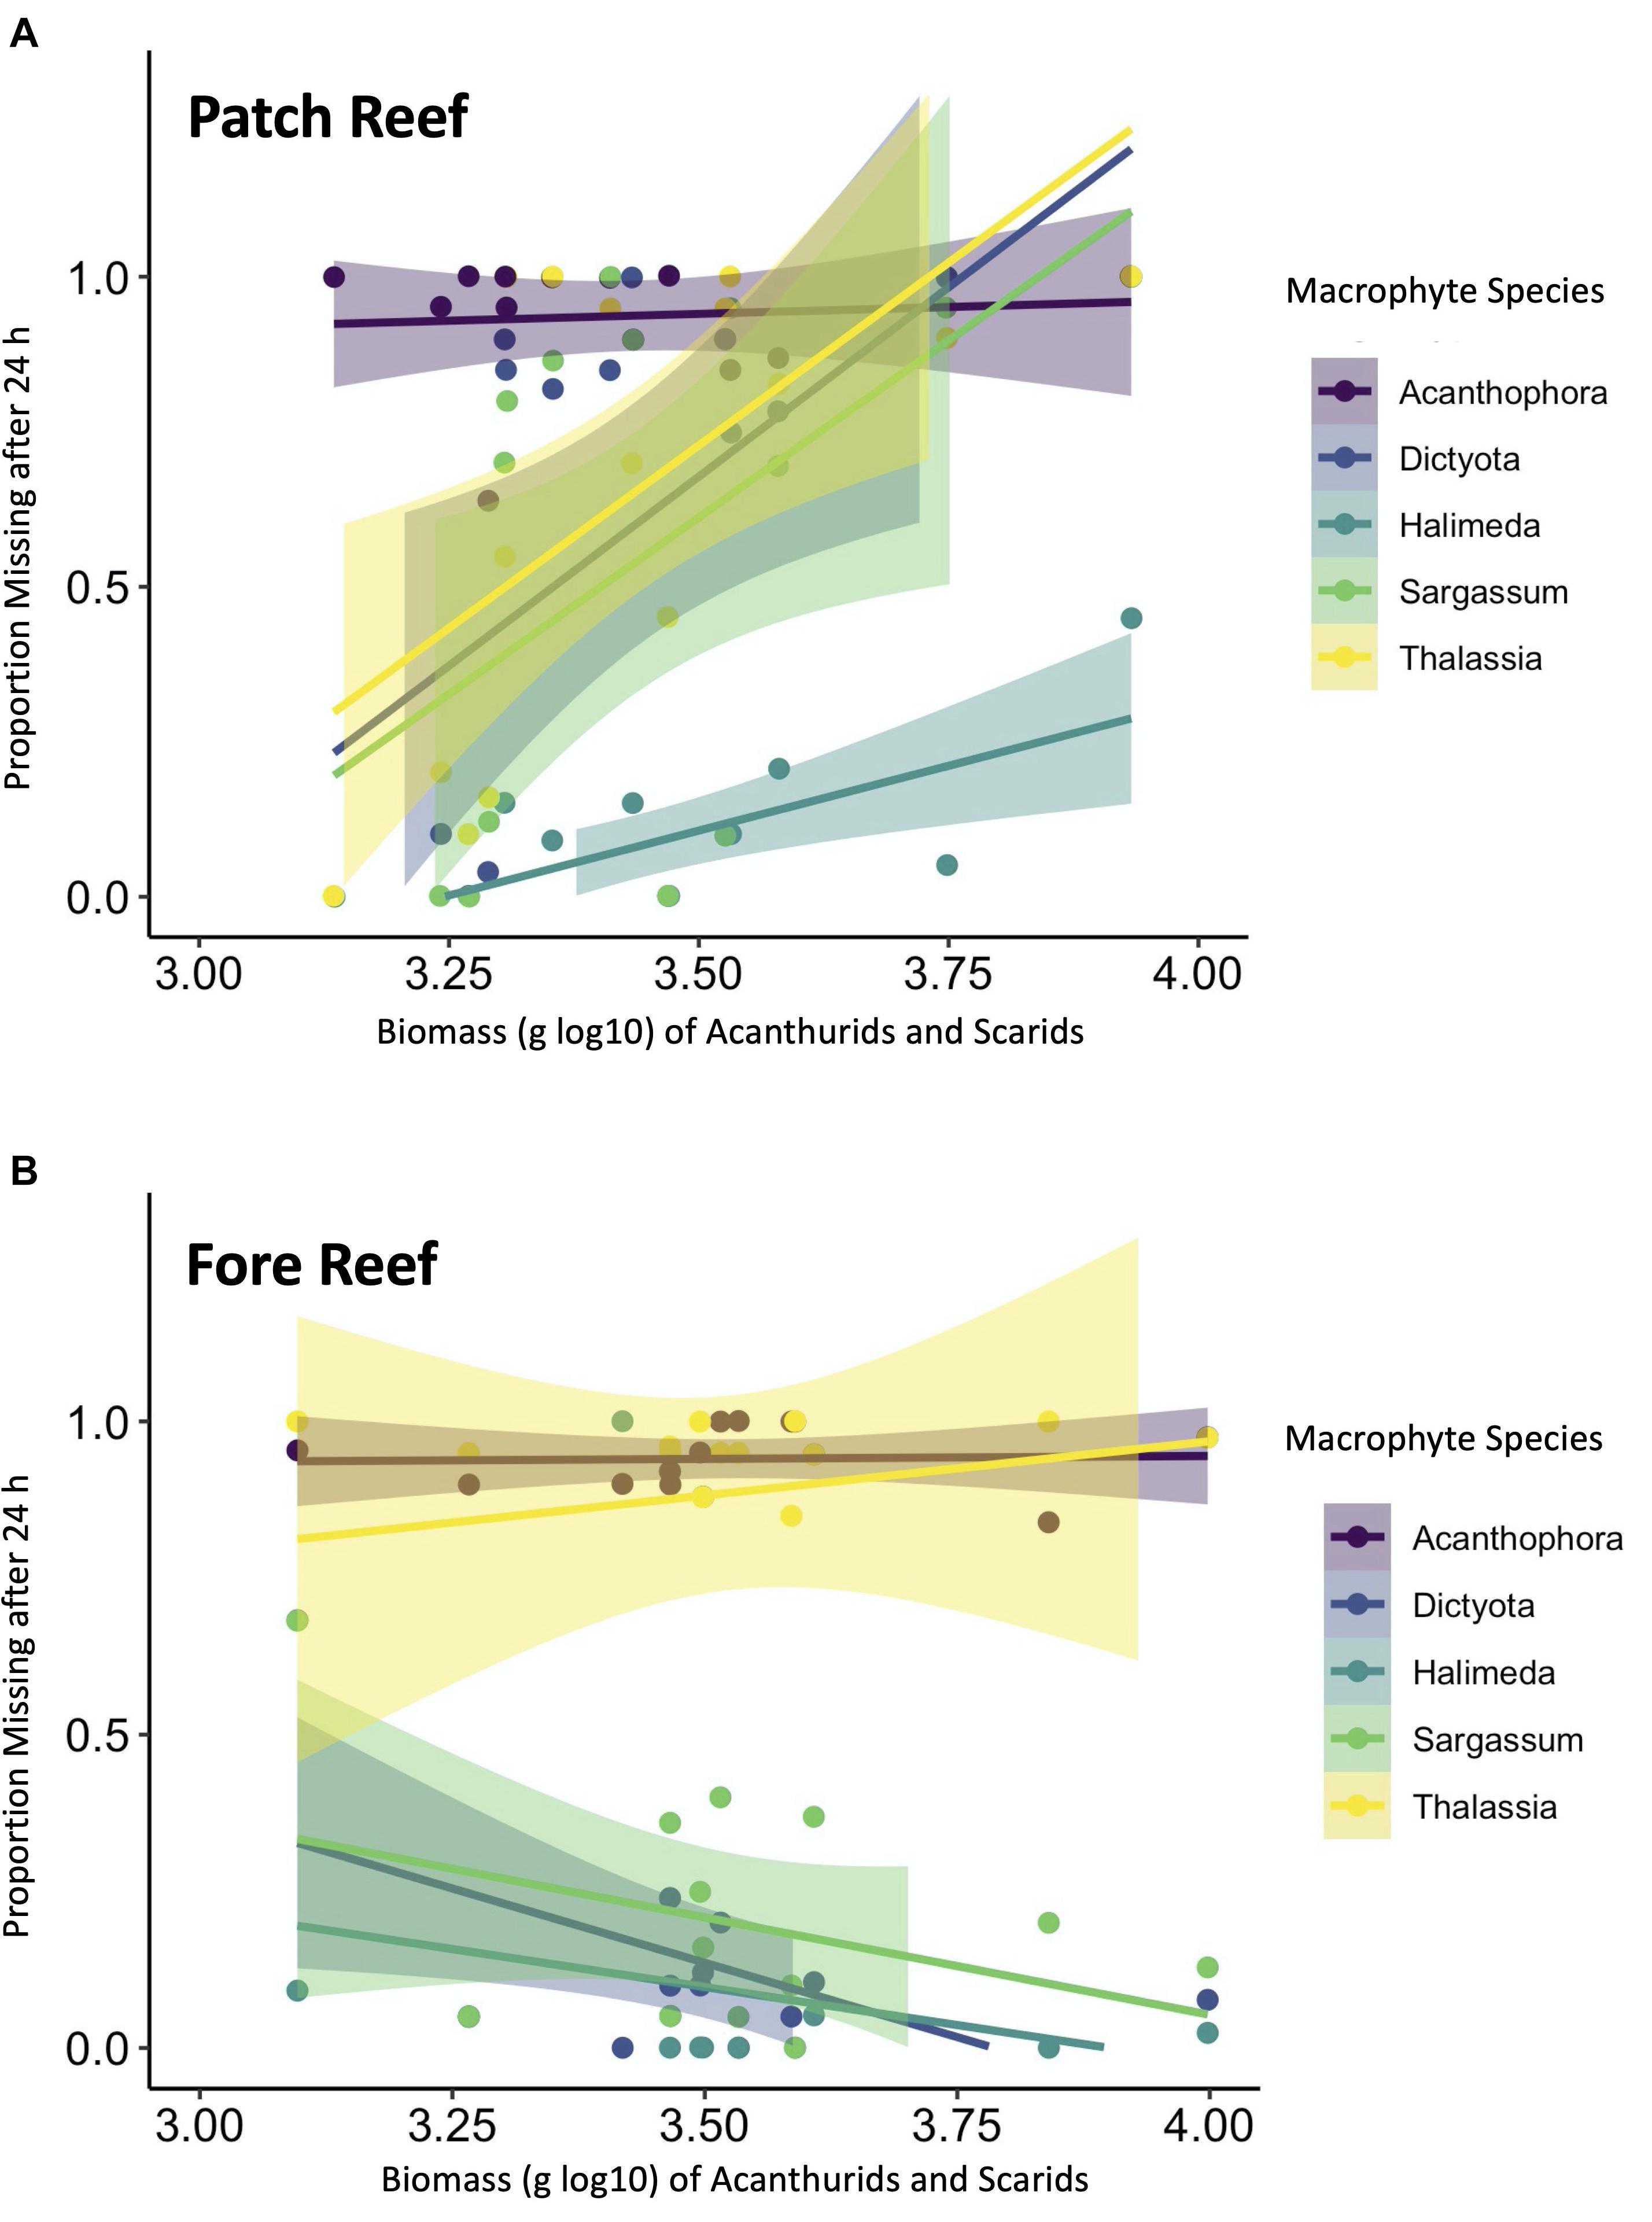
Figure 8. Relationships between acanthurid and scarid fish biomass (log10 g) and macrophyte loss after 24 h in (A) fore reef and (B) patch reef habitats. Macrophyte types are color coded and confidence intervals were applied using a linear model smoother.
Discussion
Standardized assays of macrophyte and dried squid consumption over a 5-year period across a Belizean tropical seascape revealed that consumption rates differed among habitats and these differences were consistent through time (Figures 2–4). Specifically, consumption was generally higher in structured coral reef and mangrove habitats, and lower in less structured seagrasses and sand flats. Video footage from 2017 indicated that a limited set of species was responsible for the observed consumption rates, and that the identities of the dominant consumers varied among habitats. Thus, it appears that a suite of common consumers may be responsible for maintaining a hierarchy of trophic processes across the coastal habitat mosaic in Belize, and that consumption across the seascape relies on this biodiversity (Supplementary Figure 3).
One explanation for the observed variation in consumption rates across habitats is structural complexity: three-dimensionally complex habitats like coral reefs and mangrove prop roots can provide refuge for numerous fishes and invertebrates that are responsible for consuming the types of bait we use here, while less complex structures like shorter seagrass canopies and sand flats do not provide such a variety of microhabitats for small fish to occupy (Dean and Connell, 1987; Hackradt et al., 2011). Although we did not directly measure habitat complexity in our study due to challenges in comparably measuring this quantity across the range of habitats sampled, we did observe the highest biomasses of most key consumer families—those which previously have been linked with habitat heterogeneity (Mumby et al., 2004; Nagelkerken, 2007)—on the fore reefs, patch reefs, and in mangroves (Supplementary Figure 5). The increased consumption of both macrophytes and squid we saw in these more complex habitats is consistent with previous studies (Valentine et al., 2007) and highlights the fact that the squid bait captures a complementary trophic group to herbivores—likely benthic invertivores and mid-sized predators—rather larger predators on them. Indeed, large predators are now scarce throughout the Caribbean (Paddack et al., 2009; Mumby et al., 2012), limiting the potential for interactions among consumers of both types of assays deployed in tandem, and some predators may only have interest in live prey.
The higher interannual variability in consumption in less structured sand and seagrass habitats (evidenced by their relatively high coefficients of variation) (Figure 2) likely reflects the transient use of these habitats by fish, creating a “hit-or-miss” assessment of consumption, where foraging grounds are spatially vast but consumers spend little time in them, such that consumers may fail to encounter baits during their foray. Another possible explanation is that the fishes that consumed our baits are more visible to their own predators in these open areas, limiting their foraging and leading to lower consumption, which is more consistent with the overall lower rates of consumption observed in seagrasses and especially sand flats. The interannual variation in consumption in unstructured habitats was unexpected and suggests the importance of including unstructured habitats in cross-habitat comparisons of ecological processes.
The generally lower rates of consumption we found in less structured habitats were accompanied by different species consuming the baits in different habitats. Previous work suggested that a diverse fish assemblage becomes more important in controlling turf algae when moving from the local to regional scale, incorporating more heterogeneity in both the foundational species and also the fish community itself (Lefcheck et al., 2019b). Our work similarly highlights that macrophyte browsing and squid consumption are attributable to largely different species, illustrating that a diverse consumer assemblage more effectively drives multiple trophic processes across the larger coastal seascape (Brandl et al., 2019).
Variation in the dominant consumers across habitats could stem from a reduced exchange of adult fishes among nearby habitats, but not from an exchange of juveniles, which are well known to mature in seagrasses and mangroves before moving to coral reefs. This would explain why squid consumption was lowest in the sand flats that act as conduits, shuttling fishes between multiple habitats. It could also be a consequence of the habitat-specific foraging adaptations of the various fish species and their familiarity with the baits. For example, acanthurid and scarid fishes were the dominant herbivores we observed on both patch reefs and fore reefs (Supplementary Figure 3B), as is typical of Caribbean reefs (Lewis and Wainwright, 1985; Burkepile and Hay, 2010; Lefcheck et al., 2019b; Dell et al., 2020). However, weedpops deployed to patch reefs were also targeted by omnivorous angelfish (pomacanthids), and the benthic invertivore Halichoeres garnoti, which frequently bites at benthic algae to access its target arthropod and echinoderm prey (Clifton and Motta, 1998).
In contrast, squid baits presented a novel resource, isolating the effect of species identity irrespective of either prey or predator behavior. In this case, squid bait was consumed primarily by wrasses on fore reefs, by snappers in mangrove habitats, and by the widest variety of fish species on patch reefs, including two species of snapper (Figure 7). The placement of patch reefs within the coastal seascape may be an explanation for this finding, as they are generally isolated from the continuous reefs and more proximate to other habitats like seagrasses and mangroves, which could lead to greater spillover of species from these other habitats (Figure 1 and Supplementary Figure 2). Seascape configuration, or the spatial orientation of habitats in relation to one another, is likely to play a large role in the exchange of species, the connectivity of ecosystems, and ultimately the functioning of coastal habitats and is worthy of further exploration with respect to trophic processes (Mumby et al., 2004; Jones et al., 2020).
Of particular note is our finding that fish biomass (from transect surveys) was generally uncorrelated with loss of either squid baits or macrophytes except in the case of the biomass of the subset of browsing herbivores on patch reefs. It is well known that fish biomass is a strong determinant of ecosystem processes in tropical marine ecosystems, including herbivory (e.g., Lefcheck et al., 2019b). That total fish biomass did not explain consumption in the current study could stem from a few causes. First, the biomass threshold of key consumers necessary to consume all assays within 24 h is easily met in the deployment area, leading to overall high rates of consumption, which is certainly true for squid and likely also the highly palatable Acanthophora. The resulting lack of variation when consumption is uniformly high or low prevents further evaluation of potential patterns. Second, patch reefs are smaller and more isolated than fore reefs. Consequently, they may attract more and varied browsers that are concentrated in a smaller area, one which is also less likely to offer alternative resources. Hence, small patch reefs are generally associated with seagrass-depleted sand halos generated by foragers temporarily leaving the reef (Ogden et al., 1973; Madin et al., 2011; DiFiore et al., 2019). Whether reef “patchiness” (size and proximity to other habitats) plays a role in herbivores’ abilities to control algal proliferation through consumption remains a question for future research. Finally, the surveys were not conducted exactly when the assays were deployed (to avoid diver artifacts), and the fish community observed on the transects may differ somewhat from those interacting with the experimental assays (Figures 6, 7 and Supplementary Figure 3).
We raise several final caveats with our study. Since videos were only filmed in 2017 and not over the entire range of habitats for both squidpops and weedpops, we can only draw firm conclusions about the identity of consumers at the times and places filmed. Additionally, much of the consumption observed in the videos may have been the result of patchy and opportunistic feeding, possibly creating the illusion of consistency in consumer identity. These questions could be answered by capturing video footage over multiple years and habitats to improve our understanding of the role of individual species in sustaining trophic processes across the coastal mosaic.
Overall, our 5-year study of macrophyte and squid bait consumption across a nearshore tropical seascape suggests that spatio-temporal patterns in consumption are primarily explained by habitat type, with the majority of herbivory occurring in structured reef habitats and carnivorous consumption occurring in reefs and mangroves. Notably, these relative differences persisted throughout the duration of the study, establishing a baseline to evaluate future change. Moreover, differences in consumer diversity and consumption patterns emerged between patch reefs and fore reefs, likely due to seascape characteristics including patchiness, proximity, and connectivity to other habitat types. Because a large proportion of the trophic interactions we measured occurred in structurally complex habitats, continued reef flattening and mangrove and seagrass loss and fragmentation may create cascading effects in Caribbean food webs, potentially shifting this baseline. Continued management of fish communities in Belize, particularly of the species known to be strong interactors with benthic macroalgae, is therefore key in maintaining trophic processes and mitigating the consequences of habitat change.
Data Availability Statement
The original contributions presented in the study are included in the article/Supplementary Material, further inquiries can be directed to the corresponding author/s.
Author Contributions
JED, VP, JL, and LH contributed to conception and design of the study. VP, JED, LH, RW, and SJ performed field research. CR analyzed video footage with guidance from JED and MO. JL, CR, and LH performed analysis and wrote the first draft of the manuscript. All authors contributed to manuscript revision, and read and approved the submitted version.
Funding
This work was supported by the Caribbean Coral Reef Ecosystems program, the Smithsonian’s Tennenbaum Marine Observatories Network, and the Smithsonian Environmental Research Center’s internship program. JL was supported by the Michael E. Tennenbaum Secretarial Scholar gift to the Smithsonian Institution.
Conflict of Interest
The authors declare that the research was conducted in the absence of any commercial or financial relationships that could be construed as a potential conflict of interest.
Publisher’s Note
All claims expressed in this article are solely those of the authors and do not necessarily represent those of their affiliated organizations, or those of the publisher, the editors and the reviewers. Any product that may be evaluated in this article, or claim that may be made by its manufacturer, is not guaranteed or endorsed by the publisher.
Acknowledgments
We thank the Carrie Bow Cay Field Station team for their assistance in the field: Andrew Altieri, Maggie Benson, David Branson, Justin Campbell, Kieran Cox, Zach Foltz, Michael Goodison, Maggie Johnson, Scott Ling, Alex Lowe, Emily Nixon, Laurie Penland, Janina Seemann, and Doug Schleiger. We also thank Claire Murphy for her assistance in initial video scoring. We thank the Belize Fisheries Department for their cooperation and issuing annual research permits for this work. This is contribution 89 from the Smithsonian’s MarineGEO and Tennenbaum Marine Observatories Network and CCRE Program contribution 1055.
Supplementary Material
The Supplementary Material for this article can be found online at: https://www.frontiersin.org/articles/10.3389/fmars.2021.742907/full#supplementary-material
References
Adam, T., Burkepile, D., Ruttenberg, B., and Paddack, M. (2015). Herbivory and the resilience of Caribbean coral reefs: knowledge gaps and implications for management. Mar. Ecol. Prog. Ser. 520, 1–20. doi: 10.3354/meps11170
Alvarez-Filip, L., Dulvy, N. K., Gill, J. A., Côté, I. M., and Watkinson, A. R. (2009). Flattening of Caribbean coral reefs: region-wide declines in architectural complexity. Proc. R. Soc. B. 276, 3019–3025. doi: 10.1098/rspb.2009.0339
Borer, E. T., Halpern, B. S., and Seabloom, E. W. (2006). Asymmetry in community regulation: effects of predators and productivity. Ecology 87, 2813–2820.
Brandl, S. J., Rasher, D. B., Côté, I. M., Casey, J. M., Darling, E. S., Lefcheck, J. S., et al. (2019). Coral reef ecosystem functioning: eight core processes and the role of biodiversity. Front. Ecol. Environ. 17, 445–454. doi: 10.1002/fee.2088
Burkepile, D. E., and Hay, M. E. (2010). Impact of herbivore identity on algal succession and coral growth on a Caribbean reef. PLoS One 5:e8963. doi: 10.1371/journal.pone.0008963
Chittaro, P. M., Usseglio, P., and Sale, P. F. (2005). Variation in fish density, assemblage composition and relative rates of predation among mangrove, seagrass and coral reef habitats. Environ. Biol. Fish. 72, 175–187. doi: 10.1007/s10641-004-9077-2
Clifton, K. B., and Motta, P. J. (1998). Feeding morphology, diet, and ecomorphological relationships among five Caribbean labrids (Teleostei. Labridae). Copeia 1998:953. doi: 10.2307/1447342
Dean, R. L., and Connell, J. H. (1987). Marine invertebrates in an algal succession. III. Mechanisms linking habitat complexity with diversity. J. Exp. Mar. Biol. Ecol. 109, 249–273. doi: 10.1016/0022-0981(87)90057-8
Dell, C. L. A., Longo, G. O., Burkepile, D. E., and Manfrino, C. (2020). Few herbivore species consume dominant macroalgae on a Caribbean coral reef. Front. Mar. Sci. 7:676. doi: 10.3389/fmars.2020.00676
DiFiore, B. P., Queenborough, S. A., Madin, E. M., Paul, V. J., Decker, M. B., and Stier, A. C. (2019). Grazing halos on coral reefs: predation risk, herbivore density, and habitat size influence grazing patterns that are visible from space. Mar. Ecol. Prog. Ser. 627, 71–81. doi: 10.3354/meps13074
Duffy, J. E., Ziegler, S. L., Campbell, J. E., Bippus, P. M., and Lefcheck, J. S. (2015). Squidpops: a simple tool to crowdsource a global map of marine predation intensity. PLoS One 10:e0142994. doi: 10.1371/journal.pone.0142994
Edgar, G. J., Barrett, N. S., and Morton, A. J. (2004). Biases associated with the use of underwater visual census techniques to quantify the density and size-structure of fish populations. J. Exp. Mar. Biol. Ecol. 308, 269–290. doi: 10.1016/j.jembe.2004.03.004
Edgar, G. J., Cooper, A., Baker, S. C., Barker, W., Barrett, N. S., Becerro, M. A., et al. (2020). Reef life survey: establishing the ecological basis for conservation of shallow marine life. Biol. Conserv. 252:108855. doi: 10.1016/j.biocon.2020.108855
Edgar, G. J., and Stuart-Smith, R. D. (2014). Systematic global assessment of reef fish communities by the reef life survey program. Sci. Data 1:140007. doi: 10.1038/sdata.2014.7
Ferreira, C. E. L., Floeter, S. R., Gasparini, J. L., Ferreira, B. P., and Joyeux, J. C. (2004). Trophic structure patterns of Brazilian reef fishes: a latitudinal comparison. J. Biogeogr. 31, 1093–1106. doi: 10.1111/j.1365-2699.2004.01044.x
Fox, J., and Weisberg, S. (2019). An R Companion to Applied Regression, 3rd Edn. Thousand Oaks, CA: Sage publications.
Fraser, K. M., Lefcheck, J. S., Ling, S. D., Mellin, C., Stuart-Smith, R. D., and Edgar, G. J. (2020). Production of mobile invertebrate communities on shallow reefs from temperate to tropical seas. Proc. R. Soc. B 287:20201798. doi: 10.1098/rspb.2020.1798
Freestone, A. L., Osman, R. W., Ruiz, G. M., and Torchin, M. E. (2011). Stronger predation in the tropics shapes species richness patterns in marine communities. Ecology 92, 983–993. doi: 10.1890/09-2379.1
Froese, R., and Pauly, D. (eds). (2021). FishBase. Available online at: www.fishbase.org (accessed October 4, 2021).
Gardner, T. A., Côté, I. M., Gill, J. A., Grant, A., and Watkinson, A. R. (2003). Long-term region-wide declines in Caribbean corals. Science 301, 958–960. doi: 10.1126/science.1086050.
Gauff, R. P., Bejarano, S., Madduppa, H. H., Subhan, B., Dugény, E. M., Perdana, Y. A., et al. (2018). Influence of predation risk on the sheltering behaviour of the coral-dwelling damselfish, Pomacentrus moluccensis. Environ. Biol. Fishes 101, 639–651. doi: 10.1007/s10641-018-0725-3
Hackradt, C. W., Félix-Hackradt, F. C., and García-Charton, J. A. (2011). Influence of habitat structure on fish assemblage of an artificial reef in southern Brazil. Mar. Environ. Res. 72, 235–247. doi: 10.1016/j.marenvres.2011.09.006
Halpern, B. S., Cottenie, K., and Broitman, B. R. (2006). Strong top-down control in Southern California kelp forest ecosystems. Science 312, 1230–1232. doi: 10.1126/science.1128613
Hammerschlag, N., Morgan, A. B., and Serafy, J. E. (2010). Relative predation risk for fishes along a subtropical mangrove–seagrass ecotone. Mar. Ecol. Prog. Ser. 401, 259–267. doi: 10.3354/meps08449
Hay, M. E. (1981). Herbivory, algal distribution, and the maintenance of between-habitat diversity on a tropical fringing reef. Am. Nat. 118, 520–540. doi: 10.1086/283845
Hay, M. E. (1984). Predictable spatial escapes from herbivory: how do these affect the evolution of herbivore resistance in tropical marine communities? Oecologia 64, 396–407. doi: 10.1007/BF00379139
Heck, K. L. Jr., and Wilson, K. A. (1987). Predation rates on decapod crustaceans in latitudinally separated seagrass communities: a study of spatial and temporal variation using tethering techniques. J. Exp. Mar. Biol. Ecol. 107, 87–100. doi: 10.1016/0022-0981(87)90188-2
Jones, T. R., Henderson, C. J., Olds, A. D., Connolly, R. M., Schlacher, T. A., Hourigan, B. J., et al. (2020). The mouths of estuaries are key transition zones that concentrate the ecological effects of predators. Estuar. Coast. 44, 1557–1567. doi: 10.1007/s12237-020-00862-6
Koltes, K., and Opishinski, T. (2009). Patterns of water quality and movement in the vicinity of carrie bow cay, belize. Smiths. Contrib. Mar. Sci. 38, 380–390.
Lefcheck, J. S. (2016). piecewiseSEM: piecewise structural equation modeling in R for ecology, evolution, and systematics. Methods Ecol. Evol. 7, 573–579. doi: 10.1111/2041-210X.12512
Lefcheck, J. S., Hughes, B. B., Johnson, A. J., Pfirrmann, B. W., Rasher, D. B., Smyth, A. R., et al. (2019a). Are coastal habitats important nurseries? A meta-analysis. Conserv. Lett. 12:e12645.
Lefcheck, J. S., Innes-Gold, A. A., Brandl, S. J., Steneck, R. S., Torres, R. E., and Rasher, D. B. (2019b). Tropical fish diversity enhances coral reef functioning across multiple scales. Sci. Adv. 5:eaav6420. doi: 10.1126/sciadv.aav6420
Lefcheck, J. S., Pfirrmann, B. W., Fodrie, F. J., Grabowski, J. H., Hughes, A. R., and Smyth, A. R. (2021). Consumption rates vary based on the presence and type of oyster structure: a seasonal and latitudinal comparison. J. Exp. Mar. Biol. Ecol. 536:151501. doi: 10.1016/j.jembe.2020.151501
Lenth, R. V. (2020). emmeans: Estimated Marginal Means, aka Least-Squares Means. Available online at: https://CRAN.R-project.org/package=emmeans (accessed September 29, 2021).
Lewis, S. M. (1985). Herbivory on coral reefs: algal susceptibility to herbivorous fishes. Oecologia 65, 370–375. doi: 10.1007/BF00378911
Lewis, S. M. (1986). The role of herbivorous fishes in the organization of a Caribbean reef community. Ecol. Monogr. 56, 183–200. doi: 10.2307/2937073
Lewis, S. M., and Wainwright, P. C. (1985). Herbivore abundance and grazing intensity on a Caribbean coral reef. J. Exp. Mar. Biol. Ecol. 87, 215–228. doi: 10.1016/0022-0981(85)90206-0
Ling, S. D., Johnson, C. R., Frusher, S. D., and Ridgway, K. R. (2009). Overfishing reduces resilience of kelp beds to climate-driven catastrophic phase shift. Proc. Natl. Acad. Sci. U. S. A. 106, 22341–22345. doi: 10.1073/pnas.0907529106
Littler, M. M., Taylor, P. R., and Littler, D. S. (1983). Algal resistance to herbivory on a Caribbean barrier reef. Coral Reefs 2, 111–118. doi: 10.1007/BF02395281
Madin, E. M. P., Madin, J. S., and Booth, D. J. (2011). Landscape of fear visible from space. Sci. Rep. 1, 1–4. doi: 10.1038/srep00014
Mumby, P. J., Edwards, A. J., Arias-González, J. E., Lindeman, K. C., Blackwell, P. G., Gall, A., et al. (2004). Mangroves enhance the biomass of coral reef fish communities in the Caribbean. Nature 427, 533–536. doi: 10.1038/nature02286
Mumby, P. J., Steneck, R. S., Edwards, A. J., Ferrari, R., Coleman, R., Harborne, A. R., et al. (2012). Fishing down a Caribbean food web relaxes trophic cascades. Mar. Ecol. Prog. Ser. 445, 13–24. doi: 10.3354/meps09450
Mumby, P. J., Steneck, R. S., Roff, G., and Paul, V. J. (2021). Marine reserves, fisheries ban, and 20 years of positive change in a coral reef ecosystem. Conserv. Biol. 35, 1473–1483. doi: 10.1111/cobi.13738
Musrri, C. A., Poore, A. G. B., Hinojosa, I. A., Macaya, E. C., Pacheco, A. S., Pérez-Matus, A., et al. (2019). Variation in consumer pressure along 2500 km in a major upwelling system: crab predators are more important at higher latitudes. Mar. Biol. 166:142. doi: 10.1007/s00227-019-3587-0
Nagelkerken, I. (2007). Are non-estuarine mangroves connected to coral reefs through fish migration? Bull. Mar. Sci. 80, 595–607.
Nagelkerken, I., Sheaves, M., Baker, R., and Connolly, R. M. (2015). The seascape nursery: a novel spatial approach to identify and manage nurseries for coastal marine fauna. Fish Fish. 16, 362–371. doi: 10.1111/faf.12057
Navarrete, S. A., Wieters, E. A., Broitman, B. R., and Castilla, J. C. (2005). Scales of benthic-pelagic coupling and the intensity of species interactions: from recruitment limitation to top-down control. Proc. Natl. Acad. Sci. U. S. A. 102, 18046–18051. doi: 10.1073/pnas.0509119102
Ogden, J. C., Brown, R. A., and Salesky, N. (1973). Grazing by the echinoid Diadema antillarum Philippi: formation of halos around West Indian patch reefs. Science 182, 715–717. doi: 10.1126/science.182.4113.715
Oksanen, J., Blanchet, F. G., Friendly, M., Kindt, R., Legendre, P., McGlinn, D., et al. (2020). vegan: Community Ecology Package. R Package Version 2.5-7. Available online at: https://CRAN.R-project.org/package=vegan (accessed November 28, 2020).
Paddack, M. J., Reynolds, J. D., Aguilar, C., Appeldoorn, R. S., Beets, J., Burkett, E. W., et al. (2009). Recent region-wide declines in Caribbean reef fish abundance. Curr. Biol. 19, 590–595. doi: 10.1016/j.cub.2009.02.041
Paul, V. J., and Hay, M. E. (1986). Seaweed susceptibility to herbivory: chemical and morphological correlates. Mar. Ecol. Prog. Ser. 33, 255–264. doi: 10.3354/meps033255
R Core Team. (2020). R: A Language and Environment for Statistical Computing. Vienna: R Foundation for Statistical Computing.
Rasher, D. B., Hoey, A. S., and Hay, M. E. (2013). Consumer diversity interacts with prey defenses to drive ecosystem function. Ecology 94, 1347–1358. doi: 10.1890/12-0389.1
Rodemann, J., and Brandl, S. (2017). Consumption pressure in coastal marine environments decreases with latitude and in artificial vs. natural habitats. Mar. Ecol. Prog. Ser. 574, 167–179. doi: 10.3354/meps12170
Short, F. T., Koch, E. W., Creed, J. C., Magalhães, K. M., Fernandez, E., and Gaeckle, J. L. (2006). SeagrassNet monitoring across the Americas: case studies of seagrass decline. Mar. Ecol. 27, 277–289. doi: 10.1111/j.1439-0485.2006.00095.x
Stallings, C. D. (2009). Fishery-independent data reveal negative effect of human population density on caribbean predatory fish communities. PLoS One 4:e5333. doi: 10.1371/journal.pone.0005333
Tootell, J. S., and Steele, M. A. (2016). Distribution, behavior, and condition of herbivorous fishes on coral reefs track algal resources. Oecologia 181, 13–24. doi: 10.1007/s00442-015-3418-z
Valentine, J. F., Heck, K. L. Jr., Blackmon, D., Goecker, M. E., Christian, J., Kroutil, R. M., et al. (2007). Food web interactions along seagrass–coral reef boundaries: effects of piscivore reductions on cross-habitat energy exchange. Mar. Ecol. Prog. Ser. 333, 37–50. doi: 10.3354/meps333037
Vergés, A., Vanderklift, M. A., Doropoulos, C., and Hyndes, G. A. (2011). Spatial patterns in herbivory on a coral reef are influenced by structural complexity but not by algal traits. PLoS One 6:e17115. doi: 10.1371/journal.pone.0017115
Whalen, M. A., Whippo, R. D. B., Stachowicz, J. J., York, P. H., Aiello, E., Alcoverro, T., et al. (2020). Climate drives the geography of marine consumption by changing predator communities. Proc. Natl. Acad. Sci. U. S. A. 117, 28160–28166. doi: 10.1073/pnas.2005255117
Keywords: herbivory, predation, coral reef, seagrass, mangrove, Belize, squidpop
Citation: Ritter CJ, Harper LM, Lefcheck JS, Paul VJ, Whippo R, Jones S, Ogburn MB and Duffy JE (2021) Patterns of Consumption Across a Caribbean Seascape: Roles of Habitat and Consumer Species Composition Through Time. Front. Mar. Sci. 8:742907. doi: 10.3389/fmars.2021.742907
Received: 16 July 2021; Accepted: 06 October 2021;
Published: 27 October 2021.
Edited by:
Cataldo Pierri, University of Bari Aldo Moro, ItalyReviewed by:
Aldo S. Pacheco, National University of San Marcos, PeruAlice Rogers, Victoria University of Wellington, New Zealand
Copyright © 2021 Ritter, Harper, Lefcheck, Paul, Whippo, Jones, Ogburn and Duffy. This is an open-access article distributed under the terms of the Creative Commons Attribution License (CC BY). The use, distribution or reproduction in other forums is permitted, provided the original author(s) and the copyright owner(s) are credited and that the original publication in this journal is cited, in accordance with accepted academic practice. No use, distribution or reproduction is permitted which does not comply with these terms.
*Correspondence: Carmen J. Ritter, Y2FybWVuamVhbnJpdHRlckBnbWFpbC5jb20=