 Michelle Waycott
 Kor-jent van Dijk
 Ainsley Calladine
 Eric Bricker
 Ed Biffin
- 1Department of Ecology and Evolutionary Biology, School of Biological Sciences, The Environment Institute, University of Adelaide, Adelaide, SA, Australia
- 2Department for Water and Environment, State Herbarium of South Australia, Botanic Gardens and State Herbarium, Adelaide, SA, Australia
- 3EPLJ Music LLC, Charlottesville, VA, United States
- 4Department of Environmental Sciences, University of Virginia, Charlottesville, VA, United States
Halophila johnsonii is an endangered seagrass species that is restricted to the southeast coast of Florida, United States. Its taxonomic status has been called into question, in particular, given the close morphological and genetic similarity of H. johnsonii and the widely distributed and morphologically variable Halophila ovalis, which is largely restricted to the Indo-Pacific region. While a close relationship to H. ovalis is uncontroversial, it remains uncertain whether H. johnsonii represents a distinct lineage or is a recent introduction to the Florida region. Given the conservation status of H. johnsonii, distinguishing these alternatives has important implications for the management of the species and its habitat. Here, we develop molecular data sets for samples of H. johnsonii and H. ovalis including DNA sequences, genome-wide SNPs and microsatellites with the view to resolving the affinities of H. johnsonii with respect to the wider H. ovalis complex. Phylogenetic hypotheses based upon plastid (∼18000 bp) and low copy nuclear DNA (∼6500 bp) sequences derived from hybrid capture, along with 990 genome-wide ddRAD SNPs consistently resolved H. johnsonii within H. ovalis. Specifically, we found a close affinity between H. johnsonii and H. ovalis sampled from the east coast of Africa. In addition, Halophila specimens collected in Antigua, which are within the range of morphological variation typical for H. ovalis, are virtually identical to H. johnsonii and the East African H. ovalis samples based upon DNA sequence analyses and these group together using Bayesian clustering analyses of microsatellites and ddRAD SNPs. We conducted population genetic analyses using large number of H. johnsonii samples collected over a 17-year period. Genotypic data generated through microsatellites and ddRAD SNPs revealed genetic uniformity for all 132 H. johnsonii samples across the Indian River Lagoon, Florida, while samples of H. ovalis from Antigua shared the same genotype as H. johnsonii. We conclude that the lack of genetic diversity and the absence of sexual reproduction strongly indicates that the total range of H. johnsonii is actually one clone that is closely related to populations in Africa and Antigua and may be derived from a recent introduction from one of those regions.
Introduction
Halophila johnsonii Eisman is a shallow water marine angiosperm, or seagrass, which has a restricted distribution in areas of the southeast coast of Florida (Virnstein et al., 2009). H. johnsonii was first noted along the east coast of Florida in the latter half of the last century (Phillips, 1960) and was subsequently described as a new species (Eiseman and McMillan, 1980). It is differentiated from other Halophila Thouars species found in the Atlantic by its smooth leaf margins on leaf-pairs at each node and leaf blades lacking both serrations and hairs. Eiseman and McMillan (1980) also noted that H. johnsonii was likely a very close relative to the Indo-Pacific seagrass species H. ovalis (R.Br.) Hook.f. but suggested it differed in leaf form from that species. The emphasis at the time of the original taxonomic description was to differentiate H. johnsonii from the other Atlantic species, which they successfully achieved. As a relatively recently described species, and a seagrass endemic to the east coast of Florida, early collections of H. johnsonii may have been referred to Halophila decipiens Ostenf. or H. baillonii Asch. (e.g., Figure 46 in Phillips, 1960).
The affinities of H. johnsonii to the widespread and variable species H. ovalis were for a long time largely unstudied. Similarity between H. johnsonii and H. ovalis was evaluated in a limited way using isozyme analysis around the time of its description (McMillan, 1980; McMillan and Williams, 1980). However, those studies had limited resolution and sampling and thus provided few insights as to the distinctiveness of these groups. Other early investigations into the relationships among Halophila species utilized newer and emerging molecular markers (e.g., Random Amplified Polymorphic DNA (RAPD) markers (Jewett-Smith et al., 1997; Kenworthy et al., 2007), but these also lacked resolution to definitively determine affinities and/or had serious technical and methodological issues leading to uncertainty in interpretation (Bussell et al., 2005). Thus, genetic markers with greater resolution and with a high degree of confidence in the outcomes are required to generate species level data for evaluating the relationships between H. johnsonii and H. ovalis.
Taxonomically H. ovalis has been variously called a “collective species” (Den Hartog, 1970) and a “complex” (Sachet and Fosberg, 1973; Waycott et al., 2002), reflecting the diversity in apparent form (Den Hartog, 1970; Waycott et al., 2002, 2006; Uchimura et al., 2008). Indeed Den Hartog (1970) describes H. ovalis as a eurybiontic species emphasizing the very wide range of tolerances this species appears to exhibit across a range of gradients including salinity, temperature, depth range, and sediment type. A number of subspecies have been described endeavoring to capture some of the variation observed in the broader species concept for H. ovalis. For example, extreme forms of H. ovalis were separated out as subspecies (Den Hartog, 1970; Sachet and Fosberg, 1973; Kuo and Den Hartog, 2006) – H. ovalis subsp. linearis, characterized by the linear leaf blades and H. ovalis subsp. bullosa, characterized with bullose or bulging leaf blades between the veins. A full revision of Halophila section Halophila is likely required to resolve the taxonomic uncertainty within H. ovalis, however, morphological traits that are not environmentally modified will need to be determined to effectively achieve this.
DNA sequence based phylogenetic analyses have placed H. johnsonii as one of several species closely associated with H. ovalis (e.g., Waycott et al., 2002; Waycott et al., 2006; Uchimura et al., 2008). In addition, a study of Halophila material found on the Caribbean Island of Antigua (Short et al., 2010) casts doubt as to the specific status of H. johnsonii. Based upon rDNA ITS (internal transcribed spacer regions of 18–26S nuclear ribosomal) sequences and morphology, the Antigua material was determined to belong to H. ovalis and was genetically identical to H. johnsonii. These authors also found that the morphological characters that are diagnostic for H. johnsonii fall within the range of variation that occurs in H. ovalis sensu lato, as previously suggested by Waycott et al. (2002), and in particular, were most similar to H. ovalis subsp. linearis from Mozambique, east Africa. However, the status of H. johnsonii requires further investigation given a strong reliance on the ITS region in previous studies. Specific concerns include the possibility of incomplete lineage sorting (ILS) (other issue with ITS sequences may also apply see for example, Bailey et al., 2003), which could go undetected in a single marker study, and insufficient variation to adequately detect recently diverged lineages within the morphologically diverse and geographically widespread H. ovalis complex (Fonseca and Olsen, 2016).
Few studies have attempted to assess the genetic diversity within H. johnsonii. Using RAPDs, Jewett-Smith et al. (1997) detected some genetic variation within H. johnsonii; however, small sample size and use of dominant genetic markers limited the power of this study. Using RAPDs and AFLPs for a range-wide sample, Freshwater et al. (2003) [summarized in Kenworthy et al. (2007)] detected very low levels of genetic diversity both within and among H. johnsonii populations. A separate study, using the same samples as Freshwater et al. (2003) screened AFLPs across 10 populations [Waycott, referred to in Kenworthy et al. (2007)]. The low levels of genetic variability found in this study were attributed to isolation, small population size, and a loss of its ability to set seed. Microsatellites, the markers of choice for seagrass clonality research (e.g., Arnaud-Haond et al., 2005; McMahon et al., 2014, 2017) were later developed for H. ovalis (Xu et al., 2010). A subsequent study using these markers found high genetic diversity in two monospecific H. ovalis populations in the Hepu Dugong National Nature Reserve of Guangxi, China and that a small number of genets consisted of multiple ramets (Xu et al., 2019). One of the main findings was that clonal diversity was high and clones were small compared to other seagrass species (e.g., Arnaud-Haond et al., 2012; Bricker et al., 2018). These findings indicate that H. ovalis is a species that has high turnover meadows that are maintained through sexual reproduction. Preliminary findings pertaining to genetic diversity in H. johnsonii are in stark contrast to the inferences made for H. ovalis by Xu et al. (2019). The availability of microsatellite markers allows further testing of the reproductive biology of H. johnsonii and this study will be the first to use high resolution co-dominant markers to assess genetic diversity in the species.
This study provides a revaluation of the status of H. johnsonii, firstly by assessing the evolutionary relationships of H. johnsonii and the broader the H. ovalis complex using a combination of DNA sequences and SNPs (single nucleotide polymorphisms) generated through ddRAD (double digest restriction-site associated digest) sequencing. A secondary aim is to establish how H. johnsonii is related to other populations in the H. ovalis complex using a population genetic approach. New and previously developed microsatellites along with ddRAD SNPs were screened within and among Halophila populations. Given the restricted distribution of H. johnsonii, and the absence of closely related Halophila species in the Atlantic Ocean, we considered two contrasting hypotheses. First, H. johnsonii is a relic of long-term isolation resulting from contraction/extinction of the broader distribution of H. ovalis in the Atlantic (e.g., Kuo, 2020). Under this hypothesis, we would expect a strong signal of allelic differentiation, with a possibility of some overlapping alleles, and H. johnsonii should be resolved as sister to H. ovalis from the Indo-West Pacific on a phylogenetic tree. The alternative hypothesis invokes a recent long-distance dispersal event to Florida with origins in the Indo-West Pacific H. ovalis complex. Under this proposition, we would expect no, to little allelic differentiation and reduced genetic diversity due to genetic inbreeding and drift. Phylogenetically, samples of H. johnsonii would be expected to cluster with samples of H. ovalis from the Indo-West Pacific.
Materials and Methods
Phylogenetic Data Generation Using Targeted Nuclear and Chloroplast Gene Regions and ddRAD
Sampling
For phylogenetic analyses a total of 105 plant samples were used, including plant material sourced for Halophila species from 19 countries across the Indo Pacific, the Caribbean and the tropical Atlantic Ocean (Figure 1 and Supplementary Tables 1A,B). Material of H. johnsonii included several independent sets of samples obtained at different times and locations (Figure 1 inset and Supplementary Table 1A).
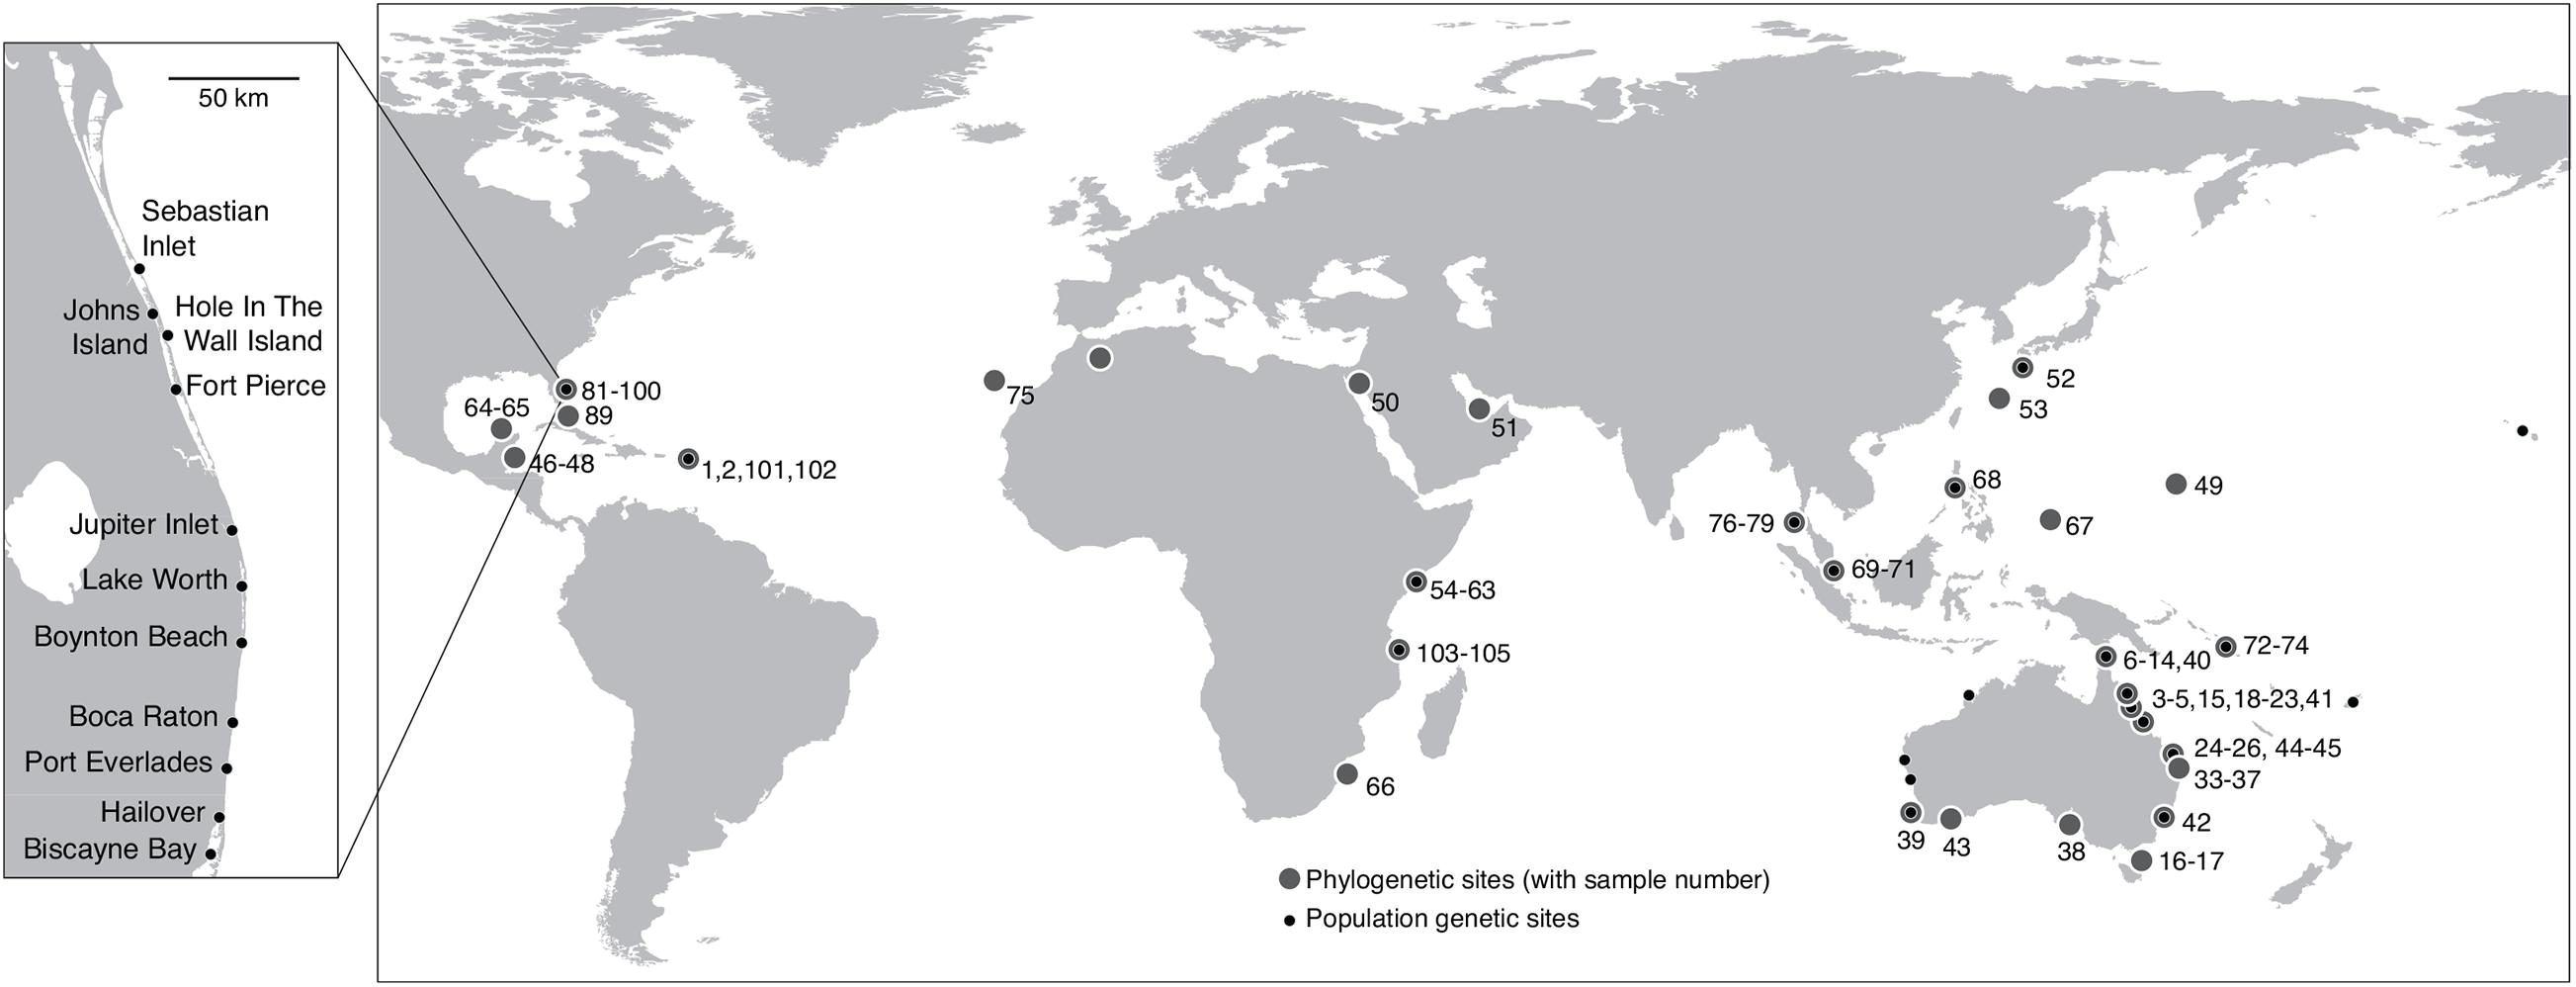
Figure 1. Locations of Halophila samples included in the DNA sequence data sets (large circles). Numbers refer to sample codes used in Supplementary Table 1. Inset map shows the approximate distributional range of H. johnsonii in Florida, United States indicating collection sites for samples included in this study. Sites used for population genetics analyses are indicated by the small dark circles and have no number assigned. Details of the population genetic samples are in Supplementary Table 5.
RNA Bait Design
We used a set of single copy nuclear and plastid loci developed as phylogenetic markers for angiosperms (Waycott et al., 2021; Supplementary Table 2) using the myBaits® target enrichment system (Arbor Science) for sequence capture of the selected loci. In brief, genomic DNA (normalized to 1 ng/uL) was sheared using a Diagenode Bioruptor® Pico sonicator to fragment lengths of c. 300–600 bp. DNA libraries were constructed using a NEBNext® UltraTM II DNA Library Prep with Sample Purification Beads preparation kit (New England Biolabs). To enable bioinformatics processing following Hybrid Capture, truncated “stubby” Y-adaptors (compatible to Illumina TruSeq primers) similar to Glenn et al. (2016) with synthetic “barcodes” were annealed at each end of the DNA fragments. These synthetic DNA barcodes are 8nt in length and situated on the 3′ end of the Read 1 and 2 primer binding sites; 48 adapters were designed for this study and reused every 48 samples. The tag sequences were randomly selected from the “8nt ed3” list provided by Faircloth and Glenn (2012). Hybrid capture was performed following manufactures instructions, hybridization was performed at 65°C and incubated for 24 h. Post capture PCR was performed on the half build libraries to fuse the remaining sequencing adapters with 8nt P5 and P7 indexes. Libraries were pooled in equimolar concentrations and sent for Illumina paired-end sequencing (2 × 150) to the Australian Genome Research Facility (AGRF).
Post Sequencing Data Processing Targeted Genes
High-throughput 150 bp paired-end reads were processed using CLC Genomics Workbench v7.5.1.1 Following demultiplexing and quality trimming (Phred-score threshold of 20), we used de novo assembly of pooled H. ovalis samples to generate a set of reference contigs for the species. In order to recover the targeted nuclear loci, the de novo assembly was converted to a BLAST database and we used reference genomic sequences in Zostera marina downloaded from Phytozome v 122 (Goodstein et al., 2011) as query sequences using an E-value ≤ 1E-20. The de novo contigs matching the Zostera genes were then used as the mapping reference for each individual to generate a per sample assembly at each locus (Supplementary Table 2). From these, we extracted the majority rule consensus sequence inserting “Ns” when coverage was lower than five.
In order to recover the plastid (chloroplast) targets we used the chloroplast genome sequence of Elodea canadensis (Genbank number JQ310743), a member of the same family as Halophila (Hydrocharitaceae) as a mapping reference (Supplementary Table 2). Reads from each sample were mapped to the reference using default parameters with a length fraction of 0.5 and a similarity fraction of 0.85. Consensus sequences were extracted for each individual and locus and were imported into Geneious v11 (Kearse et al., 2012), aligned using the MUSCLE (Edgar, 2004) plugin with default parameters and each alignment was manually checked and adjusted.
The concatenated chloroplast and nuclear DNA data were analyzed separately under maximum likelihood (ML) using RAxML (Stamatakis, 2014) and the GTR Gamma I model of nucleotide substitution (Abadi et al., 2019) with 500 non-parametric bootstrap replicates to assess topological support. We also used the MrBayes 3.2.4 (Huelsenbeck and Ronquist, 2001) Geneious plugin to estimate phylogenies from each data set with Bayesian inference. For both data sets, we used the GTR+I+G model of sequence evolution and 2 independent chains were run over 1,100,000 steps, sampling trees and parameter values every 1,000 steps, and discarding 10% as burnin. Bayesian posterior probabilities (PP) were summarized on the post-burnin topologies combined from the two independent runs per data set.
Genome Wide Screening With ddRAD
A small selection of samples was used for ddRAD analysis, where a total of 48 samples from 13 populations were processed (Supplementary Table 1). The protocol described in Peterson et al. (2012) and adapted as reported in Villacorta-Rath et al. (2016) was used with some modifications. Briefly, ∼100 ng of extracted DNA was digested using restriction enzymes EcoRI-hf and MseI (New England Biolabs), followed by ligation of restriction-site specific adapters with unique barcodes. The DNA library preparation was purified with AMPure XP magnetic beads (Beckman Coulter Life Sciences) and size-selected to 300 and 1,000 bp to avoid amplification of fragments outside of the sequencing range. The size-selected library was amplified in 50 μL reactions using KAPA SYBR® FAST qPCR (Kapa Biosystems) on a LightCycler® 96 Instrument (Roche Diagnostics) using the IlluminaTM sequencing primer sites of the adaptors. Quantitative PCR was performed to determine when to stop the PCR reaction (i.e., when amplification curves reached exponential amplification), which was 15 cycles for this experiment. 3 μL of each sample was run on a 1.5% agarose gel. Each library was then given a visual score of 1–4 (1 = high fluorescence, 2 = medium, 3 = low, and 4 = very low) for fragment lengths around 200 bp (region that will be sequenced). Libraries were pooled based on this score (1 = 7 μL, 2 = 15 μL, 3 = 22 μL, and 4 = 30 μL) in one low-bind tube to equilibrate DNA concentration between libraries. The pooled library was cleaned with 0.7X AMPure XP (Beckman Coulter) and then size selected to 300--400 bp on a Pippin Prep 2% agarose gel (100--600 bp with marker L; Sage Science). Eluates were quantified on a Tape Station (Agilent) with High Sensitivity D1000 ScreenTapes and sent off for sequencing on a NextSeq500 (100 single end Mid Output Kit, Illumina)TM. The library was sequenced at AGRF. Over 196 million reads were generated and imported into CLC genomic workbench seven (Qiagen). These were de-multiplexed according to internal adapter barcodes, trimmed and all clean reads were imported into IPyRAD 0.7.253 (Eaton, 2014). We used a clustering threshold of 0.85 for de novo assembly and discarded loci with <10 individuals (∼20%) represented for that locus. A single SNP per locus was randomly selected and passed for downstream analyses.
Selected SNPs (990) were concatenated and analyzed in RAxML using the GTR Gamma I model of nucleotide substitution and 500 non-parametric bootstrap replicates to assess topological support. In addition, we used a coalescent approach to estimate a lineage tree from the SNP data using SVDquartets (Chifman and Kubatko, 2014) implemented in PAUP∗ (Swofford, 2003). We evaluated 100,000 random quartets with 1,000 non-parametric bootstrap replicates and then the quartet assembly method QFM (Reaz et al., 2014) was used to generate a summary tree.
Population Genetic Analysis Using Microsatellites and SNPs
Development of Microsatellites
Genomic DNA of the 13 H. ovalis test samples (Supplementary Table 5) was isolated from leaf tissue using the DNeasy Plant Kits (Qiagen). An equimolar mix of the DNA samples was sent to GenoScreen (Lille, France) for library preparation and followed methods described by Malausa et al. (2011). Briefly, the samples were fragmented and enriched for TG, TC, AAC, AGG, AAG, ACG, ACAT, and ACTC repeats. The enriched library was then amplified and prepared for sequencing using GS-FLX Titanium chemistry (454 Life Sciences, a Roche Company). A total of 16,331 contigs containing microsatellites were isolated using the QDD software (Meglécz et al., 2010) and a shortlist of 175 validated loci with primers were provided. Seventy-five loci were selected based on repeat motif and number of repeats and ordered for testing. Primer selection criteria included product size expected to be between 100 and 400 bp as well as possessing simple uninterrupted repeats, not complex or compound repeats. Novel primer pairs were tested in a similar way to Bijak et al. (2014). Following initial diversity assessment of new primers and previously published primers (Xu et al., 2010; results in Supplementary Table 3.1) three multiplex panels were designed using Multiplex Manager (Holleley and Geerts, 2009) to reduce laboratory expenses and labor resulting in a 10 loci genotyping panel with fluorescent tags (6-FAM, VIC, and NED). Two loci (HpO28 and HO-8) were added to multiple multiplexes as the dye and size range allowed for it. The reverse primers were slightly modified by adding a PIG-tail (5′-GTTTCT-3′) to the 5′ end to reduce stutters (Brownstein et al., 1996), see Supplementary Table 3.1. The three multiplexes were used for screening of all the population samples following conditions similar to Bijak et al. (2014).
Population Sampling
The population genetic diversity of H. johnsonii was determined using a range of sample sets. The largest set consisted of samples of H. johnsonii from the Indian River Lagoon that were collected in 2000 and 2012 by the Florida Fish and Wildlife Conservation Commission and the University of Virginia. This set included 132 samples from 12 locations across the full range of the species distribution (Supplementary Table 5). Samples of H. ovalis from Antigua, described in Short et al. (2010), were also included in this study. To enable comparison of the genetic diversity of H. johnsonii to related taxa, samples were included from the H. ovalis complex across its geographic range in the Indo-West Pacific region (Supplementary Table 5). Although sampling was sparse for some sites, the genetic information obtained will be sufficient to assess overall genetic diversity within distribution of the H. ovalis complex. A total of 294 samples were successfully genotyped in the microsatellites survey.
Population Analysis Using Microsatellites
Allele calls were extracted from Geneious as .csv files and collated into an Microsoft Excel data sheet and manually transformed and imported into GenoDive (Meirmans and Van Tierden, 2004). To assess clonality, we used the Assign Clones function setting the threshold to 0 (Supplementary Figure 3.3) following the approach suggested by Meirmans and Van Tierden (2004) and Arnaud-Haond et al. (2007). All duplicate genotypes within populations were removed from the data set and all subsequent analyses were performed on a reduced sample set that consisted of 123 multilocus genotypes (MLGs, Supplementary Table 6). Because of the low sample size following the removal of putative clones, only average number of alleles per locus, effective number of alleles, observed heterozygosity, and expected heterozygosity were calculated for each population using GenoDive. The genotypic richness was calculated using equation 5 in Arnaud-Haond et al. (2007). A Principal Components Analysis (PCA) was also performed on genets in GenoDive. A complete dataset was required for this analysis and the “Fill in missing data” option was run based on population allele frequencies. The graph was plotted in DataGraph v4.7.1 (Visual Data Tools Inc.).
To determine how many distinct genetic groups there were in the data, a Bayesian assignment approach was performed using the software Structure (Pritchard et al., 2000). Admixture was specified in the model, allowing genotypes to show membership to more than one cluster. Default settings were used, and sampling locations were not used as priors. Model parameters were set to K = 1–20, with 10 iterations for each value of K, and an initial burn-in period of 100,000 iterations (sufficient for α, FST to converge) followed by 1,000,000 Markov Chain Monte Carlo repetitions. The most likely number of population clusters was determined by the ad hoc estimator ΔK (Evanno et al., 2005) and CLUMPAK (Kopelman et al., 2015) was used for downstream processing.
Population Genetic Analysis Using ddRAD
Following transformation into biallelic numeric Boolean data, the SNPs generated through ddRAD were also analyzed using a population genetic approach (47 samples distributed across 13 populations: Supplementary Table 1A). Clonality was determined with the Assign Clones function in GenoDive, setting the threshold to 6 (Supplementary Figure 3.7) following the approach suggested by Meirmans and Van Tierden (2004) and all duplicate MLGs were removed from the data. Basic genetic diversity parameters average number of alleles per locus, observed heterozygosity and expected heterozygosity were calculated for each population (Supplementary Table 3.4) and locus used (Supplementary Table 3.1) with GenoDive. A PCA was also performed on genets in GenoDive. A complete dataset was required for this analysis and the “Fill in missing data” option was run based on population allele frequencies. The graph was plotted in DataGraph v4.7.1 (Visual Data Tools Inc.).
Structure analyses were performed on the SNP data using same settings as described above. Ten runs were performed with the number of clusters (K) set to 1–15, with an initial burn-in period of 1,00,000 iterations followed by 1,000,000 iterations and the most likely number of clusters was determined using the ΔK statistic.
Results
Three different DNA sequence data sets were generated to assess phylogenetic relationships within Halophila: (1) 16 plastid loci generated from hybridization capture (N = 73 samples), a final concatenated alignment of 17,999 bp (Supplementary Table 2); (2) 7 nuclear loci generated from hybridization capture (N = 36 samples), a final concatenated alignment of 6,449 bp (Supplementary Table 2); and (3) 990 SNP loci generated from ddRAD sequencing (N = 47 samples; data available in Dryad repository doi: 10.5061/dryad.jr8pq). These data represent the most comprehensive data set to compare relationships among a group of marine angiosperms to date. Additionally, two genotypic datasets were generated to assess how H. johnsonii samples relate to each other and to other populations in the H. ovalis complex in a global population genetic context. A large sample set was screened with ten microsatellite loci and a smaller sample was tested with the 990 SNP loci that were generated through ddRAD.
Phylogenetic Relationships Across the Genus Halophila Inferred From Plastid Gene Regions
Plastid phylogenetic relationships among the species of Halophila were generally well resolved (Figure 2). A monophyletic H. ovalis sens. lat is strongly supported and includes two major well-supported sub-clades (clades 1 and 2 in Figure 2). Clade 2 includes samples from north-eastern Australia, while clade 1 includes samples from throughout the Indo-Pacific, as well as H. johnsonii (samples collected in 2000, 2012, and 2017) and H. ovalis from Antigua. The latter are resolved within a well-supported clade (1a in Figure 2) that otherwise includes, exclusively, samples from east Africa including Kenya, Zanzibar and Mozambique. The average patristic distance across the pairwise comparisons of samples forming group 1a was zero (i.e., all individuals share the same haplotype) compared to c. 0.0009 for group 1 overall and c. 0.002 across Group 1 and 2 (i.e., H. ovalis sens. lat.) (Supplementary Table 4).
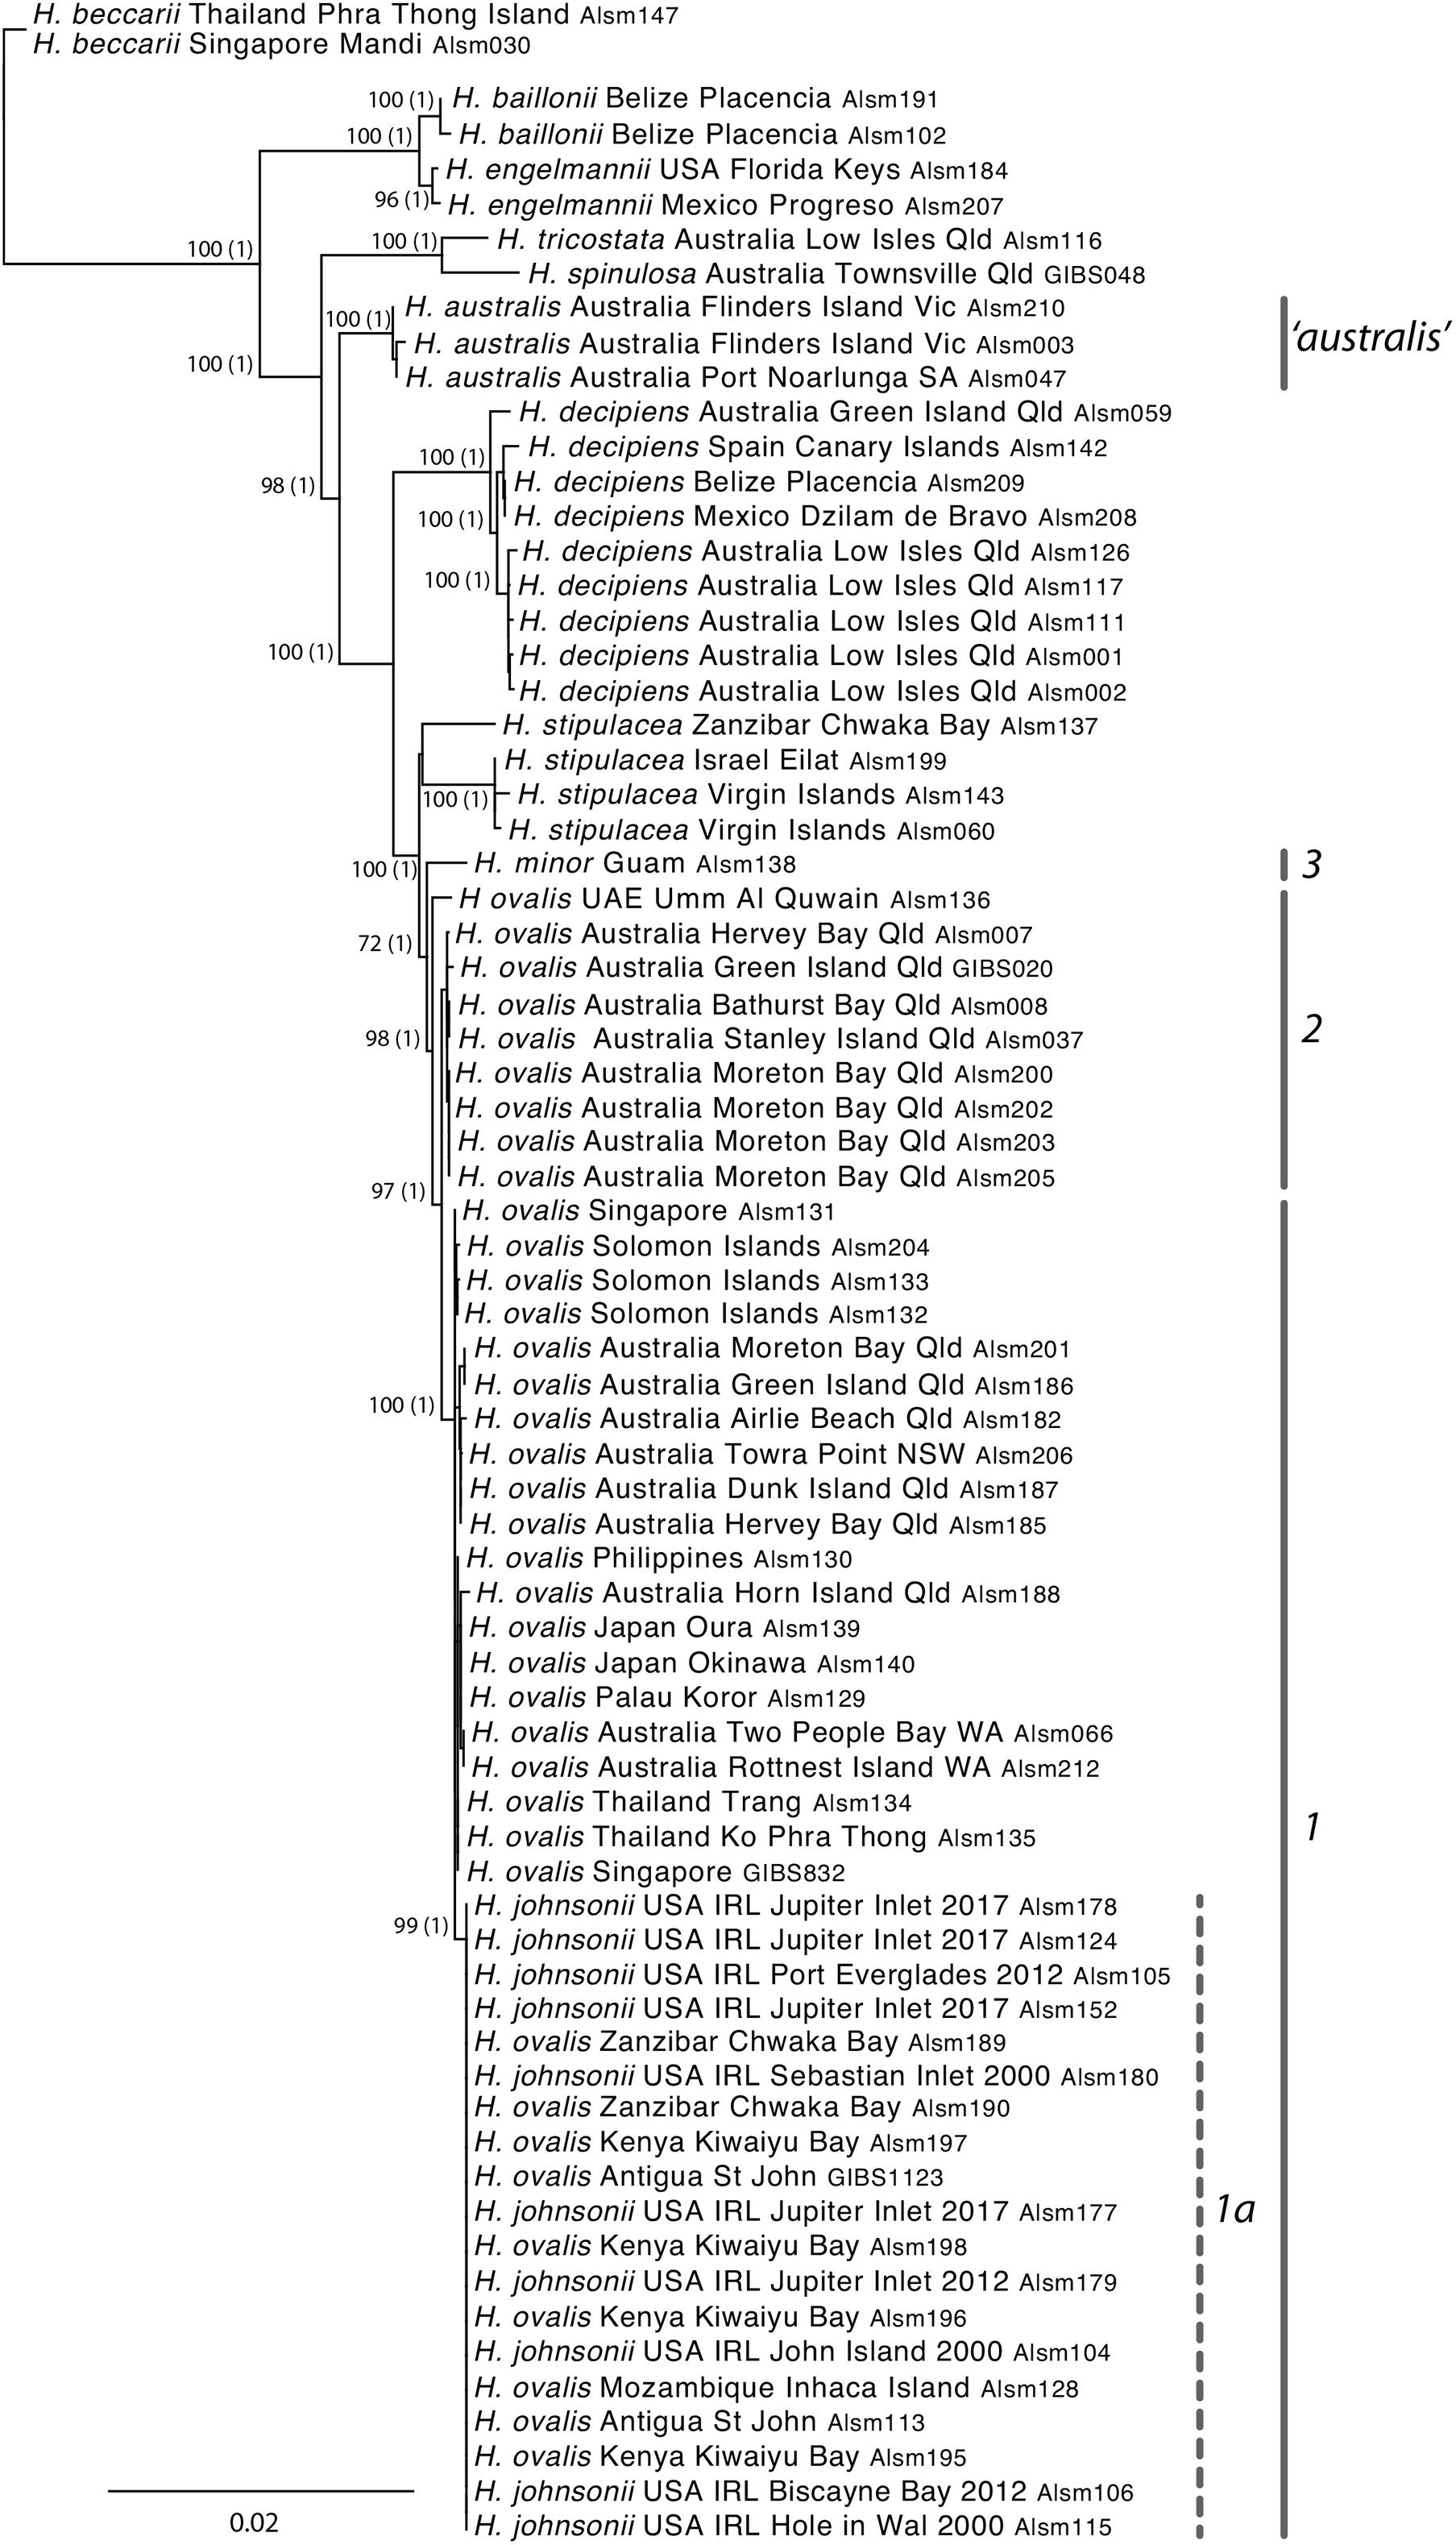
Figure 2. Maximum-likelihood topology obtained from the 16 locus hybridization capture generated plastid (cp) DNA regions for 73 samples of Halophila using RAxML and the GTR Gamma I nucleotide substitution model and 500 bootstrap replicates. ML support values ≥50%, and PP > 0.8 (Bayesian analyses, bracketed) are shown adjacent to the node. Unlabeled nodes had support values lower than this value. Highlighted groups include: 1–Clade III of Uchimura et al. (2008) referred to as H. ovalis group; 1a–including H. johnsonii, along with specimens of H. ovalis from the East coast of Africa, and samples from Antigua; 2– equivalent to clade II of Uchimura et al. (2008) referred to as H. major group; and 3–single specimen likely to be representative of clade IV following Uchimura et al. (2008); “australis” – true Halophila australis only found in southern temperate Australia; A–broader H. ovalis group (sensu lato) used in other analyses.
Phylogenetic Relationships Within the Halophila ovalis Complex Inferred From Nuclear Gene Regions
The results of phylogenetic analysis of nuclear DNA data generated using hybridization capture (Figure 3) recover topologies that are largely consistent with those from the plastid DNA analysis. Specifically, a well-supported clade (1a in Figure 3) includes H. johnsonii along with H. ovalis from Antigua and H. ovalis samples obtained from the east coast of Africa (Kenya and Zanzibar). Group 1a is resolved within Group 1, which includes several well-supported clades (tropical and eastern Australia; Solomon Islands; Thailand and Singapore; and Western Australia) but the relationships among these groups are poorly resolved. These are sister to a well-supported clade comprising individuals from tropical eastern Australia (Group 2 in Figure 3). The overall average patristic distance across the pairwise comparisons of samples within group 1a is extremely low: c. 0.002 overall and 0.00026 for H. johnsonii samples and the Antigua material compared with 0.012 for Group 1 overall and c. 0.013 for H. ovalis sens. lat, (i.e., Groups 1 and 2 in Figure 3), see Supplementary Tables 2, 4.
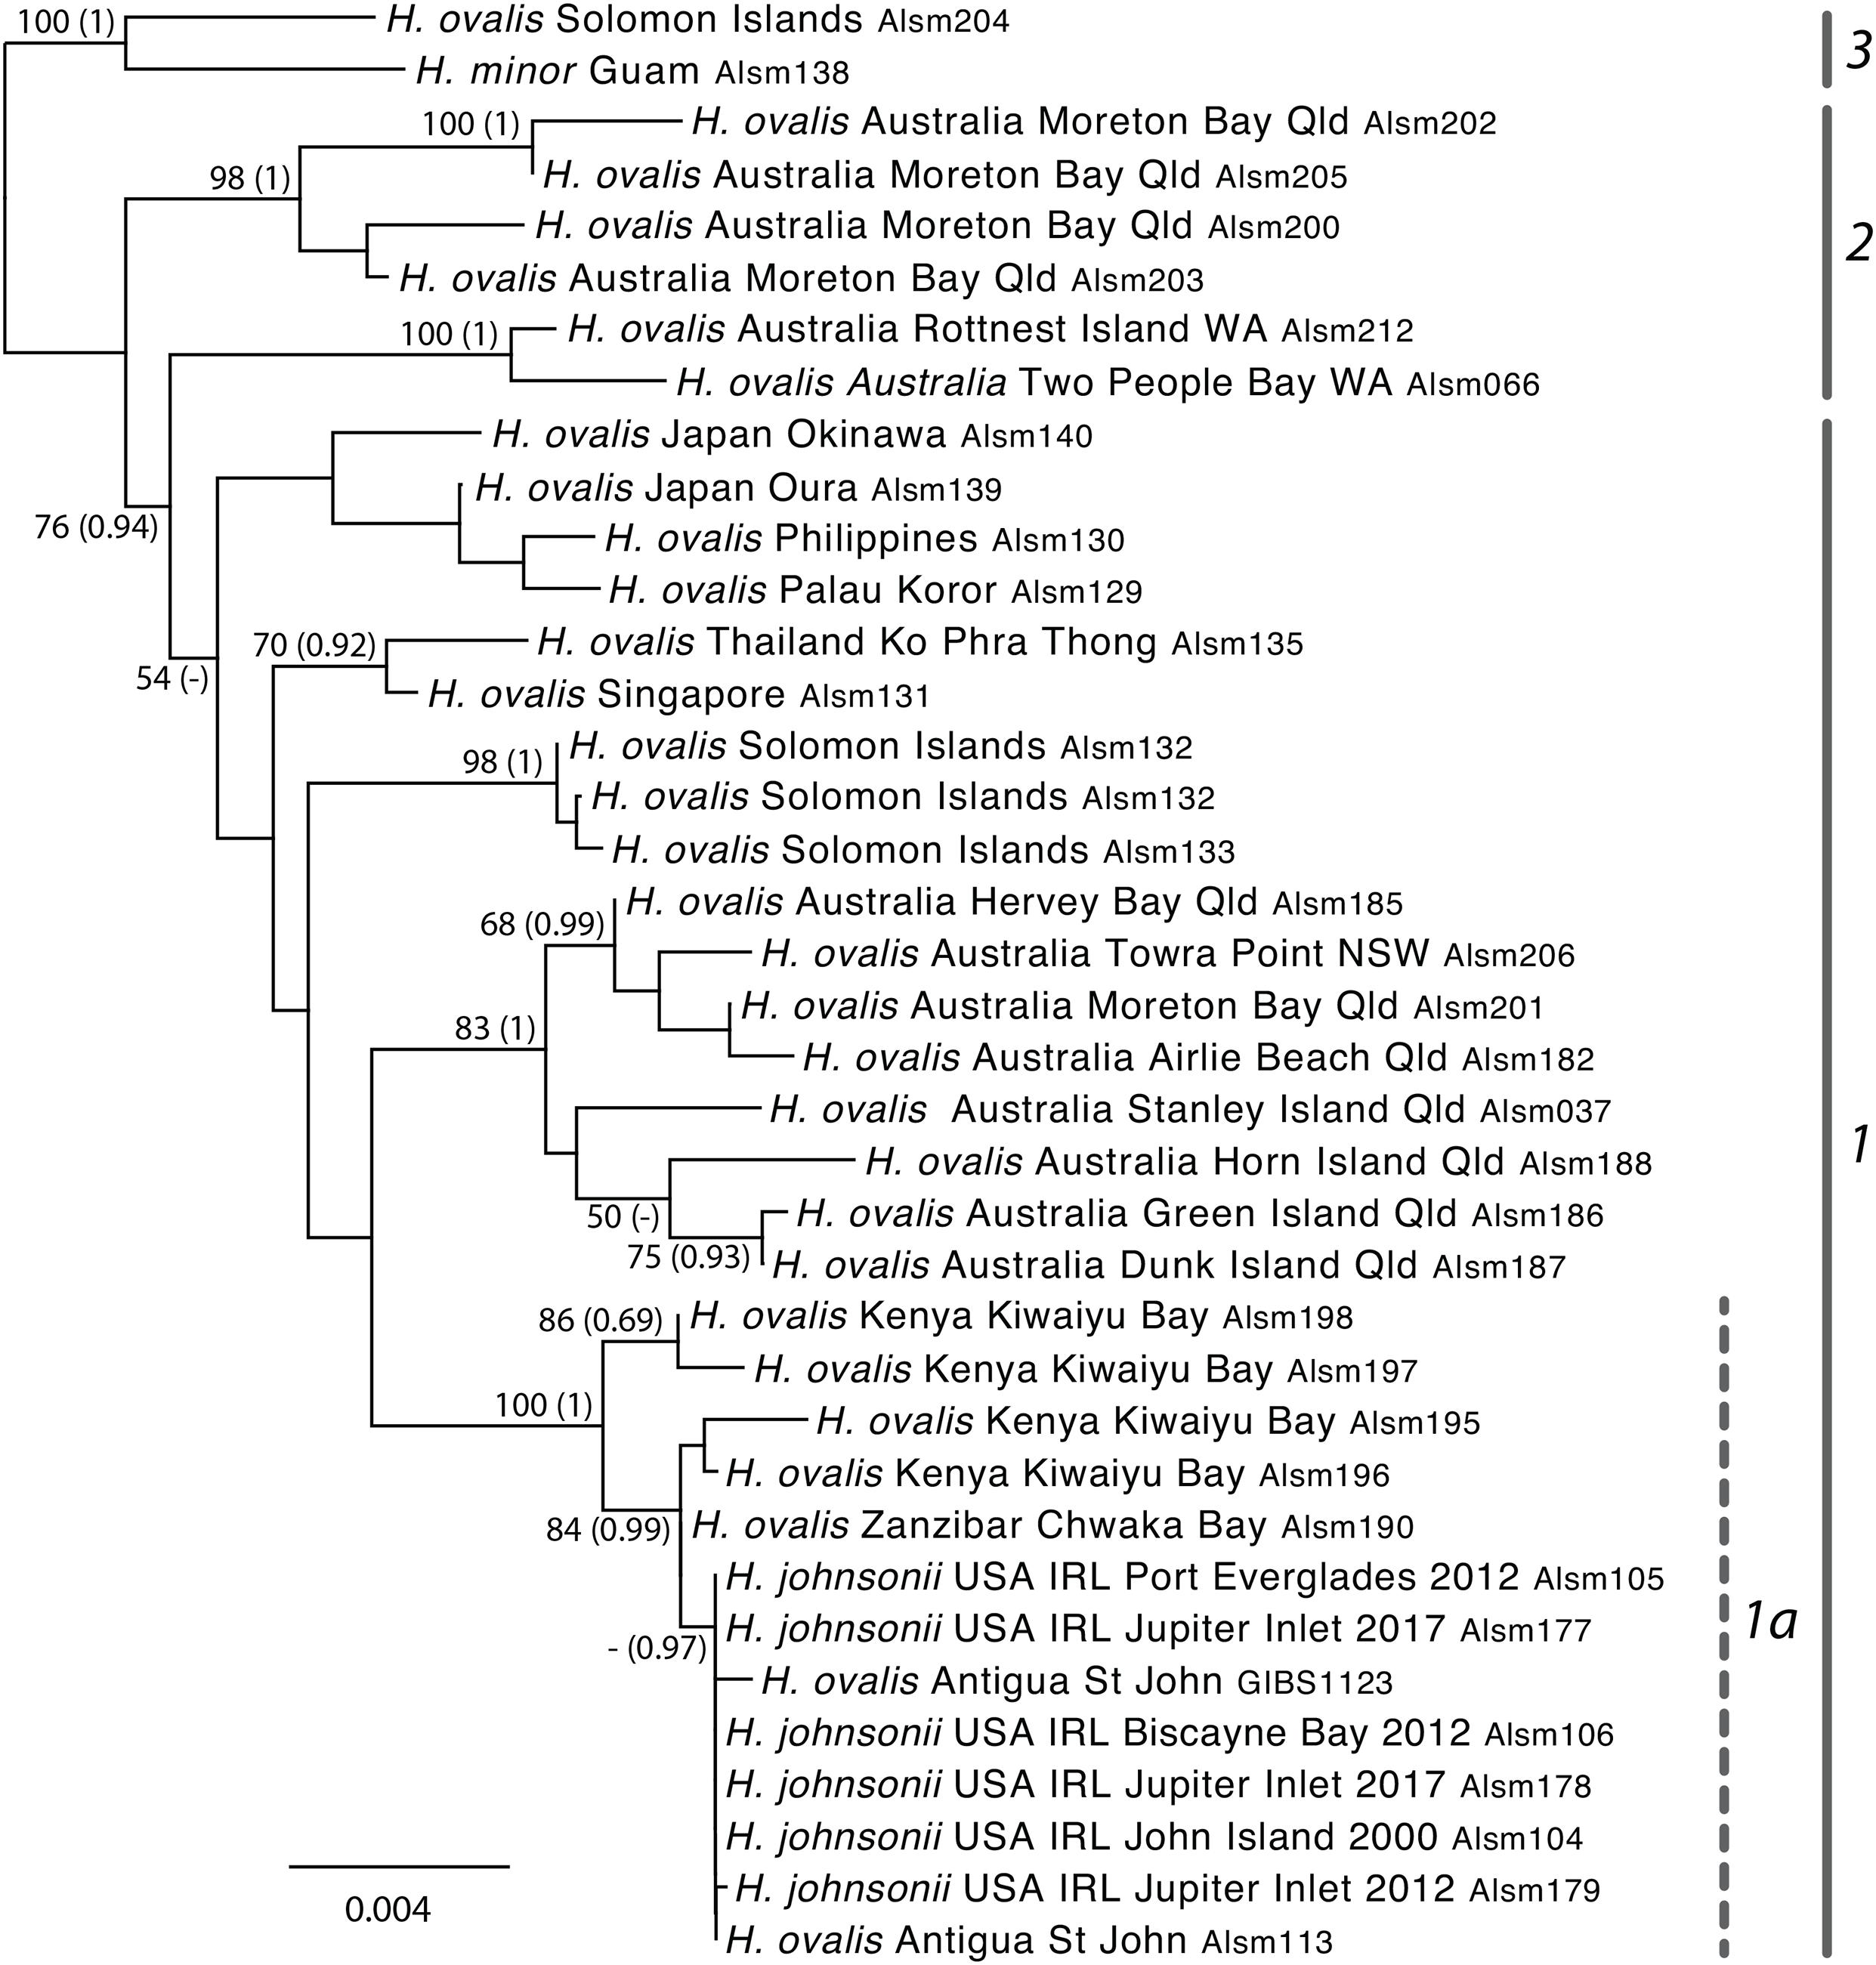
Figure 3. Maximum-likelihood topology obtained from the 7 locus hybridization capture generated for nuclear (nr) gene regions across 38 samples from the seagrass genus Halophila under the GTR Gamma I substitution model using RAxML with 500 bootstrap replicates. ML support values ≥50%, and PP > 0.8 (Bayesian analyses, bracketed) are shown adjacent to the node. Unlabeled nodes had support values lower than this value. Highlighted groups include (as for Figure 2): 1–Clade III of Uchimura et al. (2008) referred to as H. ovalis group; 1a–including H. johnsonii, along with specimens of H. ovalis from the East coast of Africa, and samples from Antigua; 2–equivalent to clade II (H. major group) of Uchimura et al. (2008); and 3–specimens likely to be representative of clade IV following Uchimura et al. (2008).
Phylogenetic Relationships Within the Halophila ovalis Complex Inferred From ddRAD Analysis
Genome-wide screening of anonymous gene regions using ddRAD generated a data set of 990 (presumably) independent SNP loci providing a dataset that could be compared to the hybridization capture data. The phylogenetic analyses using RAxML recovered a similar topology (Figure 4) to those from the plastid and nuclear DNA sequences (Figures 2, 3). In particular, the H. johnsonii samples were not differentiated from each-other, or from H. ovalis from Antigua and these were placed within a well-supported group including the majority of east African samples. The overall average patristic distance across the pairwise comparisons of samples of H. johnsonii samples and the Antigua material was 0.002 compared with an average of 0.21 across the dataset overall, see Supplementary Table 3. The relationships inferred from the SNP markers using SVDquartets (Supplementary Figure 7) are consistent with those inferred from ML analysis of the concatenated SNPs (Figure 4).
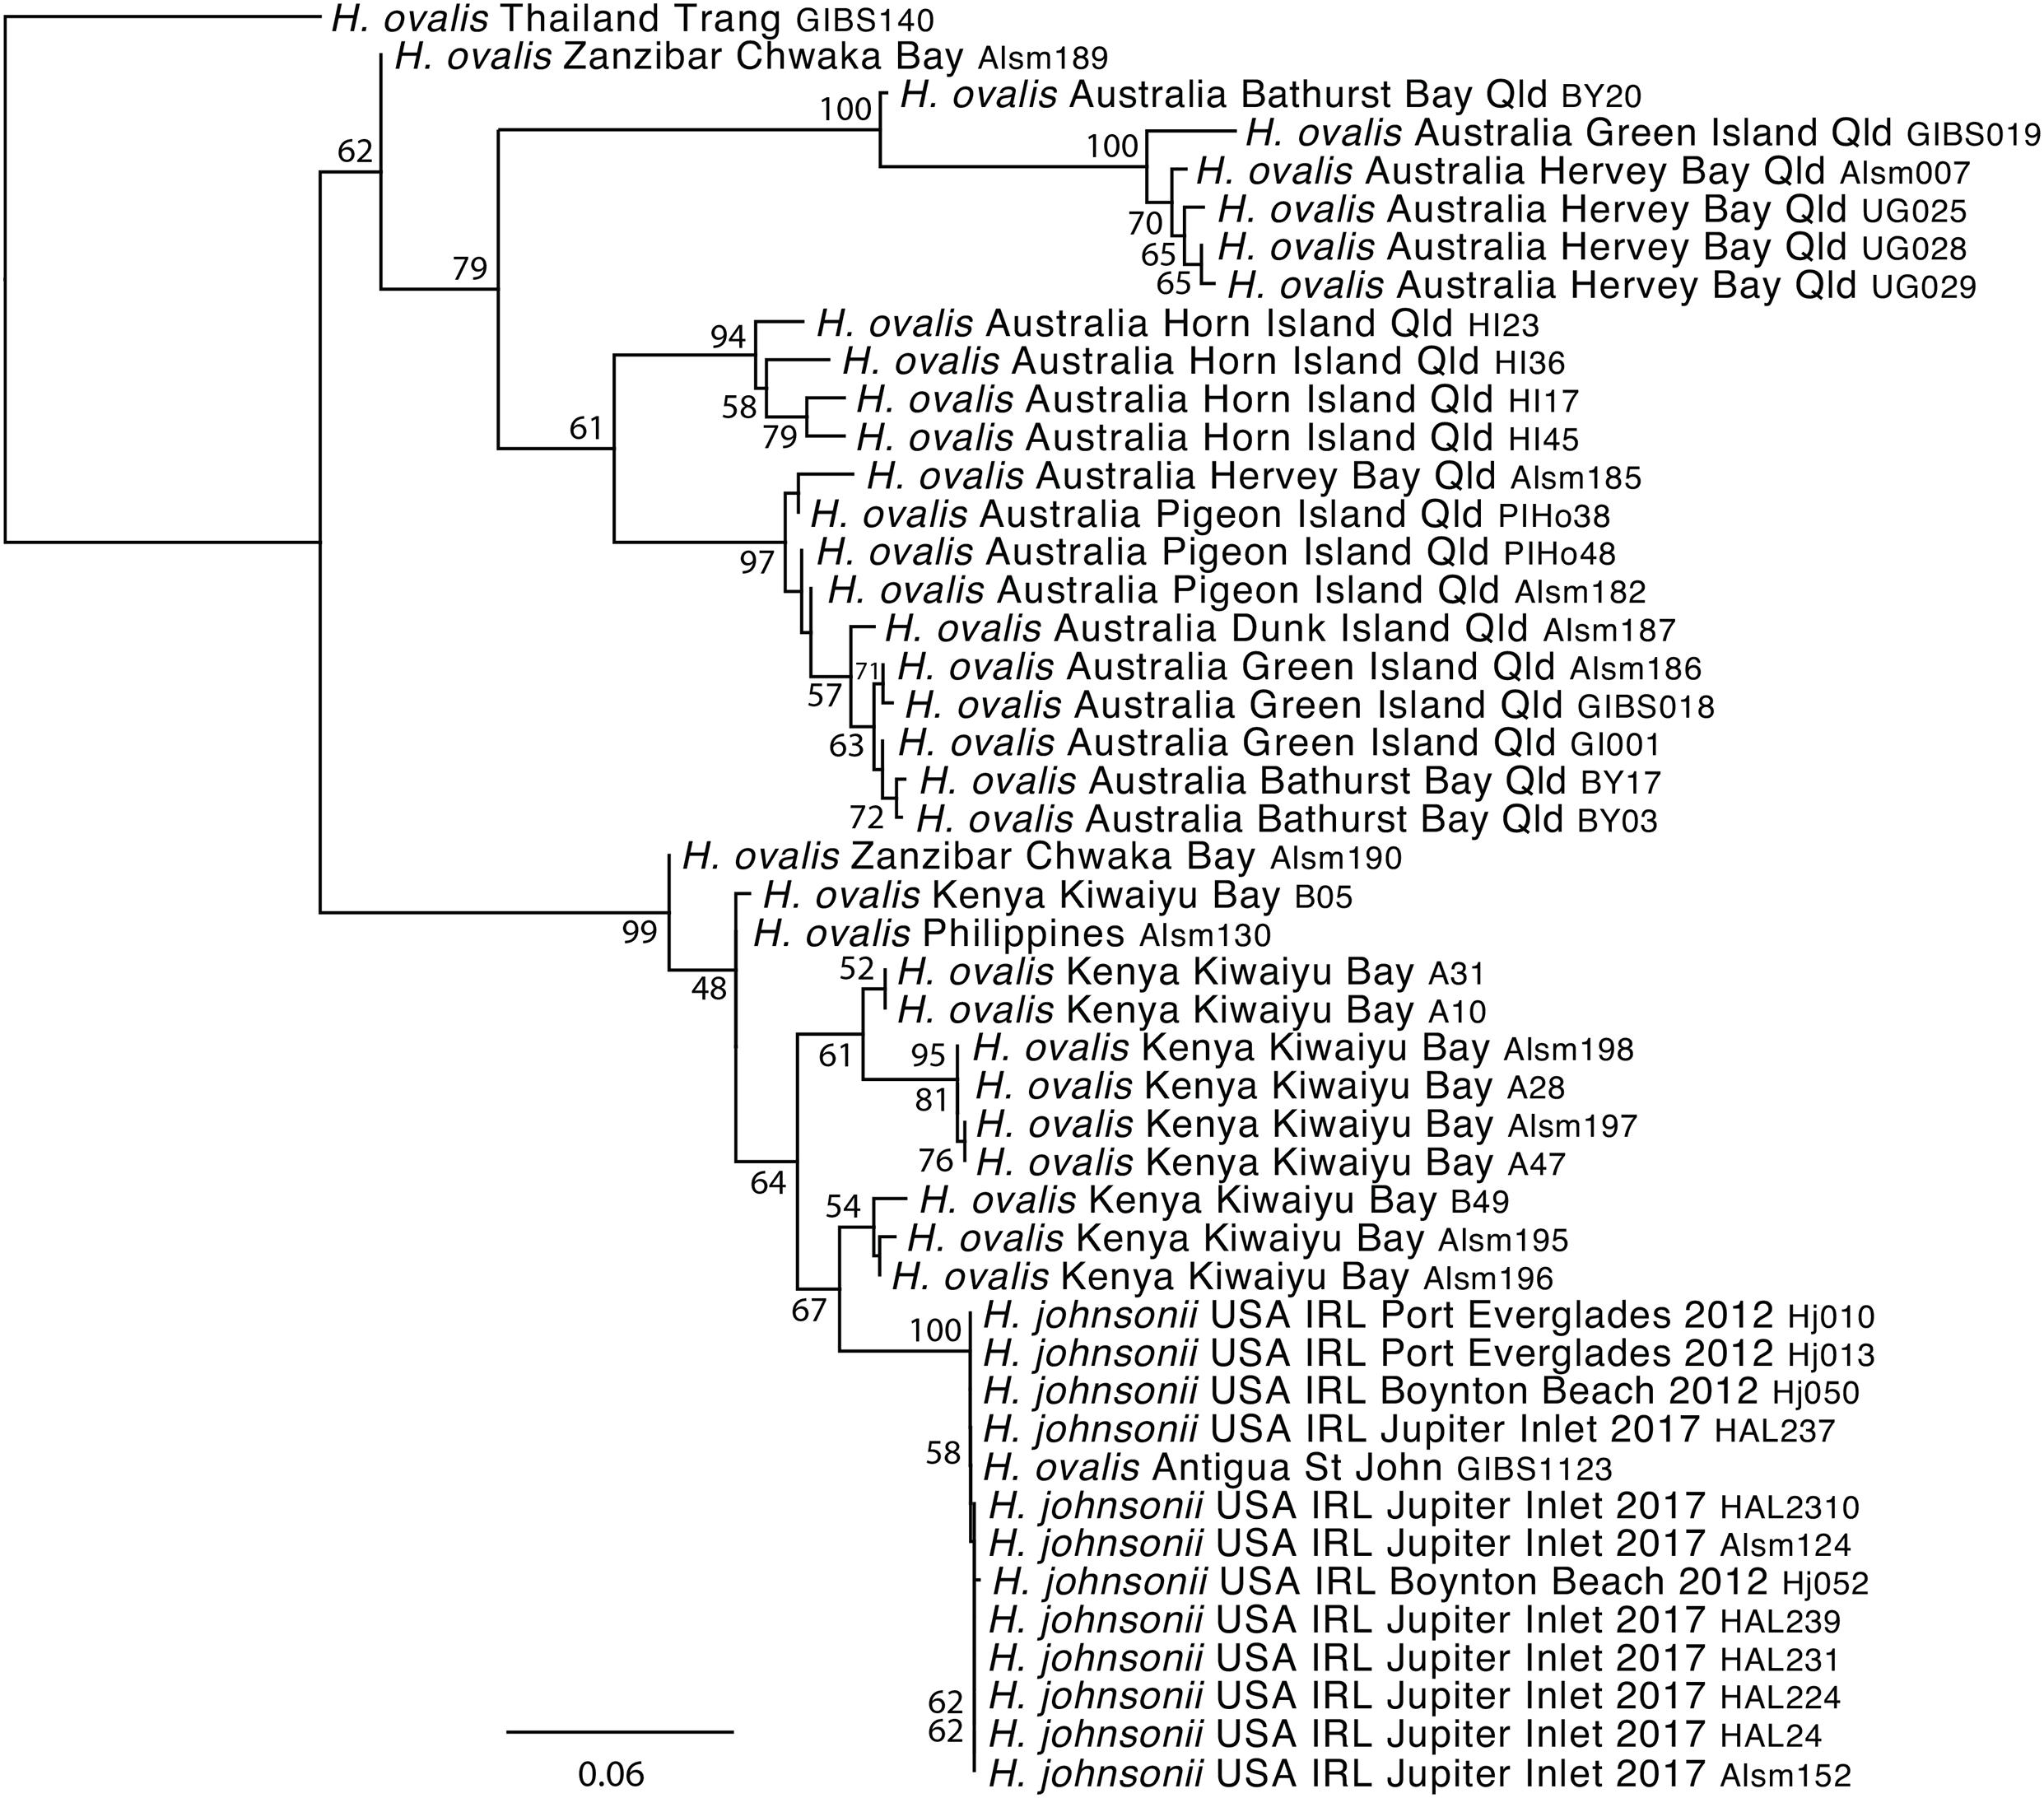
Figure 4. Phylogenetic relationships based on analysis of 990 ddRAD SNPs generated for samples of Halophila johnsonii and the H. ovalis complex (Supplementary Table 1) using RAxML, the GTR Gamma I nucleotide substitution model and 500 bootstrap replicates. Support values ≥80% are shown adjacent to the node and unlabeled nodes had support values lower than this value.
Genetic Diversity of Halophila johnsonii and Other Members of the Halophila ovalis “Complex” Using Microsatellites
Genotypic analysis of H. johnsonii samples collected in the Indian River Lagoon revealed that all MLGs could be collapsed into a single MLG, effectively one sample, contributing to following population genetic analyses (Supplemental Materials 3, 5, 6). The nine samples from Antigua were also collapsed into one MLG, which was identical to that of H. johnsonii (based on 9 microsatellite loci, as Locus HpO22 did not work for the Antigua samples, see Supplementary Table 5). Other populations within the H. ovalis complex had reduced numbers of MLGs due to clonality but most populations retained multiple MLGs for genetic diversity assessment while for some populations each sample was a unique MLG (Supplementary Table 3.4).
Although PCRs did not always yield alleles for all loci, genetic diversity in most populations in the H. ovalis complex was considerable. Allelic diversity was highest in the Solomon Islands (3.9), which is noteworthy considering the small number of samples tested. Heterozygosity values were also calculated and are indicative of significant genetic diversity for the selected markers and populations tested but are not very informative given the small sample sizes (Supplementary Table 3.4).
Population assignment with Structure and ad hoc post analysis using ΔK indicated the most likely number of clusters was 3 (Supplementary Figure 3.5). Figure 5 shows the assignment of MLGs to clusters for values of K from two to four and this sequence of graphs illustrates how samples split into smaller sub-clusters with increasing values of K. At K = 4, samples of H. johnsonii and H. ovalis from Antigua are consistently assigned to the “Blue” cluster and are closely associated with populations from eastern Africa (Kenya and Zanzibar) as was found in each of our phylogenetic data sets. Eastern Australian populations appear to be the most differentiated from all other populations as they form a distinct group at K = 2, followed by Western Australian populations when K = 3 and an Indo Pacific cluster at K = 4. Supplementary Figure 3.6 shows the PCA for the same MLGs.
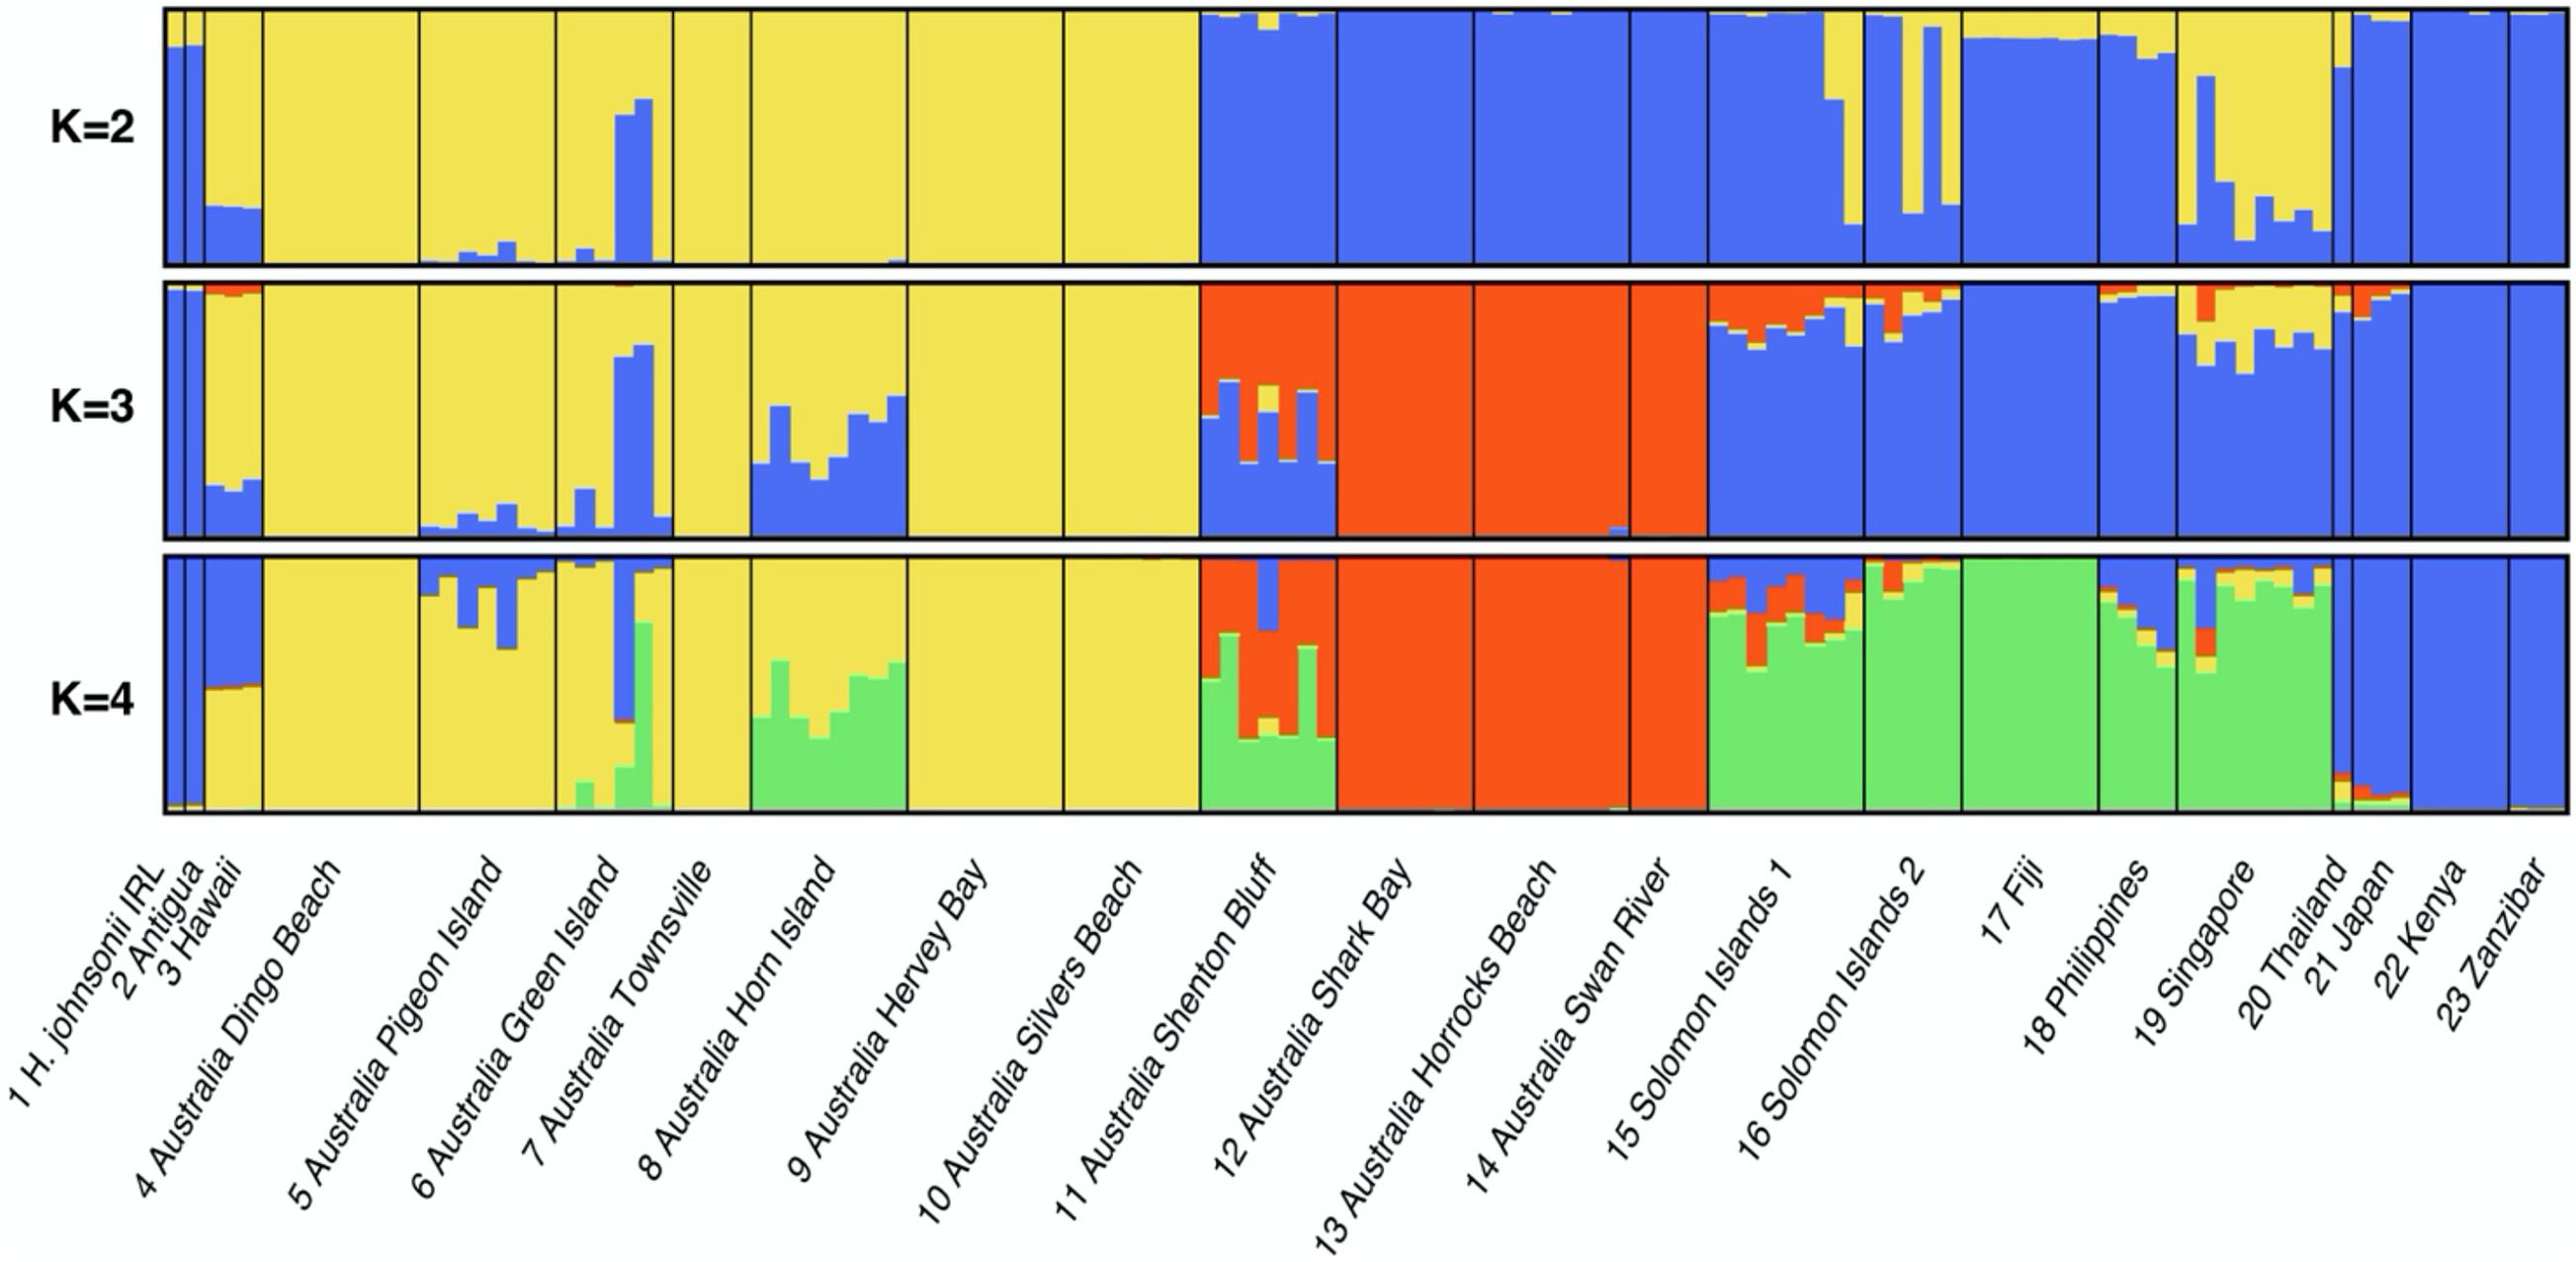
Figure 5. Structure cluster assignment of H. johnsonii and H. ovalis “complex” populations for K = 2, K = 3, and K = 4 based on microsatellite genotyping. Each multilocus genotype is one vertical bar, populations are separated by black lines and cluster assignment is indicated by color. Population details can be found in Supplementary Table 5.
Genetic Diversity of Halophila johnsonii and Other Members of the Halophila ovalis Complex Inferred From ddRAD Analysis
From the initial 47 samples that were screened, removal of duplicate genotypes within populations resulted in 33 samples passing to population analysis. As with the microsatellite data, all H. johnsonii had the same genotype and collapsed into one representative for the species and the H. ovalis samples from Antigua also shared that genotype. Allelic diversity and expected heterozygosity (HE) were highest among the East Australian populations (Supplementary Figure 3.7). Population assignment with Structure resulted in similar clustering as the microsatellites, with K = 3 being the most likely number of clusters in the data (Supplementary Figures 3.9, 3.10). The H. johnsonii and Antigua samples cluster strongly with the Kenyan populations. Supplementary Figure 3.11 shows the PCA with SNP MLGs.
Discussion
This study aimed to establish, with a high degree of confidence, the relationships of H. johnsonii within the broader H. ovalis complex. H. johnsonii is listed under the United States Fish and Wildlife Service ESA and its taxonomic status is of interest to many stakeholders as changes could have far-reaching implications for the ongoing management of the species and its habitat. The results obtained, based on substantial sequencing efforts, demonstrate that H. johnsonii is placed within a monophyletic group that contains diverse representation of H. ovalis samples from widespread geographic origins i.e., Australia (both tropical and subtropical east and west coasts) Japan, Thailand, Philippines, Palau, Singapore, and the Solomon Islands. Furthermore, we found a close relationship between H. johnsonii and samples of H. ovalis from eastern Africa and Antigua using a phylogenetic (Figures 2–4) and a Bayesian clustering approach (Figure 5 and Supplementary Figure 3.9). Taken together, our findings support the hypothesis that H. johnsonii is an outlying population of the Indo-Pacific species, H. ovalis, following a broader species concept for this taxon (Waycott et al., 2002, 2004, 2006, 2014; Uchimura et al., 2008). In fact, genetic diversity of H. johnsonii is so low that all samples share the same MLG and can be “cautiously” considered members of one clone, with strong indications that it is now also present in Antigua (Supplementary Tables 3.4, 5, 6).
Previous studies, based upon rDNA ITS sequencing, also determined a close genetic relationship between H. johnsonii and the Antiguan H. ovalis material (Short et al., 2010) and/or the resolution of H. johnsonii within H. ovalis sens. lat. (e.g., Waycott et al., 2002; Short et al., 2010). However, the limitations of single locus studies have been widely recognized (e.g., Doyle, 1992): in particular, gene histories may be distinct from lineage histories owing to factors such as ILS. The comparison of plastid and nuclear data sets can provide evidence of ILS (e.g., Pelser et al., 2010), which should manifest as conflicting gene trees detected using data with different evolutionary rates and patterns of inheritance. Here, we resolved broadly consistent topologies from our plastid and nuclear data sets (Figures 2, 3). Furthermore, phylogenetic relationships inferred from genome wide ddRAD SNPs, including an approach that is robust to ILS (Chou et al., 2015), found a close relationship of H. johnsonii and H. ovalis samples from Antigua and East Africa (Figure 4 and Supplementary Figure 7). This is consistent with phylogenetic analyses of the nuclear and plastid DNA sequences, as well as clustering analyses using both SNPs and microsatellites (Figure 5 and Supplementary Figure 3.9). Taken together, our findings indicate that ILS is not a factor influencing the resolution of relationships among our focal taxa.
Previous molecular phylogenies have provided relatively limited resolution within the widespread and morphologically variable H. ovalis complex, we suggest in part reflecting the focus on single marker (rDNA ITS) sequencing lacking sufficient variation, as well as a limited sampling of the species range (e.g., Waycott et al., 2002; Uchimura et al., 2008; Short et al., 2010). This “lack of evidence” has cast doubt on assertions that H. johnsonii may be equivalent to H. ovalis (e.g., Fonseca and Olsen, 2016). In the present study, based upon an expanded sampling of H. ovalis (Figure 1), new DNA sequences, SNPs and microsatellite data, we were able to differentiate several groups within H. ovalis (Figures 2–5) consistent with the view that the species is indeed a complex and heterogeneous entity comprising several morphologically and/or geographically distinct lineages. Importantly, our data is sufficient to detect structure within H. ovalis. With respect to H. johnsonii no difference between this species and H. ovalis from Antigua was found, and very limited differentiation from Africa and in any future taxonomic treatment of the H. ovalis complex, these would likely be treated together.
The level of divergence between H. johnsonii, the Antiguan material, and H. ovalis samples from eastern Africa in each of our phylogenetic data sets (Figures 2–4) suggest that the former two entities have only recently separated from the latter, potentially following one or more recent long distance dispersal events from the Indo-West Pacific, and most likely from east Africa. As noted elsewhere (Short et al., 2010; Fonseca and Olsen, 2016), it may be difficult to distinguish amongst human mediated dispersal and natural range extension of seagrass species, and both have been suggested to explain pan-tropical distributions in Halophila: H. stipulacea is believed to be a human mediated introduction to the Tropical Atlantic (Ruiz and Ballantine, 2004), while H. decipiens may have naturally dispersed either from the Indo-Pacific to the Atlantic, or vice-versa, via rafting or floating of vegetative fragments (Waycott et al., 2002). Asexual recruitment via fragment dispersal has also been suggested for H. johnsonii in the Indian River Lagoon (Hall et al., 2006) and a founding event, comprising one or a few such fragments is consistent with the absence of male plants and the very low genetic diversity observed with H. johnsonii. The finding that samples of H. ovalis from Antigua and H. johnsonii share the same MLG (Supplementary Table 6) also supports the potential for long-distance vegetative dispersal, and that H. ovalis in Antigua is in fact a clone of H. johnsonii. This view is reinforced by morphological studies of these entities conducted by Short et al. (2010) and by the lead author of this study (Waycott et al., 2014; H. johnsonii specimens US3616733, 4 and 6; US3160166, 7, Smithsonian Museum, United States National Herbarium; and 2 H. ovalis SeagrassNet specimens from Antigua, F. Short 28) indicating they are morphologically as well as genetically equivalent. Finding genetically and morphologically indistinguishable seagrass populations in these widely separated locations, and not elsewhere, leads to the potential to speculate on the dispersal direction. Given the relative prevalence of the “H. johnsonii” material throughout the Indian River Lagoon and the very limited area of occupancy of the Antigua material, it seems unlikely the Indian River Lagoon population originated in Antigua. The movement of recreational marine vessels between these locations is common and given the documented ability of H. johnsonii to recruit from fragments (Hall et al., 2006), it is possible, albeit speculative, that the direction of colonization would be from Florida to Antigua.
The microsatellite data presented here do not provide a comprehensive population genetic survey of H. ovalis. However, there is sufficient genotypic information to form an impression of how genetic diversity is distributed within the H. ovalis complex. Based on phylogenetic relationships among samples it is clear that members of the different clades are not behaving as a panmictic entities. This is also reflected in the strong genetic structure found in this survey of widespread locations. The development and testing of microsatellite loci in H. ovalis may be complicated by the presence of genetic structure and we recommend establishing the phylogenetic affiliation of samples before performing population genetic surveys using microsatellites. It is worth noting the high genetic diversity, as evidenced by microsatellite based expected heterozygosity, was observed across the geographic distributions of the globally collected samples (Supplementary Table 3.4). In addition, the finding that African populations were so closely related to H. johnsonii and displayed significant genetic diversity even among such few samples (Supplementary Table 3.4) indicated the makers selected are capable of generating genetic diversity fingerprints of H. johnsonii samples if it was present at all. Across this haphazard population sample, genetic diversity measures suggest local scale population processes have a major impact on measurable heterozygosity, and is likely to be related to recruitment and connectivity (McMahon et al., 2014, 2017).
The data presented in this study provide compelling evidence that H. johnsonii and H. ovalis are morphological variants of the same species, and that the ongoing recognition of H. johnsonii is unsupported. Any model for the origins of these populations arising from incipient speciation are less plausible than models of recent, and likely very recent, long-distance dispersal. The implications of this finding are significant. An outcome of this analysis will be a revision of the current H. johnsonii Eiseman species circumscription to be synonymous with H. ovalis (R.Br.) Hook.f. and the need for a re-evaluation of its conservation status.
Data Availability Statement
The datasets presented in this study can be found in online repositories. The names of the repository/repositories and accession number(s) can be found below: https://datadryad.org/stash and doi: 10.5061/dryad.b5mkkwhdt.
Author Contributions
MW provided the project leadership, designed the study, assisted in the sample collection, coordinated and participated in the data collection, analysis and led interpretation and writing of the manuscript, and the preparation of figure, table, and data files. K-JD, AC, and EBi contributed in different aspects of data collection, analysis, and interpretation, and contributed to the writing and editing of the manuscript, the production of figures and tables. EBr contributed to the sample collection, study design, and interpretation the writing, and editing of the manuscript, the production of figures and tables. All authors contributed to the article and approved the submitted version.
Funding
Funding for this project was provided by the Jones Conservation Fund (administered by the University of Virginia during the duration of the project), the James Cook University, The University of Adelaide, the Australian Research Council, the State Herbarium of South Australia, and NOAA.
Conflict of Interest
EBr is employed by EPLJ Music LLC.
The remaining authors declare that the research was conducted in the absence of any commercial or financial relationships that could be construed as a potential conflict of interest.
Publisher’s Note
All claims expressed in this article are solely those of the authors and do not necessarily represent those of their affiliated organizations, or those of the publisher, the editors and the reviewers. Any product that may be evaluated in this article, or claim that may be made by its manufacturer, is not guaranteed or endorsed by the publisher.
Acknowledgments
Generous support of this project was received from colleagues in particular: Jud Kenworthy–NOAA, Penny Hall–Florida Fish and Wildlife Research Institute, Kathryn McMahon–Edith Cowan University (including the important Kenya samples) and a number of people who supplied samples from their work around the world (listed in Supplementary Table 1) but notably Len McKenzie, Fred Short, Siti Yaakub, Brigitta van Tussenbroek, and Rob Quinn.
Supplementary Material
The Supplementary Material for this article can be found online at: https://www.frontiersin.org/articles/10.3389/fmars.2021.740958/full#supplementary-material
Footnotes
- ^ https://www.qiagenbioinformatics.com
- ^ https://phytozome.jgi.doe.gov
- ^ https://github.com/dereneaton/ipyrad
References
Abadi, S., Azouri, D., Pupko, T., and Mayrose, I. (2019). Model selection may not be a mandatory step for phylogeny reconstruction. Nat. Commun. 10:934.
Arnaud-Haond, S., Alberto, F., Teixeira, S., Procaccini, G., Serrão, E. A., and Duarte, C. M. (2005). Assessing genetic diversity in clonal organisms: low diversity or low resolution? Combining power and cost efficiency in selecting markers. J. Heredity 96, 434–440. doi: 10.1093/jhered/esi043
Arnaud-Haond, S., Duarte, C. M., Alberto, F., and Serrão, E. A. (2007). Standardizing methods to address clonality in population studies. Mol. Ecol. 16, 5115–5139. doi: 10.1111/j.1365-294x.2007.03535.x
Arnaud-Haond, S., Duarte, C. M., Diaz-Almela, E., Marba, N., Sintes, T., and Serrao, E. A. (2012). Implications of extreme life span in clonal organisms: millenary clones in meadows of the threatened seagrass Posidonia oceanica. PLoS One 7:e30454. doi: 10.1371/journal.pone.0030454
Bailey, C. D., Carr, T. G., Harris, S. A., and Hughes, C. E. (2003). Characterization of angiosperm nrDNA polymorphism, paralogy, and pseudogenes. Mol. Phylogenet. Evol. 29, 435–455. doi: 10.1016/j.ympev.2003.08.021
Bijak, A. L., Van Dijk, K.-J., and Waycott, M. (2014). Development of microsatellite markers for a tropical seagrass, Syringodium filiforme (Cymodoceaceae). Appl. Plant Sci. 2:1400082. doi: 10.3732/apps.1400082
Bricker, E., Calladine, A., Virnstein, R., and Waycott, M. (2018). Mega clonality in an aquatic plant – a potential survival strategy in a changing environment. Front. Plant Sci. 9:435.
Brownstein, M. J., Carpten, J. D., and Smith, J. R. (1996). Modulation of non-templated nucleotide addition by Taq DNA polymerase: primer modifications that facilitate genotyping. BioTechniques 20, 1008–1010.
Bussell, J. D., Waycott, M., and Chappill, J. A. (2005). Arbitrarily amplified DNA markers as characters for phylogenetic inference. Perspect. Plant Ecol. Evol. Syst. 7, 3–26. doi: 10.1016/j.ppees.2004.07.001
Chifman, J., and Kubatko, L. (2014). Quartet inference from SNP data under the coalescent model. Bioinformatics 30, 3317–3324. doi: 10.1093/bioinformatics/btu530
Chou, J., Gupta, A., Yaduvanshi, S., Davidson, R., Nute, M., Mirarab, S., et al. (2015). A comparative study of SVDquartets and other coalescent-based species tree estimation methods. BMC Genom. 16:S2.
Doyle, J. J. (1992). Gene trees and species trees: molecular systematics as one-character taxonomy. Syst. Bot. 2, 144–163. doi: 10.2307/2419070
Eaton, D. a. R. (2014). PyRAD: assembly of de novo RADseq loci for phylogenetic analyses. Bioinformatics 30, 1844–1849. doi: 10.1093/bioinformatics/btu121
Edgar, R. C. (2004). MUSCLE: multiple sequence alignment with high accuracy and high throughput. Nucleic Acids Res. 32, 1792–1797. doi: 10.1093/nar/gkh340
Eiseman, N. J., and McMillan, C. (1980). A new species of seagrass, Halophila johnsonii, from the atlantic coast of florida. Aquat. Bot. 9, 15–19. doi: 10.1016/0304-3770(80)90003-0
Evanno, G., Regnaut, S., and Goudet, J. (2005). Detecting the number of clusters of individuals using the software STRUCTURE: a simulation study. Mol. Ecol. 14, 2611–2620. doi: 10.1111/j.1365-294x.2005.02553.x
Faircloth, B. C., and Glenn, T. C. (2012). Not all sequence tags are created equal: designing and validating sequence identification tags robust to indels. PLoS One 7:e42543. doi: 10.1371/journal.pone.0042543
Fonseca, M. S., and Olsen, J. L. (2016). The enigmatic seagrass: the complex and emerging story of Johnson’s seagrass. ECO Magazine 20–33.
Freshwater, D. W., York, R. A., Kenworthy, W. J., and Waycott, M. (2003). Multi-Locus Genotyping of the Threatened Seagrass, Halophila johnsonii Eiseman Reveals a High Level of Clonality. Report to National Oceanic and Atmospheric Administration. Wilmington, NC: University of North Carolina.
Glenn, T. C., Nilsen, R., Kieran, T. J., Finger, J. W., Pierson, T. W., Bentley, K. E., et al. (2016). Adapterama I: Universal stubs and primers for thousands of dual-indexed Illumina libraries (iTru & iNext). bioRxiv [Preprint]. 049114
Goodstein, D. M., Shu, S., Howson, R., Neupane, R., Hayes, R. D., Fazo, J., et al. (2011). Phytozome: a comparative platform for green plant genomics. Nucleic Acids Res. 40, D1178–D1186.
Hall, L. M., Hanisal, M. D., and Virnstein, R. W. (2006). Fragment of the seagrasses Halodule wrightii and Halophila johnsonii as potential recruits in Indian River Lagoon, Florida. Mar. Ecol. Progr. Ser. 310, 109–117. doi: 10.3354/meps310109
Holleley, C. E., and Geerts, P. G. (2009). Multiplex manager 1.0: a cross-platform computer program that plans and optimizes multiplex PCR. BioTechniques 46, 511–517. doi: 10.2144/000113156
Huelsenbeck, J. P., and Ronquist, F. (2001). MRBAYES: Bayesian inference of phylogenetic trees. Bioinformatics 17, 754–755. doi: 10.1093/bioinformatics/17.8.754
Jewett-Smith, J., Mcmillan, C., Kenworthy, W. J., and Bird, K. (1997). Flowering and genetic banding patterns of Halophila johnsonii and conspecifics. Aquat. Bot. 59, 323–331. doi: 10.1016/s0304-3770(97)00064-8
Kearse, M., Moir, R., Wilson, A., Stones-Havas, S., Cheung, M., Sturrock, S., et al. (2012). Geneious Basic: an integrated and extendable desktop software platform for the organization and analysis of sequence data. Bioinformatics 28, 1647–1649. doi: 10.1093/bioinformatics/bts199
Kenworthy, W. J., Norton, S., Harter, S., and Landry, J. B. (2007). Endangered Species Act 5-Year Review Johnson’s Seagrass (Halophila johnsonii Eiseman). Silver Spring, MD: National Marine Fisheries Service.
Kopelman, N. M., Mayzel, J., Jakobsson, M., Rosenberg, N. A., and Mayrose, I. (2015). Clumpak: a program for identifying clustering modes and packaging population structure inferences across K. Mol. Ecol. Resour. 15, 1179–1191. doi: 10.1111/1755-0998.12387
Kuo, J. (2020). Taxonomy of the genus Halophila Thouars (Hydocharitaceae): a review. Plants (Basel Switzerl.) [Online] 9:1732. doi: 10.3390/plants9121732
Kuo, J., and Den Hartog, C. (2006). “Taxonomy and biogeography of seagrasses,” in Seagrasses: Biology, Ecology and Conservation, eds A. W. D. Larkum, R. J. Orth, and C. M. Duarte (Dordrecht: Springer), 1–23. doi: 10.1007/978-1-4020-2983-7_1
Malausa, T., Gilles, A., Meglécz, E., Blanquart, H., Duthoy, S., Costedoat, C., et al. (2011). High-throughput microsatellite isolation through 454 GS-FLX Titanium pyrosequencing of enriched DNA libraries. Mol. Ecol. Resour. 11, 638–644. doi: 10.1111/j.1755-0998.2011.02992.x
McMahon, K. M., Evans, R. D., Van Dijk, K.-J., Hernawan, U., Kendrick, G. A., Lavery, P. S., et al. (2017). Disturbance is an important driver of clonal richness in tropical seagrasses. Front. Plant Sci. 8:2026. doi: 10.3389/fpls.2017.02026
McMahon, K., Van Dijk, K.-J., Ruiz-Montoya, L., Kendrick, G. A., Krauss, S. L., Waycott, M., et al. (2014). The movement ecology of seagrasses. Proc. R. Soc. B Biol. Sci. 282:20140878.
McMillan, C. (1980). Isozymes of tropical seagrasses from the Indo-Pacific and the Gulf of Mexico—Caribbean. Aquat. Bot. 8, 163–172. doi: 10.1016/0304-3770(80)90048-0
McMillan, C., and Williams, S. C. (1980). Systematic implications of isozymes in Halophila section Halophila. Aquat. Bot. 9, 21–31. doi: 10.1016/0304-3770(80)90004-2
Meglécz, E., Costedoat, C., Dubut, V., Gilles, A., Malausa, T., Pech, N., et al. (2010). QDD: a user-friendly program to select microsatellite markers and design primers from large sequencing projects. Bioinformatics 26, 403–404. doi: 10.1093/bioinformatics/btp670
Meirmans, P. G., and Van Tierden, P. H. (2004). GENOTYPE and GENODIVE: two programs for the analysis of genetic diversity in asexual organisms. Mol. Ecol. Notes 4, 792–794. doi: 10.1111/j.1471-8286.2004.00770.x
Pelser, P. B., Kennedy, A. H., Tepe, E. J., Shidler, J. B., Nordenstam, B., Kadereit, J. W., et al. (2010). Patterns and causes of incongruence between plastid and nuclear Senecioneae (Asteraceae) phylogenies. Am. J. Bot. 97, 856–873. doi: 10.3732/ajb.0900287
Peterson, B. K., Weber, J. N., Kay, E. H., Fisher, H. S., and Hoekstra, H. E. (2012). Double digest RADseq: an inexpensive method for de novo SNP discovery and genotyping in model and non-model species. PLoS One 7:e37135. doi: 10.1371/journal.pone.0037135
Phillips, R. C. (1960). Observations on the Ecology and Distribution of the Florida Seagrasses. St Petersburg, FL: Florida State Board of Conservation, Marine Laboratory.
Pritchard, J. K., Stephens, M., and Donnelly, P. (2000). Inference of population structure using multilocus genotype data. Genetics 155, 945–959. doi: 10.1093/genetics/155.2.945
Reaz, R., Bayzid, M. S., and Rahman, M. S. (2014). Accurate phylogenetic tree reconstruction from quartets: a heuristic approach. PLoS One 9:e104008.
Ruiz, H., and Ballantine, D. L. (2004). Occurrence of the seagrass Halophila stipulacea in the tropical West Atlantic. Bull. Mar. Sci. 75, 131–135.
Sachet, M. H., and Fosberg, F. R. (1973). Remarks on Halophila (Hydrocharitaceae). Taxon 22, 439–443. doi: 10.2307/1219332
Short, F. T., Moore, G. E., and Peyton, K. A. (2010). Halophila ovalis in the Tropical Atlantic Ocean. Aquat. Bot. 93, 141–146. doi: 10.1016/j.aquabot.2010.05.001
Stamatakis, A. (2014). RAxML version 8: a tool for phylogenetic analysis and post-analysis of large phylogenies. Bioinformatics 30, 1312–1313. doi: 10.1093/bioinformatics/btu033
Swofford, D. (2003). PAUP∗ ver 4.0. b10. Phylogenetic Analysis Using Parsimony and Other Methods Sunderland. Sunderland, MA: Sinauer Associates.
Uchimura, M., Faye, E. J., Shimada, S., Inoue, T., and Nakamura, Y. (2008). A reassessment of Halophila species (Hydrocharitaceae) diversity with special reference to Japanese representatives. Bot. Mar. 51, 258–268.
Villacorta-Rath, C., Ilyushkina, I., Strugnell, J. M., Green, B. S., Murphy, N. P., Doyle, S. R., et al. (2016). Outlier SNPs enable food traceability of the southern rock lobster, Jasus edwardsii. Mar. Biol. 163:223.
Virnstein, R. W., Hayek, L. C., and Morris, L. J. (2009). Pulsating patches: a model for the spatial and temporal dynamics of the threatened seagrass Halophila johnsonii. Mar. Ecol. Progr. Ser. 385, 97–109. doi: 10.3354/meps08039
Waycott, M., Freshwater, D. W., York, R. A., Calladine, A., and Kenworthy, W. J. (2002). Evolutionary trends in the seagrass genus Halophila (Thouars): Insights from molecular phylogeny. Bull. Mar. Sci. 71, 1299–1308.
Waycott, M., Mcmahon, K. M., Mellors, J. E., Calladine, A., and Kleine, D. (2004). A Guide to Tropical Seagrasses of the Indo-West Pacific. Townsville, OLD: James Cook University.
Waycott, M., Mcmahon, K., and Lavery, P. (2014). A Guide to Southern Temperate Seagrasses. Melbourne: CSIRO Publishing.
Waycott, M., Procaccini, G., Les, D. H., and Reusch, T. B. H. (2006). “Seagrass evolution, ecology and conservation: a genetic perspective,” in Seagrasses: Biology, Ecology and Conservation, eds W. D. Larkum, R. J. Orth, and C. M. Duarte (Dordrecht: Springer), 25–50. doi: 10.1007/1-4020-2983-7_2
Waycott, M., Van Dijk, K.-J., and Biffin, E. (2021). A hybrid capture RNA bait set for resolving genetic and evolutionary relationships in angiosperms from deep phylogeny to intraspecific lineage hybridization. BioRxiv, doi: 10.1101/2021.09.06.456727
Xu, N., Yu, S., Zhang, J., Tsang, P., and Chen, X. (2010). Microsatellite primers for Halophila ovalis and cross amplification in H. minor (Hydrocharitaceae). Am. J. Bot. 97, E56–E57.
Keywords: Halophila johnsonii, species complex, seagrass, Indian River Lagoon, Florida, microsatellites, ddRAD, hybrid capture
Citation: Waycott M, van Dijk K-j, Calladine A, Bricker E and Biffin E (2021) Genomics-Based Phylogenetic and Population Genetic Analysis of Global Samples Confirms Halophila johnsonii Eiseman as Halophila ovalis (R.Br.) Hook.f.. Front. Mar. Sci. 8:740958. doi: 10.3389/fmars.2021.740958
Received: 14 July 2021; Accepted: 20 August 2021;
Published: 08 October 2021.
Edited by:
Christian Marcelo Ibáñez, Andrés Bello University, ChileReviewed by:
Jutta Papenbrock, Leibniz University Hannover, GermanyMarie-Laure Guillemin, Austral University of Chile, Chile
Copyright © 2021 Waycott, van Dijk, Calladine, Bricker and Biffin. This is an open-access article distributed under the terms of the Creative Commons Attribution License (CC BY). The use, distribution or reproduction in other forums is permitted, provided the original author(s) and the copyright owner(s) are credited and that the original publication in this journal is cited, in accordance with accepted academic practice. No use, distribution or reproduction is permitted which does not comply with these terms.
*Correspondence: Michelle Waycott, bWljaGVsbGUud2F5Y290dEBhZGVsYWlkZS5lZHUuYXU=
†These authors have contributed equally to this work