 Luisa Listmann
 Franziska Kerl
 Nele Martens1
94% of researchers rate our articles as excellent or good
Learn more about the work of our research integrity team to safeguard the quality of each article we publish.
Find out more
ORIGINAL RESEARCH article
Front. Mar. Sci., 05 October 2021
Sec. Aquatic Physiology
Volume 8 - 2021 | https://doi.org/10.3389/fmars.2021.740763
This article is part of the Research TopicPhysiological Impacts of Global Warming in Aquatic OrganismsView all 5 articles
Pico-phytoplankton have ample scope to react to environmental change. Nevertheless, we know little about the underlying physiological mechanisms that govern how evolutionary history may affect short-term responses to environmental change. We investigated growth rates and carbon uptake related traits at 15° and 22°C and at different times during the microbial growth curve (lag phase, mid and late exponential) of eight novel strains of Ostreococcus sp. (ca. 1 μm). The strains were isolated from two distinct regions of the Baltic Sea differing in salinity and temperature as well as variability therein from North-East (Bornholm Basin) to South-West (Kiel area). Strains from Kiel area had ca. 10% higher growth rates on average and showed more variation between strains compared to strains from the Bornholm Basin. While biomass increased throughout the experiment in both temperature, CUE (carbon use efficiency, indicative of photosynthetically derived carbon available for growth) was too low to explain positive growth throughout the entire growth curve at 15°C and during the early stages at 22°C. Throughout the growth curve CUE then increased enough to sustain growth, but only at 22°C. Consequently, we then tested whether Ostreococcus use organic carbon to supplement growth when light is not a limiting factor. We show that Ostreococcus qualitatively modulate their potential to grow on organic carbon sources throughout a single growth curve. Based on the differences between CUE and a potential to grow on organic carbon, we postulate a shift in carbon acquisition between inorganic and organic sources in Ostreococcus sp. with potential implications on ecological dynamics within microbial communities.
In recent years, temperatures in the atmosphere and sea surface have been increasing at an unprecedented rate, putting organisms into environmental conditions that they have likely not experienced before (IPCC, 2014). An organism can react to a changing environment through a combination of strategies such as moving to other locations, coping with changes via plasticity (i.e., phenotypic variation within one genotype), adapting (i.e., evolutionary change that leads to an increase in fitness) or in the worst case, dying (Gienapp et al., 2008). Here, we investigate the adaptive response (i.e., how growth rates differ with respect to temperature in the short-term within several generations) of a pico-phytoplankton species Ostreococcus sp. from the Baltic Sea. Growth rates can indicate the direction and magnitude of change in fitness (Elena and Lenski, 2003). In addition to understanding if short-term responses to warming in Ostreococcus vary, we are also interested in the underlying metabolic responses, which can provide a mechanistic link between selection environments and evolved growth responses (Padfield et al., 2016).
Pico-phytoplankton are a globally distributed group of microbial photosynthetic primary producers that make up about 0.53–1.32 Pg C of the marine biomass and contribute to ca. 20% of marine primary production (Worden et al., 2004; Buitenhuis et al., 2012). In coastal areas, pico-phytoplankton can temporarily contribute up to 80% to the marine production of oxygen via photosynthesis and fuel biogeochemical cycles (Worden, 2006). As primary producers, they assimilate inorganic carbon (CO2) and have important cascading effects on higher trophic levels in the marine food web (Field et al., 1998; Falkowski et al., 2008). In addition, high growth rates and large populations size with high standing genetic variation (Reusch and Boyd, 2013) enable pico-phytoplankton, as well as other microbial species, to track today’s rapid changes in the environment via fast plastic responses and evolutionary change and often through a combination of both (Lenski and Travisano, 1994; Wiser et al., 2013; Levis et al., 2016).
Phytoplankton species can be divided into different functional groups regarding their carbon uptake. Of these, photoautotrophs assimilate carbon via photosynthesis while mixotrophic phytoplankton acquire their carbon either via photosynthesis or uptake of organic carbon compounds (Lindsey and Scott, 2010). In this study, we focus on a globally distributed pico-phytoplankton species, Ostreococcus sp., which has a size of about 1 μm and is the smallest known free-living eukaryote (Courties et al., 1994; Rodríguez et al., 2005). Ostreococcus sp. is characterized as a photoautotrophic species, i.e., using CO2 as its carbon source for growth (Courties et al., 1994). However, it has been shown that Ostreococcus has the potential to grow in the dark relying on other carbon sources (e.g., sorbitol) that do not directly come from co-occurring photosynthesis (van Ooijen and Millar, 2012). Therefore, in Ostreococcus other carbon uptake related strategies could play a role to sustain growth.
Previous experimental long-term studies have shown that phytoplankton are indeed able to adapt to environmental change within a few hundred generations which translate to several months to years in the laboratory (Lohbeck et al., 2012; Schlüter et al., 2014; Listmann et al., 2016; Schaum et al., 2018). Despite their insights into the adaptive potential of phototrophic microbes, these experiments focus mainly on single strains (i.e., genotypes) of species from culture collections and are very time consuming and large experiments. As a result, they only capture a reduced image of ecological variability. Selection, however, will act on the range of phenotypes within a species, which itself changes as a function of ecological variability. Within-species variation is therefore a crucial component to consider for characterizing the adaptive potential of organisms (Des Roches et al., 2018). In this study we circumvent the limitations of long-term experimental studies on laboratory strains by using two approaches: First, to account at least for a small degree of ecological variability (Boyd et al., 2013; Godhe and Rynearson, 2017; Hattich et al., 2017), we use not one, but eight strains of the same species complex. Second, in order to investigate the evolved response to warming, we use strains of the same species complex with different environmental histories—an approach called space for time substitution (Likens, 1989).
To understand how pico-phytoplankton evolve to warming, we want to link growth responses to the underlying metabolic responses (e.g., Padfield et al., 2016). Metabolic responses that are associated with growth can include nutrient uptake related strategies (Sommer, 1984; Edwards et al., 2015), metabolic responses within the cell for energy turnover or allocation (Rokitta et al., 2016; Collins and Schaum, 2019) or, as is most important for primary producers, carbon uptake related strategies (Rost et al., 2006). Several studies on different phytoplankton groups have demonstrated that net primary production, which describes the uptake of carbon for growth, can change in response to changes in the environment essentially modulating the relationship of net primary production and growth (Schaum et al., 2017; Barton et al., 2020). These indicate that inorganic carbon is assimilated in different quantities. However, these studies have so far investigated the responses in cultures at exponential phase in the microbial growth curve. This allows us to understand metabolic dynamics that are associated with exponential growth, but it ignores that ample theory in ecology and evolution would predict the existence of multiple strategies both depending on the environmental condition and the life cycle state of a microbial organism (Halsey et al., 2013; García-Carreras et al., 2018). Here, we additionally focus on metabolic responses during early and late exponential growth phases rather than only the maximum exponential growth phase of the microbial growth curve.
We isolated six novel strains of Ostreococcus tauri and two Ostreococcus mediterraneus in spring of 2018 (RV ALKOR cruise AL505) (Table 1) from the Baltic Sea in order to study a range of strains of the same species complex with different evolutionary histories. This was the first successful isolation of Ostreococcus from the Baltic Sea. The Baltic Sea is characterized by different environmental gradients including for example temperature, salinity or nutrients (Leppäranta and Myrberg, 2009) that have changed in the last decades (Zhong et al., 2020). Here, we focus on two regions in the South-West and East of the Baltic, the Kiel area and Bornholm Basin, differing mainly in temperature and salinity. The respective gradients range from warmer, more variable temperatures and higher salinity in the Kiel area compared to colder, less variable temperatures and lower salinity in the Bornholm Basin. We measured the growth response to two different temperatures and how the respective evolutionary trajectories affected this response in the novel strains. At the same time, by quantifying carbon use efficiency via photosynthesis and respiration measurements (Hackett and Griffiths, 1997; Rutgers et al., 2016; Schaum et al., 2017), we characterized how growth can be maximized (or changed) in varying environments (i.e., temperatures) and at different time-points during the exponential growth phase. After our main experiment, we subsequently investigated the potential of Ostreococcus sp. to grow on several organic carbon compounds considering again effects of changes in the thermal environment (temperature assay), evolutionary history (via space for time substitution), and the life cycle (throughout a growth curve).
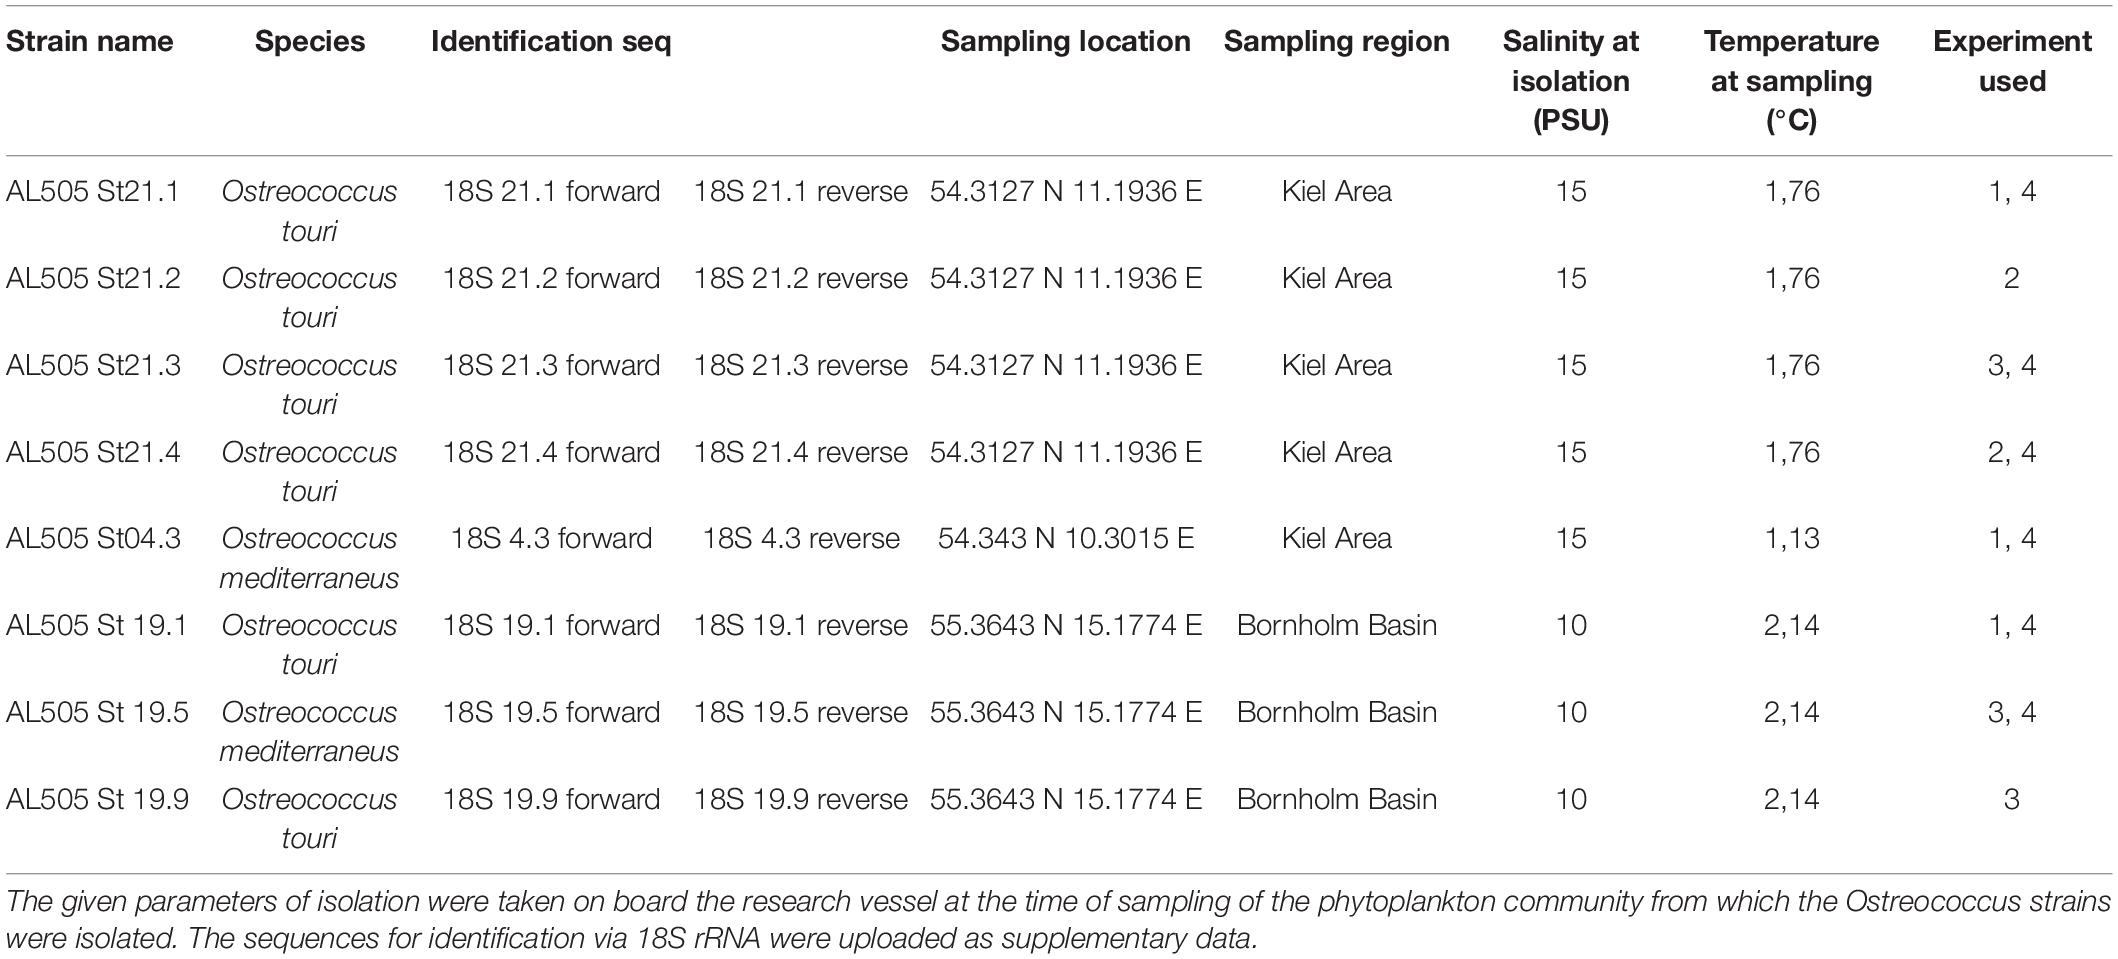
Table 1. This table summarizes the different origins of the strains that were used in the experiments.
We isolated Ostreococcus sp. from pico-phytoplankton community samples obtained during a RV ALKOR cruise (AL505) in 2018 (see Figure 1A and Table 1 for sampling dates and locations) using a Niskin bottle at 5 m. Community samples were immediately passed through a 35 μm sieve to remove grazers and large debris, and then further size fractioned via gentle filtration through a 2 μm membrane filter (kept filtrate) and a 0.2 μm filter (kept filter and rinsed gently). From these samples, we successfully isolated eight new strains of Ostreococcus sp. (see Table 1 for details); five from the Kiel area and three from the Bornholm Basin. We determined the species identity via 18S rRNA sequencing (Cai et al., 2010). The isolation by dilution method where samples were diluted to below 1 cell per specific volume and grown in wellplates for ca. 15–30 days, proved best for Ostreococcus of the Baltic Sea (unpubl. results). Stock cultures were kept at their respective isolation salinities in f/2 media (Guillard, 1975) that was prepared using artificial seawater. In a common garden approach, all stocks were kept at 18°C after isolation. 18°C corresponds to a mean temperature over the two regions where the strains were isolated from. All cultures were kept in gentle rotation at a 12:12 day and night cycle with light intensities of ca. 100 μE. Based on earlier studies and the characteristics of phytoplankton populations (up to million cells/mL) we assume that the isolated strains are genetically distinct (Boyd et al., 2013; Hattich et al., 2017; Godhe and Rynearson, 2017). Furthermore, SNP analysis of Mediterranean O. tauri strains isolated by the same procedure have shown that strains are indeed genetically distinct (Gwenael et al., personal communication).
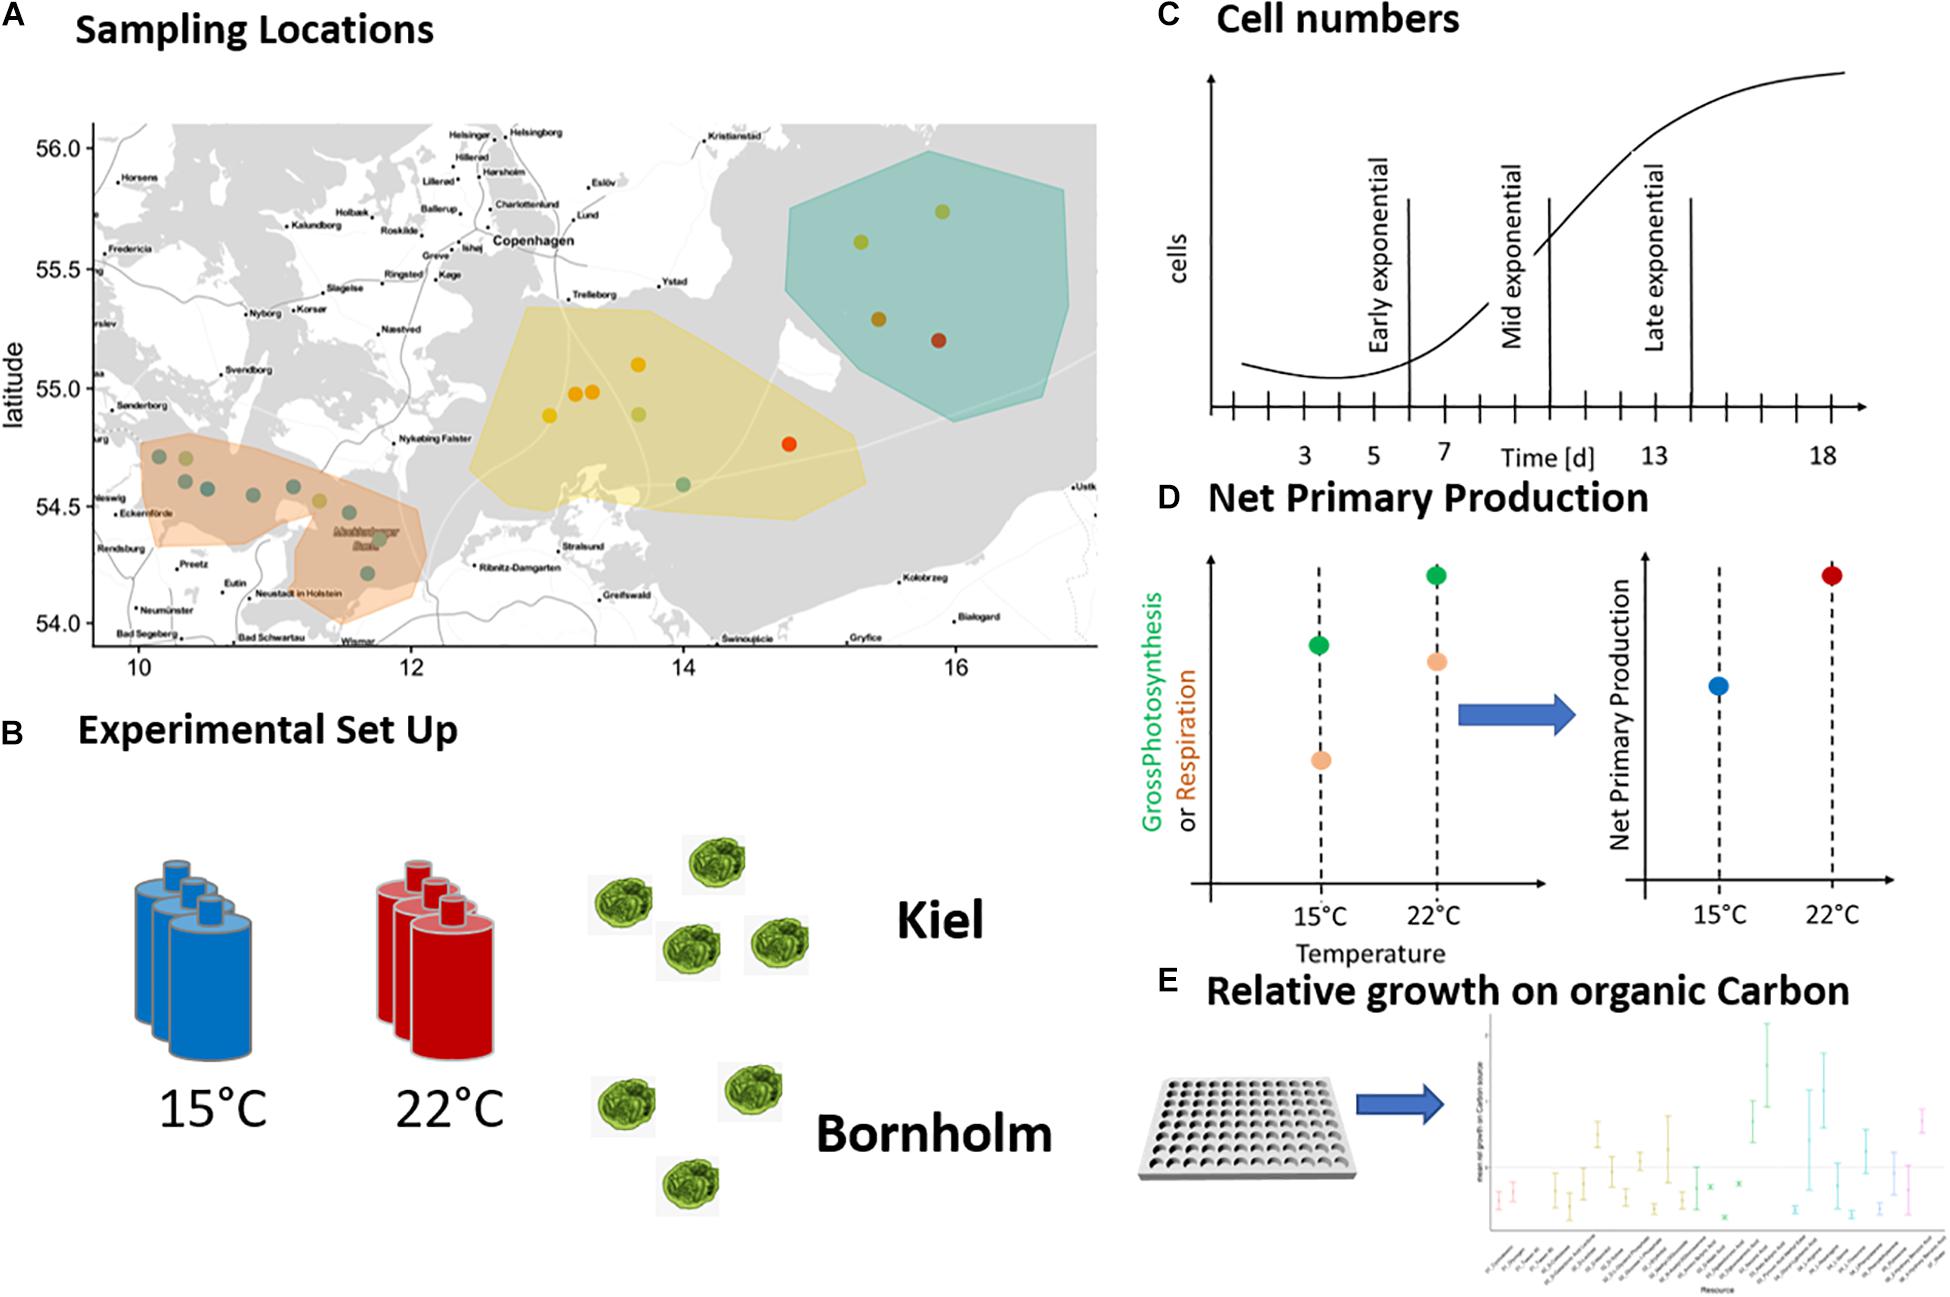
Figure 1. Sampling locations and experimental set-up: The pico-phytoplankton communities from which we isolated Ostreococcus sp. were collected during two research cruises in March and August 2018 and originate from Kiel area and Bornholm Basin (A). Eight successfully isolated strains of Ostreococcus sp. were exposed to 15 and 22°C (B) in four consequent experiments and monitored daily for growth via tracking cell numbers (C). In addition, we measured net primary production daily (D) in experiments 1–3 and in experiment 4 we investigated potential growth on organic carbon at three time points of the microbial growth curve (E).
The eight new strains were cultured to determine their growth rate and metabolism response to 15 and 22°C (spanning late spring and late summer temperatures). The experiment had to be carried out in three subsequent batches due to the limited number of metabolic measurements possible at the same time (see Figure 1B and Table 1). The batches were all set up the same way: each strain was replicated three times and each replicate inoculated with 3000 cells/mL in 40 mL f/2 media (Guillard, 1975) of the respective salinity of isolation (Table 1). All replicated cultures were exposed to the two treatment temperatures with a 12:12 day and night cycle at 100 μE light intensity for 18 days ensuring growth through a whole microbial growth cycle (Figure 1C). Starting at day three of microbial growth we measured cell numbers daily via flow cytometry (BD Accuri C6 flow cytometer) and starting on day 4–5, we measured photosynthetic metabolic activity daily via optical O2 measurements (Figure 1D) (see below for explanation of measurement).
After the main experiment, we set up a second smaller experiment to determine the potential of growth on organic carbon sources using six strains of the eight isolated Ostreococcus strains (four from Kiel and two from Bornholm, respectively) (Figure 1E). Each strain was inoculated at 3000 cells/mL in 200 mL of f/2 media (Guillard, 1975) of the respective salinity of isolation and exposed to both 15 and 22°C with a 12:12 day and night cycle at 100 μE light intensity. In addition to growth and carbon use efficiency measures, we here investigated the potential of each strain to grow on 31 different organic carbon sources using ecoplates (Biolog EcoPlateTM) at three time points during the microbial growth curve (determined via the preceding growth experiments).
We determined cell counts to calculate growth rates in the experimental cultures and increase of cell numbers in the Biolog EcoPlates. Cells were counted at a rate of 65 μl/min on a flow cytometer (Accuri BD C6 Plus) using gating of cells characterized by the height of forward scatter and red fluorescence signal (Supplementary Figure 1). The forward scatter was set to a threshold of ca. 200 that allowed us to determine debris and potentially high amounts of bacteria in the experimental cultures. Ostreococcus is large enough to be well distinguished from bacterial cells or cell debris (Supplementary Figure 2) which came in handy when measuring the Ostreococcus increase on the Biolog EcoPlates with organic carbon sources.
On the daily cell count measurements, we fitted a growth curve containing a lag phase, exponential phase and carrying capacity. To analyze the shape of the growth curves, non-linear curve fitting of a gompertz growth model (Buchanan et al., 1997) was carried out using the “nlsLoop” function in the R package, “nlsLOOP” (version 1.2-1). Parameter estimation was achieved by running 1,000 different random combinations of starting parameters for cell count at carrying capacity, duration of lag phase, and maximum growth rate picked from a uniform distribution. The script then retained the parameter set that returned the lowest Akaike information criterion (AICc) score, yielding μmax and day at μmax. In addition, we calculated growth rates at early and late exponential phase (3 days before and after day at μmax, respectively) using the following formula [ln(Nt−Nt–1)] with N being the number of cells/ml. The day at μmax was important for subsequent analysis of growth on organic carbon sources (see Supplementary Table 1).
Net photosynthesis and respiration rates were measured on PreSens® SDR Sensor Dish optodes. We measured oxygen production for 15 min in the light, and respiration for 15 min in the dark under the light and temperature conditions set in the incubator (i.e., all experimental units at their assay temperatures). In non-axenic cultures, bacterial respiration is also measured both in light and in the dark. However, over the course of the microbial growth curve we find that bacterial counts (as part of the debris smaller than ca. 0.5 μm) did not increase or change such that we can assume that measures compared over one batch cycle are based on changes in autotrophic phytoplankton cells. All characterizations were carried out at the same time of day (9–11 a.m.). From the measurements we calculated the rate of oxygen evolution within a 5–10 min constant time window as changes from light to dark can have consequences on the absolute values measured on the PreSens SDR Sensor Dish. Due to oxygen drifts within the sample vials we always ran a control with MQ in each measurement and subtracted this drift from the rates calculated. From the rate of oxygen evolution in the dark (R) and light (NP) we then calculated gross photosynthesis as follows: [R]+NP = GPP.
Carbon use efficiency and was then calculated as follows:
Here we were interested in, if and how much a culture could grow on a number of different carbon sources that we provided via the ecoplates (Supplementary Figure 3). Based on Exp. 1–3 we identified three time points (corresponding to three different days during the microbial growth cycle) at which we then measured growth on organic carbon. These time points were “early exponential phase” 3 days prior to day at μmax, “mid exponential phase” at μmax and “late exponential phase” 3 days later than day at μmax. The actual days of inoculation into ecoplates varied between the different strains of Ostreococcus and treatment temperatures (see Supplementary Table 2 for details). Each ecoplate contained 31 different organic carbon sources in triplicates and three controls with water (see Rutgers et al., 2016 for list of sources and groups thereof and Supplementary Figure 2). Each of the 96 wells was inoculated with 200 μl of culture (except one control of water with only MQ) and then left to grow for 24 h at the same experimental condition as the respective original culture. After 24 h we fixed the samples with sorbitol (10 μL of a 1% sorbitol solution per sample) for 24 h at 4°C in the dark and then froze them for later analysis via flow cytometry. After thawing the ecoplates overnight, we counted the cells in each well and calculated the relative change in cell numbers on organic carbon compared to the control (on water). Since our cultures were not axenic, we cannot exclude, that present bacteria readily use the organic compounds provided in the ecoplate. Therefore, we calculated the relative difference of cell numbers on an organic source specifically identifying phytoplankton cells in the cytometry fingerprints. We provide an example for control sample (no culture), culture on water (control), and on an amino acid in Supplementary Figure 2. In addition, we calculated an overall value of relative change in cell numbers on organic carbon the following way: First, we calculated the mean of cells/mL for the control wells; second, we calculated the relative change in cells/mL for each of the 93 wells that contained a carbon source compared to the control (i.e., “water,” no other organic carbon source). This relative change could be between −1 and 1: anything between −1 and 0 meant that less cells than in the control were present after 24 h whereas anything between 0 and 1 meant that more cells in the control were present after 24 h. Third, we counted the number of wells where the relative change in cell numbers was positive. And last, the overall potential use of an organic carbon source was then calculated as the mean of the relative change of cells normalized by the number of wells on which the relative increase was positive.
We found that the transfer of culture from the 150 mL culture flasks to 200 μL on the ecoplates presented a stressful condition in itself. This was seen as rapid decrease of cell numbers even in the control samples on water only. However, one well contained only water, and thus there was no change in culturing condition other than being transferred into a smaller volume and we could still determine the effect of the presence of an organic carbon compound on the Ostreococcus strains.
All data were analyzed in the R programming environment (version 4.0.3.) using the packages “nlme,” “ggpot2,” “lme4,” “emmeans,” “vegan,” “reshape2,” and “multcomp.”
The growth rates (μmax, growth rate at early and late exponential phase) were analyzed with a linear mixed effects model (lme within the nlme package). Growth was first analyzed via a global model that included sampling location (Kiel area or Bornholm Basin), assay temperature (15 and 22°C) and time as fixed factors in full interaction. The “experiment” (Exp 1–3 for μmax and net primary production) was computed as a nested random effect within region. The global model was reduced to the single and interacting factors containing the lowest AICc score with a minimum difference of 2 (Supplementary Table 3.1). The best model for growth only included the single factors and no interaction (Supplementary Table 3.2).
CUE, gross photosynthesis and respiration were analyzed with a generalized linear squares (gls) model (within the nlme package) that accounted for autocorrelation over time. We first constructed a global model that included the sampling location and assay temperature as fixed factors in full interaction—using the lowest AICc score with a minimum difference of 2 (Supplementary Tables 4.1, 5.1, 6.1, respectively) then yielded the model that best explained each response variable (Supplementary Tables 4.2, 5.2, 6.2, respectively.
The changes in cell numbers on the organic carbon compounds was analyzed in two ways: First we analyzed the differences in the groups of carbon compounds via a linear mixed effects model containing the effect of timing at 22°C (Supplementary Tables 7.1, 7.2) and temperature (Supplementary Tables 7.3, 7.4) in mid exponential phase as well as the effects of region and “carbon group” (Supplementary Table 8). The lme model was reduced to the single and interacting factors containing the lowest AICc score with a minimum difference of 2. Second, we confirmed the statistical analysis on the relative growth on carbon and changes in cell numbers via a PCA analysis and subsequent permanova that tested again for the effect of timing at 22°C (see above) and temperature in mid exponential phase (Supplementary Tables 9, 10). The difference to the first analysis is, that it includes the differences between all 31 carbon sources and how the complete use of all the sources differed between time-points, temperature and regions.
Following the expected shape of a microbial growth curve, the highest growth rates were reached in the middle of the microbial growth curve and lower at the early and late stage of the microbial growth curve both in the Kiel and Bornholm strains (Figure 2 and Supplementary Table 5; Global model (TI) Effect of “Timing” [F(2, 155) = 619.787, p < 0.0001]. In the Kiel strains, the growth rates were higher in the early and mid-phases of exponential growth compared to the Bornholm region [Figure 2 and Supplementary Table 3.2; Effect of “Region” F(1, 155) = 28.458, p < 0.0001]. All strains of Ostreococcus increased their growth rate from 15 to 22°C [Figure 2 and Supplementary Table 3.2; Effect of “Temperature” F(1, 155) = 16.724, p < 0.0001] at early and late stage of exponential growth. The increase of growth rate between 15 and 22°C is higher in the Kiel strains (e.g., min and max growth mid exponential phase 0.52–1.06) compared to the Bornholm (e.g., min and max growth mid exponential phase 0.43–0.71) strains indicated in the maximum and minimum growth rates of all strains within a region. The difference between regions indicated an effect of the absolute difference in experienced past environment including the variability therein; in other words, their evolutionary history.
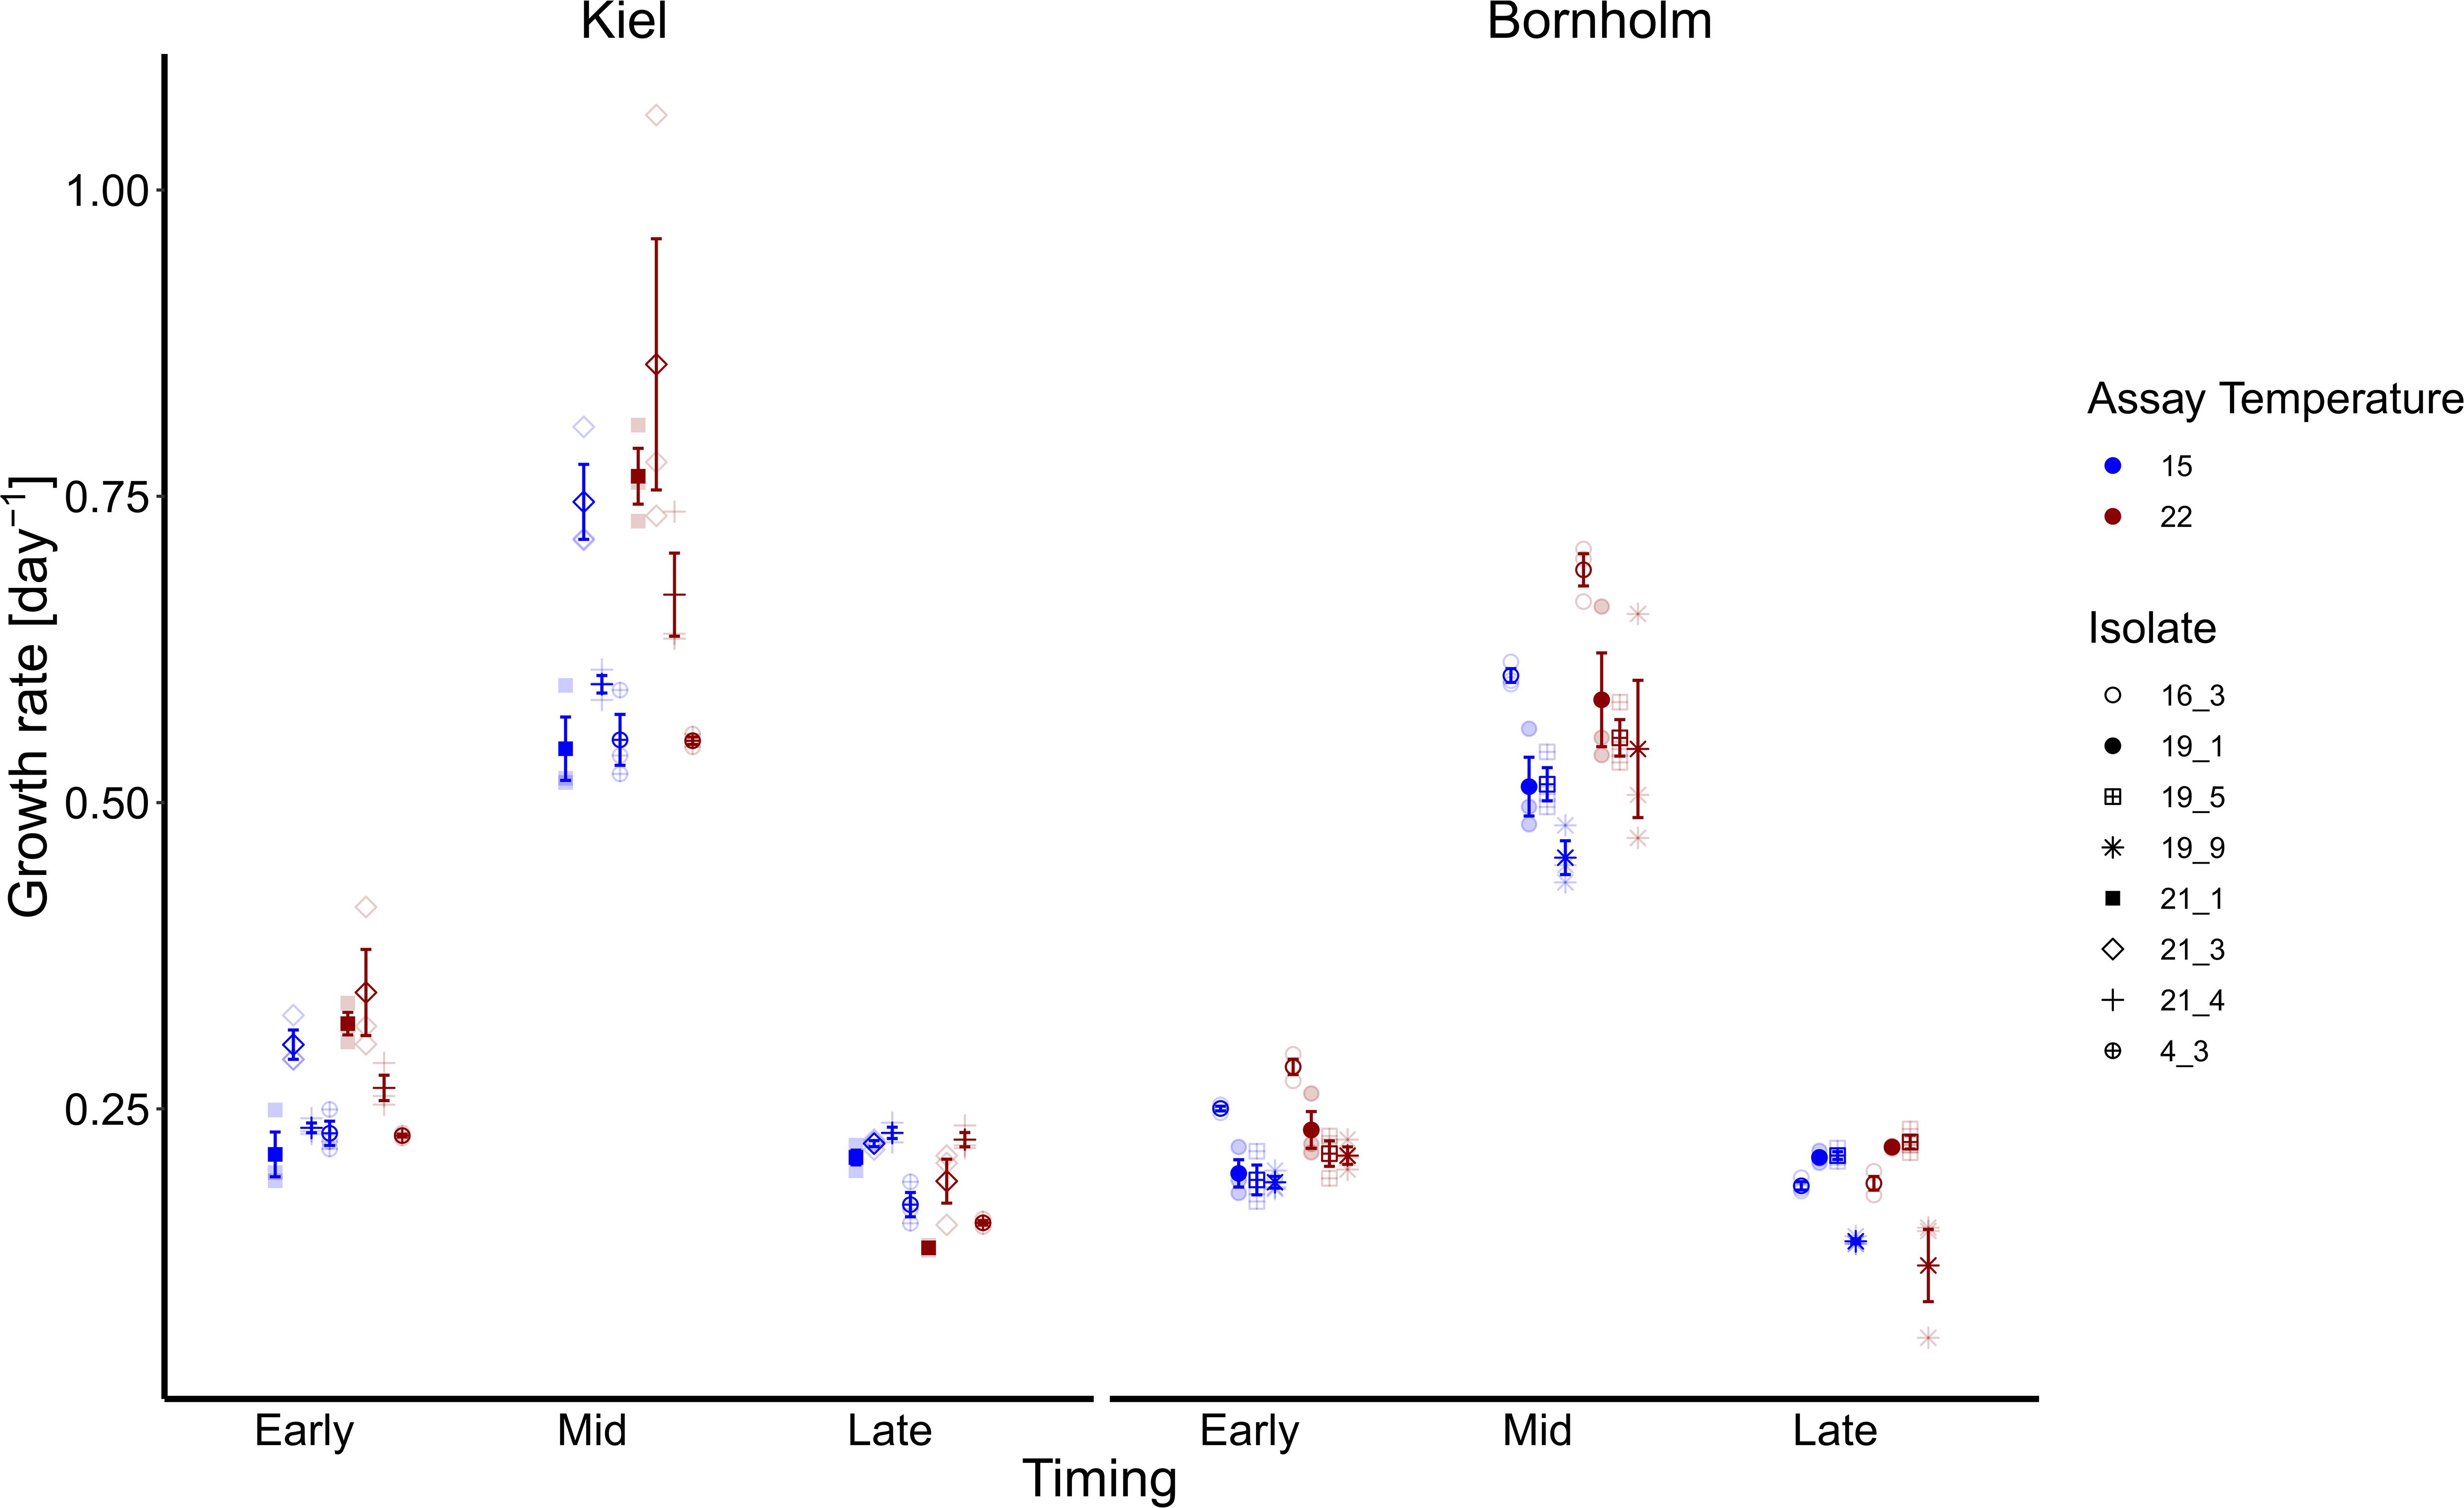
Figure 2. Growth rates are shown here at early, mid and late exponential phase and at 15 (blue) and 22°C (red). Note that for the growth rate at mid exponential phase we used a logarithmic curve fit to all numbers collected during the experiment whereas early and late exponential growth rates were estimated via ln(Nt-Nt–1) 3 days prior and after the day where growth was maximum. The left panel shows growth rates of four isolates from the Kiel area whereas the right panel shows growth rates of four isolates from the Bornholm area. All filled points show mean +/– 1 SE (n = 3). The different shapes indicate the growth rates of each of the single isolates (four for each region).
Both gross photosynthesis (GP) and respiration (R) decrease rapidly over the course of a batch cycle (correlation of time in statistical models) (Figure 3). The statistical analysis did not show a significant effect of either temperature or region on either GP or R (Figure 3 and Supplementary Tables 4, 5). The high variability over the course of the microbial growth cycle could be responsible. Since carbon use efficiency (CUE) puts GP and R in relation to each other per sample we have—apart from GP—another measure of primary productivity that allows us to interpret the capacity to grow on the available inorganic resource.
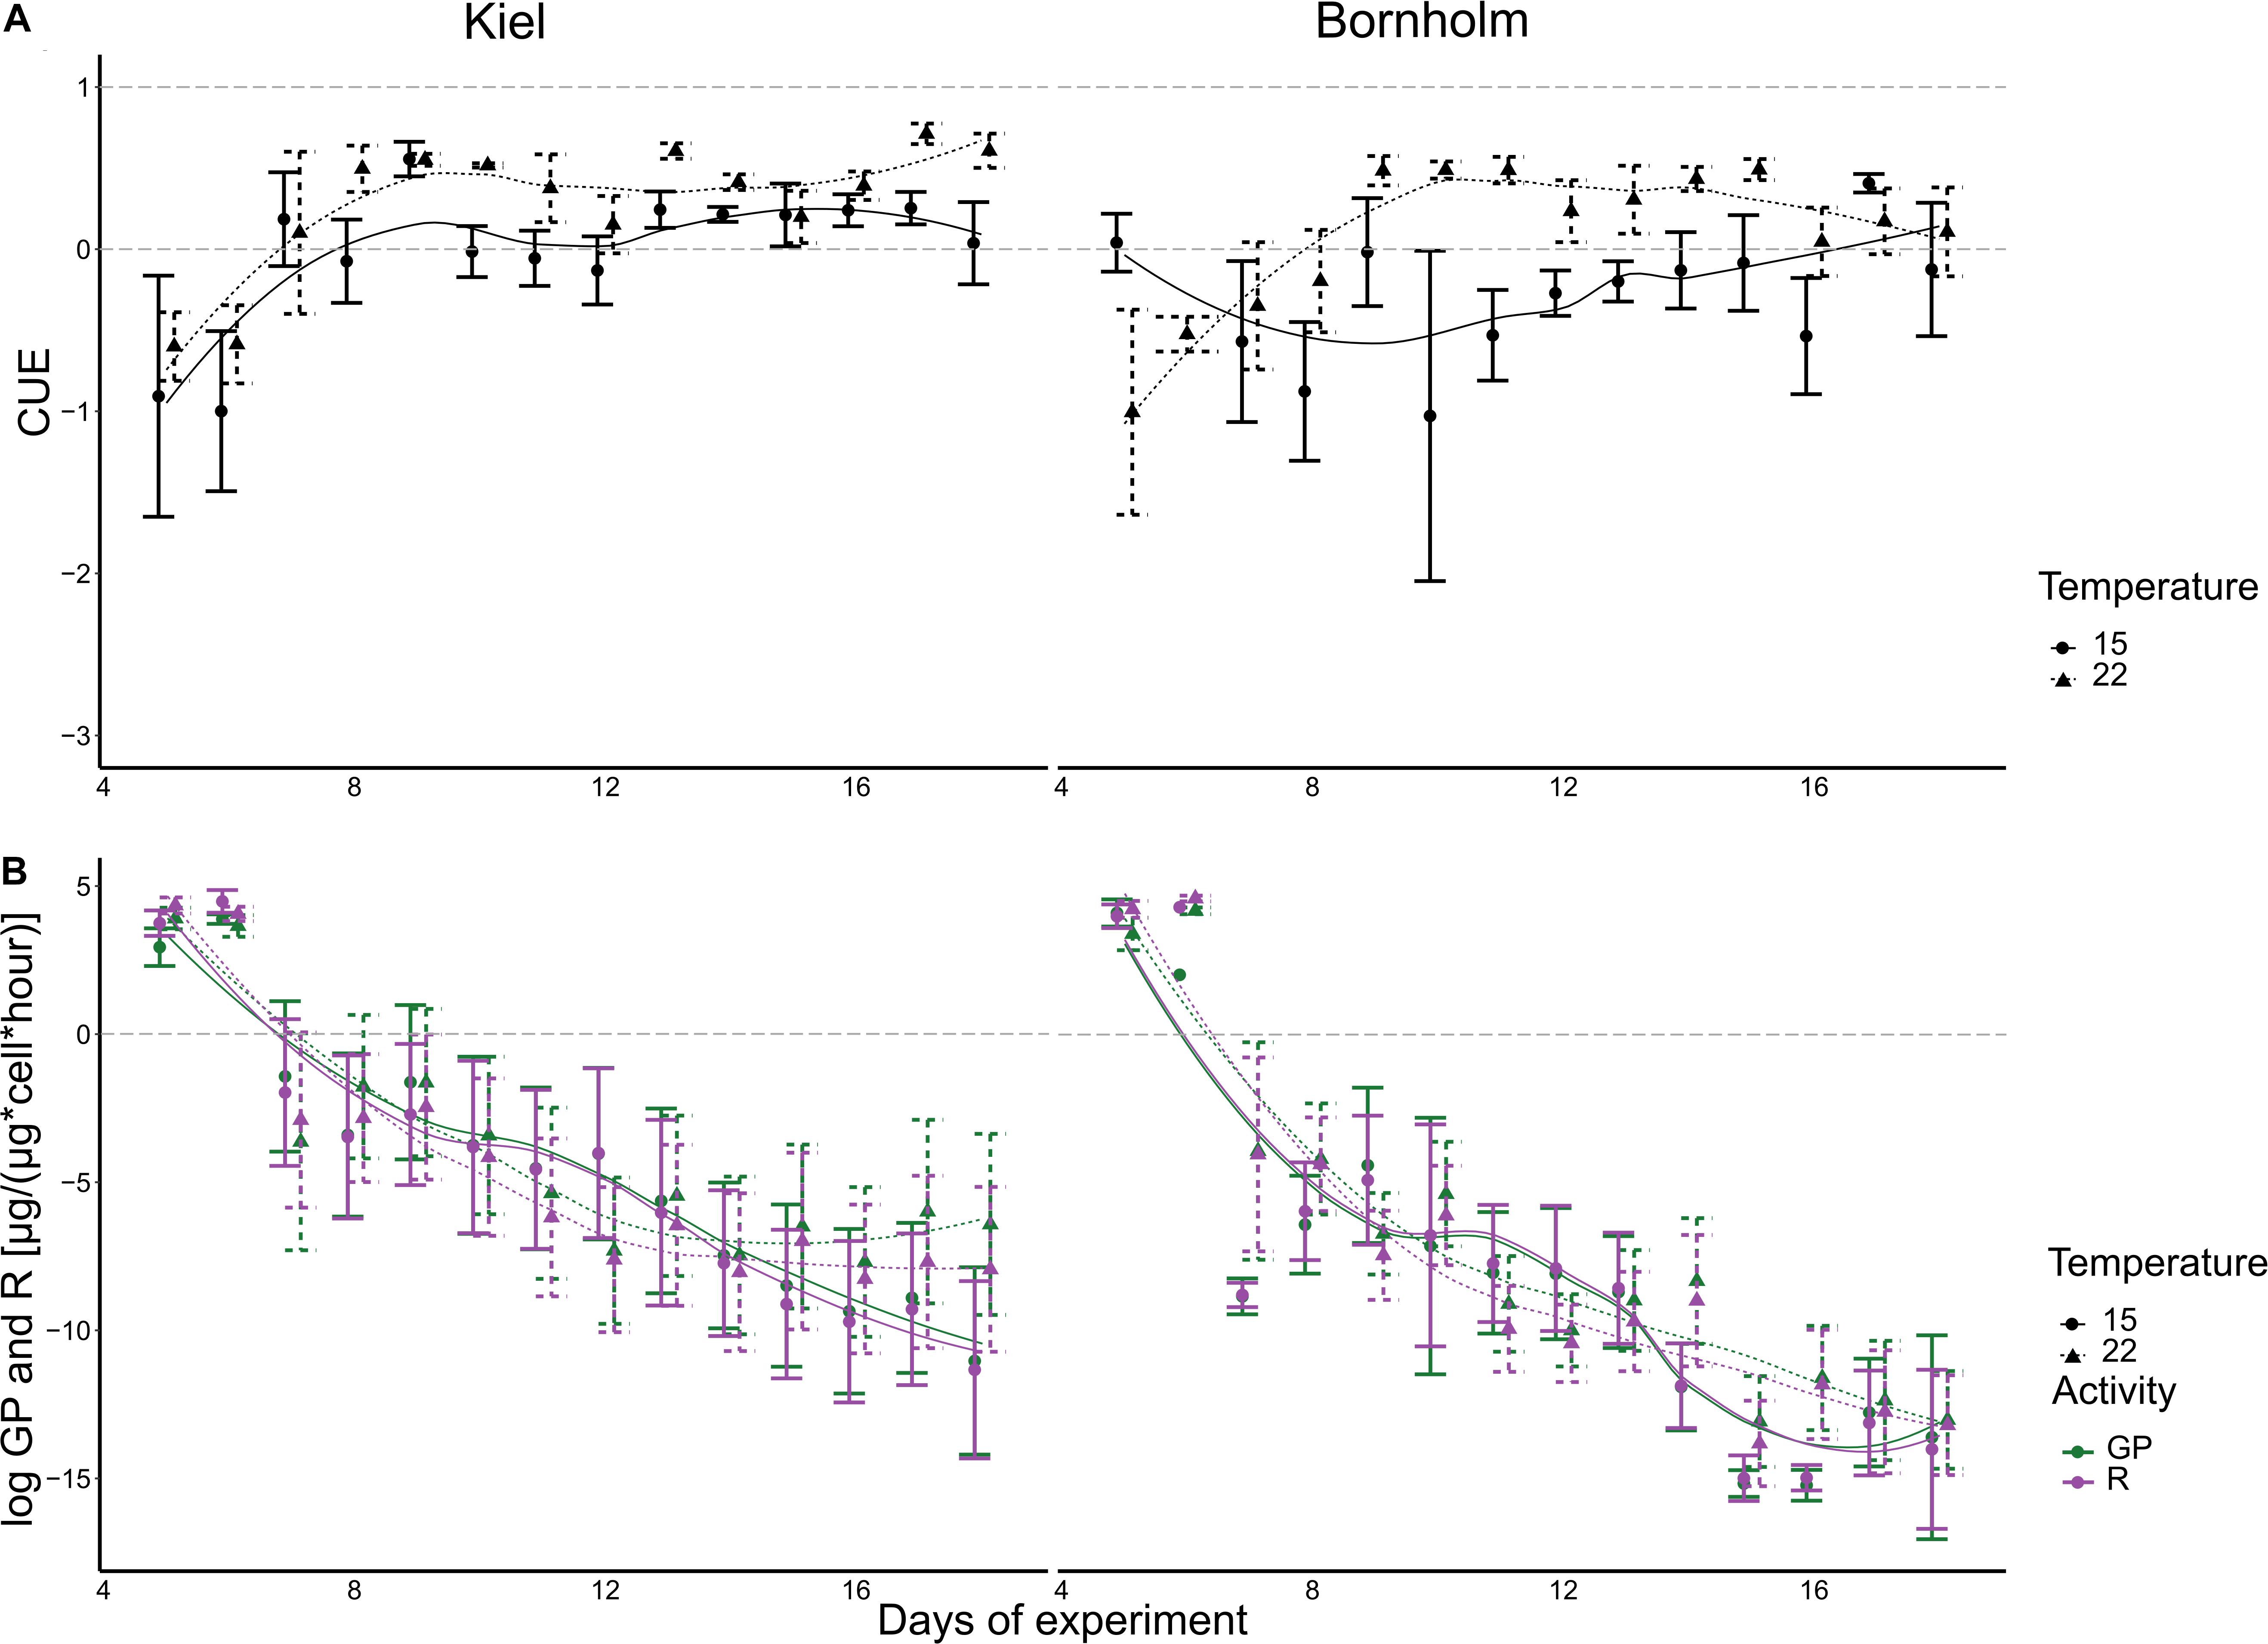
Figure 3. CUE (A), gross photosynthesis (green) and respiration (purple) (B) are shown here. The left panels show data for Kiel strains, whereas the right panels show data of Bornholm strains. All points show mean ± 1 SE including n = 12 and n = 12 for Kiel and Bornholm, respectively. The fitted lines are based on a loess smoother. The dashed gray lines indicate thresholds for CUE where either no growth on CO2 alone is possible (<0), some growth is possible (0–0.5) and growth on CO2 alone is possible (>0.5).
The CUE in both Kiel and Bornholm strains increased with temperature at mid exponential phase [Figure 3 and Supplementary Table 6.2; Effect of “Temperature” F(1) = 9.934, p = 0.002] and varied throughout the microbial growth curve (all models included correlation of time). Specifically, CUE increases in the first 6–8 days of experiment and then stays relatively constant. In addition, CUE was generally higher in the Kiel strains compared to the Bornholm strains [Figure 3 and Supplementary Table 6.2; Effect of “Region” F(1) = 11.680, p = 0.001]. 20% of the data were also explained by an inclusion of the interaction of temperature and region that explains a higher CUE especially at 22°C (Supplementary Table 6.1).
Due to experimental limitations, we were only able to measure use of organic carbon sources on one representative replicate of four strains from the Kiel area and two strains from the Bornholm area, respectively. Thus, a comparison between the strains was statistically not possible. Averaged over all the organic sources we did find a higher use of organic carbon sources by isolates from Kiel compared to Bornholm at mid exponential phase in both assay temperatures [Figure 4 and Supplementary Table 7.4; Effect of “Region” F(1, 4) = 11.416, p = 0.028] as well as early and late exponential phase at 22°C [Figure 4 and Supplementary Table 7.2; Effect of “Region” F(1, 4) = 6.531, p = 0.063]. In addition to the overall difference between the regions we also found effects of the timing of measurement and temperature: on the one hand, the use of organic carbon in both Kiel and Bornholm strains decreased from early to mid and late exponential phase at 22°C [Figure 4 and Supplementary Table 7.2; Effect of “Timing” F(2, 10) = 12.398, p = 0.002]. On the other hand, at mid exponential phase, the use of organic carbon sources was higher at 15°C compared to 22°C in both areas [Figure 4 and Supplementary Table 7.4; Effect of “Temperature” F(1, 5) = 5.730, p = 0.062].
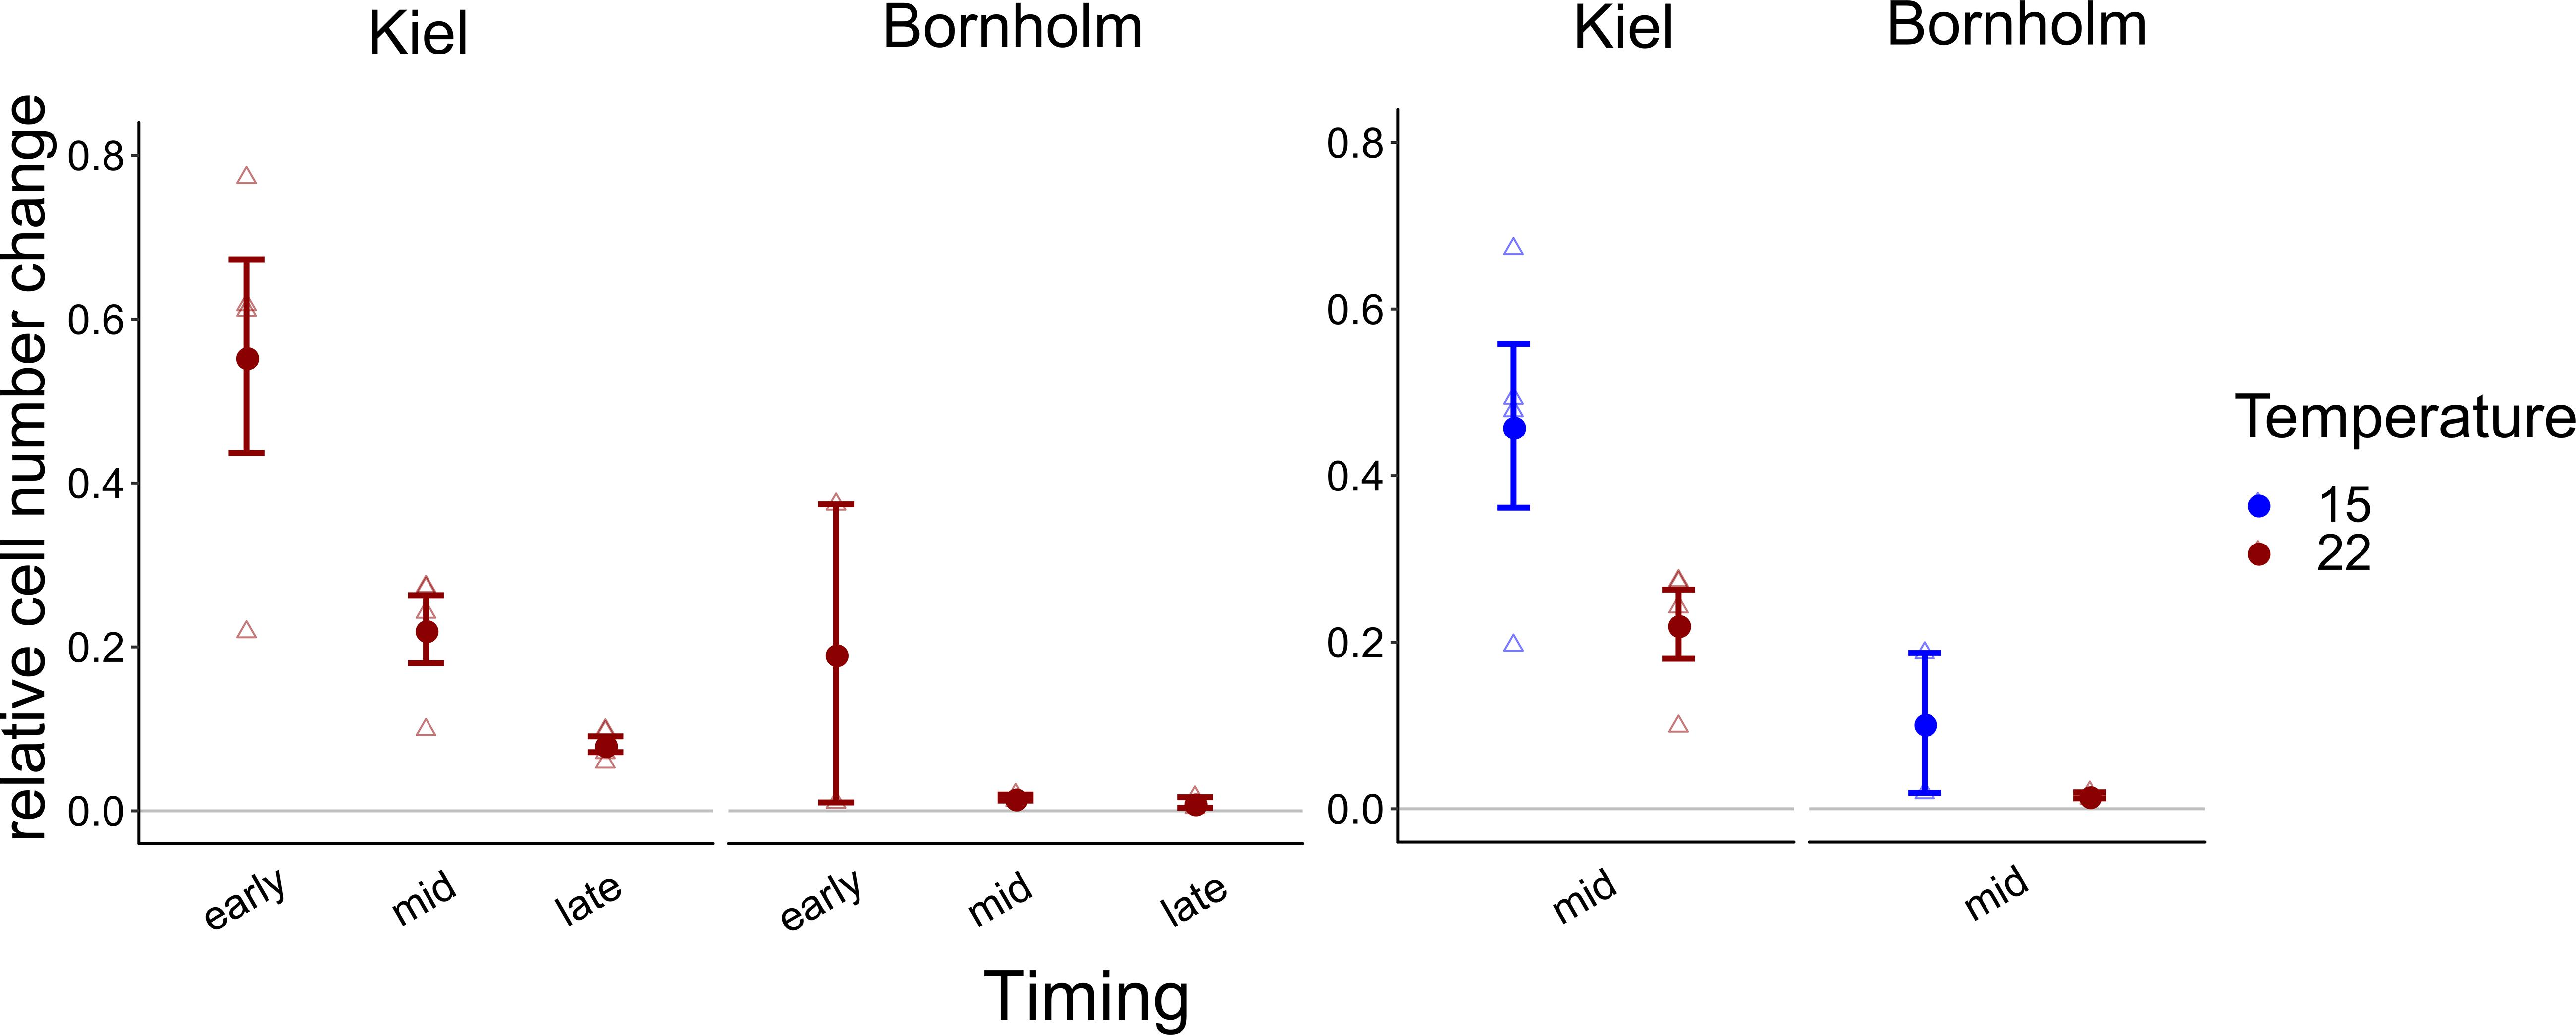
Figure 4. Overall relative increase in cell numbers on carbon normalized by the number of sources on which we found positive growth is shown here: in the left panel the growth at 22°C (red) at early, mid and late exponential phase is shown, whereas in the right panel relative growth at mid exponential phase at 15 (blue) and 22°C (red) degrees is shown. All points show mean ± 1 SE including n = 4 and n = 2 for Kiel and Bornholm, respectively. Triangles present the overall growth on organic carbon per ecoplate of each experimental unit.
In addition to the differences in use when all carbon sources were considered together, we found that at different sampling times and temperatures the carbon sources were used in different quantities (Figure 5). At 22°C we found that in the early exponential phase on all carbon groups except for the polymers (Cyclodextrin and Glycogen), cell numbers compared to the water control were higher in the strains from Kiel, whereas in the Bornholm strains this was mainly observed on carbohydrates and carboxylic acids [Figure 5A, Supplementary Table 8.2; Effect of “Region∗Carbon Group” F(5, 1525) = 3.798, p = 0.002]. At mid and late exponential phase, there were fewer sources on which cell numbers were higher than in the control in the Kiel strains and there was no further increase in cell numbers on carbon sources in the Bornholm strains [Figure 5A and Supplementary Table 8.2; Effect of “Timing” F(2, 1525) = 67.528, p < 0.0001]. In the Kiel strains, there was still potential use of amines and carbohydrates at mid exponential and phenolic compounds in the late exponential phase [Figure 5A and Supplementary Table 8.2; Effect of “Timing∗Region” F(2, 1525) = 9.290, p < 0.0001). In addition, at 15°C compared to 22°C there were more carbon groups potentially used in both Kiel and Bornholm strains [Figure 5B and Supplementary Table 8.4; Effect of “Temperature” F(1, 1058) = 37.202, p < 0.0001], however, differently so between the regions [Figure 5B and Supplementary Table 8.4; Effect of “Temperature∗Region” F(1, 1058) = 9.334, p = 0.002]. In the Kiel strains resources from all groups except for the polymers lead to an increase in cell numbers and in Bornholm strains this was only the case on amines and carboxylic acids [Figure 5B and Supplementary Table 8.4; Effect of “Region∗Carbon Group” F(5, 1058) = 5.007, p < 0.0001].
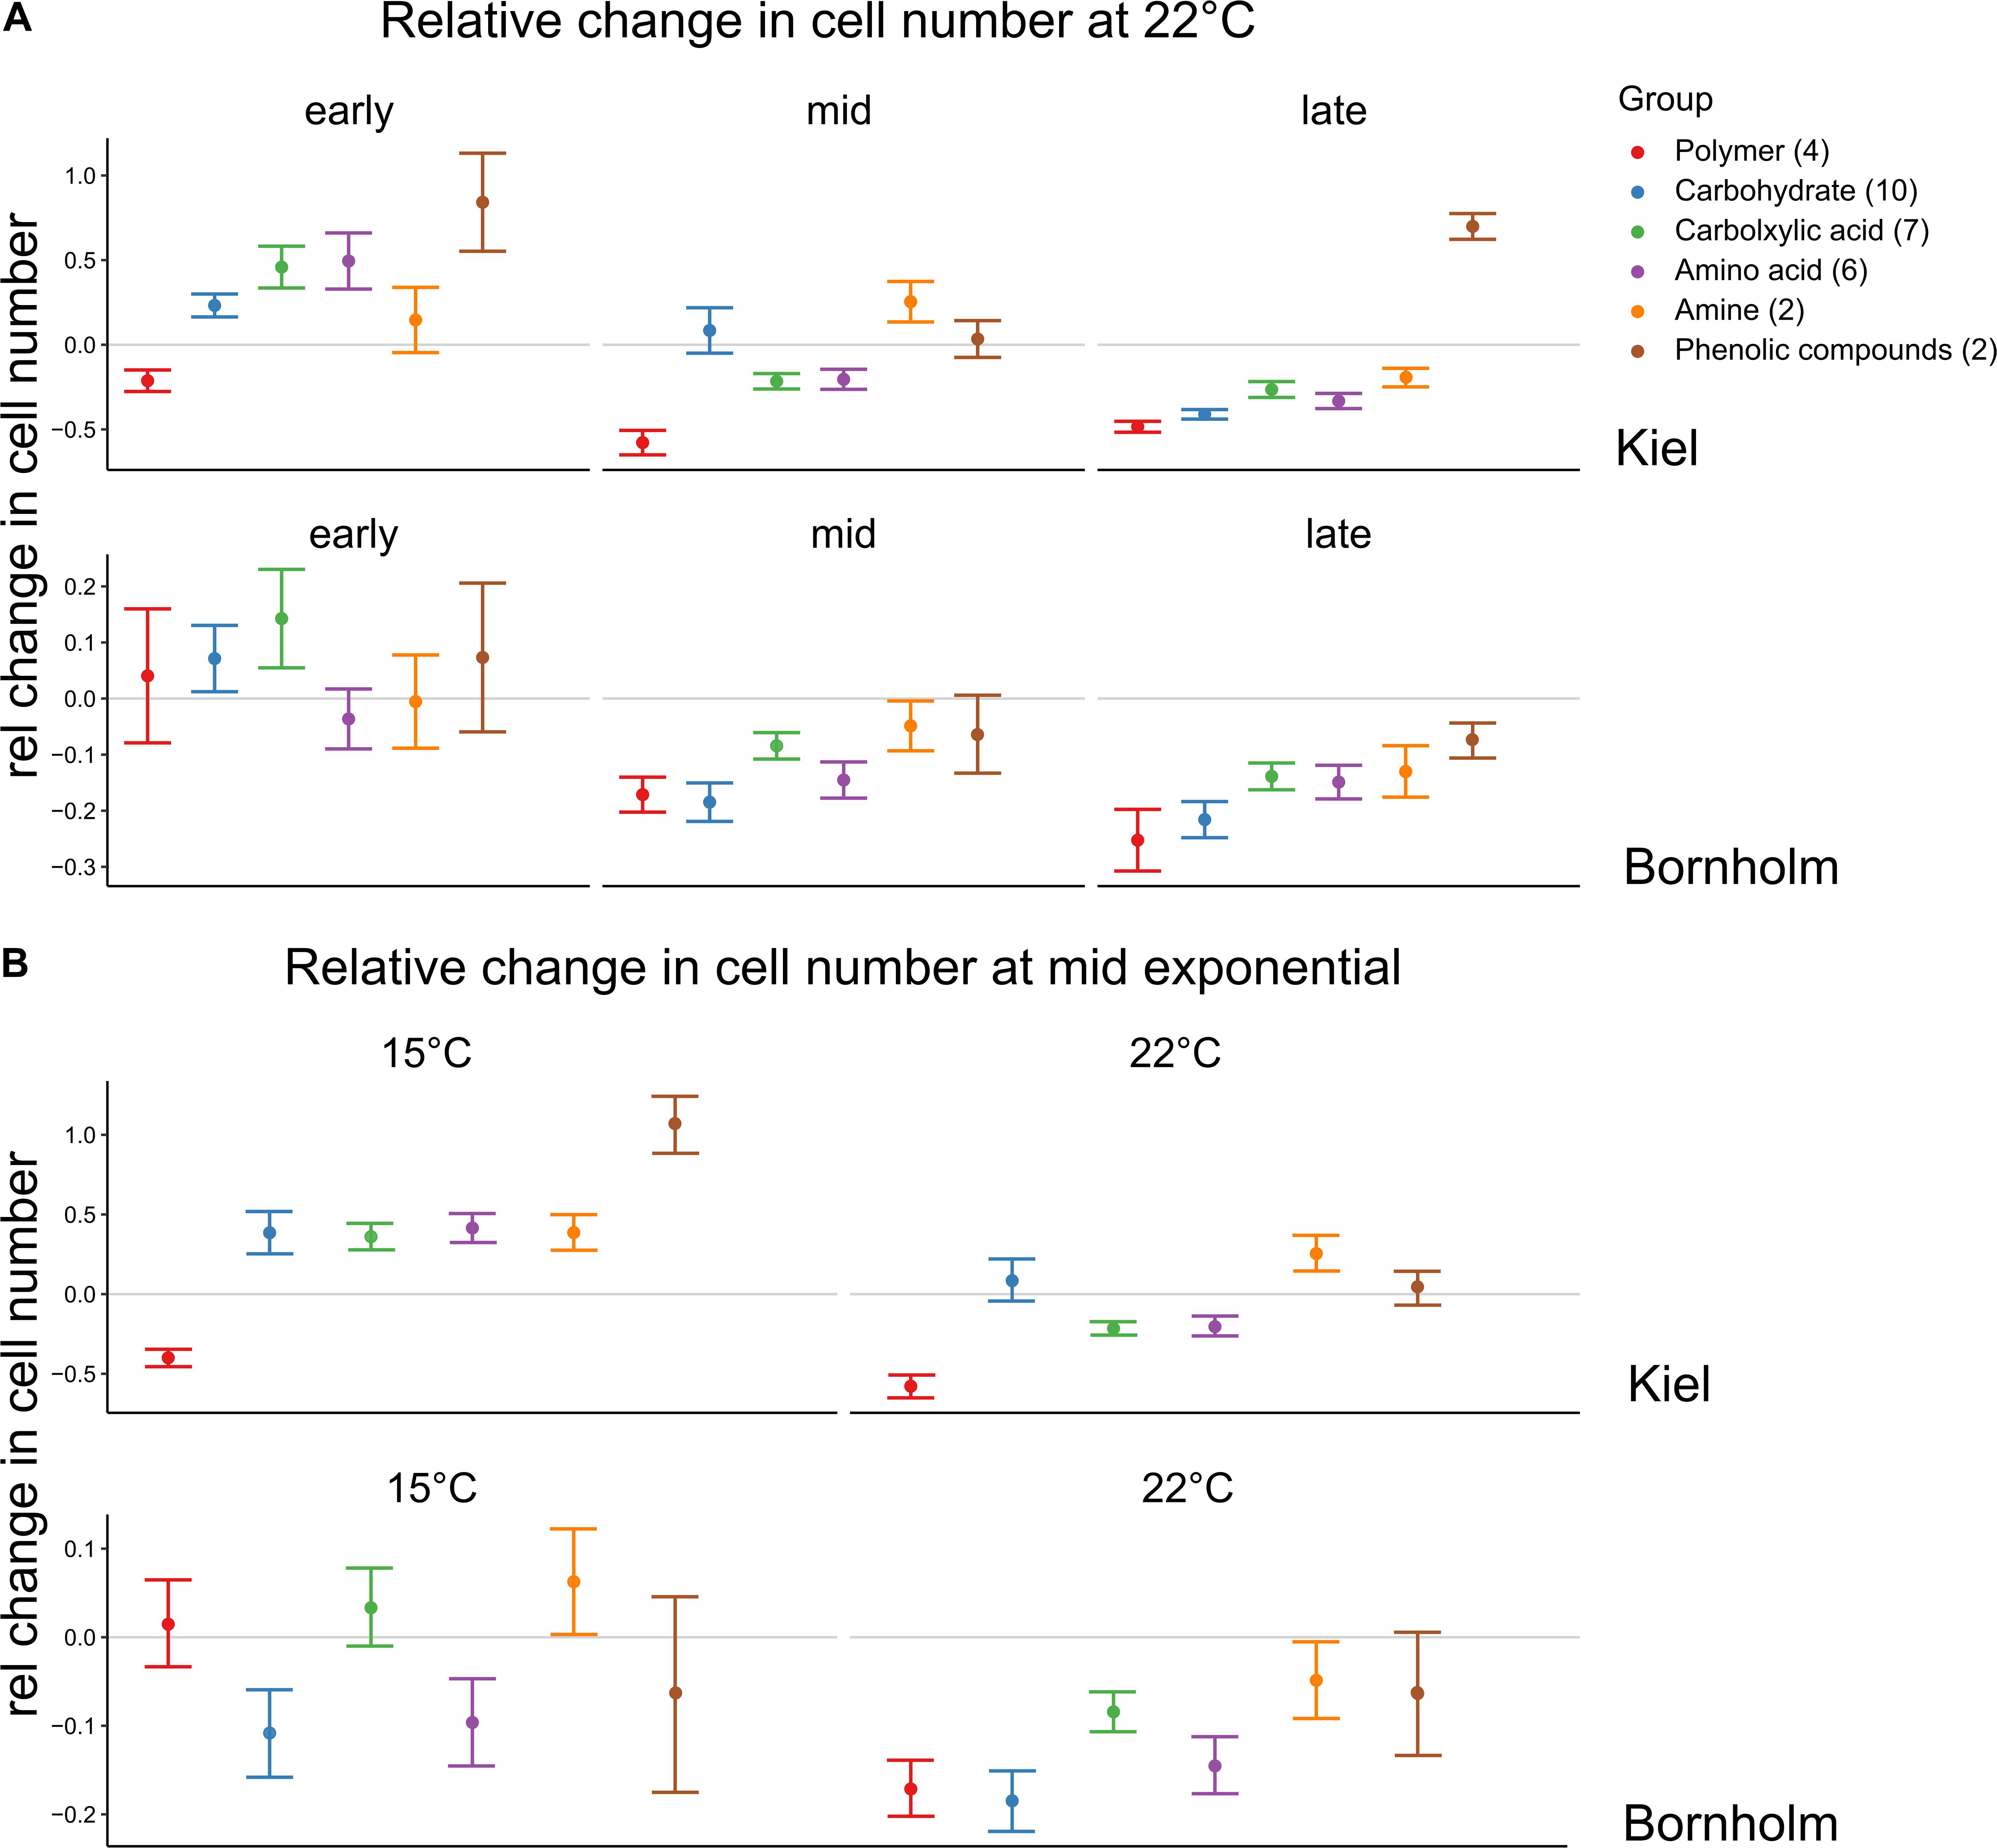
Figure 5. Relative change in cell numbers on the different carbon compound groups. The colors code for the different groups of carbon sources each source belongs to and on which we did the statistical analysis. Shown here are mean ±1 SE for each group. However, each group contains different numbers of carbon sources (number in brackets) and a total of triplicate/source measurements of 4 or 2 strains for Kiel and Bornholm samples, respectively. A negative relative change indicates that the cells could not profit from being incubated on an organic carbon source whereas the positive change indicated a positive effect of the organic compound. (A) Shows the changes at 22°C at the different time points whereas (B) shows the changes in mid exponential phase between 15 and 22°C.
In our study on carbon uptake in Ostreococcus sp. from the Baltic Sea, we showed that there is an adaptive signature of warming or, at the very least in the absence of molecular evidence, of processes acting on time-scales beyond acclimation and plasticity. Furthermore, we found different circumstances with respect to temperature and time in microbial growth curve when inorganic and, potentially, organic carbon were used for growth.
With respect to the question whether Ostreococcus has an adaptive signature of its origin, we showed that strains from the warmer and more variable Kiel area showed higher growth rates in general and a more variable response to temperature as well. This was the opposite in the strains from the colder, less variable Bornholm Basin. These findings are consistent with the expectations based on short-term (within several generations) response measurements (Zhong et al., 2020) where the origin of the communities and thus their evolutionary history affected all key functional traits measured. Taking into account the wealth of theoretical work (Draghi and Whitlock, 2012; Botero et al., 2015; Ashander et al., 2016; Buckley and Kingsolver, 2019; Haaland and Botero, 2019) and experimental studies (Ketola and Saarinen, 2015; Schaum et al., 2016, 2018; Kristensen et al., 2018; Saarinen et al., 2018; Zhong et al., 2020), we expected that the samples from the Kiel area will have been under selection in a more variable environment, giving rise to more variable responses with respect to growth.
Considering how Ostreococcus can adjust its growth mechanistically, we conclude that inorganic and organic carbon were likely taken up in different quantities depending on the stage of the microbial growth cycle and temperature to sustain positive growth that we observed throughout. At early exponential phase, both in strains from Kiel and Bornholm CUE was below the threshold of 0.5, which means that the carbon necessary to increase biomass could not have solely come from uptake of CO2 via photosynthesis. Rather, we found in the follow-up experiment that cell numbers could increase (compared to the control on water only) on several organic carbon sources especially at early exponential phase. This means, that at this early stage in the microbial growth curve, Ostreococcus sp. potentially used organic carbon sources in the media to increase cell numbers. The organic carbon in the media could stem for example from the release of DOC by death of other Ostreococcus cells or bacteria (Thornton, 2014; Carlson and Hansell, 2015). At mid exponential and late exponential phase in the 22°C treatment, CUE increased to above the threshold of 0.5, whereas the cell increase on carbon sources decreased to almost zero, potentially indicating that at this stage in the microbial growth curve, growth was sustained mainly by uptake of CO2. However, in the 15°C treatment CUE was still below 0.5 and similarly, cells in the 15°C at mid exponential phase also increased on organic carbon sources compared to 22°C treatment. In summary, we found that when CUE was lowest, the potential to use organic carbon sources was the highest and vice versa (see Supplementary Figure 4). Consequently, there seems to be a shift between the potential use of organic vs. inorganic carbon leading to an increase cell numbers (Supplementary Figure 4). The origin of the strains further affected the likelihood and strength of this “shift.” In the samples that originated from the southern more thermally variable Kiel region, we found a stronger shift compared to the colder less variable Bornholm region (Supplementary Figure 4). Several studies that have already investigated organic carbon uptake, found that indeed mixotrophy in microalgae increased biomass yields (for example Kang et al., 2004; Liu et al., 2009; Pang et al., 2019), however, these studies focused on optimizing biofuel generation. It is still unclear, under what “natural” conditions microalgae preferably grow mixo-trophically or photo-trophically and what organic compounds may be available under natural conditions (Stickney et al., 2000; Flynn et al., 2013; Mitra et al., 2016).
Previous studies have already pointed toward evidence of Ostreococcus being able to sustain growth on sorbitol in the dark for circadian clock research (O-Neill et al., 2011; van Ooijen and Millar, 2012), but our study provides striking evidence that organic carbon sources are taken up readily in the light. This requires that we rethink our understanding of photoautotrophs and go beyond CO2 uptake. The consequences of the ability to take up organic carbon may be twofold: on the one hand, the carbon pool used by Ostreococcus may not solely be in the form of CO2 but also DOM (dissolved inorganic matter). If, in general, many species of phytoplankton would indeed use other forms of carbon other than CO2, there might be a consequence on the carbon draw-down from the inorganic pool (Basu and Mackey, 2018). In particular, less DIC would be used directly for biomass production, but rather carbon would be taken up indirectly via the microbial shunt. On the other hand, using organic carbon sources puts the organisms in direct competition with other mixotrophic phytoplankton as well as heterotrophic organisms (e.g., bacteria). This second consequence is likely of more importance considering species interactions in microbial communities and thus ecosystem dynamics due to changes in the microbial loop (Meyer, 1994; Fenchel, 2008).
Generally, carbon acquisition via photosynthesis is cheap (Raven, 1991; Raven and Johnston, 1991) which is why there could be other reasons wherefore organic carbon is readily taken up by Ostreococcus under certain conditions. For example, the uptake of organic carbon compounds could be a “cheap” acquisition of organic nutrients (e.g., nitrogen, phosphorus) that are otherwise expensive to produce or acquire. The reduction of nitrate to organically available nitrogen (the same goes for phosphorous) is energy consuming (Timmermans et al., 1994). And at times where photosynthetic activity is low (i.e., at early and late exponential phase or lower temperatures), the available energy for such chemical conversions is low as well. As a result, using organic carbon compounds may be a way for the organism to acquire organic nutrients in a cheap way and use them for biomass formation and growth. Even if the growth on organic carbon compounds is not a consequence of requiring more carbon but rather organic nutrients, the effect this can have on competition that we highlighted above, may be similar. Whether the sources we tested were an organic carbon or organic nutrient source, could be investigated via the addition of DOC (dissolved organic carbon) or DOP (dissolved organic phosphorous) or DON (dissolved organic nitrogen) in manipulative experiments. The uptake of dissolved organic nutrients could then in addition be traced via mass spectrometry or HPLC (see for example Yan et al., 2012).
In this study, the growth effect of the organic carbon sources was not measured directly in culture, but rather as a potential to use a given source (ecoplates) (see section “Materials and Methods” for details). Therefore, a manipulative experiment proving that the addition of an organic carbon source directly to the experimental culture increases growth, would be the next logical step. In addition, testing the effect of additional organic carbon sources on other functional groups of phytoplankton and heterotrophic organisms is necessary to characterize the consequence of possible competition between phototrophic and heterotrophic microbial species and how ecological dynamics would be affected.
In conclusion, we found that a small pico-phytoplankton species from the Baltic Sea does have an adaptive response to environmental change due to differences in ecological variability and evolutionary history. However, it is important to understand the mechanism of the growth response, as the differences in the strategies related to carbon uptake may have implications on ecosystem dynamics and how well microbial photosynthetic organisms can persist in future environments.
The original data used in this study are deposited in Zenodo under the following: https://doi.org/10.5281/zenodo.3958784.
LL, FK, and NM carried out the experiments. LL and C-ES retrieved, prepared and maintained the phytoplankton cultures, conceived, designed the experiments, and supervised laboratory work. LL handled data analysis and wrote the first draft of the manuscript. All authors contributed equally to writing subsequent versions of the manuscript.
This project was funded through a grant by the Universitaet Hamburg to C-ES. Research was also partially funded by the Deutsche Forschungsgemeinschaft (DFG, German Research Foundation) under Germany’s Excellence Strategy—EXC 2037 “CLICCS—Climate, Climatic Change, and Society”—Project No. 390683824, contribution to the Center for Earth System Research and Sustainability (CEN) of Universität Hamburg.
The authors declare that the research was conducted in the absence of any commercial or financial relationships that could be construed as a potential conflict of interest.
All claims expressed in this article are solely those of the authors and do not necessarily represent those of their affiliated organizations, or those of the publisher, the editors and the reviewers. Any product that may be evaluated in this article, or claim that may be made by its manufacturer, is not guaranteed or endorsed by the publisher.
We would like to thank Margarethe Nowicki, Richard Klinger, Jens-Peter Hermann, and the captain and crew of RV ALKOR for support at sea (cruises AL505 and AL507), and Stefanie Schnell for technical assistance in the laboratory at IMF Hamburg.
The Supplementary Material for this article can be found online at: https://www.frontiersin.org/articles/10.3389/fmars.2021.740763/full#supplementary-material
Ashander, J., Chevin, L. M., and Baskett, M. L. (2016). Predicting evolutionary rescue via evolving plasticity in stochastic environments. Proc. Biol. Sci. 283:20161690. doi: 10.1098/rspb.2016.1690
Barton, S., Jenkins, J., Buckling, A., Schaum, C. E., Smirnoff, N., Raven, J. A., et al. (2020). Evolutionary temperature compensation of carbon fixation in marine phytoplankton (V Ezenwa, Ed.). Ecol. Lett. 23, 722–733. doi: 10.1111/ele.13469
Basu, S., and Mackey, K. R. M. (2018). Phytoplankton as key mediators of the biological carbon pump: their responses to a changing climate. Sustainability 10:869. doi: 10.3390/su10030869
Botero, C. A., Weissing, F. J., Wright, J., and Rubenstein, D. R. (2015). Evolutionary tipping points in the capacity to adapt to environmental change. Proc. Natl. Acad. Sci. U.S.A. 112, 184–189. doi: 10.1073/pnas.1408589111
Boyd, P. W., Rynearson, T. A., Armstrong, E. A., Fu, F., Hayashi, K., Hu, Z., et al. (2013). Marine phytoplankton temperature versus growth responses from polar to tropical waters – outcome of a scientific community-wide study. PLoS One 8:e63091. doi: 10.1371/journal.pone.0063091
Buchanan, R. L., Whiting, R. C., and Damert, W. C. (1997). When is simple good enough: a comparison of the Gompertz, Baranyi, and three-phase linear models for fitting bacterial growth curves. Food Microbiol. 14, 313–326. doi: 10.1006/fmic.1997.0125
Buckley, L. B., and Kingsolver, J. G. (2019). Environmental variability shapes evolution, plasticity and biogeographic responses to climate change (A Hampe, Ed.). Glob. Ecol. Biogeogr. 28, 1456–1468. doi: 10.1111/geb.12953
Buitenhuis, E. T., Li, W. K. W., Vaulot, D., Lomas, M. W., Landry, M. R., Partensky, F., et al. (2012). Earth system science data picophytoplankton biomass distribution in the global ocean. Earth Syst. Sci. Data 4, 37–46. doi: 10.5194/essd-4-37-2012
Cai, H., Wang, K., Huang, S., Jiao, N., and Chen, F. (2010). Distinct patterns of picocyanobacterial communities in winter and summer in the chesapeake bay. Appl. Environ. Microbiol. 76, 2955–2960. doi: 10.1128/aem.02868-09
Carlson, C. A., and Hansell, D. A. (2015). DOM Sources, Sinks, Reactivity, and Budgets. Biogeochemistry of Marine Dissolved Organic Matter, 2nd Edn. Amsterdam: Elsevier Inc., 65–126.
Collins, S., and Schaum, C. E. (2019). Diverse strategies link growth rate and competitive ability in phytoplankton responses to changes in CO2 levels. bioRxiv [Preprint] doi: 10.1101/651471
Courties, C., Vaquer, A., Troussellier, M., Lautier, J., Chrétiennot-Dinet, M. J., Neveux, J., et al. (1994). Smallest eukaryotic organism. Nature 370, 255–255. doi: 10.1038/370255a0
Des Roches, S., Post, D. M., Turley, N. E., Bailey, J. K., Hendry, A. P., Kinnison, M. T., et al. (2018). The ecological importance of intraspecific variation. Nat. Ecol. Evol. 2, 57–64.
Draghi, J. A., and Whitlock, M. C. (2012). Phenotypic plasticity facilitates mutational variance, genetic variance, and evolvability along the major axis of environmental variation. Evolution 66, 2891–2902. doi: 10.1111/j.1558-5646.2012.01649.x
Edwards, K. F., Klausmeier, C. A., and Litchman, E. (2015). Nutrient utilization traits of phytoplankton. Ecology 96, 2311–2311. doi: 10.1890/14-2252.1
Elena, S. F., and Lenski, R. E. (2003). Evolution experiments with microorganisms: the dynamics and genetic bases of adaptation. Nat. Rev. Genet. 4, 457–469. doi: 10.1038/nrg1088
Falkowski, P. G., Fenchel, T., and Delong, E. F. (2008). The microbial engines that drive earth’s biogeochemical cycles. Science 320, 1034–1040. doi: 10.1126/science.1153213
Fenchel, T. (2008). The microbial loop – 25 years later. J. Exp. Mar. Biol. Ecol. 366, 99–103. doi: 10.1016/j.jembe.2008.07.013
Field, C. B., Behrenfeld, M. J., Randerson, J. T., and Falkowski, P. (1998). Primary production of the biosphere: integrating terrestrial and oceanic components. Science 281, 237–240. doi: 10.1126/science.281.5374.237
Flynn, K. J., Stoecker, D. K., Mitra, A., Raven, J. A., Glibert, P. M., Hansen, P. J., et al. (2013). Misuse of the phytoplankton-zooplankton dichotomy: the need to assign organisms as mixotrophs within plankton functional types. J. Plankton Res. 35, 3–11. doi: 10.1093/plankt/fbs062
García-Carreras, B., Sal, S., Padfield, D., Kontopoulos, D. G., Bestion, E., Schaum, C. E., et al. (2018). Role of carbon allocation efficiency in the temperature dependence of autotroph growth rates. Proc. Natl. Acad. Sci. U.S.A. 115, E7361–E7368.
Gienapp, P., Teplitsky, C., Alho, J. S., Mills, J. A., and Merilä, J. (2008). Climate change and evolution: disentangling environmental and genetic responses. Mol. Ecol. 17, 167–178. doi: 10.1111/j.1365-294x.2007.03413.x
Godhe, A., and Rynearson, T. (2017). The role of intraspecific variation in the ecological and evolutionary success of diatoms in changing environments. Philos. Trans. R. Soc. B 372:20160399. doi: 10.1098/rstb.2016.0399
Guillard, R. R. L. (1975). “Culture of phytoplankton for feeding marine invertebrates,” in Culture of Marine Invertebrate Animals, eds W. L. Smith and M. H. Chanley (Boston, MA: Springer US), 29–60. doi: 10.1007/978-1-4615-8714-9_3
Haaland, T. R., and Botero, C. A. (2019). Alternative responses to rare selection events are differentially vulnerable to changes in the frequency, scope, and intensity of environmental extremes. Ecol. Evol. 9, 11752–11761. doi: 10.1002/ece3.5675
Hackett, C. A., and Griffiths, B. S. (1997). Statistical analysis of the time-course of biolog substrate utilization. J. Microbiol. Methods 30, 63–69. doi: 10.1016/s0167-7012(97)00045-6
Halsey, K. H., O’Malley, R. T., Graff, J. R., Milligan, A. J., and Behrenfeld, M. J. (2013). A common partitioning strategy for photosynthetic products in evolutionarily distinct phytoplankton species. New Phytol. 198, 1030–1038. doi: 10.1111/nph.12209
Hattich, G. S. I., Listmann, L., Raab, J., Ozod-Seradj, D., Reusch, T. B. H., and Matthiessen, B. (2017). Inter-and intraspecific phenotypic plasticity of three phytoplankton species in response to ocean acidification. Biol. Lett. 13:20160774. doi: 10.1098/rsbl.2016.0774
Kang, R., Wang, J., Shi, D., Cong, W., Cai, Z., and Ouyang, F. (2004). Interactions between organic and inorganic carbon sources during mixotrophic cultivation of Synechococcus sp. Biotechnol. Lett. 26, 1429–1432. doi: 10.1023/b:bile.0000045646.23832.a5
Ketola, T., and Saarinen, K. (2015). Experimental evolution in fluctuating environments: tolerance measurements at constant temperatures incorrectly predict the ability to tolerate fluctuating temperatures. J. Evol. Biol. 28, 800–806. doi: 10.1111/jeb.12606
Kristensen, T. N., Ketola, T., and Kronholm, I. (2018). Adaptation to environmental stress at different timescales. Ann. N. Y. Acad. Sci. 1476, 5–22. doi: 10.1111/nyas.13974
Lenski, R. E., and Travisano, M. (1994). Dynamics of adaptation and diversification: a 10,000-generation experiment with bacterial populations. Proc. Natl. Acad. Sci. U.S.A. 91, 6808–6814. doi: 10.1073/pnas.91.15.6808
Leppäranta, M., and Myrberg, K. (2009). Physical Oceanography of the Baltic Sea. New York: Springer-Verlag.
Levis, N. A., Pfennig, D. W., Mayr, E., Wagner, G. P., Lynch, V. J., Carroll, S. B., et al. (2016). Evaluating ‘plasticity-first’ evolution in nature: key criteria and empirical approaches. Trends Ecol. Evol. 31, 563–574. doi: 10.1016/j.tree.2016.03.012
Lindsey, R., and Scott, M. (2010). What are Photoplankton? Available online at: http://earthobservatory.nasa.gov/Features/Phytoplankton/printall.php
Listmann, L., LeRoch, M., Schlüter, L., Thomas, M. K., and Reusch, T. B. H. (2016). Swift thermal reaction norm evolution in a key marine phytoplankton species. Evol. Appl. 9, 1156–1164. doi: 10.1111/eva.12362
Liu, X., Duan, S., Li, A., Xu, N., Cai, Z., and Hu, Z. (2009). Effects of organic carbon sources on growth, photosynthesis, and respiration of Phaeodactylum tricornutum. J. Appl. Phycol. 21, 239–246. doi: 10.1007/s10811-008-9355-z
Lohbeck, K. T., Riebesell, U., and Reusch, T. B. H. (2012). Adaptive evolution of a key phytoplankton species to ocean acidification. Nat. Geosci. 5, 346–351. doi: 10.1038/ngeo1441
Meyer, J. L. (1994). The microbial loop in flowing waters. Microb. Ecol. 28, 195–199. doi: 10.1007/bf00166808
Mitra, A., Flynn, K. J., Tillmann, U., Raven, J. A., Caron, D., Stoecker, D. K., et al. (2016). Defining planktonic protist functional groups on mechanisms for energy and nutrient acquisition: incorporation of diverse mixotrophic strategies. Protist 167, 106–120. doi: 10.1016/j.protis.2016.01.003
O-Neill, J. S., Van Ooijen, G., Dixon, L. E., Troein, C., Corellou, F., Bouget, F. Y., et al. (2011). Circadian rhythms persist without transcription in a eukaryote. Nature 469, 554–558. doi: 10.1038/nature09654
Padfield, D., Yvon-Durocher, G., Buckling, A., Jennings, S., and Yvon-Durocher, G. (2016). Rapid evolution of metabolic traits explains thermal adaptation in phytoplankton. Ecol. Lett. 19, 133–142. doi: 10.1111/ele.12545
Pang, N., Gu, X., Chen, S., Kirchhoff, H., Lei, H., and Roje, S. (2019). Exploiting mixotrophy for improving productivities of biomass and co-products of microalgae. Renew. Sustain. Energy Rev. 112, 450–460. doi: 10.1016/j.rser.2019.06.001
Raven, J. A. (1991). Physiology of inorganic C acquisition and implications for resource use efficiency by marine phytoplankton: relation to increased CO2 and temperature. Plant Cell Environ. 14, 779–794. doi: 10.1111/j.1365-3040.1991.tb01442.x
Raven, J. A., and Johnston, A. M. (1991). Mechanisms of inorganic-carbon acquisition in marine phytoplankton and their implications for the use of other resources. Limnol. Oceanogr. 36, 1701–1714. doi: 10.4319/lo.1991.36.8.1701
Reusch, T. B. H., and Boyd, P. W. (2013). Experimental evolution meets marine phytoplankton. Evolution 67, 1849–1859. doi: 10.1111/evo.12035
Rodríguez, F., Derelle, E., Guillou, L., Le Gall, F., Vaulot, D., and Moreau, H. (2005). Ecotype diversity in the marine picoeukaryote Ostreococcus (Chlorophyta, Prasinophyceae). Environ. Microbiol. 7, 853–859. doi: 10.1111/j.1462-2920.2005.00758.x
Rokitta, S. D., Von Dassow, P., Rost, B., and John, U. (2016). P- and N-starvation trigger the same cellular responses to promote senescence in eukaryotic phytoplankton. Front. Mar. Sci. 3:109. doi: 10.3389/fmars.2016.00109
Rost, B., Riebesell, U., and Sültemeyer, D. (2006). Carbon acquisition of marine phytoplankton. Limnol. Oceanogr. 51, 12–20. doi: 10.4319/lo.2006.51.1.0012
Rutgers, M., Wouterse, M., Drost, S. M., Breure, A. M., Mulder, C., Stone, D., et al. (2016). Monitoring soil bacteria with community-level physiological profiles using BiologTM ECO-plates in the Netherlands and Europe. Appl. Soil Ecol. 97, 23–35. doi: 10.1016/j.apsoil.2015.06.007
Saarinen, K., Laakso, J., Lindström, L., and Ketola, T. (2018). Adaptation to fluctuations in temperature by nine species of bacteria. Ecol. Evol. 8, 2901–2910. doi: 10.1002/ece3.3823
Schaum, C. E., Barton, S., Bestion, E., Buckling, A., Garcia-Carreras, B., Lopez, P., et al. (2017). Adaptation of phytoplankton to a decade of experimental warming linked to increased photosynthesis. Nat. Ecol. Evol. 1, 1–7.
Schaum, C. E., Buckling, A., Smirnoff, N., Studholme, D. J., and Yvon-Durocher, G. (2018). Environmental fluctuations accelerate molecular evolution of thermal tolerance in a marine diatom. Nat. Commun. 9:1719.
Schaum, C.-E., Rost, B., and Collins, S. (2016). Environmental stability affects phenotypic evolution in a globally distributed marine picoplankton. ISME J. 10, 75–84. doi: 10.1038/ismej.2015.102
Schlüter, L., Lohbeck, K. T., Gutowska, M. A., Gröger, J. P., Riebesell, U., and Reusch, T. B. H. (2014). Adaptation of a globally important coccolithophore to ocean warming and acidification. Nat. Clim. Chang. 4, 1024–1030. doi: 10.1038/nclimate2379
Sommer, U. (1984). The paradox of the plankton: fluctuations of phosphorus availability maintain diversity of phytoplankton in flow-through cultures. Limnol. Oceanogr. 29, 633–636. doi: 10.4319/lo.1984.29.3.0633
Stickney, H. L., Hood, R. R., and Stoecker, D. K. (2000). The impact of mixotrophy on planktonic marine ecosystems. Ecol. Model. 125, 203–230. doi: 10.1016/s0304-3800(99)00181-7
Thornton, D. C. O. (2014). Dissolved organic matter (DOM) release by phytoplankton in the contemporary and future ocean. Eur. J. Phycol. 49, 20–46. doi: 10.1080/09670262.2013.875596
Timmermans, K. R., Stolte, W., and de Baar, H. J. W. (1994). Iron-mediated effects on nitrate reductase in marine phytoplankton. Mar. Biol. 121, 389–396. doi: 10.1007/bf00346749
van Ooijen, G., and Millar, A. J. (2012). Non-transcriptional oscillators in circadian timekeeping. Trends Biochem. Sci. 37, 484–492. doi: 10.1016/j.tibs.2012.07.006
Wiser, M. J., Ribeck, N., and Lenski, R. E. (2013). Long-term dynamics of adaptation in asexual populations. Science 342, 1364–1367. doi: 10.1126/science.1243357
Worden, A. (2006). Picoeukaryote diversity in coastal waters of the Pacific Ocean. Aquat. Microb. Ecol. 43, 165–175.
Worden, A. Z., Nolan, J. K., and Palenik, B. (2004). Assessing the dynamics and ecology of marine picophytoplankton: the importance of the eukaryotic component. Limnol. Oceanogr. 49, 168–179.
Yan, M., Korshin, G., Wang, D., and Cai, Z. (2012). Characterization of dissolved organic matter using high-performance liquid chromatography (HPLC)-size exclusion chromatography (SEC) with a multiple wavelength absorbance detector. Chemosphere 87, 879–885.
Keywords: pico-phytoplankton, environmental change, carbon acquisition, evolutionary history, primary production
Citation: Listmann L, Kerl F, Martens N and Schaum C-E (2021) Differences in Carbon Acquisition Could Explain Adaptive Responses in a Baltic Sea Pico-Phytoplankton. Front. Mar. Sci. 8:740763. doi: 10.3389/fmars.2021.740763
Received: 13 July 2021; Accepted: 13 September 2021;
Published: 05 October 2021.
Edited by:
Enric Gisbert, Institute of Agrifood Research and Technology (IRTA), SpainCopyright © 2021 Listmann, Kerl, Martens and Schaum. This is an open-access article distributed under the terms of the Creative Commons Attribution License (CC BY). The use, distribution or reproduction in other forums is permitted, provided the original author(s) and the copyright owner(s) are credited and that the original publication in this journal is cited, in accordance with accepted academic practice. No use, distribution or reproduction is permitted which does not comply with these terms.
*Correspondence: Luisa Listmann, bHVpc2EubGlzdG1hbm5AdW5pLWhhbWJ1cmcuZGU=
Disclaimer: All claims expressed in this article are solely those of the authors and do not necessarily represent those of their affiliated organizations, or those of the publisher, the editors and the reviewers. Any product that may be evaluated in this article or claim that may be made by its manufacturer is not guaranteed or endorsed by the publisher.
Research integrity at Frontiers
Learn more about the work of our research integrity team to safeguard the quality of each article we publish.