- 1Hellenic Centre for Marine Research (HCMR), Anavyssos, Greece
- 2New Naval Ltd. (NNL), Lavrion, Greece
- 3Waste & Water SARL, Athens, Greece
Marine pollution from debris is a major issue nowadays, since every year large amounts of litter enter into the sea. Under the Horizon 2020 framework and within the Cleaning Litter by developing and Applying Innovative Methods in European Seas (CLAIM) project, innovative devices were designed, developed, tested and applied in laboratory and in the field. These consisted of a system named CLEAN TRASH for the prevention of macrolitter in river estuaries before entering the Sea and a filtering system for microplastics (MPs), to be placed at waste water treatment plants (WWTP). Laboratory experiments showed that macrolitters were blocked by 90% by the CLEAN TRASH system, while during the sea testing period at the Kifissos river estuary, a significant source of terrestrial based litter for the Saronikos Gulf, a total amount of 1,175 kg of litter was collected in 38 days before entering the sea, of which the 708 kg (60%) were plastic debris of various sizes and another 164 kg (14%) of styrofoam parts. The lab scale prototype of the filtering system for MPs had an efficiency of about 95%. The upscaled device was tested at the Megara WWTP and was able to withhold a significant amount of MPs. The theoretical contribution of such devices toward the reduction of plastic pollution in the Saronikos Gulf area and the Natura conservation areas therein, was also studied with the use of a 3-D coupled Hydrodynamic-Lagrangian litter tracking model. In all experiments performed, the installation of the above devices for a period of 2 years, resulted in a microplastics reduction by about 87% and a macroplastics reduction ranging from 13 to 43%, depending on the sources.
Introduction
Each year millions of tons of plastic debris enter the sea (Jambeck et al., 2015). These are either macroplastics, (i.e., particles with a diameter larger than 5 mm), although in the 5–25 mm range, they are also categorized as mesoplastics, or microplastics (MPs) that are smaller than 5 mm. The first usually originate from sources like rivers, streams and areas close to shore with intense anthropogenic activity (e.g., tourism). MPs are either primary, i.e., industrially manufactured in small sizes (microbeads in personal care products, industrial scrubbers, plastic powders, etc.) that enter the sea from Waste Water Treatment Plants (WWTPs), or secondary that result from the fragmentation of larger plastic particles (textiles, paint, tires, etc.), once they are released into the environment (Talvitie et al., 2017a).
The scale of plastic pollution at sea, by becoming part of the Earth’s fossil record, is a marker of the Anthropocene, as characterized the current geological era. The rapidly increasing volume of plastic pollution is putting the health of all the world’s oceans and seas at risk (UNEP – Un Environment Programme, 2021), since plastics in the marine environment are considered a threat to living organisms by being mistaken for food (Talvitie et al., 2017a; Sun et al., 2018; Mahara et al., 2021), or simply consumed together with plankton (i.e., filter feeding organisms) (Alava, 2020; Mahara et al., 2021). Studies investigate the trophic transfer of smaller MPs up the food chain from smaller consumers to top predators (Alava, 2020; Hamilton et al., 2021), including humans (Smith et al., 2018), with unknown effects in human health.
Possible actions to prevent sea pollution from plastics, could include methods like an international ban on the intentional use of plastics, the ban of single use plastic products and of MPs from cosmetics, raising public awareness regarding the benefit of reducing plastic pollution from sources like beaches and harbors, and blocking plastics before they enter the sea. This last measure must be twofold since, for the reduction of both kinds of plastic, barriers must be installed at rivers and streams for the macroplastics and at the WWTPs for MPs.
For the reduction of larger plastics (macroplastics), a number of technologies have been developed. Most of these include innovative devices placed at rivers and streams that stop macroplastics and other debris. Some examples are the Interceptor from the Ocean Cleanup foundation (The Ocean Cleanup, 2021), installed in Indonesia, Malaysia and the Dominican Republic, the Bubble Barrier (Waternet, 2021), deployed in a number of the Amsterdam City canals, Mr. Trash Wheel (Trash, 2021), installed at the Jones Fall River in Baltimore, the River Cleaning system (Home—Rivercleaning, 2021), the Allseas river plastics removal project (Allseas Group S. A., 2021) installed at the Port of Antwerp in Belgium and in rivers and ports in Netherlands, the Seabin project (Seabin, 2021), the EPS Marine Sea Surface Cleaning Boats (Marine, 2021), the Urban Rivers Trashbot (Trash robot —Urban Rivers, 2021) and the SeaVax Project (Oceansplasticleanup, 2021).
Among these innovative approaches, for blocking macroplastics before entering the sea, is the CLAIM’s Litter Entrapping Autonomous Network Tactical Recovery Accumulation System Hellas or CLEAN TRASH which has been designed and manufactured under the CLAIM project (Cleaning Litter by Developing and Applying Innovative Methods in European Seas) and installed at Kifissos river in Athens, Greece.
Passing on to the reduction of MPs at sea through their treatment at key entrance points (i.e., WWTPs), it has been shown that conventional wastewater treatment may substantially reduce MPs from the wastewater and most of the MPs (particularly the larger sized classes) are already removed during the pre-treatment phases (Carr et al., 2016; Murphy et al., 2016; Talvitie et al., 2017b), and by up to 98% through tertiary treatment. Although their removal efficiency is high, conventional WWTPs may actually be a significant source of MPs given the large volumes of effluents that are discharged, carrying high concentrations of MP (Mason et al., 2016; Murphy et al., 2016; Mintenig et al., 2017; Talvitie et al., 2017a,b). Although in the past several years there have been continuous increases in the required level of quality of the final effluents of wastewater treatment, the technologies to improve the quality of the final effluent are not specifically designed to remove MPs (Mason et al., 2016; Talvitie et al., 2017b). However, a few studies suggest that by utilizing a variety of advanced final-stage treatment technologies, the reduction of the MPs from effluents can be further improved (Carr et al., 2016; Mintenig et al., 2017; Talvitie et al., 2017b; Ziajahromi et al., 2017).
Plastic microbeads, fragments and fibers pass directly from household waste into waste water systems and are too small to be retained by the standard filters used at WWTPs. Therefore, to reduce existing quantities of MPs released in the marine environment, there is a need for innovative methods, one of which is now under development in the framework of CLAIM project. Nanotechnology has potential application in various sectors of wastewater treatment and management, and is often more effective than conventional filters (e.g., Hillie and Hlophe, 2007). Heterogeneous photocatalysis is one such alternative water treatment method suitable for controlling environmental pollution (e.g., Theron et al., 2010). A photocatalytic device that degrades MPs in water under natural or artificial sunlight fabricated by KTH Royal Institute of Technology in Stockholm as well as the SME DEVENTUS using green nanotechnology-based coatings encourage polymer degradation (Uheida et al., 2021). However, to optimize the efficiency of the photocatalytic reactor—given the large volumes of effluents that are discharged, a prototype prefiltering system was developed to be placed toward the end of the purification process of WWTPs and prior the photocatalytic device to retain MPs as small as 30 μm which escape from WWTPs and feed them back to the photocatalytic reactor with a back wash operation.
Last, the effect of a possible permanent installation of these technologies in both Kifissos river (CLEAN TRASH system) and the Megara WWTP (prefiltering device), as well as in all the other rivers and WWTPs flowing into the seas around the Metropolitan area of Athens, were studied using a Lagrangian numerical model (Tsiaras et al., 2021).
Clean Trash System
Background and Site Deployment Selection
The CLEAN TRASH system aims to retain macroplastics (>5 mm) at river mouths, before they enter the sea. It is designed in order to incorporate a unique containment system which minimizes storage requirements of collected macroplastics while automatically regulating its position in the water, in combination with a tactical arrangement of customized floating barriers.
For the needs of the project, the rivers of the Attica Region (Figure 1), where the city of Athens (Greece) is located, were studied. The aim was to select the best available options by considering a number of factors such as location, water flow, depth in the river mouth area and expected litter quantities.
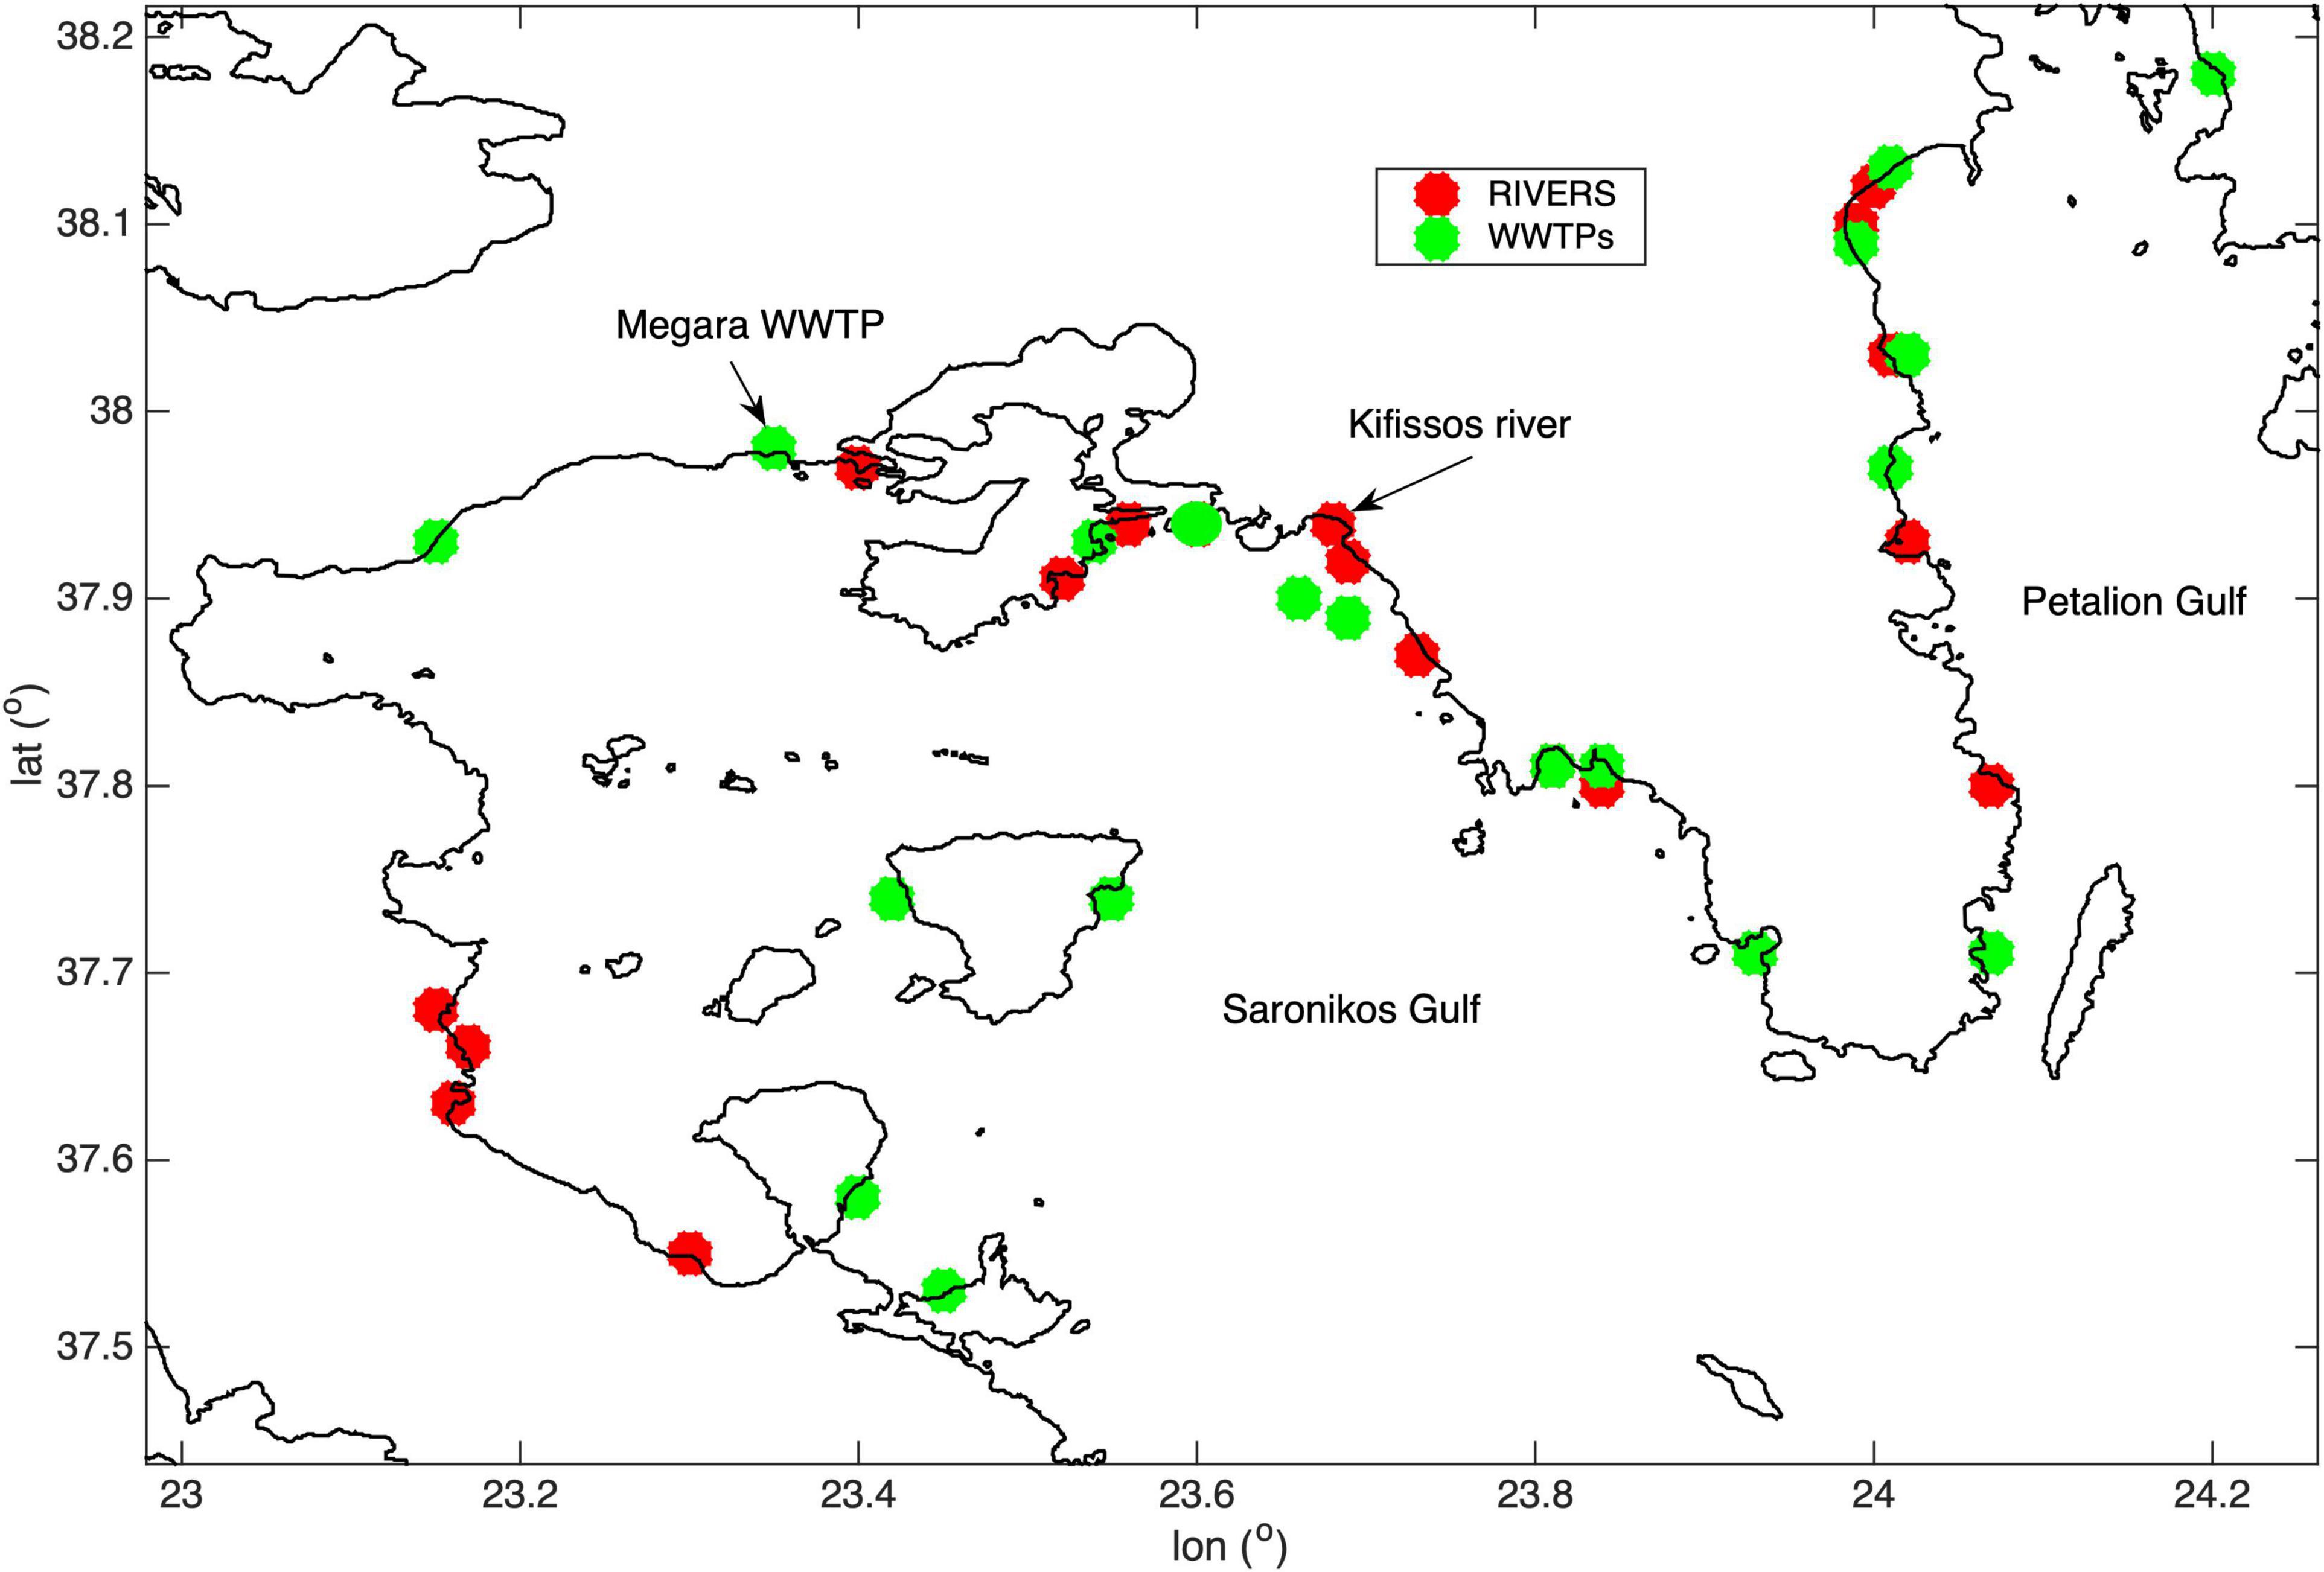
Figure 1. The Saronikos Gulf Area with the Macro and Micro Plastic Point Sources from Rivers and WWTPs.
To this end, outflows of the larger rivers in the area, the Kifissos, the Erasinos and the Rafina rivers were compared, using model derived river daily mean outputs (Lindström et al., 2010) for the years 1980–2010 (Figure 2). The Kifissos river has an average outflow of 3.2 m3/s, with a minimum of 0.48 m3/s during August and with the maximum values (13.49 m3/s) appearing during winter months and some events during spring. The other two rivers have significantly lower and non-permanent water outflows. Therefore, the Kifissos river was selected thanks to its permanent outflow, which can bring considerable quantities of litter during rain periods, while the other rivers in the Attica Region are characterized by long periods of dryness, potentially putting the project tests at risk.
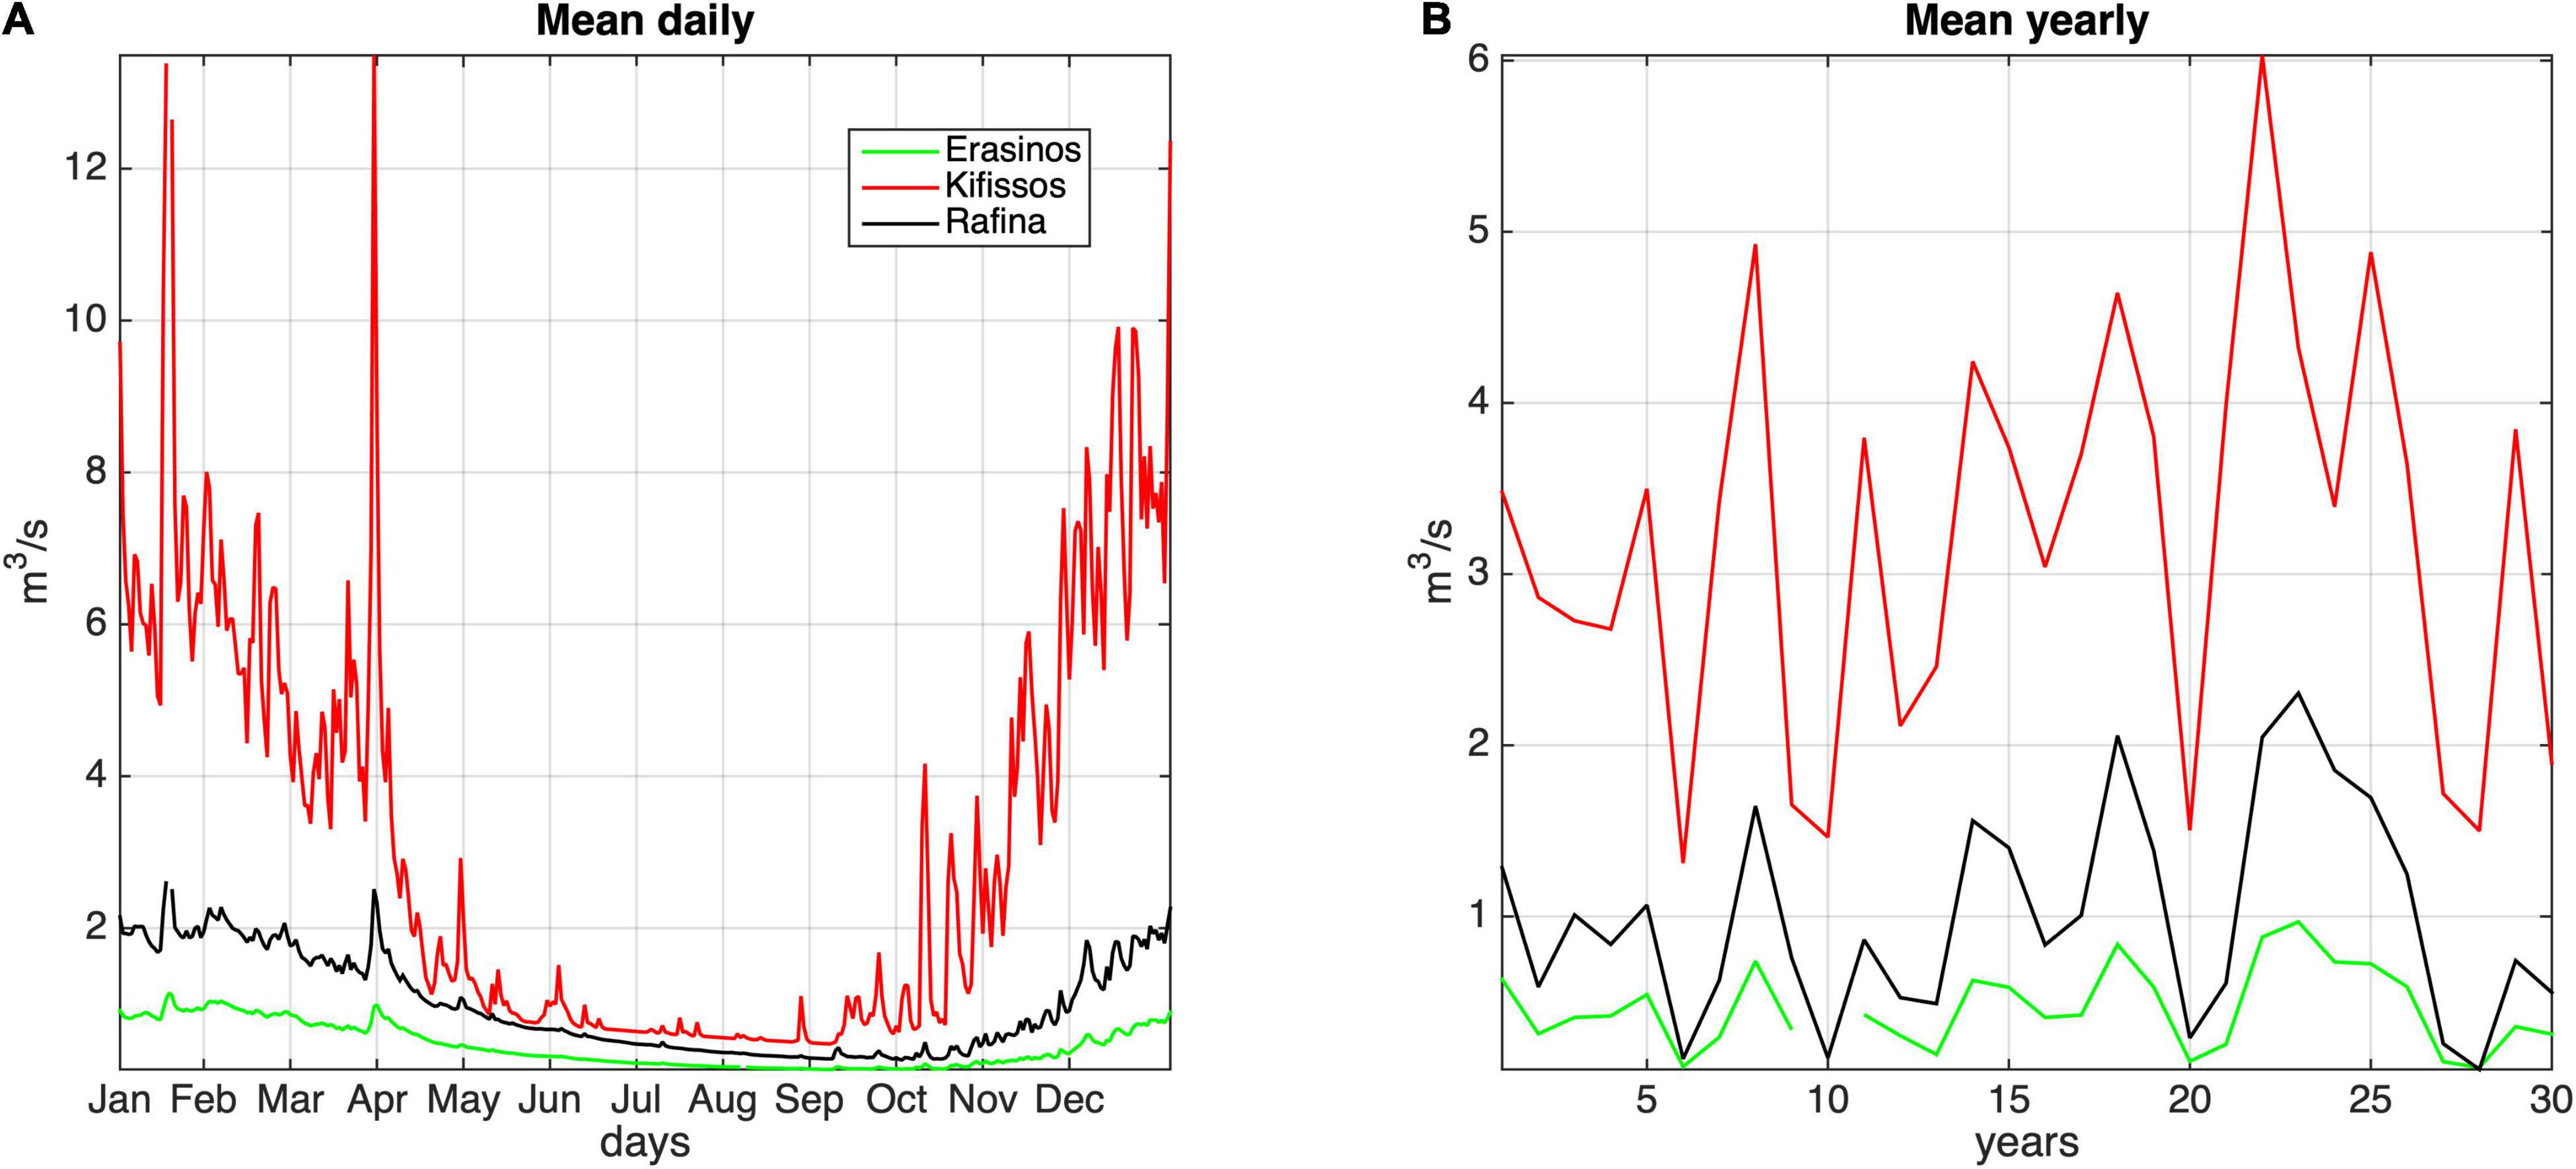
Figure 2. Modelled Average Daily (A) and Yearly (B) (1980–2010) Water Release of the 3 Major Rivers of Attica.
Following the river selection and in order to examine the prevailing weather conditions in the estuary area, outputs from the Poseidon operational forecast system (Poseidon System, 2021) for the 2000–2010 period, were used. Northerly and northerly-west winds prevail during all seasons (Figure 3), with the maximum velocities appearing mainly during the summer period.
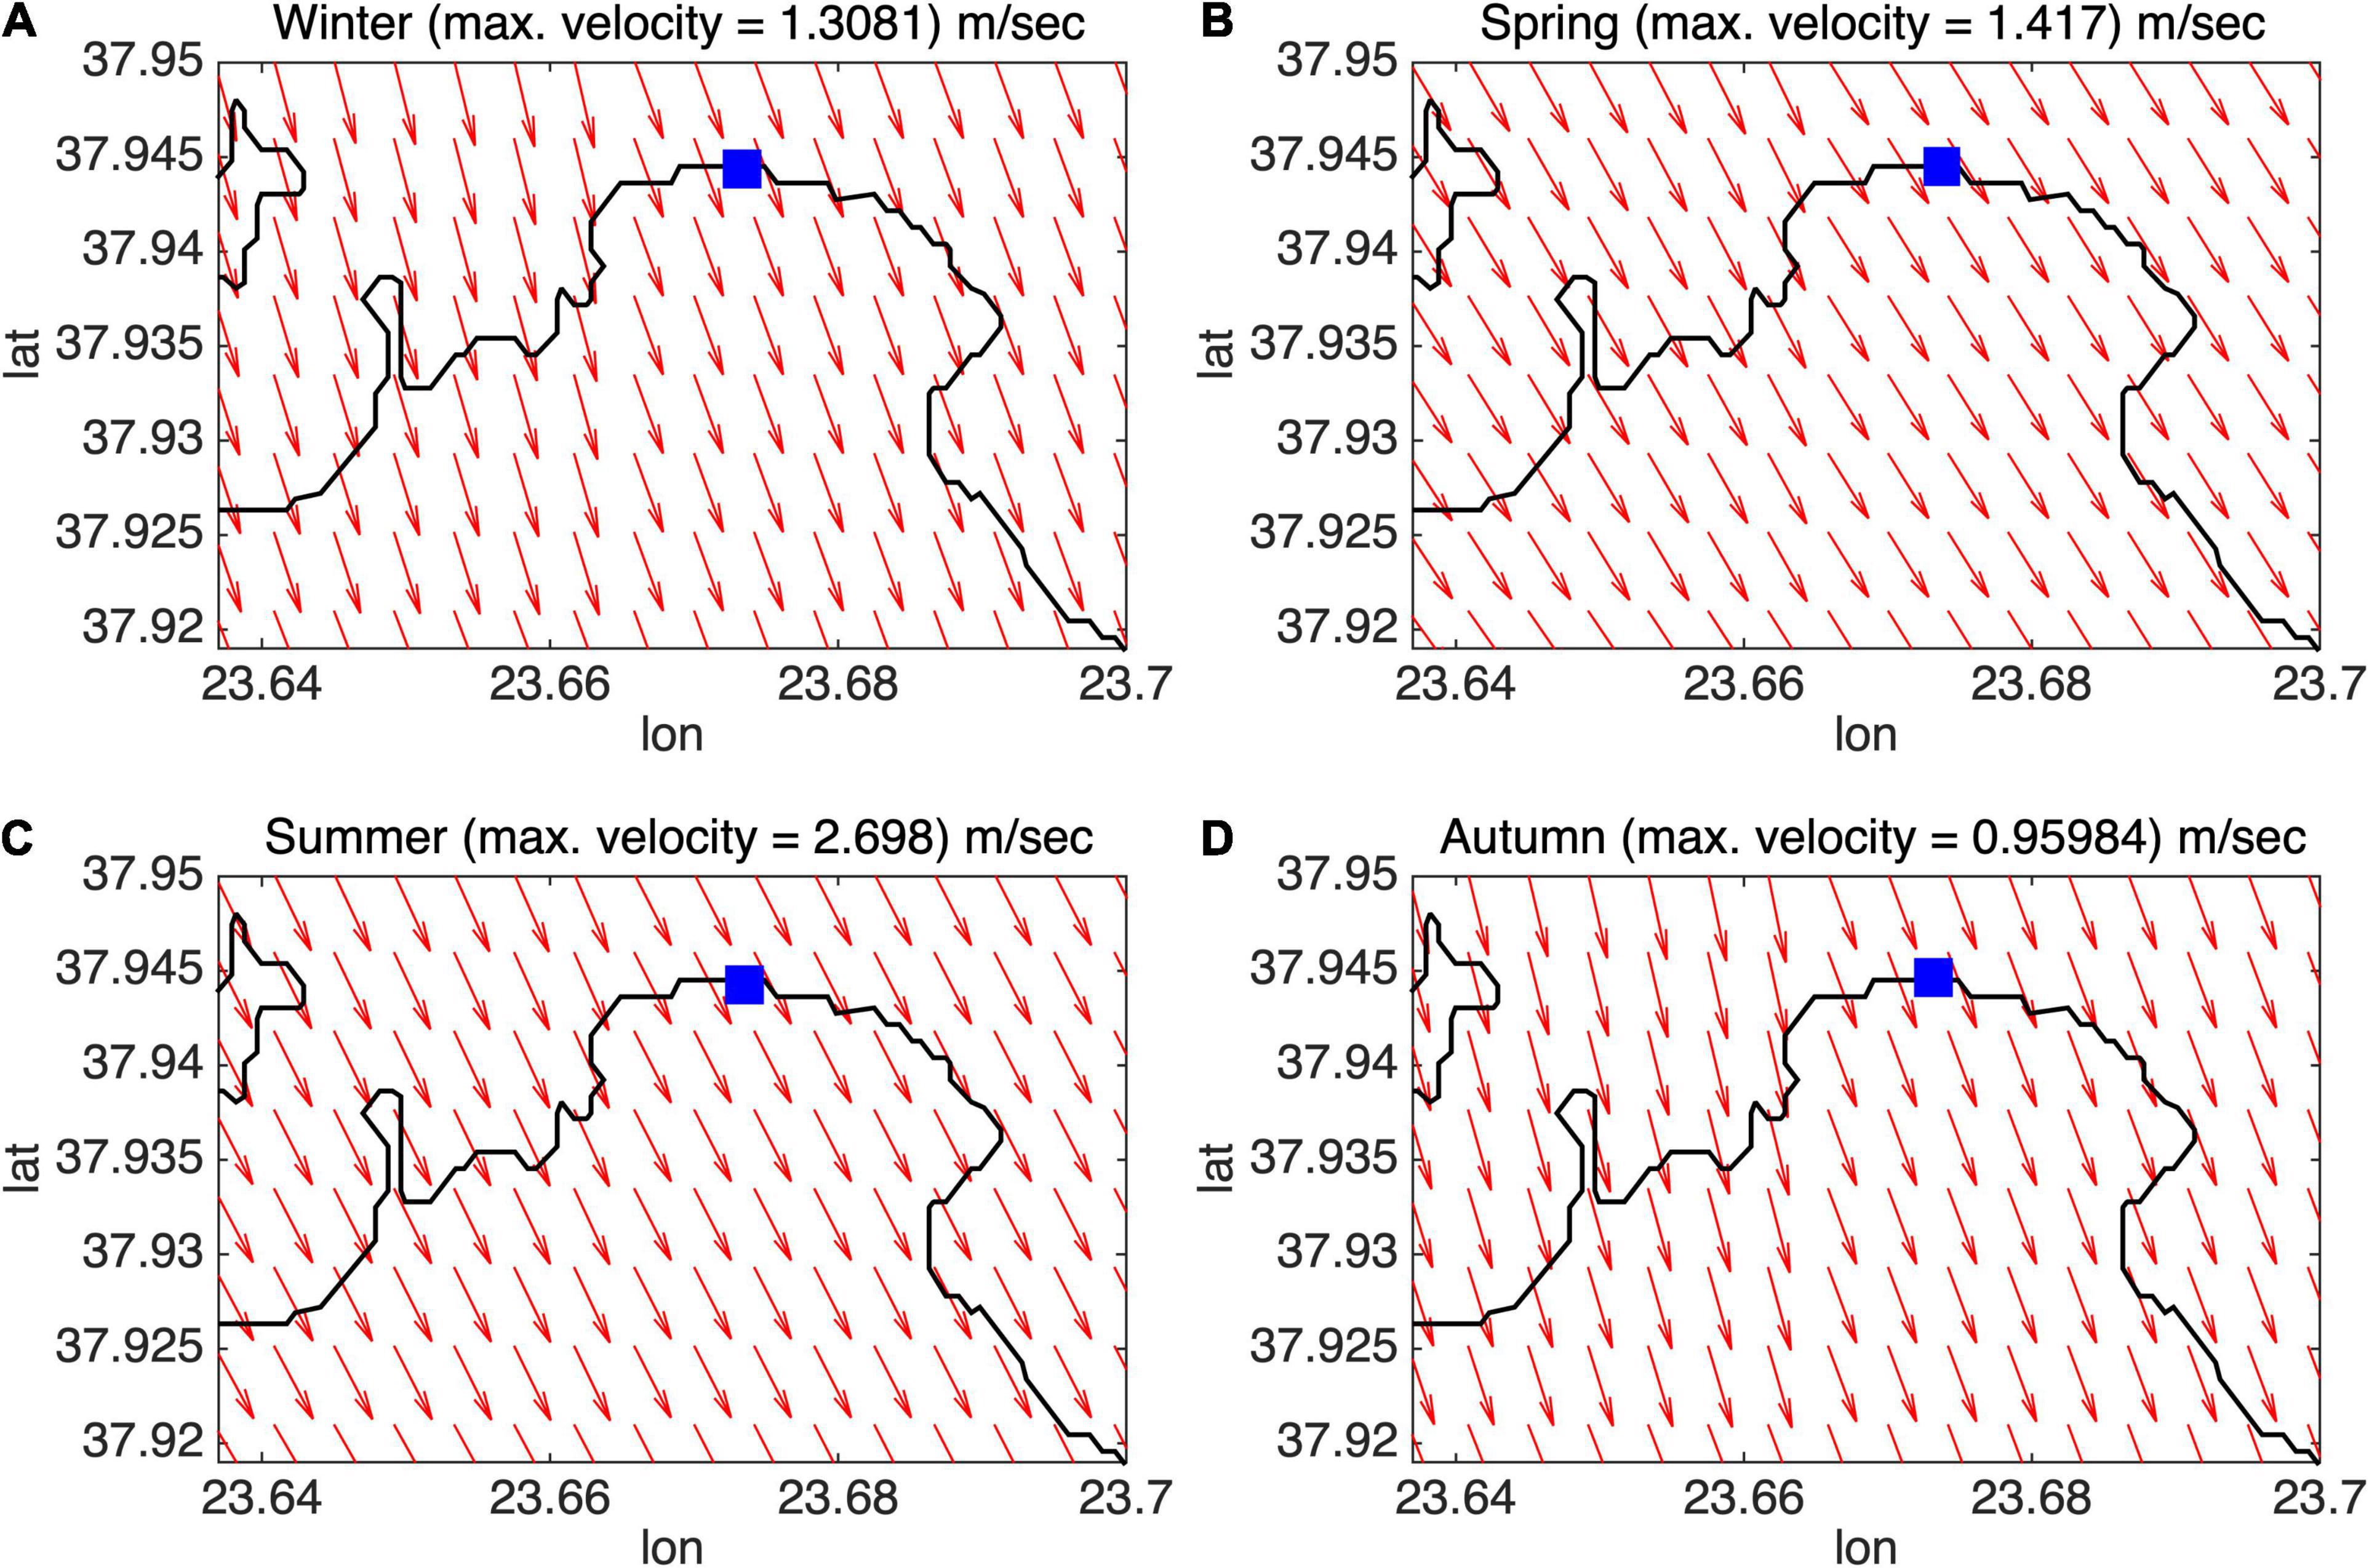
Figure 3. Seasonal [Winter: (A), Spring: (B), Summer: (C), Autumn: (D)] Wind Conditions near the Kifissos River Mouth (denoted by the blue square).
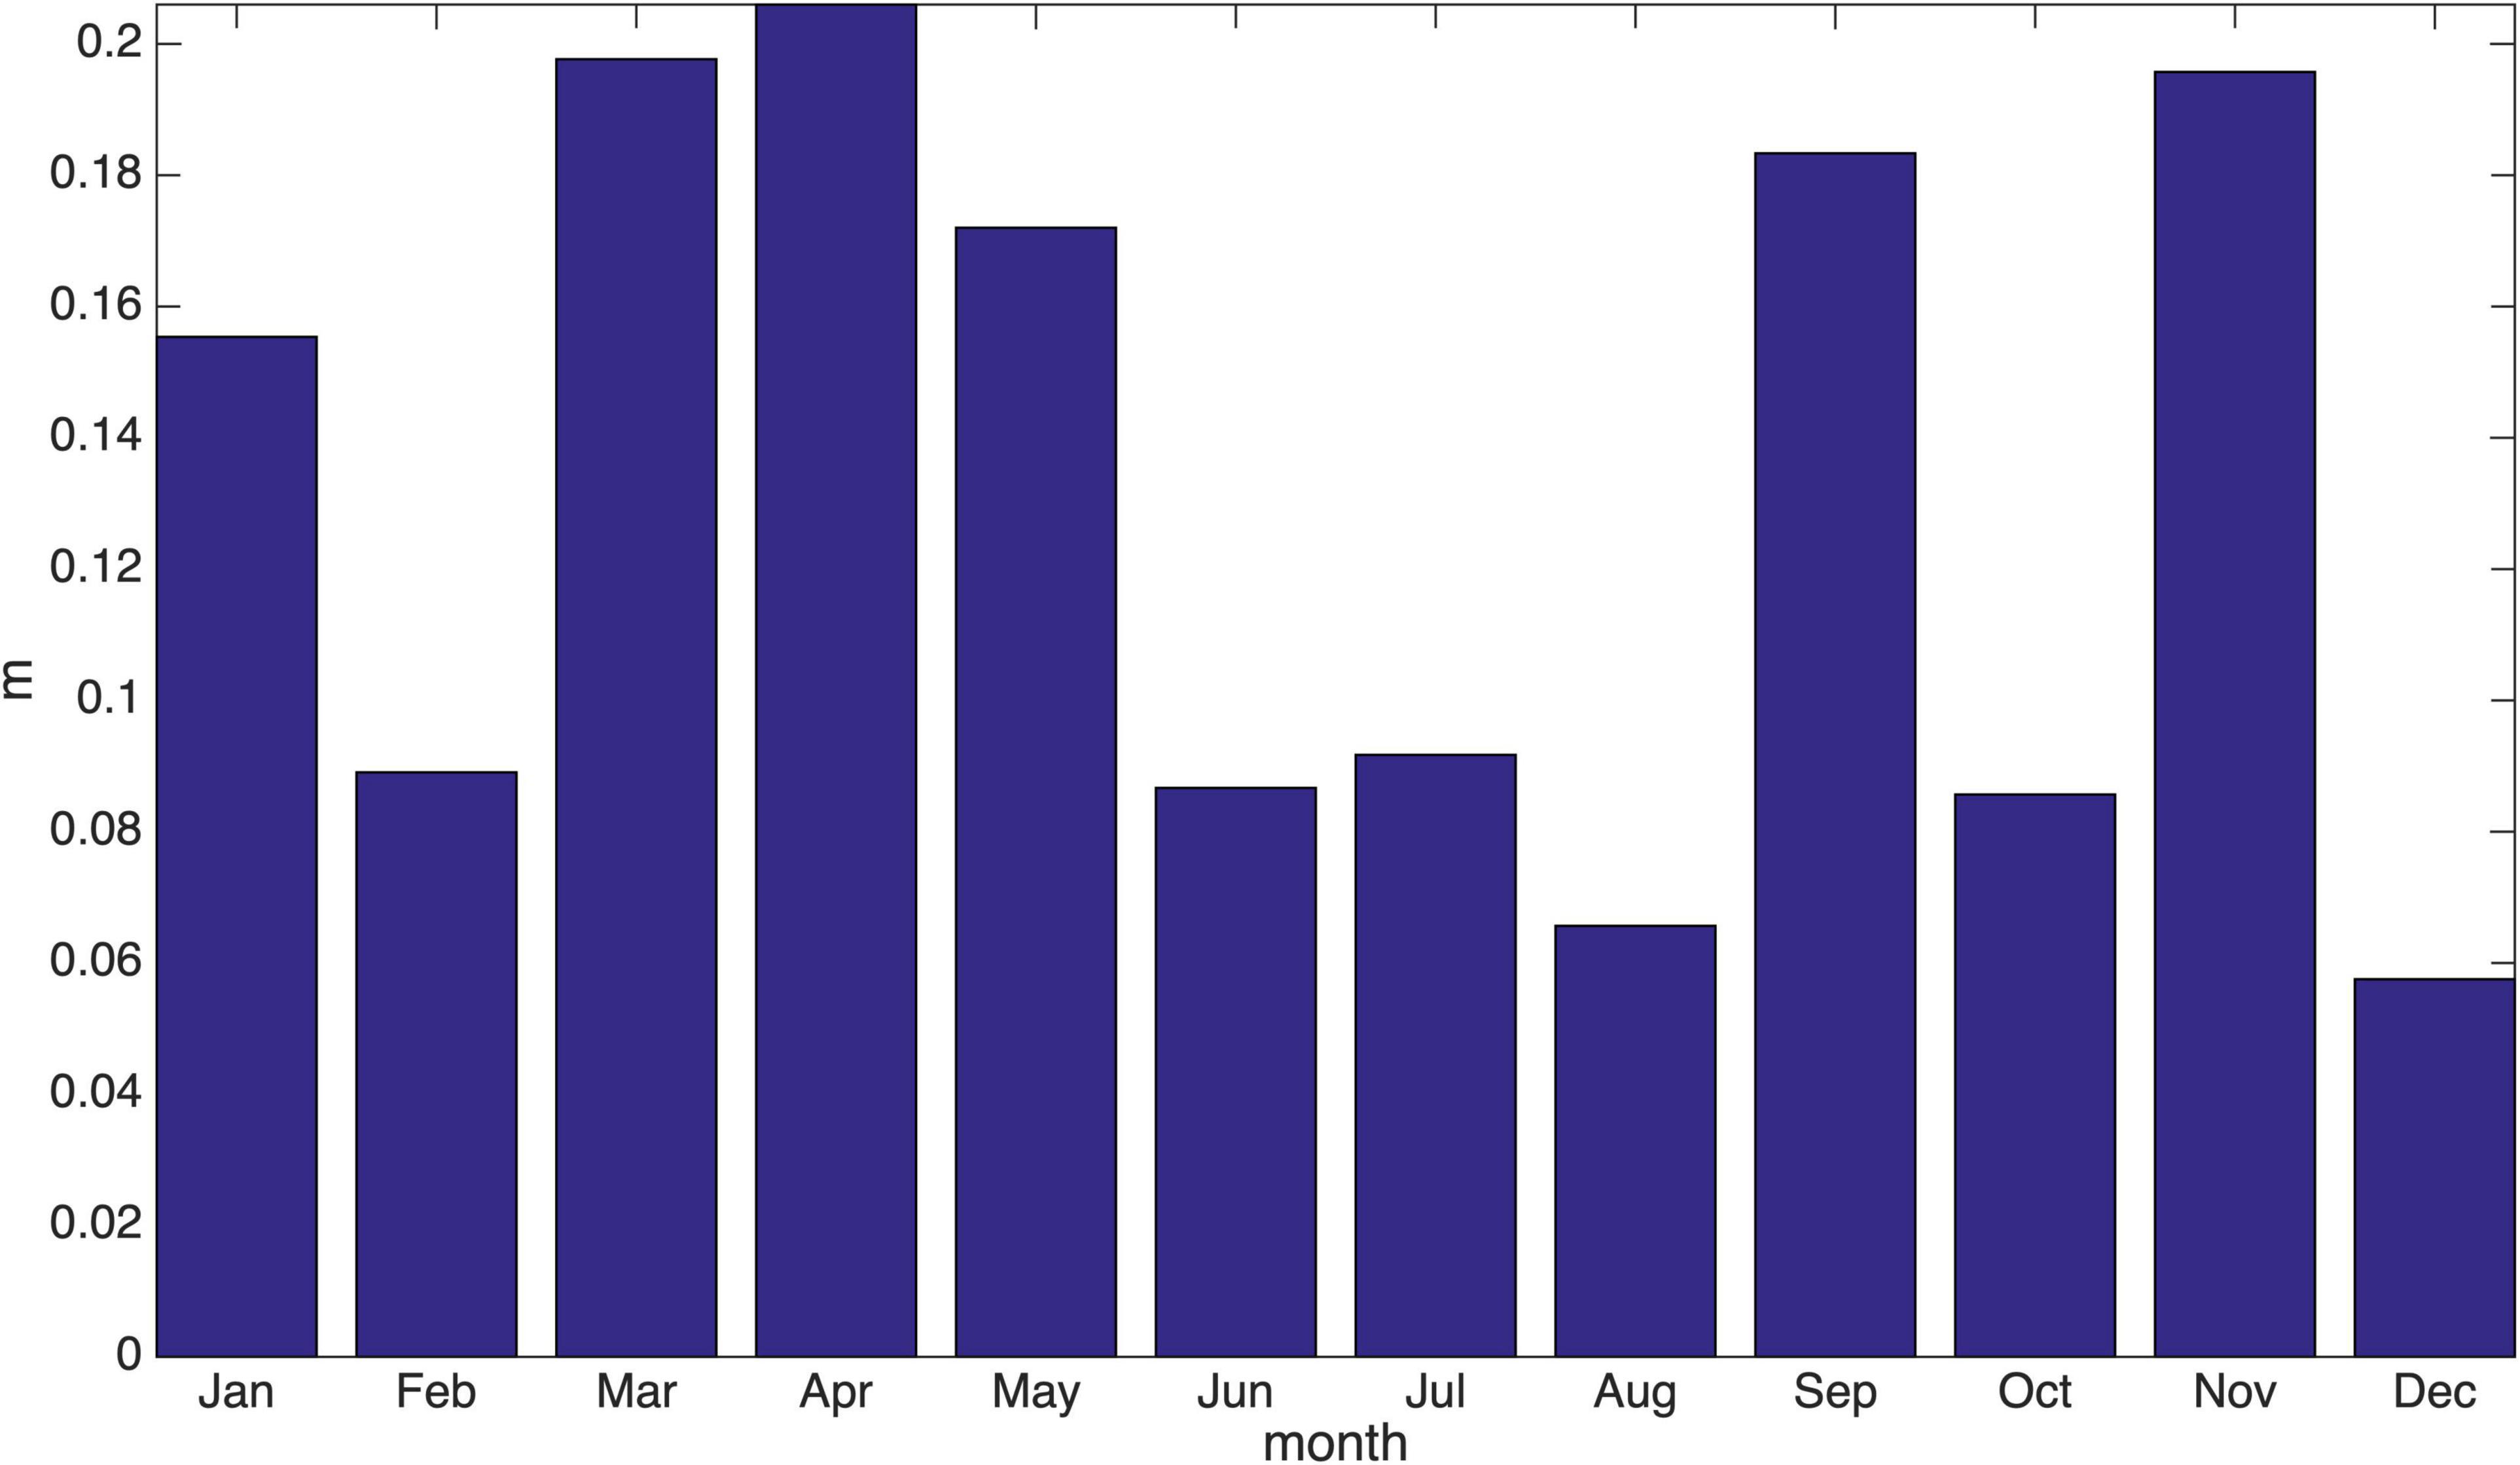
The seasonally average significant wave height at the model grid point corresponding to the river output was calculated to be 0.12 m (Figure 4), without taking under consideration the existence of the wave breaker located at the southern part of the river mouth. Maximum wave height in the area (0.2 m) is presented between Winter and Spring.
Toward predicting a possible displacement of the boom due to the existence of strong currents, the average surface currents speed and direction in the area was calculated (Figure 5). The overall circulation is anticyclonic and the yearly average current speed is estimated at ∼0.035 m/sec. More thoroughly, an initial westerly current during winter becomes northerly during spring and summer and changes during autumn to a southerly current, all of considerably low speeds.
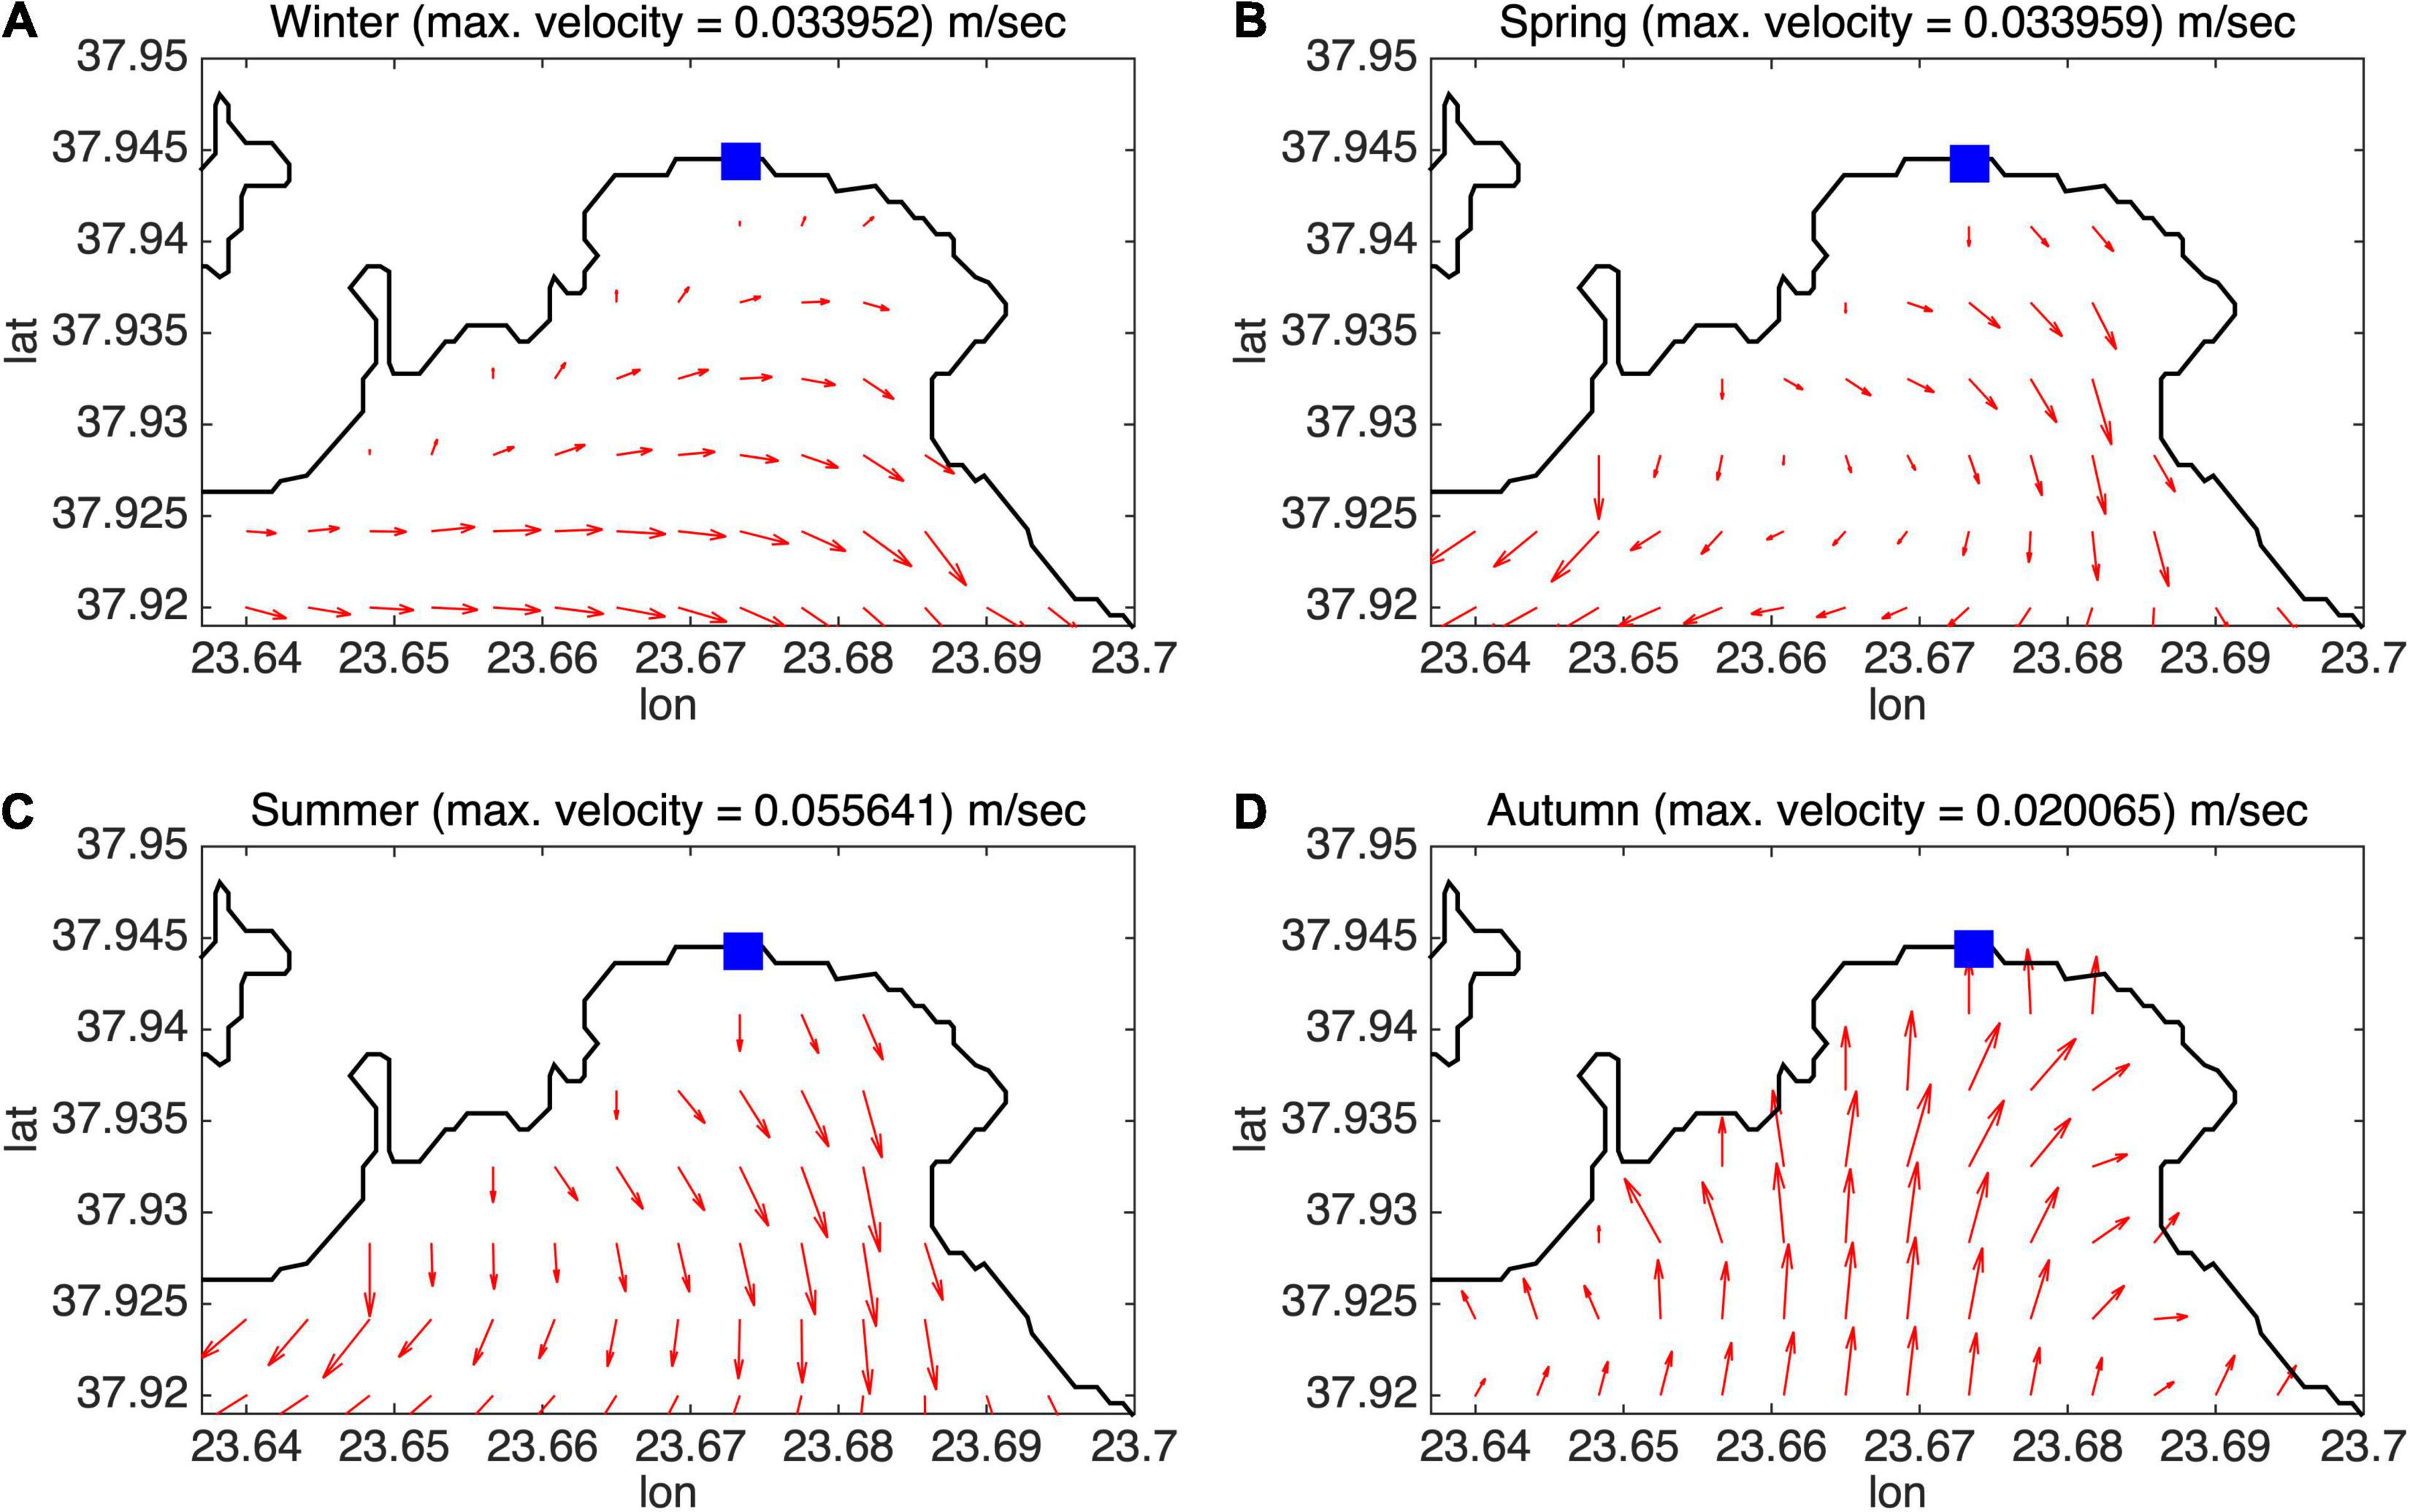
Figure 5. Seasonal [Winter: (A), Spring: (B), Summer: (C), Autumn: (D)] Current Speed and Direction at the Depth of 1 m near the Kifissos River Mouth.
Toward avoiding possible damage or even destruction from large objects being driven into the system, due to flooding phenomena and the resulting increased flow and currents speed during heavy rainfall and storms, the system had to be installed away from the boxed river bank (Figure 6). But issues like navigation hazards, disturbance of rowing teams and other shoreline activities prevented the immersion of the system further from the river mouth and thus it was placed just before the wave breaker construction.
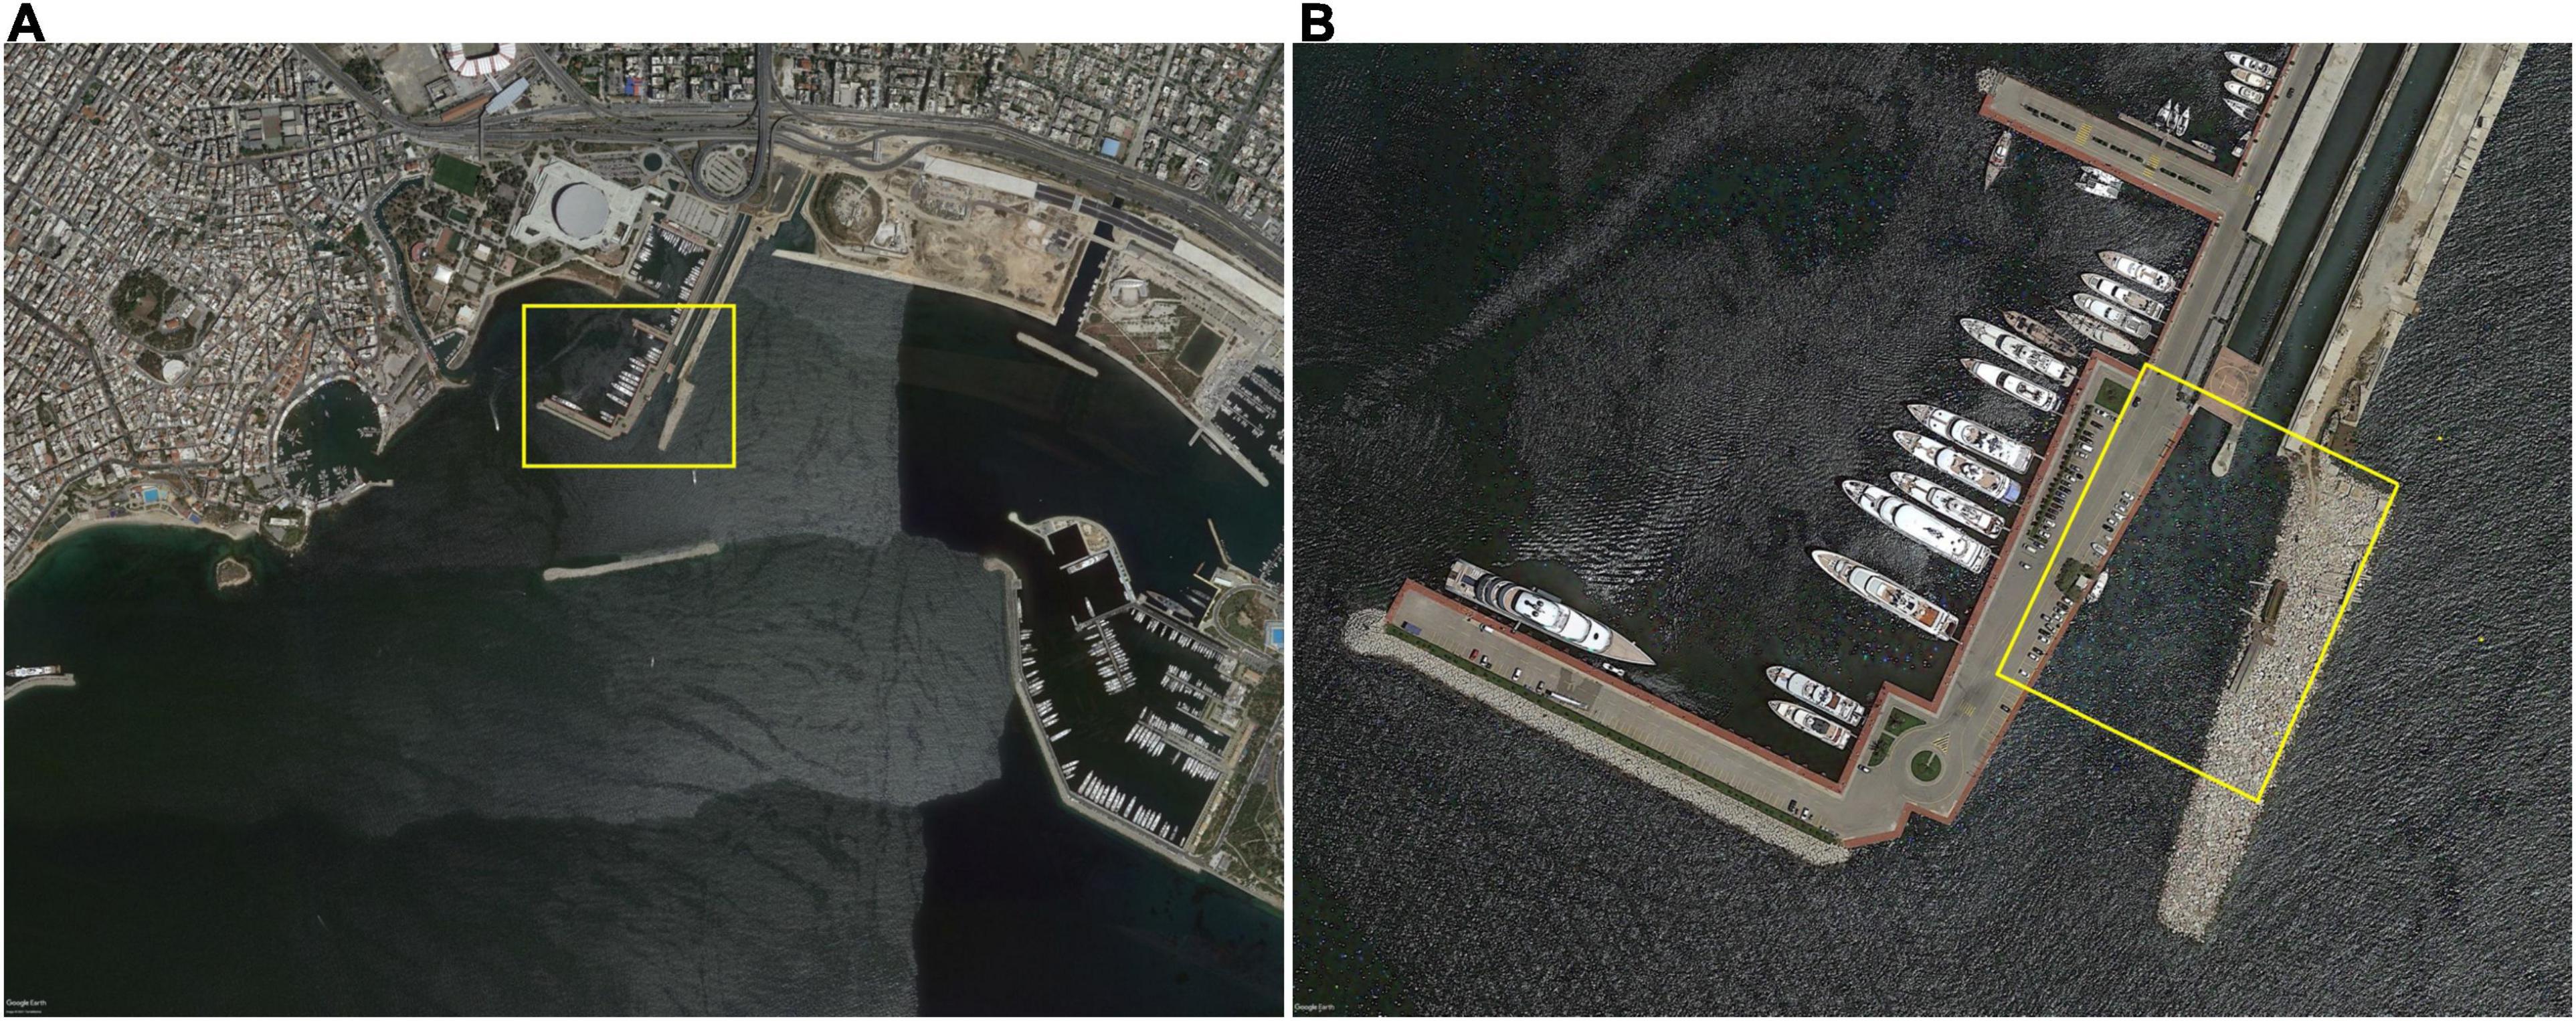
Figure 6. Aerial Snapshots of the Kifissos River Estuary Surrounding Area (A), including the position of the Wave Breaker and the adjacent Marinas and a close up (B) to the River Mouth (Google Earth, 2021).
Development Stages and Technical Standards
The idea behind the design of the CLEAN TRASH system, is to utilize strategically placed, customized floating boom barriers and a debris processing containment with autonomous height regulation, to collect visible floating pieces and monitor the process, before or as they enter the sea. Also the system will be equipped with a continuous visual monitoring system to gather information.
To this end, custom designed river booms were devised to control litter both on the surface and subsurface within the water column, by guiding and collecting the recovered material within the containment cage (Figure 7). The purpose of floating barriers is to direct, contain and process materials and was updated to address the geomorphology and man-made alters of the installation location, the current of the river and the projected amount of litter at the installation location.
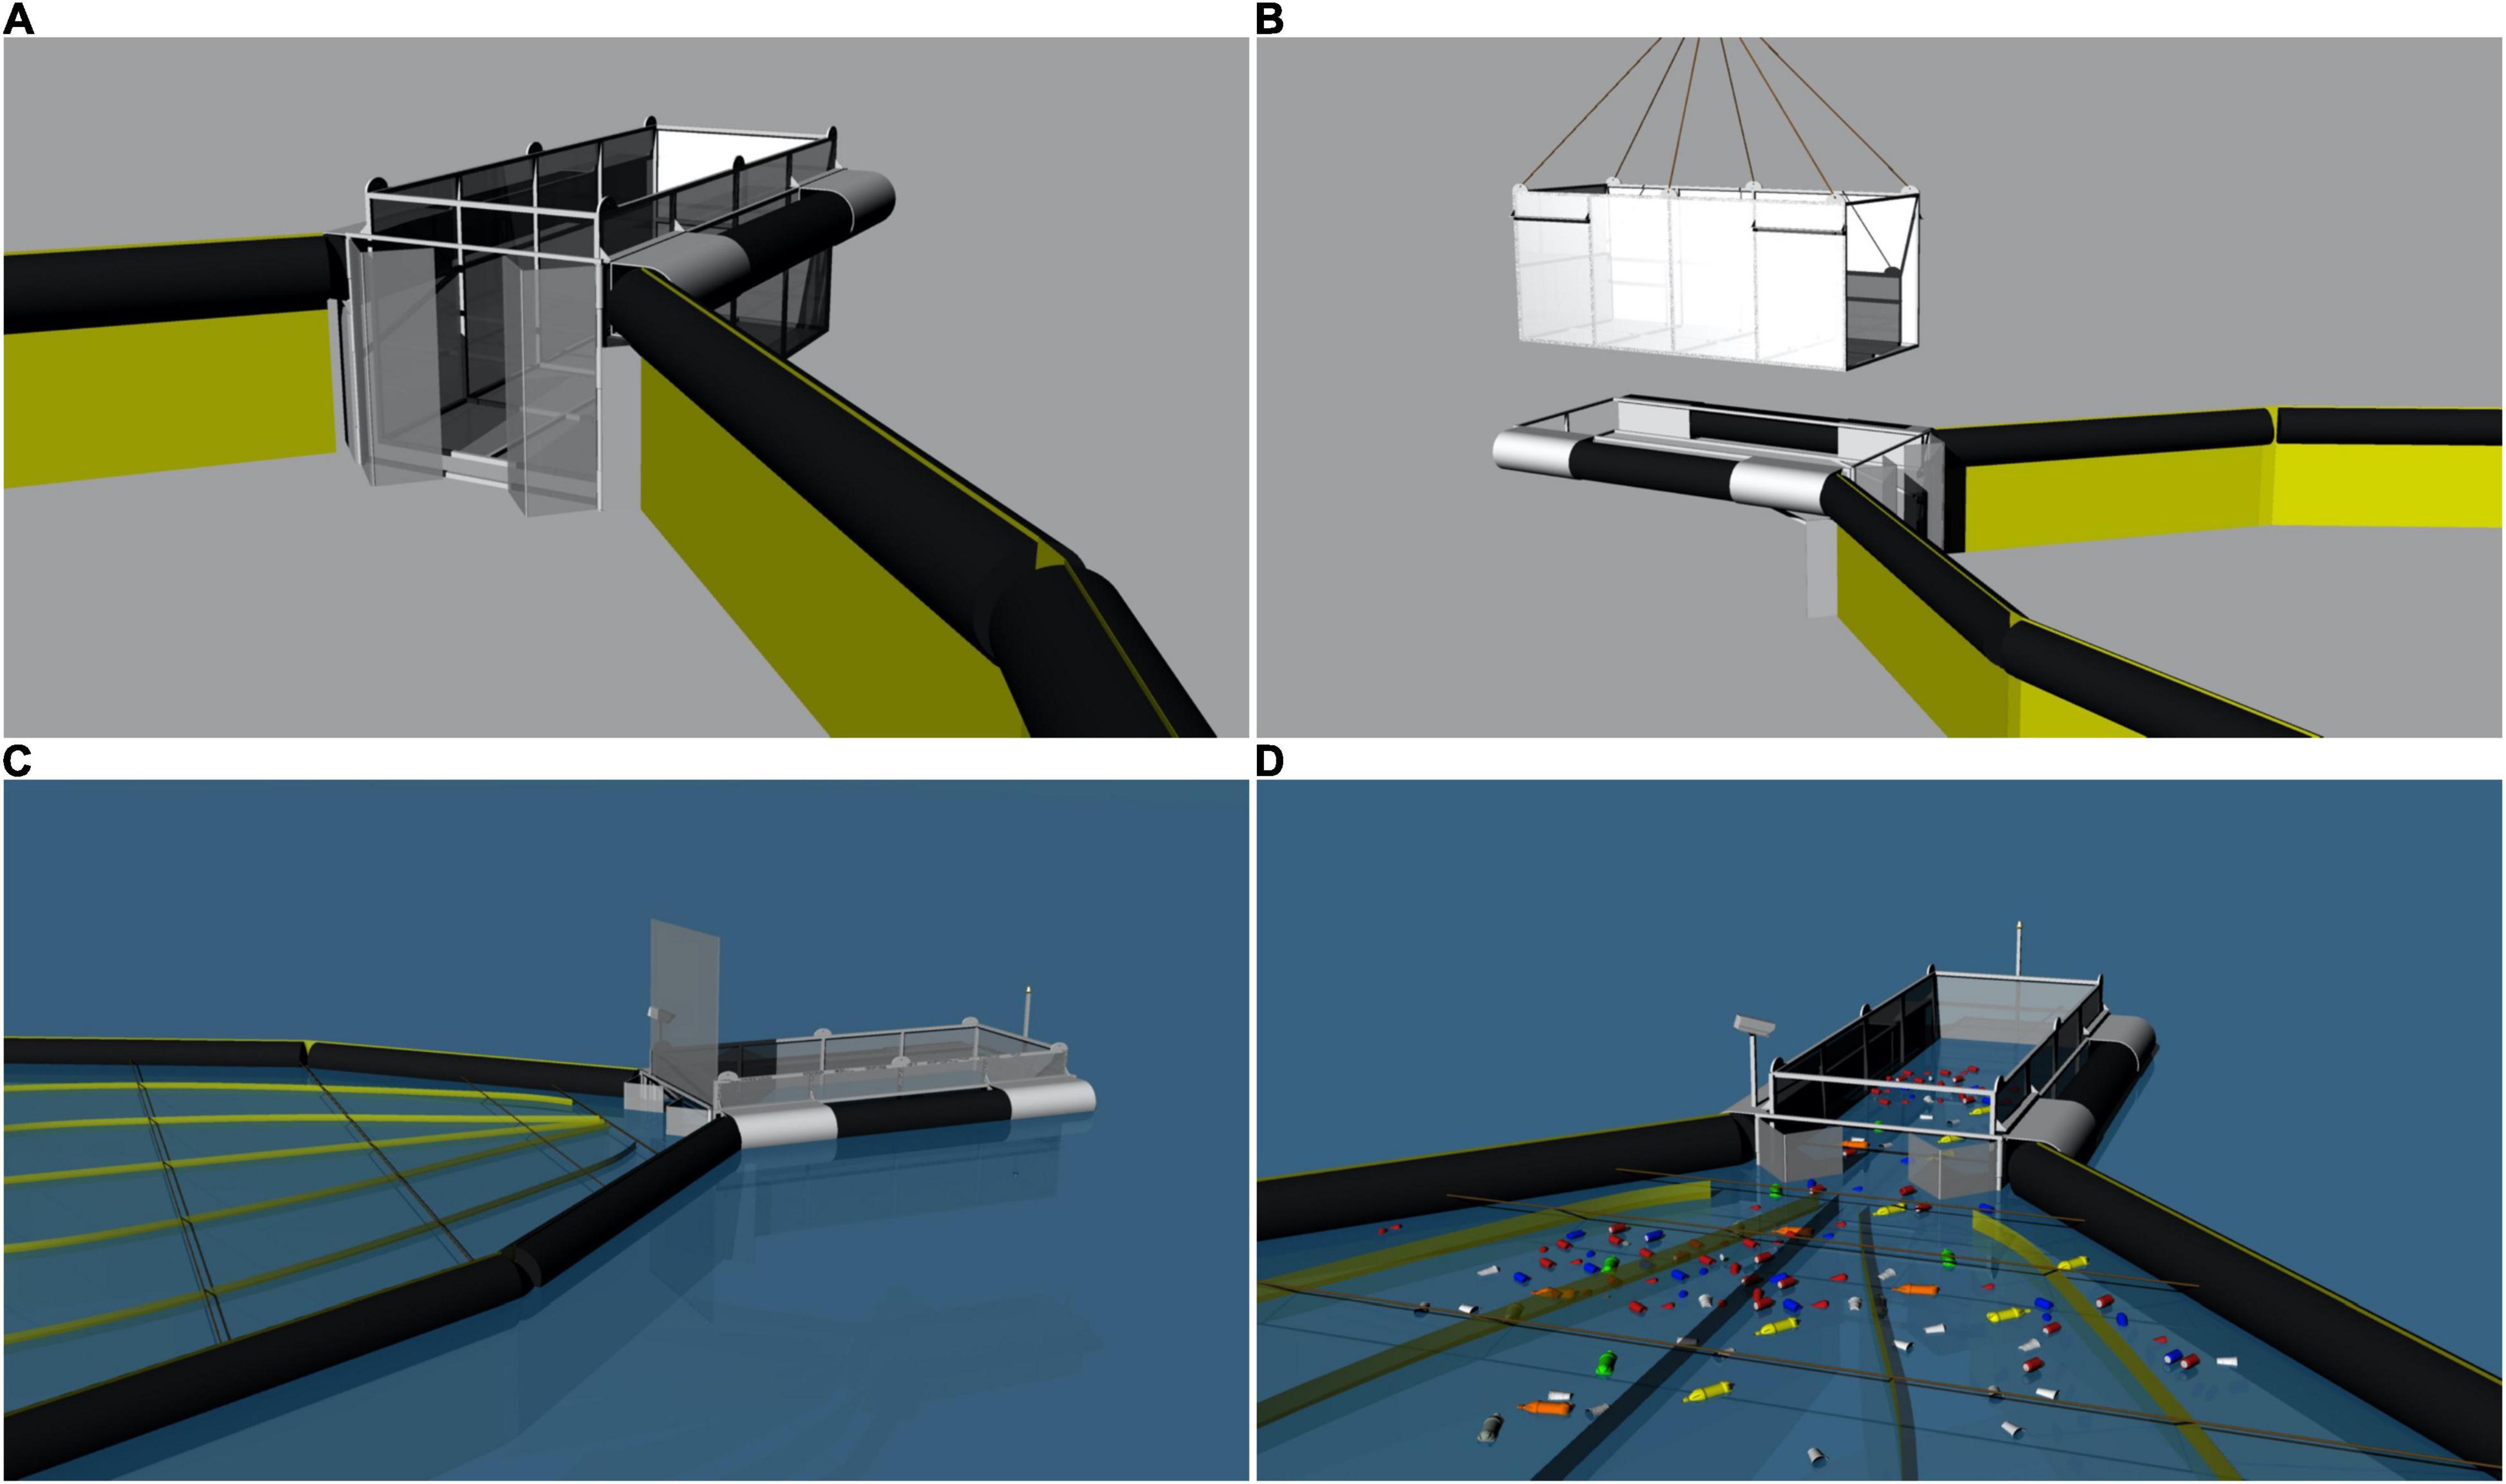
Figure 7. Initial diagram of the System (A), displaying the Cage removal (B) and the positioning of the floating barriers (C) for best litter guidance when adding water flow (D).
A cage design was developed to contain corralled trash as small as 5 mm in size, and also to compress and increase the efficiency/capacity of storage within the containment system. Hence independent floatation systems were designed to allow the system to maintain proper performance in a variety of water flow scenarios, while collecting varying volumes of litter/debris.
Testing: Lab
Initially a 1:2 scale model of the system was constructed for lab scale testing. System checks included high current speed trials (2–4 m/s) in order to check stability and changes in performance. Subsequently, tests were performed on the effectiveness of the scaled prototype (Figure 8). These included the ability of the floating barrier to guide and contain debris, the effectiveness of the collection cage in containing debris and, lastly, the capability of the cage to compress the collected litter.
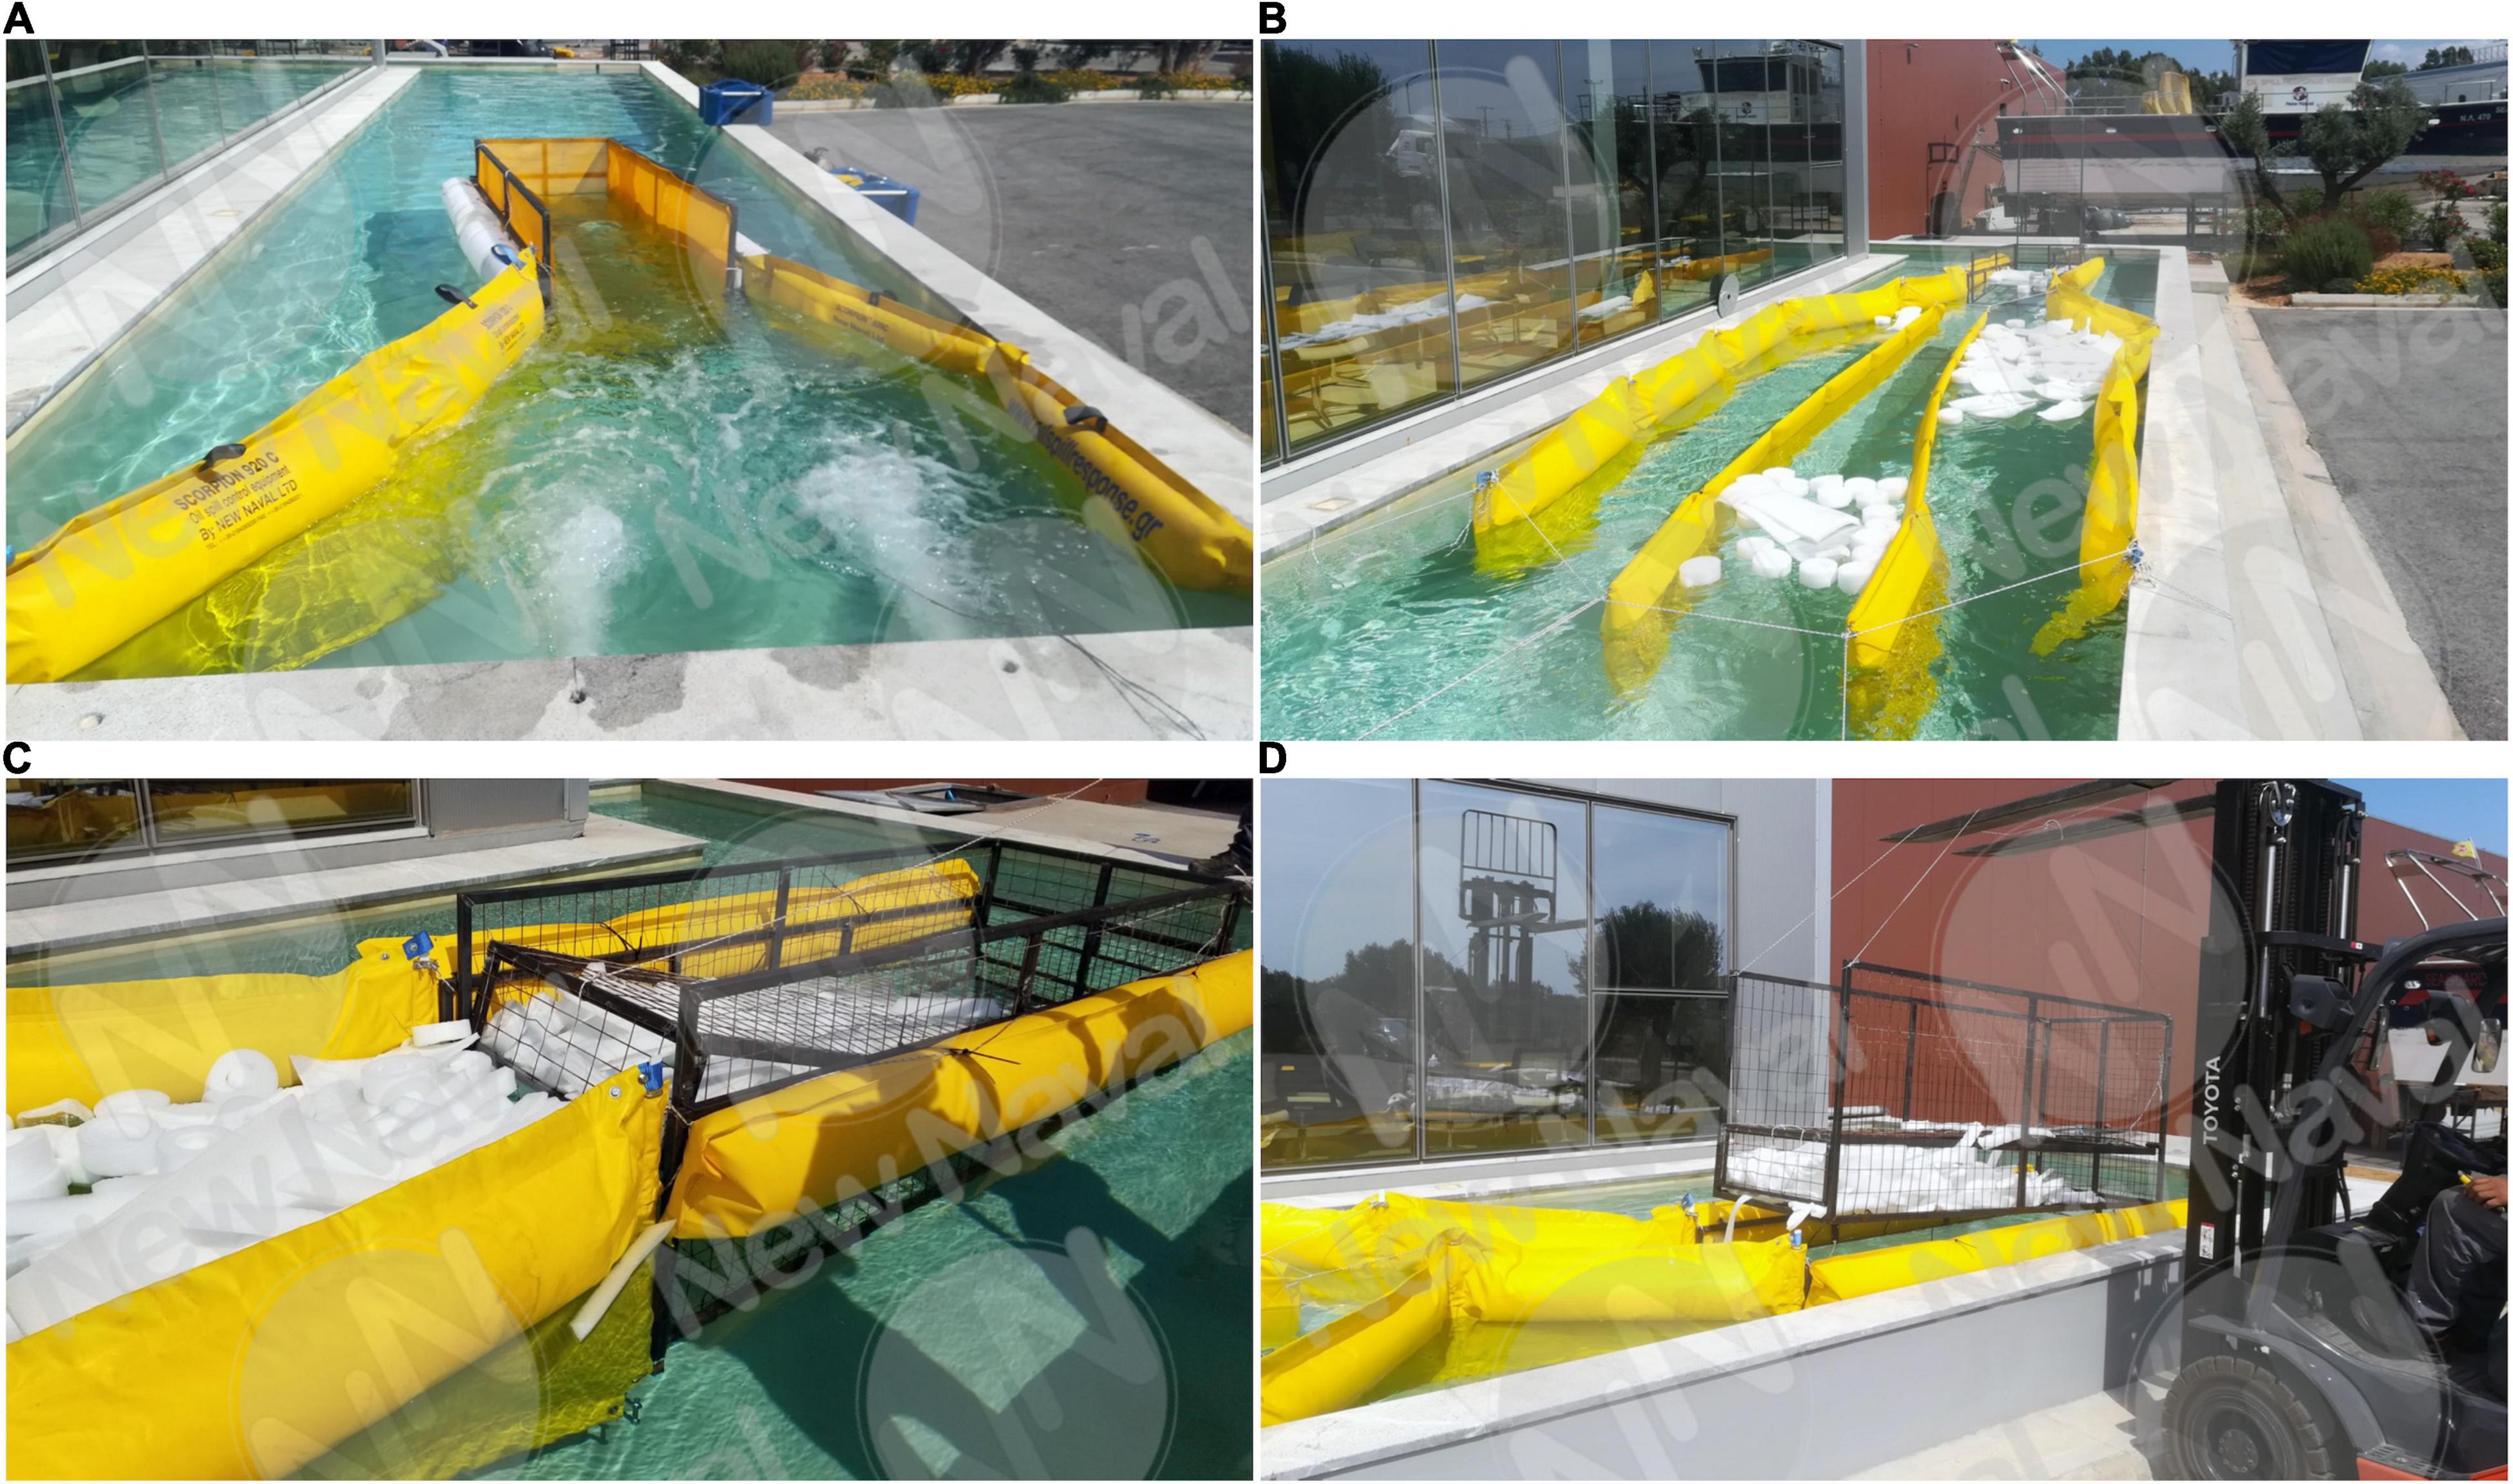
Figure 8. Lab Tests of the 1:2 Scale Prototype with the addition of (A) Water Flow, (B) Floating Barriers and litter, (C,D) removable Cage.
It was found that the floating barrier performed satisfactorily in terms of buoyancy (the ability to stay afloat and to maintain adequate freeboard), roll response (the rotation of the boom from rest due to wave, wind, or current forces) and heave response (the ability of the boom to react to the vertical motion of the water surface). The materials used for testing consisted of polypropylene, foam, ethafoam, styrofoam and wood, all of various shapes and sizes and with a density ranging from 50 kg/m3 for styrofoam and 920 to 960 kg/m3 for the rest of the materials. The collection cage, by gathering more than 90% of the litter thrown in the test tank, during two consecutive 3-h tests, was considered efficient. Moreover, no “splashing” or “submerging” phenomena were observed and the expected operational performance was considered satisfactory. Lastly, the operational necessity for a fast and safe removal of the cage from the base system was satisfied, since this proved to be effortlessly and rapidly done.
Testing: Field
The normal scale prototype for use and installation in the Kifissos river was constructed and tested in open-water, prior to its scheduled installation (Figure 9). Some basic elements of the cage design are its steel construction, a removable door in order to seal the storage compartments which, when full, are lifted above sea level, and the external ballast tanks for adjusting the systems gradient in the water.
An electric system using power from renewable energy (solar panels) was also installed to support various elements such as the marine beacon for navigation safety, the night vision onboard cameras used for the system’s remote monitoring, and lastly, the control of the ballast tanks, which is handled by four 12 volt pumps each connected to a ballast tank, for lifting the cage to the desired height. This procedure brings each empty storage unit to the sea surface level, which has been identified by two position sensors. Lastly, the floating barriers were constructed out of PVC-coated polyester fabric, were designed at a height of 920 mm with a total length of 100 m, and were equipped with marine lights for the necessary system visibility.
On Site Installation
The system was installed at the Kifissos river on the 11th February 2019 and was scheduled to operate continuously until the end of March, so that it would collect and contain the marine litter exiting from the river on a 24/7 basis. Remote monitoring (Figure 10), through a smartphone application, enables (remotely) the raising of each full chamber of the cage until all chambers are raised. Then, after thorough count and categorization, the emptying of the collected debris is scheduled.
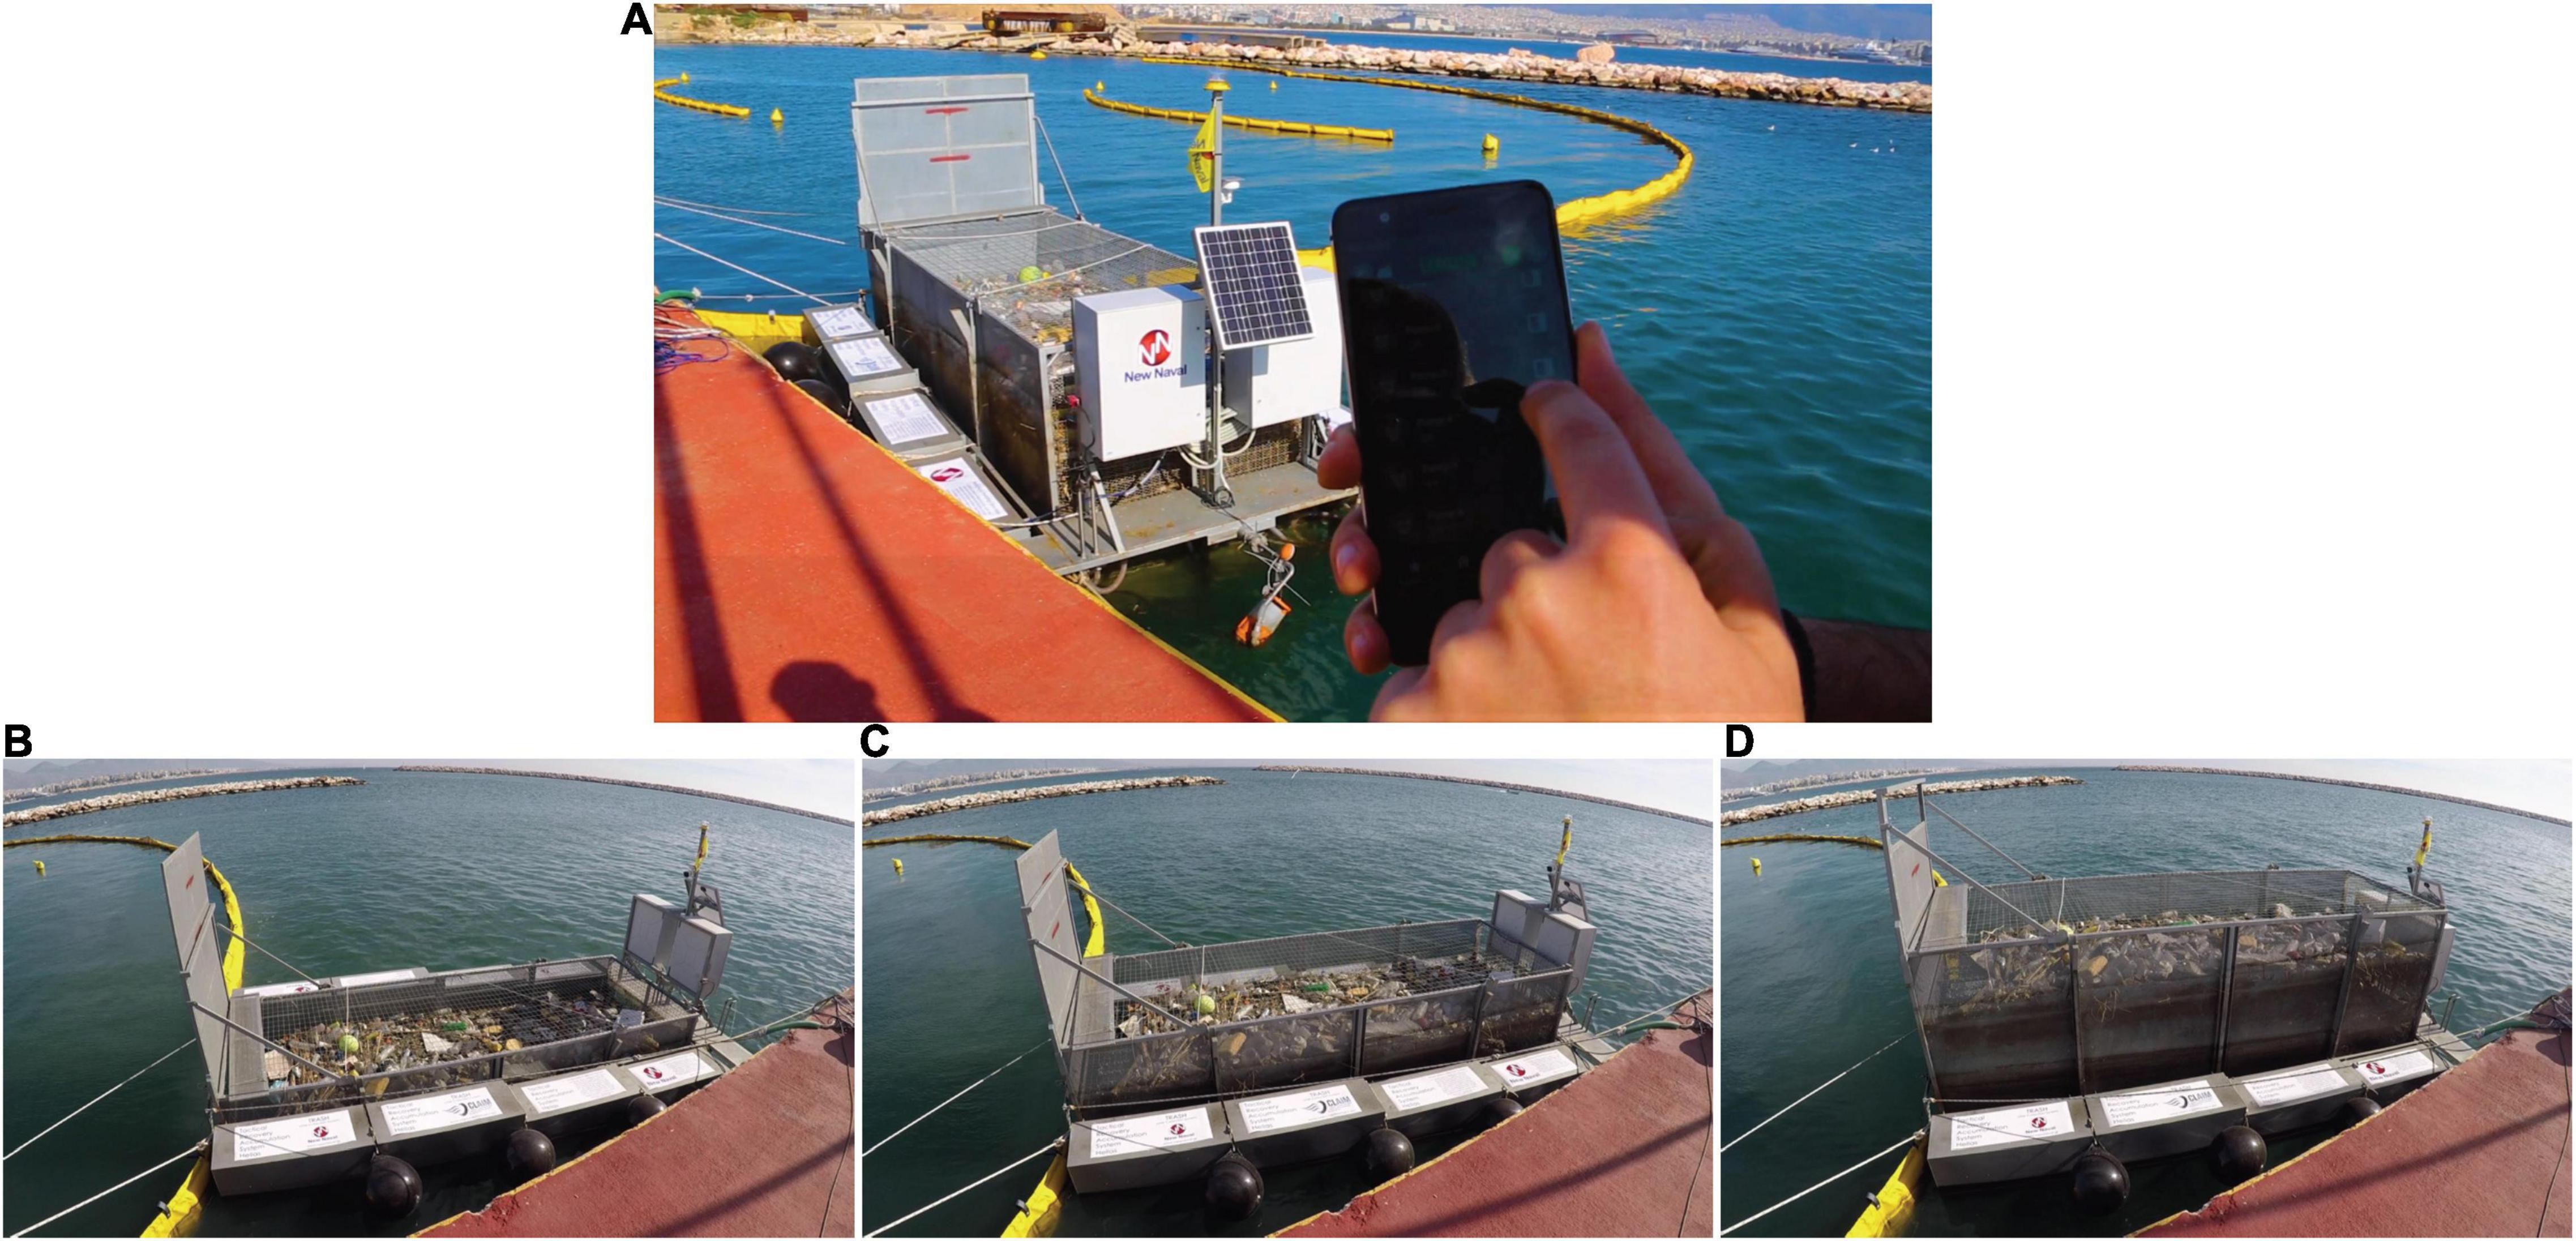
Figure 10. CLEAN TRASH System Test of Remote Monitoring (A) and Switch between System Partitions (B–D), after Installation at the Kifissos River Mouth.
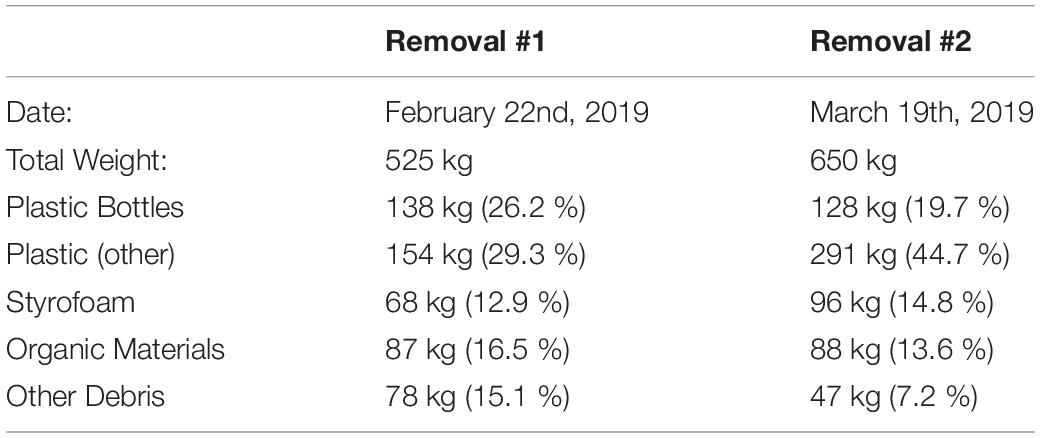
The operational period was shorter than initially scheduled since the system was removed on 19/3/2019. During this period, the internal cage was discharged twice and litter was emptied and categorized by material and size (Table 1). So, in the first discharge that took place on 22/2/2019, a total of 525 kg of litter was collected, filling 27% of the total cage capacity. Debris consisted of organic materials like woods, reeds, and grasses etc. (17%), various debris like aluminum cans, glass bottles, cartboards etc. (15%) and plastics (69%) in the form of bottles, Styrofoam and other plastic objects (Figure 11).
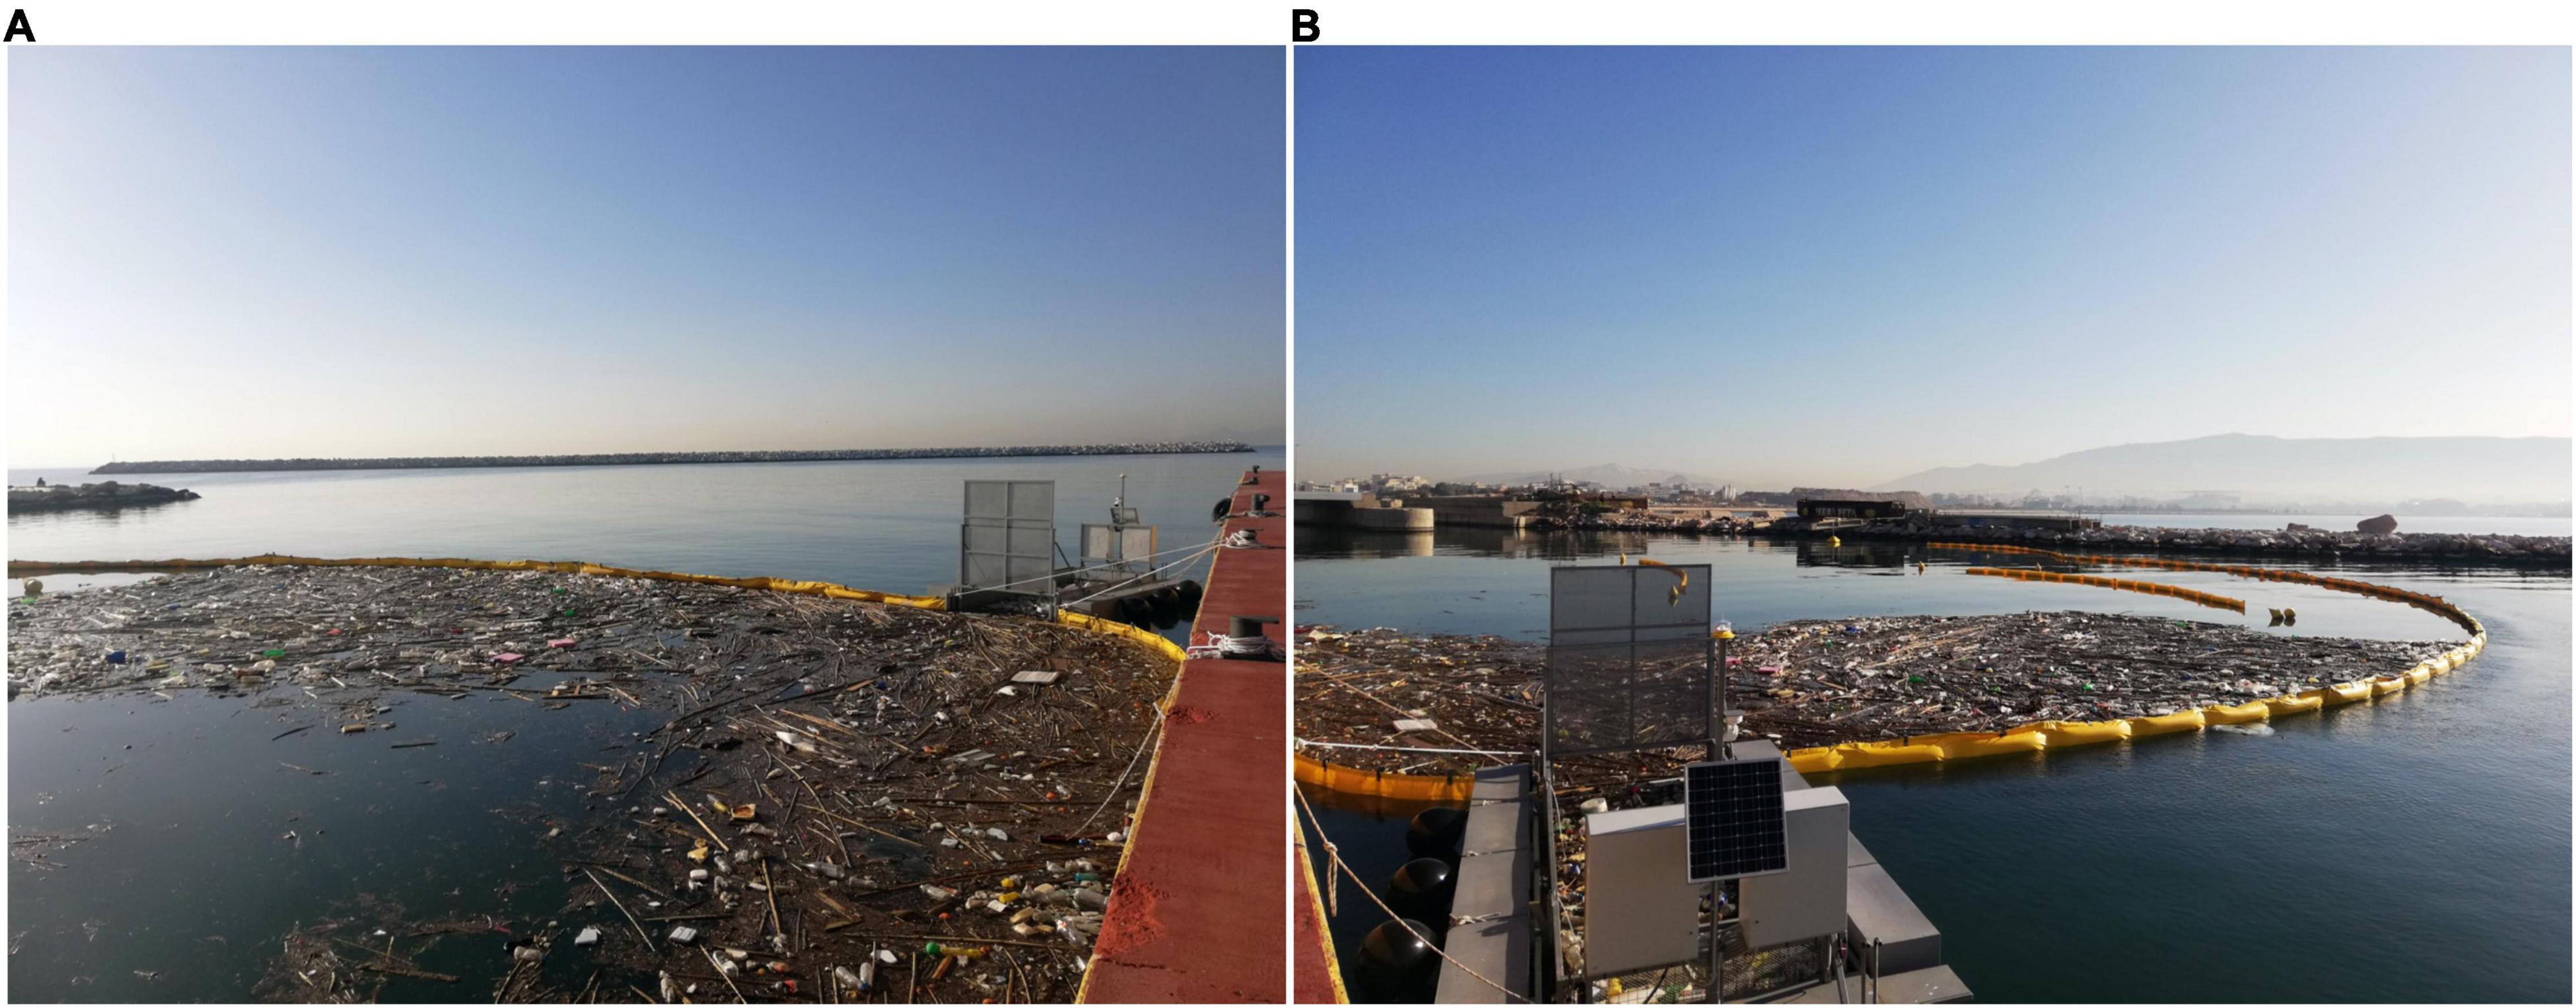
Figure 11. Trash Collected by the CLEAN TRASH System after a Major Flooding Event, as opposed to the Clean Sea Area (A) and the Clean River Estuary (B) in the Background.
The second cage removal took place on 19/3/2019 and yielded a total 650 kg of debris, filling 80% of the cage. The litter composition was comparable with that from the first cage emptying and, this time, plastic objects corresponded to 79% of the total debris weight. Organic material and other various objects constituted 14 and 7%, respectively of the total litter weight.
Over a period of 37 days, the CLEAN TRASH system managed to collect a total of 1,175 kg of debris, of which 75% (875 kg) was macroplastics. Daily visual observations of the system did not reveal any litter escapes from the boom to the sea. Although it is hard to know what percentage of the litter, eventually escaped the system and ended up at sea, reports from the officers of the neighboring marina pointed out that, during the installation period, the surrounding waters were significantly less polluted. Therefore, in practice, the operation of the system can be marked as successful.
Prefiltering System
Marine pollution by MPs (plastic particles with a diameter smaller than 5 mm) has been recognized as an emerging issue. Wastewater treatment plants (WWTPs) have been identified as important sources of the release of plastics into aquatic environments which may lead to further contamination. Although WWTPs treat and remove the arriving solid waste, they are not designed to also remove MPs (Gies et al., 2018).
To this end, a photocatalytic nanocoating device has been developed, aiming at mineralizing MPs. Mineralization time is proportional to the size of the litter. Therefore, in order to enhance the efficiency of the photocatalytic device, bigger particles must be blocked since they would require more time to be dissolved. For this, a low cost, automated and self-cleaning filtering system for MP litter was designed for installation before the photocatalytic nanocoating device, in order to supply it with accumulated liquid litter of appropriate size.
Methodology Used for Microplastics Removal in Waste Water Treatment Plants
A wide variety of technologies have been tested for the removal of MPs removal at WWTPs. During the treatment at Finnish WWTPs (Talvitie et al., 2017b), 99.9% reduction was achieved with the use of membrane bioreactors, 97% with rapid sand filters, 95% through dissolved air flotation and 40 to 98% with the use of disk filters. On the downside, membrane bioreactors are expensive and require high operation/maintenance technology. Thus, for the needs of the project, sand filters were selected due to their high efficiency. These are commonly used for BOD5, COD, TSS, NO3 and PO4 removal in WWTP as tertiary treatment (Eltawab et al., 2019) with very satisfactory results.
Lab Scale Prototype: Material and Design
The prototype was fully automated and consisted of a sand filter made of PVC and two cartridge filters, one installed at the inlet of the pre-filtering device to prevent large particles from entering the filter, and the second at the outlet having a sieve with a certified diameter of 30 μm. A PVC pipe of Φ160 was used to fabricate the filter vessel (Figure 12). For sand retention in the filter, a nozzle with 1 inch diameter, 20 cm height and intervals of 0.2 mm was fabricated (Figure 12) using 3D printing. The sand used as a filter media had a particle size of 0.4–0.6 mm to ensure the theoretical filtration capacity at the 30 microns.
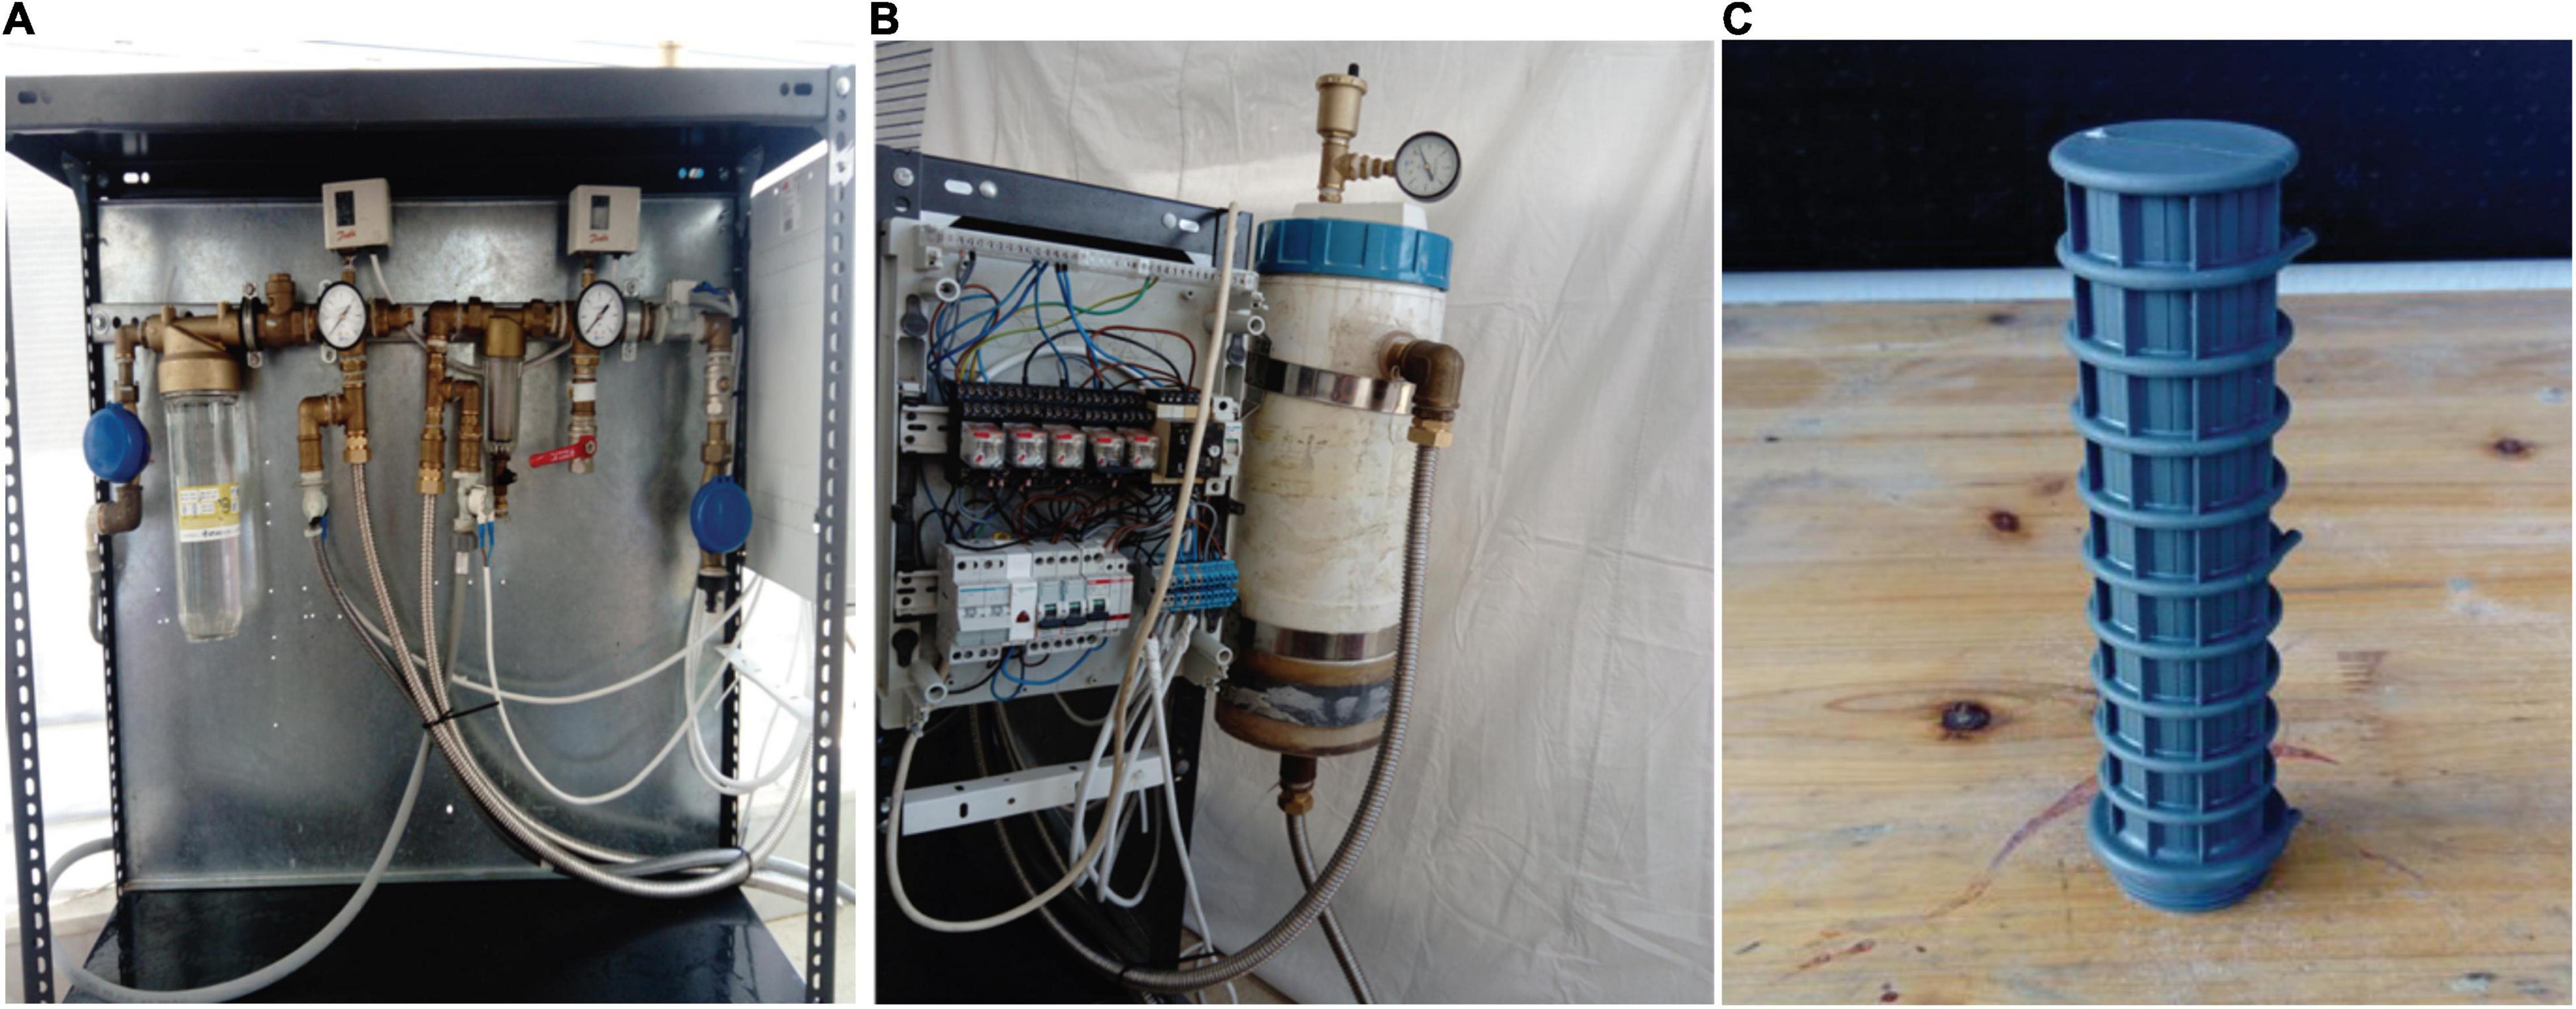
Figure 12. The lab scale prototype (A) and the PVC filter vessel (B) and a 3D nozzle fabricated for sand particles retention (C).
The height of about 20 cm provided adequate “separation surfaces” between the sand and the nozzle. The separation surfaces are needed for the normal operation as well as for the backwashing operations. The filter vessel was designed in such a way as to leave a 7 cm filler of sand on the sides and 15 cm from the top as the influent enters to the filter from the top.
The maximum effluent requirements for the cleaning filtration device were assumed to be 0.5 m3/day or about 20 L/h. After various lab tests, the fabrication of a cylindrical filter with a Φ160 PVC tube and a total height of 40 cm was made. This filter vessel gave enough space so that the filling material could rise up during the backwash and no material would escape to the rinsing outlet. The lab scale prototype was designed to filter 50 L/hr of liquid litter as opposed to the 20 L/hr that the photocatalytic nanocoating device requires (Figure 13). The pilot scale prototype received minor modifications in order to be able to work under higher pressure, which mainly included changes in materials and dimensions.
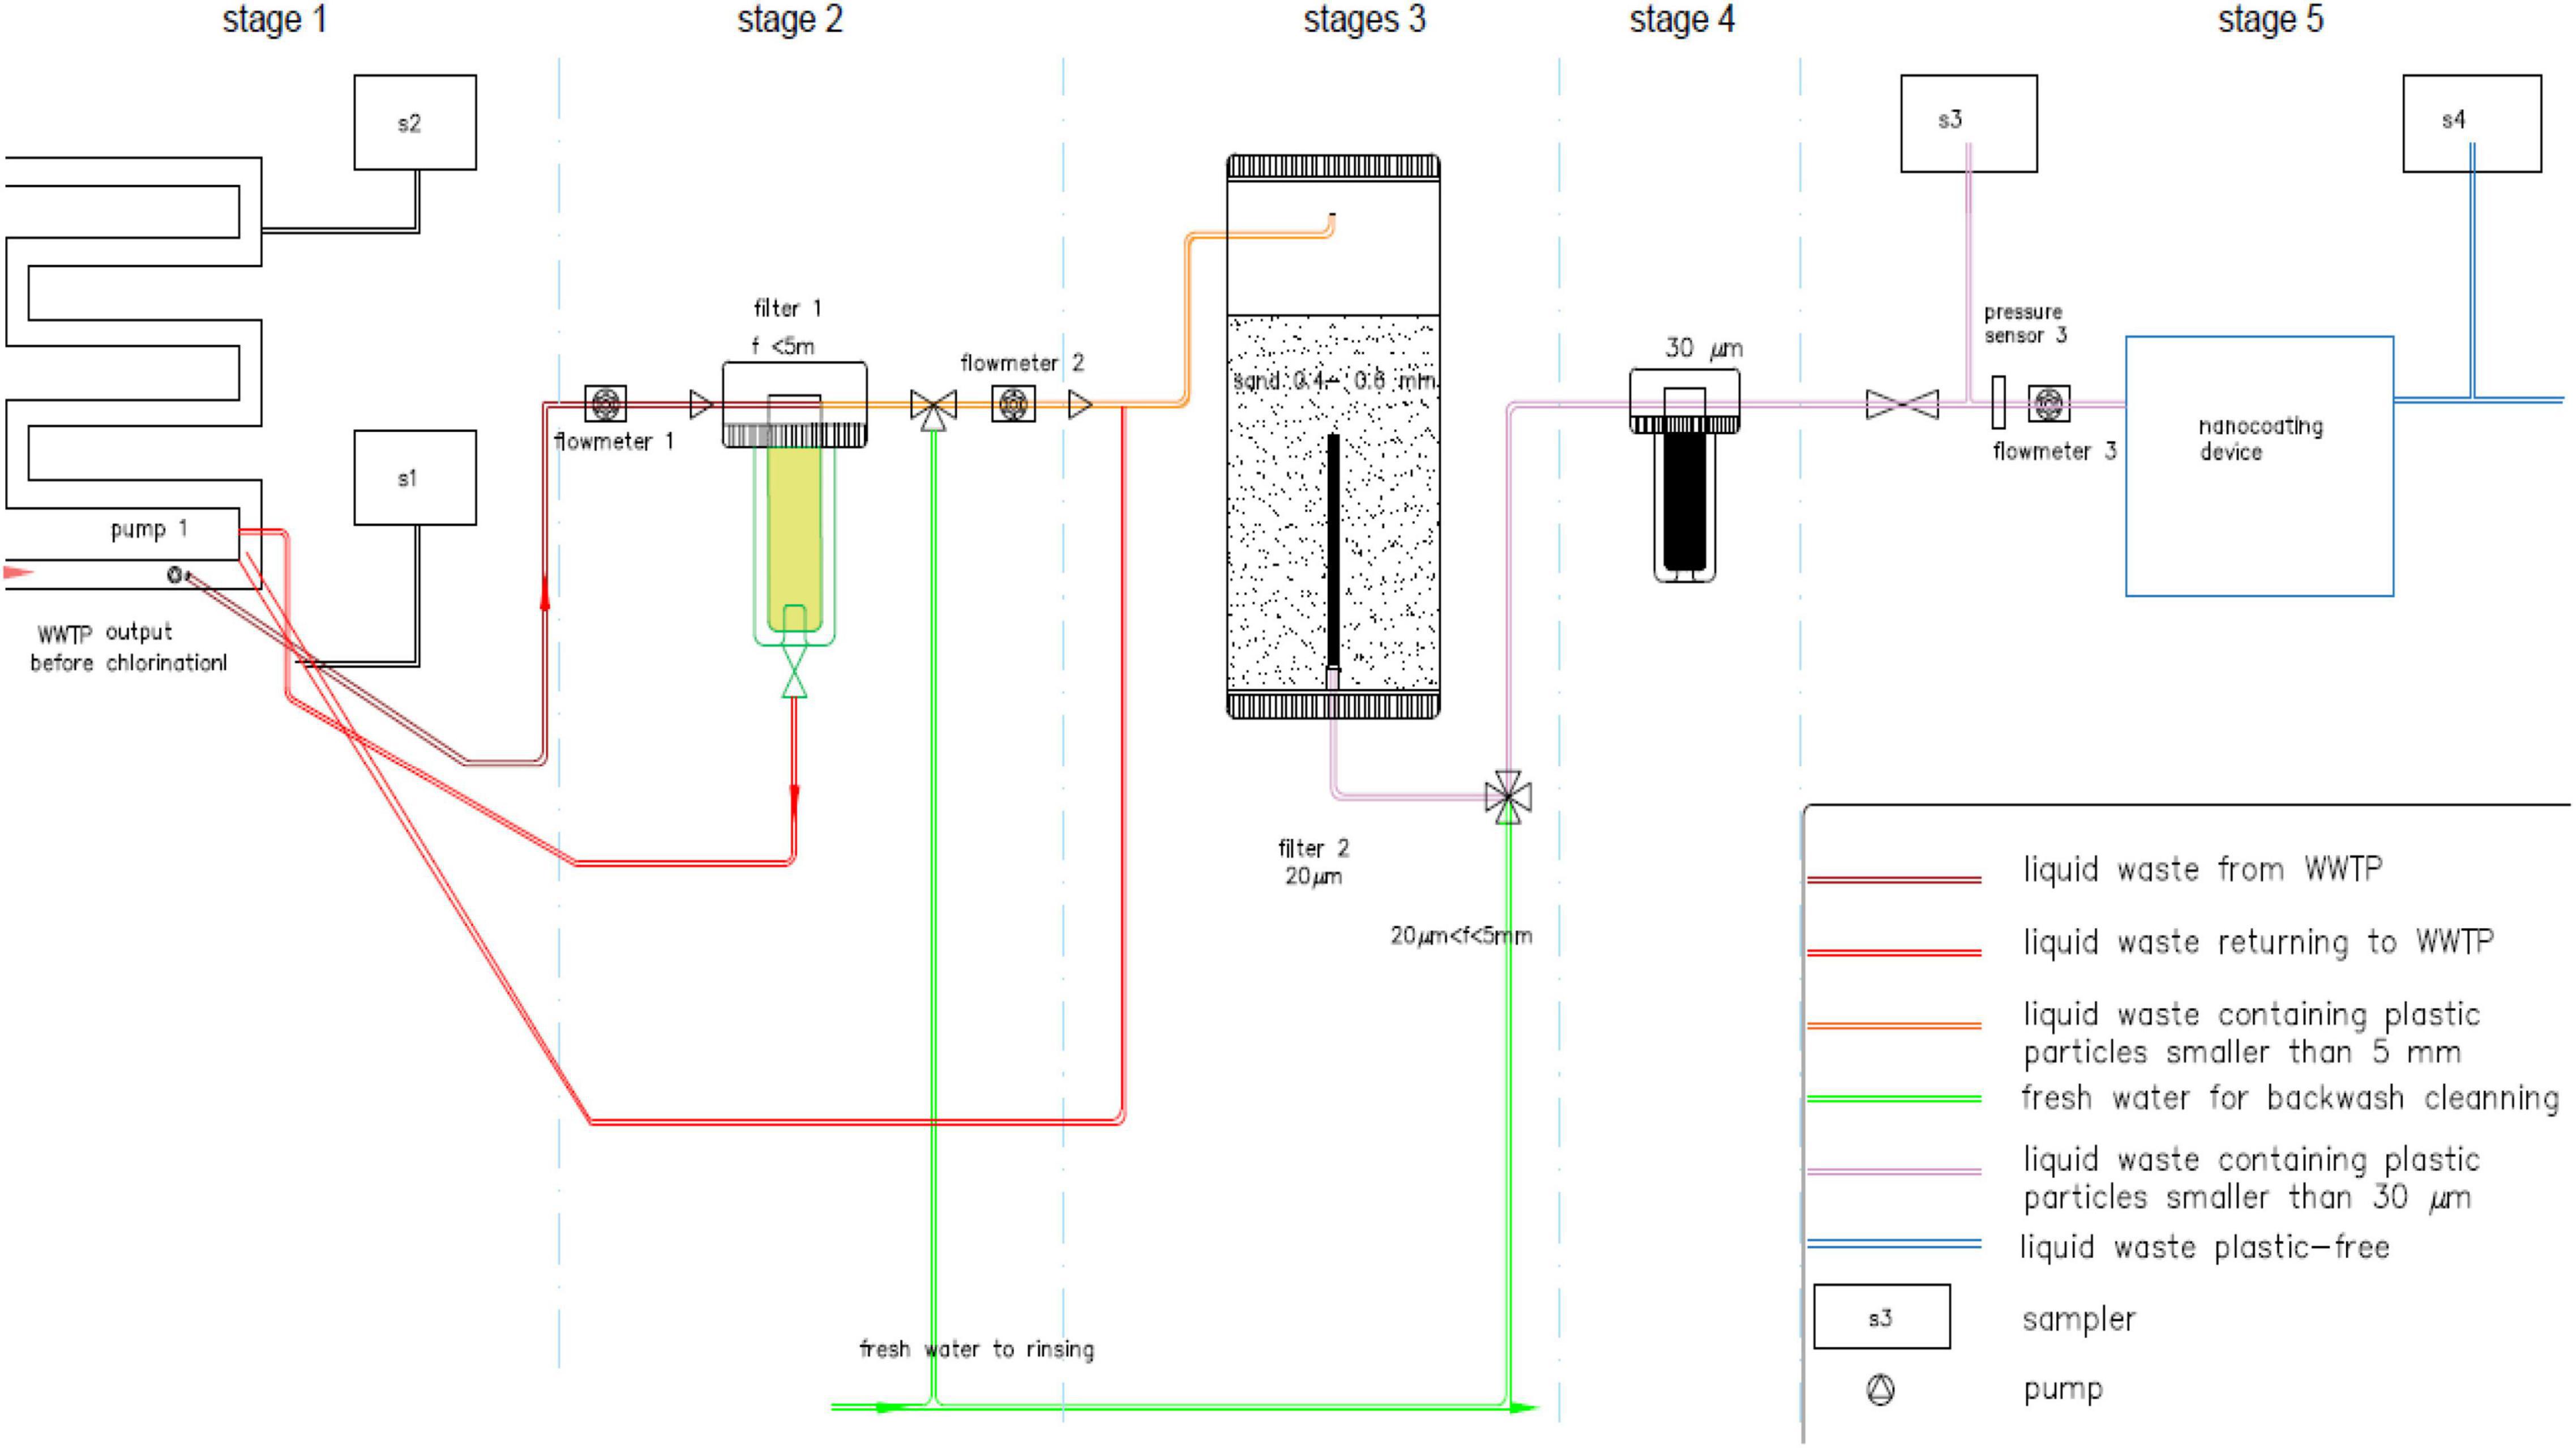
Figure 13. The lab scale prototype process diagram of the cleaning automated filtering device (pre-filtering system).
Lab Scale Efficiency Test
Polystyrene foam pieces were ground into powder using a sanding machine. Their size was tested and certified by HCMR. From 109 g of ground MPs, only 30 g were at the scale of 50 μm particles and were used for the experiment. Foam pieces were first ground and passed through a sieve before adding water. Polyelectrolyte was used for water surface tension reduction, allowing the mixing of the MPs powder. Subsequently, the solution was passed through the sand filter. For this experiment, 4 L of water was used and 30 gr of MPs powder was added in the water solution.
After the filtration, the MPs were retained on a paper filter and left to oven dry for 3 days. Then the mass of MPs was calculated by subtracting the mass of the filter paper from the total mass (filter paper and MPs). Lab analysis showed that 1.3 g were retained on the filter paper. The remaining 28.7 g were captured inside the sand filter media. The prefiltering system efficiency was estimated at 95.67% for MPs at the scale of 50 μm and was calculated by the mathematical type:
Lab Scale Field Test
HCMR and Waste et Water SARL (responsible for the implementation of filtering devices in the WWTPs) performed a first sampling of MPs at Megara WWTP in Attica, Greece (Figure 1) in December 2018 aiming to identify the MP types in this particular WWTP and estimate the quantities that end up in the sea along with the wastewater treatment plant effluent. The WWTP at Megara was designed for 41.000 p.e. (2,500 m3/day) and currently the load is 1,870 m3/day. The wastewater is treated both mechanically and biologically and the effluent water is discharged into the sea (Saronikos Gulf, Greece) after it is disinfected in a meander.
Three cartridge filters were used in line with a filtration range of 1,500, 70, and 30 μm. The filter arrangement consisted of two parallel storm drains (70 μm + 30 μm in line) with a common wastewater supply, pre-filtered by the filter of 1,500 μm. The 70 and 30 μm cartridge filters were constructed from stainless steel and are certified for the nominal permissible cross section of the solids. A total of 5,300 L of waste has passed through the sampling system. From the first storm drain, 4,000 L of wastewater treatment plant effluent has been filtered and their cartridges (70 and 30 μm), were sent for analysis.
The first sampling proved that the 70 and 30 μm cartridge filters can easily filter 4,000 L of effluent in 3 h (flow capacity 1.33 m3/hr), without a rise in pressure. Pressure and flow capacity measurements (flow meter and manometers) showed that, with a pressure rise above 0.2 bar, the flow capacity doesn’t drop more than 30%. From the second storm drain, 1,300 L of effluent were filtered. Analysis of the retained solids, from the 70 and 30 μm cartridges and from the common first filter of 1,500 μm revealed 80 particles in the filter of 70 μm. The black particle fragment was found to be 68.75%, the red particle was 8.75%, the blue particle was 15%, and the transparent and green were 3.75%, respectively. The separation of the MPs based on their color does not aim at their characterization, instead it is used solely for categorization purposes.
The cartridges were carried to the lab in their original holders. The effluent retained in the original filter holder, as well as any material recovered from the sieves were vacuum filtered GF/C filters (pore size 1.2 μm) under a glove bag. Then the filters were put in Petri dishes covered with aluminum foil and dried at 60°C for 24 h. Examination for MPs was conducted under a stereomicroscope (Olympus, SZE and SZX7) together with a digital camera (Luminera) and the INFINITY ANALYZE software (Lumenera, 2021). During the whole process of the analysis, five procedural blank filters were left open in Petri dishes in order to check for airborne contamination. The number and type of particles (fragments and filaments) identified are presented in Table 2. The color of the filaments is also shown as it gives a hint relatively to the filaments found in the blank samples.
Numerical Models
The application of the CLEAN TRASH and the Prefiltering systems in the rivers and WWTPs around the metropolitan city of Athens, was studied with the use of a numerical model, consisting of a three dimensional hydrodynamic model, online coupled to a Lagrangian Individual Based Model (IBM) that describes the pathways and fate of both micro- and macroplastics from major land-based sources (rivers, coastal cities) (Tsiaras et al., 2021). The coupled model has been implemented on the Mediterranean basin-scale (∼5 Km horizontal resolution) (see Tsiaras et al., 2021) and for the purpose of the present study it was downscaled with a finer resolution (∼400 m) in Saronikos Gulf.
The hydrodynamic model is based on the Princeton Ocean Model (POM; Blumberg and Mellor, 1983), a primitive equation, free-surface, sigma coordinate 3-D circulation model. In the current application, fields of ocean currents and the horizontal and vertical mixing coefficients that POM provides, are used for the plastics movement.
The Lagrangian IBM plastic dispersion model is built upon a previous work on the prediction of floating pollutants (Pollani et al., 2001) and takes into account most of the important processes (advection from currents, stokes drift, vertical and horizontal mixing, biofouling/sinking, wind drag, beaching). Different types and size classes of macro- (5–20 mm, 20–200 mm, > 200 mm bottle/bag/foam) and MPs (50, 200, 350, 500, 1,000, 2,000 μm) are considered in the model. Biofouling induced sinking is explicitly described, as a possible mechanism of MPs removal from the surface, due to the buoyancy loss resulting from the attachment of heavier biofilm. The wind drag that is practically effective only for macroplastics > 20 cm (bottles, foam) is assumed to depend on the particle surface above water, following Yoon et al. (2010). Random movement in the horizontal depends on the horizontal diffusion obtained from the hydrodynamic model, while random movement in the vertical is assumed to depend on the vertical turbulent diffusion obtained from the hydrodynamic model and mixing induced from waves which decays exponentially with depth. Bottles are assumed to randomly lose their buoyancy and sink (i.e., when filled with water), while plastic bags are also assumed to gradually lose their buoyancy from the attachment of micro- and macrofouling communities after a 2–3 month period (Holmström, 1975). Plastics are divided into Super Individuals (SIs) (Scheffer et al., 1995) for computational efficiency. Briefly, each SI includes particles with the same properties such as kind (micro or macro plastic), size class, weight and position (longitude, latitude).
Model Setup
The study area consists of the gulfs which surround the city of Athens and the neighboring suburbs (Figure 1). This includes the Saronic Gulf (south) and the largest part of the Petalion Gulf (east). The domain resolution is 1/240° × 1/240° in the horizontal and the water column is divided in 24 sigma-levels. The atmospheric forcing, also used to evaluate the particles wind drag, is obtained from the POSEIDON operational weather forecast (Papadopoulos and Katsafados, 2009), while the waves forcing (stokes drift and vertical mixing) is obtained off-line from Copernicus marine service (Ravdas et al., 2018; Marine.copernicus.eu., 2021). A uniform background initial concentration was adopted for each type/size class, based on a Mediterranean basin average from available in situ data (see Tsiaras et al., 2021). The simulation performed covers the years 2011 and 2012 and follows a 3 year spin-up simulation. The fine model open boundary conditions for the hydrodynamics (temperature, salinity, currents) and plastics concentration are obtained from the Mediterranean basin-scale model simulation over the same period.
Sources
As previously discussed, the major sources of MPs are the WWTPs and rivers or storm drains. Input of MPs from WWTs was estimated, using municipal wastewater discharge (UNEP/MAP, 2011), taking into account of the removal efficiency, depending on the type of treatment. A uniform concentration of influent (untreated) water was adopted based on available data for the Mediterranean (Uddin et al., 2020). Larger particles (>300 μm) were assumed to be totally removed, when some type of treatment is applied, being discharged into the sea only from untreated wastewater.
River originated MPs were not considered in the present study, given that the vast majority of MPs comes from the wastewater discharge from the extended Athens city Metropolitan area with more than 3 M population (Worldpopulationreview, 2021). Respectively and although macroplastics originate from rivers and coastal areas with increased anthropogenic activity, such as beaches and harbors, two different experiments were performed. In the first experiment, both rivers and coastal areas were considered as sources, while in the second experiment, macroplastics originated only from rivers. This way the effect of a possible installation of the CLEAN TRASH system in all local rivers was clearer.
For the river originated macroplastics estimation, the data from the two CLEAN TRASH system cleanups were used in both setups. These were combined in a water quality model (Lindström et al., 2010) for the estimation of the outflow of Kifissos, aiming at estimating the amount of plastics that enter the sea from the main rivers in the area. Thus, from 11 February to 19 March 2019 (37 days), a total of 875 kg of macroplastics were collected and removed from the CLEAN TRASH system collection cage. For the same period, river model estimates a total of 1.563 × 10⁷ m3 of water output, resulting to 5.6 × 10⁻² g/m3 of plastic. This value was used as a reference for a total of 19 rivers in the field (Figure 1). The adopted source inputs of macroplastics from coastal areas were distributed along the coastline following a function of population density, as in the basin-scale model implementation (Tsiaras et al., 2021). The total amount of macroplastics from coastal population was tuned in order to obtain a best fit with available in situ data in the Mediterranean (see Tsiaras et al., 2021).
Efficiency tests on both the CLEAN TRASH system and the prefiltering device, yielded values of more than 90 and 95.67% respectively. Therefore plastics outflow from both rivers and WWTPs were considered to be reduced by that percentage, when applying the cleaning devices.
Results
Starting with the hydrodynamic circulation, the Petalion Gulf is characterized by a southward current during the entire year (not shown). Inside Saronikos Gulf, an anticyclonic circulation prevails, creating a general southwestern movement pattern (Figure 14). This is opposed to a cyclone created in the area adjacent to the main sources of plastics, the Kifissos river and the WWTP of the Metropolitan area of Athens (Psitalia), acting as a possible pollutants concentration area. The southwestern part of the bay is a more enclosed area, with weak currents. The overall simulated circulation is in reasonable agreement with the circulation inferred from in situ measurements (Kontoyiannis, 2010).
As can be seen in Figures 15A,D,G, Saronikos Gulf is considerably more plastic polluted compared with the Petalion Gulf, since the major sources of plastics are located in Saronikos and specific local circulation patterns contribute to a plastics concentration increase. This is more apparent in the northern and southwestern part of the Gulf.
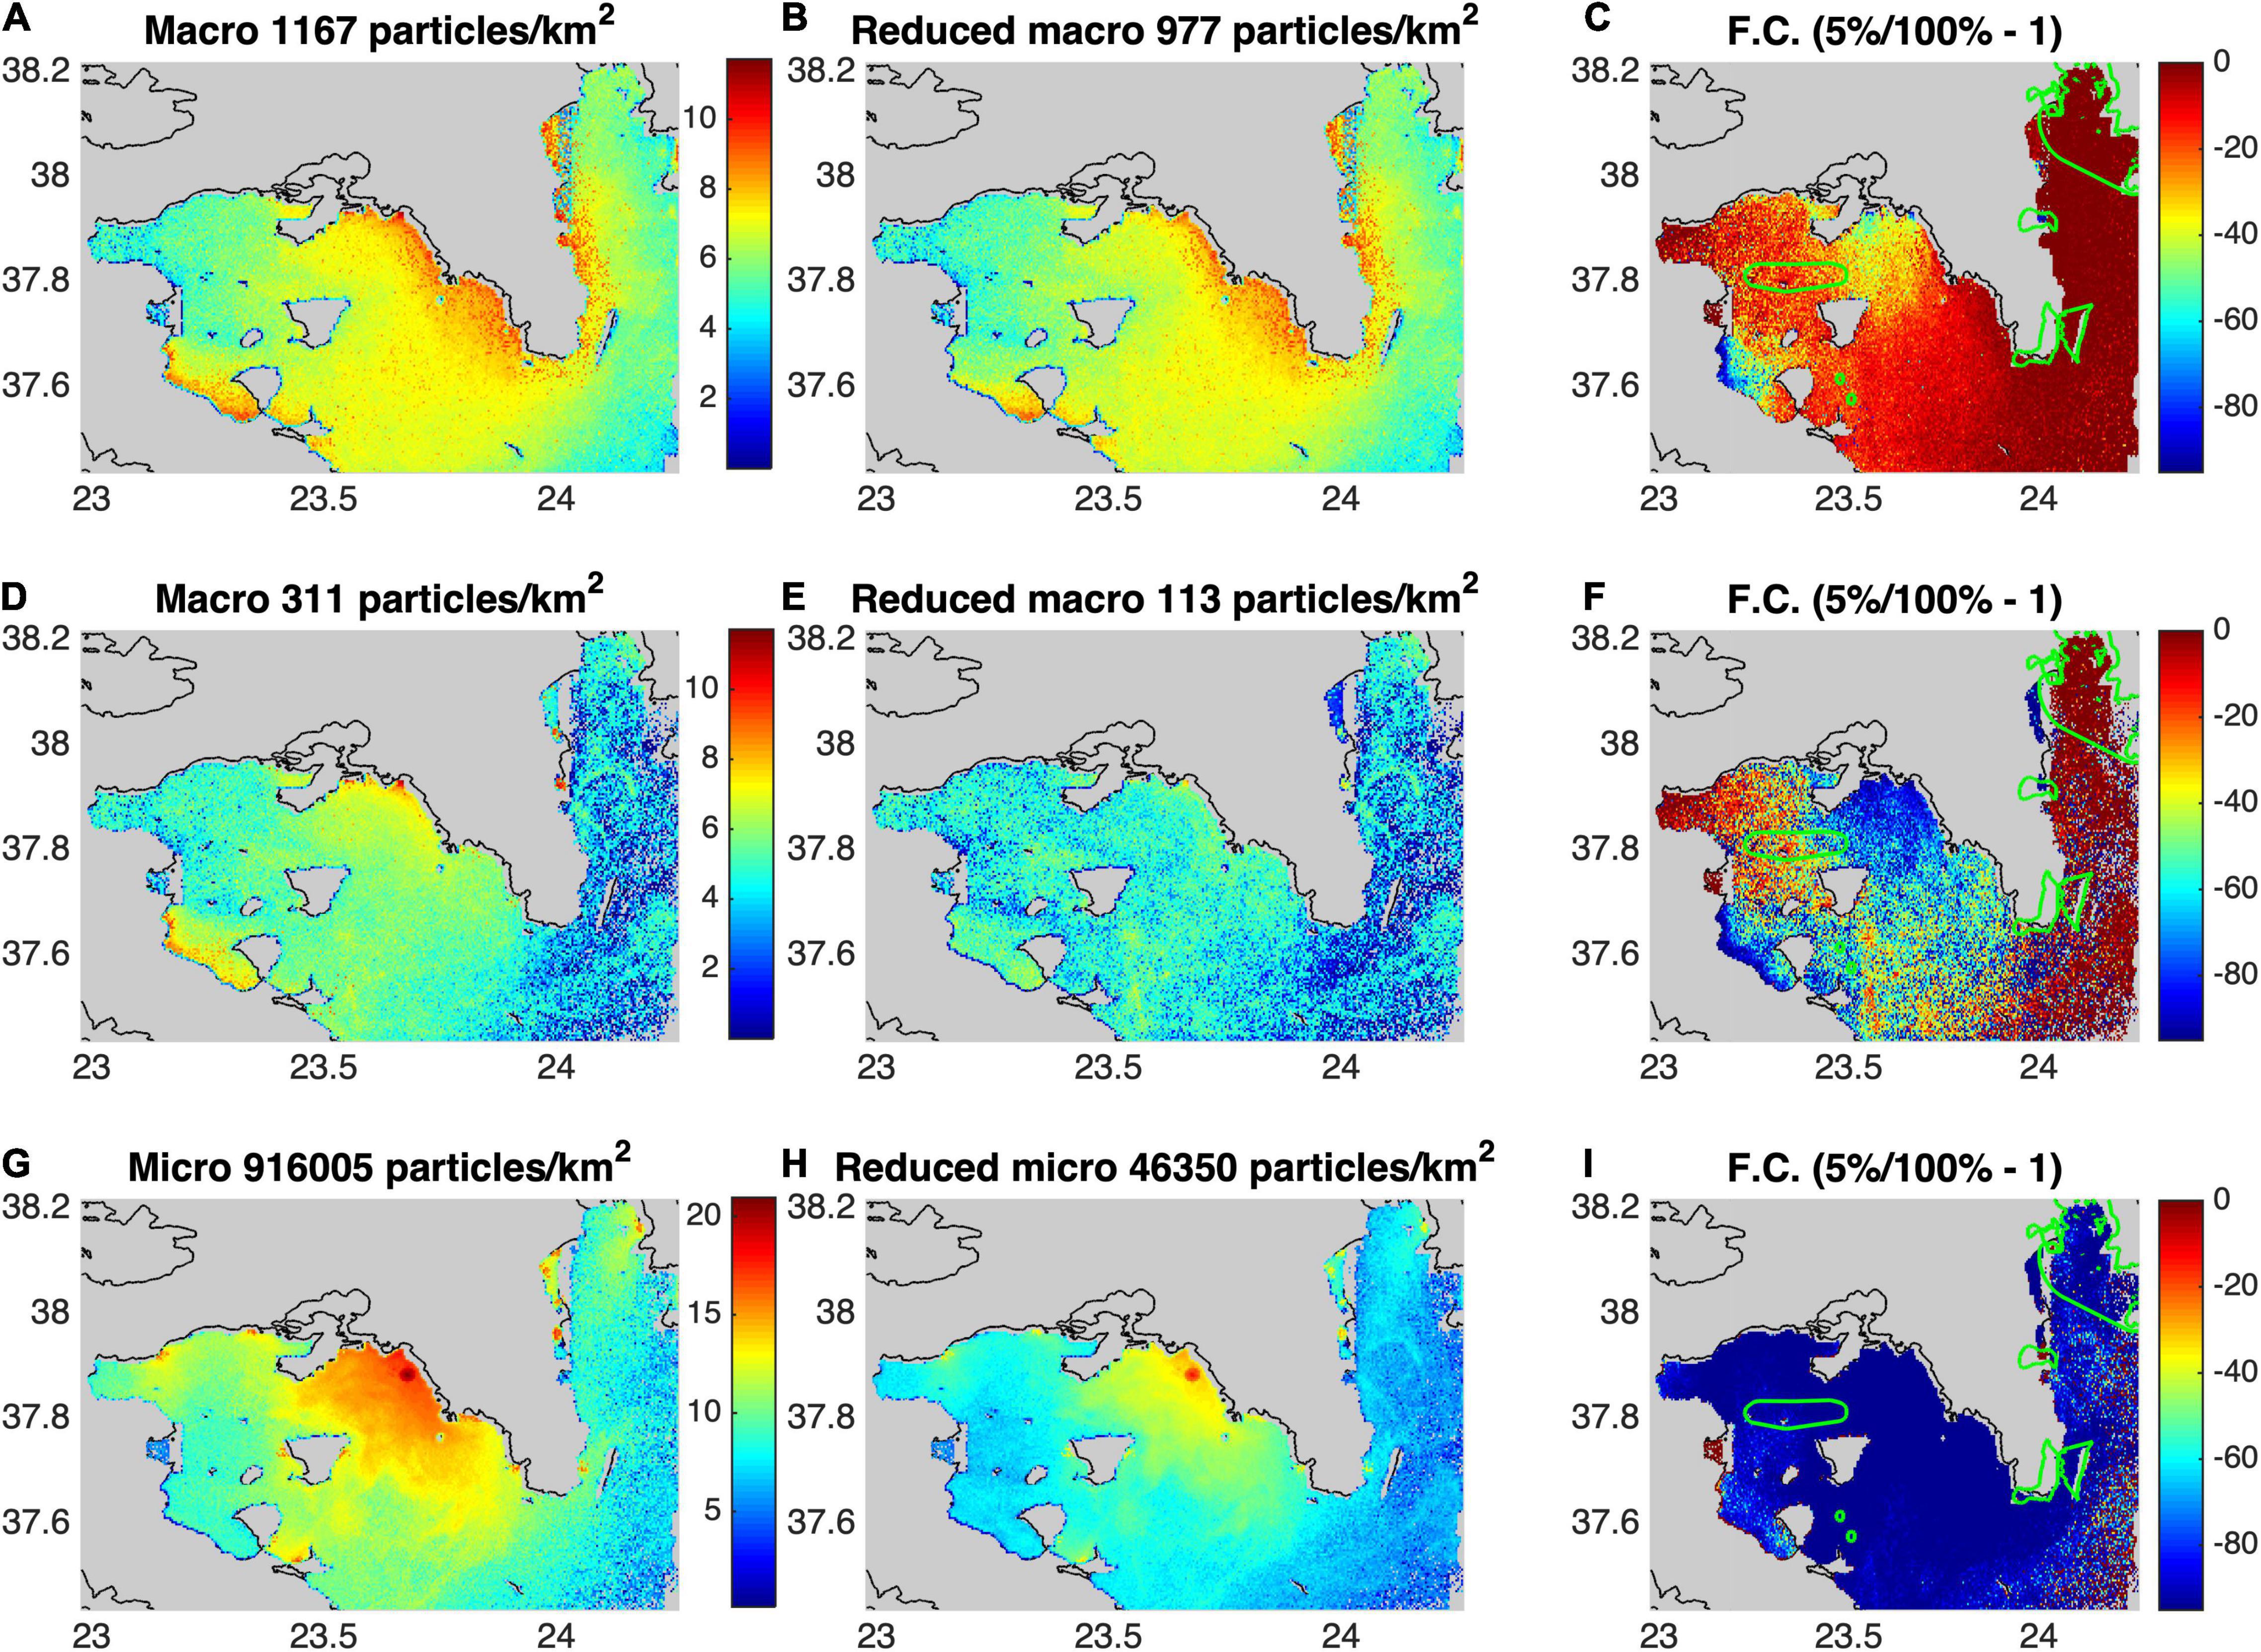
Figure 15. Macro (A–F) and MPs (G–I) concentration in the reference (left column), cleaning scenario (middle column) simulation and fractional change (scenario/reference-1, right column. In panels (A–C), sources are rivers and coastal areas, in panels (D–F), sources are only rivers. NATURA conservation areas are enclosed in green line.
In the scenario with beaches acting as sources (Figure 15A), the coastal area around the prefecture of Athens, both in Saronikos and Petalion Gulfs, becomes considerably more polluted, although the strong dominating southward current of Petalion Gulf, sustains a more plastic free environment.
The application of the CLAIM cleaning devices in all sources for a period of 2 years (Figures 15B,E,H), brought a significant reduction in the concentration of plastics. In the scenario where macroplastics originate from both rivers and beaches, the application of the CLEAN TRASH device in all rivers, brought a 13% reduction in their concentration in the sea. This reduction was evenly spread across the field and emphasized to the role of coastal activities in plastic pollution.
When considering rivers as the exclusive sources of macroplastics, the application of the CLEAN TRASH device resulted in their reduction by 43.5% on average. This was especially apparent in Saronikos Gulf, where in some areas, macroplastics were decreased by up to 95%. These areas included the former high accumulation areas (northern and southwestern part of Saronikos bay).
In both experiments (beaches/no beaches), MPs were significantly reduced throughout the field on average by 87%. The stronger decrease of MPs is probably attributed to their faster removal from surface waters due to biofouling induced sinking, while macroplastics that are mostly floating, have a longer residence time.
A focus in areas of specific interest like the characterized as NATURA conservation areas (Emodnet-humanactivities.eu., 2021), shows the significance of the cleaning methods developed in the CLAIM project. These areas are habitats to many protected species such as seabirds and play a significant role in the preservation of the biodiversity (Coll et al., 2010). Both kinds of plastics are often mistaken for food by most species (Steen et al., 2016). Consumed MPs are transferred into the trophic chain through the predation of the initial consumers (Smith et al., 2018; Alava, 2020) and macroplastics consumption may even lead to the consumers death (Gregory, 2009).
In these NATURA areas, macroplastics were reduced by 12 and 39.3%, with and without beaches acting as sources, respectively, and MPs by 87.3% in both scenarios. A comparison between the three major NATURA areas in the field (in Saronikos and in the Northern and central Petalion Gulfs), shows that the most benefited area is the one in Saronikos Gulf, in terms of macro plastics reduction (Figures 15C,F). MPs were significantly reduced in all three NATURA areas (Figure 15I).
The northeastern Saronikos Gulf is an area of high touristic interest and also benefits from the reduction of both kinds of plastics, especially that of MPs. Across the coasts of the Saronikos Gulf, mainly in the southwestern part, but in other spots as well, numerous fish farms are in operation. In most of these areas, MPs can be significantly reduced with the use of the prefiltering and photocatalytic systems in WWTPs. Contrary to the above, some of these areas by acting as macroplastics concentration areas, are not as much benefited from the application of the CLEAN TRASH system in the surrounding rivers.
Discussion
During the CLAIM project, a series of technologies were developed for the prevention of sea pollution from plastics. Among these were the CLEAN TRASH system with a mission to block macroplastics before they enter the sea and a prefiltering system for the reduction of larger MPs so that only the smaller ones can proceed to a photodegradation system.
The CLEAN Trash system was designed with the aim of being placed at river mouths and blocking all incoming litter, including plastics. Therefore, it consists of a set of floating barriers for the restriction of the litter spread and their direction toward a containment cage. The main challenges behind the design of the floating barriers were the extreme tolerance to heavy, sharp, fast moving, floating objects and their positioning in such a way that most litter are diverted to the collection cage.
The collection cage was designed with a focus on large capacity, through successive compartments and with autonomy and sustainability, through solar power driven equipment. Also, the developed system was remotely monitored and operated through a custom built application for safety and cost reduction reasons. The system installation was considered successful since the surrounding sea area condition after heavy rain events, seemed to justify the experimental 90% efficiency. In 37 days it collected a total of 875 kg of macroplastics and 300 kg of other litter that otherwise would end up at sea. Collected macroplastics could be separated by type of plastic and then be recycled. Pieces of wood, canes and other organic materials could be grinded into fuel pellets.
The system’s efficiency in real conditions may be limited by a number of factors, mainly connected to the prevailing weather conditions. Strong winds and high waves, large volume of river water outflow and bulky litter carried away, may not only limit the efficiency, but put the entire system in danger. Therefore there is a need for system constant online monitoring.
The necessity of reducing MPs before they exit at sea, lead to the development of a photodegradation and mineralization device which, however, requires a prefiltering system for the retainment of the largest particles retainment. In the prefiltering system, the sand filtering technique was adopted for cost reduction reasons, giving an efficiency of 96.67% in lab scale tests. The need for upscale and filtering of significant quantities of water, lead to the adaptation of successive cartridge filtering devices with decreasing hole size to up to 30 μm. Analysis of the retained solids showed a retention of various kind of MPs.
Numerical models were used for the study of the effects of such systems when installed at all rivers and WWTPs around a highly populated Metropolitan city like Athens, Greece. Results showed that when using the efficiency rates that were exported from lab scale experiments and applying them to the devices for a period of just 2 years, there is a significant reduction of the plastics concentration at sea. Macroplastics reduction ranged from 13 to 43.5% depending on the source selection and MPs were reduced by 87%. In some areas with increased importance, either for the conservation of marine life or touristic and aquaculture activities, the reduction (especially of MPs) is even more significant.
Conclusively, the cleaning devices developed for the needs of the CLAIM project proved in the lab and during field tests that they can significantly contribute toward a plastic free sea, especially when these are applied for a significant period of time to as many sources as possible. This theory was also tested from a numerical model, for a 2 year period of systems application.
The next step would be their further development and testing in order to achieve higher efficiency rates and solve any design failures that may arise during long-term application. The evolution of both systems to an industrial level will assist at installing them at as many plastic pollution sources as possible. As advocate to this effort, numerical models can act as a powerful tool to provide a view of the current situation and an insight on highly polluted areas, together with a quality assessment of the effects of the CLAIM cleaning systems.
Data Availability Statement
The original contributions presented in the study are included in the article/supplementary material, further inquiries can be directed to the corresponding author/s.
Author Contributions
AG: article conception and implementation. KT: Lagrangian model development. GTriantap: contribution to the writing of the article. APa, GP, and TO: CLEAN TRASH system R&D. CK, APo, EN, and NK: pre-filtering system R&D. GTriantaf: contribution to the article conception and implementation. All authors contributed to the article and approved the submitted version.
Funding
This work was financially supported by: The EC H2020 CLAIM project (Grant Agreement no. 774586).
Conflict of Interest
APa, GP, and TO are employed by New Naval Ltd. (NNL). EN and NK are employed by Waste & Water SARL.
The remaining authors declare that the research was conducted in the absence of any commercial or financial relationships that could be construed as a potential conflict of interest.
Publisher’s Note
All claims expressed in this article are solely those of the authors and do not necessarily represent those of their affiliated organizations, or those of the publisher, the editors and the reviewers. Any product that may be evaluated in this article, or claim that may be made by its manufacturer, is not guaranteed or endorsed by the publisher.
References
Alava, J. J. (2020). Modelling the bioaccumulation and biomagnification potential of microplastics in a cetacean foodweb of the Northeastern Pacific: a prospective tool to assess the risk exposure to plastic particles. Front. Mar. Sci. 7:566101. doi: 10.3389/fmars.2020.566101
Allseas Group S.A. (2021). Allseas Group S.A. [online]. Available online at: https://allseas.com (accessed May 19, 2021).
Blumberg, A., and Mellor, G. (1983). Diagnostic and prognostic numerical circulation studies of the South Atlantic Bight. J. Geophys. Res. Oceans 88, 4579–4592.
Carr, S. A., Liu, J., and Tesoro, A. G. (2016). Transport and fate of microplastic particles in wastewater treatment plants. Water Res. 91, 174–e182. doi: 10.1016/j.watres.2016.01.002
Coll, M., Piroddi, C., Steenbeek, J., Kaschner, K., Ben Rais Lasram, F., Aguzzi, J., et al. (2010). The biodiversity of the mediterranean sea: estimates, patterns, and threats. PLoS One 5:e11842. doi: 10.1371/journal.pone.0011842
Google Earth (2021). Google Earth. [online]. Available online at: https://earth.google.com/web/ (accessed May 24, 2021).
Eltawab, R., Ayoub, M., El-Morsy, A., and Afifyd, H. (2019). Evaluating performance of different filter media stratification for tertiary treatment of wastewater. Am. Sci. Res. J. Eng. Technol. Sci. 61, 289–303.
Emodnet-humanactivities.eu. (2021). View Data | EMODnet Human Activities. [online]. Available online at: https://www.emodnet-humanactivities.eu/view-data.php (accessed May 20, 2021).
Gies, E. A., LeNoble, J. L., Noöl, M., Etemadifar, A., Bishay, F., Hall, E. R., et al. (2018). Retention of microplastics in a major secondary wastewater treatment plant in Vancouver, Canada. Mar. Pollut. Bull. 133, 553–561. doi: 10.1016/j.marpolbul.2018.06.006
Gregory, M. (2009). Environmental implications of plastic debris in marine settings—entanglement, ingestion, smothering, hangers-on, hitch-hiking and alien invasions. Philos. Transact. R. Soc. B Biol. Sci. 364, 2013–2025. doi: 10.1098/rstb.2008.0265
Hamilton, B. M., Rochman, C. M., Hoellein, T. J., Robison, B. H., Van Houtan, K. S., and Choy, C. A. (2021). Prevalence of microplastics and anthropogenic debris within a deep-sea food web. Mar. Ecol. Progr. Ser. 675, 23–33.
Hillie, K. T., and Hlophe, M. (2007). Nanotechnology and the challenge of clean water. Nat. Nanotechnol. 2, 663–664. doi: 10.1038/nnano.2007.350
Jambeck, J., Geyer, R., Wilcox, C., Siegler, T., Perryman, M., Andrady, A., et al. (2015). Plastic waste inputs from land into the ocean. Science 347, 768–771. doi: 10.1126/science.1260352
Kontoyiannis, H. (2010). Observations on the circulation of the Saronikos Gulf: a Mediterranean embayment sea border of Athens, Greece. JGR Oceans 115, 1–23.
Lindström, G., Pers, C. P., Rosberg, R., Strömqvist, J., and Arheimer, B. (2010). Development and test of the HYPE (Hydrological Predictions for the Environment) model – A water quality model for different spatial scales. Hydrol. Res. 4, 295–319. doi: 10.2166/nh.2010.007
Lumenera (2021). Infinity Analyze and Capture Software for Microscope Cameras – Windows Version Teledyne Lumenera. [online]. Available online at: https://www.lumenera.com/infinity-analyze-and-capture-for-windows.html (accessed May 19, 2021).
Mahara, N., Alava, J. J., Kowal, M., Grant, E., Boldt, J. L., Kwong, L. E., et al. (2021). Assessing size-based exposure to microplastics and ingestion pathways in zooplankton and herring in a coastal pelagic ecosystem of British Columbia, Canada. Mar. Ecol. Progr. Ser. Available online at: https://www.int-res.com/prepress/m13966.html (accessed December 5, 2021).
Marine, A. (2021). Anasayfa – EPS Marine. EPS Marine. Available online at: https://epsmarine.com (accessed May 19, 2021).
Marine.copernicus.eu. (2021). Home | CMEMS. [online]. Available online at: https://marine.copernicus.eu (accessed May 24, 2021).
Mason, S., Garneau, D., Sutton, R., Chu, Y., and Ehmann, K. (2016). Microplastic pollution is widely detected in US municipal wastewater treatment plant effluent. Environ. Pollut. 218, 1045–1054. doi: 10.1016/j.envpol.2016.08.056
Mintenig, S. M., Int-Veen, I., Loder, M. G., Primpke, S., and Gerdts, G. (2017). Identification of microplastic in effluents of waste water treatment plants using focal plane array-based micro-Fourier-transform infrared imaging. Water Res. 108, 365–372. doi: 10.1016/j.watres.2016.11.015
Murphy, F., Ewins, C., Carbonnier, F., and Quinn, B. (2016). Wastewater treatment works (WwTW) as a source of microplastics in the aquatic environment. Environ. Sci. Technol. 50, 5800–5808. doi: 10.1021/acs.est.5b05416
Oceansplasticleanup (2021). Seavax Rivervax Mass Water Filtration Machines Projects Overview. [online]. Available online at: http://www.oceansplasticleanup.com/SeaVax_RiverVax/SeaVax_RiverVax_Projects_Overview.htm (accessed May 19, 2021).
Papadopoulos, A., and Katsafados, P. (2009). Verification of operational weather forecasts from the POSEIDON system across the Eastern Mediterranean. Nat. Hazards Earth Syst. Sci 9, 1299–1306. doi: 10.5194/nhess-9-1299-2009
Pollani, A., Triantafyllou, G., Petihakis, G., Konstantinos, N., and Dounias, K. (2001). The Poseidon operational tool for the prediction of floating pollutant transport. Mar. Pollut. Bull. 43, 270–278. doi: 10.1016/s0025-326x(01)00080-7
Poseidon System (2021). Poseidon System. [online]. Available online at: https://poseidon.hcmr.gr/ (accessed May 19, 2021).
Ravdas, M., Zacharioudaki, A., and Korres, G. (2018). Implementation and validation of a new operational wave forecasting system of the mediterranean monitoring and forecasting centre in the framework of the copernicus marine environment monitoring service. Nat. Hazards Earth Syst. Sci. 18, 2675–2695. doi: 10.5194/nhess-18-2675-2018
Rivercleaning (2021). Home – Rivercleaning. [online]. Available online at: https://rivercleaning.com (accessed May 19, 2021).
Scheffer, M., Baveco, J. M., DeAngelis, D. L., Rose, K. A., and van Nes, E. H. (1995). Super-individuals: a simple solution for modelling large populations on an individual basis. Ecol. Model. 80, 161–170. doi: 10.1016/0304-3800(94)00055-m
Seabin (2021). Seabin Project – Cleaner Oceans for a Brighter Future. [online]. Available online at: https://seabinproject.com (accessed May 19, 2021).
Smith, M., Love, D., Rochman, C., and Neff, R. (2018). Microplastics in Seafood and the Implications for Human Health. Curr. Environ. Health Rep. 5, 375–386. doi: 10.1007/s40572-018-0206-z
Steen, R., Torjussen, C., Jones, D., Tsimpidis, T., and Miliou, A. (2016). Plastic mistaken for prey by a colony-breeding Eleonora’s falcon (Falco eleonorae) in the Mediterranean Sea, revealed by camera-trap. Mar. Pollut. Bull. 106, 200–201. doi: 10.1016/j.marpolbul.2016.02.069
Sun, J., Dai, X., Wang, Q., van Loosdrecht, M. C. M., and Ni, B.-J. (2018). Microplastics in wastewater treatment plants: detection, occurrence and removal. Water Res. 152, 21–37. doi: 10.1016/j.watres.2018.12.050
Talvitie, J., Mikola, A., Koistinen, A., and Setala, O. (2017a). Solutions to microplastic pollution – Removal of microplastics from wastewater effluent with advanced wastewater treatment technologies. Water Res. 123, 401–407. doi: 10.1016/j.watres.2017.07.005
Talvitie, J., Mikola, A., Setälä, O., Heinonen, M., and Koistinen, A. (2017b). How well is microlitter purified from wastewater? – A detailed study on the stepwise removal of microlitter in a tertiary level wastewater treatment plant. Water Res. 109, 164–172. doi: 10.1016/j.watres.2016.11.046
The Ocean Cleanup (2021). The Ocean Cleanup. [online]. Available online at: https://theoceancleanup.com (accessed May 19, 2021).
Theron, J., Walker, J. A., and Cloete, T. E. (2010). Nanotechnology and water treatment: applications and emerging opportunities. Crit. Rev. Microbiol. 34, 43–69. doi: 10.1080/10408410701710442
Trash, W. (2021). Home – Mr. Trash Wheel. [online]. Available online at: https://www.mrtrashwheel.com (accessed May 19, 2021).
Tsiaras, K., Hatzonikolakis, Y., Kalaroni, S., Pollani, A., and Triantafyllou, G. (2021). Modeling the pathways and accumulation patterns of micro- and macro-plastics in the Mediterranean. Front. Mar. Sci. 8:743117. doi: 10.3389/fmars.2021.743117
Uddin, S., Fowler, S., and Behbehani, M. (2020). An assessment of microplastic inputs into the aquatic environment from wastewater storm drains. Mar. Pollut. Bull. 160:111538. doi: 10.1002/ieam.1915
Uheida, A., Mejía, H. G., Abdel-Rehim, M., Hamd, W., and Dutta, J. (2021). Visible light photocatalytic degradation of polypropylene microplastics in a continuous water flow system. J. Hazard. Mater. 406:124299. doi: 10.1016/j.jhazmat.2020.124299
UNEP – Un Environment Programme (2021). From Pollution to Solution: A Global Assessment of Marine Litter and Plastic Pollution. Available online at: https://www.unep.org/resources/pollution-solution-global-assessment-marine-litter-and-plastic-pollution (accessed December 6, 2021).
UNEP/MAP (2011). “Inventory of municipal wastewater treatment plants of coastal Mediterranean cities with more than 2,000 inhabitants (2010),” in UNEP(DEPI)/MED WG.357/Inf.7, Greece, 225.
Urban Rivers (2021). Trash robot — Urban Rivers. [online]. Available online at: https://www.urbanriv.org/trashbot (accessed May 19, 2021).
Waternet (2021). Waternet. [online]. Available online at: https://www.waternet.nl (accessed May 19, 2021).
Worldpopulationreview (2021). Athens Population 2021 (Demographics, Maps, Graphs). [online]. Available online at: https://worldpopulationreview.com/world-cities/athens-population (accessed May 24, 2021).
Yoon, J.-H., Kawano, S., and Igawa, S. (2010). Modelling of marine litter drift and beaching in the Japan Sea. Mar. Pollut. Bull. 60, 448–463. doi: 10.1016/j.marpolbul.2009.09.033
Keywords: marine pollution, macroplastics, microplastics, Lagrangian plastic dispersion model, CLEAN TRASH, prefiltering system, waste water treatment plant
Citation: Gkanasos A, Tsiaras K, Triantaphyllidis G, Panagopoulos A, Pantazakos G, Owens T, Karametsis C, Pollani A, Nikoli E, Katsafados N and Triantafyllou G (2021) Stopping Macroplastic and Microplastic Pollution at Source by Installing Novel Technologies in River Estuaries and Waste Water Treatment Plants: The CLAIM Project. Front. Mar. Sci. 8:738876. doi: 10.3389/fmars.2021.738876
Received: 09 July 2021; Accepted: 07 December 2021;
Published: 24 December 2021.
Edited by:
Juan José Alava, University of British Columbia, CanadaReviewed by:
Tadele Assefa Aragaw, Bahir Dar University, EthiopiaGabriel Enrique De-la-Torre, Saint Ignatius of Loyola University, Peru
Copyright © 2021 Gkanasos, Tsiaras, Triantaphyllidis, Panagopoulos, Pantazakos, Owens, Karametsis, Pollani, Nikoli, Katsafados and Triantafyllou. This is an open-access article distributed under the terms of the Creative Commons Attribution License (CC BY). The use, distribution or reproduction in other forums is permitted, provided the original author(s) and the copyright owner(s) are credited and that the original publication in this journal is cited, in accordance with accepted academic practice. No use, distribution or reproduction is permitted which does not comply with these terms.
*Correspondence: Athanasios Gkanasos, dGhnYW5hc29zQGhjbXIuZ3I=; George Triantafyllou, Z3RAaGNtci5ncg==
 Athanasios Gkanasos
 Kostas Tsiaras
 George Triantaphyllidis
 Aleksandros Panagopoulos2
 George Triantafyllou