 Patricia Lopez-Garcia1*
 Juan J. Muñoz-Perez1
 Antonio Contreras2
 Juan Vidal1Bismarck Jigena1
 Juan J. Santos1
 Jeanette Romero1Francisco Contreras2
- 1CASEM (Centro Andaluz Superior de Estudios Marinos), University of Cadiz, Cádiz, Spain
- 2Polytechnic School of Algeciras, University of Cadiz, Cádiz, Spain
Analyses were carried out to determine the main sand size parameters (median grain size D50 and sorting σ) for beach nourishment purposes using the sieving method aboard a dredger. Due to a lack of space and the need to carry and use the material with ease, the sieves are commonly small (10 cm diameter), and the shaking procedure is usually performed by hand. However, the influence of shaking, either mechanically or manually, has not yet been studied with 10 cm diameter sieves. Therefore, 20 samples were taken from inside the hopper of a trailing suction dredger and sieved both manually and mechanically for 10 min. The results showed that manual sieving yielded higher D50 values than the mechanical procedure. The average error arising from using the manual method was 14%, but it can reach 36.5%. The granulometric analysis carried out for different shaking times has shown that this error is < 5% when at least 20 min of shaking is performed. The mechanical procedure gave always finer sand results. In addition, the overfill ratio calculated for both mechanical and manual results reached differences of up to 48%.
Introduction
Beach nourishment is one of the one of the most commonly performed shore protection method on coasts worldwide. However, research into the design of these nourishment projects is ongoing to improve the work efficiency, which is based on empirical equations and rules (Pendleton et al., 2012; Román-Sierra et al., 2013; Karambas and Samaras, 2014; Armstrong et al., 2016; Choi et al., 2016; Pranzini et al., 2018).
The work process for beach nourishment requires finding suitable sand to replace the native sand eroded from the beach (Pranzini et al., 2018; Saponieri et al., 2018), and to estimate the amount of sand needed for beach nourishment (U.S. Army Corps of Engineers, 2002). Analyses of the sand-size distribution provides clues about the origin, depositional environment, and transport history of the sand (Bernabeu Tello et al., 2002; Singh et al., 2007; Fenster et al., 2016; Remo et al., 2016; Grottoli et al., 2017; Hallin et al., 2019). Additionally, sand-size analysis is an essential methodology used to classify materials and sedimentary environments (Steidtmann, 1982; Roman-Sierra et al., 2011), and it can also be used to make predictions about the longevity of sand on a beach and how it reacts to storms (Bascom, 1951; Larson and Kraus, 1991; Grottoli et al., 2017; de Villar et al., 2019). The analyses carried out to study the coastal processes include measurements of the main sand size parameters, mainly, the median grain size (D50) and the sorting, i.e., the spread of the sizes around the average (σ) (Blott and Pye, 2001).
The beach nourishment manager must carry out a quality control of the sand dumping site and decide where the sand should be placed. Methodologies to obtain the sand-size parameters need to be performed quickly aboard a dredger before the sand is pumped to the beach. The determination of the sand size parameters needs to be accurate for beach nourishment purposes (error less than 10%) (Muñoz-Pérez et al., 2012). These parameters can be expressed in metric or phi (logarithmic) units. Their determination is usually calculated using Folk and Ward formulae based on Krumbein’s previous disquisitions (Krumbein and Pettijohn, 1938; Folk and Ward, 1957; Folk, 1974; Friedman and Johnson, 1982). Therefore, measures of accuracy could be determined through the analysis of several portions of a sample, several analyses of the same sample, or the analysis of several samples collected at the same locality. Among the methods used to analyze the sand size particles, researchers have studied and compared laser diffraction (Blott and Pye, 2006), laser granulometry and sedigraph (Celia Magno et al., 2018), camsizer (Luisa Martinez et al., 2017), microtrac (Austin and Shah, 1983), laser grain size with pipette and sieve (Konert and Vandenberghe, 1997), image analysis (Eberhard et al., 2012; Orrú et al., 2013), and sieving (Shillabeer et al., 1992; Pope and Ward, 1998; Eberhard et al., 2012).
The sieving method is the most common analysis used to determine the main sand size parameters aboard a dredger when performing a beach nourishment. The analysis of sand-size inside a dredger ship has some limitations such as limited workspace, specifications of the material that is needed, an unstable energy supply, and the limited time available to transport sand between the borrow and dump sites. Thus, the sieving method, when performed aboard a dredger, should be chosen according to its ease of use and its economic efficiency. Furthermore, the difficulty of embarking and disembarking sand with cat ladders in the high seas, alongside the habitual lack of a stable energy supply makes it difficult to use a mechanical shaker on board the ship. Thus, the manual shaking procedure is usually performed instead to analyze of sand grain sizes inside a dredger. The abovementioned problems together with the shortage of space are also the reason why small sieves (10 cm instead of 20 cm diameter) are mostly used in these situations.
Moreover, it is important to obtain highly precise D50 values and sorting results for beach nourishment purposes. The grain size compatibility of dredged (“borrow”) sediments and native beach sediments is commonly expressed as the overfill ratio (RA) (James, 1975). This overfill factor describes the theoretical volume of borrow sand that will comprise the residual volume of sediment on the beach after losses. That is, the RA attempts to account for the natural loss of some fraction of the borrow sediment that is finer than the native beach sediment. It is therefore important to evaluate possible errors when determining sand parameters (native and borrow) before and during the beach nourishment process, since these could entail dredging a larger volume of borrow sand than necessary. Indeed, Poullet et al. (2016) studied a particular case with the James method (U.S. Army Corps of Engineers, 2002) to obtain the RA, in order to demonstrate the importance of errors made when performing sand parameter determinations in the calculation of sand nourishment volumes. Regarding the design beach nourishment projects, Grosskopf and Kraus (1993) proposed a mean error of less than 11.5 m3/m of beach volume to estimate the sand volume; otherwise, an accuracy comparable to the 10–20% contingencies is associated with the project designs (Muñoz-Pérez et al., 2012). Thus, some authors (Grosskopf and Kraus, 1993; Muñoz-Pérez et al., 2012; Poullet et al., 2016) indicate that errors up to 10% can be assumed for beach nourishment purposes.
Precision is crucial when determining sand parameters. According to Syvitski (1991), for example, sieving time can influence the results of sand size analyses. Sifting efficiency in relation to sieving time has been evaluated with several studies. One of the hypotheses was that finer materials require longer sieving times; indeed, the finer the material, the greater the number of sieves that the sand needs to pass through, and the longer the grains will need to pass through smaller apertures (Mizutani, 1963). Thus, Syvitski (1991) and Lund-Hansen and Oehmig (1992) proposed a median sieving time of 20 min, whereas the US Army Corps of Engineers (USACE) (U.S. Army Corps of Engineers, 2002) chose 15 min, and Román-Sierra et al. (2013) established 10 min as the minimum time required to obtain accurate results for medium-grained beach and dune sands. However, these studies used mechanical sieving as the sieving method, and studies of the sieving efficiency with small diameter sieves shaken manually, though necessary, have not yet been performed. Poullet et al. (2019b) have compared manual and mechanical sieving with sieves of 20 cm diameter vs. manual sieving with 10 cm diameter sieves (both with 10 min of shaking time). Their conclusion was that the small diameter sieves should be rejected as a method on board for beach nourishment purposes. Nevertheless, the differences between mechanical and manual shaking with small diameter sieves have not yet been tested and neither has the influence of the shaking time with small sieves. These studies were contemplated in order to have a solution instead of the rejection of that method.
Therefore, the aim of this study is to distinguish the differences between the results obtained for the size parameters of sand sieved by hand (shaken manually) and sand that was mechanically sieved (shaken with a machine). In both scenarios, 10 cm diameter sieves were used. In addition, relative errors for different sieving times were investigated. The present paper shows the error arising from manual sieving and determines if this error is acceptable for beach nourishment works.
Materials and Methods
The sand samples analyzed are from the Meca sandbank site, where sand was extracted to perform beach nourishments. The Meca sandbank is located between 15 and 20 m depths in the Gulf of Cadiz close to the Strait of Gibraltar (Figure 1A), and contains approximately 25 million m3 of sand that can be used for beach nourishments (Muñoz-Perez et al., 2009). The beaches on the coast near the sandbank consist of fine-medium sand, like the borrowed sediment, with an average D50 0.25 mm and a composition of 90% quartz and 10% calcium carbonate (Muñoz-Pérez et al., 2000).
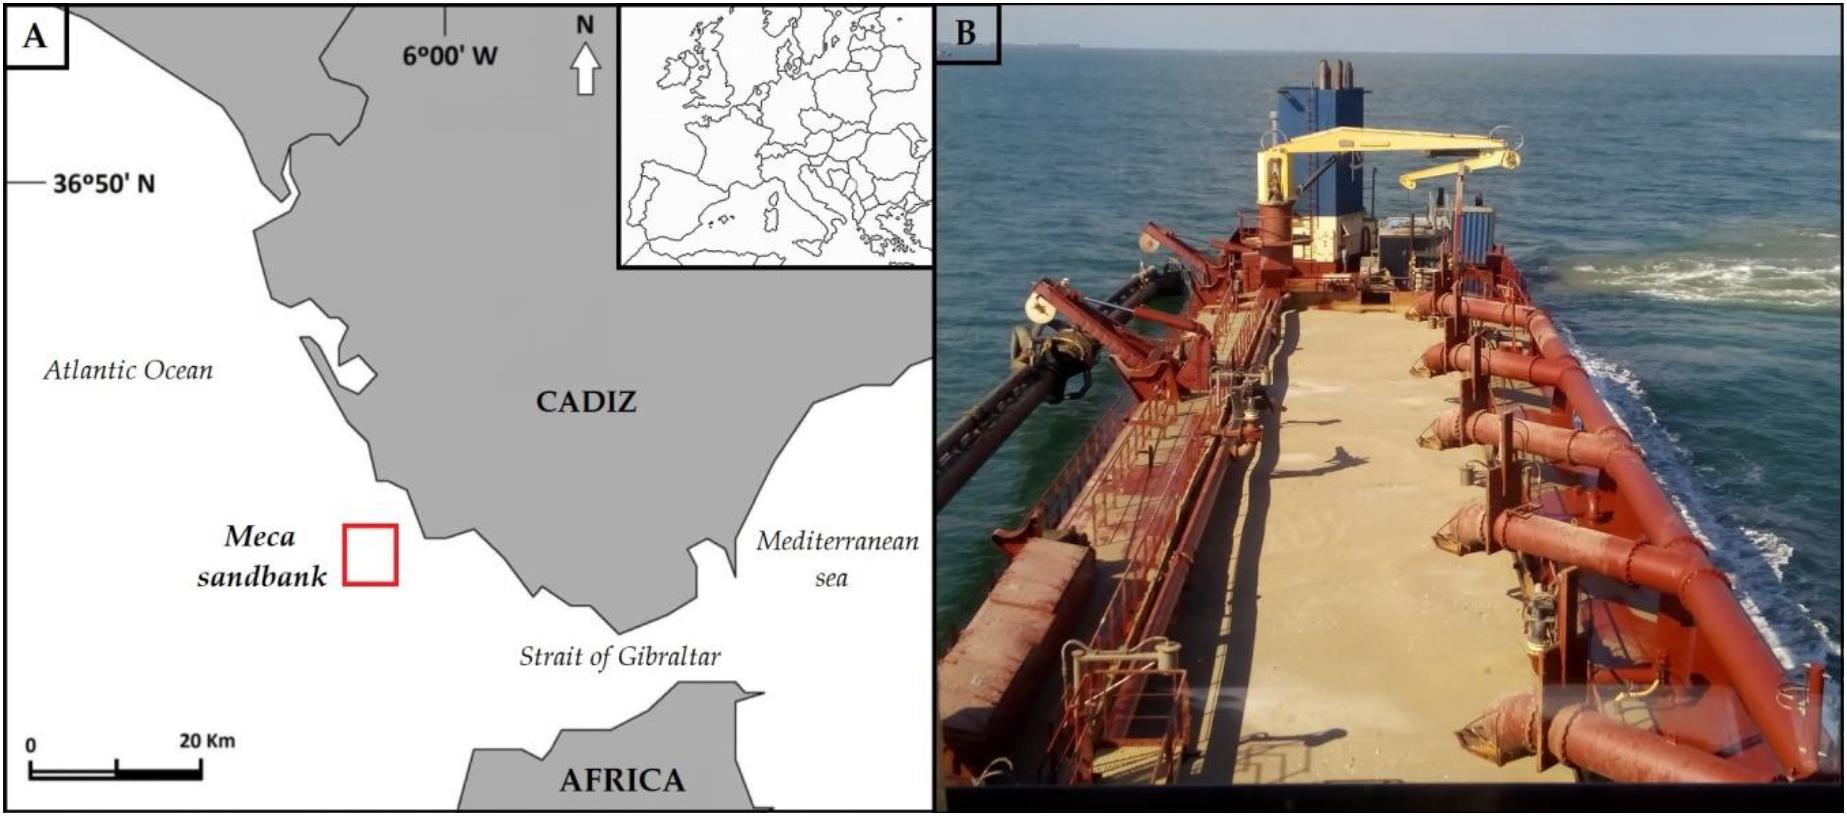
Figure 1. (A) The Meca sandbank in the Gulf of Cadiz close to the Strait of Gibraltar (Spain, Europe). (B) The hopper of the trailing suction dredger where the samples were taken.
Twenty samples were taken on different days from inside the hopper of a trailing suction dredger (Figure 1B) during beach nourishments in Cadiz (Costa Ballena and Punta Candor beaches). The sampling was carried out once the dredging operations were finished and the hopper was full of sand. Prior to removing the sand sample from the hopper surface, the operator took off the first 5 cm in depth from a 20 cm2 random sand area from the surface, adhering to the appropriate safety measures. The first 5 cm from the surface usually has a high percentage of shells, and it is not representative of the whole hopper (Poullet et al., 2019a).
While the dredger was sailing to the pumping area, the sand size analysis was carried out following the standard procedure described by Syvitski (1991), and slightly modified by Román-Sierra et al. (2013). Once the analysis was finalized on board by shaking with bare hands, each sample was saved in a hermetic bag in order to perform the analysis on the same samples afterward at the inland laboratory with the mechanical sieving method. Therefore, each sample was sieved twice with a small diameter sieve size (10 cm). Since this study case was during beach nourishment in Spain, eight specific mesh sizes were used for the sieving, 2 1 mm, 710, 500, 355, 250, 125, and 62.5 μm, because the Spanish Coastal Administration customarily requires it. The methodology for sand sample analysis is summarized below.
First, 20 samples weighing 100 g each were dried in the muffle for 12 h at the laboratory, whereas the drying process aboard was performed in a microwave for 5 min at maximum power. This specific weight was chosen to facilitate the passage of the samples through the meshes, since adding a larger volume of sediments could result in their accumulation. Following that, each sample was weighed with a triple beam balance scale, whose accuracy can measure within a tenth of a gram, in order to simulate aboard conditions. For the next step after the sample weighing, the sand sample was put into the upper sieve (2 mm mesh size) of the 10 cm diameter sieve column. Then, the dry sample was sieved for 10 min using the two different methods: manual and mechanical shaking procedures. The sand accumulated in each sieve was weighed to obtain the required values of D50 and the sorting. These steps were performed for the two methodologies. The parameters were calculated using the corresponding equations that can be found in Folk and Ward (Folk and Ward, 1957; Table 1). Blott and Pye (2001) produced a detailed manual of this study. The equations were based on the phi unit scale and can be converted from phi (φ) units to millimeters using equation 1.
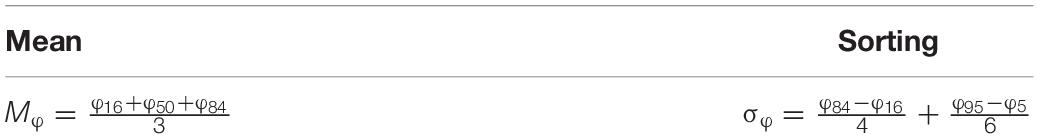
Table 1. Formulae used to calculate the main granulometric parameters, according to Folk and Ward graphical measures (Folk and Ward, 1957), where Mφ is the estimated mean grain size and σφ is the estimated standard deviation of the sample in phi units.
The sieving procedure was performed twice per each sample in order to find possible variations in the results. However, the results were exactly the same. In addition, the 3 samples with the highest differences for both methods were analyzed and checked a third time.
Furthermore, the overfill ratio (RA) was used to calculate the increase in the nourishment volume needed to compensate for the losses of fines from the borrow sand. Thus, the overfill ratio RA was determined by applying Eq. 2 and 3 in the James’ graph (Figure 2; U.S. Army Corps of Engineers, 1984). These ratios were obtained with the values of the Mean and Sorting parameters of manual and mechanical sieve procedures for both the borrow (Mφb and σφb) and the native sand (Mφn and σφn). This revealed the error which arose from using the manual sieving method, and what this implies for the necessary decrease in volume.
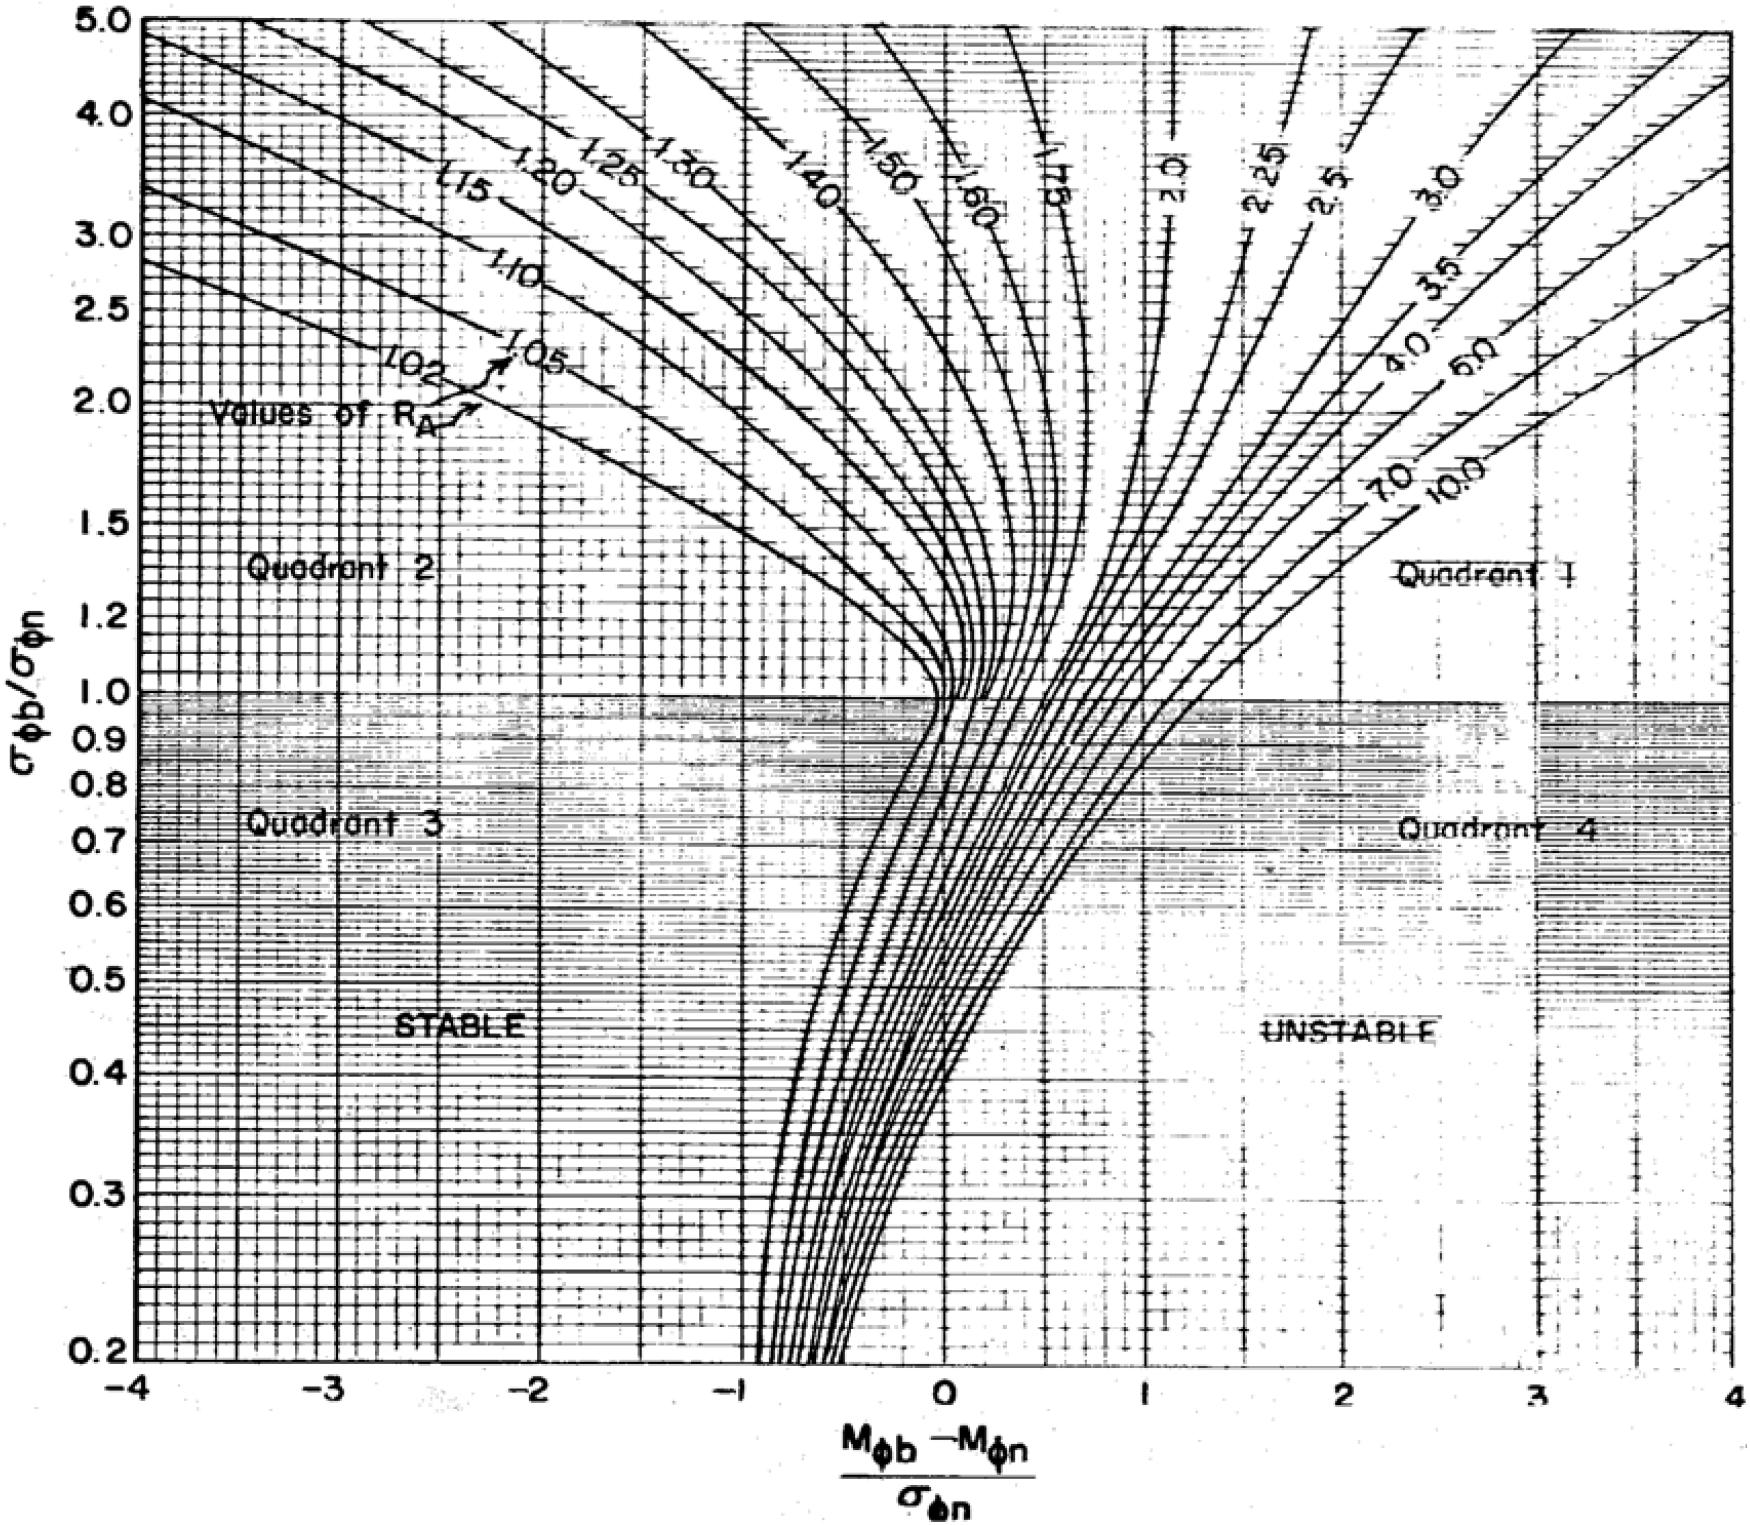
Figure 2. James graph where RA can be found using Mean and Sorting parameters for the borrow (Mφ b and σφ b) and the native sand (Mφ n and σφ n) (U.S. Army Corps of Engineers, 1984).
A previous study (Muñoz-Pérez et al., 2012) has already established that mechanical sieving is the preferred method for obtaining realistic results and guaranteeing homogeneity. Therefore, the relative error (ε), taking the mechanical method as the reference, was calculated for D50 and the sorting parameters following Eq. 4 and 5.
Results and Discussion
The values of D50 (mm) and sorting (φ) obtained through the mechanic and manual sieving of 20 sand samples are shown alongside native sand values in Table 2. Thus, the difference between both methodologies for each parameter, and the error (ε) arising from using the mechanical method as a reference can also be observed. In addition, the percentage of shells present in the samples is also shown in the table. Other granulometric parameters like D95, D84, D16, and D5 and their differences are also shown in Table 3 in order to help find what sieve meshes have the sand accumulation, which could be a possible cause of the error with manual shaking.
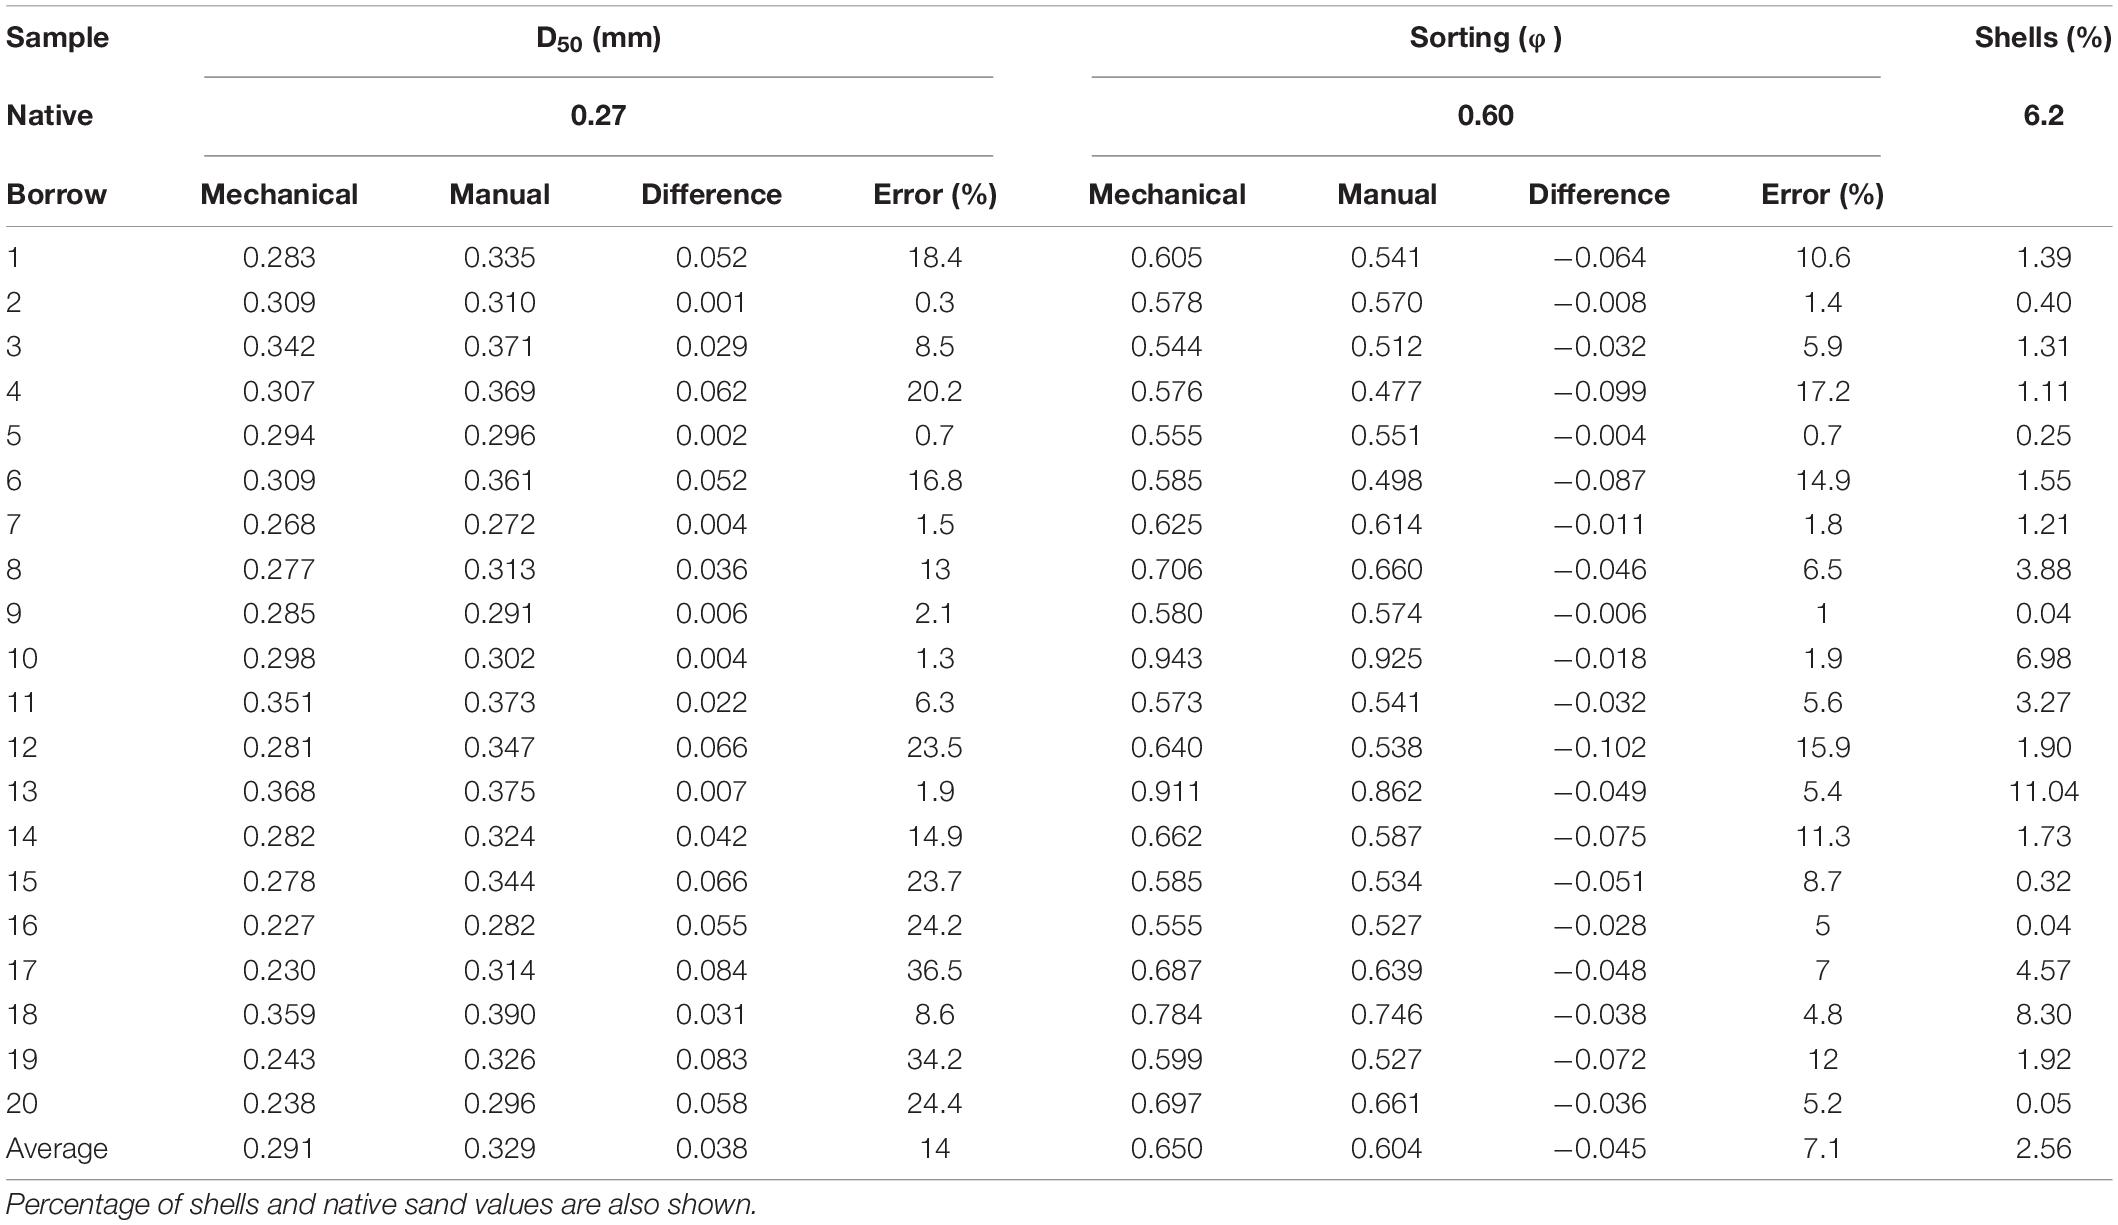
Table 2. Granulometric parameters of 20 sand samples including D50 (mm) and sorting (φ), and difference (mm) and error (%) between methodologies for mechanical and manual sieving methods with 10 cm diameter sieves.
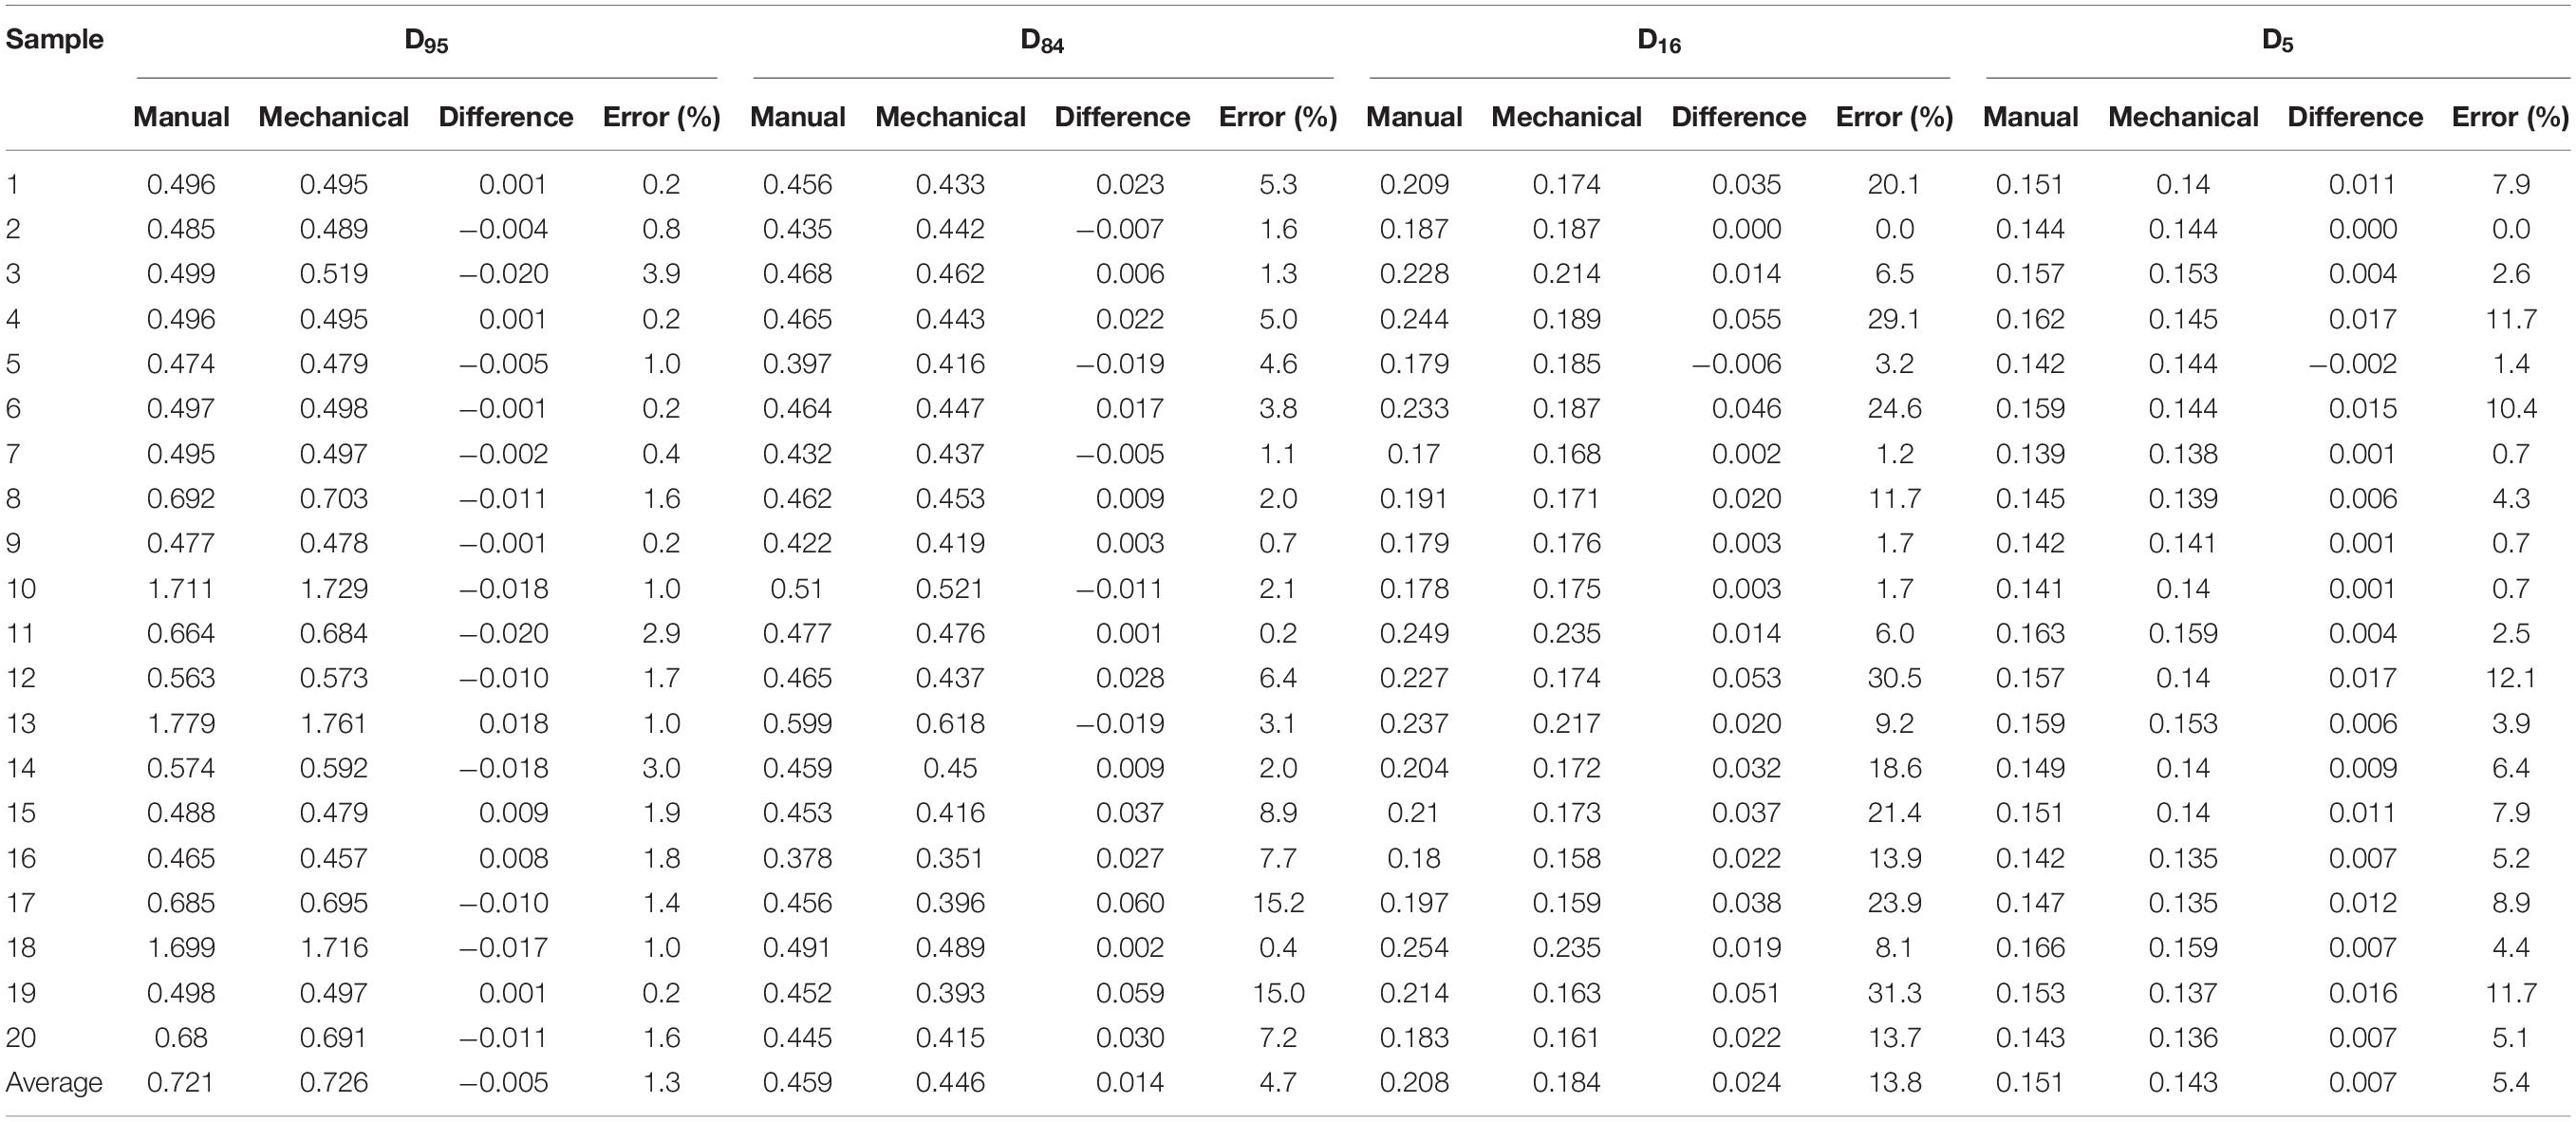
Table 3. Granulometric parameters of 20 sand samples including D95, D84, D16, and D5 (mm), and difference (mm) and error (%) between methodologies for mechanical and manual sieving methods with 10 cm diameter sieves.
The differences and errors in samples 16, 17, 19, and 20 were higher than in the other samples, and thus, tests for these samples were repeated, but the results did not change.
D50 (Median Grain Diameter)
Figure 3 shows that the D50 values were always higher when sieving was performed manually, i.e., mechanical sieving produces smaller D50 values. The maximum difference was 0.084 mm (sample 17), representing a maximum error of 36.5%, whereas the average error was of 14%. The mechanical sieving produced finer results due to the more constant and powerful shaking than shaking by hand. In manual sieving, sand was accumulated on certain larger mesh size sieves. A possible explanation for this is the application of less amplitude, strength, and consistency in the shaking performance that is needed for sand to pass through the corresponding mesh sizes. Moreover, it can be seen (example in Figure 4 of sample 17) that sand accumulated in the 355 μm-sized mesh during manual sieving. Nevertheless, for the same sample, part of this sand passed through to the underlying sieves (250 and 125 μm), when sieved mechanically.
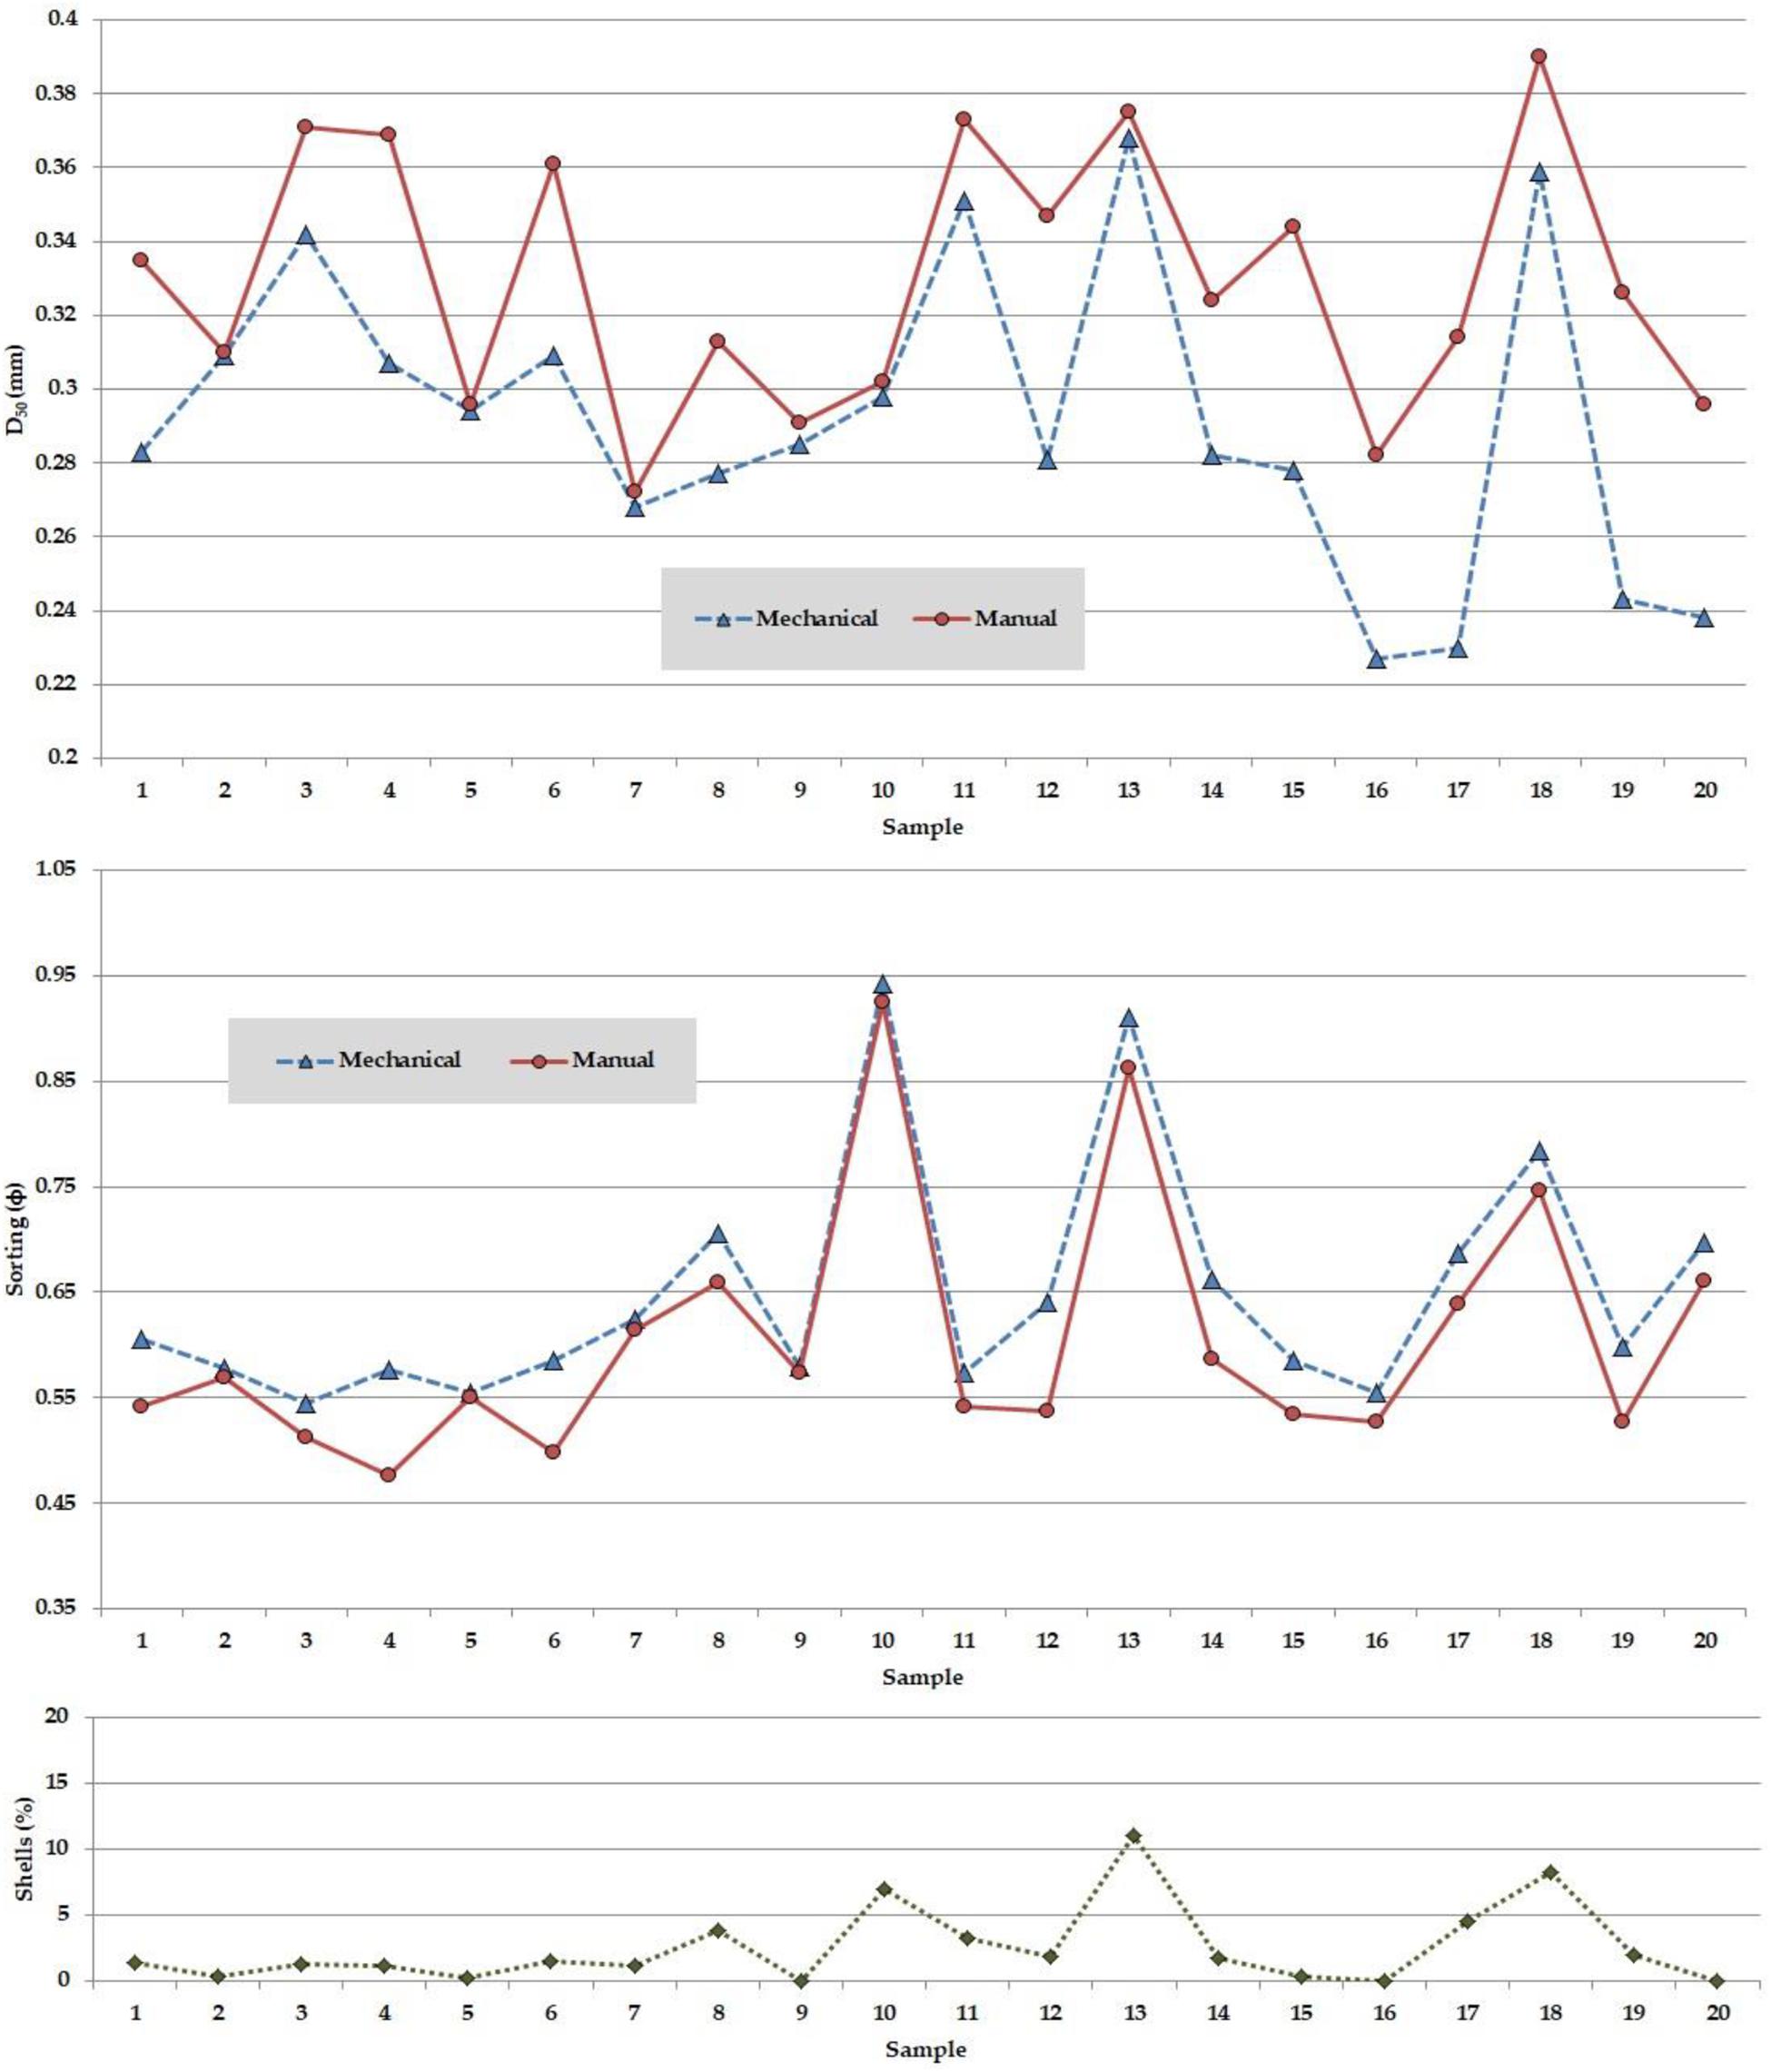
Figure 3. Graphical results of the granulometric parameters of 20 sand samples, D50 (mm) and sorting (φ) for mechanical and manual sieving methods with 10 cm diameter sieves. Percentage of shells is also shown.
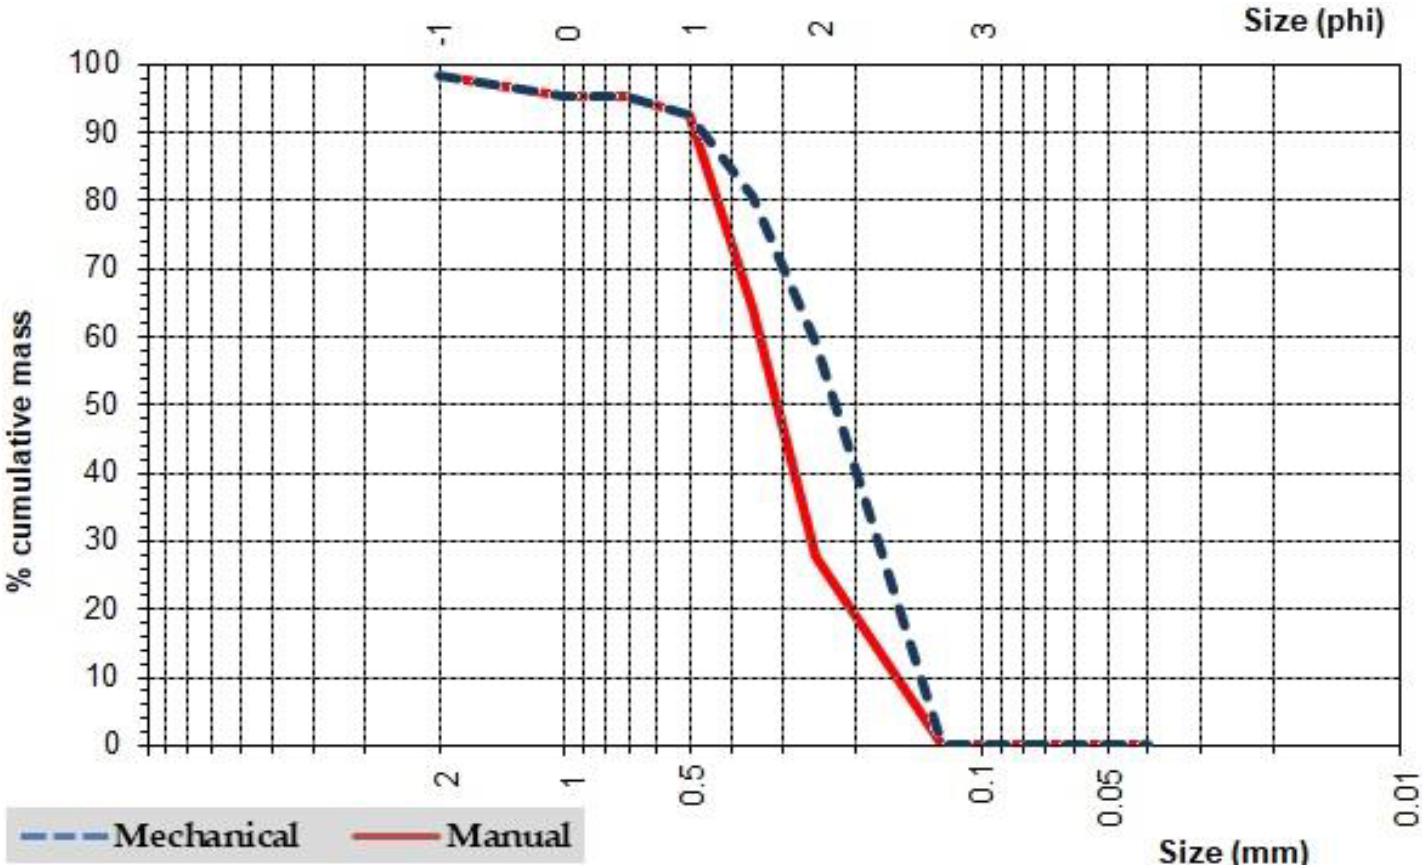
Figure 4. Comparison of the granulometric curves of sand sample 17 (particle size in mm and phi units) for both mechanical and manual sieving.
Sieving Time
Román-Sierra et al. (2013) established that a mechanical sieving performance of 10 min is sufficient to obtain the same results as with a 20 min sieving duration. However, their sieving analysis was performed using 20 cm diameter sieves, whereas in this study the sieves were smaller (10 cm diameter). For this reason, the samples with the highest differences were analyzed by both manual and mechanical shaking during 15, 20, 25, and 30 min (Figure 5), to determine how long a sand sample should be shaken manually for, using small diameter sieves, to acquire (if possible) similar results to those obtained with the mechanical sieving method.
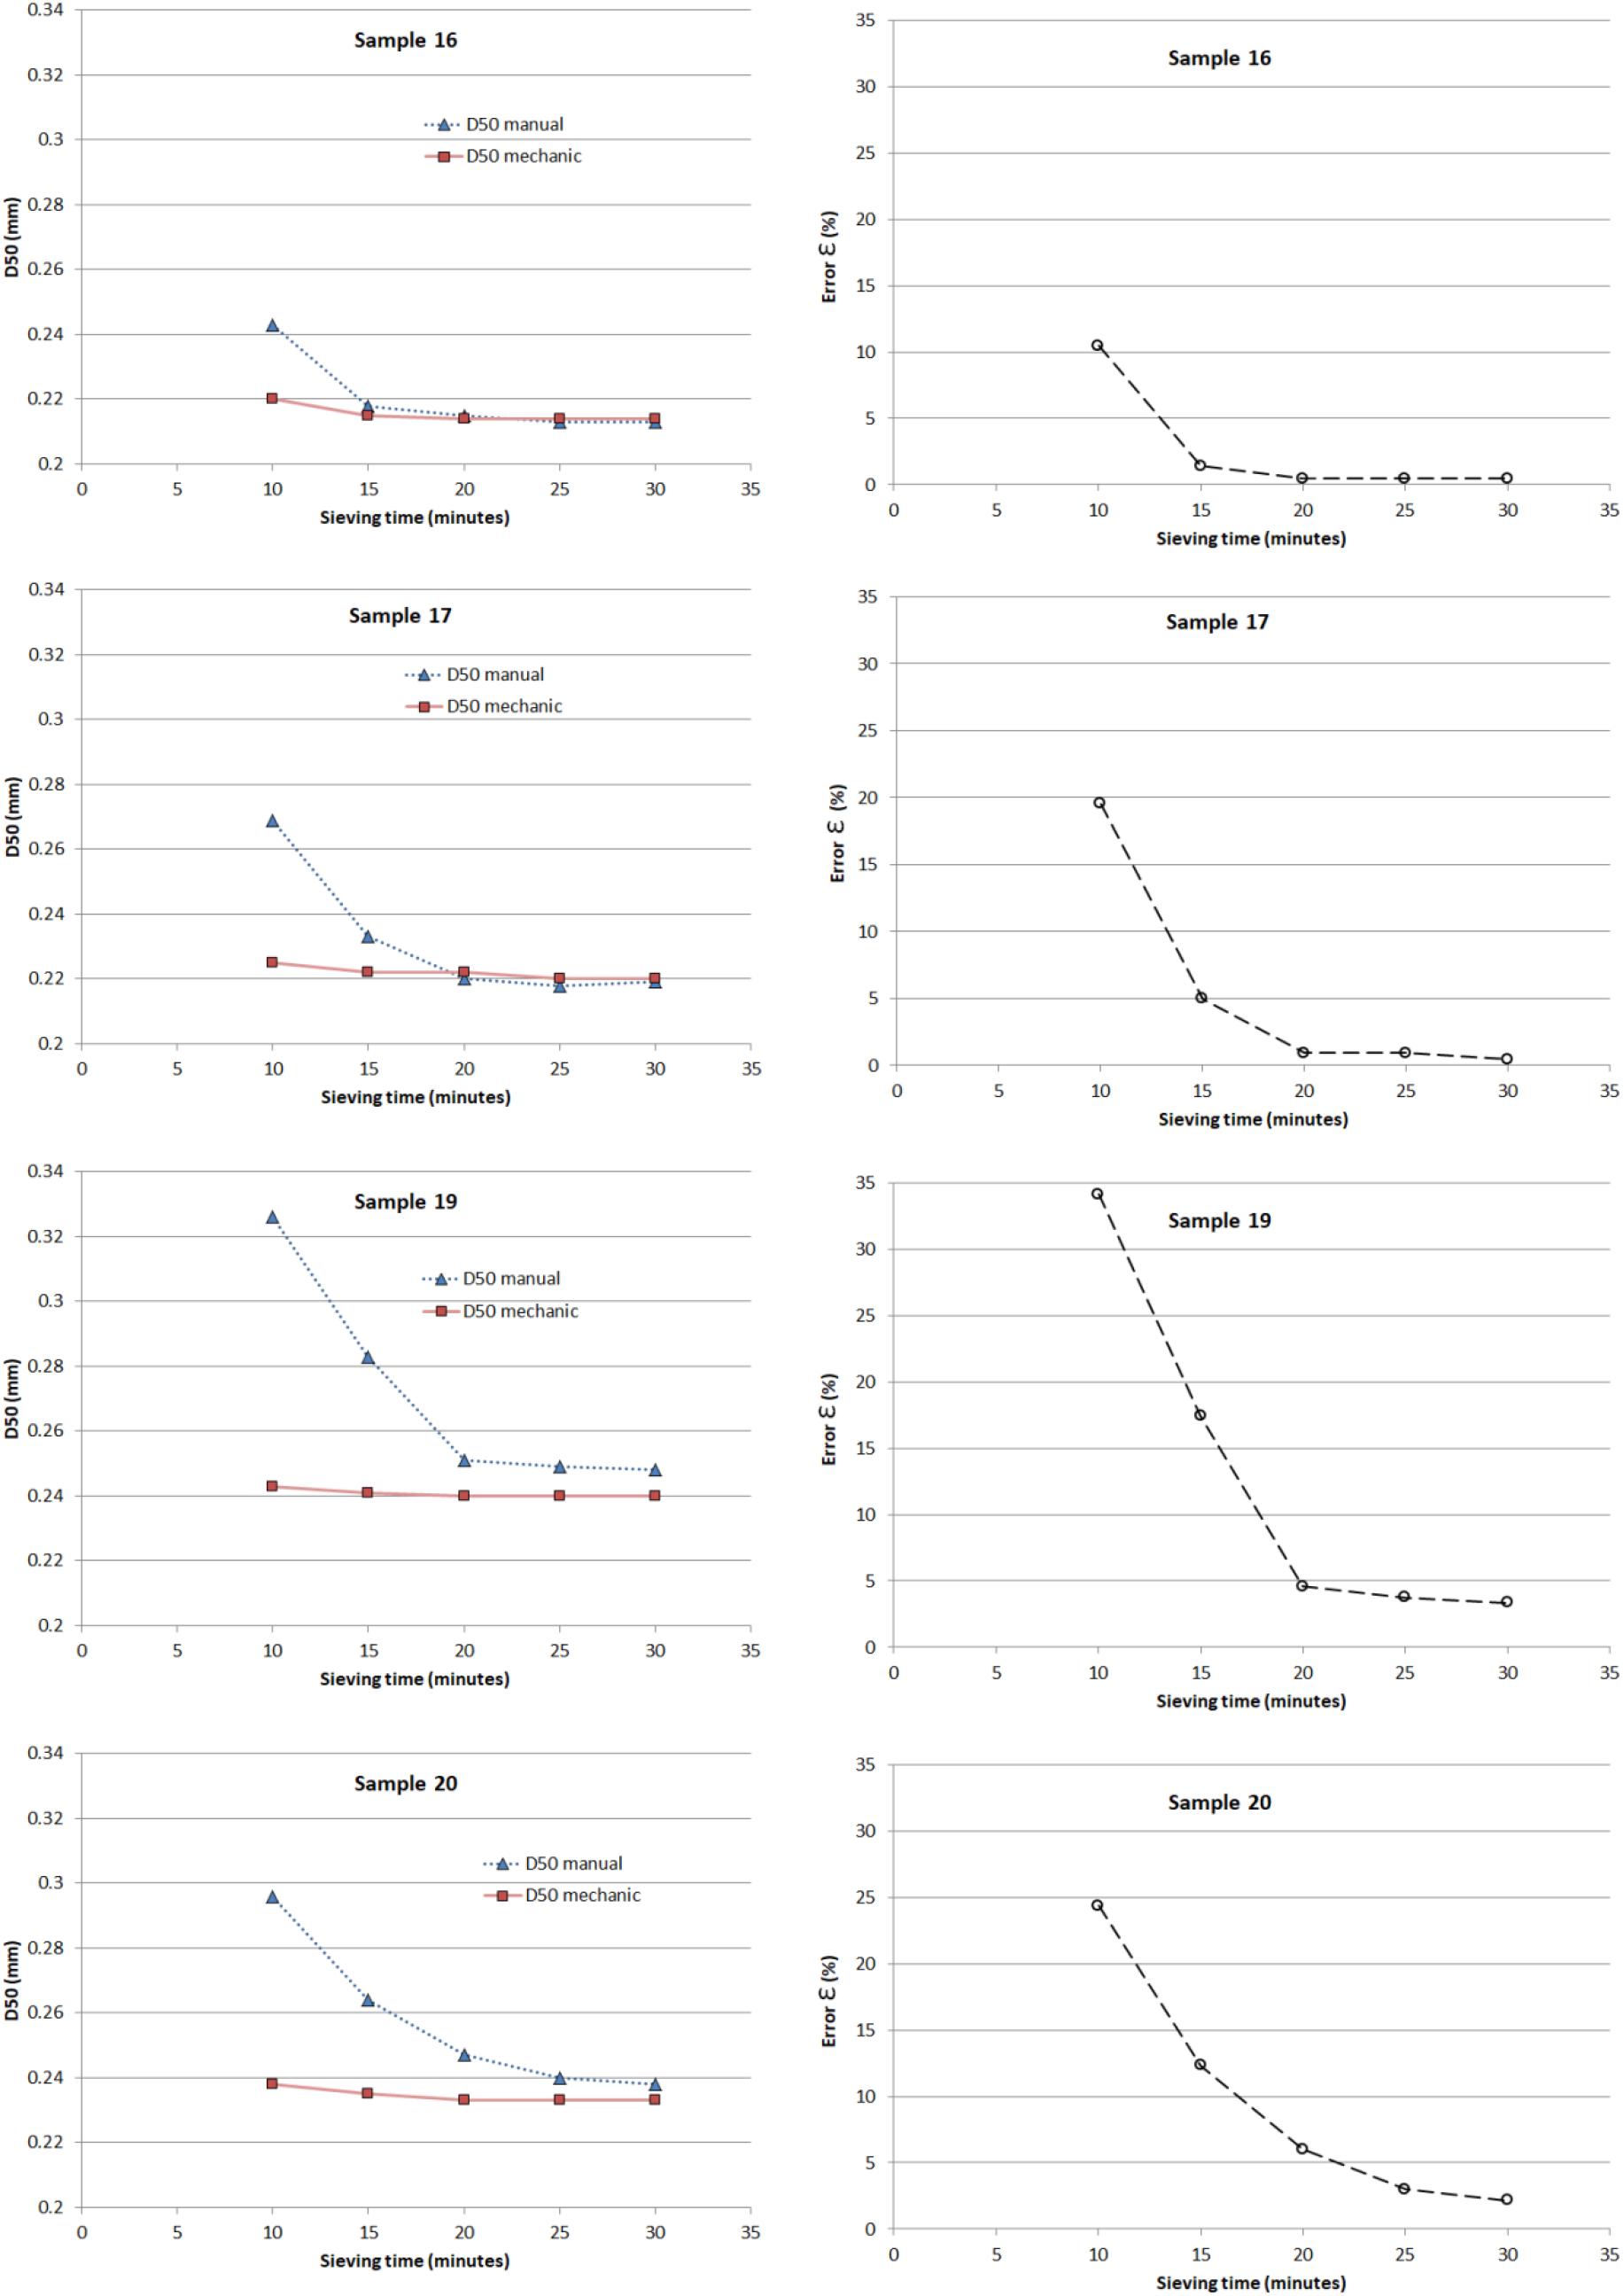
Figure 5. Results of D50 from samples 16, 17, 19, and 20 sieved during 10, 15, 20, 25, and 30 min, respectively, with mechanical and manual procedures, and their respective errors (%).
Figure 5 depicts how D50 values decrease with increasing sieving time but stabilize after 20 min of shaking. Therefore, sand samples should be shaken manually during 20 min in small diameter sieves to obtain good results, as the relative errors were as little as < 5% after 20 min in all cases. Longer sieving times did not substantially improve the results. These results demonstrate that 10 min of sieving was not enough to obtain reliable results when manually shaking samples with 10 cm diameter sieves. Nevertheless, there was no problem as long as a manual sieving time of 20 min was guaranteed. Thus, here is a possible solution to the rejection of the small sieves according to the statement by Poullet et al. (2019b).
Furthermore, when analyzing the differences between sieves, the granulometric curve of sample 17 (Figure 4) was chosen because it was a representative sample that showed a clear example of how the mechanical procedure produced finer sand with more variable sizes. Indeed, it was observed that the larger differences were found around the 0.25 mm sized sand grains.
Tables 2, 3 show average values of D50 and D16 ranging from 0.184 to 0.329 mm, with 14% average error for both. These values correspond to the sieve meshes of 355 and 250 μm, where the highest errors can be found. The average values for D5 are 0.143 and 0.151 mm, with an error of 5.4%. Finally, the D84 and D95 average values range from 0.446 to 0.726 mm, and their errors are 1.3 and 5.4%, respectively. These results demonstrate that sieve meshes above 355 and under 250 μm are not the issue. Regrettably, the average D50 was also about 0.25 mm for the sand in the study zone of the present research.
Sand samples must be shaken manually during 20 min in small diameter sieves to get accurate results, in contrast to the 10 min needed with mechanical sieving (Blott and Pye, 2006) to get the optimal result.
Sorting
The results for the sorting parameter (for both mechanical and manual shaking) showed only a slight difference (almost homogeneous) between both methods (see Figure 3). Although the differences seemed to be minor, the sorting results obtained manually were always smaller than those acquired mechanically. If the sorting was smaller, it meant that the sample was not well sorted because the accumulation of grains with a specific size occurred instead of a more homogeneous spreading of the sand around the average.
Percentage of Shells
The amount of shells in each sample was visually obtained with the help of a microscope. The three upper sieves contained the most shell particles because bioclasts have a larger size than sand sediments. The percentage of shells did not seem to have any correlation with the sorting nor D50 (Figure 3). This might be because the percentages were not high enough to have an influence on the rest of the parameters. Further research should solve this question, for example by studying different values of shell percentages and their possible influence on the sand size parameters.
Overfill Ratio (RA)
Following the procedure established by Poullet et al. (2016) and applying Eq. 2 and 3 in the James method (U.S. Army Corps of Engineers, 1984), the overfill ratio (RA) was obtained for samples 16, 17, 19, and 20 (Table 4). These were the samples with highest values of D50 error when comparing the mechanical and manual sieving methods. These errors reached up to 36.5% in D50.
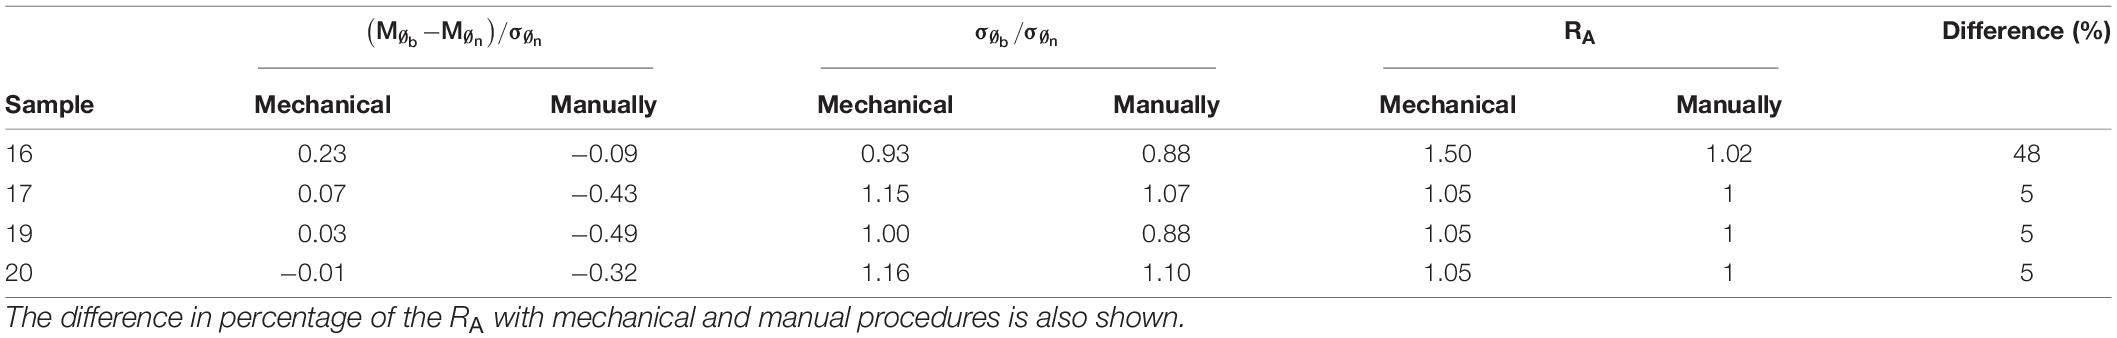
Table 4. Results of equations with the Mean and Sorting parameters of manual and mechanical sieve procedures for the borrowed samples (Mφ b and σφ b) and the native sand (Mφ n and σφ n), and the resulting overfill ratio (RA).
The RA calculated for the mechanically and manually obtained results of Mean and Sorting reached differences up to 5% in volume for samples 17, 19, and 20 and 48% for sample 16. The RA for the mechanical sieving is considered the most accurate and, therefore, the reference value (as previously stated for the D50 results). Looking at sample 16, when the mechanical method is used, an RA of 1.50 indicates the need for an increased volume of dumped sand of 50% to fill the beach. On the other hand, the RA obtained with manual sieving for the same sample 16 is only 1.02, which implies just an increase of 2% volume sand needed for the nourishment: a 48% less volume than the former and more exact calculation. In other words, the manual results showed that the borrowed sand was stable and would not have losses (RA ≈ 1). However, actually, the more accurate mechanical results showed the need for a volume increase of the borrowed sand ranging from 5 to 50%. If the manual sieving for 10 min is chosen, the beach will be filled with less sand than what is really needed.
Although the results presented in this paper are specific to this type of sand, the methodology carried out could be generalized to any other beach worldwide. The variation in the estimation of D50 could be attached to a function with the shaking time. The present study results show quite significant error variations; thus, it has not been possible to obtain a direct transfer function. Therefore, an example of future research lines is in developing a transfer or correction function to improve the manual results, thus reducing the errors. This study was carried out while keeping in mind some possible facts that may induce variations in the results, like the sand drying method. Thus, future works will evaluate how the drying process affects the D50 results. For now, this study provides an alternative to obtain better results with small diameter sieves and the manual shaking method, which is to increase the sieving time for at least 20 min.
Conclusion
Coastal dynamics and littoral geomorphology processes are studied through several analyses that include (among others) the measurement of the main sand size parameters: median grain size (D50) and sorting. Moreover, the accuracy of the results of these sand size parameters is key for successful beach nourishment. Nevertheless, since the analyses must be performed aboard a dredger, and due to the lack of space amongst other difficulties, the sieving method to obtain the results usually involves the manual shaking of small sieves (10 cm diameter). For this reason, 20 samples were taken on board the dredger ship during dredging operations for beach nourishment in the Gulf of Cadiz (SW of Spain), and were sieved using two different methods: mechanical shaking vs. manual shaking.
This study was carried out to help to determine what error is made if manual sieving is chosen instead of mechanical sieving, and if this error is assumable for beach nourishment works. The results showed lower D50 values for the mechanical shaker compared to the manually obtained values. The average D50 error found for this particular case was of 14%, with a maximum of 36.5%. The D50 differences varied between 0 and 0.08 mm, with a mean of 0.038 mm. The representative granulometric curves show that larger differences were found in the sieves with meshes of 355 and 250 μm. This is a problem for this case because the borrow sand also had a D50 of 0.25 mm. Moreover, even though the sorting parameter did not seem to exhibit noteworthy differences between the methods, the mechanical sorting results were always higher, implying a more homogeneous spreading of the sand around the average instead of an accumulation in particular sizes, like with manually sieving.
Hence, despite the mechanical sieving results are the reference due to their higher accuracy obtained with just 10 min of sieving, manual shaking will remain the sieving process on board a dredger ship, and thus, the recommendation to perform the sieving is shaking manually for at least 20 min.
Furthermore, the overfill ratio (RA) was calculated for both manual and mechanical sieving methods; RA reached differences of up to 5% in volume for samples 17, 19, and 20, and 48% for sample 16. Accordingly, if the manual sieving method was performed for beach nourishment purposes when the volume of borrowed sand needed was obtained and dumped on the beach, an unexpected loss of sand may have happened.
Finally, the conclusions highlighted herein are specific for this type of sand. However, this methodology could be applied to beaches worldwide to determine the differences between mechanical and manual sieving results. Next research lines may consist of developing a transfer or correction function with the shaking time and D50 to improve the manual results by reducing the errors. In addition, it was found that the sand drying process in a microwave could be a factor that alters the D50 estimations; therefore, it should be studied in future works.
Data Availability Statement
The original contributions presented in the study are included in the article/supplementary material, further inquiries can be directed to the corresponding author/s.
Author Contributions
PL-G, JM-P, and AC contributed to conception and design of the study. JS and JR organized the database. PL-G, JV, and BJ performed the statistical analysis. PL-G and JM-P wrote the first draft of the manuscript. AC and FC wrote sections of the manuscript. All authors contributed to manuscript revision, read, and approved the submitted version.
Conflict of Interest
The authors declare that the research was conducted in the absence of any commercial or financial relationships that could be construed as a potential conflict of interest.
Publisher’s Note
All claims expressed in this article are solely those of the authors and do not necessarily represent those of their affiliated organizations, or those of the publisher, the editors and the reviewers. Any product that may be evaluated in this article, or claim that may be made by its manufacturer, is not guaranteed or endorsed by the publisher.
References
Armstrong, S. B., Lazarus, E. D., Limber, P. W., Goldstein, E. B., Thorpe, C., and Ballinger, R. C. (2016). Indications of a positive feedback between coastal development and beach nourishment. Earths Future 4, 626–635. doi: 10.1002/2016EF000425
Austin, L. G., and Shah, I. (1983). ‘A method for inter-conversion of microtrac and sieve size distributions’. Powder Technol. 35, 271–278. doi: 10.1016/0032-5910(83)87018-1
Bascom, W. N. (1951). The relationship between sand size and beach-face slope. Trans. Am. Geophys. Union 32:866. doi: 10.1029/TR032i006p00866
Bernabeu Tello, A. M., Santamaría, R. M., and Pascual, C. V. (2002). ‘An equilibrium profile model for tidal environments. Sci. Mar. 66, 325–335. doi: 10.3989/scimar.2002.66n4325
Blott, S. J., and Pye, K. (2001). ‘Gradistat: a grain size distribution and statistics package for the analysis of unconsolidated sediments. Earth Surf. Process. Landforms 26, 1237–1248. doi: 10.1002/esp.261
Blott, S. J., and Pye, K. (2006). Particle size distribution analysis of sand-sized particles by laser diffraction: an experimental investigation of instrument sensitivity and the effects of particle shape. Sedimentology 53, 671–685. doi: 10.1111/j.1365-3091.2006.00786.x
Celia Magno, M., Venti, F., Bergamin, L., Gaglianone, G., Pierfranceschi, G., and Romano, E. (2018). A comparison between Laser granulometer and sedigraph in grain size analysis of marine sediments. Measurement 128, 231–236. doi: 10.1016/j.measurement.2018.06.055
Choi, J., Park, J., Choi, J., and Lee, J. (2016). ‘Effects of beach nourishment and the influence of irrigation water discharge on byunsan beach, west coast, korea. Irrigation Drainage 65, 239–245. doi: 10.1002/ird.2048
de Villar, A. C., Gómez-Pina, G., Muñoz-Pérez, J. J., Contreras, F., López-García, P., and Ruiz-Ortiz, V. (2019). ‘New design parameters for biparabolic beach profiles (SW Cadiz, Spain). Rev. Construccion 18, 432–444. doi: 10.7764/RDLC.18.3.432
Eberhard, L., Schindler, H. J., Hellmann, D., Schmitter, M., Rammelsberg, P., and Giannakopoulos, N. N. (2012). ‘Comparison of particle-size distributions determined by optical scanning and by sieving in the assessment of masticatory performance. J. Oral Rehabil. 39, 338–348. doi: 10.1111/j.1365-2842.2011.02275.x
Fenster, M. S., Dolan, R., and Smith, J. J. (2016). Grain-size distributions and coastal morphodynamics along the southern Maryland and Virginia barrier islands. Sedimentology 63, 809–823. doi: 10.1111/sed.12239
Folk, R. L., and Ward, W. C. (1957). ‘Brazos river bar: a study in the significance of grain size parameters’. J. Sediment. Res. 27, 3–26.
Grosskopf, W. G., and Kraus, N. C. (1993). Guidelines For Surveying Beach Nourishment Projects., CETN II-31. Vicksburg, MS: U.S. Army Engineering Water Experiment Station.
Grottoli, E., Bertoni, D., and Ciavola, P. (2017). Short- and medium-term response to storms on three Mediterranean coarse-grained beaches. Geomorphology 295, 738–748. doi: 10.1016/j.geomorph.2017.08.007
Hallin, C., Huisman, B. J. A., Larson, M., Walstra, D. J. R., and Hanson, H. (2019). Impact of sediment supply on decadal-scale dune evolution — Analysis and modelling of the Kennemer dunes in the Netherlands. Geomorphology 337, 94–110. doi: 10.1016/j.geomorph.2019.04.003
James, W. R. (1975). Techniques In Evaluating Suitability Of Borrow Material For Beach Nourishment, Technical Memorandum No. 60. Washington DC: Coastal Engineering Research Center (U.S.).
Karambas, T. V., and Samaras, A. G. (2014). Soft shore protection methods: the use of advanced numerical models in the evaluation of beach nourishment. Ocean Eng. 92, 129–136. doi: 10.1016/j.oceaneng.2014.09.043
Konert, M., and Vandenberghe, J. (1997). Comparison of laser grain size analysis with pipette and sieve analysis: a solution for the underestimation of the clay fraction. Sedimentology 44, 523–535. doi: 10.1046/j.1365-3091.1997.d01-38.x
Krumbein, W., and Pettijohn, F. (1938). ‘Manual of Sedimentary Petrography’. Available online at: https://agris.fao.org/agris-search/search.do?recordID=US201300427427 (Accessed April 18, 2021).
Larson, M., and Kraus, N. C. (1991). Mathematical modeling of the fate of beach fill. Coast. Eng. 16, 83–114. doi: 10.1016/0378-3839(91)90054-K
Luisa Martinez, M., Silva, R., Lithgow, D., Mendoza, E., Flores, P., Martínez, R., et al. (2017). Human impact on coastal resilience along the coast of veracruz, mexico. J. Coast. Res. 77, 143–153. doi: 10.2112/SI77-015.1
Lund-Hansen, L. C., and Oehmig, R. (1992). Comparing sieve and sedimentation balance analysis of beach, lake and eolian sediments using log-hyperbolic parameters. Mar. Geol. 107, 139–142, IN17–IN18, 143–147. doi: 10.1016/0025-3227(92)90072-P
Mizutani, S. (1963). A theoretical and experimental consideration of accuracy of sieving analysis. J. Earth Sci. 11, 1–27.
Muñoz-Perez, J. J., Gomez-Pina, G., and Enriquez, J. (2009). Comments on “An approximation to short-term evolution and sediment transport pathways along the littoral of Cadiz Bay (SW Spain)” by Anfuso and et al. (Environ Geol 56:69-79). Environ. Earth Sci. 59, 477–479. doi: 10.1007/s12665-009-0031-7
Muñoz-Pérez, J. J., Mas, J. M., Naranjo, J. M., Torres, E., and Fages, L. (2000). Position and monitoring of anti-trawling reefs in the Cape of Trafalgar (Gulf of Cadiz, SW Spain). Bull. Mar. Sci. 67, 761–772.
Muñoz-Pérez, J. J., Payo, A., Román-Sierra, J., Navarro, M., and Moreno, L. (2012). Optimization of beach profile spacing: An applicable tool for coastal monitoring. Sci. Mar. 76, 791–798. doi: 10.3989/SCIMAR.03417.15A
Orrú, C., Chavarrías, V., Uijttewaal, W. S. J., and Blom, A. (2013). ‘Image analysis for measuring stratigraphy in sand-gravel laboratory experiments’, Earth Surface Dynamics Discussions. Copernicus GmbH 1, 973–1018. doi: 10.5194/esurfd-1-973-2013
Pendleton, L., Mohn, C., Vaughn, R. K., King, P., and Zoulas, J. G. (2012). Size matters: the economic value of beach erosion and nourishment in southern california. Contem. Econ. Policy 30, 223–237. doi: 10.1111/j.1465-7287.2011.00257.x
Pope, L., and Ward, C. (1998). Manual on Test Sieving Methods’, in Science & Mathematics. West Conshohocken, PA: ASTM.
Poullet, P., Muñoz-Perez, J. J., Poortvliet, G., Mera, J., Contreras, A., and Lopez, P. (2019b). ‘Influence of different sieving methods on estimation of sand size parameters. Water 11:876. doi: 10.3390/w11050879
Poullet, P., Muñoz-Perez, J. J., Lopez, P., García-Lopez, S., Martell, R., Silva, R., et al. (2019a). ‘Sand size variability inside the hopper of a trailing suction dredger for beach nourishment purposes’. Geo Mar. Lett. 39, 513–520. doi: 10.1007/s00367-019-00615-w
Poullet, P., Munoz-Perez, J. J., Mera, J., and Moreno, L. (2016). “Sand size variability inside the hopper of a trailing suction dredger in regards to beach nourishment projects,” in Proceedings of the 3rd International Conference on Coastal Zone Engineering and Management in the Middle East (Arabian Coast 2016), Dubai.
Pranzini, E., Anfuso, G., and Muñoz-Perez, J. J. (2018). A probabilistic approach to borrow sediment selection in beach nourishment projects. Coast. Eng. 139, 32–35. doi: 10.1016/j.coastaleng.2018.05.001
Remo, J. W. F., Heine, R. A., and Ickes, B. S. (2016). Particle size distribution of main-channel-bed sediments along the upper Mississippi River, USA. Geomorphology 264, 118–131. doi: 10.1016/j.geomorph.2016.04.012
Román-Sierra, J., Muñoz-perez, J. J., and Navarro-Pons, M. (2013). Influence of sieving time on the efficiency and accuracy of grain-size analysis of beach and dune sands. Sedimentology 60, 1484–1497. doi: 10.1111/sed.12040
Roman-Sierra, J., Navarro, M., Muñoz-Perez, J. J., and Gomez-Pina, G. (2011). ‘Turbidity and other effects resulting from trafalgar sandbank dredging and palmar beach nourishment. J. Waterway Port Coast. Ocean Eng. 137, 332–343.
Saponieri, A., Valentini, N., Di Risio, M., Pasquali, D., and Damiani, L. (2018). Laboratory investigation on the evolution of a sandy beach nourishment protected by a mixed soft-hard system. Water (Switzerland) 10:1171. doi: 10.3390/w10091171
Shillabeer, N., Hart, B., and Riddle, A. M. (1992). ‘The use of a mathematical model to compare particle size data derived by dry-sieving and laser analysis. Estuar. Coast. Shelf Sci. 35, 105–111. doi: 10.1016/S0272-7714(05)80059-9
Singh, M., Singh, I. B., and Müller, G. (2007). Sediment characteristics and transportation dynamics of the Ganga River. Geomorphology 86, 144–175. doi: 10.1016/j.geomorph.2006.08.011
Steidtmann, J. R. (1982). Size-density sorting of sand-size spheres during deposition from bedload transport and implications concerning hydraulic equivalence. Sedimentology 29, 877–883. doi: 10.1111/j.1365-3091.1982.tb00090.x
Syvitski, J. P. M. (1991). Principles, Methods and Application of Particle Size Analysis, ed. J. P. M. Syvitski (Cambridge: Cambridge University Press), doi: 10.1017/CBO9780511626142
U.S. Army Corps of Engineers (1984). Shore Protection Manual. Vicksburg, MS: Coastal Engineering Research Center.
Keywords: sieving, sand size, D50, sand parameters, beach nourishment
Citation: Lopez-Garcia P, Muñoz-Perez JJ, Contreras A, Vidal J, Jigena B, Santos JJ, Romero J and Contreras F (2021) Error on the Estimation of Sand Size Parameters When Using Small Diameter Sieves and a Solution. Front. Mar. Sci. 8:738479. doi: 10.3389/fmars.2021.738479
Received: 08 July 2021; Accepted: 26 August 2021;
Published: 14 September 2021.
Edited by:
Rodolfo Silva, National Autonomous University of Mexico, MexicoReviewed by:
Mireille Escudero, National Autonomous University of Mexico, MexicoEdgar Mendoza, National Autonomous University of Mexico, Mexico
Inmaculada Rodríguez-Santalla, Rey Juan Carlos University, Spain
Copyright © 2021 Lopez-Garcia, Muñoz-Perez, Contreras, Vidal, Jigena, Santos, Romero and Contreras. This is an open-access article distributed under the terms of the Creative Commons Attribution License (CC BY). The use, distribution or reproduction in other forums is permitted, provided the original author(s) and the copyright owner(s) are credited and that the original publication in this journal is cited, in accordance with accepted academic practice. No use, distribution or reproduction is permitted which does not comply with these terms.
*Correspondence: Patricia Lopez-Garcia, cGF0cmljaWEubG9wZXpnYXJjaWFAdWNhLmVz