 Vo Thi Kim Khuyen
 Dinh Vu Le2*
- 1Faculty of Environmental Sciences, Institute of Waste Management and Circular Economy, Technische Universität Dresden, Pirna, Germany
- 2Faculty of Chemical Engineering, Industrial University of Ho Chi Minh City, Ho Chi Minh City, Vietnam
- 3Institute of Environmental Science, Engineering and Management, Industrial University of Ho-Chi-Minh City, Ho Chi Minh City, Vietnam
Microplastics (MPs) are synthetic polymer pieces with a size of less than 5 mm that are ubiquitous in the marine environment. They have been recently detected in several wild species and sea products. An indispensable condiment in human food is marine salt that is produced from seawater. Since toxicity studies report potential health impacts when plastic debris is ingested, more attention must be paid to the MP contamination of sea salt and the underlying reasons for this. The central aim of this study is to evaluate the MPs contamination level of sea salt in correlation with the MPs contamination level of seawater in Vietnamese areas. Micro-Raman spectroscopy was employed to determine MPs in the samples collected from three artificial salt pans of Vietnam. The result revealed the presence of MPs in all study areas—Vung Tau (VT;14.54 MPs/L seawater and 114.67 MPs/kg salt), Ly Nhon (LN; 13.14 MPs/L seawater and 63.59 MPs/kg salt), and Can Thanh (9.42 MPs/L seawater and 93.69 MPs/kg salt). The comparisons highlight close correlations in the percentage, shape, size, and color of MPs, especially polyethylene, polyethylene terephthalate, and polypropylene particles extracted from the seawater and its salt. This study proved that seawater is a plastic pollution source for salts produced by traditional seawater evaporation. The study also alerts the prevalence of MPs in the environment and human consumables, thereby indicating that actions must be taken to reduce the pollution of water sources in Vung Tau and at the UNESCO Can Gio Mangrove Biosphere Reserve and improve salt production and refinery processes in order to minimize the number of MPs in final salt products for safe consumption.
Introduction
Since the first synthetic plastics were launched in the market, they have been widely manufactured in various forms for household uses and almost all industrial applications, thereby leading to “the plastic era” nowadays. The advantages and convenience of plastic products—such as being lightweight, durable, and low cost—are undeniable; however, human health impacts caused by plastic additives have been widely reported, such as dermatitis, endocrine disruption, and cancer (Godswill and Godspel, 2019). Although many actions have been taken to reduce plastic use, global plastics production has continued to increase from 335 million tons in 2016 to 370 million tons in 2020 (PlasticsEurope, 2018, 2020). Moreover, Asian countries continue to have a high proportion of the world’s plastic production, accounting for 17% (not including China) (PlasticsEurope, 2020). Plastic wastes have aggravated environmental pollution because they continuously degrade into small pieces of micro- and nano-sizes, generally called microplastics (MPs). They have become a ubiquitous ocean pollutant, and their elimination from the aquatic environment has, thus, become more challenging. There are different definitions and classifications of MPs, but the term MP generically refers to any plastic pieces less than 5 mm in size. Although the concept of MPs was proposed in 2004 (Thompson et al., 2004), the current knowledge on MP behaviors and impacts limited thus far. Humans have benefited from the marine environment for food and income. The plastic debris in the aquatic ecosystem is undoubtedly transferred to sea products. MPs have been found in various marine organisms such as fish and bivalves, finding their way into the human body through the food chain (Li et al., 2016; Steer et al., 2017).
Salts are produced from different sources such as saline rocks, saline wells, saline lakes, and the sea (Yang et al., 2015). Millions of years ago, salt was eaten as a regular spice with a meager total consumption amount of less than 0.25 g/day (Suckling and Swift, 2015). The WHO recommends a healthy level of 5.1 g of salt, equivalent to 2 g sodium per day for an adult (Suckling and Swift, 2015); however, the current global salt consumption levels are on the threshold of double excess, including Vietnam where the figure is at 10 g/day (Jensen et al., 2018). Vietnam has a long coastline of over 3,260 km, and table salts are produced by the evaporation of seawater throughout the country, particularly in Ca Na (Ninh Thuan), Sa Huynh (Quang Ngai), and Long Dien (Vung Tau, VT). Over 50% of salt production is done using traditional methods, which rely mainly on natural conditions. Recently, Can Gio salts crystallized from brackish seawater at Can Gio Mangrove, especially in Ly Nhon (LN), and Can Thanh (CT) towns, have caught the attention of consumers. The salt fields include a series of evaporation ponds with increasing salinities where seawater circulates and evaporates under the effects of wind and sunlight. The saline water crystallizes into concentrated thick brine pellets of size 0.5–10 mm for 9–15 days; farmers these brine pellets into piles of salt and let them dry in the air.
Sea salt is the main abiotic sea product and may contain anthropogenic contaminants from seawater that may remain during the crystallization processes. As far as the authors are aware, the present study is the first to identify MPs in salt directly produced at Vietnam’s mangrove biosphere reserve using micro-Raman spectroscopy. Although several extant studies have reported the presence of MPs in commercial marine salts—such as in Spain (Iñiguez et al., 2017), Italia (Renzi and Blaskovic, 2018), Turkey (Gündoğdu, 2018), India (Seth and Shriwastav, 2018), Taiwan (Lee et al., 2019), China (Yang et al., 2015), and Vietnam (Kim et al., 2018; Khuyen et al., 2021a)—the sea-based pollution source of MP is only a hypothesis and has not been well-proven. Therefore, this study aims to prove this hypothesis by investigating MP pollution in seawater and its salt products in VT and Can Gio and observing the correlations between plastic compositions in salt and seawater. This study can serve as the basis for reporting the MP pollution in the transition zone of the UNESCO Can Gio Mangrove Biosphere Reserve and alerting society regarding the MP contamination in sea salts.
Materials and Methods
Sample Collection Methods
The sampling was carried out in February 2021 (the dry season in Vietnam) at Long Dien, VT, Vietnam (10.4561°N, 107.2106°E), and in the transition zone of UNESCO Can Gio Biosphere Reserve—CT (10.4026°N, 106.9410°E), and LN (10.4877°N, 106.7661°E). Sea salts in Long Dien were crystalized naturally from the seawater ponds without any chemicals (Figure 1). In Can Gio, potassium alum [KAl(SO4)2.12H2O] (Sigma Aldrich) was added in seawater ponds during the crystalized process to remove impurities, and PE tarpaulins were used to place at the bottom of the salt crystallization pond to prevent the contamination with soil and sand grains.
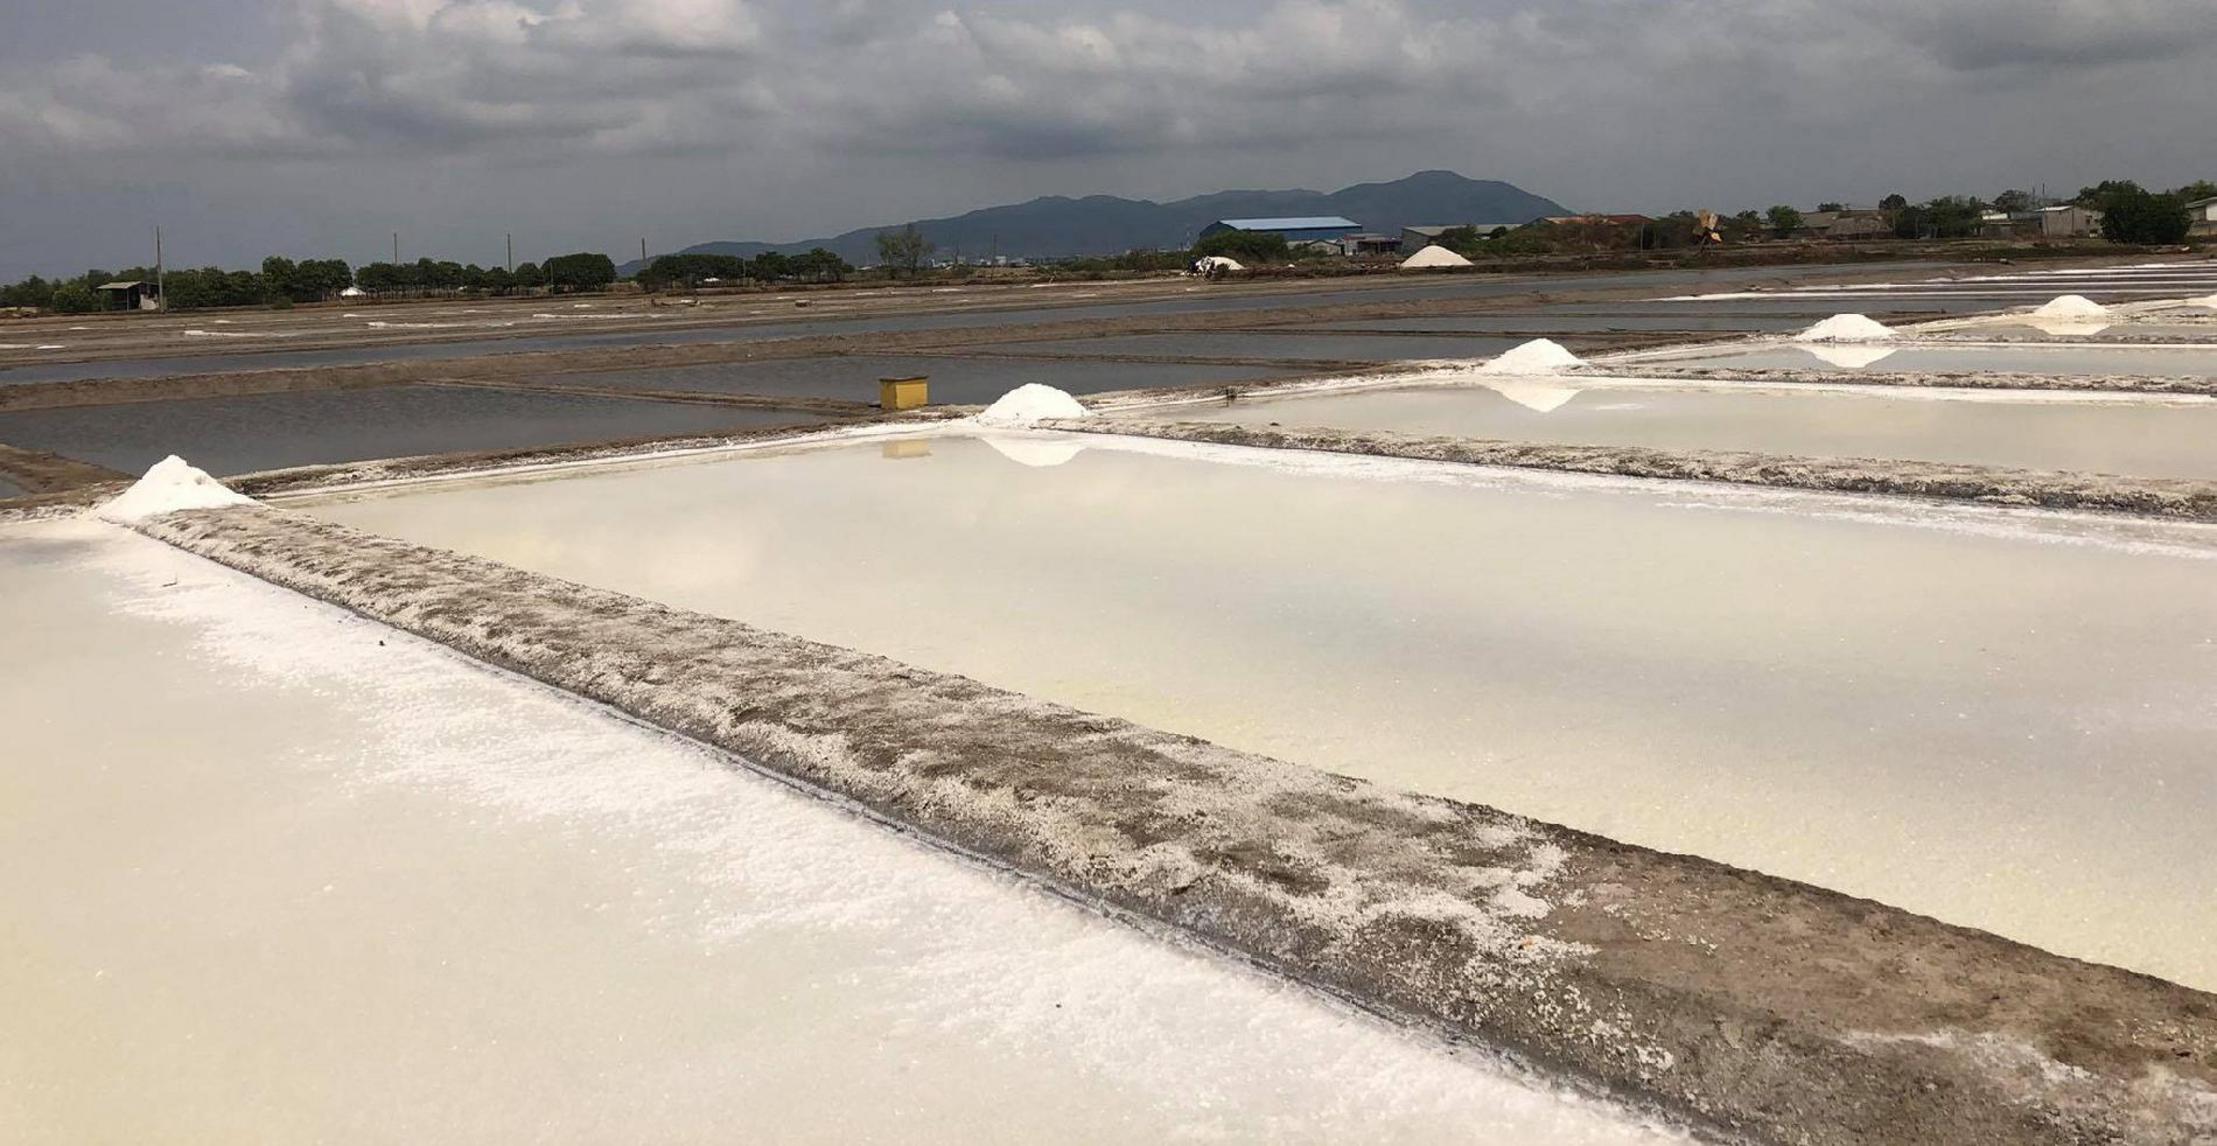
Figure 1. Typical solar salt production fields in Vietnam.
Filtered deionized water (FDW) used in this study was deionized water pre-filtered through 0.4-μm filter membrane (Sigma Aldrich) with the support of a vacuum filtration system. All sampling containers and tools used for sampling were washed with FDW and dried at 110°C for 1 h. In each sampling region (VT, CT, and LN), 15 coarse salt samples (2 kg per sample) were collected randomly in different salt pans, as suggested by Selvam et al. (2020). Each salt sample was stored in a glass box at 4°C for further analysis.
Seawater samples used in this study were collected from the shore, where the water was pumped to the fields for salt crystallization. Bulk sampling was used in the same way in several previous studies (Lusher et al., 2014; Su et al., 2016; Lahens et al., 2018). Fifteen seawater samples (1 L per sample) for 15 replicate analyses in each region were taken, then stored in a glass bottle at 4°C for further analysis. In addition, one glass bottle containing 1 L deionized water (opening) was placed at each seawater sampling site during the sampling collection as a field control sample.
Sample Preparation Procedures
About 1 L of seawater was directly vacuum filtered through glass fiber membrane filter (47-mm diameter, 1.6-μm pore size, GF/A, Whatman, GE Healthcare). Visible items on the filter paper were picked up, cleaned with FDW, and stored for direct analysis. All remain materials on the filter paper were immediately washed off with 200 ml FDW, and the final volume of the obtained solution supernatant containing MPs was about ∼200 ml. The supernatant was then oxidized with 5 ml 30% hydrogen peroxide (H2O2; Avantar VWR) at 70°C–80°C until the solution was discolored (usually 30 min), and the mixture was incubated at room temperature for 24 h. Finally, MPs were separated by filtering the solution and analyzed by Raman microscopy.
About 200 g salt of each sample was dissolved with FDW in a glass bottle and then prepared following by our previous work (Khuyen et al., 2021a). Briefly, the saturated saline solution was oxidized with 10 ml 30% H2O2 at 70–80°C until the solution was transparent. The mixture was cooled at room temperature for 24 h before MP extraction. All filter membranes were kept in Petri dishes, carefully wrapped, and let for drying at room temperature for further analysis.
Microplastic Analysis
The whole area of the filter membrane was firstly observed by ZEISS Stemi 508 stereomicroscope to identify the position of potential MPs. Then, every individual MP was analyzed by the micro-Raman spectrometer (XploRA Horiba) with a 532-m excitation laser and 50× objective. Raman spectrums were recorded in wavenumbers ranging from 50 to 3,600 per cm with an acquisition time of 15 s and a grating of 900 groves per mm of the Raman mode to identify its polymer type. The shape, color, and size were characterized under the microscopic mode at 10× resolution. The number of pieces was counted manually and categorized according to polymer type, shape, and color. The shapes were defined according to Tanaka and Takada (2016) with some modifications: (1) fibers—thread-like shape produced by fragmentation of clothing, furnishings, and fishing ropes; (2) bars, sticks—thread-like shape with higher width and smaller length than fibers; (3) beads—particles from micro-sized products with either spherical or aggregate of spheres; (4) fragments—particles produced by the breakdown of unknown larger materials; (5) films—fragments of thin polymer-derived wrapping paper or bags and so on. The other shapes are foams, pellets (granules with the shape of a cylinder or a disk manufactured as a raw material of plastic goods), and uncalled shapes are sorted into “other” groups because only a few are found in every place.
The clean filter membranes on glass Petri dishes were prepared as airborne control samples, and the waterborne control samples were 500 ml FDW. These samples were placed in the working area during the sampling handling and vacuum filtering stages. All the blank samples, including field control samples, were analyzed comparably with the actual samples. No microfibers were found on the controls, suggesting that fibers encountered in the study were not from clothing used in the laboratory.
Statistical Analysis
Microplastic abundance was expressed as items per kg of salt or per liter of water. ANOVA was employed to determine whether plastic types, particle sizes, and abundance show any differences in salt products and in the seawater between regions. Turkey’s multiple comparison test was used to analyze the mean differences. All statistical analyses were performed at a significance level of 95% by the IBM SPSS v22 software (IBM Corp., Armonk, NY, United States).
Results and Discussion
Microplastic Pollution in the Seawater
The total MP in seawater was 14.54 ± 1.78 MPs/L (n = 27), 13.14 ± 2.01 MPs/L (n = 55), and 9.42 ± 1.93 MPs/L (n = 36) in VT, LN, and CT, respectively. The results of the ANOVA revealed no significant differences in the total MP amount among the regions studied (Supplementary Table 1). Although LN and CT belong to the Can Gio biosphere reserve protected by UNESCO, intensive aquaculture farming and domestic activities have released untreated wastewater into the adjacent seawater (Anh et al., 2016), which could be diluted naturally in the marine environment and pumped into salt production ponds. VT is a populated city; therefore, the seawater samples contained higher MPs. However, the pollution here is much lower than that in the Saigon-Dong Nai river (22–251 MPs/L) (Strady et al., 2020), which flows into the Can Gio mangrove. Compared with other studies, the MPs pollution in the southeast regions in Vietnam is higher than that in the Incheon/Kyeonggi Coastal Region in South Korea (1.6 ± 1.3 MPs/L) (Chae et al., 2015), Yangtze Estuary (4.14 ± 2.46) (Zhao et al., 2014), and North Yellow Sea (0.54 ± 0.28) (Zhu et al., 2018) in China. Micro-Raman spectroscopy was used to determine the types of plastic, and their abundance is illustrated in Figure 2. The indeterminate group constituted a maximum of 5% this includes long fibers or a bundle of fibers that were too thin to be detected by a Raman spectrometer.
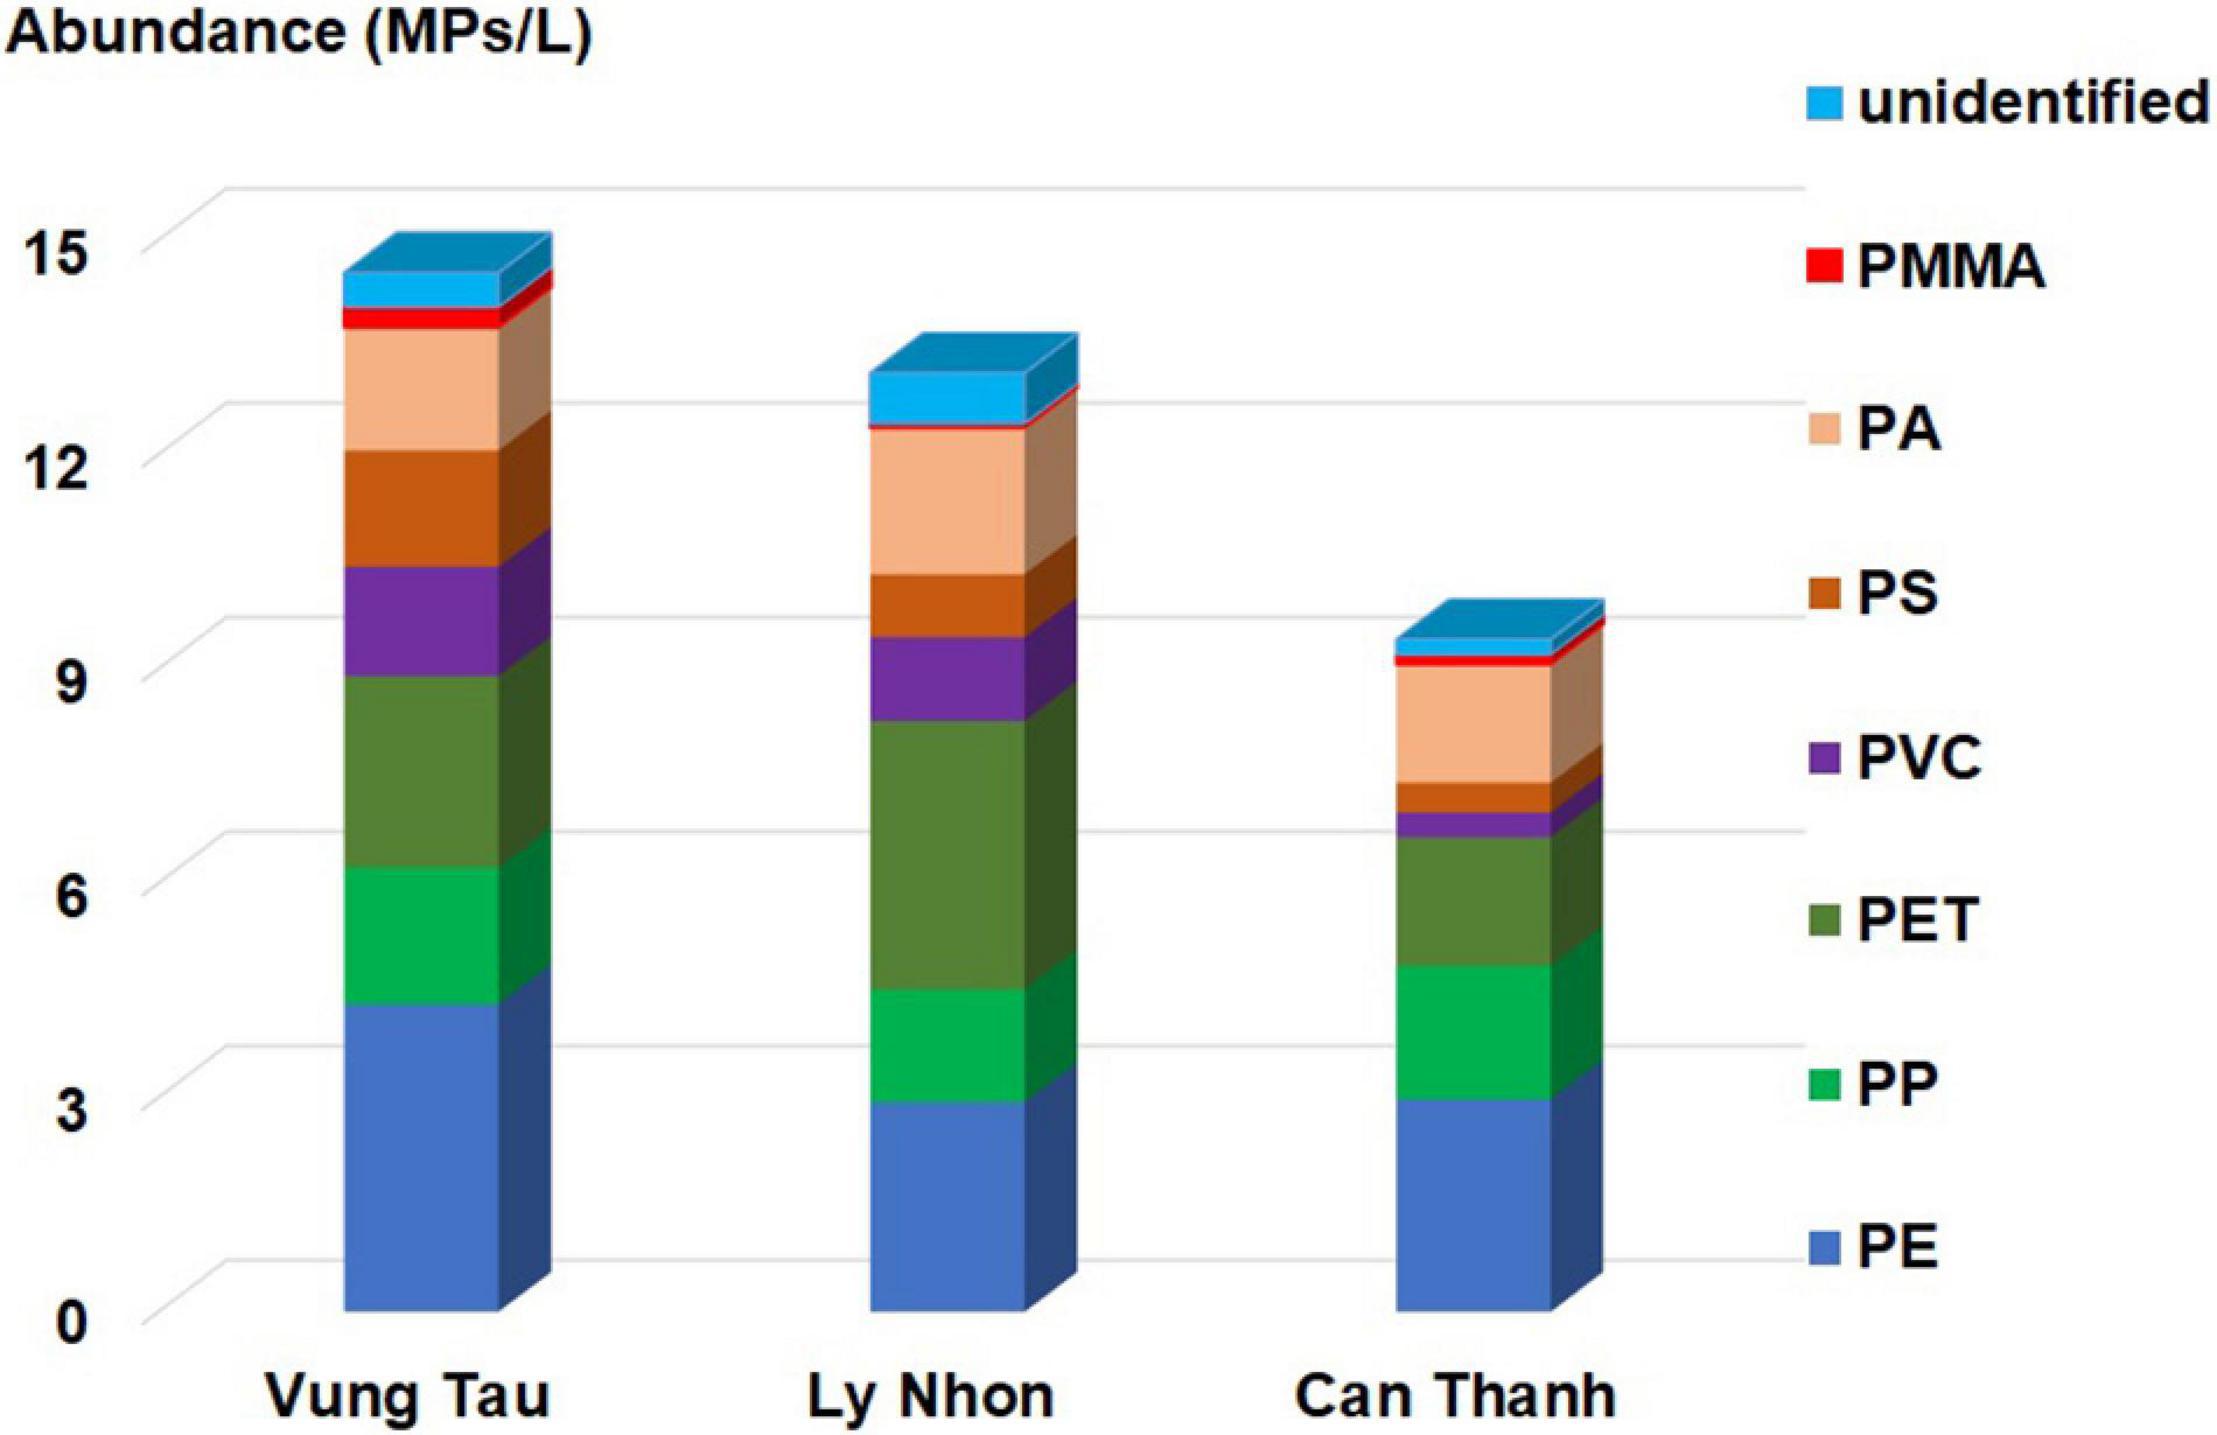
Figure 2. Compositions of microplastics filtered from the seawater samples.
The post hoc test demonstrated no significant difference in plastic compositions in each region and among the three study areas (Supplementary Tables 2a,b). Polyethylene (PE) is not only the most common material used in single-use plastic products such as shopping bags, tableware, and food packaging (Chen et al., 2021) but also in fishing materials (Wessel et al., 2016). Since fishing is one of the main activities of the local people, it is not surprising that this polymer was found in the highest number in seawater from VT and CT in the form of fibers (119.68 μm) and small fragments (35.06 μm). Furthermore, polyethylene terephthalate (PET) was the most frequently found plastic in LN seawater, and the second and third largest group of MPs in VT and CT. It appeared mainly in the form of colored fibers and fragments. Polypropylene (PP) was not a main composition plastic in the seawater at the nearby beach and Cape of Dong Tranh (Khuyen et al., 2021b), but this polymer constituted the third largest group of MPs at the CT salt pan and VT as well. Furthermore, Styrofoam floats have been used for oyster larval settlement in Korea (Choi, 2008). Oyster is intensively cultured in the study areas; however, instead of Styrofoam, fiber-cement roofing sheets and old tires are used in VT and Can Gio, respectively. Moreover, Styrofoam seafood storage boxes are easily broken down and lost in the marine environment due to their buoyancy and stranding abilities (Jayasiri et al., 2013). Therefore, a low number of polystyrene (PS) were detected in this study, compared with a report on the coastal environment in Korea (Lee et al., 2013).
Tukey’s test indicated the remarkable difference in sizes of MPs filtered from VT (50.35 μm on average) and CT seawater (94.86 μm on average) (Supplementary Tables 3a,b). Different natural conditions, such as wave and sunlight intensity, may cause these different degradation degrees. There is also a difference in the percentage of shapes of MPs in VT and Can Gio seawater.
Fibers and fragments were the dominant shapes of MPs, accounting for 29.02 and 31.25% in LN and 35.82 and 25.37% in CT seawater (Supplementary Figure 1). It is difficult to conclude whether fibers originate from textile or fishing nets. The nets and ropes are commonly produced from PA, PP, PET, and PP proposed that the origin of blue nylon fibers is cables used in fishery activities (FAO, 2017; Zhu et al., 2018). Blue was the largest color group of fibers in VT seawater, but only a few of them were identified as nylon. According to certain studies, the sources can be revealed from the size of microfibers. Thin fibers with a diameter of 10–20 μm are typical textile fibers, whereas the larger ones are called monofilaments from fishing ropes (Tanaka and Takada, 2016). Many of the fibers found in our study were thin but long (129.13 μm on average), and of which PET was higher polyamide (PA) and other polymers. Therefore, they are assumed to be fragmented products of clothing and furnishings, as PET accounts for 70% of all polyester fiber production (Geyer et al., 2017). Spherical pellets are usually assumed to be intentionally manufactured primary plastics (GESAMP, 2015; Kunz et al., 2016), and no pellets were found in Can Gio seawater. However, in contrast, one pellet was found in VT seawater. There is an important note that microbeads were the most dominant group (47.37%) in VT seawater (Supplementary Figure 1). They are considered primary MPs, which are released from cosmetics of human use (Nel and Froneman, 2015). Moreover, the film is the third-largest shape group (11.84%), which is possibly fragmented from plastic bags (Sruthy and Ramasamy, 2017). These findings are reasonable because VT is a densely populated and industrial city, and various plastic types are widely used in Vietnam. Furthermore, MPs are believed to be secondary MPs because almost all separated MPs were found in small sizes. They could undergo degradation in the seawater at the high and stable temperature (25.8°C and up to 38°C) during 5–9 sunshine hours every day (Vo and Kuenzer, 2012; Nam et al., 2014). The colors of both microfibers and particles were also affected by the photo-chemical degradation. Several fragments and fibers were found in translucent color, which might be caused by the discoloring action of UV-light (Kunz et al., 2016; Crawford and Quinn, 2017).
Microplastic Contamination in the Sea Salt
The total MPs in sea salt observed were 114.67 ± 19.10 MPs/kg (n = 6), 63.59 ± 7.62 MPs/kg (n = 6), and 93.69 ± 12.90 MPs/kg (n = 18) in VT, LN, and CT, respectively. There was no significant difference among salt production regions (ANOVA, p > 0.05, Supplementary Table 4). In general, VT salt contained a higher number of MPs compared to Can Gio salts, although its seawater sources contained a similar abundance of MP. This highlights the effects of the salt production method on MP contamination in the final products. According to salt production method in Can Gio, a commercial aluminum-based powder with the chemical formula of KAl(SO4)2 12H2O was added in every seawater pond to remove impurities. The use of potassium alum eliminates MPs to a certain extent in the salt. Indeed, coagulation has been reported to remove suspended or floating plastics such as PE and PS (Ma et al., 2018; Skaf et al., 2019; Rajala et al., 2020). The more ponds the seawater flows through, the more MPs can be retained. This may be an important reason why the MP in LN salt (crystallized from 12 ponds) is lower than that in CT salt (crystallized from four ponds). In Vietnam, the salt products are in coarse and refined forms. The coarse salt in Can Gio is distributed on the national market or produced into fine salts and sold in non-branded bags in local markets. The salt refinery cannot completely eliminate MPs because there is still a large number of MPs (56.98 ± 23.81 MPs/kg) in packed fine salts compared with 63.59–93.69 MPs/kg in the input materials (Khuyen et al., 2021a). In addition, MP abundances in coarse marine salts produced in Vietnamese locations of the Pacific Ocean are in a similar range with those crystalized in the Indian Ocean (from 56 ± 49 to 103 ± 39 MPs/kg) (Seth and Shriwastav, 2018) and Atlantic Ocean (95 ± 7 in Lanzarote, 120 ± 7 in Huelva and 140 ± 8 in La Palma) (Iñiguez et al., 2017).
Figure 3 illustrates the unequal concentration of plastic types in each sea salt product. The post hoc test also showed the differences in the abundance of PET and PA among the three regions (Supplementary Tables 5a,b). The relative abundance of PET was rather high among other plastic types in the sea salts collected directly from the salt fields. This finding is similar to our results on Vietnamese commercial table salt (Khuyen et al., 2021a). PET was the most frequently found type in VT (31.39 ± 1.79 MPs/kg) and LN salt (18.78 ± 1.26 MPs/kg), whereas in CT salt, PE was encountered most often (34.48 ± 1.03 MPs/kg). In the Can Gio salt field, PE tarpaulins are used to place at the bottom of the salt crystallization pond to prevent the coarse salt from contaminating soil and sand grains. The degradation of canvases might lead to PE contaminated the salt products. However, the analytical results eliminated this contamination in the morphology, color, and spectral properties. These tarps were black, while almost all MPs fragments were in white with the different Raman spectra. PP is the third common plastic in the sea salt of other countries, such as France, Portugal, and Japan (Karami et al., 2017); Spain (Iñiguez et al., 2017); Turkey (Gündoğdu, 2018); and Senegal, Indonesia, and Thailand (Kim et al., 2018). PA is of special note. It is the second predominant type and is found in the form of PP in VT salt, whereas its abundance is fairly low in Can Gio salts. The percentages of PP, PS, and PA in LN salt were similar to those in CT salts. This could be because the salts were produced with the same salt production method in two towns at Can Gio Biosphere Reserve.

Figure 3. Compositions of microplastics collected from the sea salt.
The total relative abundance varied from 20.24 to 197 MPs/kg in coarse salts produced in three study areas. This range is equivalent to the range given by Kim et al. (2018) (100–200 MPs/kg) in which MPs were identified by the FT-IR method. With the average daily salt intake of 10 g/day (Jensen et al., 2018), at least 265 MP particles are ingested every year by Vietnamese people (Khuyen et al., 2021a). The number of MPs in Chinese sea salts was significantly higher up to 718 particles/kg relevant to 2,620 MPs ingested annually, which according to the Chinese State Oceanic Administration (SOA) resulted from heavy plastic pollution in 81% of coastal regions in the country (Yang et al., 2015; Wang et al., 2019). Salt is one of the most indispensable human consumables, and it is currently consumed with a higher healthy amount, as suggested by WHO. Inappropriate salt/sodium intake has resulted in kidney diseases, hypertension, and mortality (Partearroyo et al., 2019). More seriously, the increasing consumption of MPs-contaminated salt will lead to inevitable combined toxicity due to the adverse effects of plastic additives, metals, and hydrophobic compounds, particularly persistent organic pollutants (POPs) and polycyclic aromatic hydrocarbons (PAHs), absorbed from the environment. PE and PA can change human cell structures by reducing estrogenic chemicals. Daily exposure to PP leads to changes in insulin resistance, and decreased liver and brain function (Smith et al., 2018). Moreover, PET, PS, and its expanded derivatives were reported to cause eye and respiratory irritation, endocrine disruption (Godswill and Godspel, 2019), and cancer (GESAMP, 2015). Polyvinyl chloride (PVC) is also a carcinogenic substance and can cause gene mutation, bronchitis chronic, liver dysfunction, and skin diseases (Nilawati et al., 2020). Poly (methyl methacrylate) (PMMA) is the least commonly found type, but particles from implant materials could induce particle-induced osteolysis (GESAMP, 2015).
Photographs and spectra of typical MPs are depicted in Supplementary Figure 2. The items had homogenous shapes and clear colors but could not be clearly determined by Raman spectra. They are classified into unidentified compositions and vary from 3.5% (CT salt) to 18% (LN salt). The experiments revealed that unidentified items were fibers in dark colors such as black, brown, dark blue, and gray due to the burning or smelting caused when samples absorbed laser beam energy (Young and Elliott, 2016). Several tiny particles could not produce clear Raman bands in this group because they were partially overlapped with sand particles on the filter paper.
Unlike seawater, the size of MPs in all salt samples is fairly equal (Supplementary Table 6), varying from 85.37 to 102.42 μm. This indicates that plastic debris in this range would have largely remained in the salt after the seawater flows through ponds and evaporates. With regard to the shape, slightly more than half of the MPs in VT salt were short fibers (71.25 μm). Fibers were also predominant in Can Gio salt, but their lengths were greater (148.25 μm). This is also observed in the size of fragments and beads. This difference is possibly due to the high efficiency of the alum coagulation in removing very tiny MPs from seawater.
Comparison of characteristics of microplastics in the seawater and sea salt
Plastic waste is considered to be hazardous because its nature limits biodegradation. Instead, such waste breaks down into micro-particles that float or remain suspending in various forms and different size categories in seawater at various depths, depending on the density of the polymer. More plastic solids such as PVC from the seawater tend to settle, whereas low-density MPs such as PE, PP, and Styrofoam are likely buoyant on the surface where they are transported over long distances to remote places (Chubarenko et al., 2016; Nilawati et al., 2020). MPs are also subjected to biofouling and colonization with microorganisms when interacting with biota in the environment. The fragmentation can remove the adhesive materials or change the forms into microfibers. These processes lead to the change in shapes and density (Branca, 2007; Chubarenko et al., 2016), redistribution in the sea levels, and uneven accumulation of each plastic type in marine salt.
In general, PE and PET are the main composition of MPs, followed by PP in both seawater and, as these are the most common materials for single-use plastic products. Approximately 42% of non-fiber plastic types have been used for packaging, of which PE, PP, and PET are predominant (Geyer et al., 2017). PET is the largest group of polyester in textile production, compared with PA, PP, and PVC (Iñiguez et al., 2017; Nilawati et al., 2020). PE and nylon can be used to manufacture fishing lines, and therefore they are not indispensable compositions in the coastal environment. The individual experiments revealed similarity in MPs compositions in both media, as depicted in Figure 4. The first evidence is CT area, where the most dominating composition was PE, followed by PET, PP, PA, PVC, PS, and PMMA. However, PE is not always the largest polymer group. It depends on the discharging sources, activities of the local community, and the intrinsic distribution of each MP particle that is affected by natural factors such as wind, waves, and tides. In the LN area, PET accounted for the highest percentage; again, there is a similar trend here in the plastic compositions in seawater and salt, PET, PE, and PVC. There is a difference in the proportion of other plastic types, but it is not remarkable. As PMMA was found in very few numbers, the possibility of transporting this polymer into salt, is therefore, not high.
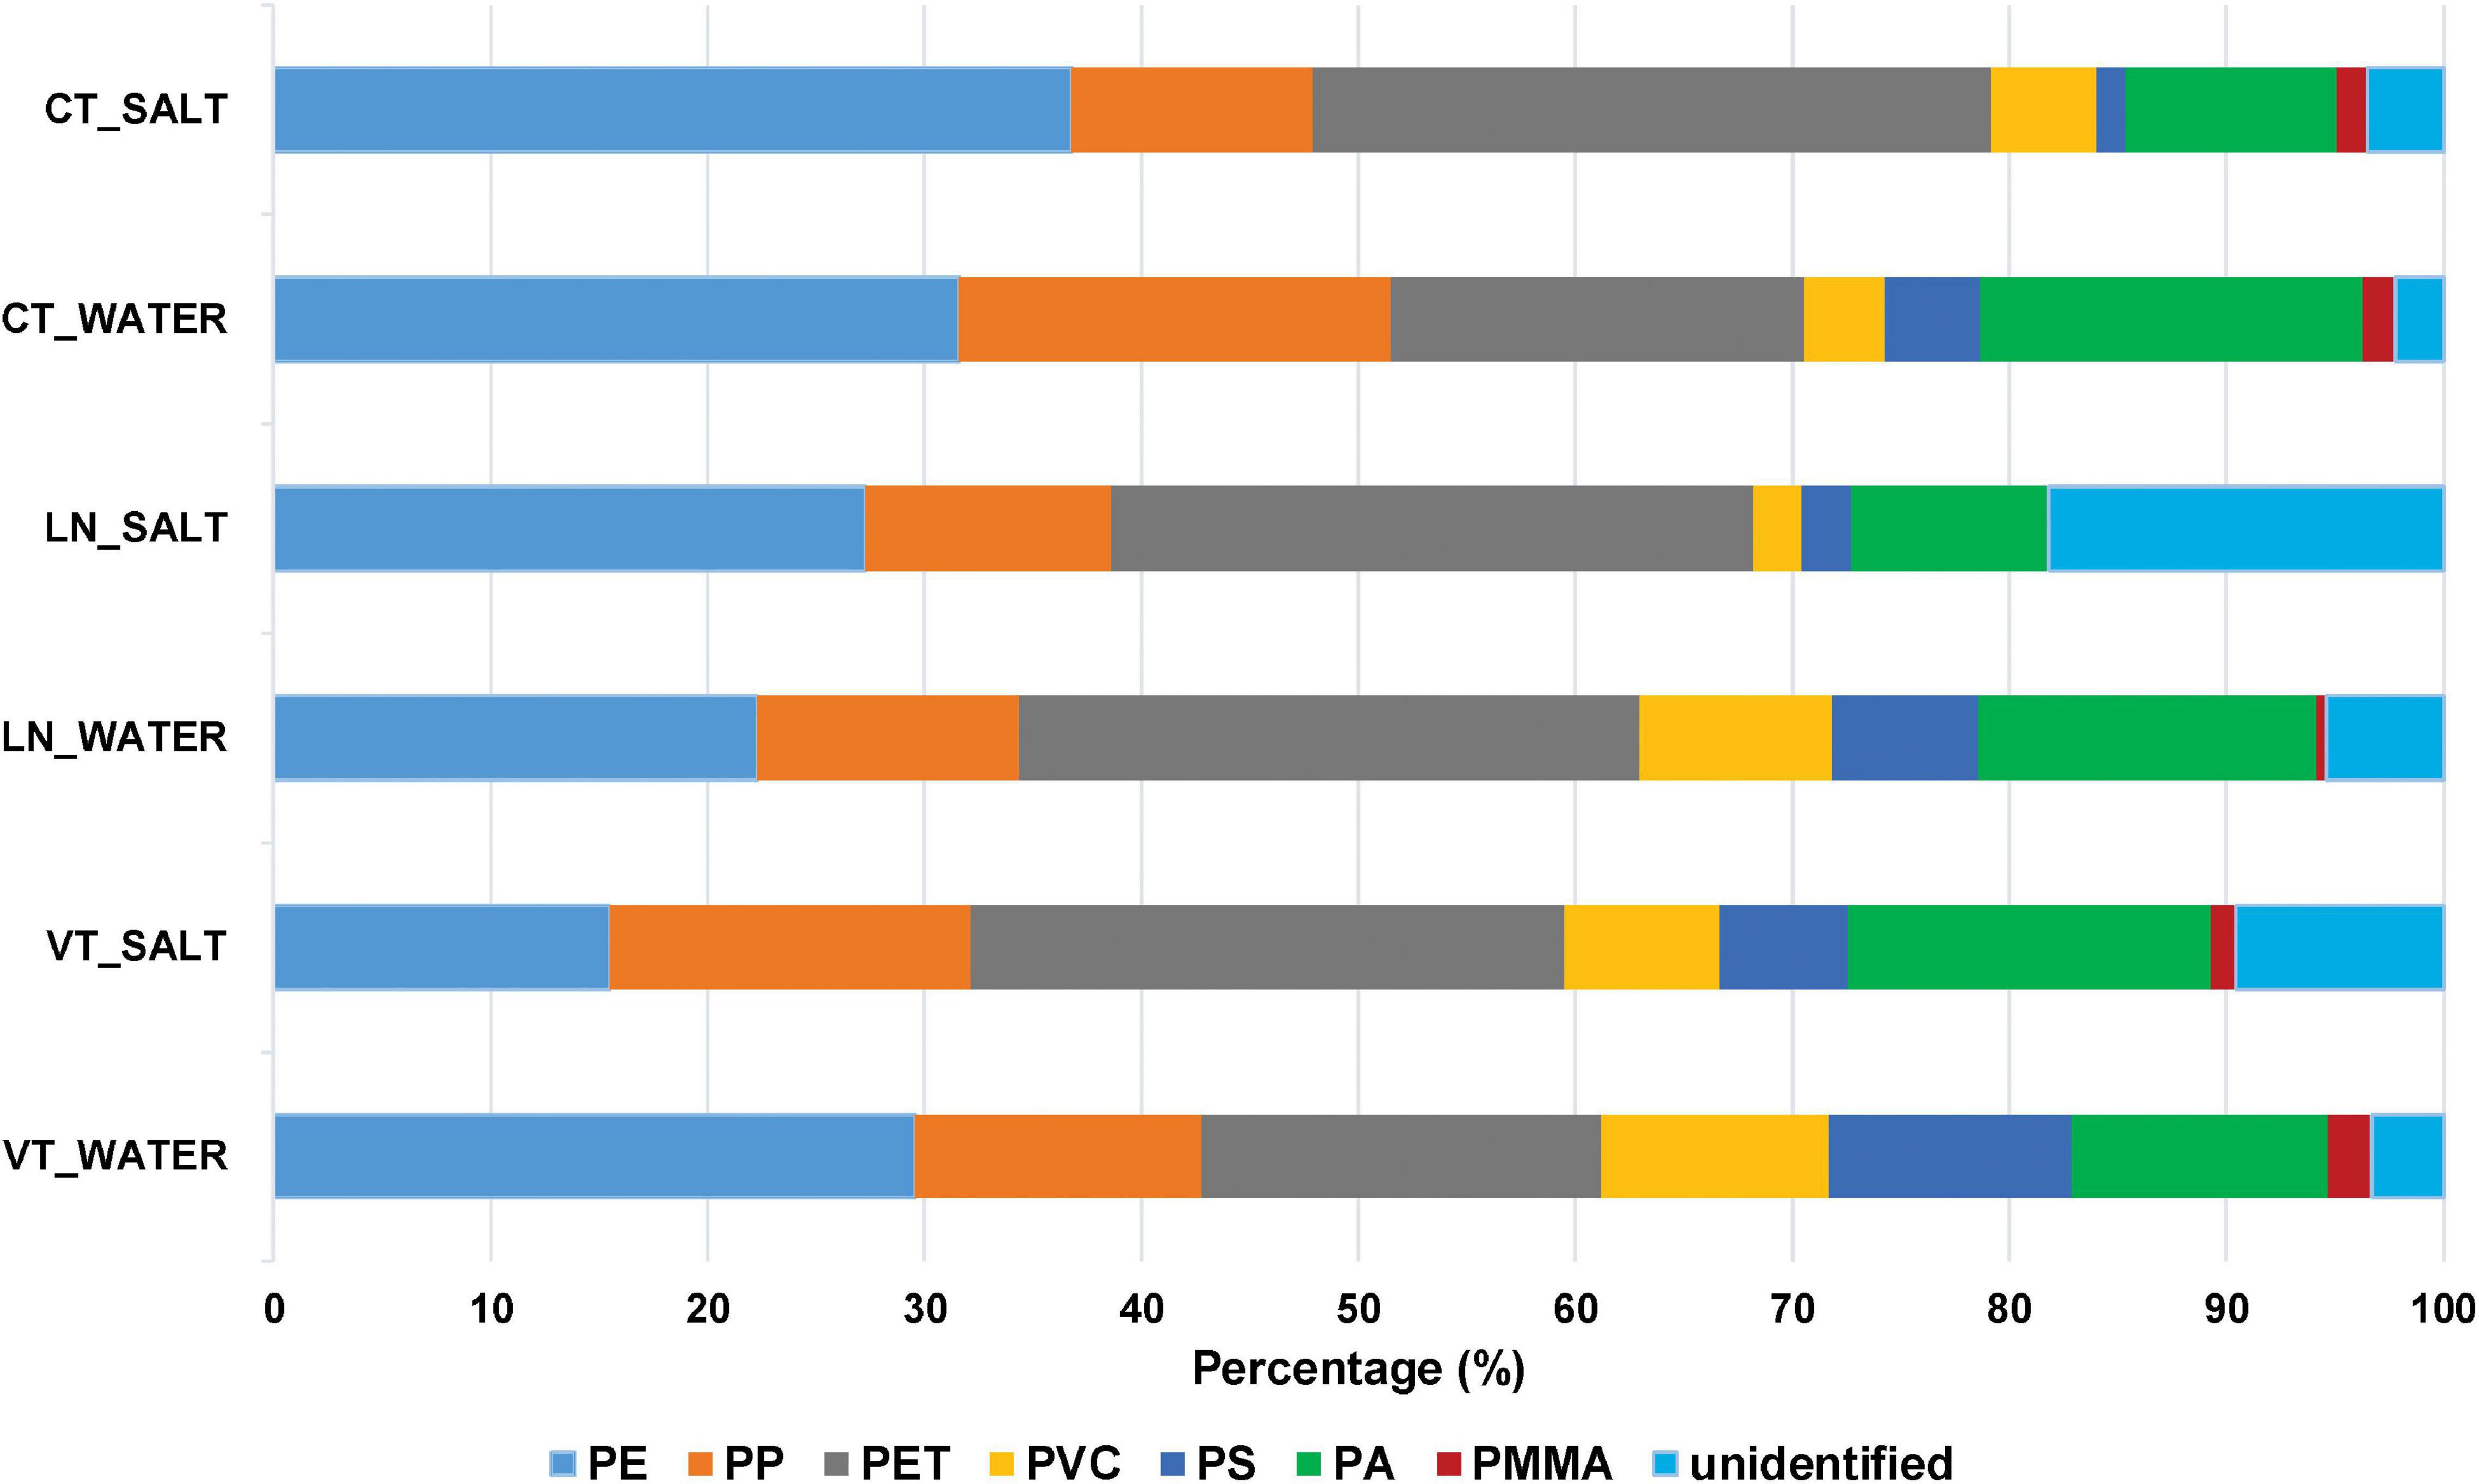
Figure 4. Compositions of microplastics in seawater and its coarse salts collected in Vung Tau, Ly Nhon, and Can Thanh salt fields.
The trend of MP compositions, shapes, and colors are similar in the seawater and salt of CT and LN. All kinds of shapes of plastic observed in the seawater were found in the salt (Supplementary Figure 1). The detailed information of colors, morphology, and their average size classified by plastic types are presented in Supplementary Table 7. Fibers and fragments were the dominant forms of MPs in the seawater and salt from Can Gio, which is similar to the findings in studies on Spanish salts (Iñiguez et al., 2017), United States, Mexican salts, and the salts from the Pacific Ocean and Mediterranean Sea (Kosuth et al., 2018). The size of fragments in the seawater was slightly larger, whereas the fibers were shorter. Although the density of PET (1.3 g/cm3) was higher than that of the seawater (1.023 g/cm3), its microfiber shape reduced the high density (Branca, 2007). Therefore, similar to the report of Iñiguez et al. (2017), colored fibers dominated by PET in all seawater and salt samples accounted for 38.46 and 78.26%, respectively, in our study. In addition to PET, textile fibers predominantly consisted of PA and PVC, but PP dominated white fragments. The color white was usually the most predominant color of non-fibrous MPs, accounting for more than 35%. Black and gray are then preferable colors for bars, fragments, and sticks. Transparent was the second popular color for beads. PE is commonly used in plastic bags, food packaging, and agricultural films (Chubarenko et al., 2016; Zhu et al., 2018). Thus, besides white color, green, orange, and transparent are common colors of PE films. For fibers, purple was the dominant category (18.35%), followed by white (16.55%), blue (14.06%), pink (9.11%), and green.
Vung Tau is a special case where there is a differentiation between seawater and coarse salt. PE is the most predominant in seawater, whereas PET was found to be most frequently found in the salt. This difference may be due to the density of these polymers. PE is less dense than water and, thus, PE can be transported on sea currents and dissipated (Nilawati et al., 2020). However, in contrast, heavy PET particles tend to move to the bottom and remain with the salt during the salt crystallization process because of the higher density (1.3 g/cm3) than that of PE (0.94 g/cm3) and PP (0.90 g/cm3) (Yang et al., 2015; Iñiguez et al., 2017). With regard to shapes, small particles with an average size of 25.98 μm dominated (47.37%), followed by bars (13.82%), films (11.84%), and fibers (5.92%) in the seawater, whereas the predominant shape was fibers (52.38%), followed by bar (25%) and fragments (14.28%) in VT salt. Nevertheless, the size of fragments, beads, and films in the salt and seawater is alike. There were more fibers in the salt, and compared with the microfibers in the seawater, most of them had short lengths (71.25 μm on average).
The comparisons on size, color, and type of MPs extracted from the seawater and marine salt in CT, LN, and VT showed the similarities in general, despite the minor differences in plastic compositions caused by the crystallization process. This study provided critical evidence to prove that the input seawater was the pollution source of MPs in the marine salt.
Conclusion
This work is the first study on the correlation of MPs pollution in seawater and coarse salt in three different sea areas in Vietnam. The total abundance of MP indicates levels of MP contamination in not only the seawater but also in the marine salt, particularly 14.54 ± 1.78 MPs/L in seawater and 114.67 ± 19.10 MPs/kg in salt in VT, 13.14 ± 2.01 MPs/L and 63.59 ± 7.62 MPs/kg in salt in LN, and 9.42 ± 1.93 MPs/L in seawater and 93.69 ± 12.90 MPs/kg in salt in CT. The variety in plastic compositions revealed multiple anthropogenic activities in natural river systems in the transition zone of the Reserve, and in VT province. The main polymer types are PE, PET, and PP. PE was the most dominant polymer because it is the most common material for single-use plastic products and fishing lines. PET and PVC fibers were found to have been involved in textile sources, and their white fragments were derived from food packaging and water bottles used by local communities. The similarity in the relative abundances of PE, PET, PP, and PVC revealed the strong correlations of plastic compositions in seawater and coarse salt. The correlation is also illustrated by the shape, size, and color of each plastic type. Many kinds of forms were found in samples, such as fibers, bars, fragments, beads, and films. The predominant forms were small fragments and fibers of various sizes. White was the most popular color in all samples. The similarities in compositions, shapes, and morphologies of MPs in the seawater and salt confirmed that MP pollution in seawater was the main cause of MPs contamination in coarse salt. The results indicate that there must be appropriate policies in place for MPs waste management. Further, the salt production process must be improved to increase the productivity and quality of coarse and refined sea salt to be a safe product.
Data Availability Statement
The original contributions presented in the study are included in the article/Supplementary Material, further inquiries can be directed to the corresponding author/s.
Author Contributions
VK developed the microplastic analysis workflow, collected the interview data, conducted the experiments, and prepared the initial draft. VK and DL designed the study, analyzed the data, and wrote the manuscript. LA, AF, and CD evaluated the experimental procedures and results, and edited the manuscript. All authors discussed the results and approved the final manuscript.
Funding
This research was being funded by German Academic Exchange Service (DAAD) under the doctoral scholarship program Sustainable Water Management 2018 for VK.
Conflict of Interest
The authors declare that the research was conducted in the absence of any commercial or financial relationships that could be construed as a potential conflict of interest.
Publisher’s Note
All claims expressed in this article are solely those of the authors and do not necessarily represent those of their affiliated organizations, or those of the publisher, the editors and the reviewers. Any product that may be evaluated in this article, or claim that may be made by its manufacturer, is not guaranteed or endorsed by the publisher.
Acknowledgments
We thank Vo Thi Thien Kim (University of Medicine Pham Ngoc Thach), MSc MD Pham, Thi Mong Dao (Nhan Dan Gia Dinh Hospital), and Med Vo Duy Khoa (Nguyen Tri Phuong Hospital) for their assistance and hard work during the fieldwork and interview campaign, Nguyen Huy Phuc (Industrial University of Ho Chi Minh City) for his hard work in the laboratory analysis. We also thank five salt farmers in Ly Nhon, Can Thanh, and Vung Tau for providing practical information about salt production method and donating their materials and products for the research in the interviews.
Supplementary Material
The Supplementary Material for this article can be found online at: https://www.frontiersin.org/articles/10.3389/fmars.2021.735975/full#supplementary-material
References
Anh, L. H., Khuyen, V. T. K., Nam, T. N., and Khoa, V. D. (2016). Effects of microalgae on nutrient removal from mariculture wastewater in Can Gio District, Ho Chi Minh City, Vietnam. J. Viet. Environ. 8, 114–120. doi: 10.13141/jve.vol8.no2.pp114-120
Branca, D. L. (2007). Uniformity of low Density Fibrous Structures and the Effects of Manufacturing Processes on Apparent Density. [dissertation/master’s thesis]. New York, NY: State University of New York College of Environmental Science and Forestry.
Chae, D. H., Kim, I. S., Kim, S. K., Song, Y. K., and Shim, W. J. (2015). Abundance and distribution characteristics of microplastics in surface seawaters of the Incheon/Kyeonggi Coastal Region. Arch. Environ. Contam. Toxicol. 69, 269–278. doi: 10.1007/s00244-015-0173-4
Chen, Y., Awasthi, A. K., Wei, F., Tan, Q., and Li, J. (2021). Single-use plastics: production, usage, disposal, and adverse impacts. Sci. Total Environ. 752:141772. doi: 10.1016/j.scitotenv.2020.141772
Choi, K. S. (2008). Oyster Capture-Based Aquaculture in the Republic of Korea (2008). Rome: FAO, 271–286.
Chubarenko, I., Bagaev, A., Zobkov, M., and Esiukova, E. (2016). On some physical and dynamical properties of microplastic particles in marine environment. Mar. Pollut. Bull. 108, 105–112. doi: 10.1016/j.marpolbul.2016.04.048
Crawford, C. B., and Quinn, B. (2017). “Microplastics, standardization and spatial distribution,” in Microplastic Pollutants, eds C. B. Crawford and B. Quinn (Amsterdam: Elsevier), 119.
FAO (2017). Microplastics in Fisheries and Aquaculture Status of Knowledge on Their Occurrence and Implications for Aquatic Organisms and Food Safety. Rome: FAO.
GESAMP (2015). “Sources, fate and effects of microplastics in the marine environment: a global assessment,” in (IMO/FAO/UNESCO IOC/UNIDO/WMO/IAEA/UN/UNEP/UNDP Joint Group of Experts on the Scientific Aspects of Marine Environmental Protection). Rep. Stud. GESAMP No. 90, ed. P. J. Kershaw (London: International Maritime Organization), 96.
Geyer, R., Jambeck, J. R., and Law, K. L. (2017). Production, use, and fate of all plastics ever made. Sci. Adv. 3:1700782. doi: 10.1126/sciadv.1700782
Godswill, C. G., and Godspel, A. C. (2019). Physiological effects of plastic wastes on the endocrine system (Bisphenol A, Phthalates, Bisphenol S, PBDEs, TBBPA). Int. J. Bioinform. Comput. Biol. 4, 11–29.
Gündoğdu, S. (2018). Contamination of table salts from Turkey with microplastics. Food Addit. Contam. Part A 35, 1006–1014. doi: 10.1080/19440049.2018.1447694
Iñiguez, E. M., Conesa, J. A., and Andres, F. (2017). Microplastics in Spanish table salt. Sci. Rep. 7:8630. doi: 10.1038/s41598-017-09128-x
Jayasiri, H. B., Purushothaman, C. S., and Vennila, A. (2013). Quantitative analysis of plastic debris on recreational beaches in Mumbai, India. Mar. Pollut. Bull. 77, 107–112. doi: 10.1016/j.marpolbul.2013.10.024
Jensen, P. N., Bao, T. Q., Huong, T. T. T., Heckbert, S. R., Fitzpatrick, A. L., LoGerfo, J. P., et al. (2018). The association of estimated salt intake with blood pressure in a Viet Nam national survey. PLoS One 13: e0191437. doi: 10.1371/journal.pone.0191437
Karami, A., Golieskardi, A., Choo, C. K., Larat, V., Galloway, T. S., and Salamatinia, B. (2017). The presence of microplastics in commercial salts from different countries. Sci. Rep. 7:46173. doi: 10.1038/srep46173
Khuyen, V. T. K., Le, D. V., Anh, L. H., Fischer, A. R., and Dornack, C. (2021a). Investigation of microplastic contamination in vietnamese sea salts based on raman and fourier-transform infrared spectroscopies. EnvironmentAsia 14, 1–13. doi: 10.14456/ea.2021.11
Khuyen, V. T. K., Le, D. V., Fischer, A. R., and Dornack, C. (2021b). Comparison of microplastic pollution in beach sediment and seawater at UNESCO Can Gio Mangrove Biosphere Reserve. Glob. Chall. 5:2100044. doi: 10.1002/gch2.202100044
Kim, J. S., Lee, H. J., Kim, S. K., and Kim, H. J. (2018). Global pattern of microplastics (MPs) in commercial food- grade salts: sea salt as an indicator of seawater MP pollution. Environ. Sci. Technol. 52, 12819–12828. doi: 10.1021/acs.est.8b04180
Kosuth, M., Mason, S. A., and Wattenberg, E. V. (2018). Anthropogenic contamination of tap water, beer, and sea salt. PLoS One 13: e0194970. doi: 10.1371/journal.pone.0194970
Kunz, A., Walther, B. A., Löwemark, L., and Lee, Y. C. (2016). Distribution and quantity of microplastic on sandy beaches along the northern coast of Taiwan. Mar. Pollut. Bull. 111, 126–135. doi: 10.1016/j.marpolbul.2016.07.022
Lahens, L., Strady, E., Le, K. T. C., Dris, R., Boukerma, K., Rinnert, E., et al. (2018). Macroplastic and microplastic contamination assessment of a tropical river (Saigon River, Vietnam) transversed by a developing megacity. Environ. Pollut. 236, 661–671. doi: 10.1016/j.envpol.2018.02.005
Lee, H., Kunz, A., Shim, W. J., and Walther, B. A. (2019). Microplastic contamination of table salts from Taiwan, including a global review. Sci. Rep. 9:10145. doi: 10.1038/s41598-019-46417-z
Lee, J., Hong, S., Song, Y. K., Hong, S. H., Jang, Y. C., Jang, M., et al. (2013). Relationships among the abundances of plastic debris in different size classes on beaches in South Korea. Mar. Pollut. Bull. 77, 349–354. doi: 10.1016/j.marpolbul.2013.08.013
Li, J., Qu, X., Su, L., Zhang, W., Yang, W., Kolandhasamy, P., et al. (2016). Microplastics in mussels along the coastal waters of China. Environ. Pollut. 214, 177–184. doi: 10.1016/j.envpol.2016.04.012
Lusher, A. L., Burke, A., O’Connor, I., and Officer, R. (2014). Microplastic pollution in the Northeast Atlantic Ocean: validated and opportunistic sampling. Mar. Pollut. Bull. 88, 325–333.
Ma, B., Xue, W., Hu, C., Liu, H., Qu, J., and Li, L. (2018). Characteristics of microplastic removal via coagulation and ultrafiltration during drinking water treatment. Chem. Eng. J. 359, 159–167.
Nam, V. N., Sinh, L. V., Miyagi, T., Baba, S., and Chan, H. T. (2014). An Overview of Can Gio District and Mangrove Biosphere Reserve, Vol. 6. Melbourne, VIC: International Society for Mangrove Ecosystems, 1–7.
Nel, H. A., and Froneman, P. W. (2015). A quantitative analysis of microplastic pollution along the south-eastern coastline of South Africa. Mar. Pollut. Bull. 101, 274–279. doi: 10.1016/j.marpolbul.2015.09.043
Nilawati, Sunarsih, and Sudarno (2020). Microplastic pollution from sea salt: its effect on public health and prevention alternatives – a review. E3S Web of Conf. 202:06018. doi: 10.1051/e3sconf/202020206018
Partearroyo, T., Samaniego-Vaesken, M. L., Ruiz, E., Aranceta-Bartrina, J., Gil, A., González-Gross, M., et al. (2019). Sodium intake from foods exceeds recommended limits in the Spanish population: the ANIBES study. Nutrients 11, 24–51.
PlasticsEurope. (2018). Plastics – The Facts 2017: An Analysis of European Plastics Production, Demand and Waste Data. Available online at: https://www.plasticseurope.org/application/files/5715/1717/4180/Plastics_the_facts_2017_FINAL_for_website_one_page.pdf (accessed date July 03, 2021).
PlasticsEurope. (2020). Plastics – The Facts 2017: An Analysis of European plastics Production, Demand and Waste Data. Available online at: https://www.plasticseurope.org/application/files/5716/0752/4286/AF_Plastics_the_facts-WEB-2020-ING_FINAL.pdf (accessed date July 03, 2021).
Rajala, K., Grönfors, O., Hesampour, M., and Mikola, A. (2020). Removal of microplastics from secondary wastewater treatment plant effluent by coagulation/flocculation with iron, aluminum and polyamine-based chemicals. Water Res. 183:116045. doi: 10.1016/j.watres.2020.116045
Renzi, M., and Blaskovic, A. (2018). Litter & microplastics features in table salts from marine origin: Italian versus Croatian brands. Mar. Pollut. Bull. 135, 62–68. doi: 10.1016/j.marpolbul.2018.06.065
Selvam, S., Manisha, A., Venkatramanan, S., Chung, S. Y., Paramasivam, C. R., and Singaraja, C. (2020). Microplastic presence in commercial marine sea salts: a baseline study along Tuticorin Coastal salt pan stations, Gulf of Mannar, South India. Mar. Pollut. Bull. 150:110675.
Seth, C. K., and Shriwastav, A. (2018). Contamination of Indian sea salts with microplastics and a potential prevention strategy. Environ. Sci. Pollut. Res. Int. 25, 30122–30131. doi: 10.1007/s11356-018-3028-5
Skaf, D. W., Punzi, V. L., Rolle, J. T., and Kleinberg, K. A. (2019). Removal of micron-sized microplastic particles from simulated drinking water via alum coagulation. Chem. Eng. J. 386:123807. doi: 10.1016/j.cej.2019.123807
Smith, M., Love, D. C., Rochman, C. M., and Neff, R. A. (2018). Microplastics in seafood and the implications for human health. Curr. Environ. Health Rep. 5, 375–386. doi: 10.1007/s40572-018-0206-z
Sruthy, S., and Ramasamy, E. V. (2017). Microplastic pollution in Vembanad Lake, Kerala, India: the first report of microplastics in lake and estuarine sediments in India. Environ. Pollut. 222, 315–322. doi: 10.1016/j.envpol.2016.12.038
Steer, M., Cole, M., Thompson, R. C., and Lindeque, P. K. (2017). Microplastic ingestion in fish larvae in the western English Channel Environ. Pollution 226, 250–259. doi: 10.1016/j.envpol.2017.03.062
Strady, E., Le, T. C. K., Gasperi, J., and Tassin, B. (2020). Temporal dynamic of anthropogenic fibres in a tropical river-estuarine system. Environ. Pollut. 259:113897. doi: 10.1016/j.envpol.2019.113897
Su, L., Xue, Y., Li, L., Yang, D., Kolandhasamy, P., Li, D., et al. (2016). Microplastics in Taihu Lake, China. Environ. Pollut. 216, 711–719.
Suckling, R. J., and Swift, P. A. (2015). The health impacts of dietary sodium and a low-salt diet. Clin. Med. 15, 585–588. doi: 10.7861/clinmedicine.15-6-585
Tanaka, K., and Takada, H. (2016). Microplastic fragments and microbeads in digestive tracts of planktivorous fish from urban coastal waters. Sci. Rep. 6:34351. doi: 10.1038/srep34351
Thompson, R. C., Olsen, Y., Mitchell, R. P., Davis, A., Rowland, S. J., John, A. W. G., et al. (2004). Lost at sea: where is all the plastic? Science 304, 838–838. doi: 10.1126/science.1094559
Vo, Q. T., and Kuenzer, C. (2012). Can Gio Mangrove Biosphere Reserve Evaluation 2012: Current Status, Dynamics, and Ecosystem Services. Hanoi: IUCN, 102.
Wang, M. H., He, Y., and Sen, B. (2019). Research and management of plastic pollution in coastal environments of China. Environ. Pollut. 248, 898–905. doi: 10.1016/j.envpol.2019.02.098
Wessel, C. C., Lockridge, G. R., Battiste, D., and Cebrian, J. (2016). Abundance and characteristics of microplastics in beach sediments: insights into microplastic accumulation in northern Gulf of Mexico estuaries. Mar. Pollut. Bull. 109, 178–183. doi: 10.1016/j.marpolbul.2016.06.002
Yang, D., Shi, H., Li, L., Li, J., Jabeen, K., and Kolandhasamy, P. (2015). microplastic pollution in table salts from China. Environ. Sci. Technol. 49, 13622–13627. doi: 10.1021/acs.est.5b03163
Young, A. M., and Elliott, J. A. (2016). Characterization of microplastic and mesoplastic debris in sediments from Kamilo Beach and Kahuku Beach. Hawaii. Mar. Pollut. Bull. 113, 477–482. doi: 10.1016/j.marpolbul.2016.11.009
Zhao, S., Zhu, L., Wang, T., and Li, D. (2014). Suspended microplastics in the surface water of the Yangtze Estuary System, China: first observations on occurrence, distribution. Mar. Pollut. Bull. 86, 562–568. doi: 10.1016/j.marpolbul.2014.06.032
Keywords: microplastics, marine pollution, Raman spectroscopy, salt evaporation ponds, sea salt, UNESCO Can Gio Mangrove Biosphere Reserve, Vung Tau
Citation: Khuyen VTK, Le DV, Anh LH, Fischer AR and Dornack C (2021) Investigating the Correlation of Microplastic Pollution Between Seawater and Marine Salt Using Micro-Raman Spectroscopy. Front. Mar. Sci. 8:735975. doi: 10.3389/fmars.2021.735975
Received: 04 July 2021; Accepted: 28 October 2021;
Published: 15 December 2021.
Edited by:
Jérôme Cachot, Université de Bordeaux, FranceReviewed by:
Cristina Pedà, National Institute of Biology, Ecology and Marine Biotechnology, ItalyBettie Cormier, Université de Bordeaux, France
Copyright © 2021 Khuyen, Le, Anh, Fischer and Dornack. This is an open-access article distributed under the terms of the Creative Commons Attribution License (CC BY). The use, distribution or reproduction in other forums is permitted, provided the original author(s) and the copyright owner(s) are credited and that the original publication in this journal is cited, in accordance with accepted academic practice. No use, distribution or reproduction is permitted which does not comply with these terms.
*Correspondence: Vo Thi Kim Khuyen, a2lta2h1eWVudm9AZ21haWwuY29t; Dinh Vu Le, bGVkaW5odnVAaXVoLmVkdS52bg==