 Anke Kügler
 Marc O. Lammers
 Eden J. Zang
 Adam A. Pack
- 1Hawai‘i Institute of Marine Biology, University of Hawai‘i at Mānoa, Kāne‘ohe, HI, United States
- 2Oceanwide Science Institute, Honolulu, HI, United States
- 3Hawaiian Islands Humpback Whale National Marine Sanctuary, Kīhei, HI, United States
- 4Department of Psychology and Biology, University of Hawai‘i at Hilo, Hilo, HI, United States
- 5The Dolphin Institute, Hilo, HI, United States
Passive acoustic monitoring (PAM) with autonomous bottom-moored recorders is widely used to study cetacean occurrence, distribution and behaviors, as it is less affected by factors that limit other observation methods (e.g., vessel, land and aerial-based surveys) such as inclement weather, sighting conditions, or remoteness of study sites. During the winter months in Hawai‘i, humpback whale male song chorusing becomes the predominant contributor to the local soundscape and previous studies showed a strong seasonal pattern, suggesting a correlation with relative whale abundance. However, the relationship between chorusing levels and abundance, including non-singing whales, is still poorly understood. To investigate how accurately acoustic monitoring of singing humpback whales tracks their abundance, and therefore is a viable tool for studying whale ecology and population trends, we collected long-term PAM data from three bottom-moored Ecological Acoustic Recorders off west Maui, Hawaii during the winter and spring months of 2016–2021. We calculated daily medians of root-mean-square sound pressure levels (RMS SPL) of the low frequency acoustic energy (0–1.5 kHz) as a measure of cumulative chorusing intensity. In addition, between December and April we conducted a total of 26 vessel-based line-transect surveys during the 2018/19 through 2020/21 seasons and weekly visual surveys (n = 74) from a land-based station between 2016 and 2020, in which the location of sighted whale pods was determined with a theodolite. Combining the visual and acoustic data, we found a strong positive second-order polynomial correlation between SPLs and abundance (land: 0.72 ≤ R2 ≤ 0.75, vessel: 0.81 ≤ R2 ≤ 0.85 for three different PAM locations; Generalized Linear Model: pland ≪ 0.001, pvessel ≪ 0.001) that was independent from recording location (pland = 0.23, pvessel = 0.9880). Our findings demonstrate that PAM is a relatively low-cost, robust complement and alternative for studying and monitoring humpback whales in their breeding grounds that is able to capture small-scale fluctuations during the season and can inform managers about population trends in a timely manner. It also has the potential to be adapted for use in other regions that have previously presented challenges due to their remoteness or other limitations for conducting traditional surveys.
Introduction
Many animals across numerous taxa produce sounds (e.g., invertebrates: Henry and Wells, 2010; Bohnenstiehl et al., 2016; amphibians: Tobias et al., 2010; Dapper et al., 2011; reptiles: Hibbitts et al., 2006; Sicuro et al., 2013; birds: Catchpole and Slater, 2008; Phongkangsananan et al., 2014; fish: Maruska et al., 2012; Tricas and Boyle, 2014; terrestrial mammals: Boughman, 1997; De La Torre and Snowdon, 2009; Van Belle et al., 2014; Pitcher et al., 2015; marine mammals: Smolker and Pepper, 1999; Van Parijs et al., 2000; Rogers and Cato, 2002; Belikov and Bel’kovich, 2007; Sanvito et al., 2007), that can be recorded and analyzed to study their behaviors and ecology. Passive acoustic monitoring (PAM) using autonomous recorders has become increasingly widespread in wildlife research to study animals in terrestrial, aerial, and marine environments (Sugai et al., 2019; Mooney et al., 2020). In the study of cetacean occurrence, distribution, and behaviors, PAM has become an essential tool as it less influenced by factors that often limit visual observation methods (e.g., vessel, land, and aerial-based surveys) such as inclement weather, sighting conditions, the accessibility of study sites, and funding (Zimmer, 2011). PAM projects on various whale and dolphin species range widely from simple detection (e.g., presence/absence in an area) and distribution studies (Van Parijs et al., 2002; Oswald et al., 2011; Soldevilla et al., 2011; Schaffeld et al., 2016) to addressing questions about exposure to potentially disturbing anthropogenic sounds (Lucke et al., 2009; Dunlop et al., 2018). Automated detection and species classification algorithms have become particularly useful for monitoring certain populations (Oswald et al., 2007; Baumgartner and Mussoline, 2011; Baumann-Pickering et al., 2013; Allen et al., 2021), while other species remain problematic. Progress has also been made using PAM to infer density estimates and population trends using animals’ acoustic vocalization rates (Marques et al., 2013; Küsel et al., 2016), for example in beaked whales (Marques et al., 2009; Barlow et al., 2021), pygmy (Kogia breviceps) and dwarf (Kogia sima) sperm whales (Hildebrand et al., 2019), gray whales (Eschrichtius robustus) (Burnham and Duffus, 2020), minke whales (Balaenoptera acutorostrata) (Martin et al., 2013), fin whales (Balaenoptera physalus) (McDonald and Fox, 1999; Harris et al., 2018), and various delphinid species (Van Parijs et al., 2002; Frasier, 2015; Martin et al., 2020). However, using individual’s vocalization rates to estimate densities becomes challenging when an abundance of animals vocalize so often that individual sounds overlap and cannot be easily distinguished in recordings, as is often the case in large aggregations including on the breeding grounds of certain marine mammals, such as the humpback whale (Megaptera novaeangliae) (Au et al., 2000; Seger et al., 2016).
Humpback whales are medium-sized baleen whales that occur globally and migrate annually between high-latitude summer feeding and low-latitude winter calving and mating regions (Clapham, 2018). In the North Pacific, the Hawaiian archipelago is the species’ principal breeding ground, with more than half of the total stock—termed the Hawai‘i Distinct Population Segment (DPS, NOAA, 2016)—wintering in the islands (Herman and Antinoja, 1977; Calambokidis et al., 2008) while the other DPSs migrate to Mexico, Central America, southern Japan, the Philippines, and the Mariana Archipelago (Baker et al., 1986; Calambokidis et al., 2008; NOAA, 2016; Clapham, 2018; Hill et al., 2020).
Humpback whales produce a variety of vocalizations (e.g., Stimpert et al., 2007, 2011; Au and Hastings, 2008). So-called “social sounds” are produced by all ages and sexes and occur on the feeding grounds, along migratory routes, and on the breeding grounds (Silber, 1986; Dunlop et al., 2008; Zoidis et al., 2008; Darling, 2015). In contrast, “song,” known by sailors for centuries, but first formally described by Payne and McVay (1971), is a complex acoustic display produced by mature male humpback whales and some non-calf subadults (Herman et al., 2013). While most prevalent in breeding areas, song may be heard along migratory routes and to a lesser extent in high-latitude feeding areas (e.g., Stimpert et al., 2012; Vu et al., 2012). Song is one of the most recognized and studied features of the species, and because of its prominence during the breeding season, is hypothesized to play an important function in the humpback whale mating system, possibly signaling to females and/or mediating male-male interactions (Herman and Tavolga, 1980; Darling et al., 2006; Smith et al., 2008; Cholewiak et al., 2018; see Herman, 2017 for a comprehensive review on the function of song).
The cacophony of multiple males singing in an ongoing asynchronous chorus becomes the dominant source of low frequency ambient noise in the marine soundscape during the winter and spring months on many breeding grounds (Au et al., 2006; Seger et al., 2016) (Figure 1). In contrast to singing males, females and mother-calf pairs are acoustically cryptic on the breeding grounds (Videsen et al., 2017), male calves and yearlings do not yet sing (Herman et al., 2013), and social sounds in other types of assemblages such as competitive groups tend to be relatively infrequent compared to song (Silber, 1986). Consequently, although non-song vocalizations are also present, PAM studies conducted on humpback whale breeding grounds will predominantly capture the acoustic activity of singing males. In Hawai‘i, seasonal increases and decreases in the amplitude of song chorusing (Au et al., 2000; Chen, 2017; Kügler et al., 2020) mirror the whales’ historically documented seasonal changes in relative abundance (e.g., Baker and Herman, 1981; Mobley et al., 1999). Specifically, (Au et al., 2000) found that the peak in chorusing from singing males corresponds with the peak in abundance obtained from aerial surveys at the same time (Mobley et al., 1999, 2001). These aerial surveys covered all age and sex classes and included areas that are heavily used by mother-calf pairs and other non-singing whales (Mobley et al., 2001). However, the relationship between chorusing levels and overall whale numbers, including non-singing whales, remains poorly defined. In Australia, Noad et al. (2017) found a positive correlation between the number of individual singers and the number of whales sighted on a migration route. Similarly, Seger et al. (2016) showed that daily noise levels correlated positively with counts of whales from visual observations on a Mexican breeding ground. However, whale densities along the Australian migration route and in Mexico differ markedly from the Hawaiian breeding ground, making comparisons difficult. Furthermore, although the recent development in automated detections of song has shown to be a valuable tool to monitor humpback whale occurrence in low-density and transient regions as well as to document seasonal patterns (Allen et al., 2021), it is currently of limited use for estimating abundance until better models are available, particularly in high-density areas such as the four-island region of Maui, Moloka‘i, Lāna‘i, and Kaho‘olawe (also called “Maui Nui”), which, along with Penguin Bank (southeast of Moloka‘i), is considered the core winter humpback whale habitat in the Main Hawaiian Islands (Herman and Antinoja, 1977; Mobley et al., 1999).
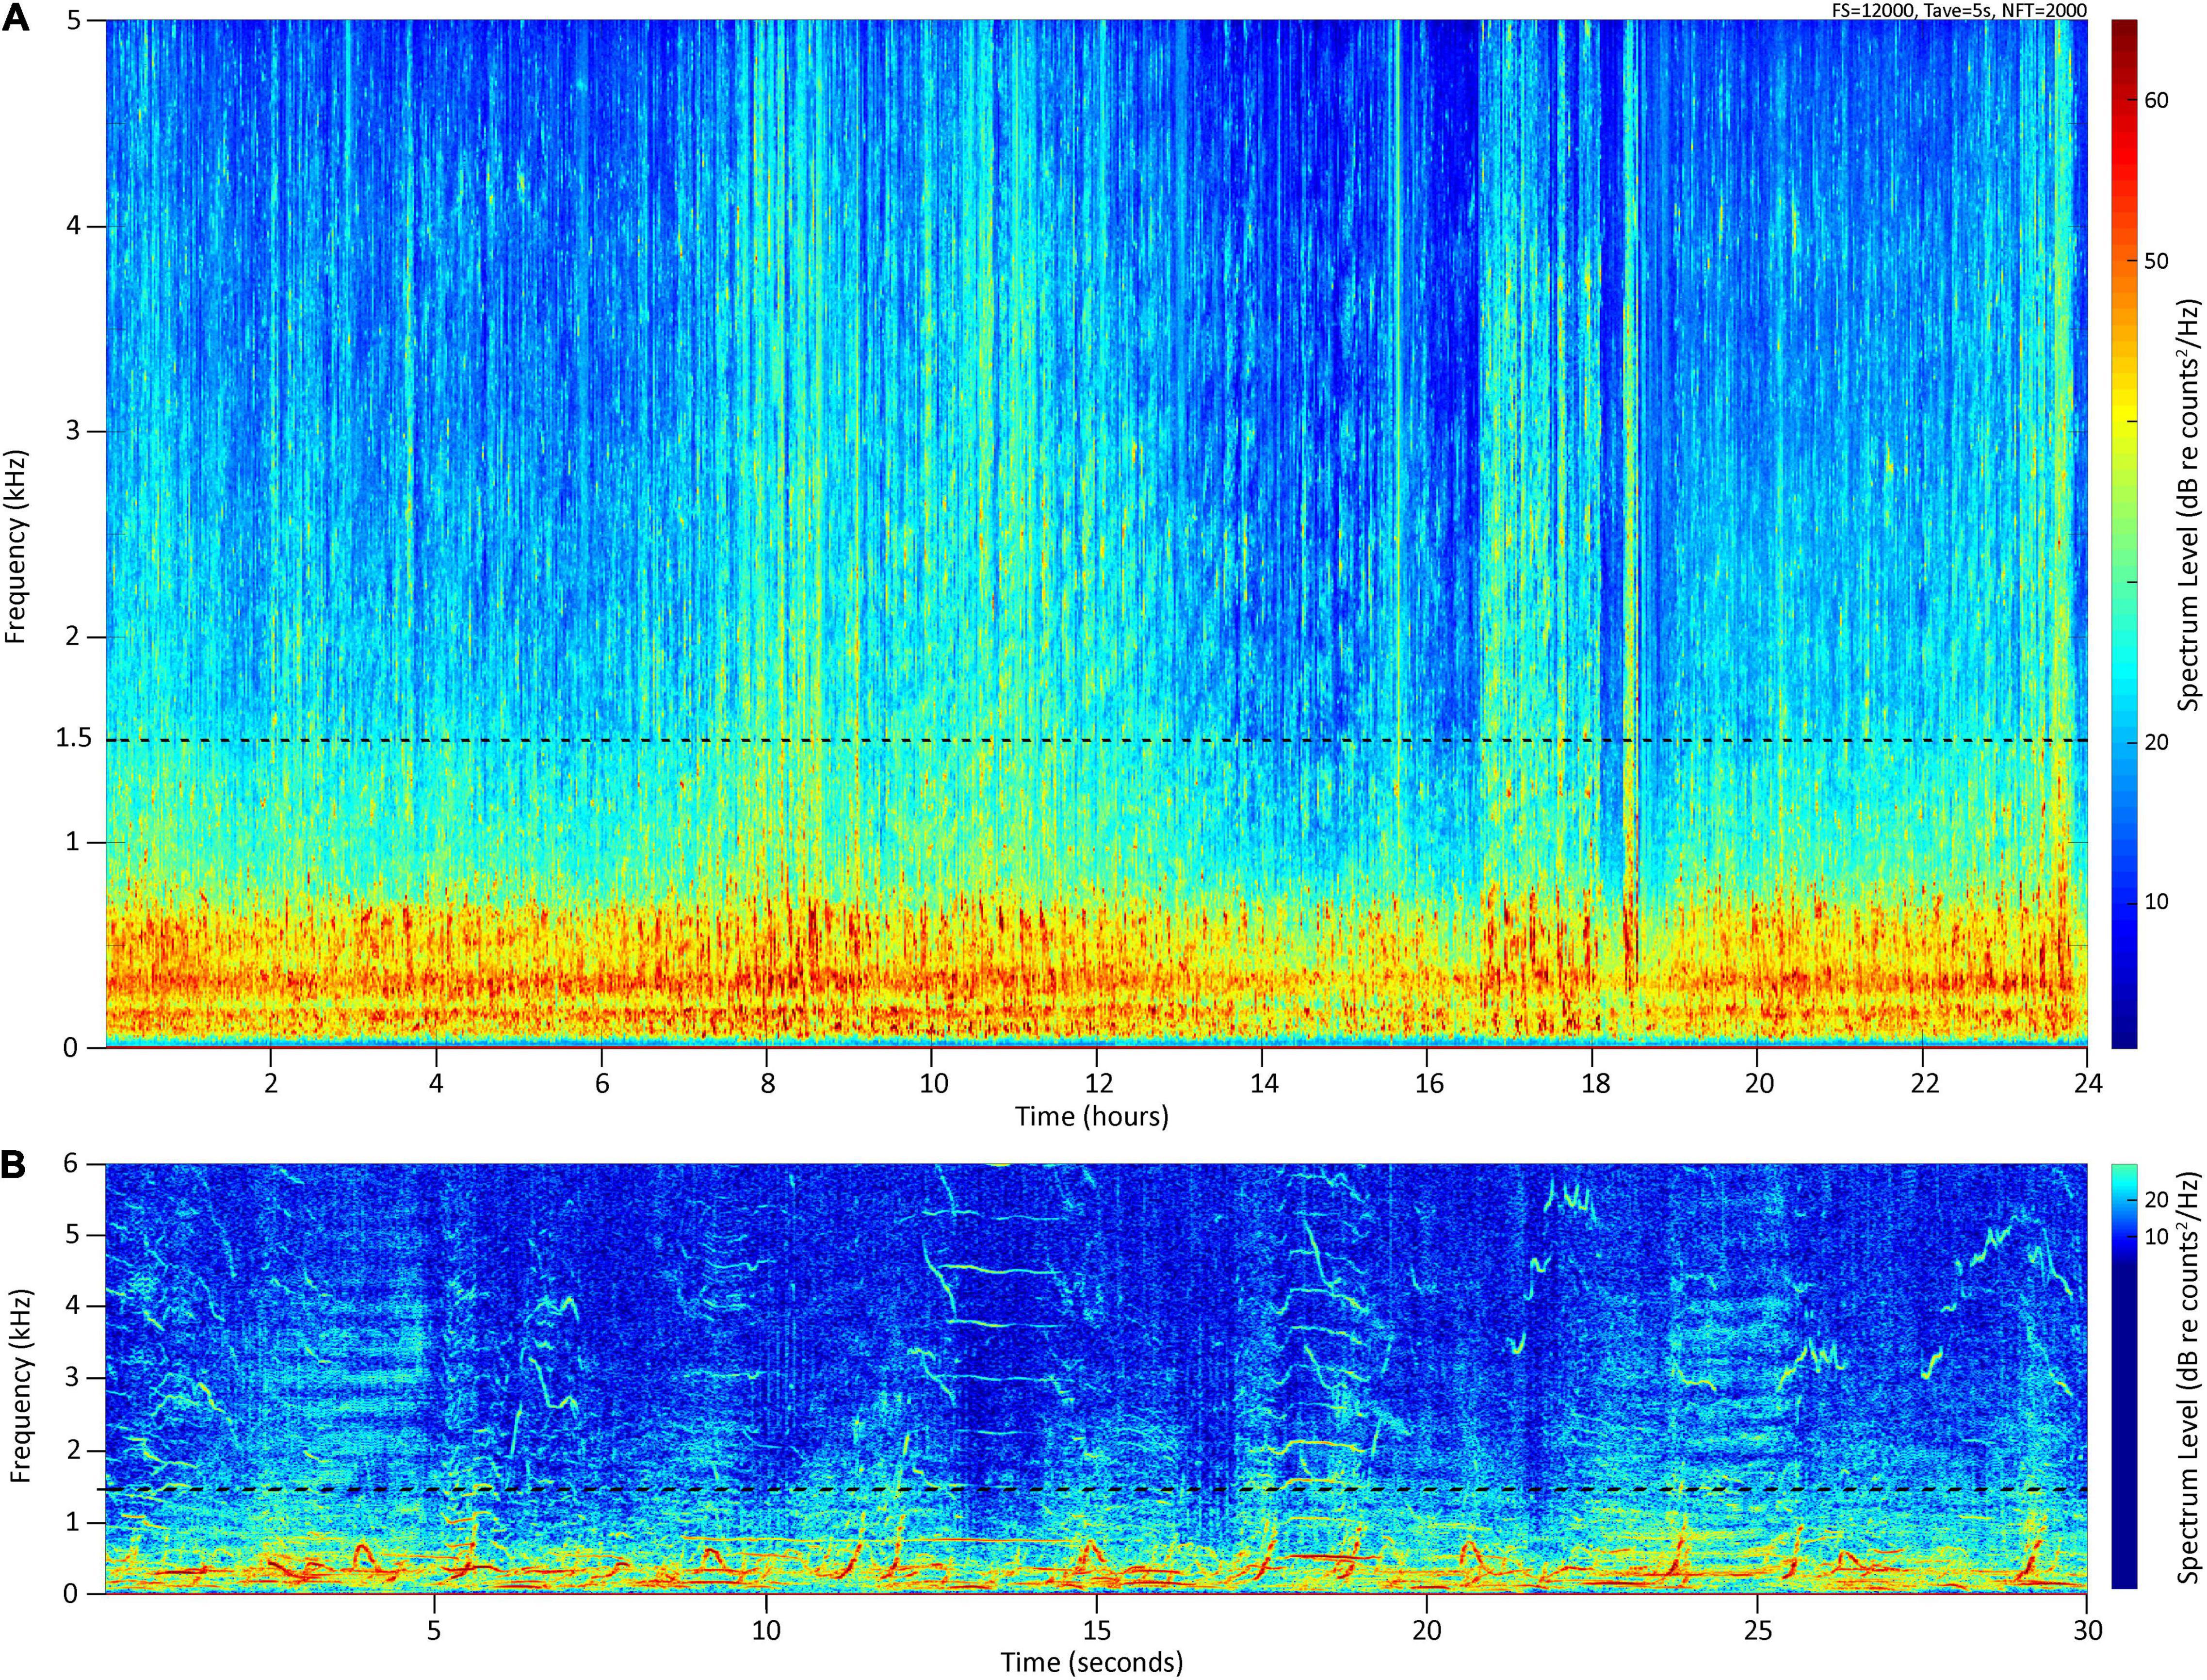
Figure 1. (A) Long-term spectral average spectrogram between 0 and 5 kHz of 24 h recorded at Olowalu (deep) on 02/15/2020, (B) spectrogram of 30 s in the 0–6 kHz band, illustrating the contribution of humpback whale chorusing to the local marine soundscape. Yellow and red color hues indicate higher levels of acoustic energy.
The objective of the current study was to evaluate the applicability of PAM to establish and monitor humpback whale abundance as a non-invasive and comparatively low-cost alternative or complement to traditional survey methods in the high-density environment off Maui. We sought to define the quantitative relationship between male song chorusing levels and overall whale numbers, as well as to identify drivers impacting this relationship, through the synthesis of acoustic and visual survey data collected over four breeding seasons. Being able to use male chorusing as a proxy for whale abundance can provide a tool that allows the study of a wide range of humpback whale’s ecological questions, ranging from long-term monitoring of population trends to micro-scale habitat use patterns.
Materials and Methods
Data Collection
Acoustic Data
Acoustic data were collected with two deep-water and one shallow-water bottom-moored, autonomous Ecological Acoustic Recorders (EARs) using a Sensor Technology SQ26-01 hydrophone with a sensitivity of −193.5 dB (Lammers et al., 2008) during the humpback whale breeding season (ca. December through April) at three locations off Maui, Hawai‘i (Figure 2). Deployment locations, depths, and recording periods are summarized in Table 1. All sites were within or near the 200 m isobath, a depth within which most humpback whales are traditionally found in Hawai‘i (e.g., Herman and Antinoja, 1977; Mobley et al., 1999) and located on sand (Maui6, Olowalu—deep) or near a coral reef (Olowalu—shallow). The shallow EAR was anchored to a concrete block on the bottom and was diver deployed. The two deep EARs were deployed off a small vessel and were each coupled with a synthetic foam float, two SubSea Sonics AR-60 acoustic releases, and approximately 75 kg of sandbags to anchor the mooring, positioning the EAR into the water column approximately 4 m off the bottom. The EARs recorded at a sample rate of either 25 kHz (Olowalu—shallow) or 50 kHz (Maui6, Olowalu—deep) and a 10% duty cycle, recording for 30 s every 5 min. Acoustic data were analyzed for the period between December 1st and April 30th of each year.
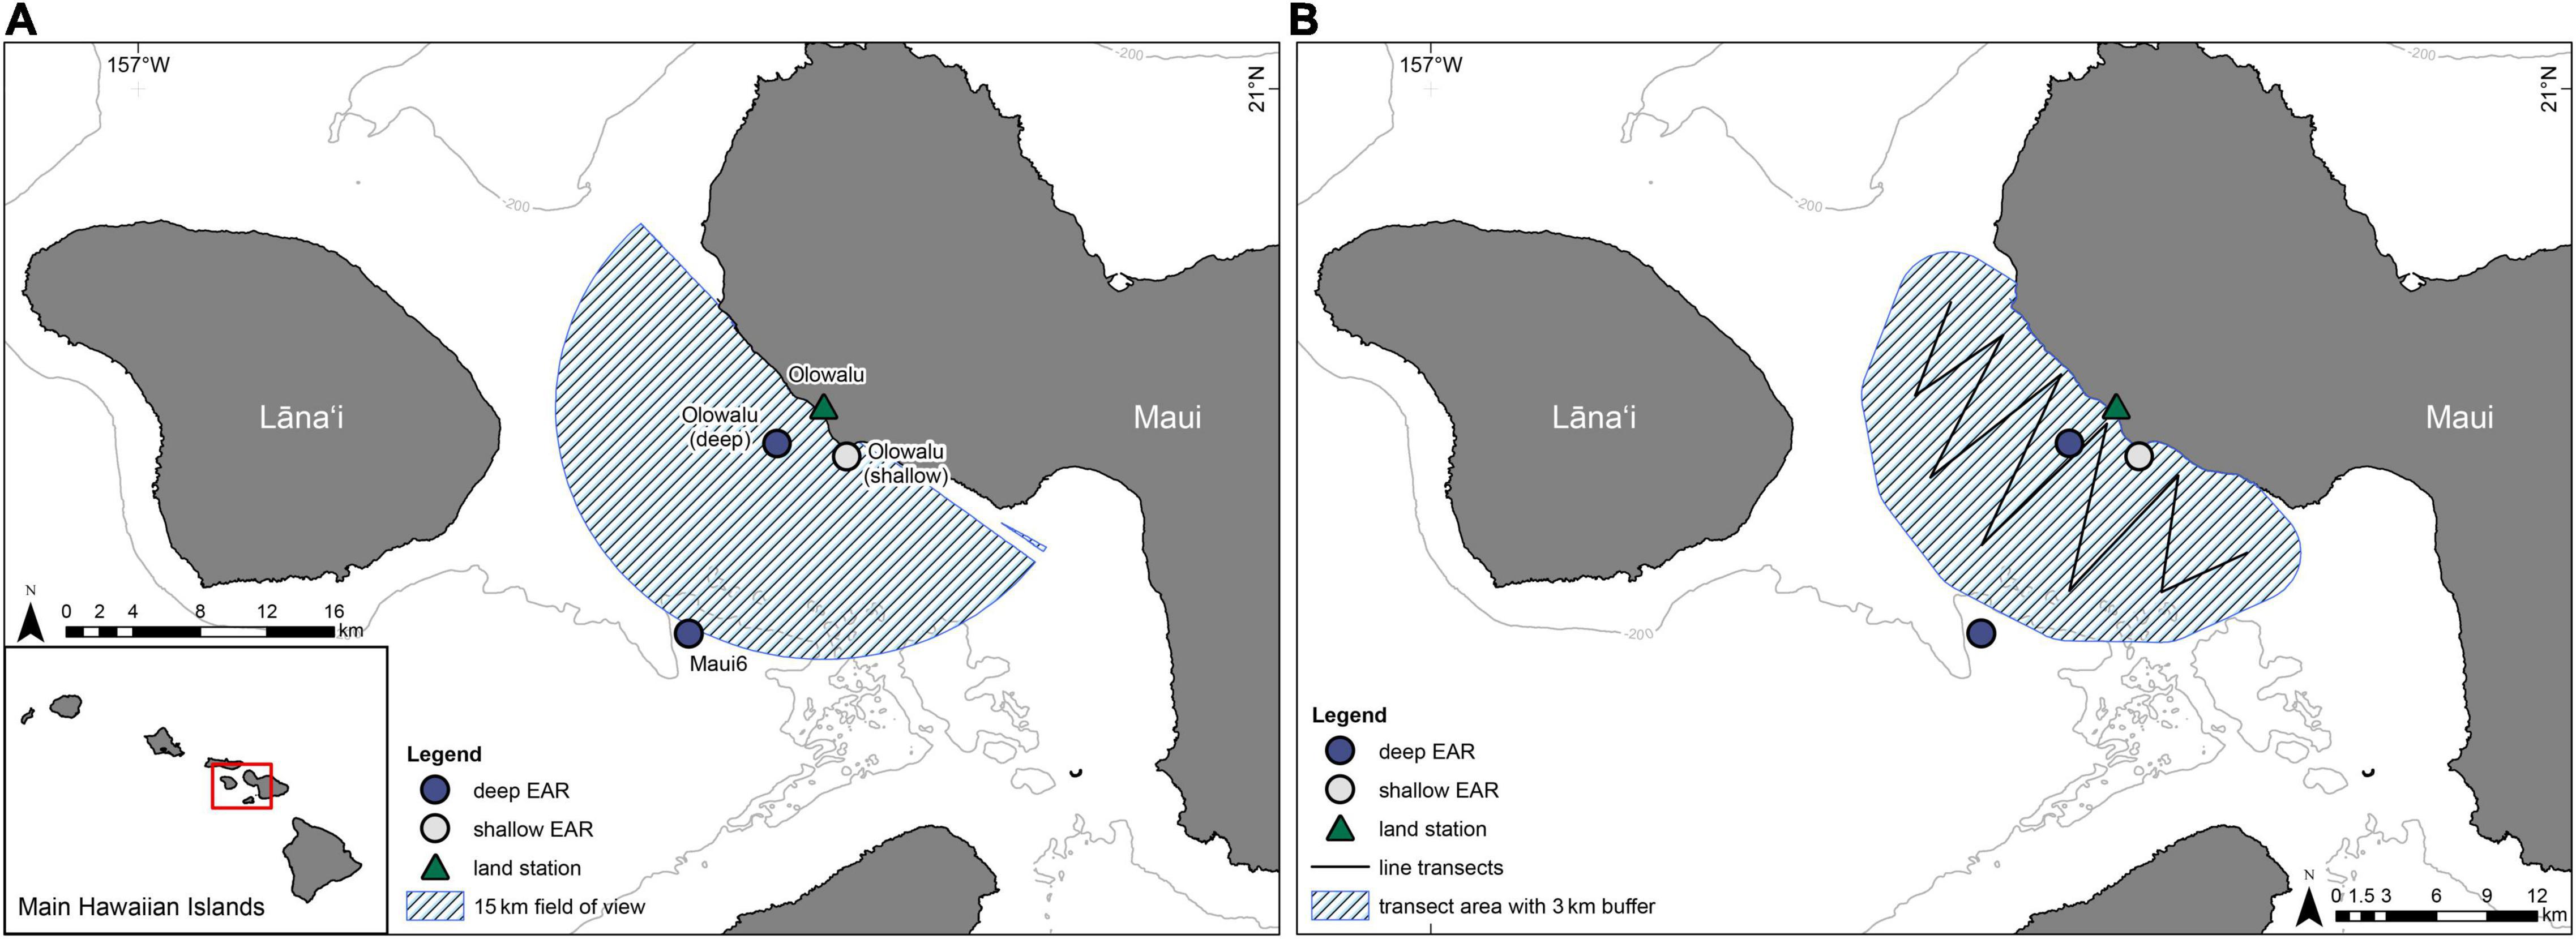
Figure 2. The locations of two deep-water Ecological Acoustic Recorders, EARs (dark blue circles) and one shallow-water EAR (light-gray circle) that were deployed between 2016/17 and 2020/21 and the location of the Olowalu land observation station (triangle). (A) The hatched area shows the 15 km field of view from the Olowalu land station. (B) The line shows the transect legs for the vessel surveys in the 2018/19 through 2020/21 seasons where the hatched area is the approximate area covered during the surveys including a 3 km buffer.
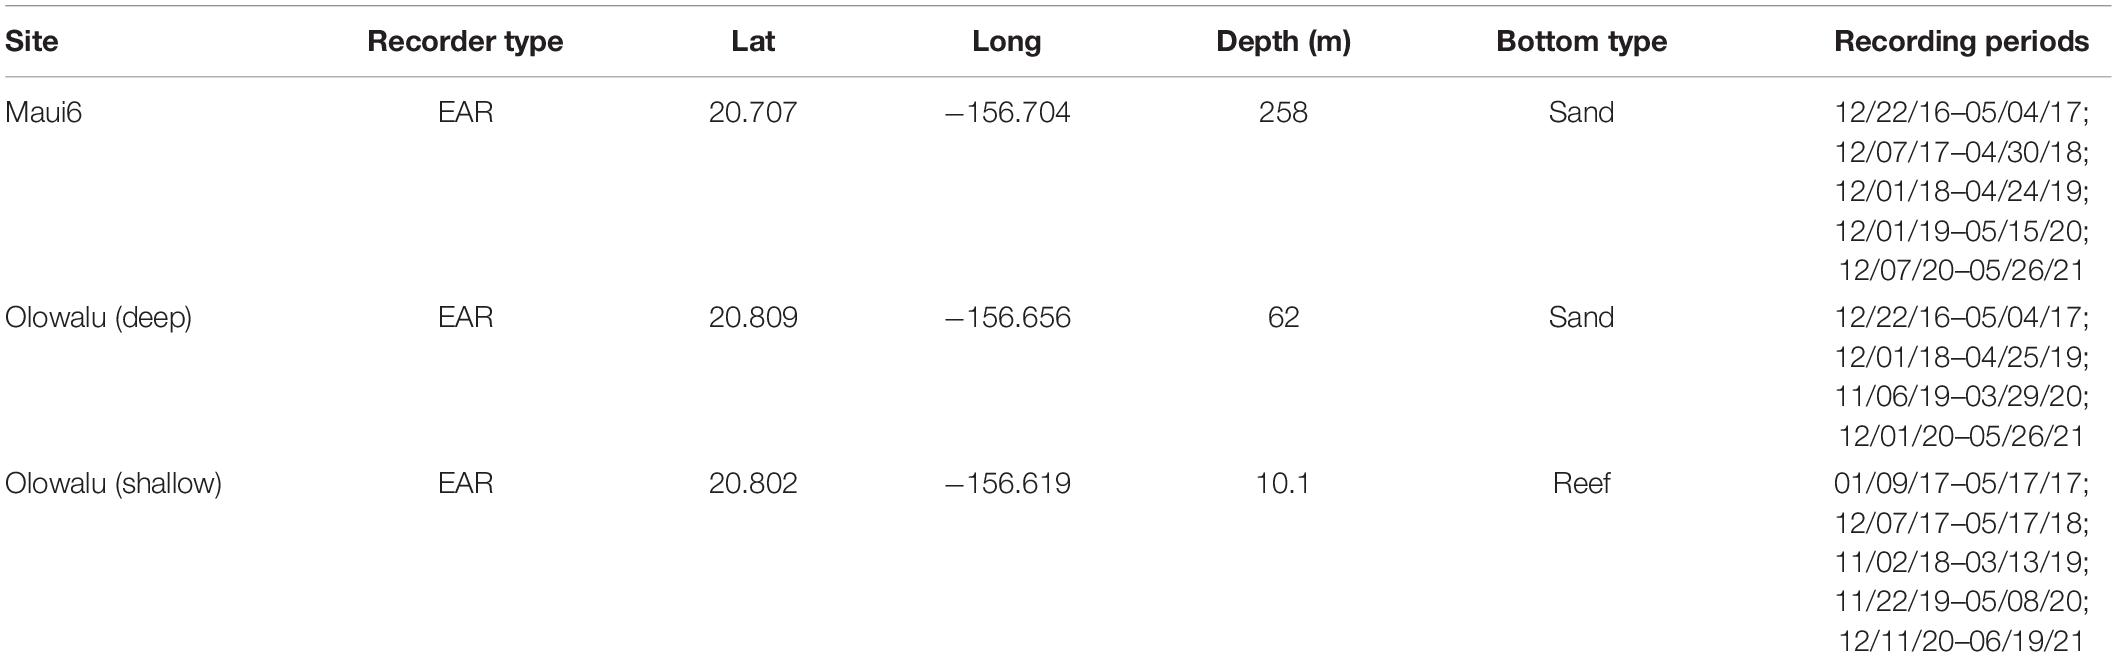
Table 1. Summary of EAR site, location, depth, and bottom type for continuous recording periods during the Hawaiian whale season (approx. December through April) 2016/17 through 2020/21 for two shallow and one deep EARs off Maui, Hawai‘i.
Land-Based Visual Surveys
Throughout each whale season, visual land-based scan samples (Martin and Bateson, 1986) were conducted one to three times each week from a hill near Olowalu on west Maui (20.829, −156.6315, 83.7 m elevation; Figure 2) one to three times each week. The total field of view was scanned for whales once per scan from one end across to the other at a slow and steady rate by the same observer during all surveys, using a pair of Bushnell 7 × 50 marine binoculars. Scans took place for 30 min every hour, up to seven times starting at 08:00 local standard time, weather permitting. The scanning direction was alternated during the first year and randomized during all subsequent years to reduce bias by inadvertently spending unequal amounts of time surveying an area segment at the beginning or the end of each scan. Any whale or group of humpback whales, regardless of number of individuals, was called a pod. When a pod was sighted, the location in vertical and horizontal angles was fixed by the observer with a Lietz DT5 digital surveyor’s theodolite and digitally transferred to a computer upon prompt by the computer operator whilst the observer continued their scan. The geo-referenced program Pythagoras (Gailey and Ortega-Ortiz, 2000) automatically converted the time-stamped angles into latitude and longitude coordinates in real-time and calculated the distance of the fix from the land station. Additional metadata that were entered into Pythagoras by the computer operator with each fix included the immediately observable pod composition (whale, dyad, competitive pod = comp pod, mother-calf pair = M/c, mother-calf-escort = M/c/E) and behavior (blow, surfacing, fluke up dive, surface active, resting/logging) as called out by the observer. Because these were immediate assessments and no prolonged time was spent observing pods to refine their composition and behavior before continuing with a scan, recorded pod composition and behavior were considered conservative estimates, with the presence of a calf likely underreported because of its relatively small size and profile at the surface. In terms of defining pod compositions, all pods of the “whale” category consisted of a single observed blow or tail fluke, but true solitary status could not be unequivocally confirmed. Although a humpback whale competitive group traditionally consists of two or more males competing for access to a single female, for our purposes a comp pod was specified simply if the pod contained at least three adult whales regardless of whether competitive behavior was observed or not. If possible, the true minimum number of whales in a comp pod was noted, but we assume an underestimation of the actual number of whales as this often was not feasible given the survey design and protocols. Dyads consisted of two non-calf whales. Mother-calf pairs were designated based on the sighting of an adult-sized whale and a whale in close proximity approximately 1/3 the size of the adult. If a third whale of adult size was present in this group, the pod was designated as a mother-calf-escort.
If a pod could not be fixed with the theodolite, compass bearing and distance in reticles were determined with the binoculars and noted as a time-stamped “non-fix” with the same composition and behavior information as fixes. During each scan, no pod was recorded twice to avoid pseudo-replication. Scans were conducted in a non-focal-follow manner and regarded as discrete; thus any pod was recorded as a new pod in subsequent scans, even if previously fixed. Environmental data (glare, visibility/haze, Beaufort sea state, wind speed, wind direction) were collected prior to each scan or when conditions changed during a scan. Scans were conducted in conditions of Beaufort sea states of 3 or less (to maximize the sightability of whales including calves; cf. methods described in e.g., Craig et al., 2014), wind speeds at the land site under 15 knots, and dry conditions.
Vessel-Based Visual Surveys
During the 2018/19, 2019/20, and 2020/21 whale seasons, vessel-based surveys following a line-transect design (Figure 2) were conducted using the Hawaiian Islands Humpback Whale National Marine Sanctuary’s R/V Koholā, a 11.6 m long, two-level rigid-hulled inflatable boat. The vessel travelled along the transect lines at a nominal speed of 10 knots (±2 knots) during surveys. Two observers positioned on each side of the flying bridge located 3.5 m above sea level, respectively, scanned the starboard and port sides. The observers actively scanned using unaided eyes from 90° abeam of their side of the vessel to 10° beyond the midline of the bow, resulting in a 100° viewing arc each. Upon sighting of a humpback whale pod, an observer measured the angle between the sighting and the track line using a TrekGuideLITE™ digital compass, obtained the minimum, maximum and best estimated number of animals, and estimated the distance in meters between 0 m and 2,000 m and in 2,000–2,500 m, 2,500–3,000 m, and >3,000 m bins, respectively, for distances greater than 2,000 m. These metrics were reported to a data recorder while the other observer continued to scan and the vessel maintained travel speed and distance. All observers underwent intensive on-water training in distance estimation from the vessel prior to formal surveys. In addition, each survey day, the observers were calibrated by obtaining blind estimates for six randomly chosen distances from a fixed reference buoy whose true distance was logged by the vessel captain. These estimates were subsequently used to obtain calibration curves for each observer and accordingly correct all sighting distance estimates obtained while on effort (Zang and Lammers, 2021). All sighting information as well as the GPS position of the vessel and the time of the sighting were logged into a custom digital form created in the program Poimapper™ on an Apple iPad mini® by the data recorder. Additional environmental data (sea state, swell size in m, cloud cover, wind speed, glare) were collected at the beginning of each transect leg or when conditions changed.
Port observer, starboard observer, and data recorder rotated every two transect legs to reduce fatigue. Survey effort was conducted in conditions that ranged between Beaufort sea state 0 and 4. If the sea state exceeded 4, effort was paused while the vessel continued to travel along the track line until conditions improved or until the survey was aborted due to unworkable conditions.
Data Processing and Analysis
Acoustic Data
All acoustic recordings were down-sampled to a 3 kHz sample rate using Matlab (MATLAB and Statistics Toolbox Release 2015b, The MathWorks, Inc., Natick, MA, United States), resulting in a 0–1.5 kHz analysis bandwidth, which corresponds to the range where the majority of humpback whale song units have their peak frequencies (Payne and McVay, 1971; Au et al., 2006) and reduces influences from snapping shrimps (Au and Banks, 1998) and environmental sounds such as wind and waves (Urick, 1983). A custom Matlab program converted the 30 s recording from sample values to pressure, calculated the root-mean-square sound pressure levels (RMS SPL), and converted the result into dB re 1 μPa2 (following standards described in Ainslie et al., 2018), as
where T is the duration of each file (30 s) and p(t) is the pressure p re 1 μPa2 at time t. Humpback whale chorusing is the dominant source of low-frequency acoustic energy during the whale season (Au et al., 2000; Au and Green, 2000), therefore RMS SPL is a representative metric of the cumulative amount of singing happening during any given 30 s recording period.
All subsequent data processing and statistical analyses were conducted in R 4.0.1 (R Core Team, 2016). The median RMS SPL in dB re 1 μPa2 was calculated for each day and recording site. This reduces auto-correlation within the time-series, as recordings are not independent from each other when a song continues over several files. It also reduces the impact of outliers from intermittent high-intensity noise (such as transiting small vessels) and from individual whales singing close to the recorders, temporarily increasing the SPL levels of individual recordings. Daily medians were selected that coincided with concurrent land-based and/or vessel-based survey days (cf. Table 2).
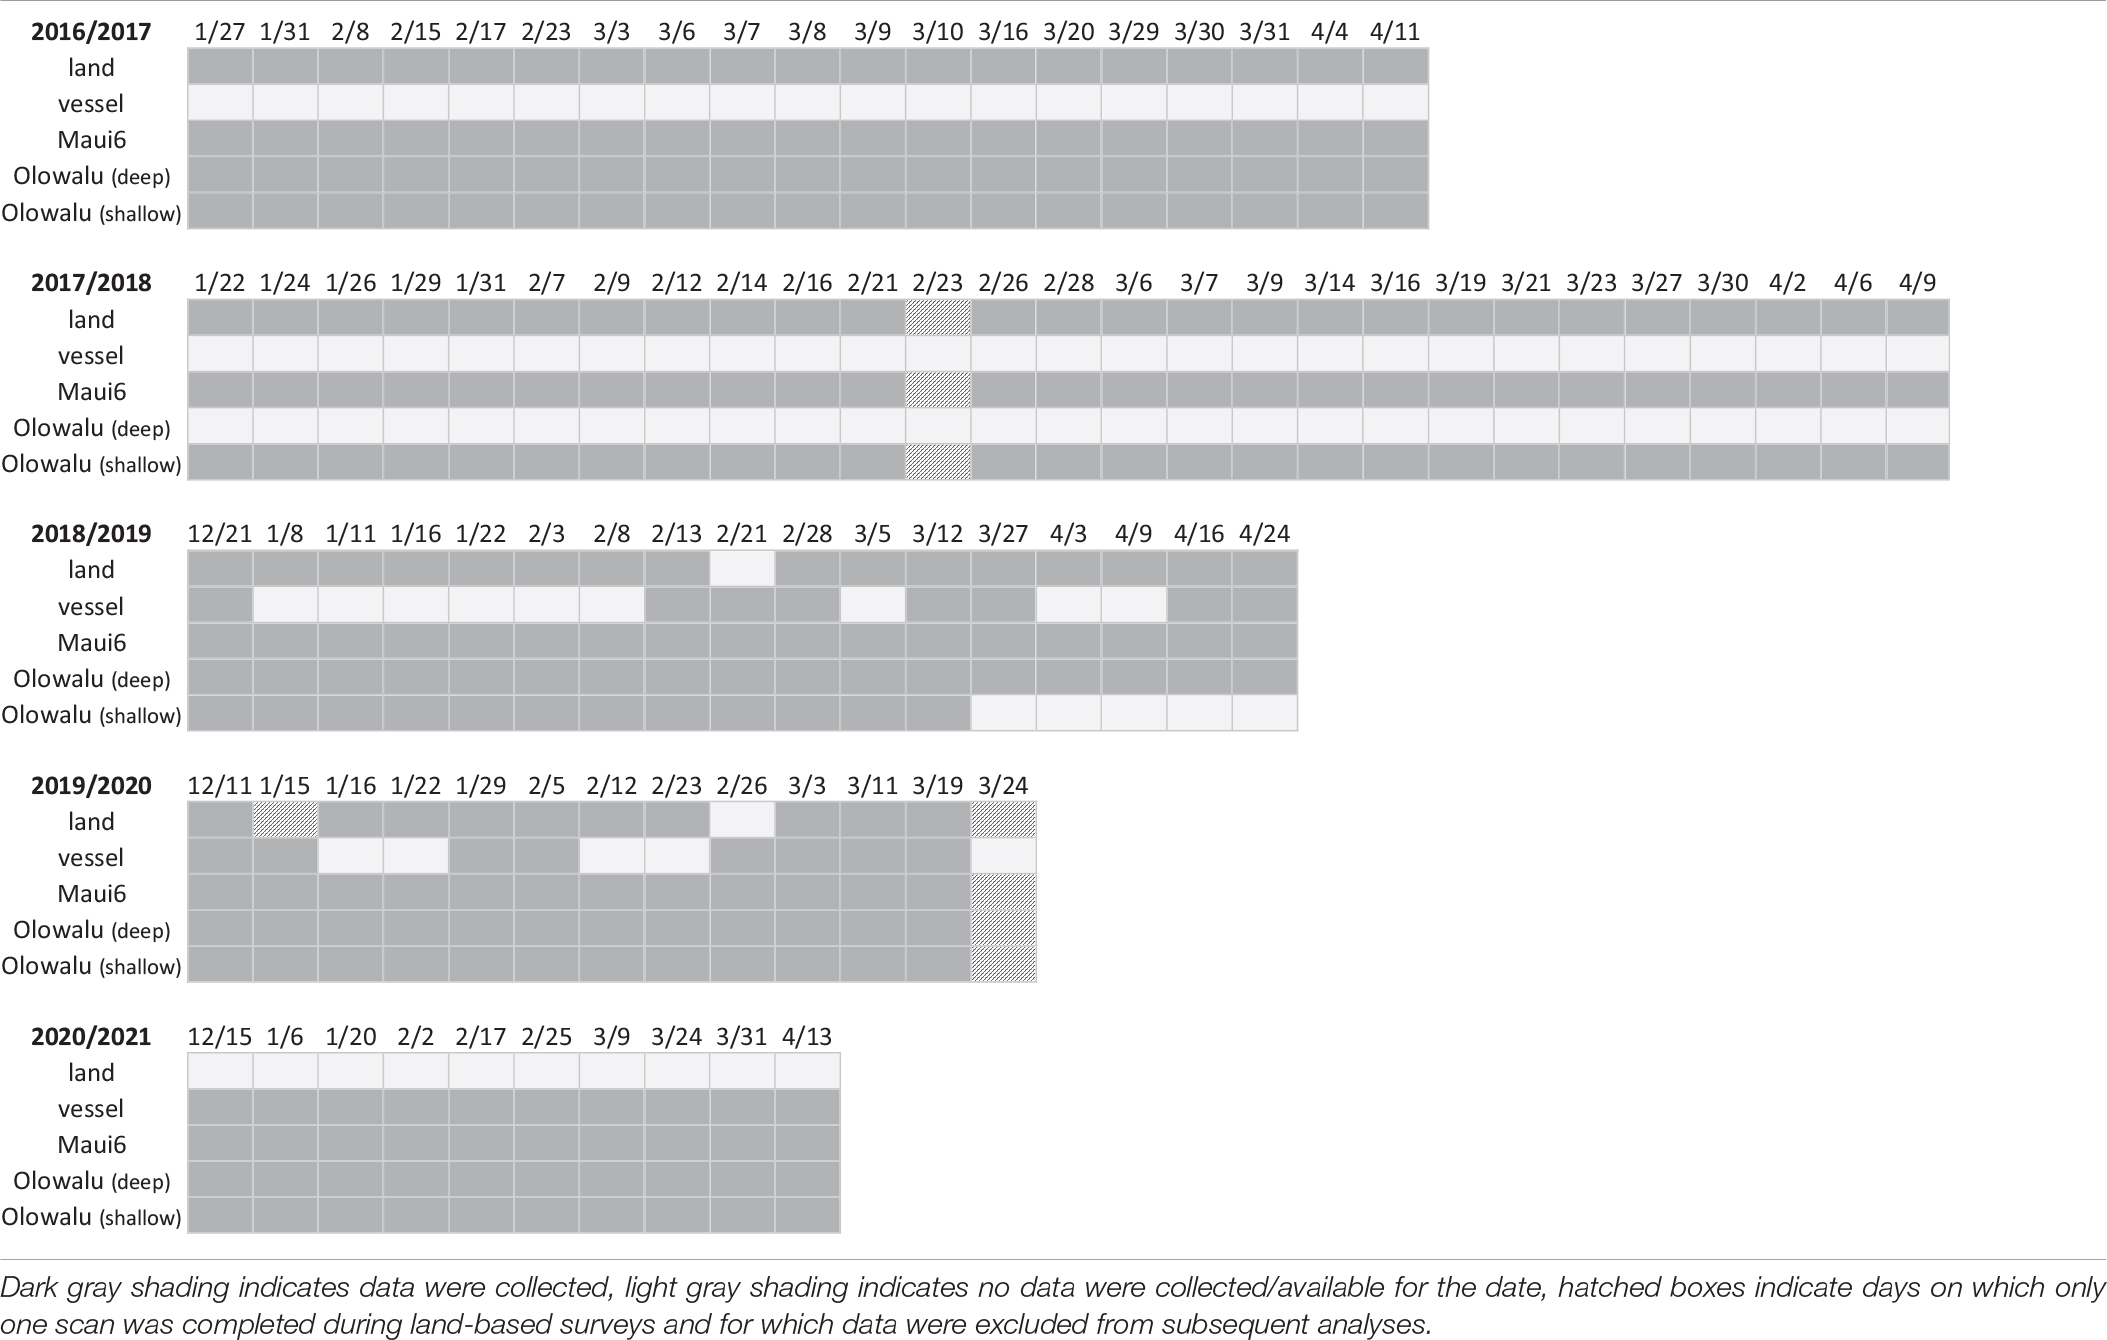
Table 2. Summary of survey effort for land-based visual (land) and vessel-based line-transect (vessel) surveys off west Maui between 2017 and 2021 and whether acoustic data were obtained from the three acoustic recorders on the same day.
Land- and Vessel-Based Whale-Sighting Data
Compass bearings and reticle distances of all non-fix observations from the land station were converted into latitude and longitude coordinates with an adapted version of the whalemap() function of the bangarang package (Keen, 2016); the function also calculates distance to the observer. All pods with distances greater than 15 km were excluded, to create a field of view that is approximately equal to the area covered by the vessel surveys and extends to the offshore Maui6 EAR (Figure 2). Three days during which only one scan was completed due to poor weather were excluded from further analysis (cf. Table 2).
For all pods, the number of individual whales was calculated depending on their composition as: “whale”: n = 1, “dyad”: n = 2, “M/c”: n = 2, “M/c/E”: n = 3, “comp pod”: n = 3 or whatever number of whales above three was detected upon sighting. The total number of pods and total number of whales were determined for each completed scan per survey day. As noted earlier, the same pod was potentially fixed repeatedly during consecutive 30 min scans of the same area. Therefore, calculating the total number of whales per day could result in pseudo-replication and misrepresentation of the actual number of whales present during the survey. Instead, the daily median number of whales per scan was determined, thereby also standardizing for differences in the number of completed scans among days due to factors such as weather. The proportion of pods with a calf and the proportion of competitive pods were calculated from the total number of pods per day and the daily total number of the respective two pod types.
For each day of vessel surveys, absolute abundance and density estimates were calculated using the Distance package (Miller et al., 2019). A full discussion of the analysis resulting in those estimates can be found in Zang and Lammers (2021). Applying the same protocol as for the land-based data, any pod observed during transects was considered a comp pod when the best estimate for group size was at least three adult whales, and the proportion of competitive pods as well as the proportion of pods with a calf were calculated from the total number of observed pods per survey. If a comp pod contained a calf, it was included in both categories.
Statistical Analysis
Multivariate models were fit to the data to determine the quantitative and qualitative relationship between abundance of whales and chorusing. To select the model that best describes the data following initial visual exploration, non-linear least squares models using the nls() function from the base stats package in R for SPL ∼ whales were fit for a linear, quadratic, logistic, and asymptotic relationship for each recorder site and survey type (cf. Figure 3 for visualizations from Maui6 as a representative example), where “whales” was the median number of whales per 30 min scan for land-based surveys and density in whales per square-kilometer for vessel-based surveys. Bias-corrected second-order Akaike Information Criteria (AICc) for each model per site were calculated using the AICc() function from the MuMIn package (Bartoń, 2020). Pairwise differences between the AICc with the lowest value and all other model AICcs (ΔAICc) were also calculated for each site and survey type. Different models were considered to support the data the same if their ΔAICc was not greater than 2. For all three recorder locations and the vessel-based data as well as Maui6, Olowalu—shallow—and the land-based data, the quadratic model had the lowest AICc values, followed by the logistic and the asymptotic models (Table 3). For the land-station and the deep Olowalu location, the logistic model had the lowest AICc, but the quadratic, logistic, and asymptotic models were all equally supported by the data. The linear model had the least support overall. A second-degree polynomial model was therefore chosen for subsequent analysis.
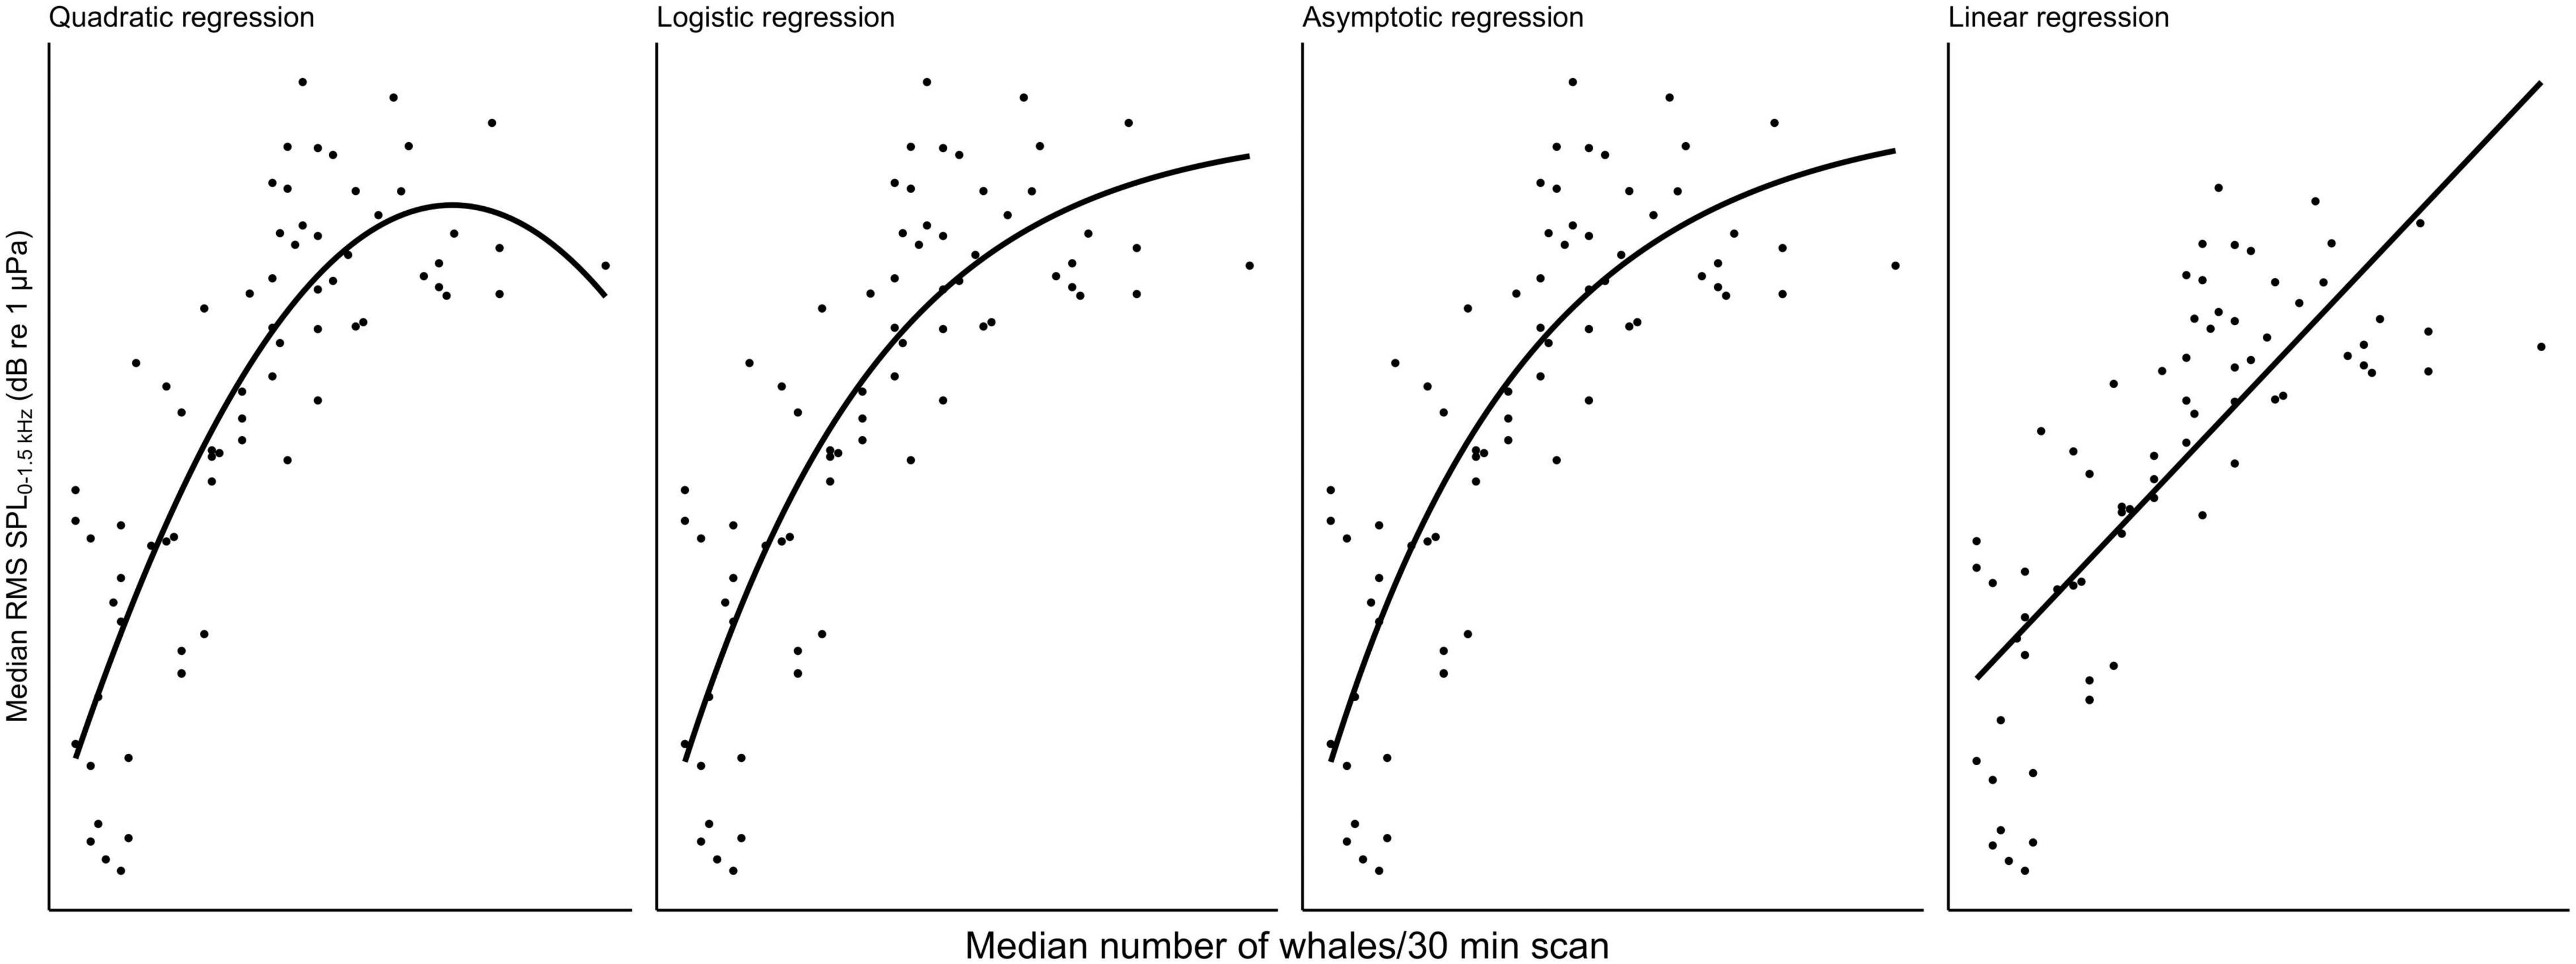
Figure 3. Comparison of four different types of regression fit with a non-linear least squares model for median daily root-mean-squared sound pressure levels (RMS SPL) in dB re 1 μPa2 in the 0–1.5 kHz frequency band recorded at the Maui6 EAR site off Maui, Hawai‘i and median number of whales per 30 min scan from a land station.
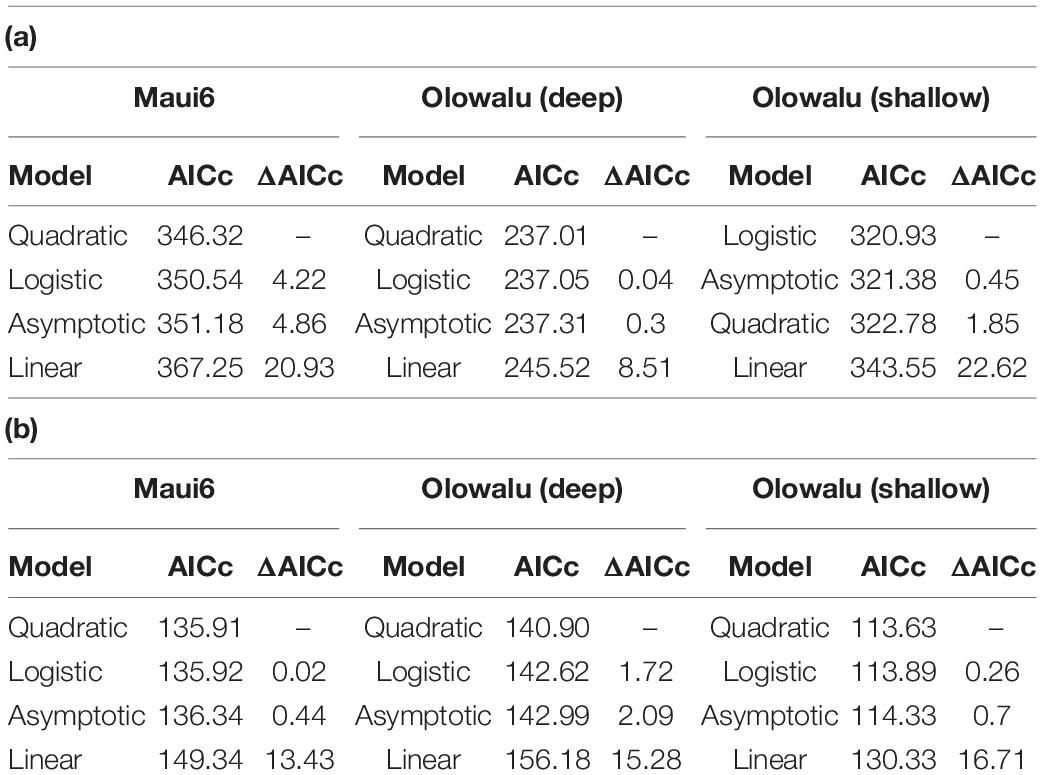
Table 3. Evaluation of four different models for the recorder location-specific relationship between daily median RMS SPL (dB re 1 μPa2) and: (a) median number of whales per 30 min scan from land, (b): density estimates (whales/km2) from vessel-based line-transect surveys.
To describe the quantitative relationship between (relative) abundance of whales (whales) and average cumulative chorusing levels (SPL), a generalized linear model (GLM) was fit with the glm() function from the stats package using the equation,
where ß0 is the intercept, ß1 and ß2 are the respective parameter coefficients, Site is a factor for the three EAR locations, and ε is the error term. Two separate GLMs were fit, one for the land-based data and one for the vessel-based data. In both models, there were no significant interactions between whales and recorder location (land: χ2 = 5.65, DF = 4, p = 0.23; vessel: χ2 = 0.48, DF = 4, p = 0.98), so a Site interaction was excluded from subsequent modeling.
To explore other factors impacting chorusing levels as well as the relationship between whale numbers and chorusing levels, a generalized additive model (GAM) was fit with the mgcv package (Wood, 2006) with the following equation,
where %calves is the percentage of pods with a calf per day, %compPods is the percentage of competitive pods per day, and day.season is the count of days into the season for the survey date, with the first day of the season defined as December 1st. For GLMs, Type II likelihood ratios were determined with the Anova() function from the car package (Fox and Weisberg, 2019) and a statistical significance of α = 0.05 was used. For the GAM, likelihood ratios were determined with the summary() function from the mgcv package and using α = 0.05.
While full models including Season main effect and interaction terms suggested that the relationship between whale numbers and chorusing levels significantly differed across the different whale seasons (but not sites), we argue that this is an artifact of survey bias from small sample sizes rather than a true underlying biological difference between years. By pooling our data across years, we increase our overall sample size and therefore the statistical power of our models, and are thus better able to achieve our goal of describing a generalized relationship between whale abundance and RMS SPL.
Results
Recordings during the breeding season were obtained for five consecutive years between 2016/17 and 2020/21 for two recording sites (Maui6 and Olowalu—shallow) and for 4 years at the deep Olowalu EAR site (2017, 2019, 2020, 2021). A total of 74 visual surveys from the Olowalu land station (2017: n = 19, 2018: n = 26, 2019: n = 16, 2020: n = 12) and 26 vessel-based line-transect surveys (2019: n = 8, 2020: n = 8, 2021: n = 10) were conducted. Three land survey days (one in 2018 and two in 2020) were excluded because only one scan was completed, resulting in 71 days with data that were analyzed. The overlapping survey effort for the different methods is summarized in Table 2.
Overall, daily median RMS SPL levels ranged from 88.67 to 114.78 dB re 1 μPa2 at Maui6 (Median ± SD in 2017: 104.58 ± 5.20, 2018: 100.80 ± 5.58, 2019: 103.75 ± 6.04, 2020: 105.22 ± 6.75, 2021: 106.63 ± 6.10), from 90.18 to 121.85 dB re 1 μPa2 at Olowalu (deep) (Median ± SD in 2017: 109.22 ± 6.43, 2019: 110.48 ± 7.32, 2020: 115.43 ± 8.23, 2021: 113.17 ± 5.93), and from 94.95 to 118.99 dB re 1 μPa2 at Olowalu (shallow) (Median ± SD in 2017: 109.86 ± 5.39, 2018: 107.06 ± 4.98, 2019: 109.35 ± 7.10, 2020: 109.48 ± 7.1, 2021: 110.67 ± 6.07). RMS SPL daily medians showed a strong seasonal pattern with an increase in December through January, a peak between February and March, and a decreasing trend through April (Figure 4).
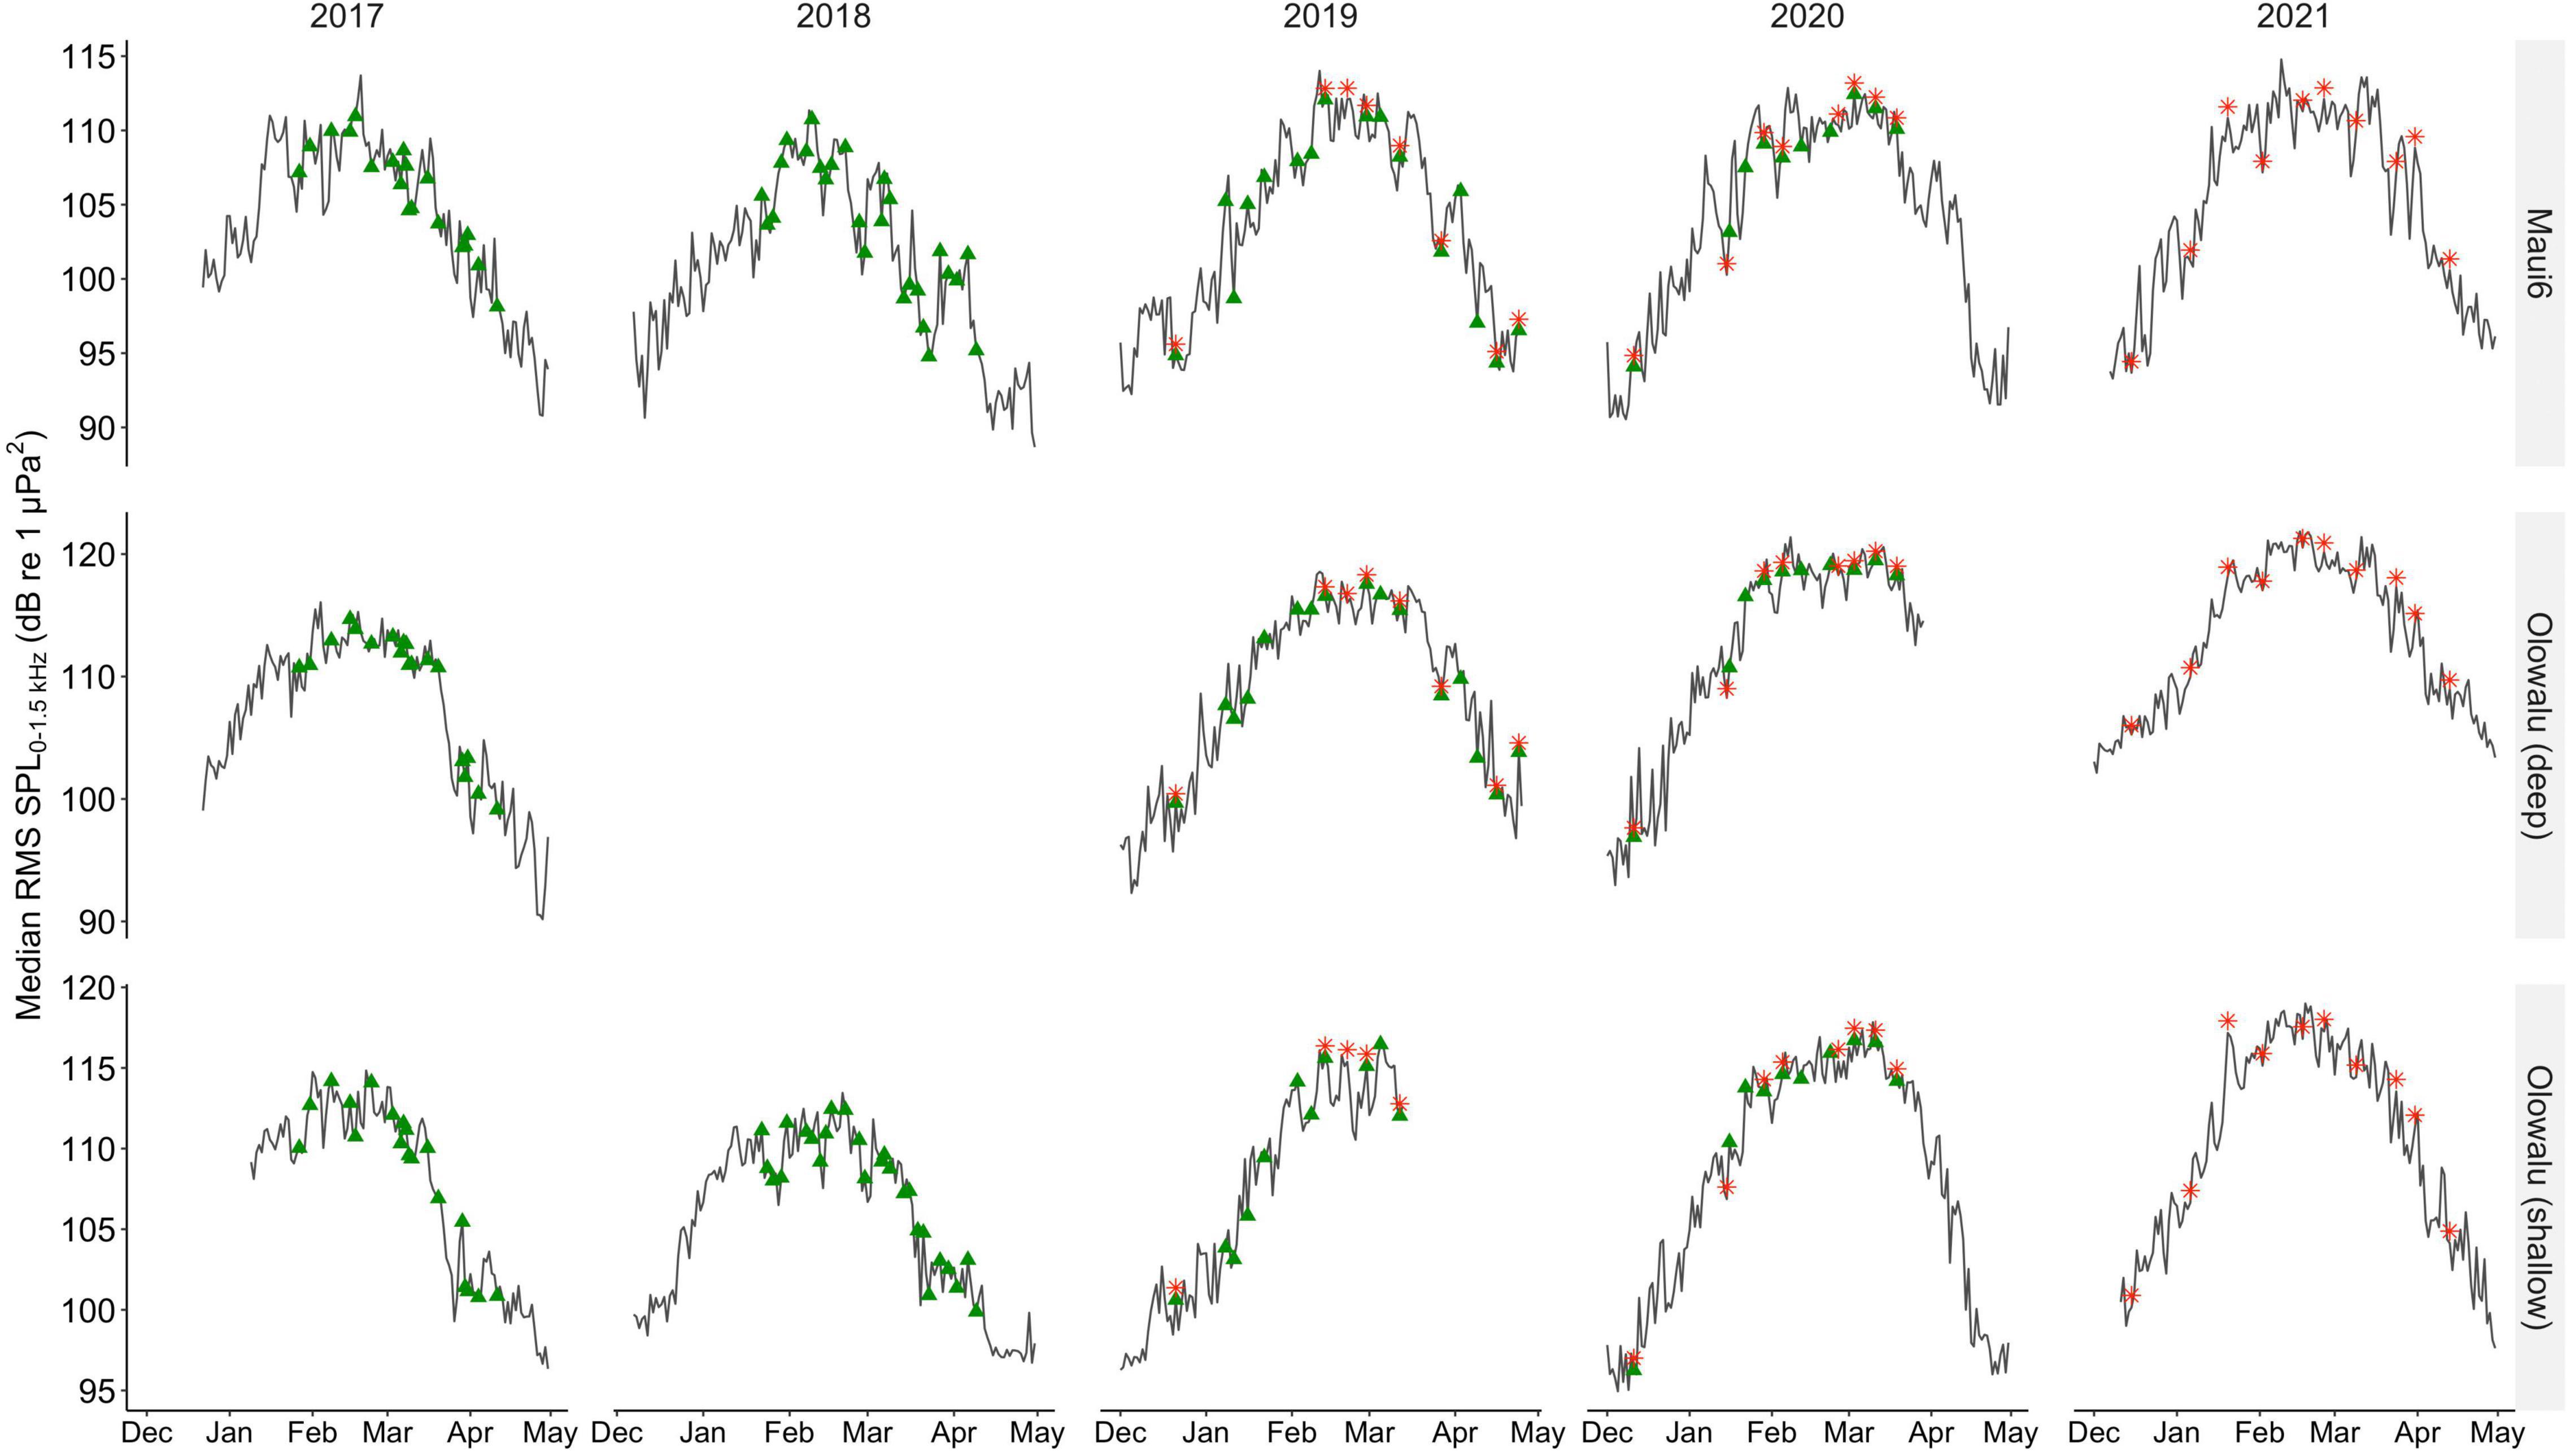
Figure 4. Median daily root-mean-squared sound pressure levels (RMS SPLs) in dB re 1 μPa2 in the 0–1.5 kHz frequency band, between 1 December and 30 April of 2016 through 2021 at two deep (Maui6, Olowalu—deep) and one shallow (Olowalu—shallow) EAR sites off Maui, Hawai‘i. Green triangles indicate dates of visual surveys from the Olowalu land station; red asterisks indicate dates of vessel-based line-transect surveys.
The median number of whales per 30 min scan from the land station ranged from 2 to 37 (Median ± SD in 2017: 13.50 ± 6.57, 2018: 11.25 ± 7.47, 2019: 14.50 ± 8.59, 2020: 20.25 ± 9.86). Density estimates from the vessel surveys ranged from 0.12 to 1.85 whales/km2 (Median ± SD in 2019: 0.53 ± 0.61 whales/km2, 2020: 1.07 ± 0.47 whales/km2, 2021: 0.62 ± 0.53 whales/km2). Whale numbers from both visual survey methods showed the same seasonal patterns as described for the acoustic data.
Quantitative Relationship Between Chorusing Levels and Whale Numbers
The GLMs showed that the number of whales (land: χ2 = 454.27, df = 2, p ≪ 0.001; vessel: χ2 = 312.54, df = 2, p ≪ 0.001) and recording location (land: χ2 = 134.18, df = 2, p ≪ 0.001; vessel: χ2 = 89.59, df = 2, p ≪ 0.001) are significant predictors of RMS SPL (Figure 5). Both the linear and the quadratic term of number of whales are significant (land: χ2linear = 177.542, plinear ≪ 0.001, χ2quadratic = 62.304, pquadratic ≪ 0.001, vessel: χ2linear = 138.03, plinear ≪ 0.001, χ2quadratic = 67.84, pquadratic ≪ 0.001), supporting the second-degree polynomial relationship between whale numbers and chorusing levels. Coefficient of determinations, R2 ranged from 0.71 to 0.75 for the land-based data (Maui6: R2 = 0.71, Olowalu—deep: R2 = 0.76, Olowalu—shallow: R2 = 0.71) and from 0.81 to 0.85 for the vessel-based data (Maui6: R2 = 0.82, Olowalu—deep: R2 = 0.81, Olowalu—shallow: R2 = 0.85). All parameter estimates from the model and predicted maximum RMS SPL (SPLmax) values are summarized in Table 4.
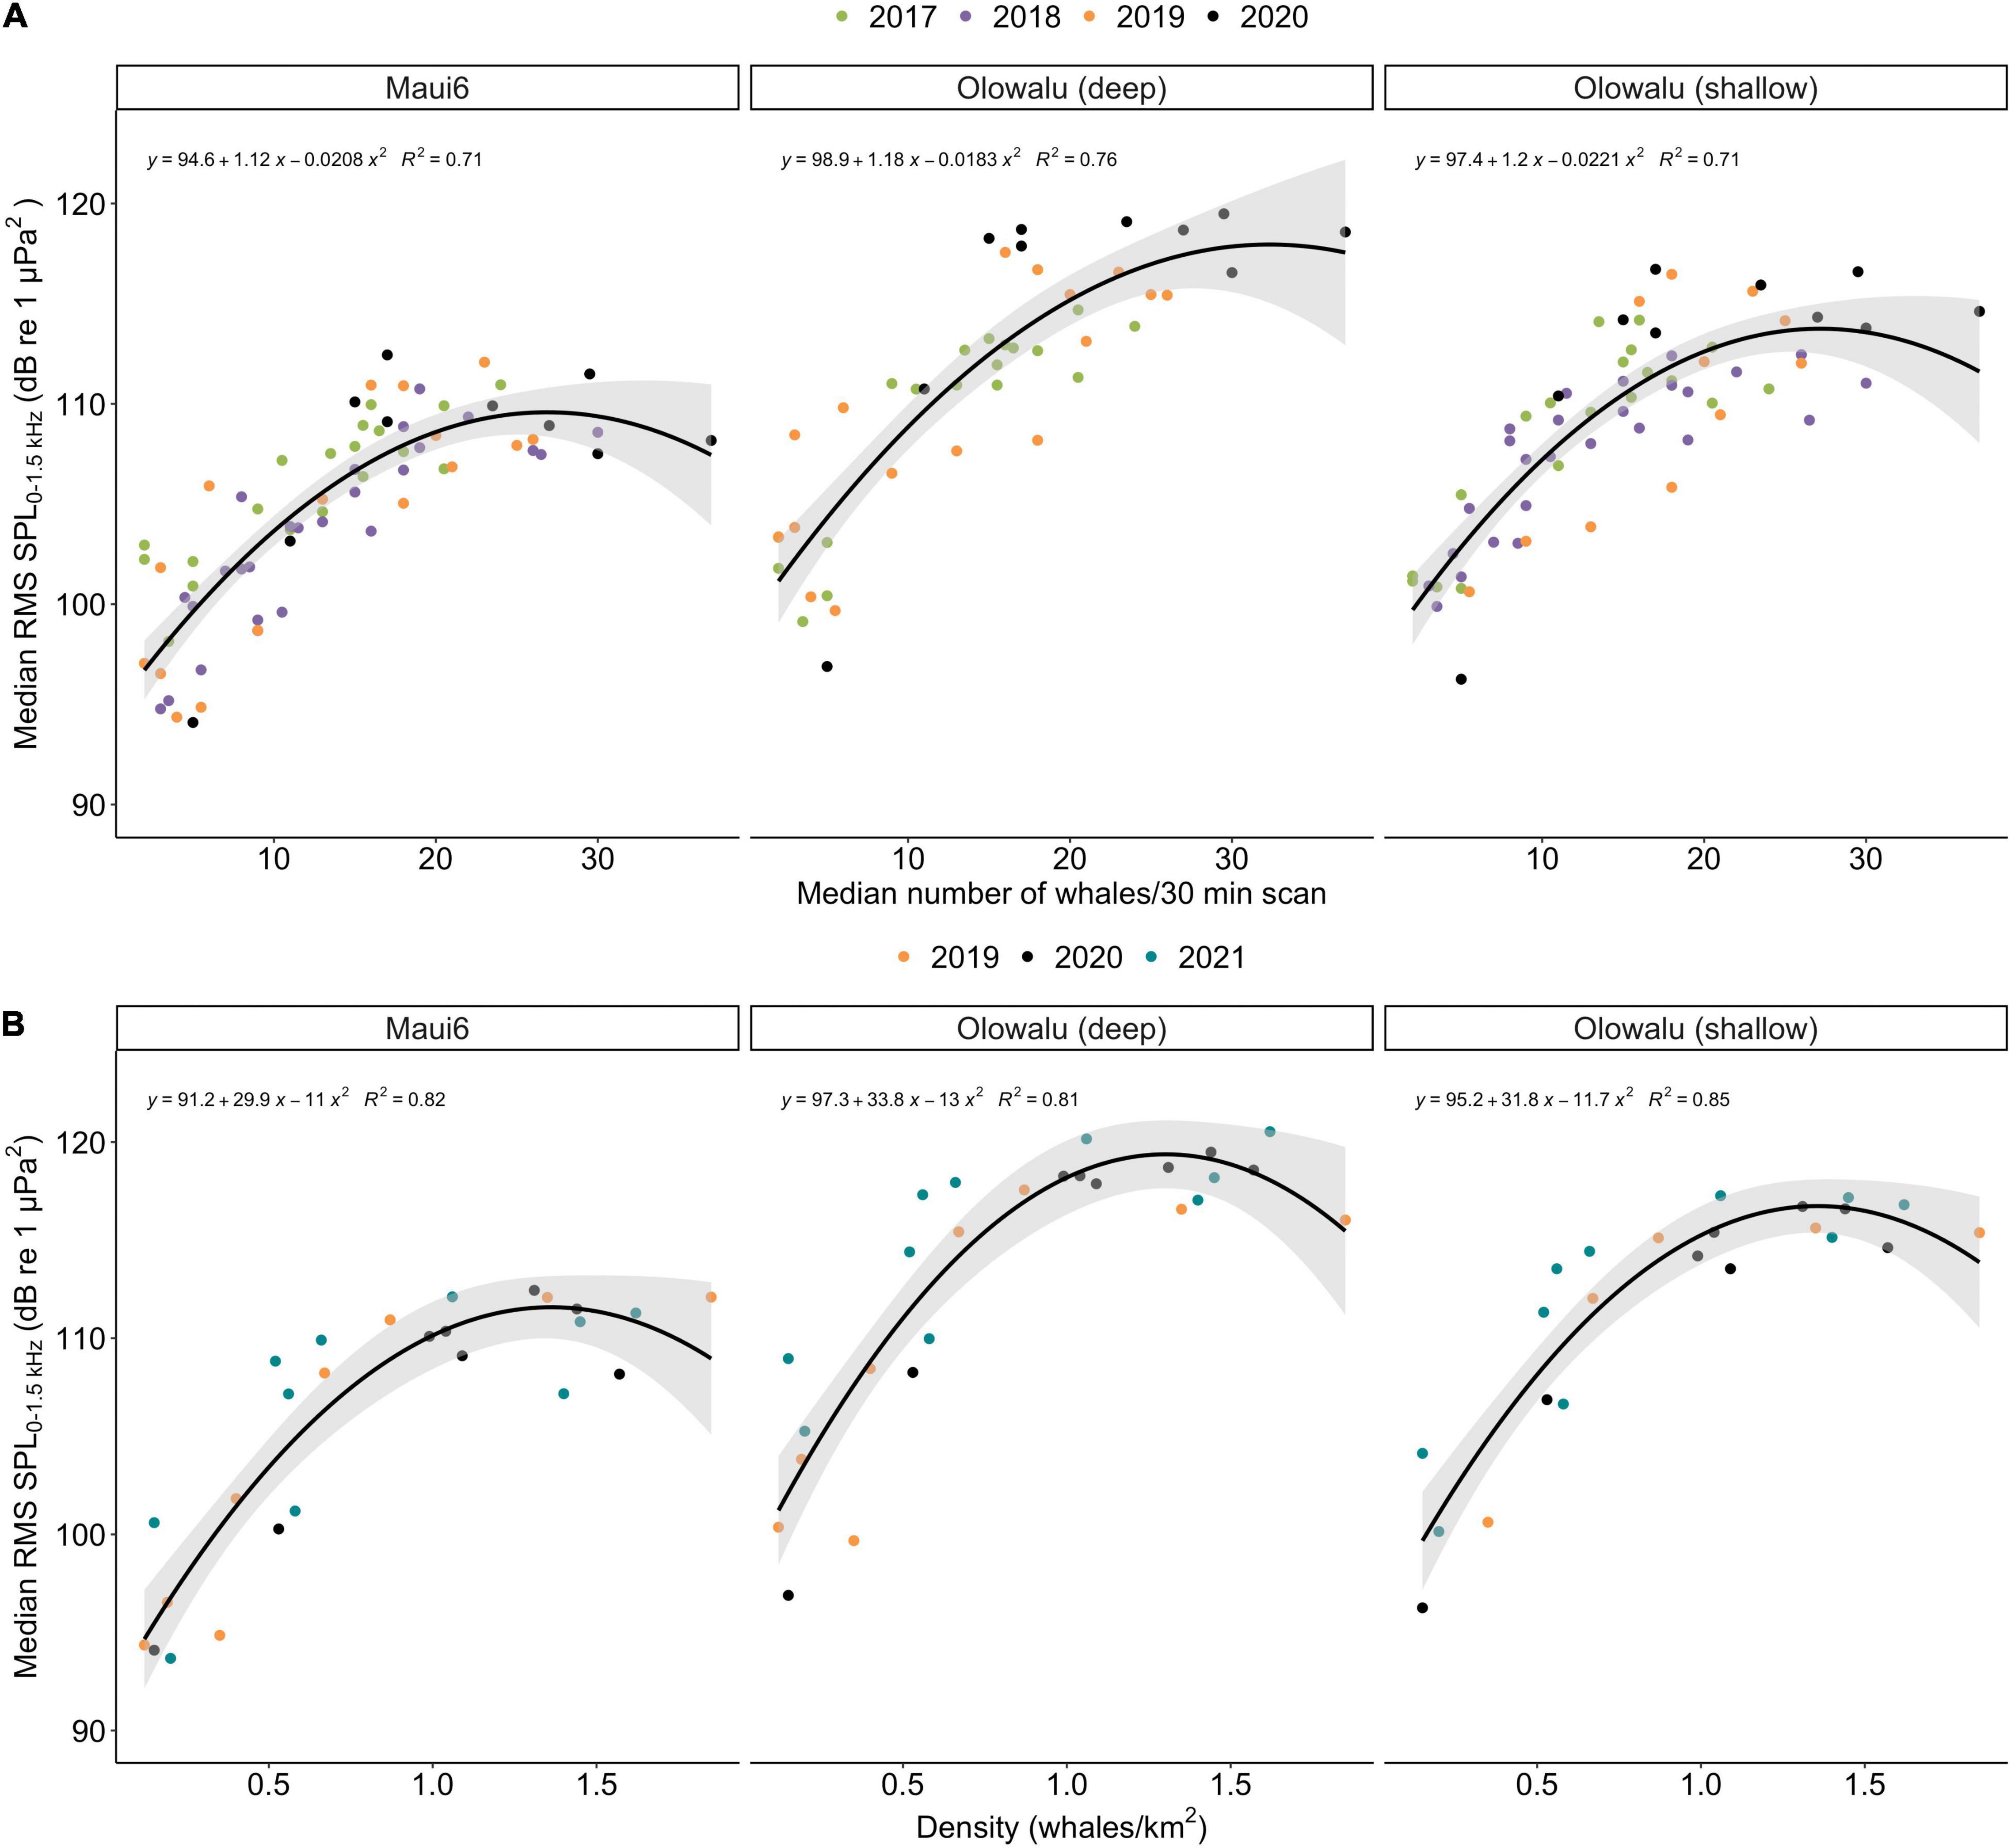
Figure 5. Median daily root-mean-squared sound pressure levels (RMS SPL) in dB re 1 μPa2 in the 0–1.5 kHz frequency band recorded at three EAR locations off Maui, Hawai‘i and whale numbers; (A) median number of whales per 30 min scan from a land station (n = 71) between 2017 and 2020, (B) density estimates from vessel-based line-transect surveys (n = 26) between 2019 and 2021. No acoustic monitoring was conducted at Olowalu (deep) in 2018. Lines show the regressions from a second-degree generalized linear model for each EAR site; shaded areas are the respective 95% confidence intervals. Equations indicate parameter estimates and R2 values from the models.
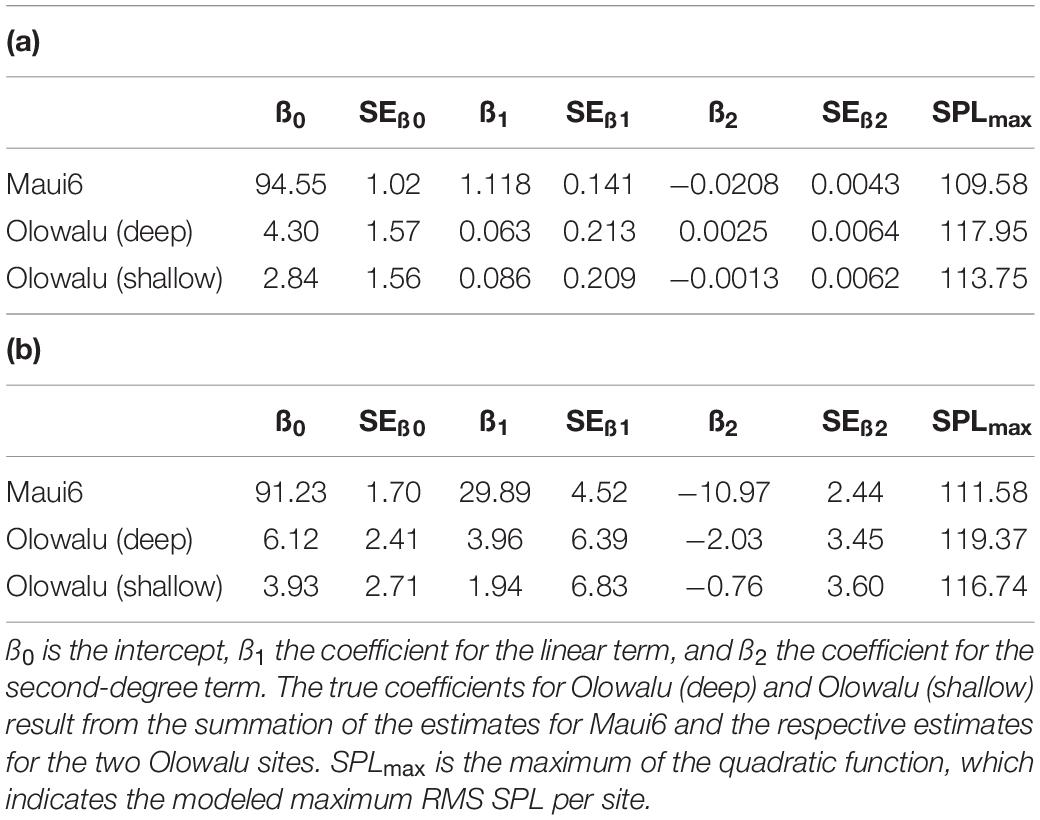
Table 4. Coefficient estimates and their standard errors (SE) from a generalized linear model (GLM) fitting a second-degree polynomial relationship between daily median RMS SPL (dB re 1 μPa2) and (a) median number of whales per 30 min scan observed from a land station and (b) abundance estimates from vessel-based line-transect surveys for three recorder locations.
Whale densities (whales/km2) off West Maui can be estimated for a known RMS SPL value up to ∼SPLmax as:
where SPLmax is the SPL value at the maximum of the quadratic regression curve. Alternatively, density estimates that include a standard error as a measure of uncertainty can be obtained from the model fit with glm() using the invest() function from the investr package in R (Greenwell and Schubert Kabban, 2014).
Qualitative Relationship Between Chorusing Levels and Whale Numbers
When adding additional covariates in a GAM framework for the land-based data, number of whales remains a significant predictor of SPL (F = 106.529, edf = 1.969, p ≪ 0.001), but this relationship depends on the time of the season (F = 4.968, edf = 15.13, p ≪ 0.001). Low whale numbers at the beginning of the season produced comparatively lower SPLs than toward the end, while during the peak of the season the higher whale densities resulted in slightly lowered chorusing levels (Figure 6). The proportion of pods with a calf is not significantly related to SPL levels (F = 1.795, edf = 4.786, p = 0.14), but chorusing levels appear to increase with increasing proportion of calves after a certain point. The proportion of calves does, however, significantly influence the relationship between SPL and whale numbers (F = 4.155, edf = 5.909, p = 0.0003). At low whale numbers, a high proportion of present calf pods is related to a decrease in chorusing. In contrast, the proportion of comp pods is significantly related with chorusing levels (F = 5.716, edf = 2.645, p = 0.0008). SPLs initially decreased with increasing proportion of competitive pods while increasing again after a midpoint with further increasing competitive pods. This relationship is independent of whale numbers (F = 0.910, edf = 2.0, p = 0.42). However, the heatmap (Figure 6) suggests that at very low whale numbers a higher proportion of competitive pods is positively related to RMS SPL levels. Overall variation explained by the model is 91.5%. Visualizations of all partial effects are summarized in Figure 6.
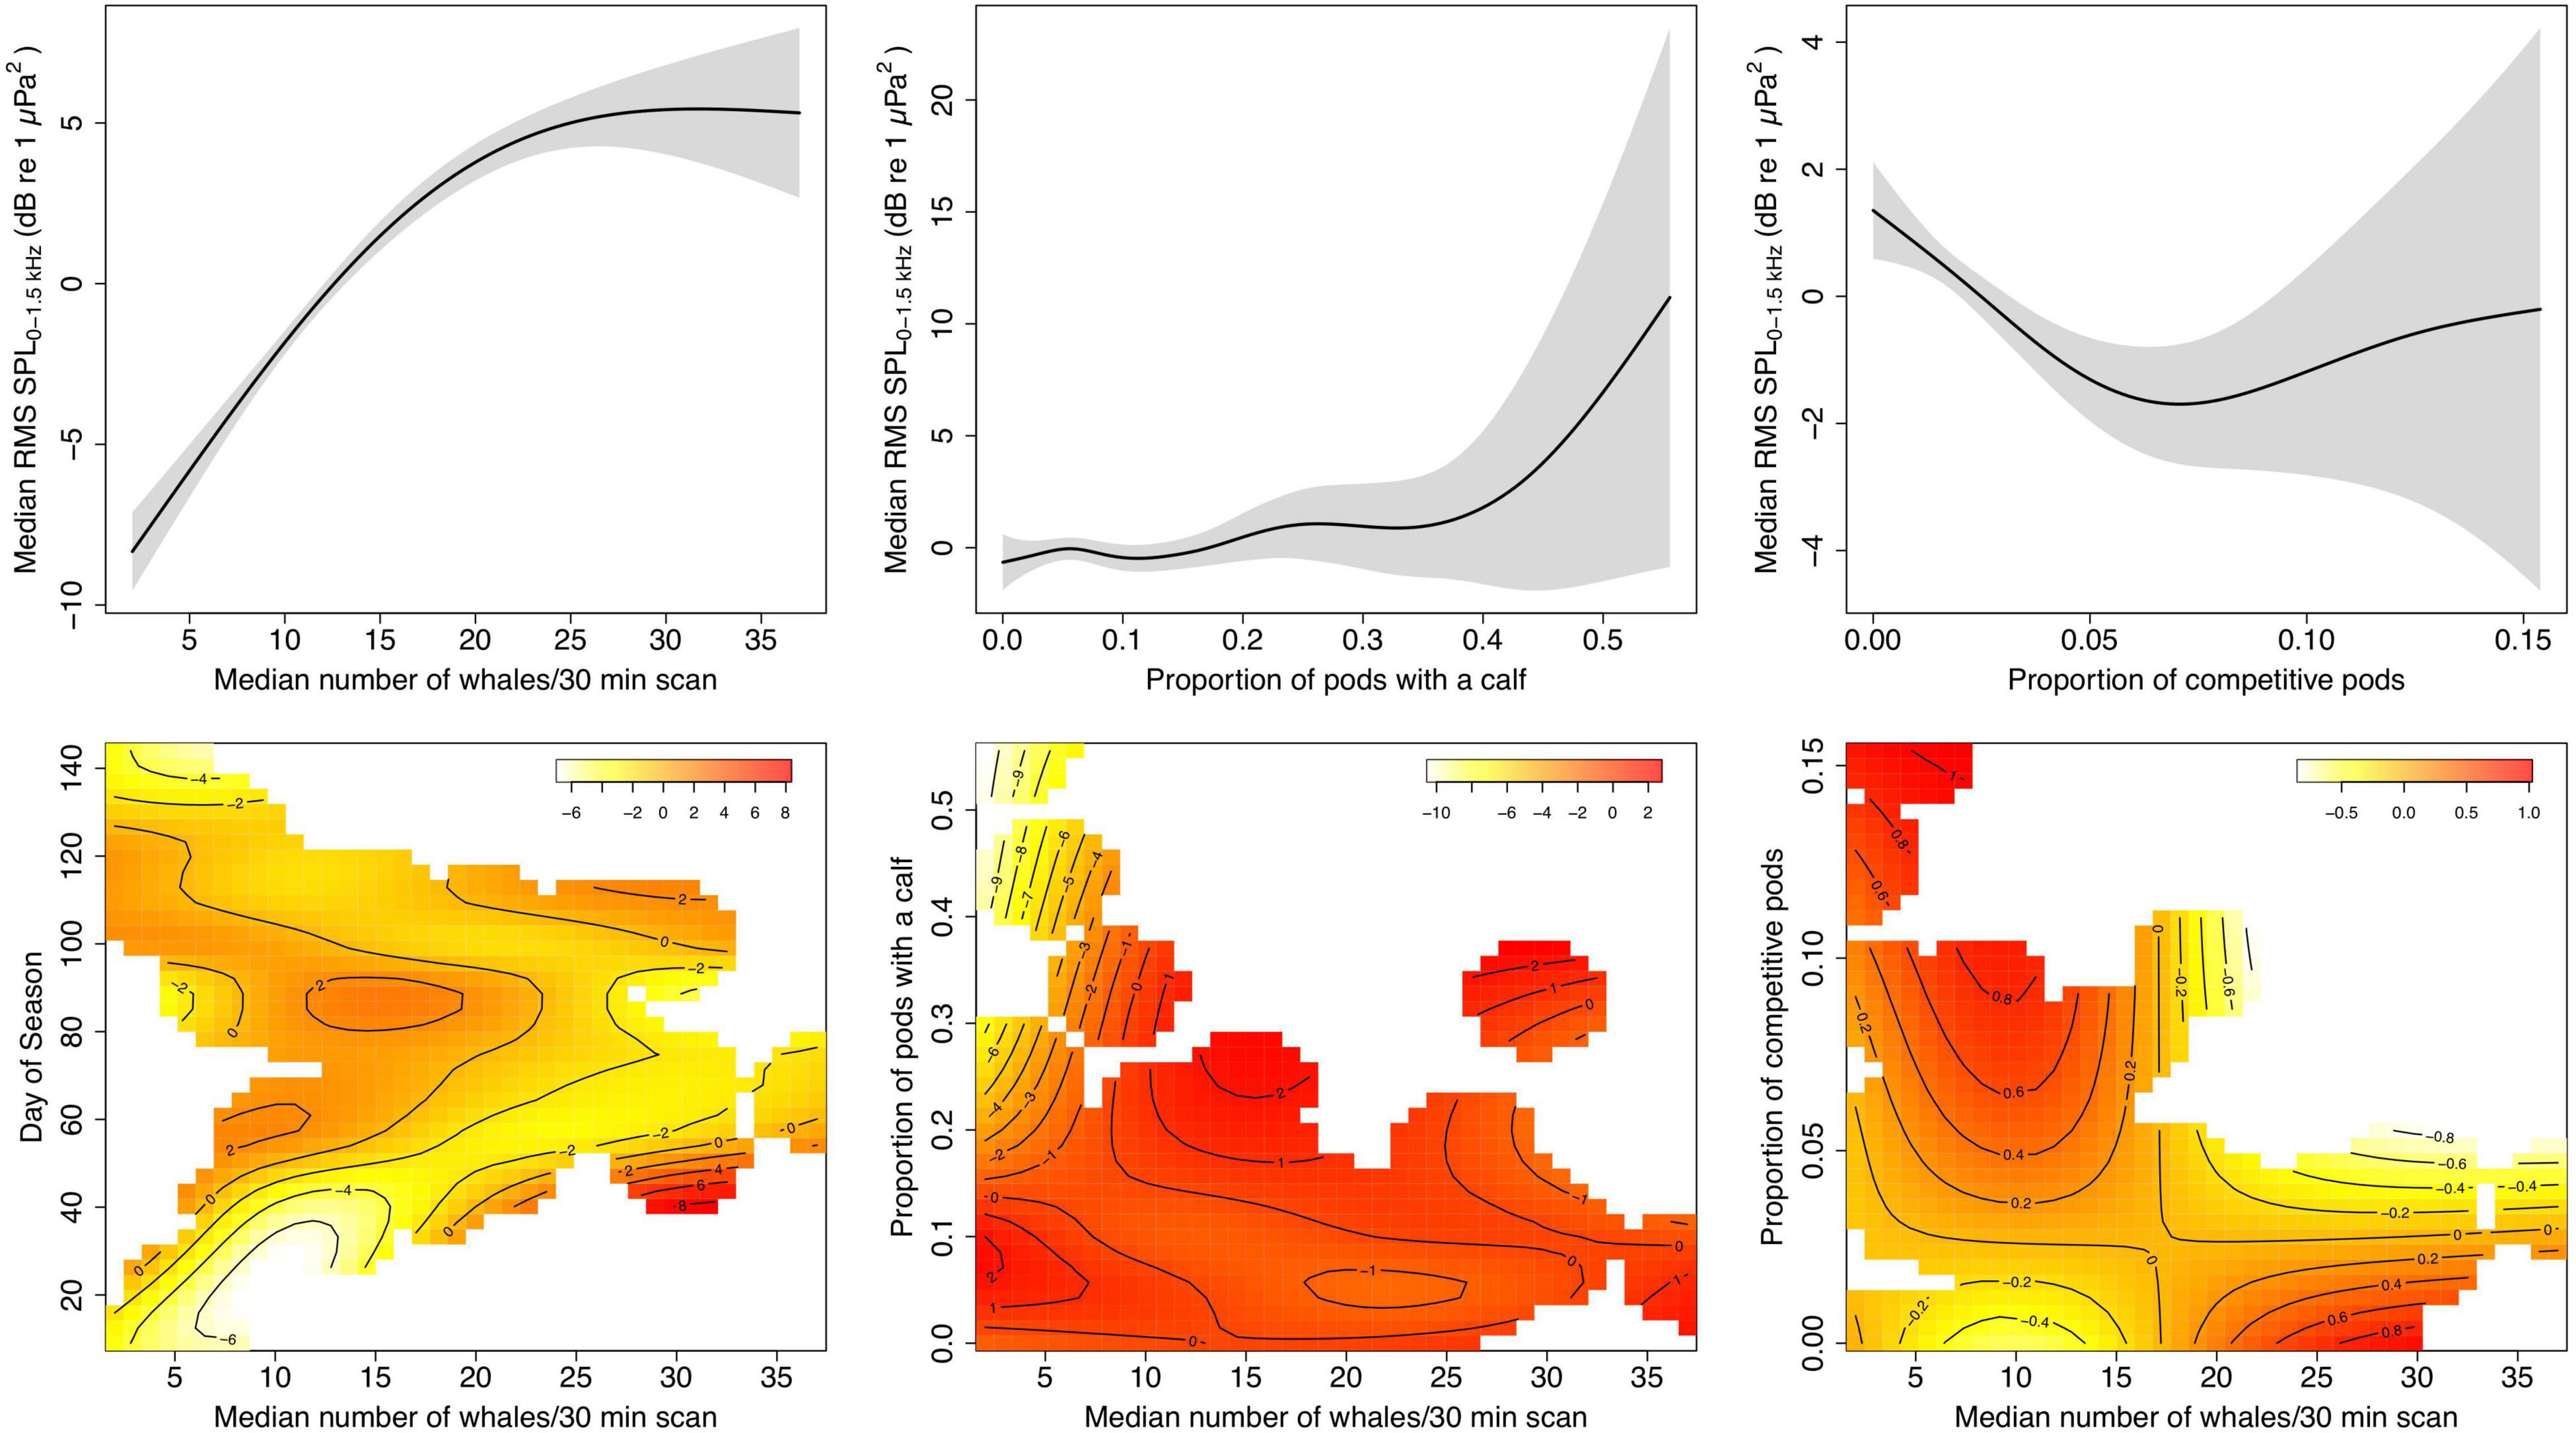
Figure 6. Plots of the partial effects of predictors fit with a generalized additive model (GAM) for daily median root-mean-squared sound pressure levels (RMS SPL) in dB re 1 μPa2 at three EAR locations off Maui, Hawai‘i, and median number of whales per 30 min from the land station, the proportion of pods with a calf per day, the proportion of competitive pods per day, and the interactions of relative whale numbers and day of the season (where day1 = December 1), relative whale numbers and proportion of pods with a calf, and relative whale numbers and proportion of competitive pods. Shaded areas indicate 95% confidence intervals. The colors in the heatmaps indicate the relative response of RMS SPL as a result of the partial effect of the respective two predictor variables with darker colors corresponding with a higher response. The isobaths specify areas of 1-unit difference in the response. White areas in the heatmaps reflect specific parameter combinations for which no data was available.
Results from the GAM for the vessel-based data are similar and explain 94.2% of deviance; density (F = 46.022, edf = 1.97, p ≪ 0.001), proportion of pods with a calf (F = 10.568, edf = 1, p = 0.002), but not proportion of comp pods (F = 3.212, edf = 1.854, p = 0.064) are significant predictors of RMS SPL and there are significant interactions between density and day of the season (F = 7.184, edf = 2.866, p ≪ 0.001), and density and proportion of comp pods (F = 3.644, edf = 1.802, p = 0.046), but not density and proportion of calf pods (F = 2.898, edf = 1.824, p = 0.102). However, we urge caution with the vessel-based results due to a relatively large number of terms included in the model compared to the small sample size, and interpretation of interaction effects is limited.
Discussion
Only adult and some juvenile male humpback whales sing (Herman et al., 2013), but their increasing and decreasing contribution to the marine soundscape in Hawai‘i during the breeding season mirrors the bell-shaped abundance curve resulting from the species’ staggered, age-class and sex-segregated migration pattern (Baker and Herman, 1981; Mobley et al., 1999; Au et al., 2000; Craig et al., 2001, 2003; Chen, 2017; Kügler et al., 2020). Our findings confirm that male chorusing intensity is predictive of overall whale numbers including non-singing animals off west Maui, Hawai‘i.
Both visual observation methods used to obtain whale numbers (whale counts from a shore station and density estimates from line-transect vessel surveys) had the same second-order polynomial correlation with acoustic recordings obtained from the three PAM sites within the study area. Observed differences among recording sites are likely the result of sound propagation effects at different recorder depths that shifted the SPL baseline, but not the general qualitative relationship between chorusing levels and whale numbers. These findings are in agreement with those reported along the southbound migration route off East Australia that also showed a positive polynomial correlation of both the number of singers and song minutes with the number of whales sighted (Noad et al., 2017). They also agree with a study conducted on a breeding ground off Mexico that showed a positive correlation between the number of whales and daily sound levels (Seger et al., 2016).
While some males may sing while escorting a mother-calf pair, or as part of a dyad or larger group (Baker and Herman, 1984; Darling and Bérubé, 2001; Smith et al., 2008; Chen, 2017), most singers are lone males (Darling et al., 2006; Herman et al., 2013) that can stay submerged for up to 20 min at a time while singing and may repeat their song in sessions that last many hours. It was therefore difficult to unambiguously identify singers with our visual observation methods, so the proportion of singers in our population is unknown. While Noad et al. (2017) showed a strong positive correlation between the number of singers and the overall number of whales observed along an Australian migratory route, they found that the proportion of singers decreased as the population increased over the course of almost 20 years. This contrasts with results from Cato et al. (2002), who showed that the proportion of singers remained consistent between 1981 and 1994 in that same population. Noad and colleagues considered that the observed decrease in the proportion of singers may have been caused by singing whales moving further offshore and outside of their in-shore study area, but concluded this was unlikely based on their observational data. They also reject the possibility of a decrease in numbers of mature whales resulting from a potential change in age structure. Instead, they proposed that the increase in population size during their recovery from commercial whaling likely changed whale singing behavior, resulting in proportionally fewer males singing. However, singing behavior during migration may differ markedly from that occurring on the breeding grounds. In fact, Seger et al. (2016) found that the proportion of singers in the population remained constant on the Mexican breeding ground. We have no reason to suspect that an abundance-dependency in the proportion of singers as observed on the Australian migration route exists on the Hawaiian breeding ground. In a recent study on population fluctuations off Maui inferred from chorusing levels as a proxy for relative abundance, Kügler et al. (2020) reported a decrease in RMS SPL levels during the month of February, the peak of the whale season, of 6.1 dB between 2014/15 and 2017/18 at the shallow Olowalu EAR site. A −6 dB change in RMS SPLs represents a 50% decrease in acoustic energy. Applying the regression presented here, we calculate that a decrease occurred from 1.21 whales/km2 in 2015 to 0.62 whales/km2 in 2018, or a change of −48.85%. Cartwright et al. (2019) reported a decline in visually observed mother-calf pairs of 76.5% and of 39% of adult groups between 2013 and 2018 in the same study area off west Maui. In addition, researchers off Hawai‘i Island reported a 50% decline in the mean number of whales counted from a shore station between 2014 and 2018 (NOAA, 2019; Frankel et al., 2021). The similarity in magnitudes of the trends described among these studies support our conclusion that variations in chorusing levels are the result of changes in whale abundance and not changing proportions of singers. Thus, SPL appears to be a reliable indicator of whale numbers over time, although further examination of the relationship between whale numbers and chorusing levels could help to define the relationship and possible limitations resulting from social dynamics more precisely.
Chorusing levels do not increase indefinitely with increasing whale numbers, but rather reach a plateau (logistic and asymptotic regressions) or even start decreasing (quadratic regression) after whale densities reach a threshold. At peak densities in February and early March, opportunities to find potential mates are abundant, which often involves physical contest competition with other males and may result in a lower proportion of males singing (Figure 6). Further, multiple past studies point to song playing an important role as a spacing mechanism among singers (Winn and Winn, 1978; Tyack, 1981; Frankel et al., 1995; Seger et al., 2016). As local densities become high, singers may not be able to maintain their minimum distance from each other, and individual males may choose to switch their behavioral strategy, for example by joining mother-calf pairs (Herman and Antinoja, 1977; Craig et al., 2002) or competitive pods (Au et al., 2000; Darling and Bérubé, 2001; Craig et al., 2002; Pack et al., 2012) rather than sing. At higher densities, singers may also be joined more frequently by other males, which often leads to cessation of singing (Darling et al., 2006).
In general, as the proportion of competitive pods increases, chorusing levels decrease (Figure 6). However, toward the end of the season when there is a high prevalence of competitive pods as the availability of receptive females becomes low and males compete over the last opportunities to mate (Craig et al., 2002), the relative amount of chorusing increases again. This also may indicate a change in male behavioral strategy. Humpback whale song has been proposed to provide information about a male’s competitive fitness (Lammers et al., 2017) and during high competitive activity males may choose to invest additional time separately advertising their fitness to competitors and/or females. Similarly, our data suggest that a high relative presence of pods with a calf is tied to increased chorusing levels, except at low whale densities (Figure 6). The number of calf pods relative to the total whale abundance increases as the whale season progresses and is highest in late March through April (Craig et al., 2003). As females without a calf become rare, the increase in chorusing with the higher proportion of calf pods may reflect an increase in the number of escorts singing in mother/calf groups (e.g., Herman and Tavolga, 1980; Chen, 2017). On the other hand, the decrease in SPL at low whale densities, but high prevalence of calf pods probably results from differences in migratory timing, as mother-calf pairs are among the last to depart the islands for their northward journey (Craig et al., 2003). It is therefore likely that this observed correlation at low densities is an artifact of co-varying seasonal changes in SPL rather than a causal relationship between SPL and calf presence.
The local presence of whales in Hawai‘i fluctuates throughout the breeding season as a function of migratory trends, residency times, and movement patterns within the archipelago (Craig and Herman, 1997; Cerchio et al., 1998; Craig et al., 2001, 2003), a pattern that is reflected in daily chorusing levels (cf. Figure 4). Visual surveys traditionally conducted to estimate abundances are often limited to a relatively large temporal resolution, as they are constrained by feasibility (access to vessels, aircraft, land observation sites or weather), logistics, and funding (e.g., Mobley et al., 1999; Barlow et al., 2011). While these efforts are important for monitoring population trends, they provide “snapshots” and are often not able to capture fluctuations on smaller temporal scales. PAM allows the ability to survey continuously throughout the breeding season and therefore capture naturally occurring fluctuations to gain a better understanding of patterns of abundance. In the future, real-time acoustic monitoring could allow monitoring the local population without a time delay from off-season instrument recovery and data processing, relaying the current status of humpback whales in Hawai‘i to managers and the public.
The Hawai‘i humpback whale DPS is considered recovered from commercial whaling depletion following decades of population growth at a rate of ca. 6–7% (Mobley et al., 1999; Calambokidis et al., 2001), and, together with eight other DPSs, was delisted from the United States Endangered Species Act in 2016 (NOAA, 2016). However, population fluctuations that have occurred since then (Cartwright et al., 2019; NOAA, 2019; Kügler et al., 2020; Frankel et al., 2021) emphasize the importance of continued long-term monitoring and the necessity for tracking population trends in order to mitigate changes in the conservation status of populations in a timely manner. This becomes particularly important in light of accelerating global changes, which are expected to put many marine species under increasing stress through the combination of climate change as well as other anthropogenic impacts, including ship strikes, entanglement, tourism, and noise pollution (Moore, 2008; Lammers et al., 2013; Senigaglia et al., 2016; Tsujii et al., 2018; Cartwright et al., 2019; Guazzo et al., 2020; Currie et al., 2021). Although our results are specific to the west Maui area, they could be adapted for studying populations in other breeding areas that are subject to limited resources or access. For example, the Northwestern Hawaiian Islands, stretching 1,900 km northwest of the Main Hawaiian Island, are a significantly understudied, but presumed important humpback whale breeding habitat (Johnston et al., 2007; Calambokidis et al., 2008; Lammers et al., 2011). Access to the region is restricted due to its remoteness and protection as part of the Papahānaumokuākea Marine National Monument, and frequent visual surveys are not possible. Further refinement of the results presented here to account for different habitats and propagation conditions could help make them more broadly applicable, thus providing a valuable tool for monitoring humpback whale abundance in more remote parts of the archipelago. However, higher wind and/or vessel noise, lower whale densities, differences in behavior and/or migratory patterns could cause unique conditions that deviate significantly from the relationship between whale numbers and chorusing levels presented here.
Finally, this study demonstrates that PAM methods can be extended to estimate population sizes for species and environments where vocalizations are too abundant to identify individual calls. Our results warrant further studies on the applicability of this cost-efficient, non-invasive method to study humpback whale populations on other breeding grounds, as well as other species that provide similar challenges.
Data Availability Statement
The raw data supporting the conclusions of this article will be made available by the authors, without undue reservation.
Author Contributions
AK performed the statistical analysis and wrote the first draft of the manuscript. All authors contributed to conception, design, and data collection of the study, manuscript revision, read, and approved the submitted version.
Funding
This work was supported by the SanctSound project, which is a collaboration between NOAA and the United States Navy to better understand underwater sound within the National Marine Sanctuary System. For more information, visit https://sanctuaries.noaa.gov/science/monitoring/sound/. Additional funding or in-kind support for this work was provided by Whale Tales/Whale Trust, the Linda and Jim Collister Fellowship, Ultimate Whale Watch, and Oceanwide Science Institute.
Conflict of Interest
The authors declare that the research was conducted in the absence of any commercial or financial relationships that could be construed as a potential conflict of interest.
Publisher’s Note
All claims expressed in this article are solely those of the authors and do not necessarily represent those of their affiliated organizations, or those of the publisher, the editors and the reviewers. Any product that may be evaluated in this article, or claim that may be made by its manufacturer, is not guaranteed or endorsed by the publisher.
Acknowledgments
The efforts described would not have been possible without the dedicated help of many individuals and we would like to thank them for donating their personal time to help with EAR recoveries and re-deployments, as computer operators during land-based surveys, and as observers and data recorders during vessel surveys. These volunteers include (in alphabetical order): Nanette “Chandra” Bowen, Lacey Brandt, Isabella Canepa, Sue Canfield, Christina Cantellops, William Carrier, Debra Caswell, Steve Chopek, Peter Colombo, Mark Deakos, Brad Eichhorst, Amy Eldredge, Tim Goeken, Ted Gruppenhoff, Russell Hansen, Lee James, Jeff Kallenbach, Jessie Kittel, Dani Kleinhenz, Matt Koller, Kirtley Mann, Laura Meades, Jason Moore, Marcus Richter, Jeannine Rossa, Julie Strong, Heather Spillane, Scott Splean, Liz Stahl, Larissa Treese, Marina Treese, Sara Wood, and Joan Zwar. We would also like to thank two reviewers for their insightful suggestions on the manuscript.
References
Ainslie, M. A., Miksis-Olds, J. L., Martin, B., Heaney, K., De Jong, C. A. F., Von Benda-Beckmann, A. M., et al. (2018). ADEON Underwater Soundscape and Modeling Metadata Standard. Version 1.0. Technical Report by JASCO Applied Sciences for ADEON Prime. Tokyo: JASCO.
Allen, A. N., Harvey, M., Harrell, L., Jansen, A., Merkens, K. P., Wall, C. C., et al. (2021). A convolutional neural network for automated detection of humpback whale song in a diverse, long-term passive acoustic dataset. Front. Mar. Sci. 8:607321. doi: 10.3389/fmars.2021.607321
Au, W. W. L., and Banks, K. (1998). The acoustics of the snapping shrimp Synalpheus parneomeris in Kaneohe Bay. J. Acoust. Soc. Am. 103, 41–47. doi: 10.1121/1.423234
Au, W. W. L., and Green, M. (2000). Acoustic interaction of humpback whales and whale-watching boats. Mar. Environ. Res. 49, 469–481. doi: 10.1016/S0141-1136(99)00086-0
Au, W. W. L., and Hastings, M. C. (2008). “Emission of social sounds by marine animals,” in Principles of Marine Bioacoustics, eds W. W. L. Au and M. C. Hastings (New York, NY: Springer Science+Business Media, LLC), 401–499. doi: 10.1007/978-0-387-78365-9_10
Au, W. W. L., Mobley, J. R. Jr., Burgess, W. C., and Lammers, M. O. (2000). Seasonal and diurnal trends of chorusing humpback whales wintering in waters off Western Maui. Mar. Mamm. Sci. 16, 530–544. doi: 10.1111/j.1748-7692.2000.tb00949.x
Au, W. W. L., Pack, A. A., Lammers, M. O., Herman, L. M., Deakos, M. H., and Andrews, K. (2006). Acoustic properties of humpback whale songs. J. Acoust. Soc. Am. 120, 1103–1110. doi: 10.1121/1.2211547
Baker, C. S., and Herman, L. M. (1981). Migration and local movement of humpback whales (Megaptera novaeangliae) through Hawaiian waters. Can. J. Zool. 59, 460–469. doi: 10.1139/z81-067
Baker, C. S., and Herman, L. M. (1984). Aggressive behavior between humpback whales (Megaptera novaeangliae) wintering in Hawaiian waters. Can. J. Zool. 62, 1922–1937. doi: 10.1139/z84-282
Baker, C. S., Herman, L. M., Perry, A., Lawton, W. S., Straley, J. M., Wolman, A. A., et al. (1986). Migratory movement and population structure of humpback whales (Megaptera novaeangliae) in the central and eastern North Pacific. Mar. Ecol. Prog. Ser. 31, 105–119. doi: 10.3354/meps031105
Barlow, J., Calambokidis, J., Falcone, E. A., Baker, C. S., Burdin, A. M., Clapham, P. J., et al. (2011). Humpback whale abundance in the North Pacific estimated by photographic capture-recapture with bias correction from simulation studies. Mar. Mamm. Sci. 27, 793–818. doi: 10.1111/j.1748-7692.2010.00444.x
Barlow, J., Fregosi, S., Thomas, L., Harris, D., and Griffiths, E. T. (2021). Acoustic detection range and population density of Cuvier’s beaked whales estimated from near-surface hydrophones. J. Acoust. Soc. Am. 149, 111–125. doi: 10.1121/10.0002881
Baumann-Pickering, S., Mcdonald, M. A., Simonis, A. E., Solsona Berga, A., Merkens, K. P., Oleson, E. M., et al. (2013). Species-specific beaked whale echolocation signals. J. Acoust. Soc. Am. 134, 2293–2301. doi: 10.1121/1.4817832
Baumgartner, M. F., and Mussoline, S. E. (2011). A generalized baleen whale call detection and classification system. J. Acoust. Soc. Am. 129, 2889–2902. doi: 10.1121/1.3562166
Belikov, R. A., and Bel’kovich, V. M. (2007). Whistles of beluga whales in the reproductive gathering off Solovetskii Island in the White Sea. Acoust. Phys. 53, 528–534. doi: 10.1134/S1063771007040148
Bohnenstiehl, D. R., Lillis, A., and Eggleston, D. B. (2016). The curious acoustic behavior of estuarine snapping shrimp: temporal patterns of snapping shrimp sound in sub-tidal oyster reef habitat. PLoS One 11:e0143691. doi: 10.1371/journal.pone.0143691
Boughman, J. W. (1997). Greater spear-nosed bats give group-distinctive calls. Behav. Ecol. Sociobiol. 40, 61–70. doi: 10.1007/s002650050316
Burnham, R. E., and Duffus, D. A. (2020). The use of passive acoustic monitoring as a census tool of gray whale (Eschrichtius robustus) migration. Ocean Coast. Manag. 188:105070. doi: 10.1016/j.ocecoaman.2019.105070
Catchpole, C. K., and Slater, P. J. B. (2008). Bird Song: Biological Themes and Variations. Cambridge: Cambridge University Press.
Calambokidis, J., Falcone, E. A., Quinn Ii, T. J., Burdin, A. M., Clapham, P. J., Ford, J. K. B., et al. (2008). in SPLASH: Structure of Populations, Levels of Abundance and Status of Humpback Whales in the North Pacific, eds J. Barlow and P. R. Wade (Seattle, WA: U.S. Department of Commerce Western Administrative Center).
Calambokidis, J., Steiger, G. H., Straley, J. M., Herman, L. M., Cerchio, S., Salden, D. R., et al. (2001). Movements and population structure of humpback whales in the North Pacific. Mar. Mamm. Sci. 17, 769–794. doi: 10.1111/j.1748-7692.2001.tb01298.x
Cartwright, R., Venema, A., Hernandez, V., Wyels, C., Cesere, J., and Cesere, D. (2019). Fluctuating reproductive rates in Hawaii’s humpback whales, Megaptera novaeangliae, reflect recent climate anomalies in the North Pacific. R. Soc. Open Sci. 6:181463. doi: 10.1098/rsos.181463
Cato, D. H., Paterson, R., and Paterson, P. (2002). Vocalisation rates of migrating humpback whales over 14 years. Mem. Qld. Mus. 47, 481–489.
Cerchio, S., Gabriele, C. M., Norris, T. F., and Herman, L. M. (1998). Movements of humpback whales between Kauai and Hawaii: implications for population structure and abundance estimation in the Hawaiian Islands. Mar. Ecol. Prog. Ser. 175, 13–22. doi: 10.3354/meps175013
Chen, J. (2017). Acoustic Ecology of Humpback Whales (Megaptera novaeangliae) in the Hawaiian Archipelago. Doctoral dissertation. Honolulu, HI: University of Hawai‘i at Mānoa.
Cholewiak, D. M., Cerchio, S., Jacobsen, J. K., Urbán-R, J., and Clark, C. W. (2018). Songbird dynamics under the sea: acoustic interactions between humpback whales suggest song mediates male interactions. R. Soc. Open Sci. 5:171298. doi: 10.1098/rsos.171298
Clapham, P. J. (2018). “Humpback whale,” in Encyclopedia of Marine Mammals, eds B. Würsig, J. G. M. Thewissen, and K. M. Kovacs (London: Elsevier), 489–492. doi: 10.1016/B978-0-12-804327-1.00154-0
Craig, A. S., and Herman, L. M. (1997). Sex differences in site fidelity and migration of humpback whales (Megaptera novaeangliae) to the Hawaiian Islands. Can. J. Zool. 75, 1923–1933. doi: 10.1139/z97-822
Craig, A. S., Herman, L. M., Gabriele, C. M., and Pack, A. A. (2003). Migratory timing of humpback whales (Megaptera novaeangliae) in the Central North Pacific varies with age, sex and reproductive status. Behaviour 140, 981–1001. doi: 10.1163/156853903322589605
Craig, A. S., Herman, L. M., and Pack, A. A. (2001). Estimating Residence Times of Humpback Whales in Hawaii. Hawaiian Islands Humpback Whale National Marine Sanctuary, Office of National Marine Sanctuaries, National Oceanic and Atmospheric Administration. Honolulu, HI: The Dolphin Institute.
Craig, A. S., Herman, L. M., and Pack, A. A. (2002). Male mate choice and male-male competition coexist in the humpback whale (Megaptera novaeangliae). Can. J. Zool. 80, 745–755. doi: 10.1139/z02-050
Craig, A. S., Herman, L. M., Waterman, J. O., and Pack, A. A. (2014). Habitat segregation by female humpback whales in Hawaiian waters: avoidance of males? Behaviour 151, 613–631. doi: 10.1163/1568539X-00003151
Currie, J. J., Mccordic, J. A., Olson, G. L., Machernis, A. F., and Stack, S. H. (2021). The impact of vessels on humpback whale behavior: the benefit of added whale watching guidelines. Front. Mar. Sci. 8:72. doi: 10.3389/fmars.2021.601433
Dapper, A. L., Baugh, A. T., and Ryan, M. J. (2011). The sound of silence as an alarm cue in Túngara frogs, Physalaemus pustulosus. Biotropica 43, 380–385. doi: 10.1111/j.1744-7429.2010.00707.x
Darling, J. D. (2015). Low frequency, ca. 40 Hz, pulse trains recorded in the humpback whale assembly in Hawaii. J. Acoust. Soc. Am. 138, EL452–EL458. doi: 10.1121/1.4935070
Darling, J. D., and Bérubé, M. (2001). Interactions of singing humpback whales with other males. Mar. Mamm. Sci. 17, 570–584. doi: 10.1111/j.1748-7692.2001.tb01005.x
Darling, J. D., Jones, M. E., and Nicklin, C. P. (2006). Humpback whale songs: do they organize males during the breeding season? Behaviour 143, 1051–1101. doi: 10.1163/156853906778607381
De La Torre, S., and Snowdon, C. T. (2009). Dialects in pygmy marmosets? Population variation in call structure. Am. J. Primatol. 71, 333–342. doi: 10.1002/ajp.20657
Dunlop, R. A., Cato, D. H., and Noad, M. J. (2008). Non-song acoustic communication in migrating humpback whales (Megaptera novaeangliae). Mar. Mamm. Sci. 24, 613–629. doi: 10.1111/j.1748-7692.2008.00208.x
Dunlop, R. A., Noad, M. J., Mccauley, R. D., Kniest, E., Slade, R., Paton, D., et al. (2018). A behavioural dose-response model for migrating humpback whales and seismic air gun noise. Mar. Pollut. Bull. 133, 506–516. doi: 10.1016/j.marpolbul.2018.06.009
Frankel, A. S., Clark, C. W., Herman, L. M., and Gabriele, C. M. (1995). Spatial distribution, habitat utilization, and social interactions of humpback whales, Megaptera novaeangliae, off Hawai’i, determined using acoustic and visual techniques. Can. J. Zool. 73, 1134–1146. doi: 10.1139/z95-135
Frankel, A. S., Gabriele, C. M., Yin, S., and Rickards, S. H. (2021). Humpback whale abundance in Hawai‘i: temporal trends and response to climatic drivers. Mar. Mamm. Sci. 2021, 1–21. doi: 10.1111/mms.12856
Frasier, K. E. (2015). Density Estimation of Delphinids Using Passive Acoustics: A Case Study in the Gulf of Mexico. Doctor of philosophy. San Diego, CA: University of California.
Gailey, G., and Ortega-Ortiz, J. (2000). Pythagoras A Computer Based System for Theodolite Tracking of Animals. Galveston, TX: Texas A&M University.
Greenwell, B. M., and Schubert Kabban, C. M. (2014). investr: an R Package for Inverse Estimation. R J. 6, 90–100. doi: 10.32614/RJ-2014-009
Guazzo, R. A., Helble, T. A., Martin, C. R., Durbach, I. N., Alongi, G. C., Martin, S. W., et al. (2020). Lombard effect: minke whale boing call source levels vary with natural variations in ocean noise. J. Acoust. Soc. Am. 147:698. doi: 10.1121/10.0000596
Harris, D. V., Miksis-Olds, J. L., Vernon, J. A., and Thomas, L. (2018). Fin whale density and distribution estimation using acoustic bearings derived from sparse arrays. J. Acoust. Soc. Am. 143:2980. doi: 10.1121/1.5031111
Henry, C. S., and Wells, M. M. (2010). Acoustic niche partitioning in two cryptic sibling species of Chrysoperla green lacewings that must duet before mating. Anim. Behav. 80, 991–1003. doi: 10.1016/j.anbehav.2010.08.021
Herman, L. M. (2017). The multiple functions of male song within the humpback whale (Megaptera novaeangliae) mating system: review, evaluation, and synthesis. Biol. Rev. Cambridge Philos. Soc. 92, 1795–1818. doi: 10.1111/brv.12309
Herman, L. M., and Antinoja, R. C. (1977). Humpback whales in the Hawaiian breeding waters: population and pod characteristics. Sci. Rep. Whales Res. Inst. 29, 59–85.
Herman, L. M., Pack, A. A., Spitz, S. S., Herman, E. Y. K., Rose, K., Hakala, S., et al. (2013). Humpback whale song: who sings? Behav. Ecol. Sociobiol. 67, 1653–1663. doi: 10.1007/s00265-013-1576-8
Herman, L. M., and Tavolga, W. N. (1980). “The communication systems of cetaceans,” in Cetacean Behavior: Mechanisms and Functions, ed. L. M. Herman (Hoboken, NJ: John Wiley & Sons, Inc).
Hibbitts, T. J., Whiting, M. J., and Stuart-Fox, D. M. (2006). Shouting the odds: vocalization signals status in a lizard. Behav. Ecol. Sociobiol. 61, 1169–1176. doi: 10.1007/s00265-006-0330-x
Hildebrand, J. A., Frasier, K. E., Baumann-Pickering, S., Wiggins, S. M., Merkens, K. P., Garrison, L. P., et al. (2019). Assessing seasonality and density from passive acoustic monitoring of signals presumed to be from pygmy and dwarf sperm whales in the Gulf of Mexico. Front. Mar. Sci. 6:66. doi: 10.3389/fmars.2019.00066
Hill, M. C., Bradford, A. L., Steel, D., Baker, C. S., Ligon, A. D., Acebes, J. M. V., et al. (2020). Found: a missing breeding ground for endangered western North Pacific humpback whales in the Mariana Archipelago. Endanger. Species Res. 41, 91–103. doi: 10.3354/esr01010
Johnston, D. W., Chapla, M. E., Williams, L. E., and Matthila, D. K. (2007). Identification of humpback whale Megaptera novaeangliae wintering habitat in the Northwestern Hawaiian Islands using spatial habitat modeling. Endanger. Species Res. 3, 249–257. doi: 10.3354/esr00049
Keen, E. (2016). Bangarang: Bangarang Data Tools for the Kitimat Fjord System. R package version 1.0.0.
Kügler, A., Lammers, M. O., Zang, E. J., Kaplan, M. B., and Mooney, T. A. (2020). Fluctuations in Hawaii’s humpback whale Megaptera novaeangliae population inferred from male song chorusing off Maui. Endanger. Species Res. 43, 421–434. doi: 10.3354/esr01080
Küsel, E. T., Siderius, M., and Mellinger, D. K. (2016). Single-sensor, cue-counting population density estimation: average probability of detection of broadband clicks. J. Acoust. Soc. Am. 140, 1894–1903. doi: 10.1121/1.4962753
Lammers, M. O., Brainard, R. E., Au, W. W., Mooney, T. A., and Wong, K. B. (2008). An ecological acoustic recorder (EAR) for long-term monitoring of biological and anthropogenic sounds on coral reefs and other marine habitats. J. Acoust. Soc. Am. 123, 1720–1728. doi: 10.1121/1.2836780
Lammers, M. O., Fisher-Pool, P. I., Au, W. W. L., Meyer, C. G., Wong, K. B., and Brainard, R. E. (2011). Humpback whale Megaptera novaeangliae song reveals wintering activity in the Northwestern Hawaiian Islands. Mar. Ecol. Prog. Ser. 423, 261–268. doi: 10.3354/meps08959
Lammers, M. O., Pack, A. A., Kügler, A., and Deakos, M. H. (2017). “Humpback whale song as a display of male fitness: evidence from measurements of variability in song units in conjuction with singer body size,” in Proccedings of the 4th International Symposium on Acoustic Communication by Animals, (Halifax).
Lammers, M. O., Pack, A. A., Lyman, E. G., and Espiritu, L. (2013). Trends in collisions between vessels and North Pacific humpback whales (Megaptera novaeangliae) in Hawaiian waters (1975–2011). J. Cetacean Res. Manag. 13, 73–80.
Lucke, K., Siebert, U., Lepper, P. A., and Blanchet, M.-A. (2009). Temporary shift in masked hearing thresholds in a harbor porpoise (Phocoena phocoena) after exposure to seismic airgun stimuli. J. Acoust. Soc. Am. 125, 4060–4070. doi: 10.1121/1.3117443
Marques, T. A., Thomas, L., Martin, S. W., Mellinger, D. K., Ward, J. A., Moretti, D. J., et al. (2013). Estimating animal population density using passive acoustics. Biol. Rev. Camb. Philos. Soc. 88, 287–309. doi: 10.1111/brv.12001
Marques, T. A., Thomas, L., Ward, J., Dimarzio, N., and Tyack, P. L. (2009). Estimating cetacean population density using fixed passive acoustic sensors: an example with Blainville’s beaked whales. J. Acoust. Soc. Am. 125, 1982–1994. doi: 10.1121/1.3089590
Martin, M. J., Gridley, T., Roux, J.-P., and Elwen, S. H. (2020). First abundance estimates of Heaviside’s (Cephalorhynchus heavisidii) and dusky (Lagenorhynchus obscurus) dolphins off Namibia using a novel visual and acoustic line transect survey. Front. Mar. Sci. 7:555659. doi: 10.3389/fmars.2020.555659
Martin, P., and Bateson, P. (1986). Measuring Behaviour: An Introductory Guide. New York, NY: Cambridge University Press.
Martin, S. W., Marques, T. A., Thomas, L., Morrissey, R. P., Jarvis, S., Dimarzio, N., et al. (2013). Estimating minke whale (Balaenoptera acutorostrata) boing sound density using passive acoustic sensors. Mar. Mamm. Sci. 29, 142–158. doi: 10.1111/j.1748-7692.2011.00561.x
Maruska, K. P., Ung, U. S., and Fernald, R. D. (2012). The African cichlid fish Astatotilapia burtoni uses acoustic communication for reproduction: sound production, hearing, and behavioral significance. PLoS One 7:e37612. doi: 10.1371/journal.pone.0037612
McDonald, M. A., and Fox, C. G. (1999). Passive acoustic methods applied to fin whale population density estimation. J. Acoust. Soc. Am. 105, 2643–2651. doi: 10.1121/1.426880
Miller, D. L., Rexstad, E., Thomas, L., Marshall, L., and Laake, J. L. (2019). Distance Sampling in R. J. Stat. Softw. 89, 1–28. doi: 10.18637/jss.v089.i01
Mobley, J. R. Jr., Bauer, G. B., and Herman, L. M. (1999). Changes over a ten-year interval in the distribution and relative abundance of humpback whales (Megaptera novaeangliae) wintering in Hawaiian waters. Aquat. Mamm. 25, 63–72.
Mobley, J. R. Jr., Spitz, S. S., and Grotefendt, R. (2001). Abundance of Humpback Whales in Hawaiian Waters: Results of 1993-2000 Aerial Surveys. Hawaiian Islands Humpback Whale National Marine Sanctuary, Office of National Marine Sanctuaries, National Oceanic and Atmospheric Administration. Honolulu, HI: Department of Land and Natural Resources.
Mooney, T. A., Di Iorio, L., Lammers, M., Lin, T. H., Nedelec, S. L., Parsons, M., et al. (2020). Listening forward: approaching marine biodiversity assessments using acoustic methods. R. Soc. Open Sci. 7:201287. doi: 10.1098/rsos.201287
Moore, S. E. (2008). Marine mammals as ecosystem sentinels. J. Mammal. 89, 534–540. doi: 10.1644/07-MAMM-S-312R1.1
NOAA (2016). Endangered and Threatened Species; Identification of 14 Distinct Population Segments of the Humpback Whale (Megaptera novaeangliae) and Revision of Species-Wide Listing, in NMFS.). Washington, DC: NOAA, 62259–62320.
NOAA (2019). “Trends in humpback whale (Megaptera novaeangliae) abundance, distribution, and health in hawai‘i and alaska: report from a meeting held on november 27-28, 2018,” in NOAA National Ocean Service, Office of National Marine Sanctuaries, Hawaiian Islands Humpback Whale National Marine Sanctuary and NOAA National Marine Fisheries Service, Pacific Islands Regional Office, Protected Resources Division, eds C. M. Gabrielle and A. A. Pack (Washington, DC: NOAA).
Noad, M. J., Dunlop, R. A., and Mack, A. K. (2017). Changes in humpback whale singing behavior with abundance: implications for the development of acoustic surveys of cetaceans. J. Acoust. Soc. Am. 142:1611. doi: 10.1121/1.5001502
Oswald, J. N., Au, W. W., and Duennebier, F. (2011). Minke whale (Balaenoptera acutorostrata) boings detected at the Station ALOHA Cabled Observatory. J. Acoust. Soc. Am. 129, 3353–3360. doi: 10.1121/1.3575555
Oswald, J. N., Rankin, S., Barlow, J., and Lammers, M. O. (2007). A tool for real-time acoustic species identification of delphinid whistles. J. Acoust. Soc. Am. 122, 587–595. doi: 10.1121/1.2743157
Pack, A. A., Herman, L. M., Spitz, S. S., Craig, A. S., Hakala, S., Deakos, M. H., et al. (2012). Size-assortative pairing and discrimination of potential mates by humpback whales in the Hawaiian breeding grounds. Anim. Behav. 84, 983–993. doi: 10.1016/j.anbehav.2012.07.024
Payne, R. S., and McVay, S. (1971). Songs of humpback whales. Science 173, 585–597. doi: 10.1126/science.173.3997.585
Phongkangsananan, N., Schwarzkopf, L., and Pike, D. A. (2014). Chatty females and quiet males: complex vocal communication in the Northern Dtella, Gehyra Dubia. Herpetol. Conserv. Biol. 9, 285–296.
Pitcher, B. J., Briefer, E. F., and Mcelligott, A. G. (2015). Intrasexual selection drives sensitivity to pitch, formants and duration in the competitive calls of fallow bucks. BMC Evol. Biol. 15:149. doi: 10.1186/s12862-015-0429-7
R Core Team (2016). R: A Language and Environment for Statistical Computing [Online]. Vienna: R Foundation for Statistical Computing.
Rogers, T. L., and Cato, D. H. (2002). Individual variation in the acoustic behavior of the adult male leopard seal, Hydrurga leptonyx. Behaviour 139, 1267–1286. doi: 10.1163/156853902321104154
Sanvito, S., Galimberti, F., and Miller, E. H. (2007). Vocal signalling of male southern elephant seals is honest but imprecise. Anim. Behav. 73, 287–299. doi: 10.1016/j.anbehav.2006.08.005
Schaffeld, T., Bräger, S., Gallus, A., Dähne, M., Krügel, K., Herrmann, A., et al. (2016). Diel and seasonal patterns in acoustic presence and foraging behaviour of free-ranging harbour porpoises. Mar. Ecol. Prog. Ser. 547, 257–272. doi: 10.3354/meps11627
Seger, K. D., Thode, A. M., Urbán, R. J., Martínez-Loustalot, P., Jiménez-López, M. E., and López-Arzate, D. (2016). Humpback whale-generated ambient noise levels provide insight into singers’ spatial densities. J. Acoust. Soc. Am. 140:1581. doi: 10.1121/1.4962217
Senigaglia, V., Christiansen, F., Bejder, L., Gendron, D., Lundquist, D., Noren, D. P., et al. (2016). Meta-analyses of whale-watching impact studies: comparisons of cetacean responses to disturbance. Mar. Ecol. Prog. Ser. 542, 251–263. doi: 10.3354/meps11497
Sicuro, F. L., Iack-Ximenes, G. E., Wogel, H., and Bilate, M. (2013). Vocal patterns of adult females and juveniles Caiman yacare (Crocodilia: Alligatoridae) in Brazilian pantanal wetland. Rev. Biol. Trop. 61, 1401–1413. doi: 10.15517/rbt.v61i3.11967
Silber, G. K. (1986). The relationship of social vocalizations to surface behavior and aggression in the Hawaiian humpback whale (Megaptera novaeangliae). Can. J. Zool. 64, 2075–2080. doi: 10.1139/z86-316
Smith, J. N., Goldizen, A. W., Dunlop, R. A., and Noad, M. J. (2008). Songs of male humpback whales, Megaptera novaeangliae, are involved in intersexual interactions. Anim. Behav. 76, 467–477. doi: 10.1016/j.anbehav.2008.02.013
Smolker, R., and Pepper, J. W. (1999). Whistle convergence among allied male bottlenose dolphins (Delphinidae. Tursiops sp.). Ethology 105, 595–617. doi: 10.1046/j.1439-0310.1999.00441.x
Soldevilla, M. S., Wiggins, S. M., Hildebrand, J. A., Oleson, E. M., and Ferguson, M. C. (2011). Risso’s and Pacific white-sided dolphin habitat modeling from passive acoustic monitoring. Mar. Ecol. Prog. Ser. 423, 247–260. doi: 10.3354/meps08927
Stimpert, A. K., Au, W. W., Parks, S. E., Hurst, T., and Wiley, D. N. (2011). Common humpback whale (Megaptera novaeangliae) sound types for passive acoustic monitoring. J. Acoust. Soc. Am. 129, 476–482. doi: 10.1121/1.3504708
Stimpert, A. K., Peavey, L. E., Friedlaender, A. S., and Nowacek, D. P. (2012). Humpback whale song and foraging behavior on an antarctic feeding ground. PLoS One 7:e51214. doi: 10.1371/journal.pone.0051214
Stimpert, A. K., Wiley, D. N., Au, W. W. L., Johnson, M. P., and Arsenault, R. (2007). ‘Megapclicks’: acoustic click trains and buzzes produced during night-time foraging of humpback whales (Megaptera novaeangliae). Biol. Lett. 3, 467–470. doi: 10.1098/rsbl.2007.0281
Sugai, L. S. M., Silva, T. S. F., Ribeiro, J. W., and Llusia, D. (2019). Terrestrial passive acoustic monitoring: review and perspectives. BioScience 69, 15–25. doi: 10.1093/biosci/biy147
Tobias, M. L., Corke, A., Korsh, J., Yin, D., and Kelley, D. B. (2010). Vocal competition in male Xenopus laevis frogs. Behav. Ecol. Sociobiol. 64, 1791–1803. doi: 10.1007/s00265-010-0991-3
Tricas, T. C., and Boyle, K. S. (2014). Acoustic behaviors in Hawaiian coral reef fish communities. Mar. Ecol. Prog. Ser. 511, 1–16. doi: 10.3354/meps10930
Tsujii, K., Akamatsu, T., Okamoto, R., Mori, K., Mitani, Y., and Umeda, N. (2018). Change in singing behavior of humpback whales caused by shipping noise. PLoS One 13:e0204112. doi: 10.1371/journal.pone.0204112
Tyack, P. (1981). Interactions between singing Hawaiian humpback whales and conspecifics nearby. Behav. Ecol. Sociobiol. 8, 105–116. doi: 10.1007/BF00300822
Van Belle, S., Estrada, A., and Garber, P. A. (2014). The function of loud calls in black howler monkeys (Alouatta pigra): food, mate, or infant defense? Am. J. Primatol. 76, 1196–1206. doi: 10.1002/ajp.22304
Van Parijs, S. M., Hastie, G. D., and Thompson, P. M. (2000). Individual and geographical variation in display behaviour of male harbour seals in Scotland. Anim. Behav. 59, 559–568. doi: 10.1006/anbe.1999.1307
Van Parijs, S. M., Smith, J., and Corkeron, P. J. (2002). Using calls to estimate the abundance of inshore dolphins: a case study with Pacific humpback dolphins Sousa chinensis. J. Appl. Ecol. 39, 853–864. doi: 10.1046/j.1365-2664.2002.00756.x
Videsen, S. K. A., Bejder, L., Johnson, M., Madsen, P. T., and Goldbogen, J. (2017). High suckling rates and acoustic crypsis of humpback whale neonates maximise potential for mother-calf energy transfer. Funct. Ecol. 31, 1561–1573. doi: 10.1111/1365-2435.12871
Vu, E. T., Risch, D., Clark, C. W., Gaylord, S., Hatch, L. T., Thompson, M. A., et al. (2012). Humpback whale song occurs extensively on feeding grounds in the western North Atlantic Ocean. Aquat. Biol. 14, 175–183. doi: 10.3354/ab00390
Winn, H. E., and Winn, L. K. (1978). The song of the humpback whale Megaptera novaeangliae in the West Indies. Mar. Biol. 47, 97–114. doi: 10.1007/BF00395631
Wood, S. (2006). Generalized Additive Models: An Introduction With R. Milton Park: Taylor & Francis. doi: 10.1201/9781420010404
Zang, E., and Lammers, M. (2021). Estimated Density and Abundance of Humpback Whales (Megaptera novaeangliae) off Maui, Hawai i: Results from 2018–21 Vessel-Based Surveys. National Marine Sanctuaries Conservation Series ONMS-21-09. Washington, DC: U.S. Department of Commerce, National Oceanic and Atmospheric Administration, National Ocean Service, Office of National Marine Sanctuaries.
Zimmer, W. M. X. (2011). Passive Acoustic Monitoring of Cetaceans. Cambridge: Cambridge University Press. doi: 10.1017/CBO9780511977107
Keywords: humpback whale, song, passive acoustic monitoring, abundance, ecology
Citation: Kügler A, Lammers MO, Zang EJ and Pack AA (2021) Male Humpback Whale Chorusing in Hawai‘i and Its Relationship With Whale Abundance and Density. Front. Mar. Sci. 8:735664. doi: 10.3389/fmars.2021.735664
Received: 03 July 2021; Accepted: 03 December 2021;
Published: 23 December 2021.
Edited by:
Ilse Catharina Van Opzeeland, Alfred Wegener Institute Helmholtz Centre for Polar and Marine Research (AWI), GermanyReviewed by:
Jack Butler, Florida International University, United StatesDenise Risch, Scottish Association for Marine Science, United Kingdom
Copyright © 2021 Kügler, Lammers, Zang and Pack. This is an open-access article distributed under the terms of the Creative Commons Attribution License (CC BY). The use, distribution or reproduction in other forums is permitted, provided the original author(s) and the copyright owner(s) are credited and that the original publication in this journal is cited, in accordance with accepted academic practice. No use, distribution or reproduction is permitted which does not comply with these terms.
*Correspondence: Anke Kügler, YWt1ZWdsZXJAaGF3YWlpLmVkdQ==