- 1National Oceanography Centre Southampton, School of Ocean and Earth Science, University of Southampton, Waterfront Campus, Southampton, United Kingdom
- 2School of Biological and Marine Sciences, University of Plymouth, Plymouth, United Kingdom
Marine phytoplankton form the base of marine food webs and are the driving force of the marine carbon cycle, so understanding the dynamics of their blooms is critical. While near-surface marine productivity (<10 m water depths) is extensively documented, that of the subsurface is less well characterised. Increasing evidence of the importance of subsurface chlorophyll maxima (SCM) and climatically driven increases in stratification of surface waters that promote SCM development call for improved sampling of the subsurface. To address this, we targeted the summer stratified waters of the Western English Channel, part of the NW European shelf seas, where SCM are commonly developed. In situ holography was applied to undertake the highest ever resolution, total water column, quantitative analysis of microplankton distribution, and demonstrated the importance of a SCM, co-located with the thermocline, dominated by a single species, the dinoflagellate Ceratium fusus. This species was dominant in the SCM over a wide area of the NW European shelf in the June/July 2015 study period and comprised up to 85% of the SCM biomass. Analysis of similarity and multivariate non-metric multidimensional scaling showed the phytoplankton community of the SCM to be statistically distinct from those of the surface and deep waters. Holography also revealed a fine scale layering of taxa at different levels within the SCM, likely reflecting ecological differences. Some taxa followed the peak abundance of C. fusus, while others reached maximum abundances immediately below or above the C. fusus maximum, suggesting the possible operation of exclusion mechanisms. Additionally, the detection of abundant aggregates located only within and beneath the SCM demonstrates the potential importance of this deep production for the export of carbon to the sea floor. Some predictions of phytoplankton productivity propose a shift to smaller cells in the more stratified oceans of the future resulting in declining production and export. Results presented here, however, contribute to a growing body of evidence that suggests, on the contrary, that key species among the larger celled/colonial, SCM-adapted diatoms and dinoflagellates may instead be selected in stratified conditions, driving increased production and export.
Introduction
Understanding phytoplankton ecology and the dynamics of their blooms is critical to predictions of how climate change may influence marine ecosystems and affect the global carbon cycle. The surface ocean has been scanned by satellite chlorophyll sensors for 40 years, with global coverage for the last 20 years (Hostetler et al., 2018). For ocean time series and transects, regular sampling has also largely targeted the surface < 10 m (Richardson et al., 2006) or else been restricted to discrete depth intervals spaced at several to 10s of metres, where typically pigments including chlorophylls have been used as a proxy for phytoplankton communities and productivity (Steinberg et al., 2001). Consequently, the phytoplankton that dominate the surface spring blooms or in upwelling regions are relatively well characterised (Behrenfeld and Boss, 2014).
In contrast to the surface waters, the subsurface ocean, beyond the range of satellite sensors (typically > 10–20 m), has only begun to be continuously surveyed in the past 15–20 years by chlorophyll sensors deployed on towed undulators, autonomous underwater vehicles (AUVs) and gliders. These surveys are now documenting great “patchiness” in the subsurface and are leading to an increased awareness of the significance of subsurface chlorophyll maxima. Such subsurface chlorophyll maxima (SCMs) are now known to be seasonally recurrent and persistent summer features in settings ranging from the mid latitude shelves of the NE Pacific (Perry et al., 2008) or NW Europe (Weston et al., 2005; Hickman et al., 2012; Barnett et al., 2019) to the Arctic (Martin et al., 2010; Churnside et al., 2020), and constitute biomass maxima. In the NW European Shelf, SCM often dominate summer new production with a total annual contribution estimated to be of the same order as (Hickman et al., 2012; Fernand et al., 2013; Williams et al., 2013) or greater than (Richardson et al., 2000) that of the spring bloom. Intensive undulator and sampling surveys such as the pioneering LOCO project in Monterey Bay (Rines et al., 2010; Sullivan et al., 2010) have revealed the widespread presence of SCM thin layers in a wide latitudinal range of coastal and shelf settings (Durham and Stocker, 2012; Greer et al., 2020). Such SCM thin layers are commonly linked to zooplankton distribution (Greer et al., 2013), and in some cases also drive multiple trophic levels via “bottom-up forcing” including top predator distribution (Scott et al., 2010; Benoit-Bird and McManus, 2012). While the dominant species of the surface ocean are well known, the phytoplankton of the subsurface including those of the SCMs are under-sampled. Conventional bottle surveys that sample discrete, multi-meter spaced depth intervals are not geared to target subsurface variability such as the thin layer SCMs that occur on sub-meter scales. Furthermore, comparison between net and bottle samples demonstrate that bottles do not adequately sample the largest phytoplankton (Armand et al., 2008), and it is some of the larger species that may be particularly significant for subsurface production and export (Kemp et al., 2000; Kemp and Villareal, 2013, 2018; Queguiner, 2013). Methods with the appropriate high levels of resolution are therefore required to identify subsurface phytoplankton taxa.
To characterise the phytoplankton of the subsurface it is necessary to deploy systems that sample the entire euphotic zone, not just the first optical depth available to satellites. In situ imaging using conventional optical techniques lacks the resolution to capture the nano- and microplankton, while flow cytometry is limited by the input nozzle diameter and may disrupt delicate phytoplankton colonies and aggregates, although developments in imaging flow cytometry can provide insights into temporal changes of phytoplankton community structure (Olson et al., 2017; Lombard et al., 2019). The recent development of commercial in situ laser holography systems allows for non-intrusive, 3D reconstructions of plankton over larger volumes and at higher resolutions than other instruments.
While in situ laser holography is recognised as having great potential, the scope of studies to date have been limited (Lombard et al., 2019; Nayak et al., 2021). A small number of species have been quantified at a limited number (2–3) of depth intervals (Malkiel et al., 1999; Talapatra et al., 2013). Higher resolution depth surveys have investigated total water column variation in phytoplankton versus zooplankton through tidal cycles in the Western English Channel (Cross et al., 2015) and the variability of four particle categories (phytoplankton, zooplankton, marine snow and others) in sub-pycnocline depths in the Ross Sea (Bochdansky et al., 2017). Simultaneous studies of holography and microstructure have been used to relate turbulent mixing to the distribution of colonial diatoms (Cross et al., 2014). Holographic studies have also identified subsurface thin layers of key elongate diatom species associated with pycnoclines and zones of low shear (Nayak et al., 2018a,b; McFarland et al., 2020).
The stratification of subsurface waters has the potential to generate a range of distinct niches for phytoplankton including those associated with the SCM (Cullen, 2015). The objectives of this study were to: (1) to identify the depth zonation of taxa within a stratified summer shelf sea water column; (2) to link depth-related characteristics of the phytoplankton community to water column physical structure; (3) to assess implications for phytoplankton ecology for the main taxa identified with special focus on the SCM. An additional aim was to demonstrate the full potential of in situ holography in providing very high resolution imagery of individual phytoplankton cells that make up the small scale layering within intense SCM where chlorophyll layers are < 5 m thick and referred to here as SCM thin layers—SCMTLs (Durham and Stocker, 2012).
Materials and Methods
Study Area and Sampling Procedure
The main study was conducted in the summer stratified waters of the Western English Channel between the 19th of June and 2nd of July 2015 (Figure 1). A single deployment of a digital in-line holographic camera system, referred to as a holocam, was performed on 19th June from Research Vessel Falcon Spirit. The holocam was mounted on a profiling frame alongside an AML Oceanographic conductivity, temperature, depth (CTD) Plus V2 probe with chlorophyll-fluorescence sensor. A simultaneous and adjacent deployment from RV Callista used a SeaBird SBE19plus V2 CTD probe mounted with a WETlabs ECO FLNTU fluorometer (sensitivity: 0.025 μg chl/l; fluorescence excitation/emission wavelengths: 470/695 nm). The configuration of the RV Callista CTD package allowed for slow descent/ascent rates without slowing sensor responses, thus improving dynamic accuracy and allowing small scale structure to be resolved. The CTD system was deployed at a descent/ascent rate of 0.01–0.1 m s–1 (rate slowed on approach to SCM), with a data acquisition rate of 2 Hz, which provided vertical resolution of 0.5–5 cm. Discrete water samples were taken from the surface waters (typically 0-20 m), SCM (at maximum chlorophyll), typically between 20 and 30 m, near the base of the thermocline, and deep waters extending beneath the SCM from depths of 30 to 35 m to the sea bed, see Supplementary Figure 2 for the all the complete depth profiles (the terms deep and bottom are used interchangeably). Samples were collected using a Niskin rosette system (6 × 5 L Niskin bottles) mounted with the CTD package, and analysed for chlorophyll concentration and phytoplankton size and taxonomic community structure. The water sample from the SCM was also analysed for particulate organic carbon (POC). For the remainder of the field survey the RV Callista CTD Niskin rosette system was used to collect vertical water column profiles and discrete water samples (from the SCM, and from surface and deep waters where possible) from a further 39 sites in the Western English Channel showing seasonal summer thermal stratification with total water depths of between 52 and 86 m (Figure 1). Fourteen of these sites were in the same general location (repeat station 1) and the remainder of sites were located further afield, often sampled as part of a transect, either inshore-offshore or adjacent to the shore (Figure 1). Water samples were routinely analysed for chlorophyll for the purpose of calibrating the fluorometer mounted with the CTD, and for phytoplankton community structure in order to provide context for the single holographic profile for the wider Western Channel over the survey period. Further afield, two stratified sites were profiled and sampled in the Celtic Sea on 28th July 2015, approximately 175 km from the study area in the Western English Channel and their locations are indicated by the two stars in the inset to Figure 1.
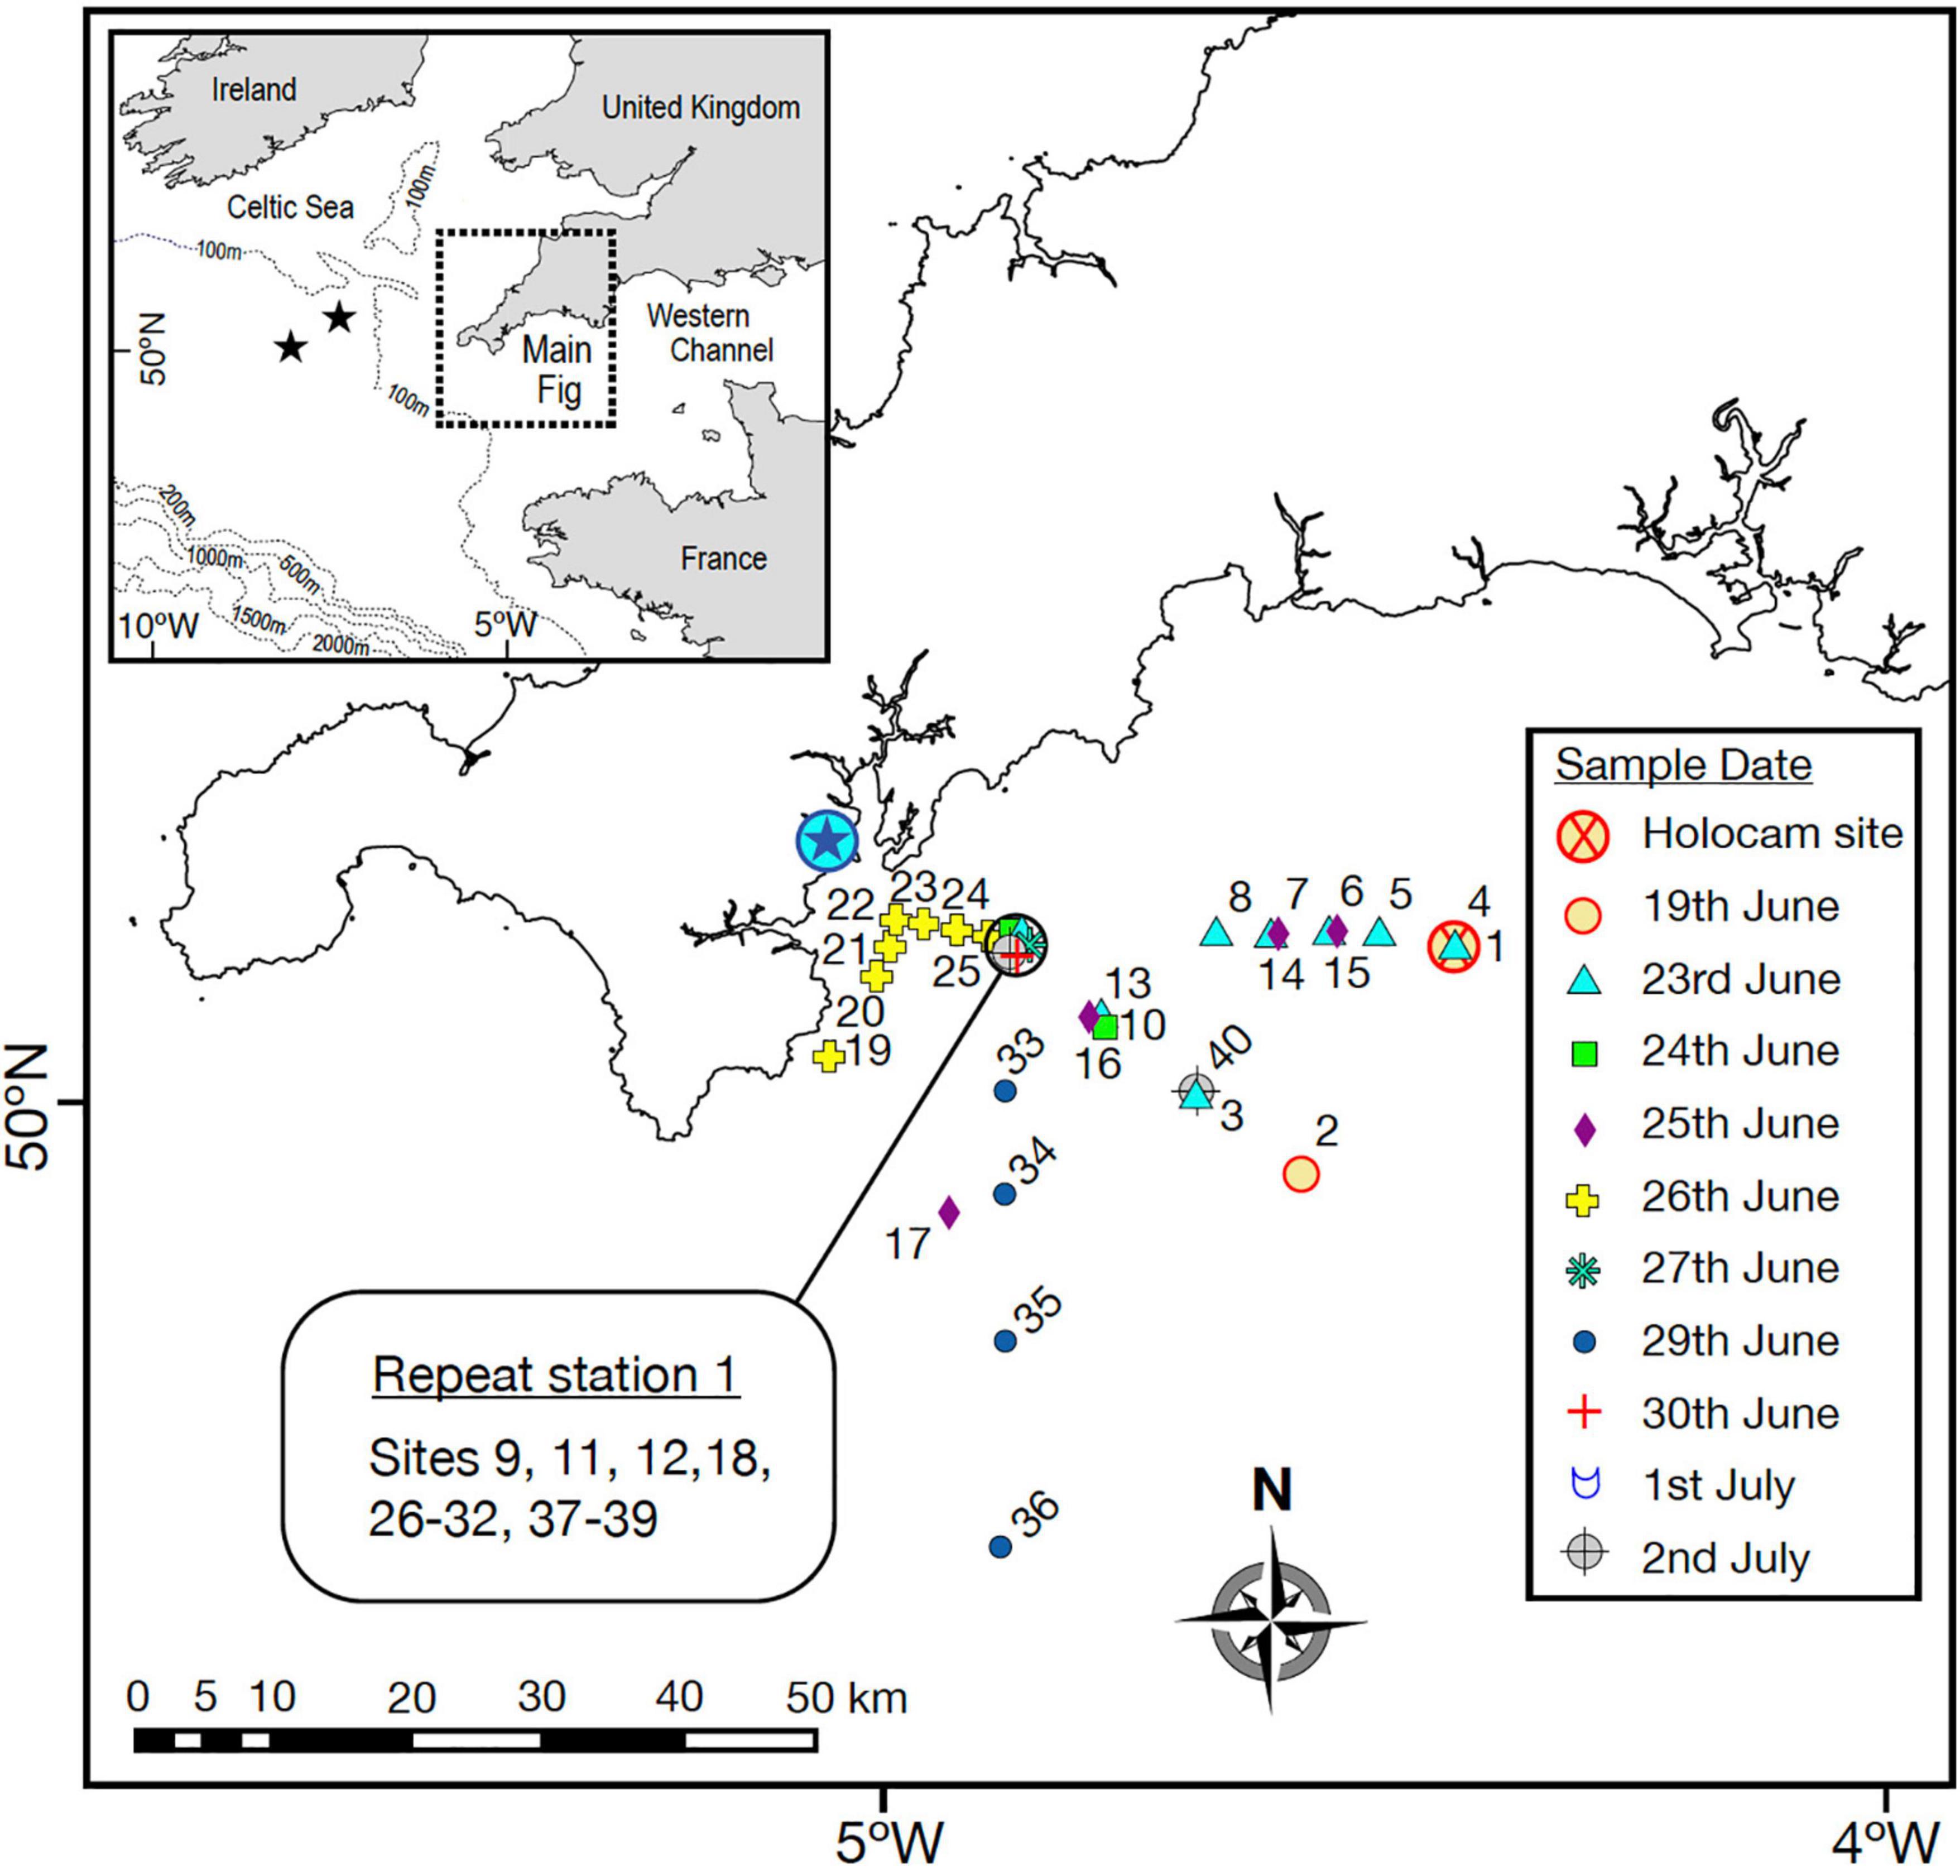
Figure 1. Study area in the Western English Channel where sampling occurred between the 19th of June and the 2nd of July 2015. Inset shows location with reference to the NW European continental shelf and location of two stations sampled in the Celtic Sea later in July. Main figure: the encircled blue star indicates the location of Falmouth. Symbols indicate the 40 stratified sites profiled and sampled (symbols labelled with site numbers), and on which date (represented by different symbols). The red/orange encircled cross indicates where the holocam was deployed on the 19th June. Repeat station 1 is indicated, including sites sampled there.
Holocam Deployment and Data Processing
The holocam, updated from that described in Graham and Nimmo-Smith (2010) was mounted on a profiling frame alongside an AML CTD Plus V2 probe with chlorophyll-fluorescence sensor (Figure 2), which was lowered slowly through the water column, with a sampling frequency of 15 Hz. The holocam was adapted for vertical profiling with a vertical configuration that minimised water column disruption, similar to that described in Graham et al. (2012). It was composed of a laser (658 nm, 60 mW) and charge coupled device (CCD) digital camera, separated by low-profile extension tubes and 90° mirrors (82 mm apart) to distance the sample volume (between mirrors) from the CCD camera and laser, as illustrated in Figure 2. The laser illuminated the sample volume and the CCD camera captured holograms comprising the interference patterns as particles diffracted the laser beam (Graham and Nimmo-Smith, 2010). Each holographic image had a size of 1536 × 1024 pixels, where pixel size was 4.65 μm and so each hologram’s sample volume was 7.14 mm × 4.76 mm × 82 mm = 2.78 ml. During the holocam deployment at Site 1 on 29th June, a total of 3323 holograms were digitally recorded on the downcast from the surface to 50 m depth.
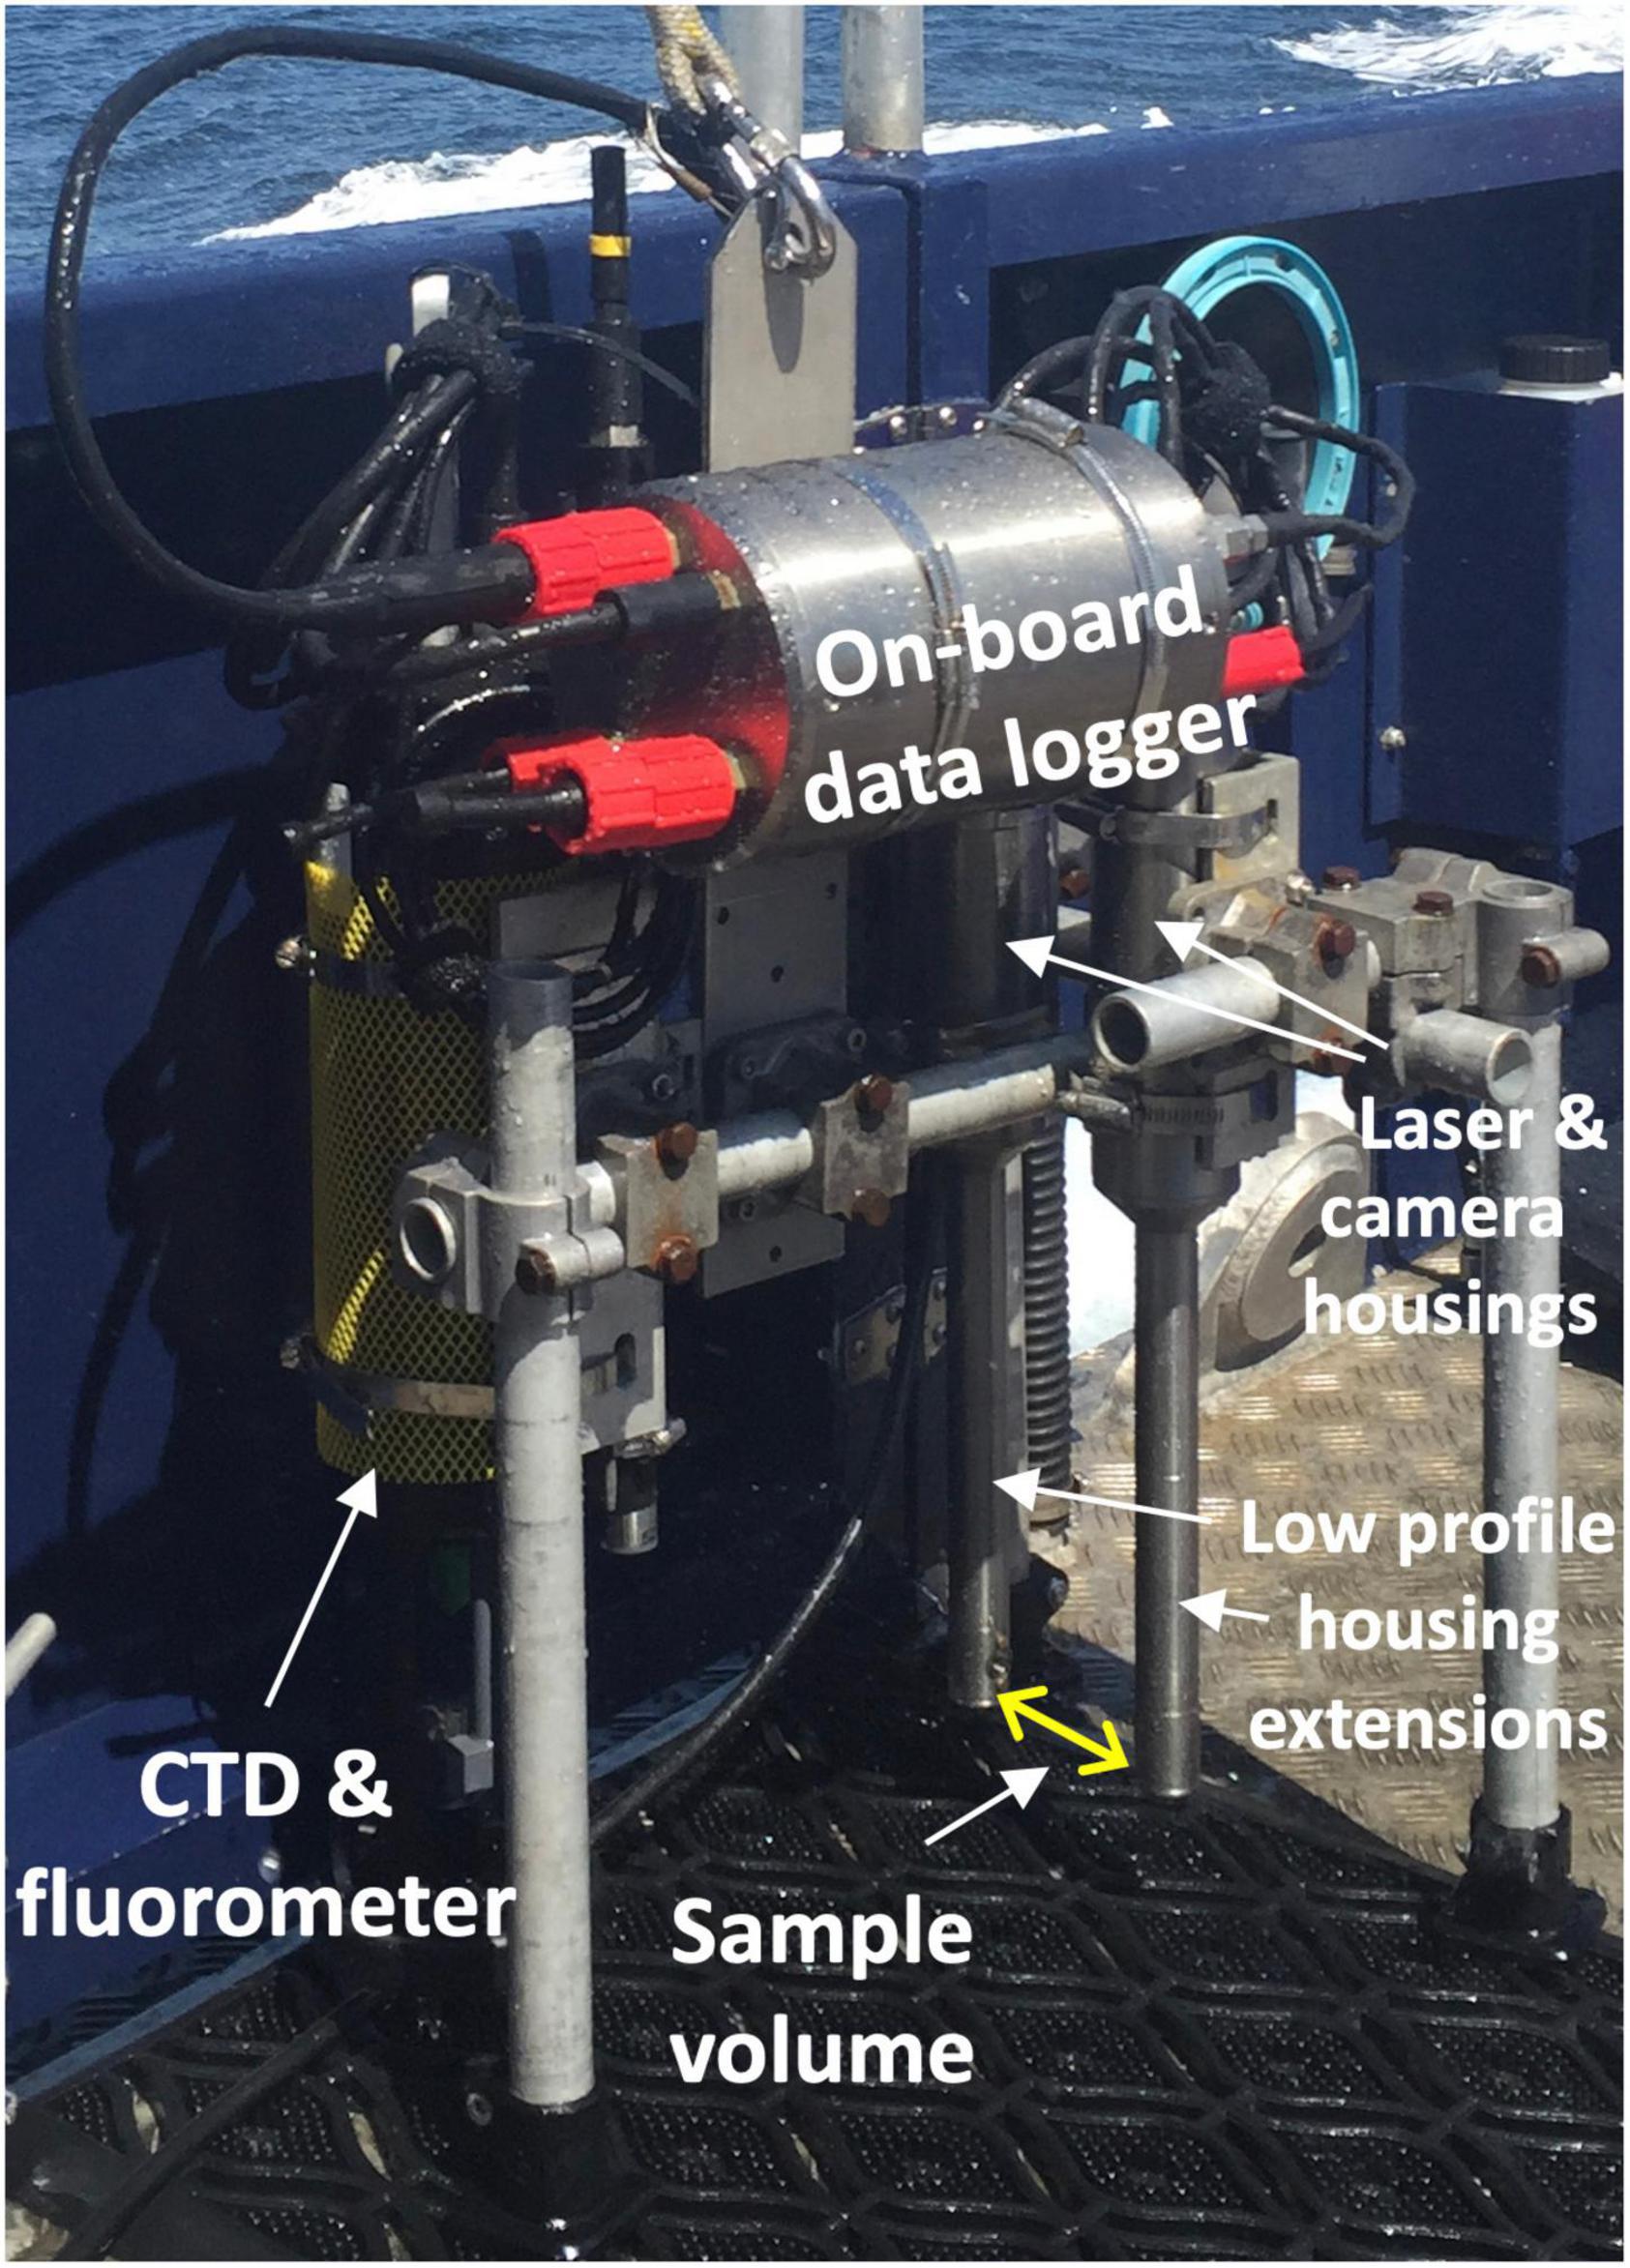
Figure 2. Photograph of the holocam system components mounted on a profiling frame with the AML CTD Plus V2 probe and fluorometer. The sample volume is indicated by the yellow arrow between low-profile housing extensions containing the laser and CCD camera. Raw data was collected by the on-board data logger.
On return to the laboratory, the holograms were processed following methodology detailed by Graham and Nimmo-Smith (2010) and Davies et al. (2015). Briefly, the static background was subtracted from the imagery captured by the CCD camera and then each hologram was reconstructed computationally into a “stack” of slices in 3-dimensional space, focussed at 0.5mm intervals through the sample volume. Each stack was then cleaned by removing the lowest 1.1% intensity pixels to reduce background noise, with this threshold determined manually to provide the best balance between reducing noise and retaining the most weakly scattering particles (Davies et al., 2015). Subsequently each stack was analysed manually whilst viewed using a MATLAB graphical user interface that facilitated navigation through the sample volume. All particles, specifically microplankton (including phytoplankton as well as heterotrophic dinoflagellates and ciliates) and aggregates, were counted as they came into focus when stepping through the 3D stack at 0.5 mm intervals, thus > 100 slices were analysed per hologram. Due to the 4.65 μm pixel size of the holograms, any particles below this threshold were not identified. Phytoplankton identification was based on linking the digitally-reconstructed holographic interference patterns to optical microscopy of the bottle samples (Figure 3 and Supplementary Figure 1), so that all major phytoplankton > 20–30 μm (including chains of smaller cells) were counted. In the case of the rod-shaped diatoms that were thought likely to be Proboscia alata, the very thin diameter precluded identification of individual cells in holograms so that counts for this taxon should be regarded as minimum values.
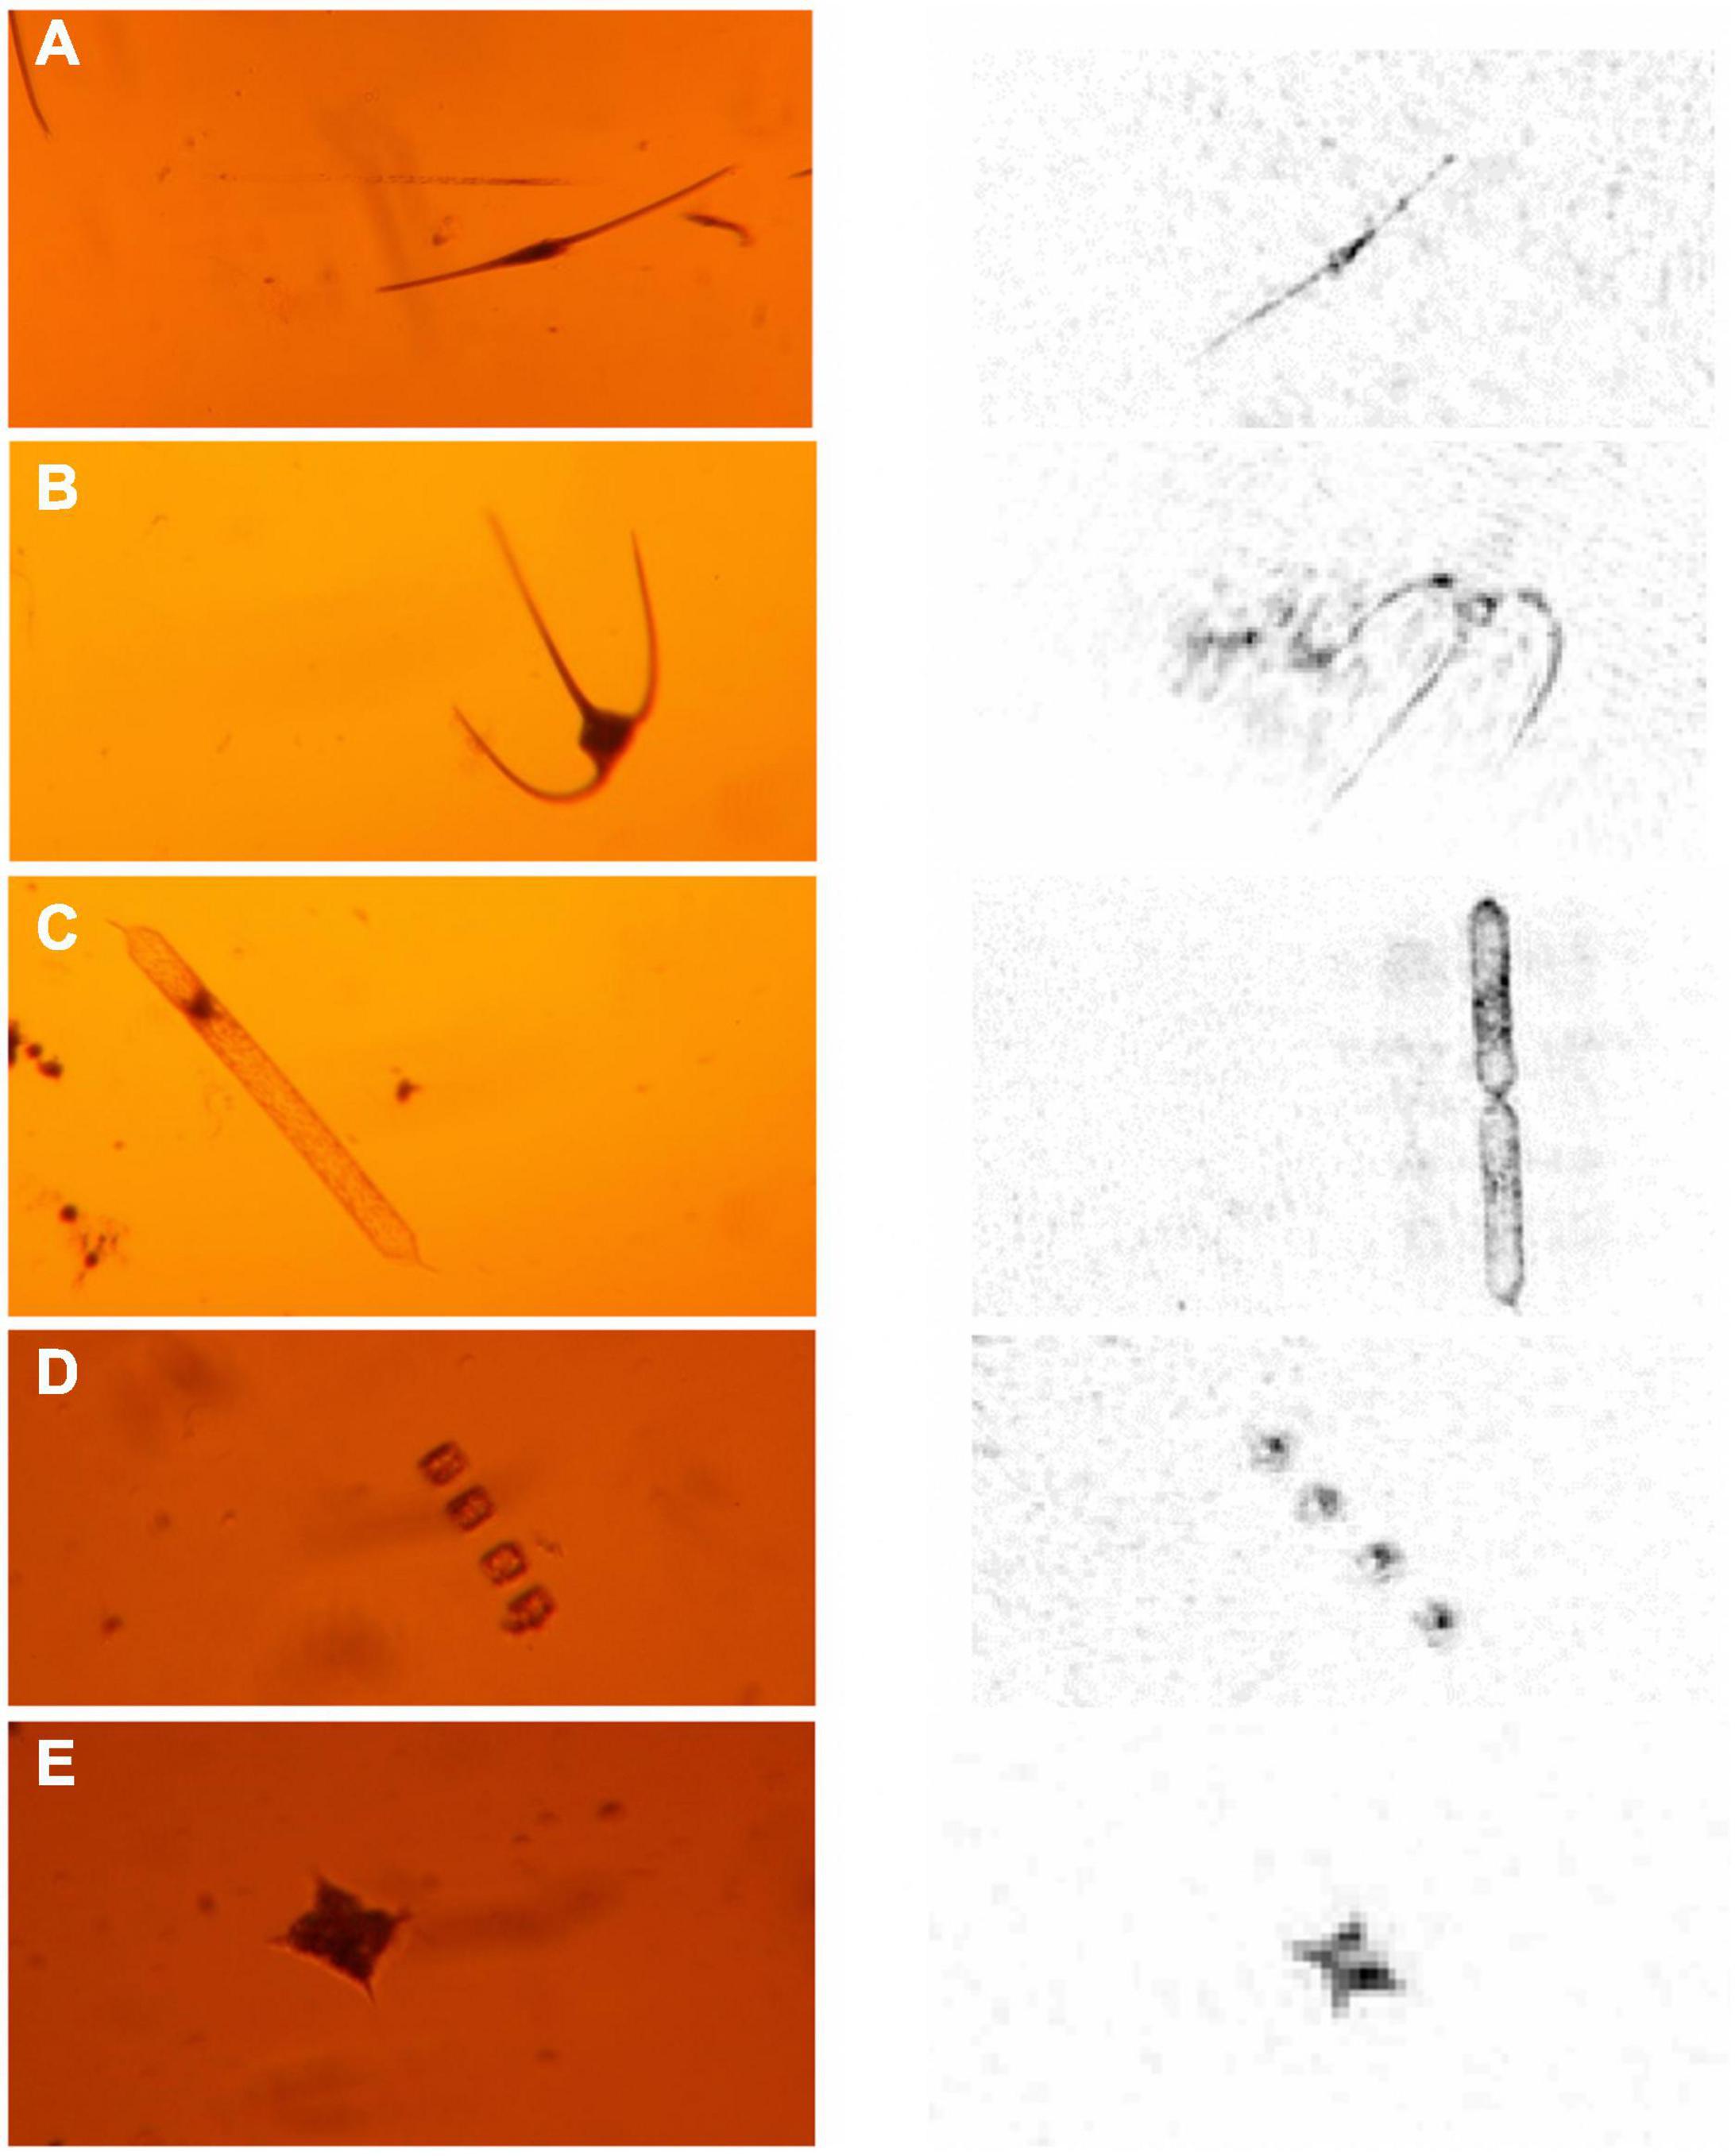
Figure 3. Selected comparative images of key taxa from optical microscope (left panel) and holocam (right panel). (A) The dinoflagellate, Ceratium fusus, (B) the dinoflagellate, Ceratium macroceros, (C) the diatom, Proboscia truncata, (D) the chained diatom, Thalassiosira, (E) the silicoflagellate, Dictyocha sp. These were used as a basis for the holocam taxa counts. A more comprehensive set of comparative images is provided in Supplementary Figure 1.
For the whole water column analysis, holograms were analysed at 0.3 m intervals. Where there was less rapid variation in abundance, as evidenced by change in chlorophyll fluorescence, in the deep waters beneath, and the surface waters above the SCM, particle counts were averaged at a 1 m depth resolution. Through the SCM, where the vertical changes in chlorophyll fluorescence were most rapid, a higher vertical resolution of 0.2 m was used without averaging. The choice of resolution was a compromise between identified vertical rates of change in taxa through the water column, as evidenced by rapid change in chlorophyll fluorescence, and how many holograms it was feasible to analyse in the given time.
Determination of Chlorophyll Concentration
Samples for chlorophyll analysis were collected by filtering 50 ml of water sample through 25 mm Whatman GF/F filters (in triplicate) immediately after collection Parsons et al. (1984). These filters were stored in a –20°C freezer until analysis, which was conducted as soon as possible on return to the lab to avoid error associated with pigment degradation (Graff and Rynearson, 2011). Chlorophyll was extracted in 90% acetone via sonication and then chlorophyll concentration was determined using a Turner Designs 10AU fluorometer based on the method of Welschmeyer (1994), whereby the fluorometer excited the extracted sample with blue light (436 nm) and the subsequent red fluorescence emission (680 nm) was recorded. For each SCM a chlorophyll intensity ratio was calculated, being the ratio of peak chlorophyll concentration to background chlorophyll concentration. Fluorometerically derived values of chlorophyll were used to calibrate the fluorometer mounted with the SeaBird CTD and to derive the carbon: chlorophyll ratio for the SCMs.
Determination of Particulate Organic Carbon
A water sample of 0.7 L was filtered onto a 25 mm pre-combusted (450°C, 6 h) Whatman GF/F filter under low vacuum (<200 mg Hg) and stored at –20°C until analysis. Prior to analysis the filter was dried in a 40°C oven for a minimum of 12 h, acid-fumed using 35% hydrochloric acid for 24 h to remove inorganic carbon and then dried again. The sample was then analysed using a carbon, hydrogen, nitrogen, sulphur-oxygen (CHNS-O) elemental analyser (Carlo-Erba Instruments EA1108) (Collos, 2002).
Microscope Phytoplankton Analysis and Biomass Determination
Samples for phytoplankton community taxonomic structure analysis were collected by decanting 50 ml of water sample into a darkened glass bottle and immediately preserving with Lugol’s iodine to a final concentration of 1%. These Lugol’s iodine preserved samples were later counted by settling 10 ml in a sedimentation chamber for 24 hours and examining using a Brunel SP951 inverted trinocular light microscope (Utermöhl, 1958). A single counting unit was an individual cell, whether solitary or part of a chain. Following previous practise (Olenina et al., 2006; Widdicombe et al., 2010), heterotrophic dinoflagellates and ciliates were included in the counts. Numerically dominant taxa (> 50 cells per ml) were counted along a single central traverse of the chamber base at 100x or 250x magnification depending on cell size. Cryptophytes (>8 μm) and unidentified small naked dinoflagellates (10–20 μm and 20–25 μm) were also counted along a single traverse of the chamber at 250x magnification. All other cells ≥ 10 μm were counted at 100x magnification upon examination of the entire chamber base plate. Since most nano-phytoplankton < 10 μm and all pico-phytoplankton could not be identified with optical microscopy, CytoSense flow cytometry was used to analyse the contribution of these phytoplankton and provide a complementary measure of biomass in the main different size fractions (meso-, micro-, nano-, pico-). A complete list of identified phytoplankton taxa is presented in Supplementary Table 2.
Diatoms, dinoflagellates and flagellates were identified to species or at least genus wherever possible, and ciliates were grouped according to size and with reference to cell wall structure (loricate or aloricate). Where there was substantial size variation within a diatom or dinoflagellate genus, cells were also classified into size categories. These included Pleurosigma (small: ∼50 μm length, medium: 80–170 μm length, large: 170–200 μm length), Thalassiosira (xsmall: < 10 μm height, small: 10–25 μm height, medium: 25–45 μm height, large: > 45 μm height), Protoperidinium (small: 10–30 μm diameter, medium: 30–65 μm diameter, large: 65–120 μm diameter) and Rhizosolenia (small: ≤ 10 μm diameter, medium: 10–20 μm diameter, large: > 20 μm diameter). Any remaining diatoms whose species or genus could not be differentiated accurately with optical microscopy were grouped as pennate or centric according to size (small: 20–40 μm length, medium: 40–65 μm length, large: 65–110 μm length, xlarge: 110–175 μm length, and small: 20–30 μm diameter, medium: 30–50 μm diameter, large: 60–150 μm diameter, xlarge > 150 μm diameter respectively). Similarly, any remaining unidentified dinoflagellates were also grouped according to size and with reference to cell wall structure (naked or armoured) where necessary (e.g., 10–20 μm naked dinoflagellates, 20–25 μm naked dinoflagellates, 10–30 μm armoured dinoflagellates).
Cell biovolume was calculated based on the geometric shapes and formulae assigned for each taxon by Olenina et al. (2006). Dimensions of at least 30 cells per taxon (only less in cases of rarely occurring taxa) were measured with the open source software “ImageJ.” Cell carbon concentrations were estimated using the carbon—biovolume relationships of Menden-Deuer and Lessard (2000).
CytoSense Flow Cytometric Phytoplankton Analysis
Samples for phytoplankton analysis by flow cytometry were collected by fixing 10 ml of water sample with glutaraldehyde (0.25% final concentration) and freezing at –80°C to preserve chlorophyll fluorescence immediately on return to lab (Marie et al., 2005; Fragoso et al., 2019). Samples were analysed with a CytoBuoy CytoSense flow cytometer and CytoUSB v5.7.5.7 data acquisition software, using two different sets of data acquisition settings; one optimal for larger phytoplankton (meso- and micro- phytoplankton: > 20 μm, and nano-phytoplankton: 2–20 μm), and the other optimal for small phytoplankton (pico-phytoplankton: < 2 μm). Meso-, micro- and nano-phytoplankton data were collected using a red (chlorophyll) fluorescence (RFL) trigger (30 mV) at a flow rate of 10 μl s–1 for 150 s or 10,000 cells. Pico-phytoplankton data were acquired using a sideways scatter (SWS) trigger (25 mV) at a flow rate of 0.1 μl s–1 for 10,000 cells, and pico-particles with a red fluorescence signal < 10 mV were manually removed from the dataset. Cell size derived from forwards scatter (FWS) was calibrated using a set of Thermo Fisher Scientific non-fluorescent polystyrene microspheres with a range of diameters (1, 2, 6, 10, 15 μm).
During data acquisition the CytoSense instrument recorded particle pulse shapes of FWS enabling description of phytoplankton community size structure using CytoClus v4.3.1.1 data processing software. For each sample a cytogram of total FWS (TFWS) and total RFL (TRFL) was generated to identify cell size. Thus clusters of pico-phytoplankton, nano-phytoplankton, and micro- and meso- phytoplankton could be resolved. As TRFL was calculated for each cell, the TRFL of the entire phytoplankton population and of each phytoplankton cluster could be determined. This allowed for the contribution of micro- and meso-phytoplankton (> 20 μm), nanophytoplankton (2–20 μm) and pico-phytoplankton (<2 μm), to total community red fluorescence (TCRFL), a proxy for chlorophyll (and by extension biomass) to be assessed.
At the two Celtic Sea sites (Figure 1), samples were collected from the SCM and preserved as described above. These preserved samples were run in a CytoSense flow cytometer, and “Image in flow” was enabled to capture photographs of the most dominant larger (> 30 μm) phytoplankton.
Statistical Analysis
A number of statistical similarity analyses were undertaken to establish potential similarities and distinctiveness of the phytoplankton community at the different water depths. The analyses were undertaken using the PRIMER v6 software (Clarke and Gorley, 2006). Statistical analysis was conducted on phytoplankton carbon biomass data since biomass is a more biogeochemically relevant property (Paasche, 1960), as it provides a more accurate representation of community structure than abundance when the community consists of taxa of a variety of different sizes. Biomass data were first standardised by dividing biomass values by the total biomass for a given sample, and then normalised by performing a square root transformation to allow each taxon to influence similarity between samples and not just the dominant taxa (e.g., Ceratium fusus). Bray-Curtis similarity was calculated within each pair of samples and a cluster analysis subsequently performed to explore similarity of community structure among samples. Samples were grouped by sampling depth, i.e., surface, SCM and deep, and a non-metric multidimensional scale (nMDS) plot was generated to visually display similarity between samples, where a stress level below 0.2 is considered to indicate the ordination to be an accurate representation of the similarity relationship (Zuur et al., 2007). An ANOSIM (Analysis of Similarity) was applied to determine if the three sample clusters (surface, SCM, and deep) were statistically distinct from each other in terms of their phytoplankton community structure, and to determine the level of separation between each cluster (given by the global R value, where values close to 0 indicate no separation and values close to 1 indicate high separation). A SIMPER (Similarity Percentage Analysis) was performed to investigate community similarities within clusters and dissimilarities between clusters, and to identify contributions of each taxon to overall similarity within each cluster and dissimilarity between clusters.
Results
Site 1 (Holocam Site): Overall Water Column Structure and Chlorophyll Distribution
Site 1 showed a stepped thermocline structure where the lower (main) thermocline was located between 25 and 28 m and an upper thermocline, between 15 and 18 m (Figures 4, 5). An intense SCMTL was located at the base of the main thermocline with a maximum chlorophyll concentration of 28.0 μg l–1, and a chlorophyll intensity ratio of 33.3 (ratio of maximum SCM chlorophyll concentration to background chlorophyll concentration). The standing stock of chlorophyll integrated to a depth of 63 m (depth of CTD profile) was 66 mg m–2 and the SCM (20-35 m) accounted for 42 mg m–2, being responsible for approximately 64% of water column chlorophyll. In surface (0–20 m) and bottom (30–70 m) waters, chlorophyll concentrations did not exceed 1 μg l–1. Phytoplankton counts converted to biomass from the discrete samples from the surface (14 m), SCM (27 m) and bottom layer (42 m) showed distinct differences (Figure 4): the surface was populated primarily by ciliates (36%), smaller heterotrophic and mixotrophic dinoflagellates (33%) and a minor diatom component (16%); the SCM was dominated by a single species, the dinoflagellate Ceratium fusus (85%); the bottom layer contained a more mixed community with larger dinoflagellates (20%) and diatoms (36%) in addition to the smaller dinoflagellates (25%).
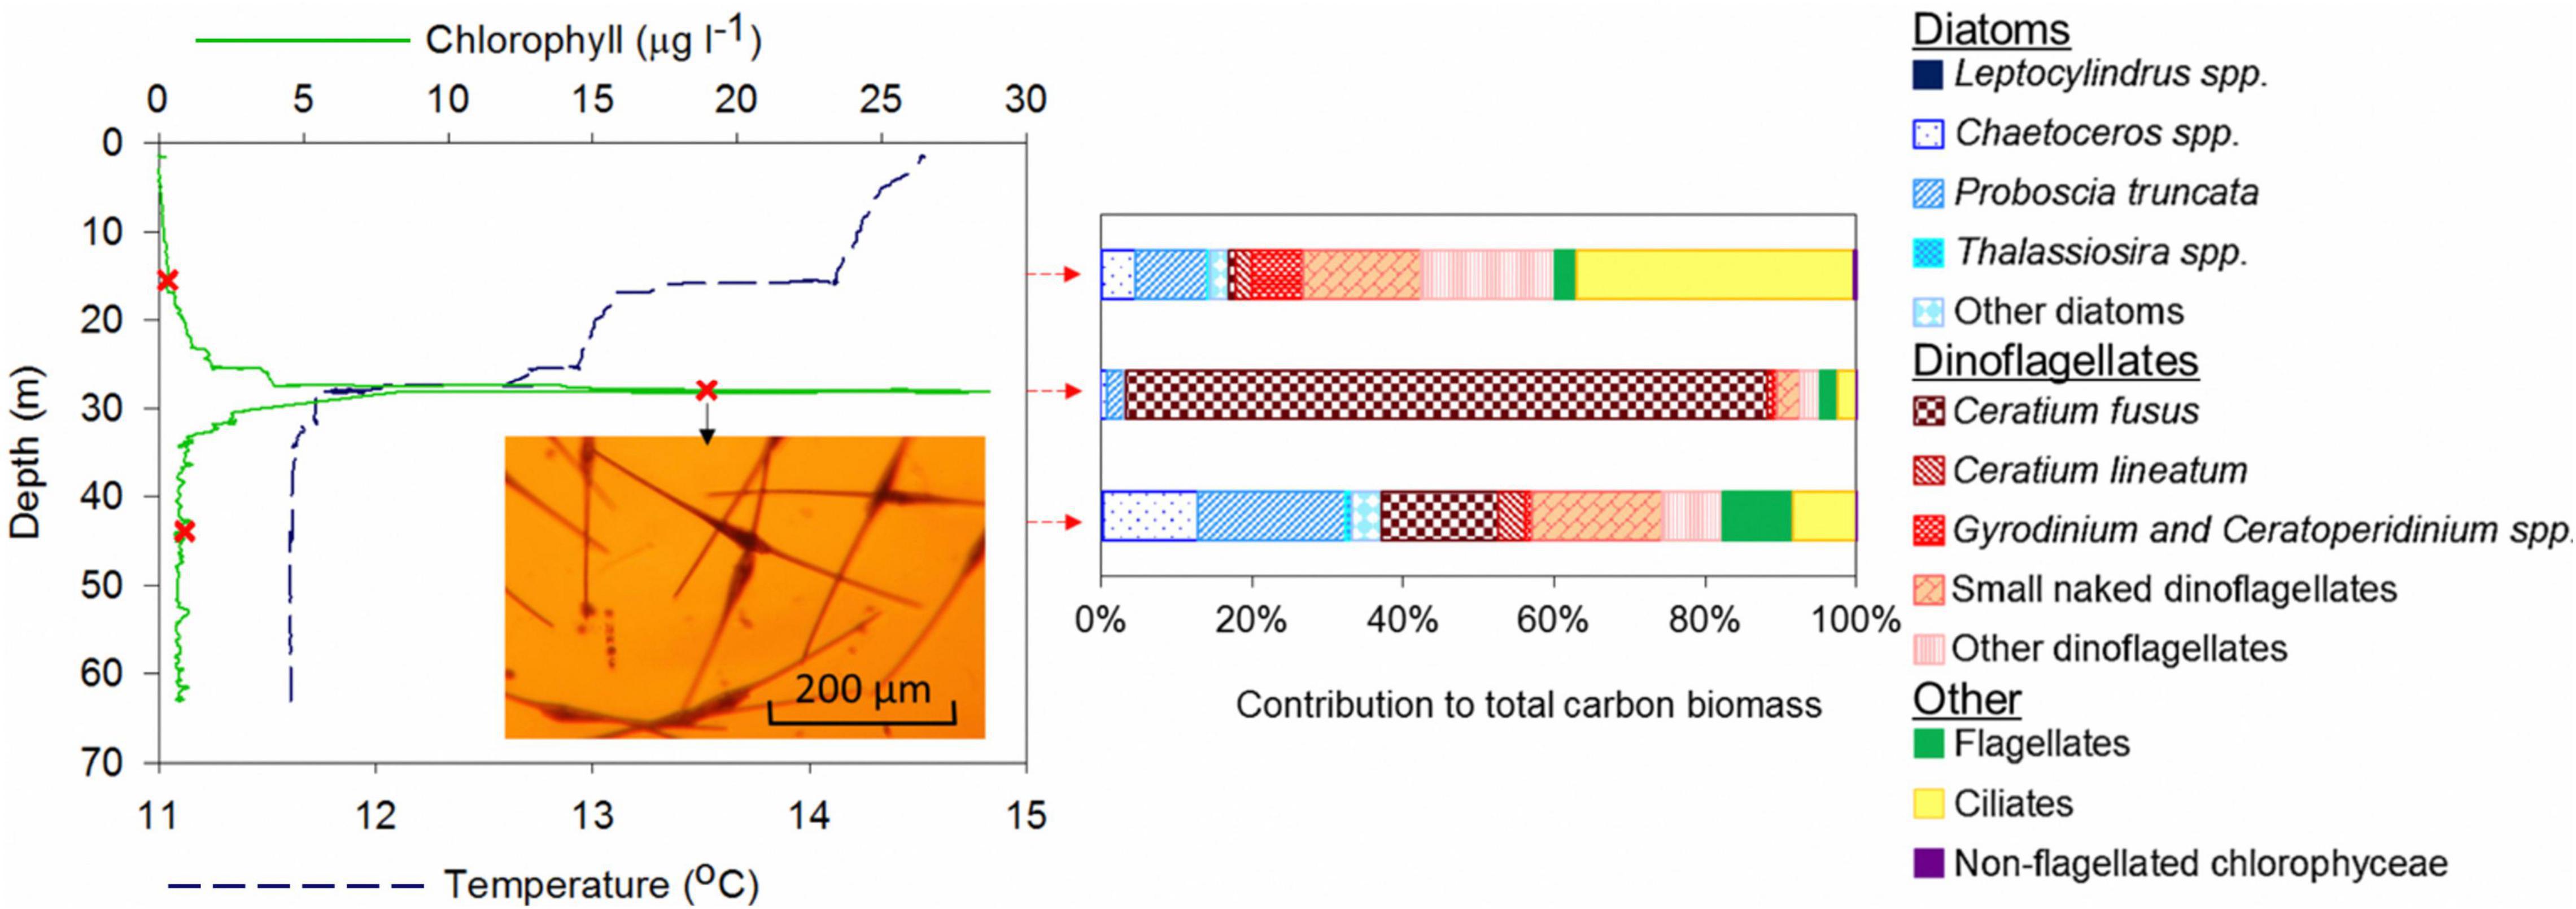
Figure 4. Temperature and chlorophyll profile, and phytoplankton (biomass) community structure determined by microscopy at site 1 where the holocam was deployed. The green line represents chlorophyll concentration determined from CTD chlorophyll-fluorescence, the blue dashed line represents temperature and the red Xs (and corresponding red arrows) where water samples were collected for phytoplankton analysis. An optical microscope image of the community within the SCM clearly shows the dinoflagellate Ceratium fusus to be dominant.
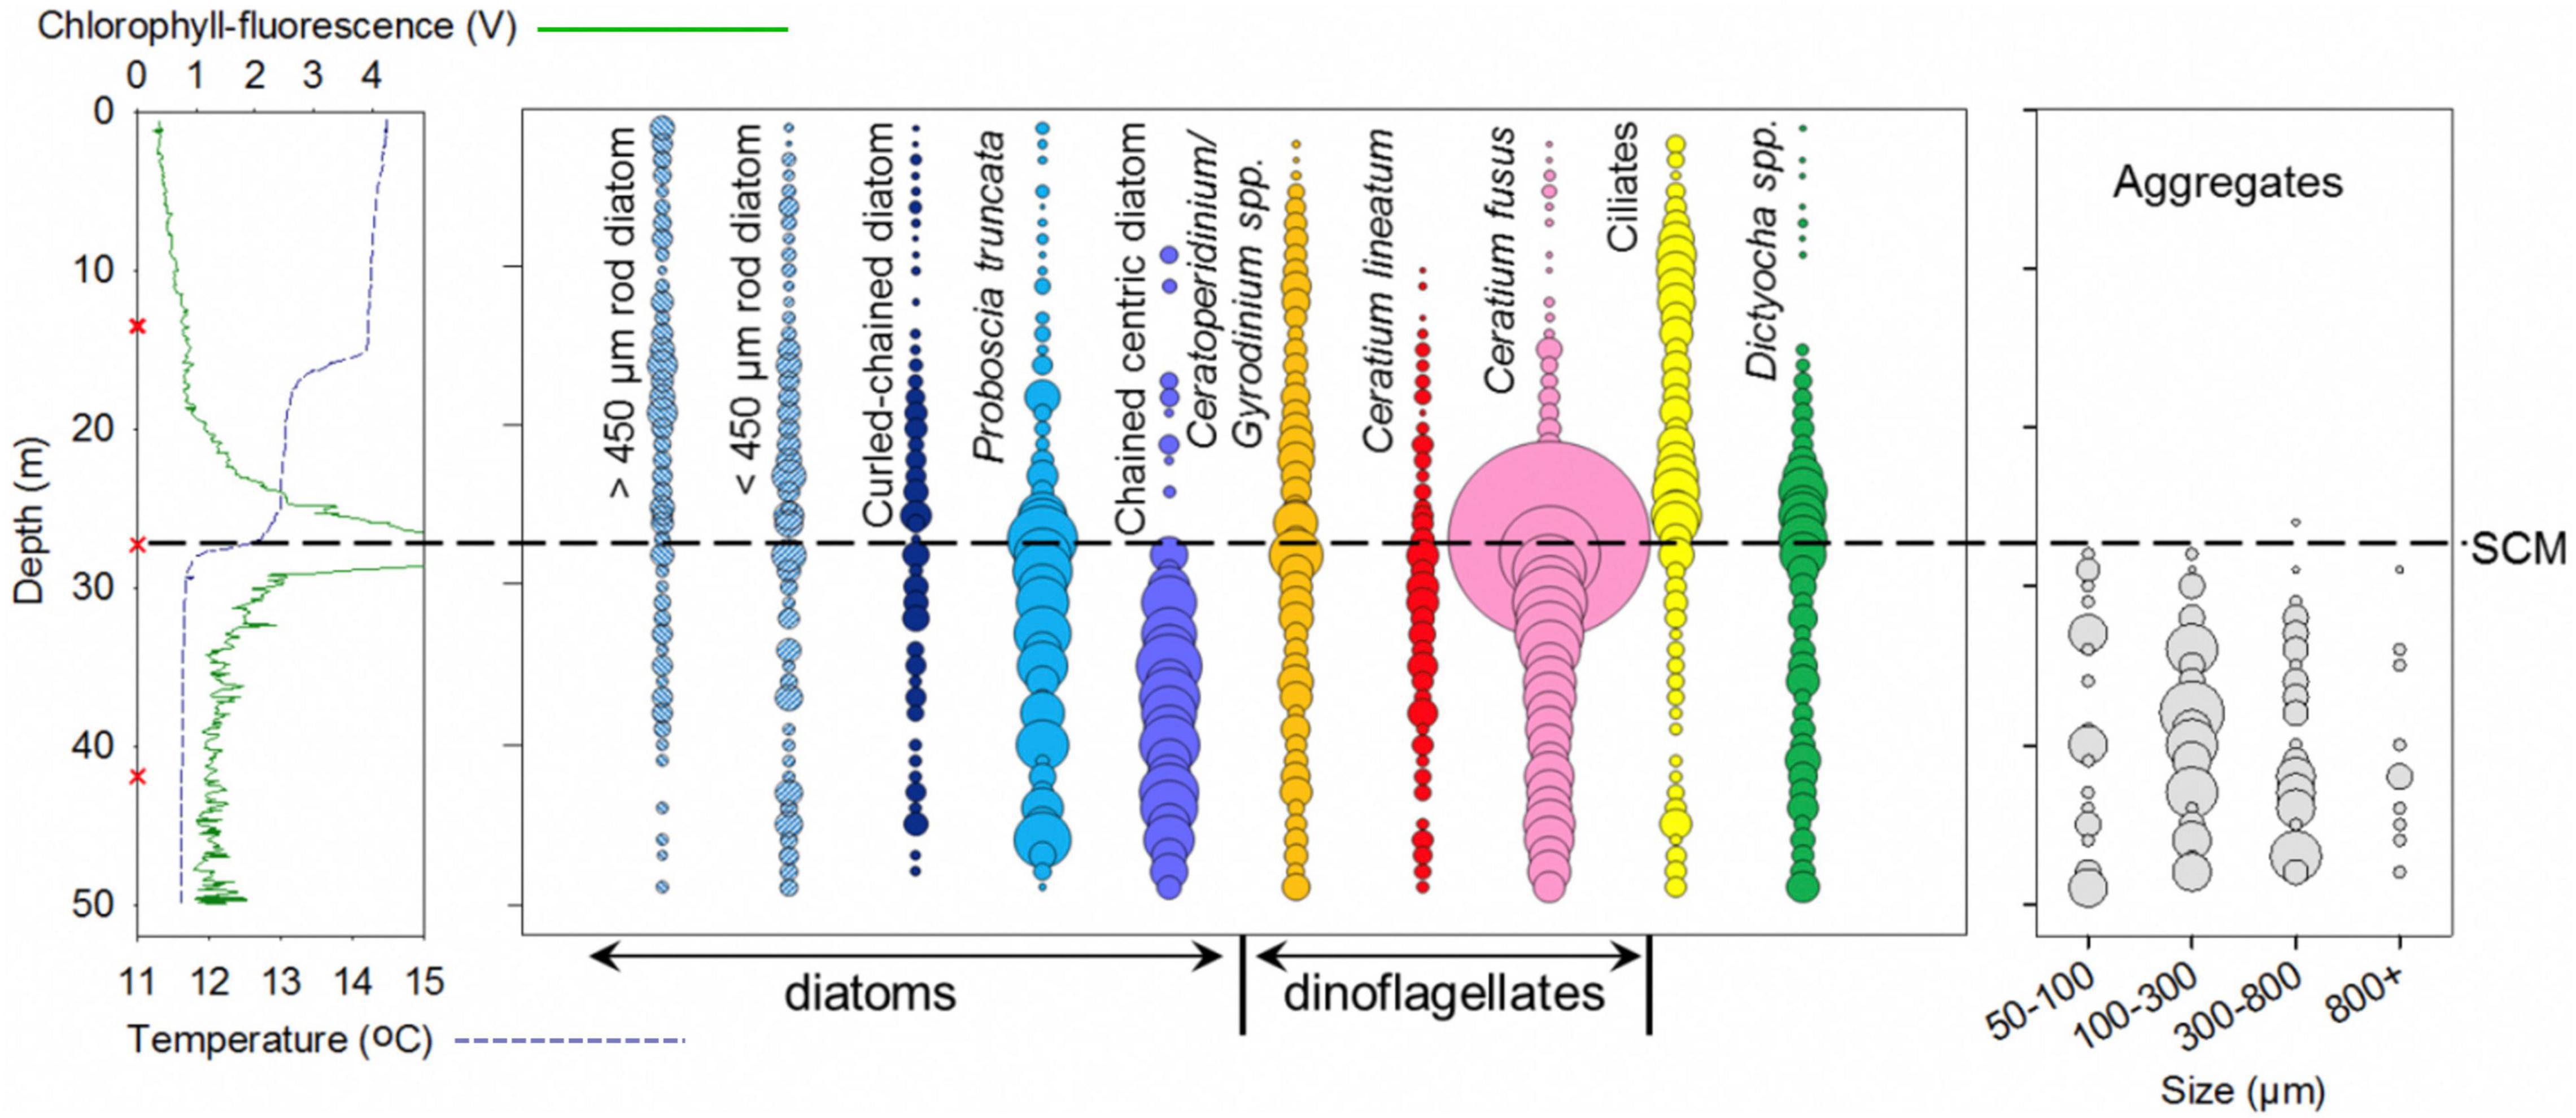
Figure 5. Holocam determined abundances of the 10 most numerically dominant large (>30 μm) phytoplankton for the whole water column. Holograms were analysed at 0.3 m depth intervals, increased to 0.2 m intervals for the SCM (between 25 and 30 m). For the whole water column analysis, particle counts were averaged over each meter, where circle size is proportional to cell abundance standardised to maximum cell abundance, and the centres of the circles correspond to the depth analysed. Aggregates counted are shown in the right hand panel of the plot, where circle size is proportional to the number of aggregates counted in the sample volume analysed, and the centres of the circles, again, correspond to the depth analysed. The AML CTD Plus V2 probe temperature (dashed blue line) and chlorophyll-fluorescence (green line) depth profile of the holocam profiled site is shown in the left hand panel of the plot, red Xs indicate where discrete water samples were collected.
Holocam Site: Whole-Water Column Holographic Phytoplankton Profiling
The most striking feature of the holocam profile was the high concentration and dominance of a single species within the SCM. From holocam counts at individual 0.2 m—spaced depths, the dinoflagellate Ceratium fusus comprised up to 81% of cells identified with concentrations up to 137 cells ml–1 (Figure 6). The discrete water samples taken at the same site for microscopic analysis at the peak SCM chlorophyll were consistent with the holocam results with C. fusus comprising 85% biomass in the SCM sample (Figure 4). The three discrete samples revealed distinct communities within the water column, while the holocam showed the continuity of change, with differences in the vertical distribution of the main taxa and key transitions in community structure at different levels (Figures 5, 6).
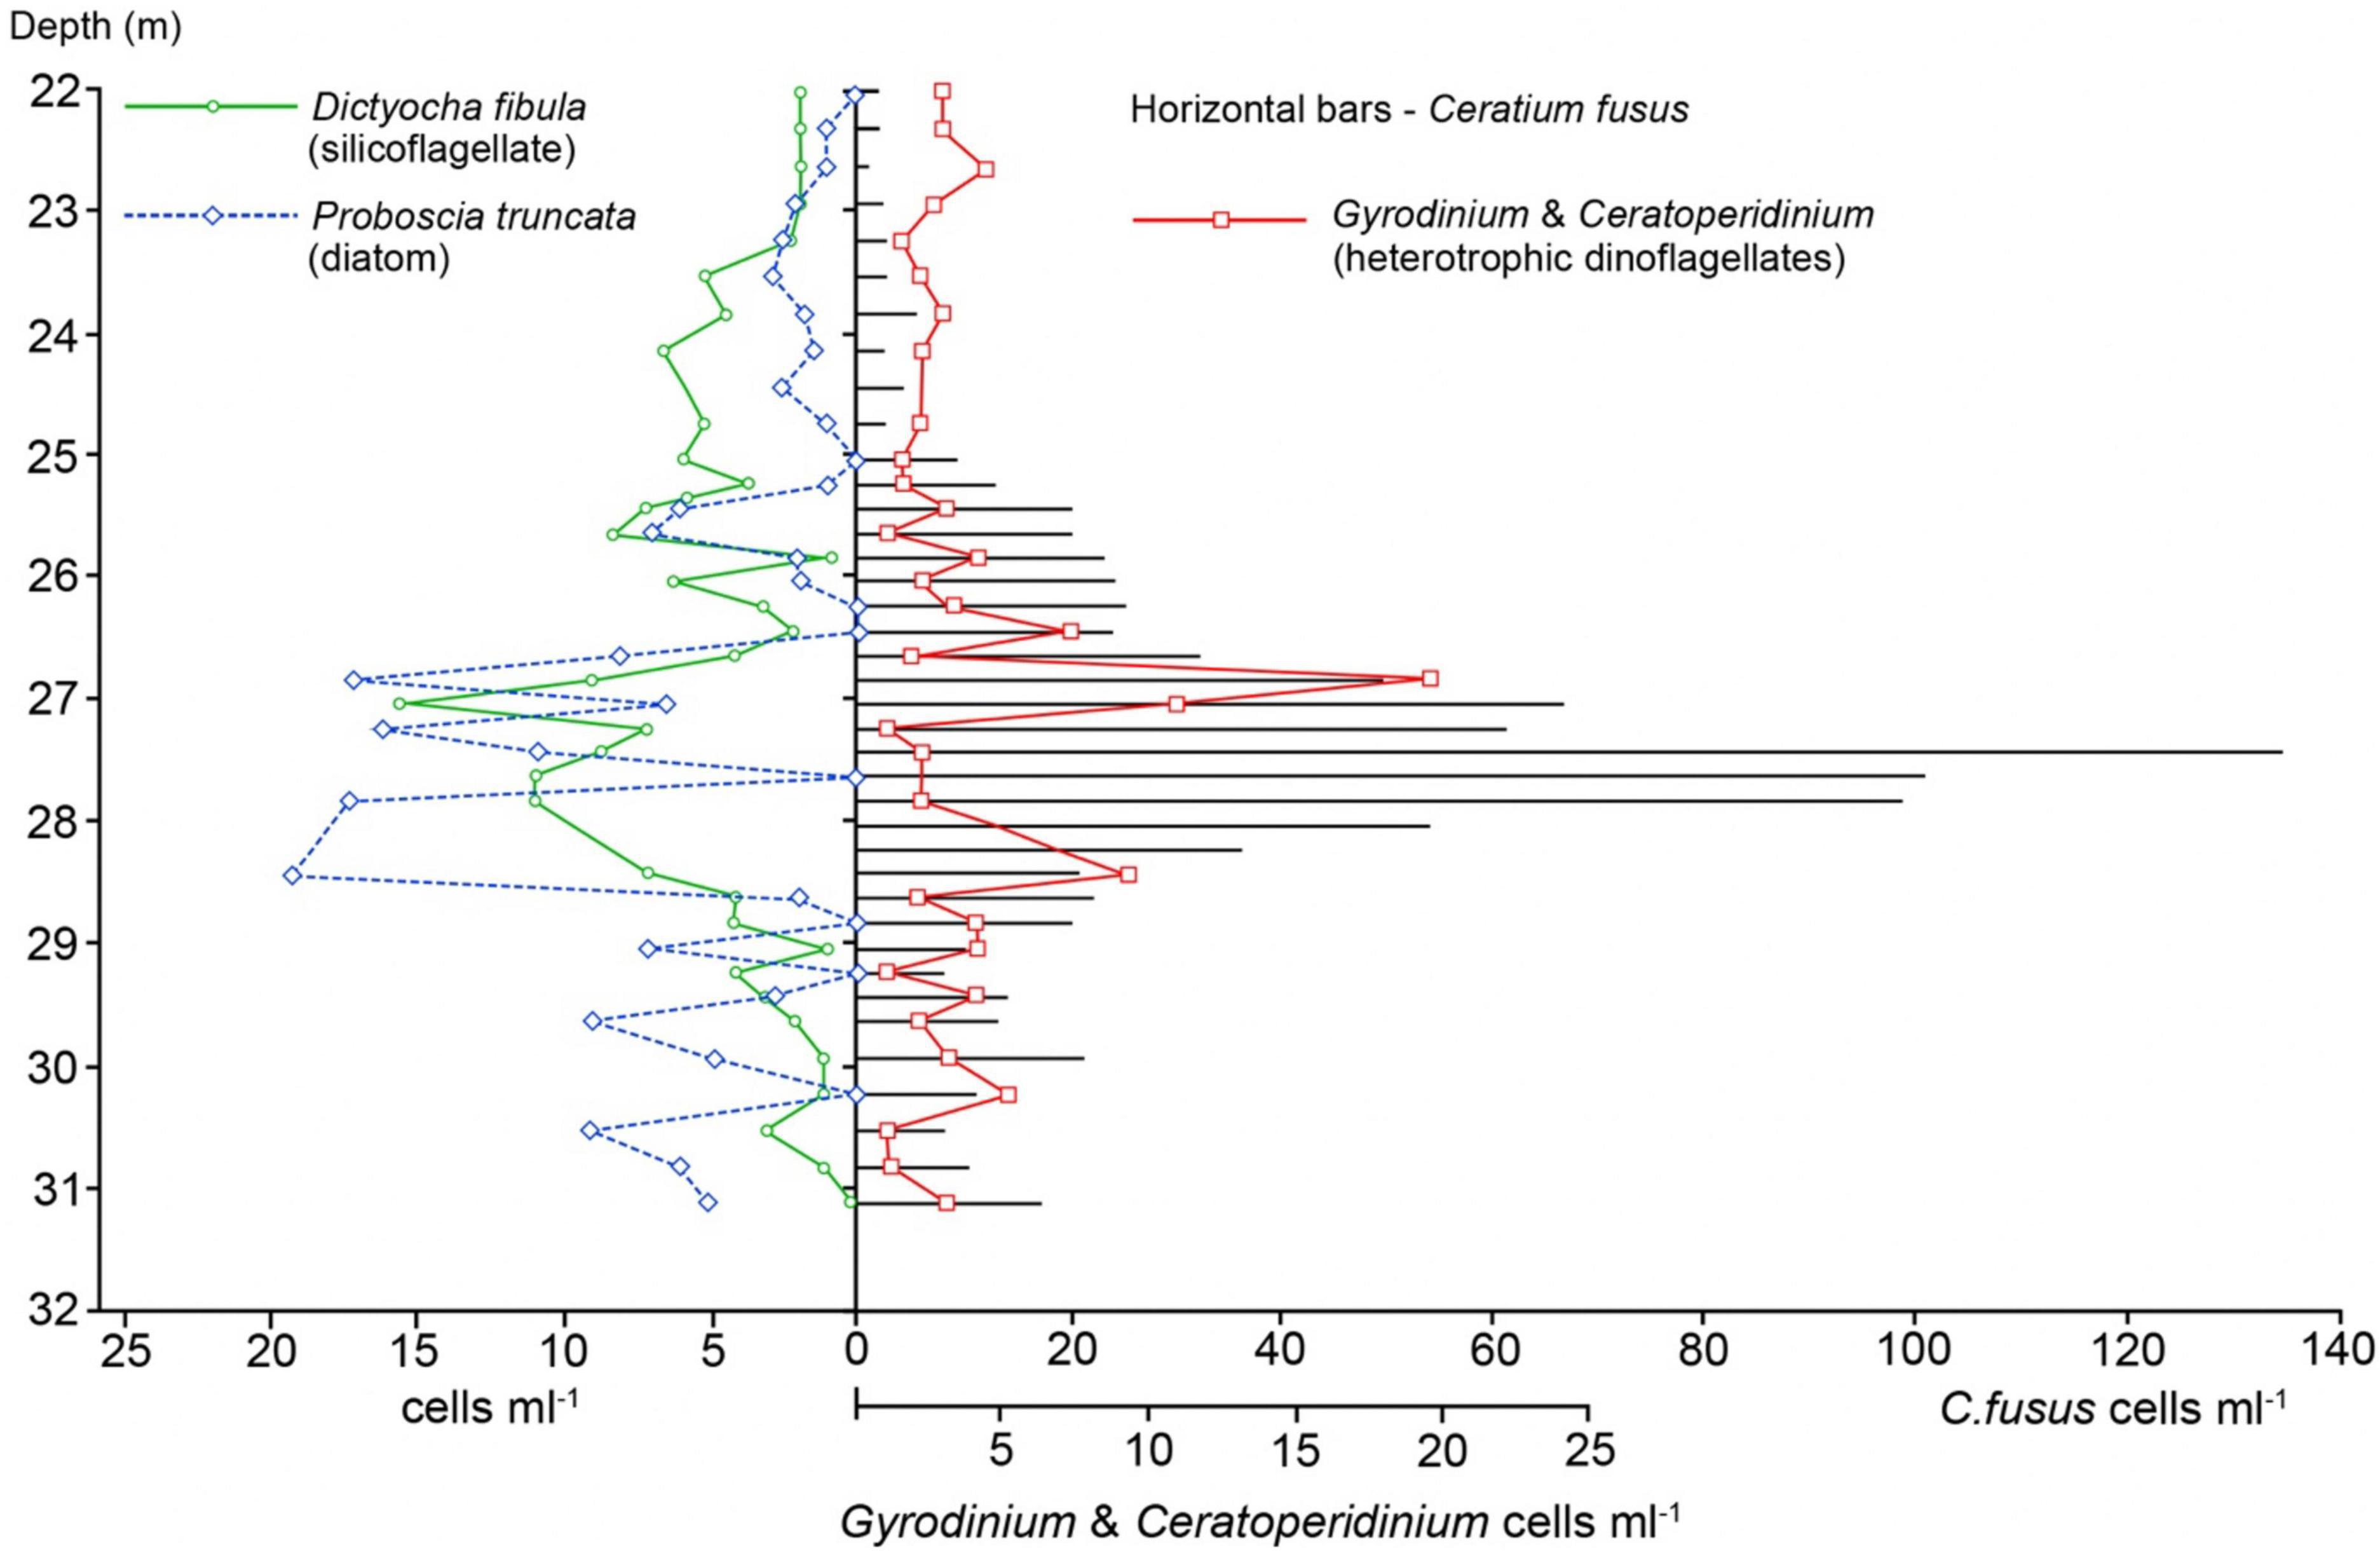
Figure 6. Holocam determined abundances of the dominant C. fusus and other major plankton through the SCM showing layering of key taxa. Analysis through the main SCM was at a higher resolution (20 cm).
Within the SCM, Ceratium fusus was consistently the most dominant species, ranging between 41 and 81% of cells identified from the 0.2 m spaced holograms between 25 and 30 m (Figure 6). Through the SCM, the C. fusus concentrations were > 20 cells ml–1 between 25.5 and 29 m, > 60 cells ml–1 between 27 and 28 m, with the peak of 137 cells ml–1 at 27.4 m (Figure 6). Holograms analysed through the SCM also revealed that the C. fusus concentration (Figure 6) matched closely the chlorophyll-fluorescence profile (Figure 4). Both show a continuous downward decrease from the SCM peak concentration at 27.4 m, but above the SCM peak, a sharp decrease is succeeded upwards by a ∼ 1.5 m zone of moderately elevated concentration, before C. fusus concentrations reduce to < 3% of cells, by 25 m. In contrast, although the decline was more abrupt below the SCM peak, C. fusus contributions of around 22% were sustained throughout the deeper waters (Figure 5). The other key contributor to the SCM was the rhizosolenid diatom Proboscia truncata that attained peak concentrations around 1 m above and below the C. fusus peak (Figure 6). Similar to C. fusus, P. truncata had sustained concentrations through the deep layer, below the SCM (> 30 m), comprising typically between 10 and 32% of cells identified from the individual spaced holograms. The dinoflagellate, Ceratium lineatum also made a significant contribution to the community within the lowermost part of the SCM, being 6.3 and 8.1% of cells identified between 30 and 33 m. Intriguingly, the abundance of the silicoflagellate, Dictyocha sp. (likely Dictyocha fibula showing the characteristic 4 radial spines—Supplementary Figure 1) closely resembled that of C. fusus, with peak concentrations in the SCM coinciding with those of C. fusus between 27 and 28 m. However, above the most intense part of the SCM (25.5–29 m) Dictyocha fibula replaced C. fusus as the dominant taxa, contributing 18.0–26.9% of cells identified between 23 and 25 m at a concentration of 4.3–6.5 cells ml–1. D. fibula occurred in reduced numbers below 30 m (generally ≤ 1.7 cells ml–1), such that it was generally less than 10% of cells identified. Significantly, peak concentrations of the heterotrophic dinoflagellates Ceratoperidinium and Gyrodinium spp. occurred immediately above (27 m) and beneath (28.5) the C. fusus SCM peak, but decreased where C. fusus was most abundant (Figure 6).
Above the SCM, in the surface waters, the community was dominated by ciliates (10–58% of cells identified; up to 6.0 cells ml–1), and Ceratoperidinium and Gyrodinium spp. (generally 10–30% of cells; between 1 and 4.0 cells ml–1) (Figures 4, 5). The larger phytoplankton were particularly sparse above the upper step to the thermocline. The only significant large phytoplankton in the topmost layer were rod shaped diatoms, primarily the rhizosolenid Proboscia alata that attained concentrations up to 4.0 cells ml–1 and constituted 30% of cells identified above 15 m (Figure 5). The distribution of other phytoplankton broadly followed the double thermocline structure with curled chained diatoms (mainly Chaetoceros spp.), chained centric diatoms (Thalassiosira spp.) and P. truncata, the dinoflagellates C. fusus and C. lineatum, and the silicoflagellate, D. fibula, making minor contributions from the top of the SCM up to 15 m, but being rare or absent above this depth (Figure 5).
The most distinctive feature of the waters below the SCM was the presence of abundant aggregates that were entirely absent from the surface water. These were recorded from the holograms in a number of size ranges covering an order of magnitude variation with the largest > 1 mm (Figure 5 and Supplementary Figure 1). Most of the material in the aggregates was not identifiable although fragments of diatom chains or large dinoflagellates could sometimes be discerned. Beneath the SCM, C. fusus and P. truncata as well as C. lineatum and D. fibula were all persistent (Figure 4). There was also a significant presence of P. alata but with a dominance of shorter (<450 μm length) specimens. A significant difference was the major presence of chained centric diatoms, likely Thalassiosira (10–37% of cells identified; up to 10.4 cells ml–1) in contrast to their near absence above 15 m and a sparse presence 15–27 m.
Holocam Site: Discrete Samples: Size Fractionated Chlorophyll and Relation to Phytoplankton Community (Biomass) Structure
Within the SCM at site 1 the phytoplankton community was predominantly composed of larger cells, with micro- and meso-phytoplankton (> 20 μm) contributing 96% of community chlorophyll, as determined by CytoSense flow cytometry (Table 1). As well as contributing 85% of the SCM carbon biomass identified using light microscopy (Supplementary Table 2), C. fusus also contributed approximately 69% of total chlorophyll. The chlorophyll concentration was determined by estimating C. fusus carbon content using the microscope cell count and biovolume estimate, and converting this to chlorophyll based on a carbon to chlorophyll ratio of 38 calculated using particulate organic carbon (POC) and chlorophyll data collected for the SCM. The other contributors to SCM biomass were the diatoms (mostly P. truncata), 3.3%; other dinoflagellates, 7.1%; flagellates (mainly D. fibula), 2.2% and ciliates (aloricate and loricate) 2.5%.

Table 1. Contribution of micro- and meso-phytoplankton (>20 μm), nano-phytoplankton (2–20 μm) and pico-phytoplankton (<2 μm) to total community red fluorescence (TCRFL; a proxy for chlorophyll and by extension biomass) as identified using CytoSense flow cytometry.
In bottom waters the phytoplankton community was mostly micro-/meso-phytoplankton, and nano-phytoplankton (55 and 33% of community chlorophyll respectively; Supplementary Table 2). Diatoms (37.2%) and dinoflagellates (45.0%) dominated community biomass identified using microscopy. Ciliates, predominantly aloricate, and flagellates, mainly Chrysophaerella longispina and D. fibula, also had significant biomass, contributing 8.4 and 9.4% respectively. Within the diatoms P. truncata (19.6% of microscope community biomass) and Chaetoceros spp. (12.6% of microscope community biomass) were most dominant, and within the dinoflagellates C. fusus (15.4%), small naked dinoflagellates (17.2%) and C. lineatum (3.6%) made the largest contributions of biomass (Figure 4; data in Supplementary Table 2).
The Wider Shelf Context: The Western Channel and Celtic Sea
To provide context for the results at site 1 we sampled the SCM at a further 39 stratified sites in a combination of repeat stations and transects (Figure 1) with representative profiles shown in Figure 7. Results of flow cytometry are given in Table 1 and the range of biomass contributions of major groups is given in Table 2 with full biomass results in Supplementary Table 2. The sampled sites included 10 where the surface and bottom waters were also sampled. This revealed the widespread dominance of C. fusus within the SCM throughout the region. There were also distinct differences in the communities of the surface, SCM and deep layers throughout the survey period that were consistent with the observations at site 1. Size fractionated chlorophyll analysis revealed that the meso- and micro- phytoplankton (> 20 μm) contributed 75% ± 11.1 (n = 40) to the SCM chlorophyll, while the nano- and pico- phytoplankton (< 20 μm) contributed 73.8% ± 15.8 (n = 11) to the chlorophyll of the surface waters (Table 1). The proportion of C. fusus in the SCM biomass also varied, with the highest concentrations in the most intense SCM with the highest chlorophyll intensity ratios (Figure 8). Across all the sites, there was a strong correlation between the abundance of C. fusus and chlorophyll concentration (Figure 9).
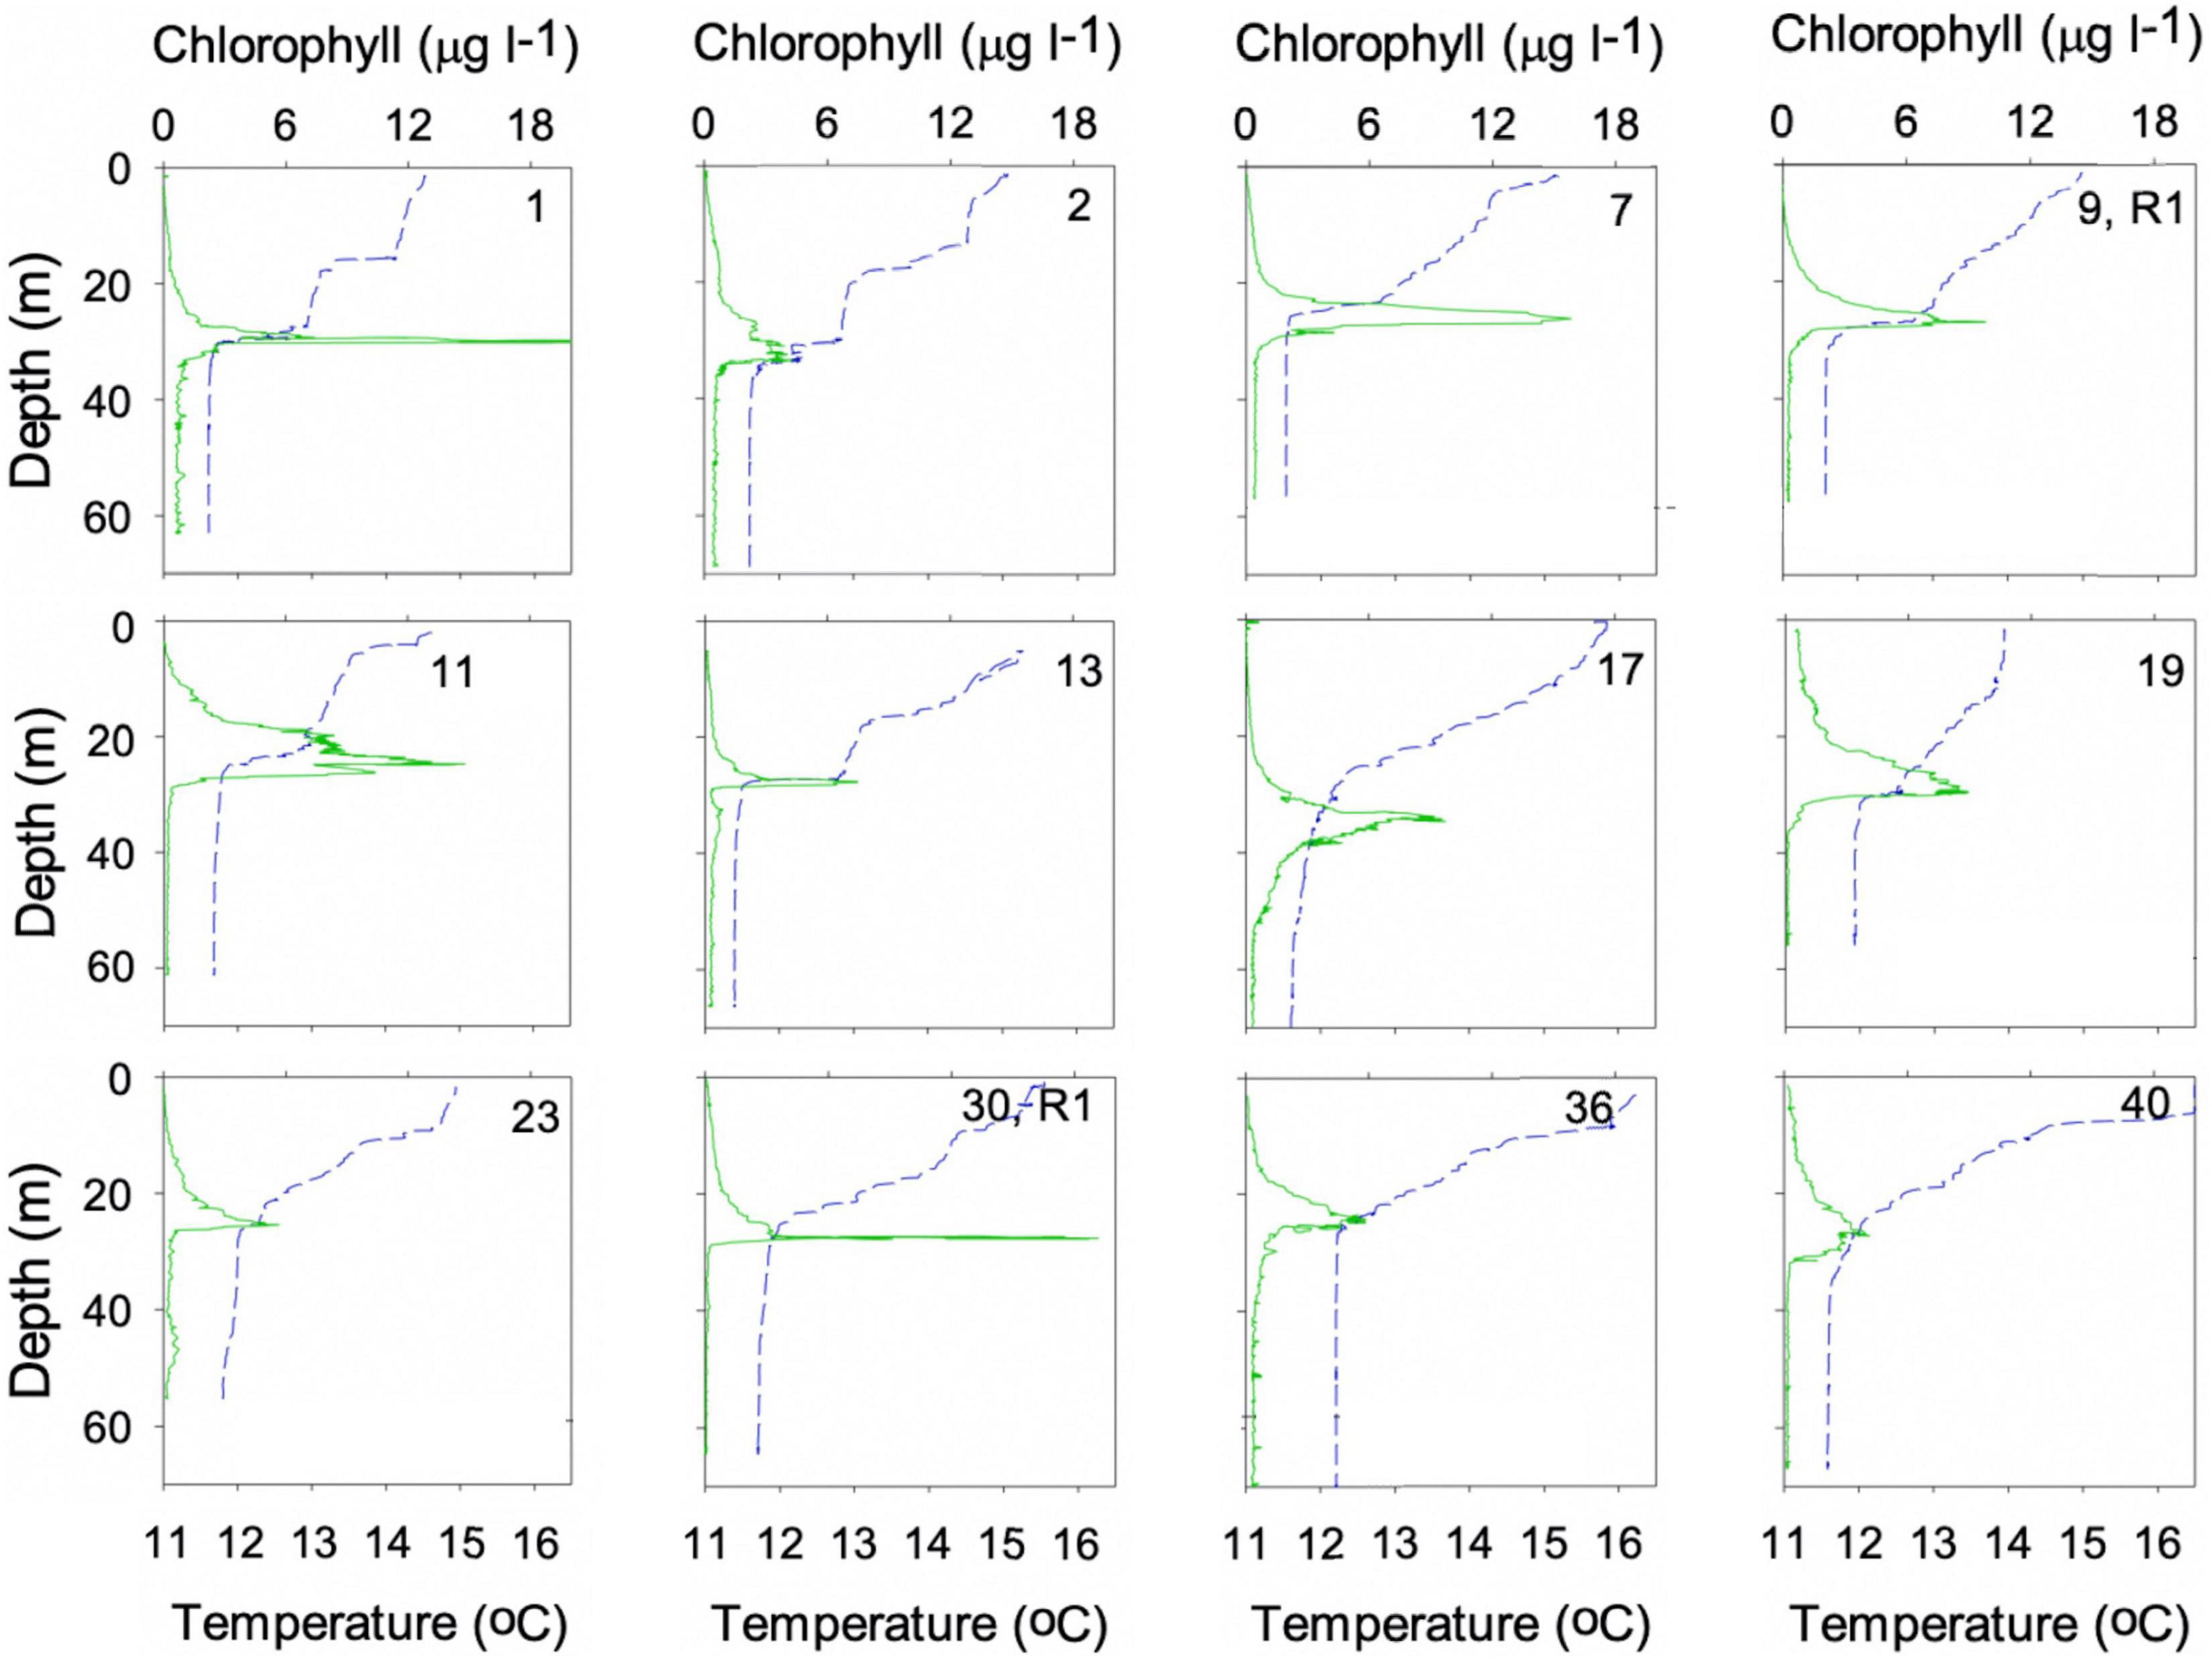
Figure 7. Representative profiles of temperature and chlorophyll fluorescence from the survey sites shown in Figure 1. A full reproduction of all the survey profiles is given in Supplementary Figure 2.
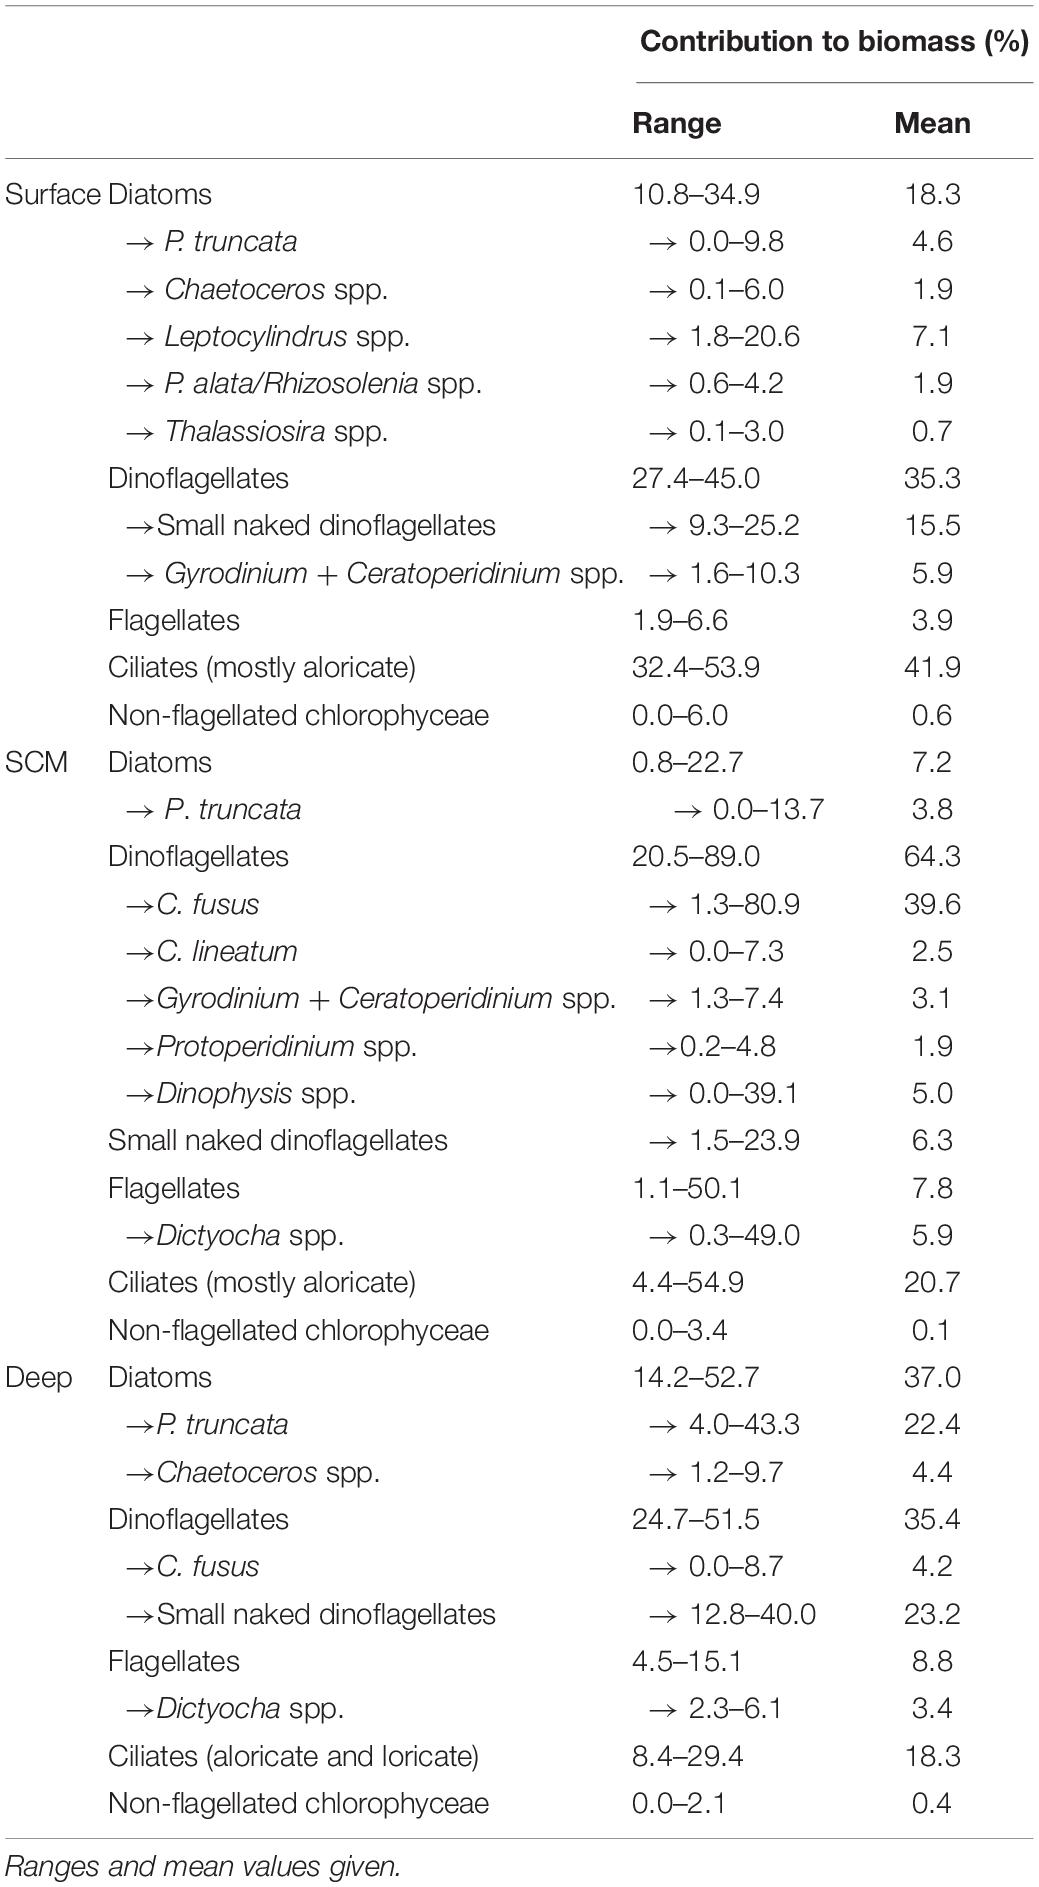
Table 2. Contribution of carbon biomass by diatoms, dinoflagellates, flagellates, ciliates, non-flagellated chlorophyceae, and key taxa within these major groups in the surface layer, SCM and bottom mixed layer of the 39 stratified sites sampled within the Western English Channel excluding the holocam deployment site (site 1).
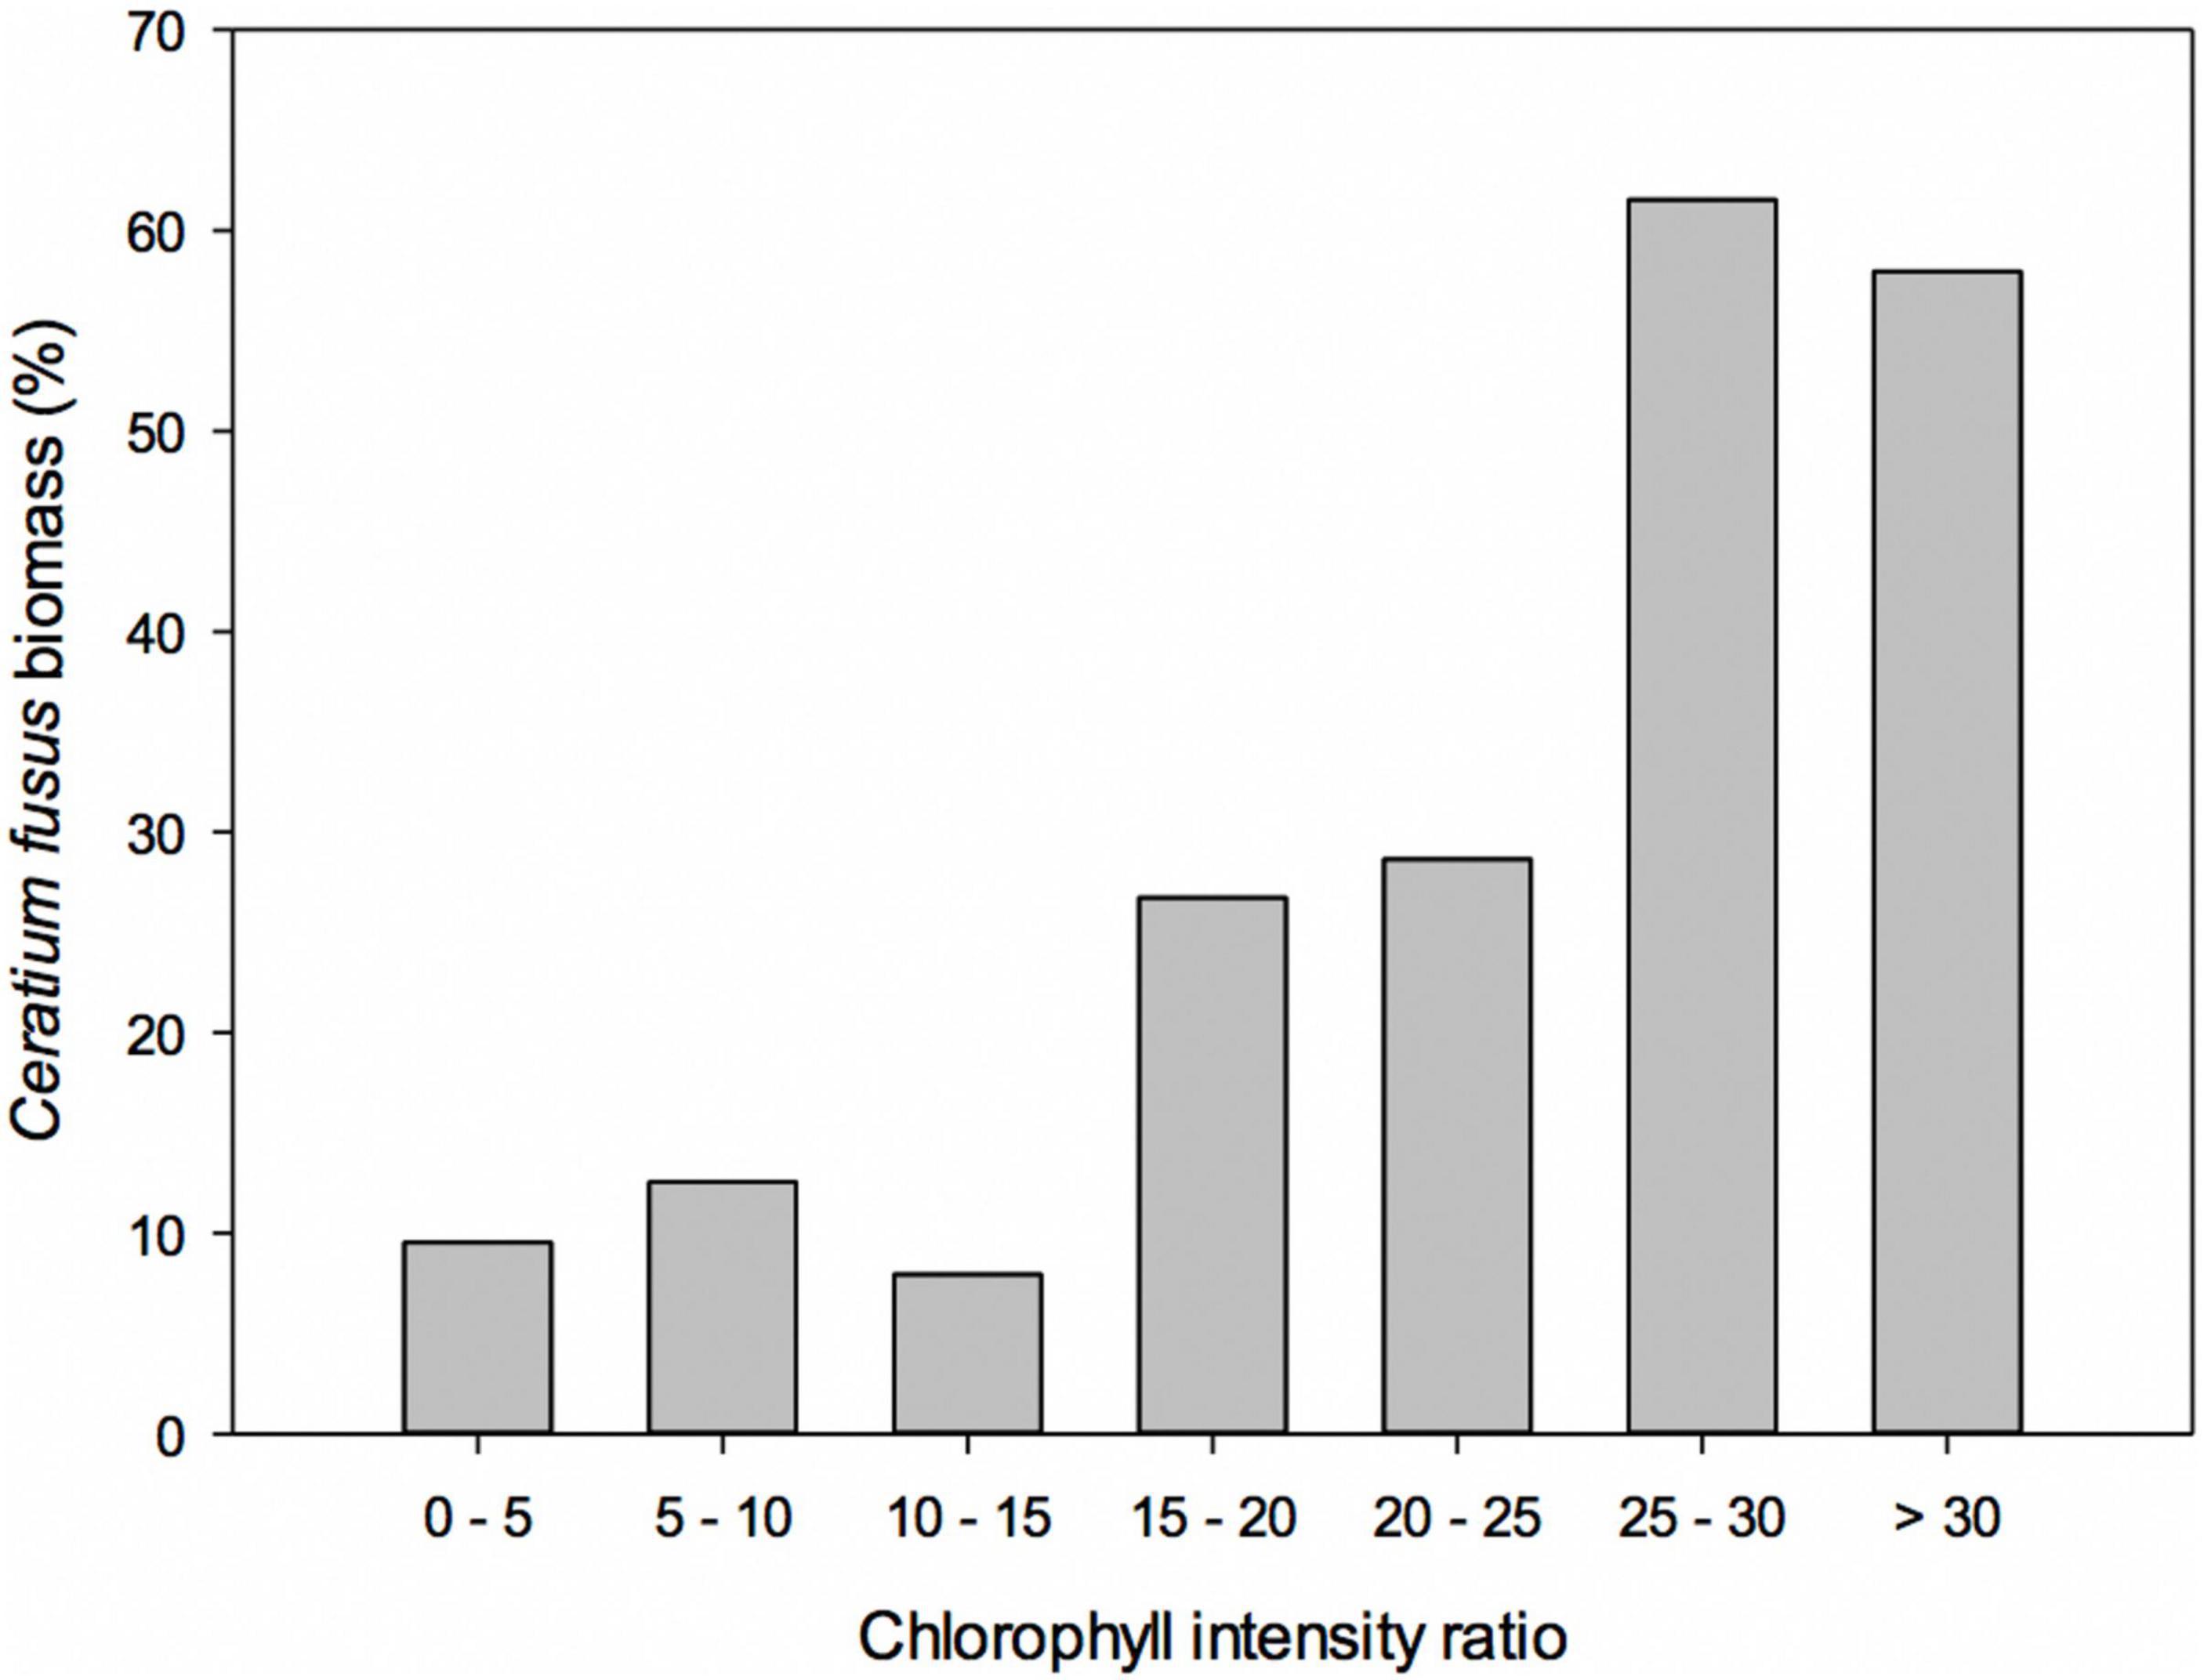
Figure 8. Biomass of Ceratium fusus plotted against chlorophyll intensity ratio (ratio of maximum SCM chlorophyll concentration to background chlorophyll concentration) for the SCMs surveyed (see Figure 6).
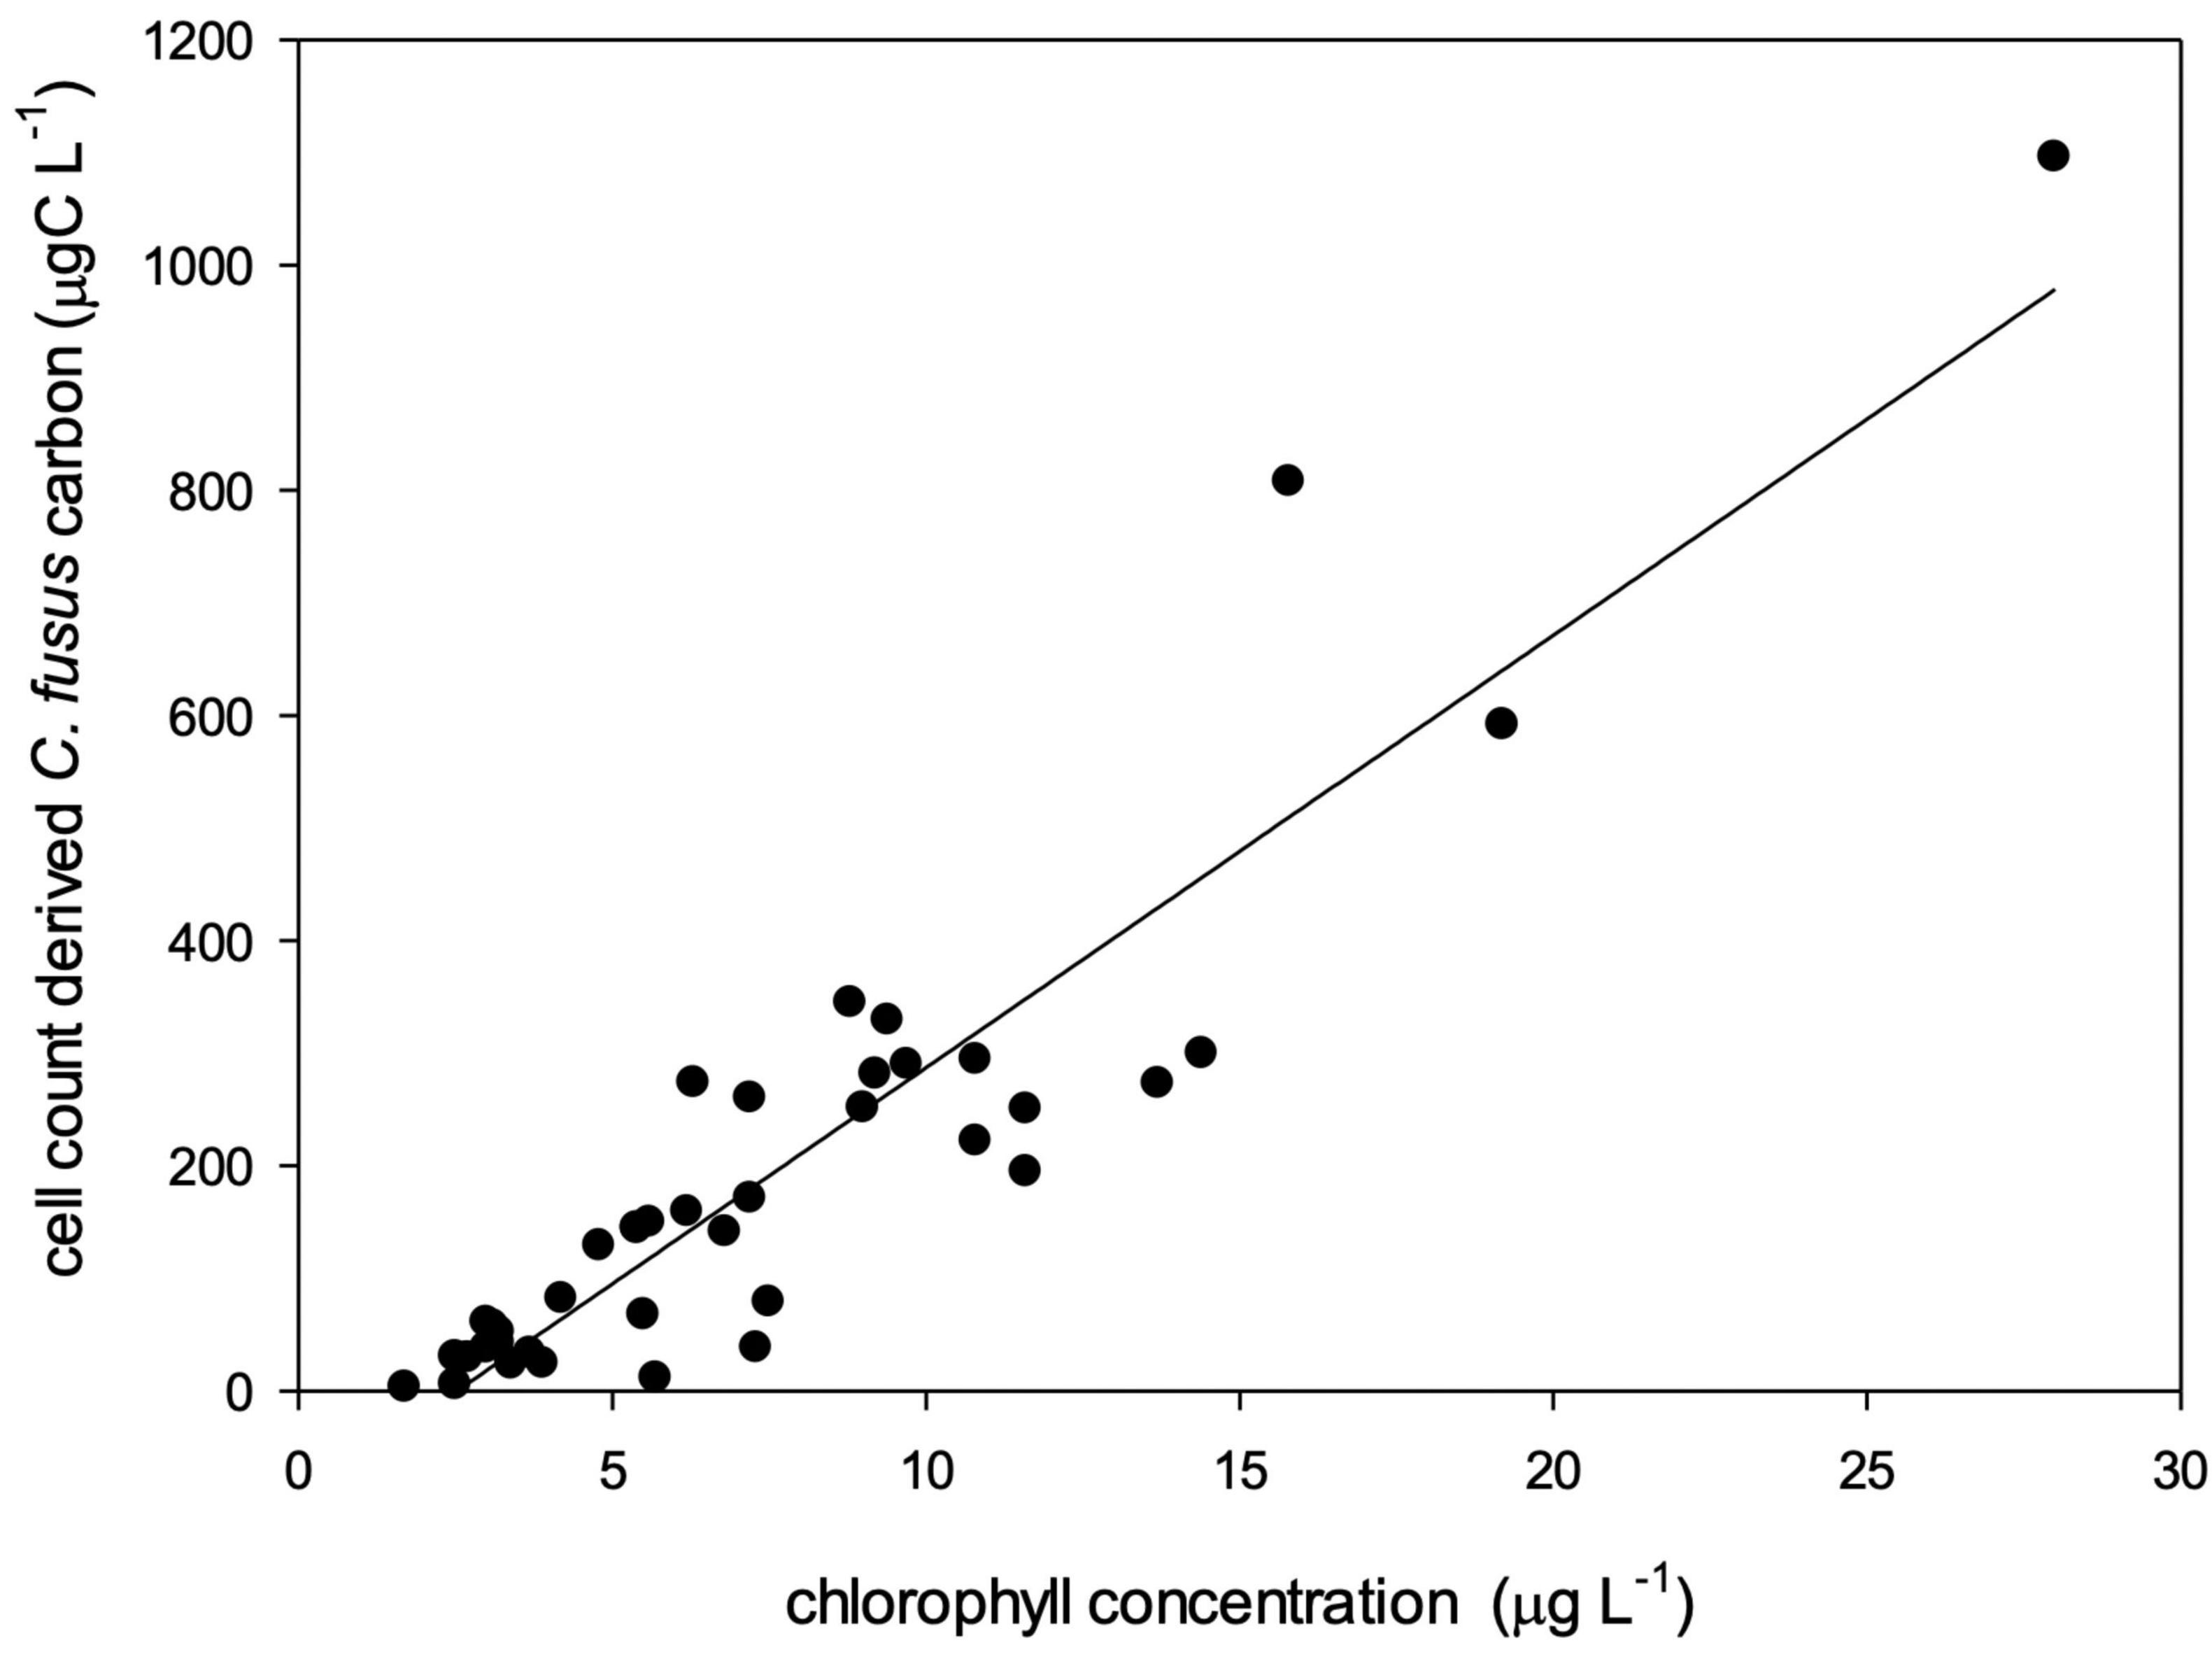
Figure 9. Relationship between cell carbon of C. fusus derived from cell counts and chlorophyll concentrations from the SCM in all the surveyed sites y = 38.4x–96.9; r2 = 0.84.
A cluster analysis with ANOSIM using carbon biomass data identified the surface, SCM and deep samples to be statistically distinct in terms of their taxonomic community structure (p = 0.001), and a global R of 0.82 (R statistic from pairwise tests varied from 0.75 to 0.91) indicated these clusters were well separated. An nMDS analysis provided a 2D spatial representation of the separation between surface, SCM and deep samples based on their biomass values, and a stress level of 0.13 verifies that the 2d plot is a reliable representation of the multidimensional relationships (Figure 10). Taxa whose cumulative contribution to similarity within a cluster and dissimilarity between clusters was approximately 90% are given in Table 3.
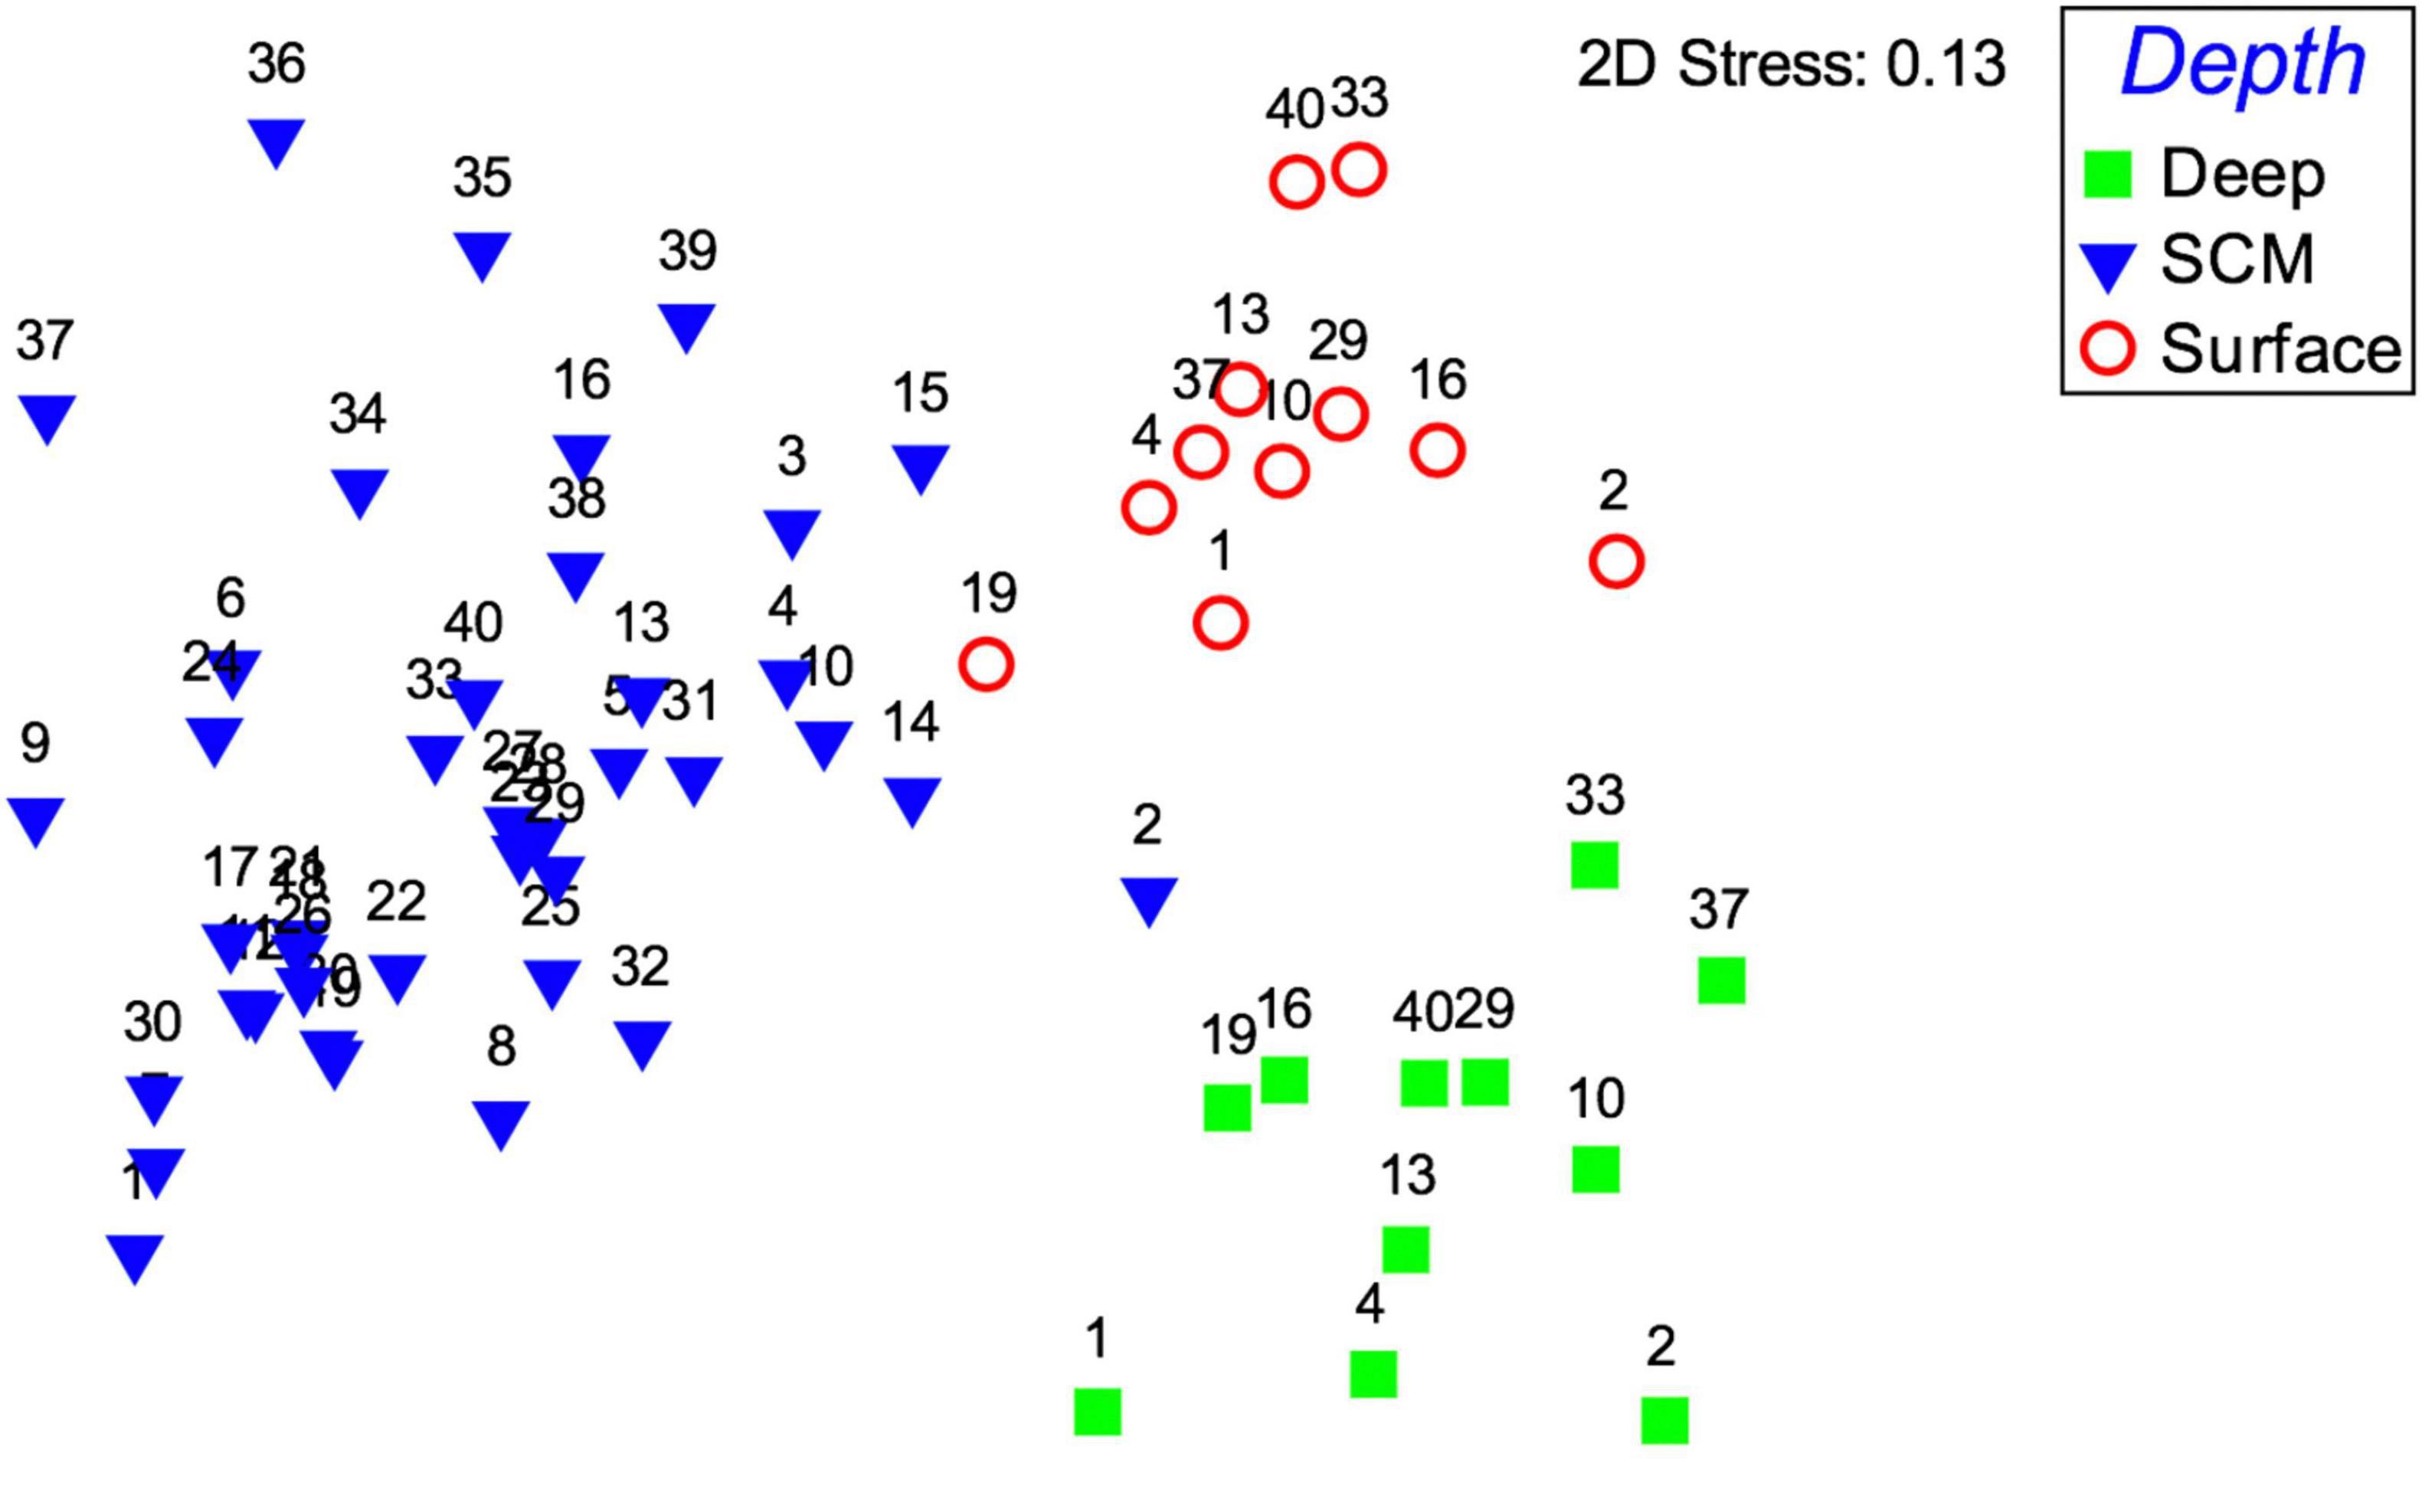
Figure 10. Non-metric multidimensional scaling (nMDS) plot representing the similarity in phytoplankton community taxonomic structure and showing the separation between SCM (blue triangles), surface (red circles) and bottom water (green squares) samples, based on carbon biomass values. The 2D stress value of 0.13 indicates that the plot represents a good representation of the multidimensional relationships.

Table 3. The five greatest contributors to similarity within each cluster, where cluster 1 (C1) contains deep samples, cluster 2 (C2) contains SCM samples and cluster 3 (C3) contains surface samples.
Within the SCM (Figure 11C; summarised in Table 2; full data in Supplementary Table 2) dinoflagellates were generally most dominant, and at over 90% of sites, C. fusus was the most dominant dinoflagellate species. The SCM sample cluster had an average similarity of 67.3%, the top five contributors being C. fusus (16.8%), large aloricate ciliates (8.8%), 10–20 μm naked dinoflagellates (5.5%), P. truncata (5.1%), and D. fibula (5.0%) (Table 3).
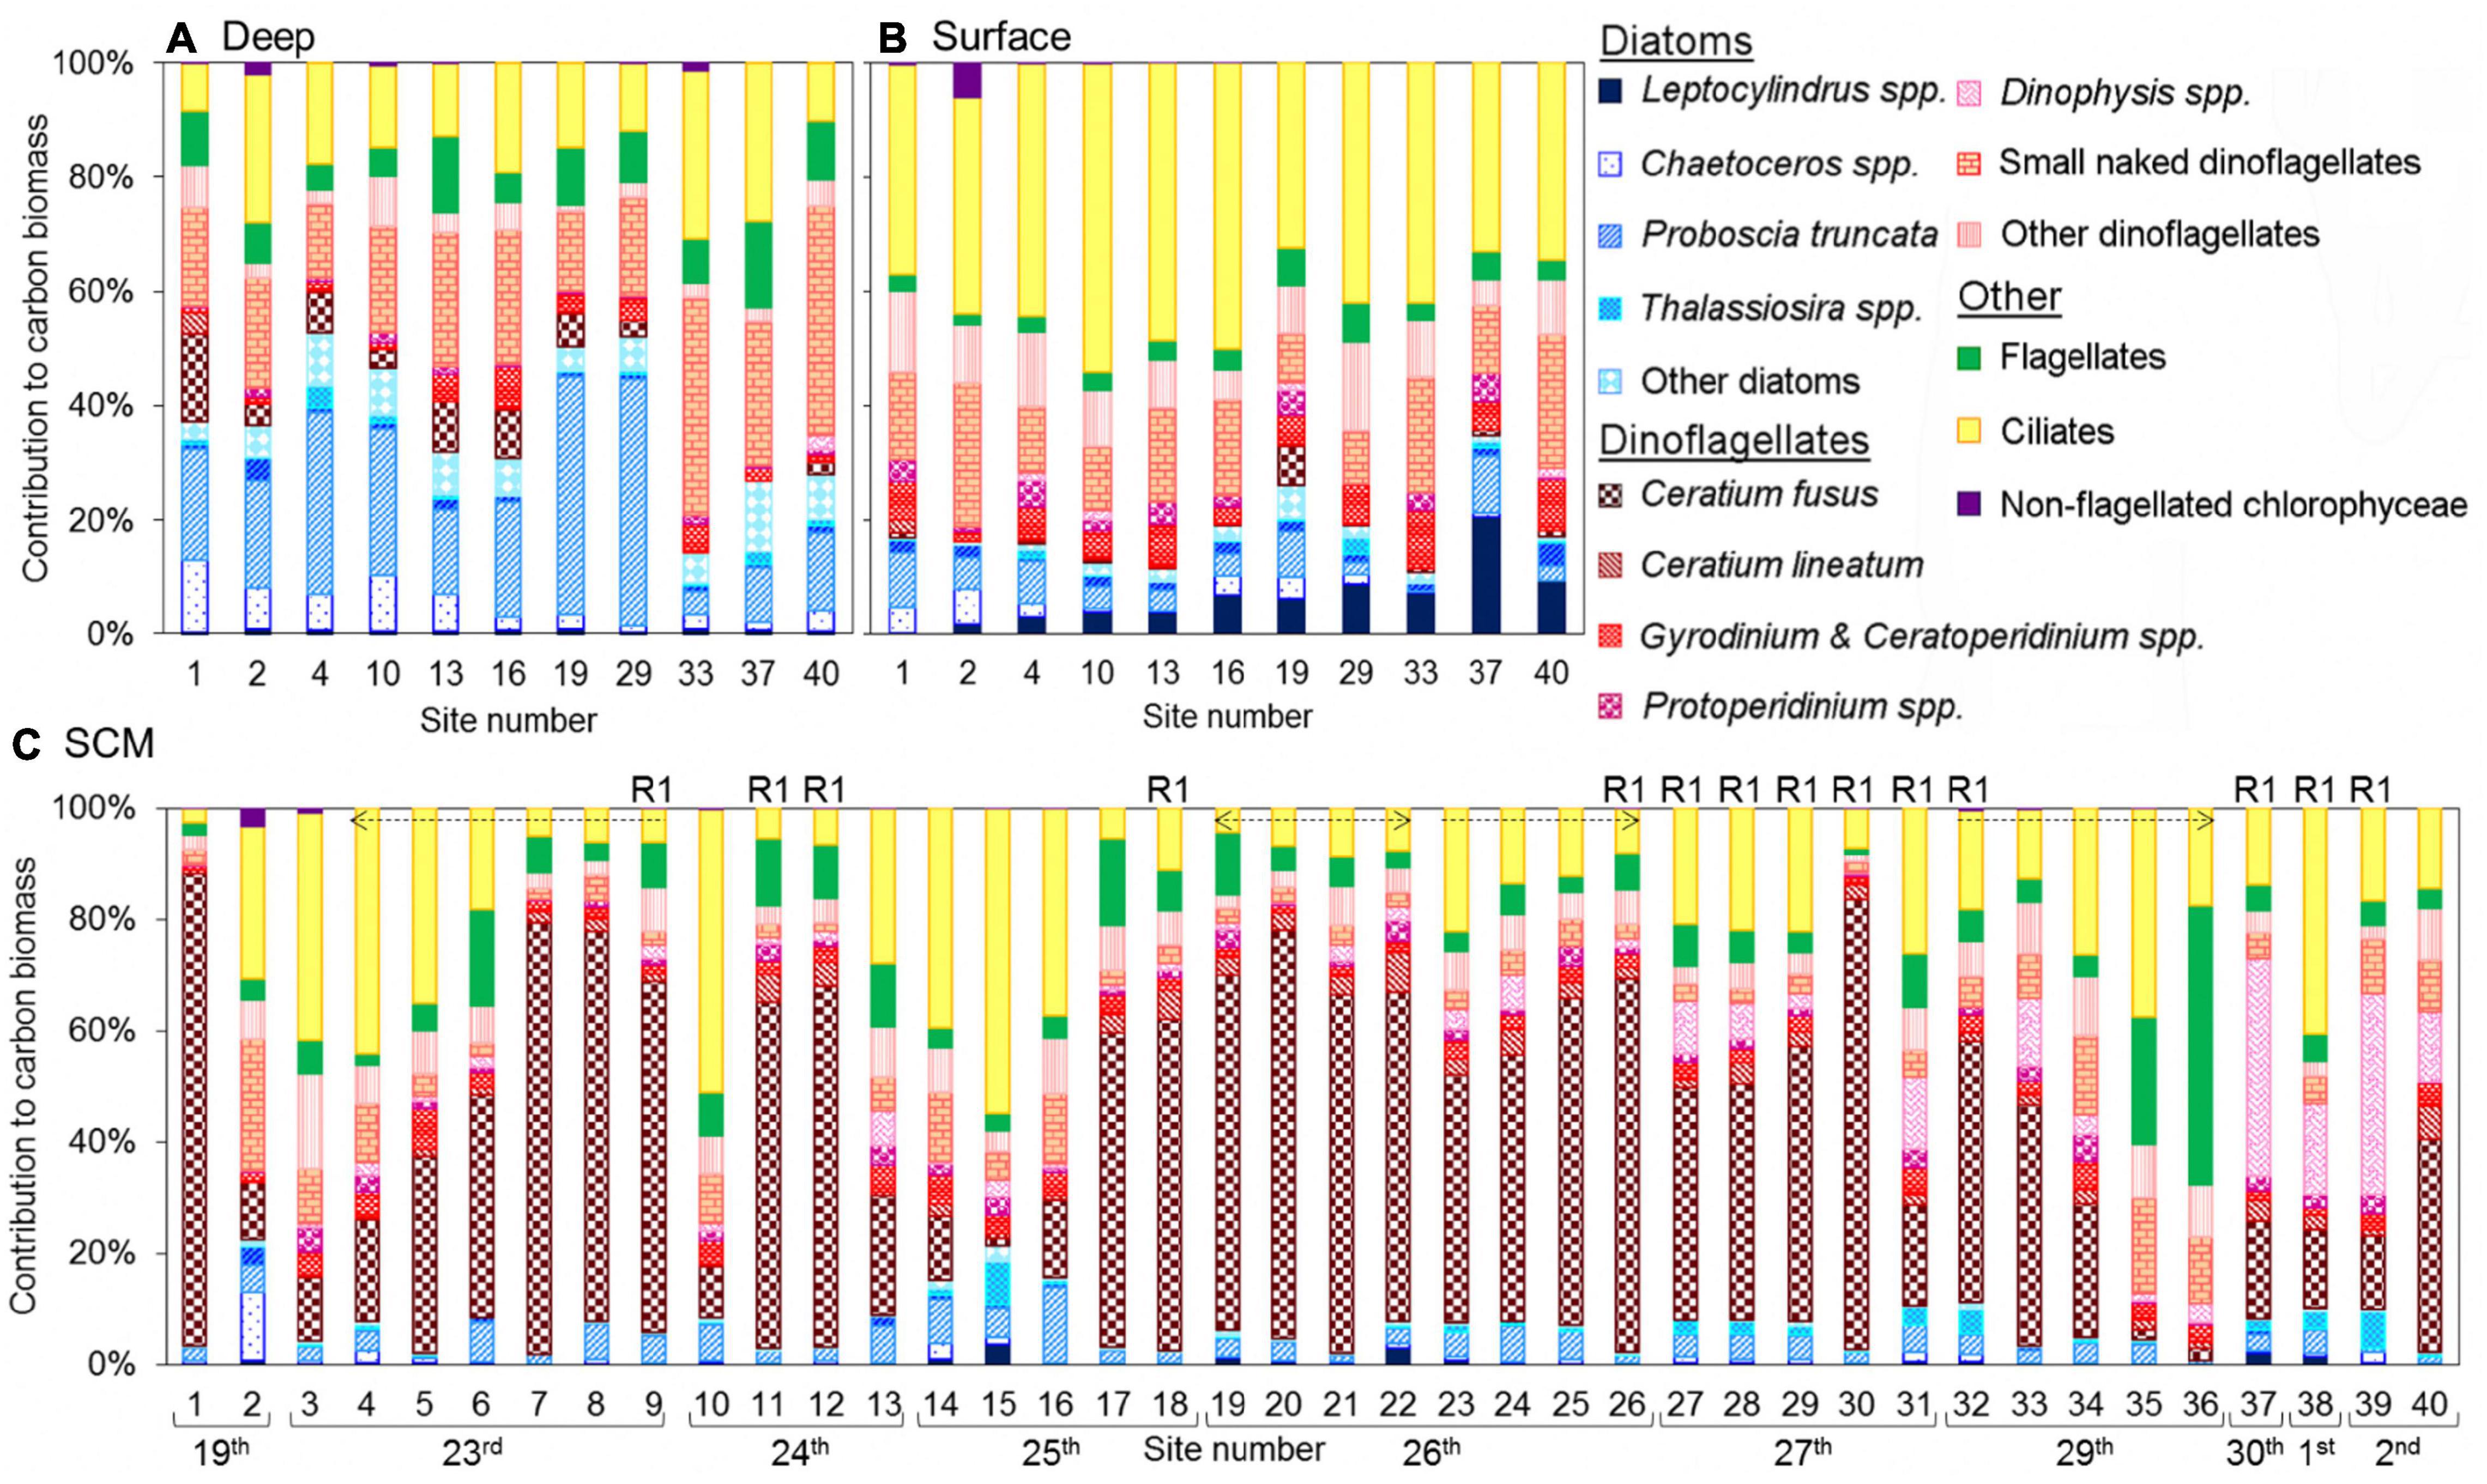
Figure 11. Phytoplankton community structure within (A) deep waters (11 sites), (B) surface waters (11 sites), and (C) the chlorophyll peak (all 40 sites) at sites profiled and sampled for optical microscope microplankton analysis. Percentage contribution of diatom taxa, dinoflagellate taxa, flagellates, ciliates and non-flagellated chlorophyceae to community carbon biomass as identified by microscopy, where diatom taxa are indicated by blue colouration and dinoflagellate taxa by red colouration (NB small naked dinoflagellates refer to 10–25 μm naked dinoflagellates that were not identified to genus/species). On plot (C) dates of sampling are given, sites sampled at repeat station 1 are labelled R1, and sites sampled as part of a transect are indicated by an arrow (two arrow head ends indicates an across shore transect and a single arrow head indicates an inshore-offshore transect, where the direction of the arrow indicates movement inshore to offshore).
Above the SCM in the surface waters (Figure 11B; summarised in Table 2; full data in Supplementary Table 2), dinoflagellates, mostly small naked dinoflagellates and Gyrodinium + Ceratoperidinium spp., and ciliates (mostly aloricate) were quite consistently dominant. The surface sample cluster had an average similarity of 72.0, over 40% of which was contributed by medium aloricate ciliates (11.9%), large aloricate ciliates (9.7%), 10–20 μm naked dinoflagellates (8.4%), Gyrodinium spp. (5.8%) and 20–25 μm naked dinoflagellates (5.4%) (Table 3).
Beneath the SCM in the bottom waters (Figure 11A; summarised in Table 2; full data in Supplementary Table 2), diatoms, predominantly P. truncata and Chaetoceros spp., and dinoflagellates, mainly small naked dinoflagellates and C. fusus, were most dominant. The deep sample cluster had an average similarity of 67.5%, and the top five contributors to this similarity (Table 3) were 10–20 μm naked dinoflagellates (12.1%), P. truncata (11.7%), Chaetoceros spp. (5.2%), Dictyocha spp. (5.1%), and large aloricate ciliates (4.8%).
A broader context is provided by two stratified sites with prominent SCM that were profiled in the Celtic Sea later on 28th July 2015, approximately 175 km from the Western English Channel study area (Figure 12). Sampling at these two sites indicated a high abundance and biomass dominance of C. fusus within the SCM located at the base of the thermocline at depths of 45–55 m (Figure 12). Concentrations of C. fusus, with an approximate size range of 350–450 μm, were determined at 73 and 249 cells ml–1 at site 1 and 2 respectively. The CytoSense flow cytometer “Image in flow” was used to record images of C. fusus (Figure 12).
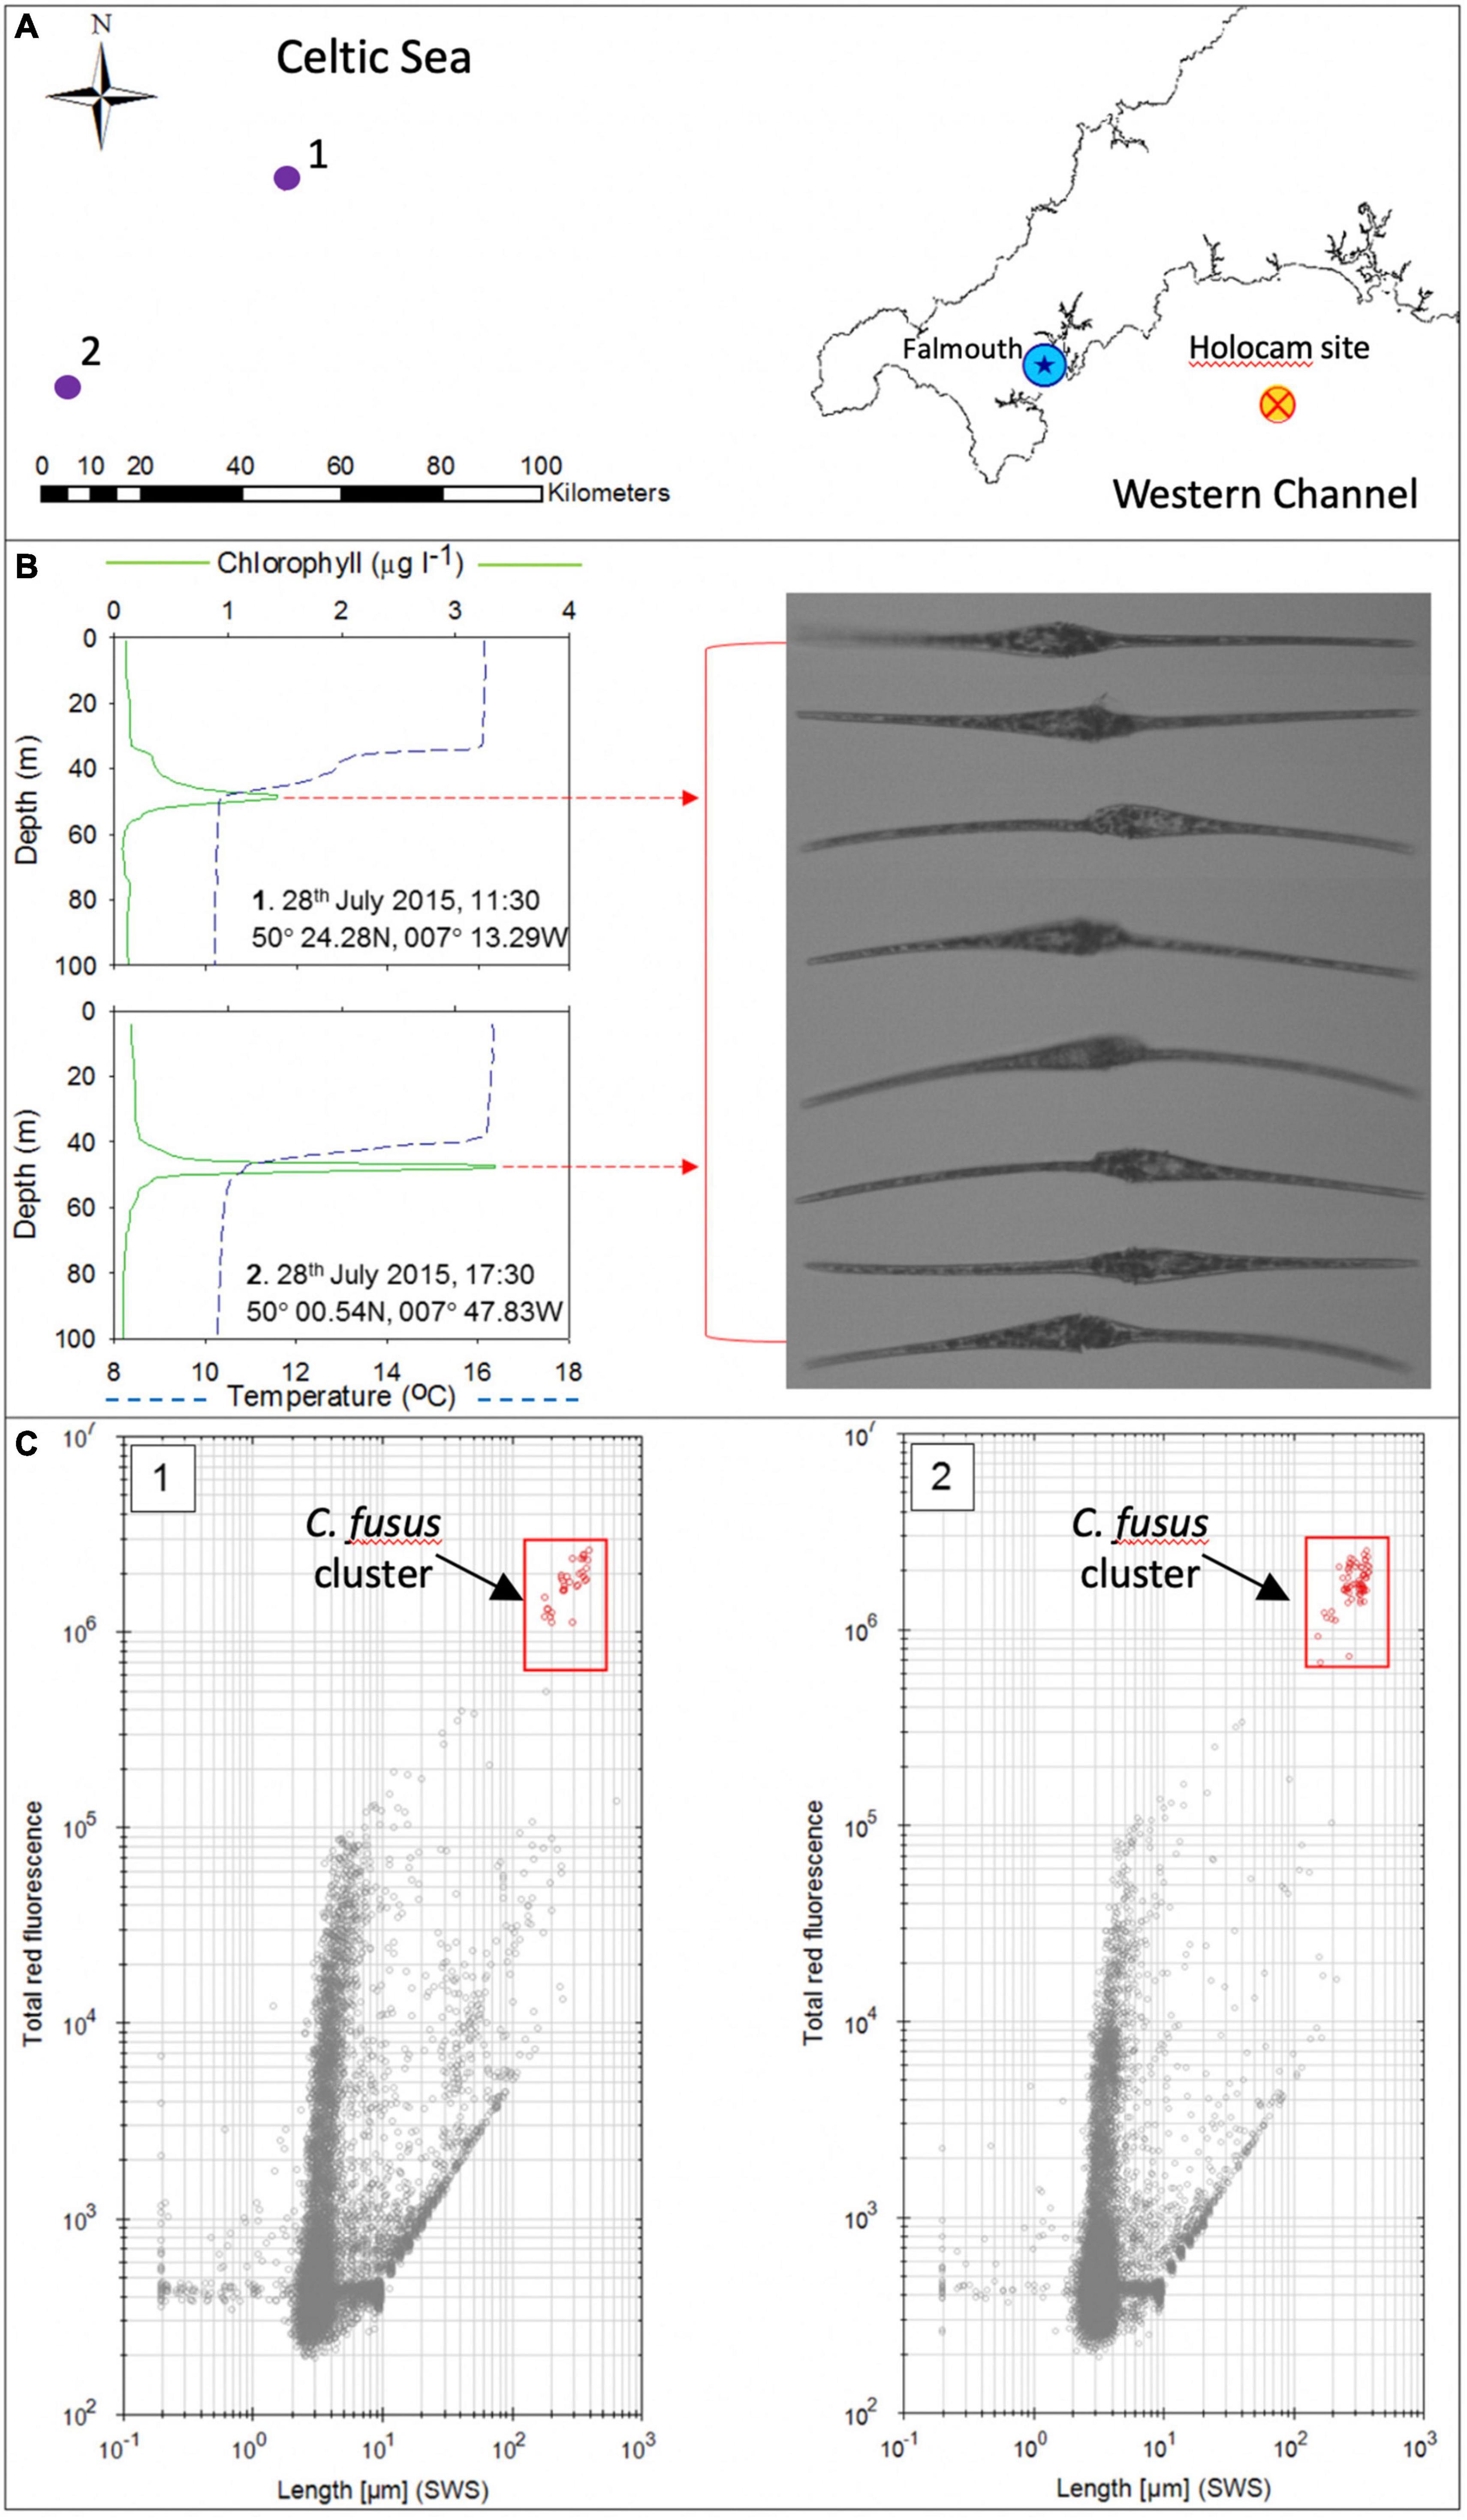
Figure 12. Results from the two sites sampled in the Celtic Sea in July 2015 with locations indicated by the numbered purple circles (1 and 2) in (A), (blue star is Falmouth and red/orange cross is the holocam deployment site). (B) Shows the temperature and chlorophyll profiles of these two sites exhibiting an SCM (Green line—chlorophyll; blue dashed line—temperature). CytoSense “Image in flow” from the SCM samples reveal abundant C. fusus. (C) Shows two cytograms generated by the Cytosense flow cytometer comparing sideways cell scatter (SWS) length vs. red (chlorophyll) fluorescence, with Ceratium fusus cell clusters indicated in red symbols.
The cytograms produced by the cytosense flow cytometer in Figure 12C show plots of sideways cell scatter (SWS) as an indicator of cell length vs. red (chlorophyll) fluorescence generated for samples collected from the SCM at each of these stations. The cytograms clearly highlight the size dominance of C. fusus in the samples collected from the SCM. These findings further point to the widespread dominance of a single species within the UK continental shelf SCM in the 2015 summer season.
Discussion
In line with the objectives of this research we found a broad tripartite make-up of phytoplankton communities that was related to water column structure in the Western Channel in July 2015. Distinct phytoplankton communities occupied the surface waters, the thermocline and associated SCM, and the deep waters. Whereas a few taxa were found throughout the water column, many had more restricted vertical distribution. The highest variability in abundance occurred around the SCM with very rapid changes in the vertical distribution of taxa. This suggests complex interactions amongst taxa and specific adaptations to the SCM/thermocline environment.
Dominance of a Single Dinoflagellate Species, Ceratium fusus in the SCM
The most remarkable feature was the dominance of the dinoflagellate C. fusus in the SCM, with its greatest abundance in the most chlorophyll-rich and sharpest SCM. A further notable aspect was the widespread distribution of C. fusus ranging to the SCMTLs of the Celtic Sea in addition to the Western Channel (Figure 12). The presence of this species in the SCM over such wide distances suggests effective dispersal mechanisms over the UK continental shelf in July 2015. While C. fusus is a mixotroph, the size fractionated chlorophyll-fluorescence, and close match of C. fusus abundance variation to that of chlorophyll, show that it was actively growing through photosynthesis in autotrophic mode at site 1.
Within the NW European shelf seas high concentrations of C. fusus have not previously been reported. Continuous plankton recorder (CPR) surveys, sampling depths of 10 m over the past several decades, reported C. fusus as one of the 10 most abundant phytoplankton in the North Sea and as common in the Bay of Biscay/Western Channel/Celtic Sea (Beaugrand et al., 2000). More broadly, C. fusus is classified as a cosmopolitan species in the North Atlantic, found in a wide temperature range (2–29.5°C) based on surface water surveys (Dodge and Marshall, 1994).
Relevant information on the physiology of C. fusus is provided by culture experiments on samples taken from the Sagami Bay area of Japan where subsurface maxima are frequently observed at depths of 5 m associated with pycnoclines (Baek et al., 2007). Laboratory experiments show that at 12°C (similar to the thermocline temperatures in the Western Channel) specific growth rates decrease with increasing photon irradiance between 53 to 183 μmol m–2 s–1 (Baek et al., 2007). Light levels at the site 1 thermocline were around 34 μmol m–2 s–1. Culture experiments also show that cells can survive at least 15 days darkness (Baek et al., 2008b). Taken together, these insights underscore the adaptations of C. fusus to the SCM niche.
The average swimming speed of C. fusus is 76 μm s–1 (27 cm/hour) (Baek et al., 2009; although an earlier study report speeds of up to 278 μm s–1; Hasle, 1954). Such speeds are sufficient to exceed the effects of the typical vertical eddy diffusivities of the shelf sea thermocline (Sharples et al., 2001) so that C. fusus would be capable of vertical movement to respond to and exploit environmental gradients of light and nutrients. Indeed, field and laboratory evidence indicate that C. fusus can migrate vertically to avoid strong sunlight (Baek et al., 2009). Thus, in periods of sustained stable stratification, in the absence of wind/wave induced turbulence, C. fusus is well-equipped to optimise growth conditions at the thermocline by, for example, moving to exploit peak nutrient concentrations.
While the highest specific growth rates recorded for C. fusus are 0.59 d–1, these are attained at 24°C, whereas the growth rate at 12°C are only 0.1 d–1 (Baek et al., 2008b), leading these authors to suggest introduction of populations by advection from warmer waters to explain high concentrations in colder waters. These relatively slow reported growth rates, may suggest that there is a further mechanism responsible for the most intense C. fusus thin layers other than merely in situ growth. The most intense C. fusus SCMTL coincided with strong stratification, and a steep thermocline which would dampen turbulence and enhance vertical shear (Durham and Stocker, 2012; see also associated higher buoyancy frequency values, Supplementary Table 1). This shear may exert a torque on plankton swimming at relatively low speeds (100 μm s–1) leading to rotation and gyrotactic trapping that may enhance layer formation (Durham and Stocker, 2012). However, in the absence of data on shear in our study area, the role of such a mechanism cannot be assessed. A preference for strongly stratified conditions is also evidenced by experiments showing that C. fusus growth rates are unaffected by small scale turbulence but decreased up to 50% with high turbulence (Sullivan and Swift, 2003).
C. fusus also has a number of other traits that may enhance its ability to thrive in the deeper SCM niche. In common with the rhizosolenid diatoms it has a high aspect ratio, so with long axis horizontal, an orientation promoted by shear, light absorption would be enhanced (Nayak et al., 2018a). The large cell size and spines also act as a defence against grazing and Ceratium spp. is avoided by all but the largest calanoid copepods (Nielsen, 1991). The ecology of C. fusus is less well known, but the close relative Ceratium furca can undertake luxury nutrient uptake and, if necessary, feeds via phagotrophy (Baek et al., 2008a), both strategies that would facilitate survival through nutrient poor conditions in the shelf sea thermocline, where supply of nutrients via tidal-driven turbulence is intermittent (Sharples et al., 2001).
Water Column Structure and Layering of the Plankton Community
The overall plankton community structure at site 1 followed the water column structure, while there was also smaller scale layering of taxa within the SCM (Figures 5, 6). The surface waters were divided by a stepped thermocline with an “upper thermocline” above the main lowest thermocline (Figure 4). Such features may develop when sustained wind mixing is succeeded by a prolonged calm period resulting in a single deep thermocline. This is then followed by a renewed windy period of lesser duration or magnitude that mixes the uppermost waters but not as far as the deep thermocline. This produces a new, shallower mixed layer and associated, upper thermocline (Beer, 1983). Alternatively, stepped thermoclines may also form in response to internal-wave-induced mixing (Navrotsky et al., 2004). The uppermost layer above the upper step of the thermocline was dominated by ciliates and heterotrophic dinoflagellates with the rhizosolenid Proboscia alata somewhat anomalous as the only significant large diatom present. Intriguingly, several species of rhizosolenid diatoms engage in vertical migration between deeper nutriclines and the surface through buoyancy regulation (Moore and Villareal, 1996), and although not demonstrated for P. alata, there are reports of positive buoyancy in this species (Villareal, written communication, 2017). Such behaviour could explain the otherwise incongruous presence of P. alata in the surface. The major phytoplankton taxa were more uniformly present in the lower segment of the surface waters and there was an increase of key species downwards to the SCM (Figures 5, 6).
The holocam revealed a fine-scale layering of taxa within the SCM at site 1 on a vertical scale hitherto undocumented, with some taxa reaching maximum abundances above and below, but declining within the C. fusus peak while others followed the C. fusus peak (Figure 6). The silicoflagellate Dictyocha fibula had a sustained presence in the lower segment of the surface layer but peak abundances coincided with the C. fusus peak (Figure 6). D. fibula is generally only reported in low abundances, for example, in the deeper part of the euphotic zone above a DCM found at 60–80 m in NW Mediterranean (Estrada et al., 1993). It has been observed in higher abundances (20–80% of cells observed) in subsurface (70–80 m) maxima in the Western Mediterranean, between SE Spain and Algeria, in close association with the nitracline (Lohrenz et al., 1988), but has not previously been reported to occur in a concentrated thin layer. The presence of maxima of the heterotrophic dinoflagellates Gyrodinium and Ceratoperidinium just above and beneath the C. fusus peak is in keeping with their requirements for relatively high prey concentrations for growth (Hansen, 1992) but their marked decrease within the peak itself may suggest some mechanism for exclusion from the C. fusus maxima. This also highlights a different feeding strategy from their potential competitors, the ciliates, which did not increase in abundance within the SCM. Maximum abundances of the diatom P. truncata in the SCMTL may reflect similar concentration mechanisms to those of C. fusus. Peak abundances of C. lineatum occurred some 2-3 m below the C. fusus max. layer. C. lineatum has been observed to grow better than C. fusus at lower temperatures (Nordli, 1957), therefore temperatures of ∼11.6°C on the downslope of the SCM, compared to those on the upslope of the SCM down to the depth of maximal fluorescence (12.0–13.2°C) may have been more favourable for C. lineatum.
Aggregates and Export From the SCM
A striking feature of the holocam results is the distribution of abundant aggregates that occurred solely within and beneath the SCM (Figure 5). While occasional diatom or dinoflagellate fragments may be observed in these, most contained indeterminate nano-sized particles and closely resemble the transparent exopolymer particles (TEP) imaged by Passow and others (Passow, 2002). The distribution of aggregates suggests that they were generated by activity within the SCM and represent a sustained flux of organic material from the SCM. The key phytoplankton of the SCM were also present throughout the lower layer, suggesting that they, also, were settling from the SCM. This suggests a key role of the SCM in generating production and export of organic matter and supports wider evidence for the importance of SCM production in shelf seas (Richardson et al., 2000; Hickman et al., 2012; Fernand et al., 2013; Williams et al., 2013).
Predictions of Future Enhanced Stratification and Implications for SCM Development
Increases in upper ocean temperatures and localised freshening, due to increased precipitation at high latitudes, are resulting in increasing surface water stratification in the global ocean and across shallow shelf seas (Bindoff et al., 2007). Future projections depict warming and freshening of the seas around the UK, with seasonal stratification projected to become more intense and persist longer leading to longer-lived and steeper thermoclines (Lowe et al., 2009; Holt et al., 2012). Previous work suggests that SCMTLs are more likely to form in stronger thermoclines that promote the growth and concentration of the larger diatoms and dinoflagellates, so that SCM may be of increased biogeochemical significance in future oceans (Barnett et al., 2019). Some predictions of phytoplankton productivity propose a shift from larger to smaller cells in the more stratified oceans of the future. This is predicted to result in declining production and export (Finkel et al., 2010). Our results suggest, on the contrary, that the larger celled, SCM-adapted phytoplankton may instead be selected in stratified conditions, driving increased production and biomass. The abundant aggregates that we identify below the SCM might also suggest that export may be significant in such scenarios. It is therefore important to improve our understanding of the ecology of the SCM environment.
Future Potential of Holocam Studies
This study highlights the spatial scale of analysis that is required to adequately understand phytoplankton ecology in stratified settings. The decimetre-scale variability of different taxa through the SCM may provide the basis for insights into the interactions between autotrophs and heterotrophs. Furthermore, even two closely related diatom species, the rhizosolenid diatoms, P. alata and P. truncata appear to be responding quite differently, with the former present in the surface layer (possibly through buoyancy regulation) and the latter in the SCM and bottom layer. This suggests that simple traits like cell size (Barton et al., 2013) are insufficient to parameterise biogeochemical models, but rather, the ecology of the dominant species needs to be better understood. The location of the SCMTL locked to the thermocline raises questions on the nature of potential biological—physical interactions, which could be investigated, for example, by deployment of a free-fall turbulence microstructure profiler mounting a holocam.
With regard to the phytoplankton identification from holocam imagery, this was done entirely by visual identification through comparison with optical microscopy and was time consuming. There is clearly scope for use of image analysis techniques and the potential development of fully unsupervised (automated) methods with ongoing increases in computing capability. Whereas there has been significant progress in aspects of image processing including focusing, segmentation and sizing, and simple particle classification (Davies et al., 2015), the unsupervised classification of more complex particle populations remains a challenge. The present study highlights the importance of a relatively small number of key taxa, so a way of simplifying the task of automated particle recognition would be limiting the number of shapes to be targeted for identification (Davies et al., 2015), which could be done following a brief initial pilot study. Thereafter automated identification could also be improved by the use of neural networks/machine learning (Luo et al., 2018; Deglint et al., 2019; Guo et al., 2021).
Conclusion
Surveys of the summer stratified waters of part of the NW European shelf seas in June/July 2015 showed a broad tripartite structure with the surface and deep waters separated by a thermocline with a co-located subsurface chlorophyll maximum (SCM).
Analysis of similarity and multivariate non-metric multidimensional scaling showed the phytoplankton communities of the surface waters (above the thermocline), the SCM and the deep waters (beneath the thermocline) to be statistically distinct.
Throughout the survey area the SCM was dominated by a single species, the dinoflagellate Ceratium fusus.
The proportion of C. fusus in the SCM biomass varied, with the highest concentrations of up to 85% of the SCM biomass and 69% of SCM chlorophyll in the most intense SCM with the highest chlorophyll intensity ratios.
The holocam results revealed a fine scale layering of taxa within the SCM with some taxa following the peak abundance of C. fusus but with others reaching maximum abundances immediately above and below it suggesting the possible operation of exclusion mechanisms.
The abundances of certain diatoms including Proboscia alata (most abundant in surface waters) and Proboscia truncata (most abundant in the SCM and bottom waters) highlights the known adaptation to stratified waters of rhizosolenid diatoms and may indicate buoyancy regulation.
Abundant aggregates present beneath the SCM throughout the bottom waters suggest mass settling and export from the SCM.
Data Availability Statement
The original contributions presented in the study are included in the article/Supplementary Material, further inquiries can be directed to the corresponding author/s.
Author Contributions
All authors participated in the field survey, where MB collected all water samples, WN-S developed and deployed the digital in-line holographic camera system and pre-processed images, and AK and DP aided with sampling procedures. MB processed the CTD and holocam data and analysed all samples. The manuscript was written by MB and AK with all authors providing comments.
Funding
This research was supported by a University of Southampton Graduate School of the National Oceanography Centre Southampton (GSNOCS) Ph.D. studentship to MB, with additional support from the Natural Environment Research Council (UK) “CaNDyFloSS: Carbon and Nutrient Dynamics and Fluxes over Shelf Systems” grant NE/K00185X/1 to DP.
Conflict of Interest
The authors declare that the research was conducted in the absence of any commercial or financial relationships that could be construed as a potential conflict of interest.
Publisher’s Note
All claims expressed in this article are solely those of the authors and do not necessarily represent those of their affiliated organizations, or those of the publisher, the editors and the reviewers. Any product that may be evaluated in this article, or claim that may be made by its manufacturer, is not guaranteed or endorsed by the publisher.
Acknowledgments
We thank the crew of the RV Callista (University of Southampton) and the RV Falcon Spirit (University of Plymouth) for their assistance in data collection. We are grateful to Mark Moore (University of Southampton) for collecting the Celtic Sea samples that were analysed using the CytoSense flow cytometer.
Supplementary Material
The Supplementary Material for this article can be found online at: https://www.frontiersin.org/articles/10.3389/fmars.2021.733799/full#supplementary-material
References
Armand, L. K., Cornet-Barthaux, V., Mosseri, J., and Quéguiner, B. (2008). Late summer diatom biomass and community structure on and around the naturally iron-fertilised Kerguelen Plateau in the Southern Ocean. Deep Sea Res. 2 Top. Stud. Oceanogr. 55, 653–676. doi: 10.1016/j.dsr2.2007.12.031
Baek, S. H., Shimode, S., and Kikuchi, T. (2007). Reproductive ecology of the dominant dinoflagellate, Ceratium fusus, in coastal area of Sagami Bay, Japan. J. Oceanogr. 63, 35–45. doi: 10.1007/s10872-007-0004-y
Baek, S. H., Shimode, S., and Kikuchi, T. (2008b). Growth of dinoflagellates, Ceratium furca and Ceratium fusus in Sagami Bay, Japan: the role of temperature, light intensity and photoperiod. Harmful Algae 7, 163–173. doi: 10.1016/j.hal.2007.06.006
Baek, S. H., Shimode, S., Han, M. S., and Kikuchi, T. (2008a). Growth of dinoflagellates, Ceratium furca and Ceratium fusus in Sagami Bay, Japan: the role of nutrients. Harmful Algae 7, 729–739. doi: 10.1016/j.hal.2008.02.007
Baek, S. H., Shimode, S., Shin, K., Han, M. S., and Kikuchi, T. (2009). Growth of dinoflagellates, Ceratium furca and Ceratium fusus in Sagami Bay, Japan: the role of vertical migration and cell division. Harmful Algae 8, 843–856. doi: 10.1016/j.hal.2009.04.001
Barnett, M. L., Kemp, A. E. S., Hickman, A. E., and Purdie, D. A. (2019). Shelf sea subsurface chlorophyll maximum thin layers have a distinct phytoplankton community structure. Cont. Shelf Res. 174, 140–157. doi: 10.1016/j.csr.2018.12.007
Barton, A. D., Finkel, Z. V., Ward, B. A., Johns, D. G., and Follows, M. J. (2013). On the roles of cell size and trophic strategy in North Atlantic diatom and dinoflagellate communities. Limnol. Oceanogr. 58, 254–266. doi: 10.4319/lo.2013.58.1.0254
Beaugrand, G., Ibanez, F., and Reid, P. C. (2000). Spatial, seasonal and long-term fluctuations of plankton in relation to hydroclimatic features in the english channel, Celtic Sea and Bay of Biscay. Mar. Ecol. Prog. Ser. 200, 93–102. doi: 10.3354/meps200093
Beer, T. (1983). Environmental Oceanography: An Introduction to the Behaviour of Coastal Waters. Oxford: Pergamon.
Behrenfeld, M. J., and Boss, E. S. (2014). Resurrecting the ecological underpinnings of ocean plankton blooms. Annu. Rev. Mar. Sci. 6, 167–194. doi: 10.1146/annurev-marine-052913-021325
Benoit-Bird, K. J., and McManus, M. A. (2012). Bottom-up regulation of a pelagic community through spatial aggregations. Biol. Lett. 8, 813–816. doi: 10.1098/rsbl.2012.0232
Bindoff, N. L., Willebrand, J., Artale, V., Cazenave, A., Gregory, J., Gulev, S., et al. (2007). “Observations: ocean climate change and sea level,” in Climate Change 2007: The Physical Science Basis, eds S. Solomon, D. Qin, M. Manning, Z. Chen, M. Marquis, K. B. Averyt, et al. (Cambridge: CUP), 385–432.
Bochdansky, A. B., Clouse, M. A., and Hansell, D. A. (2017). Mesoscale and high-frequency variability of macroscopic particles (> 100 μm) in the Ross Sea and its relevance for late-season particulate carbon export. J. Mar. Syst. 166, 120–131. doi: 10.1016/j.jmarsys.2016.08.010
Churnside, J. H., Marchbanks, R. D., Vagle, S., Bell, S. W., and Stabeno, P. J. (2020). Stratification, plankton layers, and mixing measured by airborne lidar in the chukchi and beaufort seas. Deep Sea Res. 2 Top. Stud. Oceanogr. 177:104742. doi: 10.1016/j.dsr2.2020.104742
Collos, Y. (2002). “Determination of particulate carbon and nitrogen in coastal waters,” in Pelagic Ecology Methodology, ed. D. V. Subba Rao (Lisse: Balkema).
Cross, J., Nimmo-Smith, W. A. M., Hosegood, P. J., and Torres, R. (2014). The dispersal of phytoplankton populations by enhanced turbulent mixing in a shallow coastal sea. J. Mar. Syst. 136, 55–64.
Cross, J., Nimmo-Smith, W. A. M., Hosegood, P. J., and Torres, R. (2015). The role of advection in the distribution of plankton populations at a moored 1-D coastal observatory. Prog. Oceanogr. 137, 342–359.
Cullen, J. J. (2015). Subsurface chlorophyll maximum layers: enduring enigma or mystery solved? Annu. Rev. Mar. Sci. 7, 207–239. doi: 10.1146/annurev-marine-010213-135111
Davies, E. J., Buscombe, D., Graham, G. W., and Nimmo-Smith, W. A. M. (2015). Evaluating unsupervised methods to size and classify suspended particles using digital in-line holography. J. Atmos. Ocean Technol. 32, 1241–1256. doi: 10.1175/jtech-d-14-00157.1
Deglint, J. L., Jin, C., Chao, A., and Wong, A. (2019). The feasibility of automated identification of six algae types using feed-forward neural networks and fluorescence-based spectral-morphological features. IEEE Access 7, 7041–7053. doi: 10.1109/access.2018.2889017
Dodge, J. D., and Marshall, H. G. (1994). Biogeographic analysis of the armored planktonic dinoflagellate Ceratium in the North-Atlantic and Adjacent Seas. J. Phycol. 30, 905–922.
Durham, W. M., and Stocker, R. (2012). Thin phytoplankton layers: characteristics, mechanisms, and consequences. Annu. Rev. Mar. Sci. 4, 177–207. doi: 10.1146/annurev-marine-120710-100957
Estrada, M., Marrase, C., Latasa, M., Berdalet, E., Delgado, M., and Riera, T. (1993). Variability of deep chlorophyll maximum characteristics in the Northwestern Mediterranean. Mar. Ecol. Prog. Ser. 92, 289–300. doi: 10.3354/meps092289
Fernand, L., Weston, K., Morris, T., Greenwood, N., Brown, J., and Jickells, T. (2013). The contribution of the deep chlorophyll maximum to primary production in a seasonally stratified shelf sea, the North Sea. Biogeochemistry 113, 153–166. doi: 10.1007/s10533-013-9831-7
Finkel, Z. V., Beardall, J., Flynn, K. J., Quigg, A., Rees, T. A. V., and Raven, J. A. (2010). Phytoplankton in a changing world: cell size and elemental stoichiometry. J. Plankton Res. 32, 119–137.
Fragoso, G. M., Poulton, A. J., Pratt, N. J., Johnsen, G., and Purdie, D. A. (2019). Trait-based analysis of subpolar North Atlantic phytoplankton and plastidic ciliate communities using automated flow cytometer. Limnol. Oceanogr. 64, 1763–1778.
Graff, J. R., and Rynearson, T. A. (2011). Extraction method influences the recovery of phytoplankton pigments from natural assemblages. Limnol. Oceanogr. Methods 9, 129–139.
Graham, G. W., Davies, E. J., Nimmo-Smith, W. A. M., Bowers, D. G., and Braithwaite, K. M. (2012). Interpreting LISST-100X measurements of particles with complex shape using digital in-line holography. J. Geophys. Res. Oceans 117:C05034.
Graham, G. W., and Nimmo-Smith, W. A. M. (2010). The application of holography to the analysis of size and settling velocity of suspended cohesive sediments. Limnol. Oceanogr. Methods 8, 1–15.
Greer, A. T., Boyette, A. D., Cruz, V. J., Cambazoglu, M. K., Dzwonkowski, B., Chiaverano, L. M., et al. (2020). Contrasting fine-scale distributional patterns of zooplankton driven by the formation of a diatom-dominated thin layer. Limnol. Oceanogr. 65, 2236–2258.
Greer, A. T., Cowen, R. K., Guigand, C. M., McManus, M. A., Sevadjian, J. C., and Timmerman, A. H. V. (2013). Relationships between phytoplankton thin layers and the fine-scale vertical distributions of two trophic levels of zooplankton. J. Plankton Res. 35, 939–956. doi: 10.1093/plankt/fbt056
Guo, B., Nyman, L., Nayak, A. R., Milmore, D., McFarland, M., Twardowski, M. S., et al. (2021). Automated plankton classification from holographic imagery with deep convolution neural networks. Limnol. Oceanogr. Methods 19, 21–36. doi: 10.1002/lom3.10402
Hansen, P. J. (1992). Prey size selection, feeding rates and growth dynamics of heterotrophic dinoflagellates with special emphasis on Gyrodinium Spirale. Mar. Biol. 114, 327–334. doi: 10.1007/bf00349535
Hasle, G. R. (1954). More on phototactic diurnal migration in marine dinoflagellates. Nytt Mag. Bot. 2, 139–147.
Hickman, A. E., Moore, C. M., Sharples, J., Lucas, M. I., Tilstone, G. H., Krivtsov, V., et al. (2012). Primary production and nitrate uptake within the seasonal thermocline of a stratified shelf sea. Mar. Ecol. Prog. Ser. 463, 39–57. doi: 10.3354/meps09836
Holt, J., Butenschon, M., Wakelin, S. L., Artioli, Y., and Allen, J. I. (2012). Oceanic controls on the primary production of the northwest European continental shelf: model experiments under recent past conditions and a potential future scenario. Biogeosciences 9, 97–117. doi: 10.5194/bg-9-97-2012
Hostetler, C. A., Behrenfeld, M. J., Hu, Y. X., Hair, J. W., and Schulien, J. A. (2018). Spaceborne lidar in the study of marine systems. Annu. Rev. Mar. Sci. 10, 121–147. doi: 10.1146/annurev-marine-121916-063335
Kemp, A. E. S., Pike, J., Pearce, R. B., and Lange, C. B. (2000). The “Fall dump”–a new perspective on the role of a “shade flora” in the annual cycle of diatom production and export flux. Deep Sea Res. 2 Top. Stud. Oceanogr. 47, 2129–2154.
Kemp, A. E. S., and Villareal, T. A. (2013). High diatom production and export in stratified waters–a potential negative feedback to global warming. Prog. Oceanogr. 119, 4–23.
Kemp, A. E. S., and Villareal, T. A. (2018). The case of the diatoms and the muddled mandalas: time to recognize diatom adaptations to stratified waters. Prog. Oceanogr. 167, 138–149. doi: 10.1016/j.pocean.2018.08.002
Lohrenz, S. E., Wiesenburg, D. A., Depalma, I. P., Johnson, K. S., and Gustafson, D. E. (1988). Interrelationships among primary production, chlorophyll, and environmental-conditions in frontal regions of the Western Mediterranean-Sea. Deep Sea Res. A 35, 793–810. doi: 10.1016/0198-0149(88)90031-3
Lombard, F., Boss, E., Waite, A. M., Vogt, M., Uitz, J., Stemmann, L., et al. (2019). Globally consistent quantitative observations of planktonic ecosystems. Front. Mar. Sci 6:196. doi: 10.3389/fmars.2019.001967
Lowe, J. A., Howard, T. P., Pardaens, A., Tinker, J., Holt, J., Wakelin, S., et al. (2009). UK Climate Projections Science Report: Marine and Coastal Projections. Exeter: Met Office Hadley Centre, 95.
Luo, J. Y., Irisson, J. O., Graham, B., Guigand, C., Sarafraz, A., Mader, C., et al. (2018). Automated plankton image analysis using convolutional neural networks. Limnol. Oceanogr. Methods 16, 814–827.
Malkiel, E., Alquaddoomi, O., and Katz, J. (1999). Measurements of plankton distribution in the ocean using submersible holography. Meas. Sci. Technol. 10, 1142–1152.
Marie, D., Simon, N., and Vaulot, D. (2005). “Phytoplankton cell counting by flow cytometry,” in Algal Culturing Techniques, ed. R. A. Andersen (Amsterdam: Elsevier), 253–267. doi: 10.1016/b978-012088426-1/50018-4
Martin, J., Tremblay, J. E., Gagnon, J., Tremblay, G., Lapoussiere, A., Jose, C., et al. (2010). Prevalence, structure and properties of subsurface chlorophyll maxima in Canadian Arctic waters. Mar. Ecol. Prog. Ser. 412, 69–84. doi: 10.3354/meps08666
McFarland, M., Nayak, A. R., Stockley, N., Twardowski, M., and Sullivan, J. (2020). Enhanced light absorption by horizontally oriented diatom colonies. Front. Mar. Sci 7:494. doi: 10.3389/fmars.2020.00494
Menden-Deuer, S., and Lessard, E. J. (2000). Carbon to volume relationships for dinoflagellates, diatoms and other protist plankton. Limnol. Oceanogr. 45, 569–579. doi: 10.4319/lo.2000.45.3.0569
Moore, J. K., and Villareal, T. A. (1996). Size-ascent rate relationships in positively buoyant marine diatoms. Limnol. Oceanogr. 41, 1514–1520. doi: 10.4319/lo.1996.41.7.1514
Navrotsky, V. V., Lozovatsky, I. D., Pavlova, E. P., and Fernando, H. J. S. (2004). Observations of internal waves and thermocline splitting near a shelf break of the Sea of Japan (East Sea). Cont. Shelf Res. 24, 1375–1395. doi: 10.1016/j.csr.2004.03.008
Nayak, A. R., Malkiel, E., McFarland, M. N., Twardowski, M. S., and Sullivan, J. M. (2021). A review of holography in the aquatic sciences: in situ characterization of particles, plankton, and small scale biophysical interactions. Front. Mar. Sci. 7:572147. doi: 10.3389/fmars.2020.572147
Nayak, A. R., McFarland, M. N., Sullivan, J. M., and Twardowski, M. S. (2018a). Evidence for ubiquitous preferential particle orientation in representative oceanic shear flows. Limnol. Oceanogr. 63, 122–143. doi: 10.1002/lno.10618
Nayak, A. R., McFarland, M. N., Twardowski, M. S., and Sullivan, J. M. (2018b). “On plankton distributions and biophysical interactions in diverse coastal and limnological environments,” in Proceedings of the Ocean Sensing and Monitoring X, (Bellingham, WA: International Society for Optics and Photonics), 106310.
Nielsen, T. G. (1991). Contribution of zooplankton grazing to the decline of a ceratium bloom. Limnol. Oceanogr. 36, 1091–1106. doi: 10.4319/lo.1991.36.6.1091
Olenina, I., Hajdu, S., Edleer, L., Andersson, A., Wasmund, N., Busch, S., et al. (2006). “Biovolumes and size-classes of phytoplankton in the Baltic Sea,” in Proceedings of the Baltic Sea Environment, (Helsinki: HELCOM), 1–144.
Olson, R. J., Shalapyonok, A., Kalb, D. J., Graves, S. W., and Sosik, H. M. (2017). Imaging FlowCytobot modified for high throughput by in-line acoustic focusing of sample particles. Limnol. Oceanogr. Methods 15, 867–874.
Paasche, E. (1960). On the Relationship between primary production and standing stock of phytoplankton. ICES J. Mar. Sci. 26, 33–48. doi: 10.1093/icesjms/26.1.33
Parsons, T. R., Maita, Y., and Lalli, C. M. (1984). A Manual of Chemical and Biological Methods for Seawater Analysis. New York, NY: Pergamon.
Passow, U. (2002). Transparent exopolymer particles (TEP) in aquatic environments. Prog. Oceanogr. 55, 287–333.
Perry, M. J., Sackmann, B. S., Eriksen, C. C., and Lee, C. M. (2008). Seaglider observations of blooms and subsurface chlorophyll maxima off the Washington coast. Limnol. Oceanogr. 53, 2169–2179. doi: 10.4319/lo.2008.53.5_part_2.2169
Queguiner, B. (2013). Iron fertilization and the structure of planktonic communities in high nutrient regions of the Southern Ocean. Deep Sea Res. 2 Top. Stud. Oceanogr. 90, 43–54.
Richardson, A. J., Walne, A. W., John, A. W. G., Jonas, T. D., Lindley, J. A., Sims, D. W., et al. (2006). Using continuous plankton recorder data. Prog. Oceanogr. 68, 27–74.
Richardson, K., Visser, A. W., and Pedersen, F. B. (2000). Subsurface phytoplankton blooms fuel pelagic production in the North Sea. J. Plankton Res. 22, 1663–1671.
Rines, J. E. B., McFarland, M. N., Donaghay, P. L., and Sullivan, J. M. (2010). Thin layers and species-specific characterization of the phytoplankton community in Monterey Bay, California, USA. Cont. Shelf Res. 30, 66–80.
Scott, B. E., Sharples, J., Ross, O. N., Wang, J., Pierce, G. J., and Camphuysen, C. J. (2010). Sub-surface hotspots in shallow seas: fine-scale limited locations of top predator foraging habitat indicated by tidal mixing and sub-surface chlorophyll. Mar. Ecol. Prog. Ser. 408, 207–226. doi: 10.3354/meps08552
Sharples, J., Moore, C. M., Rippeth, T. P., Holligan, P. M., Hydes, D. J., Fisher, N. R., et al. (2001). Phytoplankton distribution and survival in the thermocline. Limnol. Oceanogr. 46, 486–496. doi: 10.4319/lo.2001.46.3.0486
Steinberg, D. K., Carlson, C. A., Bates, N. R., Johnson, R. J., Michaels, A. F., and Knap, A. H. (2001). Overview of the US JGOFS Bermuda Atlantic Time-series Study (BATS): a decade-scale look at ocean biology and biogeochemistry. Deep Sea Res. 2 Top. Stud. Oceanogr. 48, 1405–1447. doi: 10.1016/s0967-0645(00)00148-x
Sullivan, J. M., and Swift, E. (2003). Effects of small-scale turbulence on net growth rate and size of ten species of marine dinoflagellates. J. Phycol. 39, 83–94.
Sullivan, J. M., Van Holliday, D., McFarland, M., McManus, M. A., Cheriton, O. M., Benoit-Bird, K. J., et al. (2010). Layered organization in the coastal ocean: an introduction to planktonic thin layers and the LOCO project. Cont. Shelf Res. 30, 1–6.
Talapatra, S., Hong, J. R., McFarland, M., Nayak, A. R., Zhang, C., Katz, J., et al. (2013). Characterization of biophysical interactions in the water column using in situ digital holography. Mar. Ecol. Prog. Ser. 473, 29–51. doi: 10.3354/meps10049
Utermöhl, H. (1958). Improvement of the quantitative methods for phytoplankton. Int. Assoc. Theor. Appl. Limnol. 9, 1–38.
Welschmeyer, N. A. (1994). Fluorometric analysis of chlorophyll-A in the presence of chlorophyll-B and pheopigments. Limnol. Oceanogr. 39, 1985–1992. doi: 10.4319/lo.1994.39.8.1985
Weston, K., Fernand, L., Mills, D. K., Delahunty, R., and Brown, J. (2005). Primary production in the deep chlorophyll maximum of the central North Sea. J. Plankton Res. 27, 909–922. doi: 10.1093/plankt/fbi064
Widdicombe, C. E., Eloire, D., Harbour, D., Harris, R. P., and Somerfield, P. J. (2010). Long-term phytoplankton community dynamics in the Western English Channel. J. Plankton Res. 32, 643–655. doi: 10.1016/j.marenvres.2017.04.013
Williams, C., Sharples, J., Mahaffey, C., and Rippeth, T. (2013). Wind-driven nutrient pulses to the subsurface chlorophyll maximum in seasonally stratified shelf seas. Geophys. Res. Lett. 40, 5467–5472. doi: 10.1002/2013gl058171
Keywords: shelf seas, in situ observations, holography, primary production, phytoplankton, dinoflagellate, subsurface chlorophyll maximum, thermocline
Citation: Barnett ML, Kemp AES, Nimmo-Smith WAM and Purdie DA (2022) Total Water Column Analysis Shows the Importance of a Single Species in Subsurface Chlorophyll Maximum Thin Layers in Stratified Waters. Front. Mar. Sci. 8:733799. doi: 10.3389/fmars.2021.733799
Received: 30 June 2021; Accepted: 17 December 2021;
Published: 14 January 2022.
Edited by:
Brian P. V. Hunt, University of British Columbia, CanadaReviewed by:
Rajani Kanta Mishra, Ministry of Earth Sciences, IndiaJohn P. Ryan, Monterey Bay Aquarium Research Institute (MBARI), United States
Copyright © 2022 Barnett, Kemp, Nimmo-Smith and Purdie. This is an open-access article distributed under the terms of the Creative Commons Attribution License (CC BY). The use, distribution or reproduction in other forums is permitted, provided the original author(s) and the copyright owner(s) are credited and that the original publication in this journal is cited, in accordance with accepted academic practice. No use, distribution or reproduction is permitted which does not comply with these terms.
*Correspondence: Alan E. S. Kemp, YWVza0Bzb3Rvbi5hYy51aw==
 Michelle L. Barnett1
 Alan E. S. Kemp
 W. Alex M. Nimmo-Smith
 Duncan A. Purdie