 Xiaowen Zhu
- 1Fisheries College, Guangdong Ocean University, Zhanjiang, China
- 2Development and Research Center for Biological Marine Resources, Southern Marine Science and Engineering Guangdong Laboratory (Zhanjiang), Zhanjiang, China
- 3Guangdong Research Center on Reproductive Control and Breeding Technology of Indigenous Valuable Fish Species, Guangdong Ocean University, Zhanjiang, China
- 4Guangdong Provincial Engineering Laboratory for Mariculture Organism Breeding, Zhanjiang, China
Body color is an important economic and ecological trait in aquatic animals, which influence their economic values and determine the animal ability to survive in the marine environment. Red-colored Plectropomus leopardus is in high demand owing to its bright color and potential value for artificial breeding. High-throughput transcriptome sequencing and liquid chromatography tandem-mass spectrometry (LC-MS/MS) approaches were used to identify transcript and metabolic differences between black-colored and red-colored P. leopardus. Compared with the black-colored group, 218 and 181 differentially expressed genes were up- and down- regulated, respectively, in the red-colored group. 425 and 56 significantly different metabolites were identified in LC-MS positive and LC-MS negative ion models, respectively, between two colored groups. Based on the integrative analysis, the red-colored group exhibited greater carotenoid uptake, transport, and accumulation activity potential than those in the black-colored group and may consume more arachidonic acid for body color formation. The black-colored group showed greater melanin synthesis activity compared with the red-colored group. These results substantially improve the understanding of molecular and metabolic mechanisms underlying body color formation in P. leopardus and the potential of body color for the environment adaptation.
Introduction
Body coloration is one of the most diverse and remarkable phenotypes, with multiple adaptive functions, including species recognition, communication, thermoregulation, camouflage, photoreception, and selective mating (Jiang et al., 2014; Du et al., 2019). It is essential to explore the molecular mechanism underlying body coloration owing to its importance in environmental adaption and body color formation (Parichy and Johnson, 2001; Braasch et al., 2009a). Researchers have reported that melanin is important for black color formation which is determined by the melanogenesis pathway in many species, including zebrafish (Sturm, 2006), bluebirds (Shawkey et al., 2006), Chinese tongue (Li et al., 2020), and Japanese ornamental carp (Bar et al., 2013; Bertolesi et al., 2020). Other color-related pigments, such as red, yellow, and white pigments, have been evaluated in common carp (Jiang et al., 2014; Du et al., 2019), and Nothobranchius fish (Ng’Oma et al., 2014), however, researches about the specific molecular and metabolic mechanism of body color formation in fish are still limited.
The leopard coral grouper (Plectropomus leopardus) naturally inhabits tropical and subtropical waters of the Indo-Pacific Oceans, and exhibits black and red body colors, which contribute to fish adaptation to environment, quality, and price (Maoka et al., 2017). In vertebrates, darker eumelanic individuals tended to be more aggressive, less sensitive to environmental stresses, and have better immune function compared with lighter individuals (Ducrest et al., 2008). Furthermore, prices of red leopard coral grouper are significantly higher than those of the black fish, particularly in Chinese markets which showed the different possibility for the environmental and economic values for different body color fishes. Multiple factors influence the body color of leopard coral groupers, including climate change (Pratchett et al., 2017), temperature (Lutfiyah et al., 2019), salinity (Setiawati et al., 2017), and diet (Xia et al., 2019). Recently, the P. leopardus genome has been published, providing a basis for further chances of the intrinsic mechanism underlying body color variation and adaptation (Yang et al., 2020; Zhou et al., 2020). Transcriptome sequencing of different color morphs of P. leopardus has revealed multiple genes associated with carotenoid metabolism (Wang et al., 2015; Yang et al., 2020) and different kinds of carotenoids, including astaxanthin, tunaxanthin, and adonixanthin, were also detected and participated in body color formation in P. leopardus (Maoka et al., 2017).
The rapid development of high-throughput sequencing technology has provided a suitable approach to identify candidate genes underlying phenotypic traits (e.g., body color, growth, immunity, and resistance to harmful conditions; Rondon et al., 2016; Wang et al., 2018; Hao et al., 2019). Recently, transcriptomic analyses of fish body color have been performed in multiple species including Oujiang color common carp (Cyprinus carpio; Du et al., 2019) and chinook salmon (Oncorhynchus tshawytscha; Madaro et al., 2020), and multiple genes associated with melanin and other color-related pigments have been detected. Despite several transcriptome analyses of different color morphs, the lack of metabolite level analyses limits our understanding of the critical pathways responsible for body color trait regulation (Wang et al., 2015; Yang et al., 2020). Phenotypes are not only regulated by transcripts as well as by metabolites and accordingly metabolic analyses could provide additional insight into physiological and biochemical factors contributing to phenotypic variation (Hao et al., 2018, 2019; Yang et al., 2018, 2019; Huang et al., 2021). Therefore, metabolomics approaches have been widely used in combination with transcriptomics to evaluate a wide range of taxa, including Coilia nasus (Xu et al., 2016), Mytilus californianus (Gracey and Connor, 2016), Crassostrea gigas (Li et al., 2017), Macrobrachium nipponense (Sun et al., 2018), Eriocheir sinensis (Wang et al., 2021), and Pinctada fucata martensii (Hao et al., 2019; Zhang et al., 2021). In the present study, transcriptomic and metabonomic methods were utilized to explore body color formation in P. leopardus. Networks were mapped based on correlations between metabolites and regulatory genes associated with body color differences. These findings provide new insights into the molecular and metabolic mechanisms underlying body color formation.
Materials and Methods
Experimental Animals
Black-colored and red-colored P. leopardus fish (4 months of age) were brought from Hainan Yonghe Biological Technology Co., Ltd., China. The body lengths of red-colored group and black-colored group fish were (11.83 ± 0.62) and (10.97 ± 0.63) cm, respectively (Supplementary Figure 1). Both groups were reared in the same conditions and fed with Dongwan grouper diet (Guangdong Yuequn Biotechnology Co., Ltd., China) twice per day (10 a.m. and 4 p.m.). Fish were anesthetized with eugenol and sacrificed for the collection of skin tissues. Skin tissues of fish were immediately frozen in liquid nitrogen and stored at −80°C for further analysis. For the transcriptome analysis, two samples were mixed to a single sample for sequencing. For metabolome detection, six individuals were utilized separately. All animal experiments were conducted in accordance with the guidelines and approval of the respective Animal Care and Use Committee of Guangdong Ocean University, China.
RNA Sequencing and Data Analysis
In the transcriptome sequencing, six skin tissues were obtained and pairs of samples were pooled for sequencing. Then, the skin tissues of both the red-colored and black-colored groups were utilized to extract RNA for transcriptome sequencing with TRIzol reagent (Invitrogen, Carlsbad, CA, United States) according to the manufacture’s instructions. RNA degradation and contamination were monitored on 1% agarose gels, and RNA purity was checked using the NanoPhotometer® spectrophotometer (IMPLEN, Westlake Village, CA, United States). RNA concentration and RNA integrity were evaluated using the Qubit® RNA Assay Kit and Qubit® 2.0 Flurometer (Life Technologies, Carlsbad, CA, United States) and RNA Nano 6000 Assay Kit and the Bioanalyzer 2100 System (Agilent Technologies, Santa Clara, CA, United States), respectively. A sequencing library was then constructed using the NEBNext® UltraTM RNA Library Prep Kit for Illumina® (NEB, Ipswich, MA, United States), and sequencing was performed using the Illumina HiSeq2500/X platform. Raw sequencing data were filtered to obtain clean data. The clean data were aligned to the reference genome (Zhou et al., 2020) using TopHat v2.0.12. Cuffquant and cuffnorm (v2.2.1) were used to calculate FPKMs, and the DESeq2 R package was used for the identification of differentially expressed genes (DEGs) between groups with an adjusted FDR < 0.01 and |log2FC| > 1. Gene Ontology (GO) and Kyoto Encyclopedia of Genes and Genomes (KEGG) pathway enrichment analyses of DEGs were performed using the GOseq R package and KOBAS with corrected P < 0.5, respectively.
Metabolomic Analysis
Tissue Samples for Metabolomic Analysis
Six skin tissues from the red-colored and black-colored groups were collected from each group. Each sample (50 mg) was homogenized with 500 μL of ice-cold methanol/water (70%, v/v) containing internal standard (L-2-Chlorophenylalanine, 1 ppm) at 30 Hz for 2 min. After homogenization, the mixture was shaken for 5 min and incubated on ice for 15 min. The mixture was centrifuged at 12,000 rpm at 4°C for 10 min and the supernatant 400 μL was placed in another centrifuge tube. Then, 500 μL of ethyl acetate/methanol (V, 1:3) was added to the original centrifuge tube and the mixture was oscillated for 5 min and incubated on ice for 15 min. Then, samples were centrifuged at 12,000 rpm at 4°C for 10 min and take 400 μL of supernatant. The two supernatants were combined and concentrated. Then, 100 μL of 70% methanol water was added to the dried product and subjected to ultrasonic treatment for 3 min. Finally, sampled were centrifuged at 12,000 rpm at 4°C for 3 min, and suck 60 μL of the supernatant was used for the liquid chromatography tandem-mass spectrometry (LC-MS/MS) analysis.
HPLC Conditions for Metabolomic Analysis
The HPLC separation was carried out using a 1,290 Infinity LC UHPLC System (Agilent Technologies). The analytical conditions were as follows: UPLC: column, Waters ACQUITY UPLC HSS T3 C18 (1.8 μm, 2.1 mm × 100 mm); column temperature, 35°C; flow rate, 0.3 mL/min; injection volume, 1 μL; solvent system, water (0.01% methanolic acid): acetonitrile; gradient program of positive ion, 95:5 V/V at 0 min, 79:21 V/V at 3.0 min, 50:50 V/V at 5.0 min, 30:70 V/V at 9.0 min, 5:95 V/V at 10.0 min, and 95:5 V/V at 14.0 min; gradient program of negative ion, 95:5 V/V at 0 min, 79:21 V/V at 3.0 min, 50:50 V/V at 5.0 min, 30:70 V/V at 9.0 min, 5:95 V/V at 10.0 min, and 95:5 V/V at 14.0 min.
Metabolomic Data Analysis
During the LC-MS experiment, the QTOF/MS-6545 mass spectrometry (Agilent Technologies) was utilized. The original data file obtained from the LC-MS analysis was extracted using ProFinder (Agilent, Santa Clara, CA, United States) to obtain m/z, retention times and peak areas of characteristic peaks, and the data file was imported into Mass Profiler Professional (Agilent) as a CEF file for peak alignment and statistical analyses. Metabolite identification was based on the primary and secondary spectral data annotated against the self-compiled database MWDB (Wuhan Metware Biotechnology Co., Ltd.) and publicly available metabolite databases, including MassBank,1 KNApSAcK,2 HMDB,3 and METLIN.4 Metabolite quantification was performed with the multiple reaction monitoring (MRM) mode (Fraga et al., 2010). Then multivariate statistical analyses were performed using MetaboAnalystR (R) (V1.0.1), including principal component analysis (PCA) and orthogonal partial least squares discriminant analysis (OPLS-DA), and significantly different metabolites (SDMs) with VIP > 1 and P < 0.05 were identified for further analysis.
Integrative Analysis of Metabolome and Transcriptome Data
Differentially expressed genes (FDR < 0.01 and | log2FC| > 1) and SDMs (VIP > 1 and P < 0.05) were integrated for a comprehensive analysis of differences between the red-colored and black-colored groups. KOBAS and Fisher’s exact tests were utilized to detect significantly enriched KEGG pathways (P < 0.05).
Results
Transcriptome Analysis
Transcriptome sequencing of red-colored and black-colored groups was performed using the Illumina HiSeq2500/X platform, and 45.57 and 46.64 M clean reads were obtained, respectively. Genes were mapped to the P. leopardus genome, and the average mapping rates for the red-colored and black-colored groups were 83.61 and 83.26%, respectively (Table 1). With respect to transcriptome quality, the red-colored and black-colored groups held Q20 of 97.87 and 97.89%, Q30 of 93.94 and 93.91%, respectively, indicating that the data quality was sufficient for subsequent analyses.
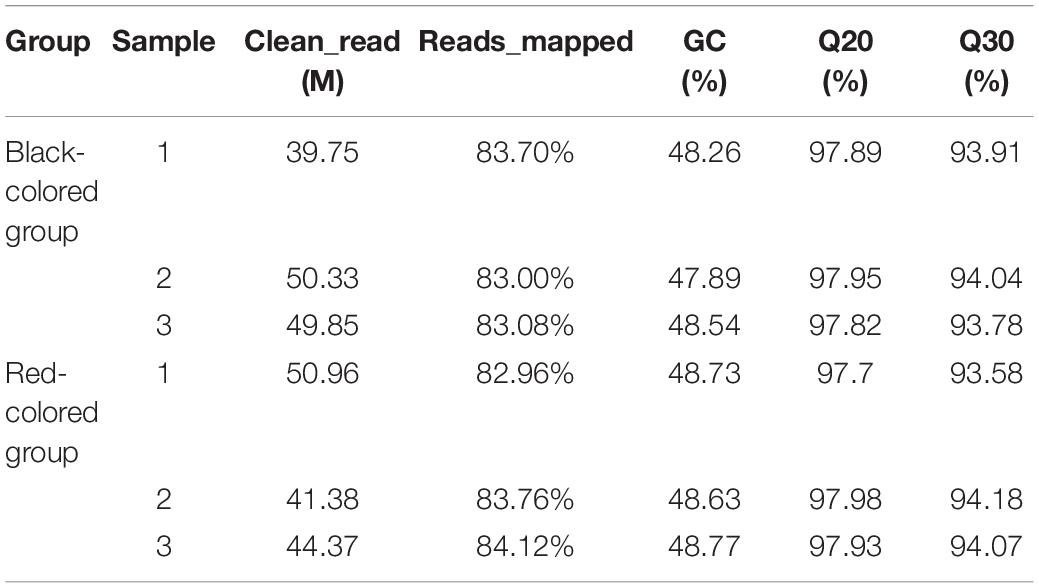
Table 1. Transcriptome analysis of different color from Plectropomus leopardus.
A total of 399 DEGs were identified between the black-colored and red-colored groups (FDR < 0.01 and | log2FC| > 1; Supplemental Table 1). Compared with the black-colored group, the red-colored group showed 218 and 181 up- and down- regulated genes, respectively. Genes related to carotenoid uptake, transport, and accumulation, including low-density lipoproteins receptor adapter protein 1 (LDLRA), fatty acid transport protein (FATP), stearoyl-CoA desaturase (SCD), showed significantly higher expression levels in the red-colored group than in the black-colored group, indicating that carotenoid accumulation ability of red-colored group is greater than that of black-colored group (Figure 1). Multiple cytochrome P450, GTPase, oxidoreductase, and regulator of G-protein signaling (RGS) genes showed differential expression patterns between groups. Furthermore, expression levels of growth-related genes, including fibroblast growth factor (FGF), FGF binding protein 1 (FGFBP1), insulin-like growth factor-binding protein (IGFBP), epidermal growth factor (EGF), and transforming growth factor beta type I (TGFβ), were significantly differently between the red-colored group and black-colored group. Expression levels of the immune-related genes complement C1q, interleukin 1/18, 4, 6, 11, tumor necrosis factor (TNF), and C-type lectin also differed significantly between two groups (Figure 2). Melanocyte, melanocortin receptor 5, tyrosinase-related protein 1 (TYRP1), which are involved in the melanin synthesis, showed significantly higher FPKM values in the black-colored group than in the red-colored group (Supplemental Table 1).
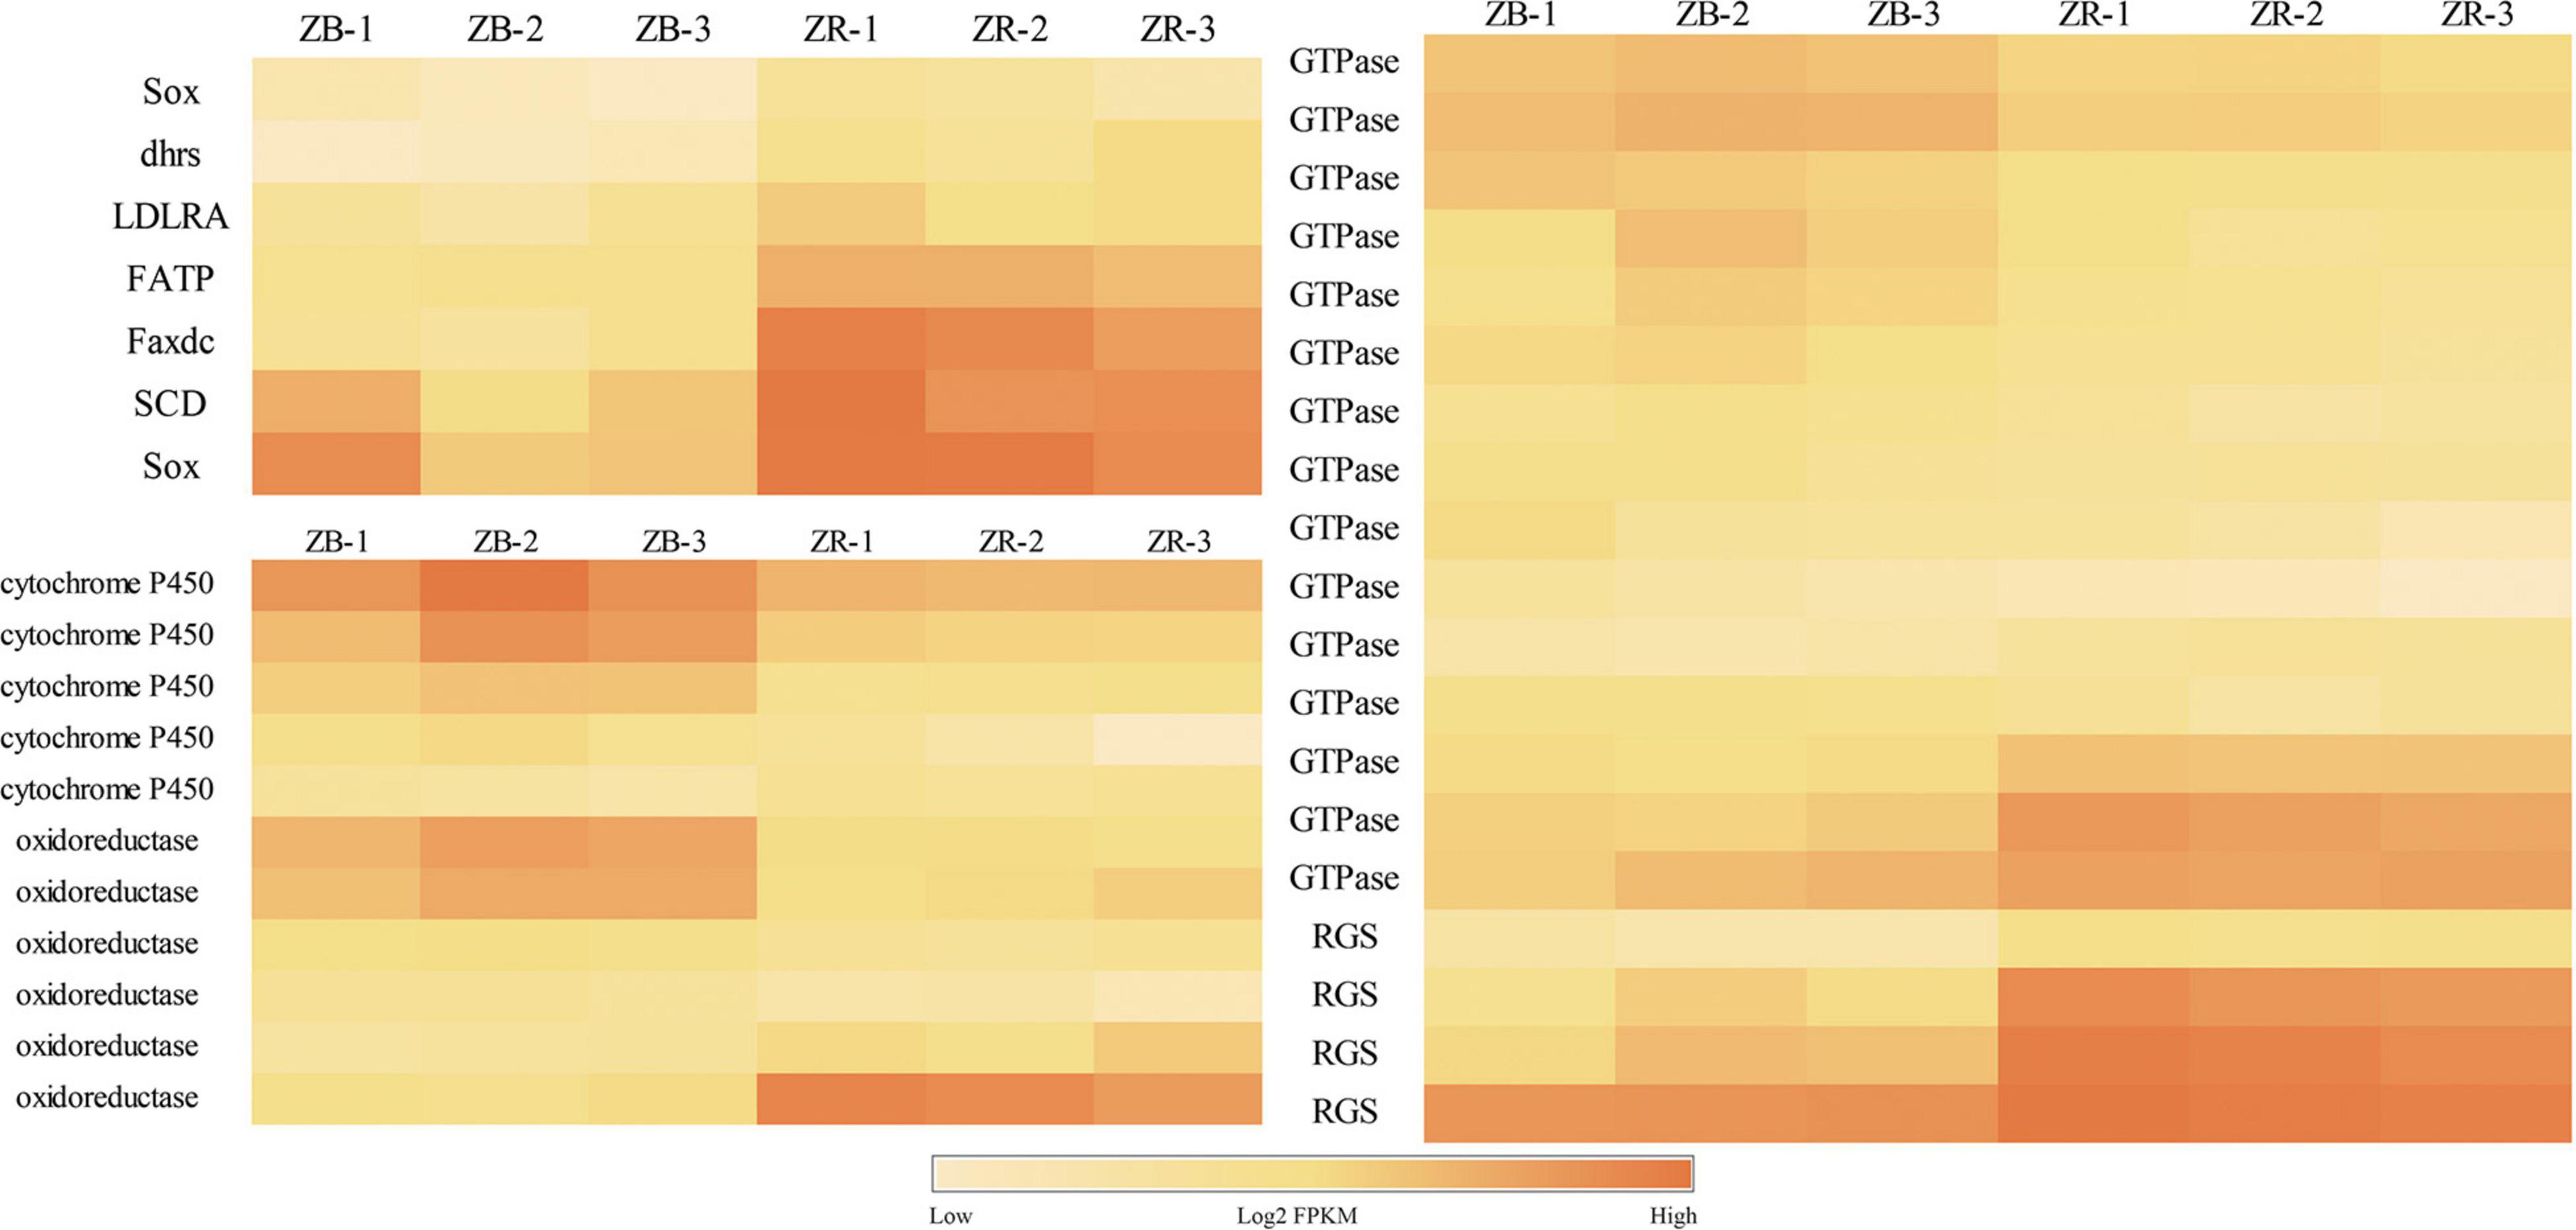
Figure 1. Differentially expressed genes (DEGs) related to carotenoid uptake, transportation and accumulation of the transcriptome analysis from red-colored group (ZR) and black-colored group (ZB).
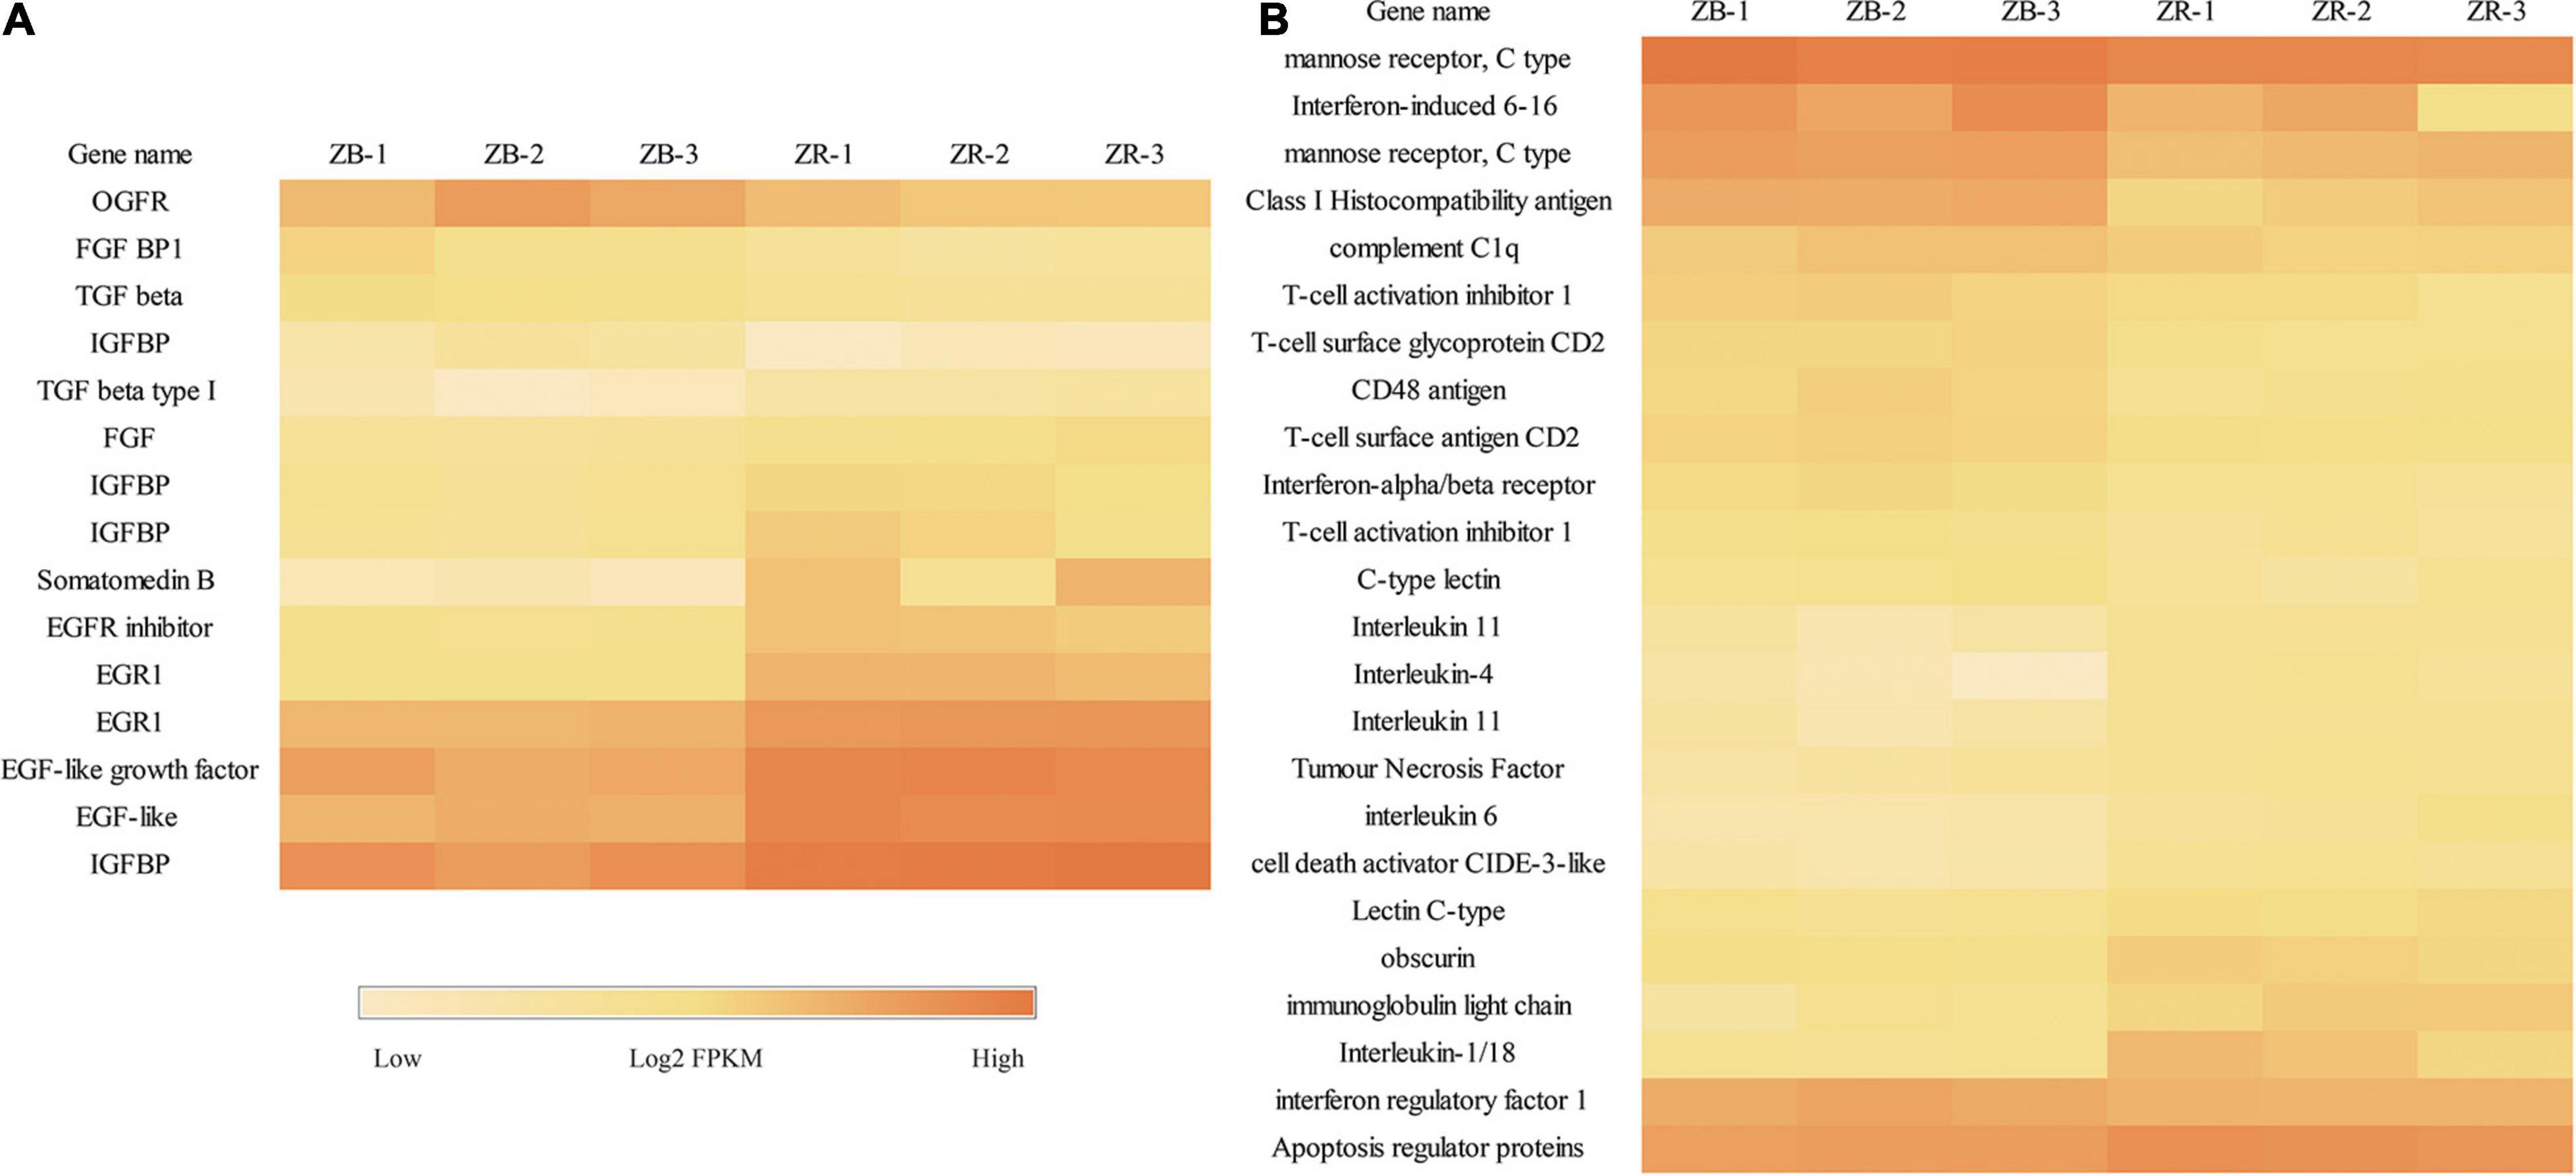
Figure 2. Differentially expressed genes related to immunity and growth of the transcriptome analysis from ZR and ZB groups. (A) DEGs related to growth. (B) DEGs related to immunity.
All DEGs were classified into the three main GO categories cellular component, molecular function, and biological processes (Figure 3B), and GO enrichment showed that 73 GO terms were significantly enriched (P < 0.1), including immune-related terms, such as immune response, interleukin-1 receptor binding, chemokine activity, and inflammatory response. Furthermore, DEGs were enriched for growth-related terms, including growth factor activity, insulin-like growth factor binding, and regulation of cell growth (Figure 3A and Supplementary Table 2). Significant pathways associated with pigment synthesis were identified in a pathway enrichment analysis of DEGs (P < 0.5; Supplementary Table 3). Among these pathways, “Tyrosine metabolism” and “Melanogenesis,” which function in melanin formation, were enriched (Figure 4).
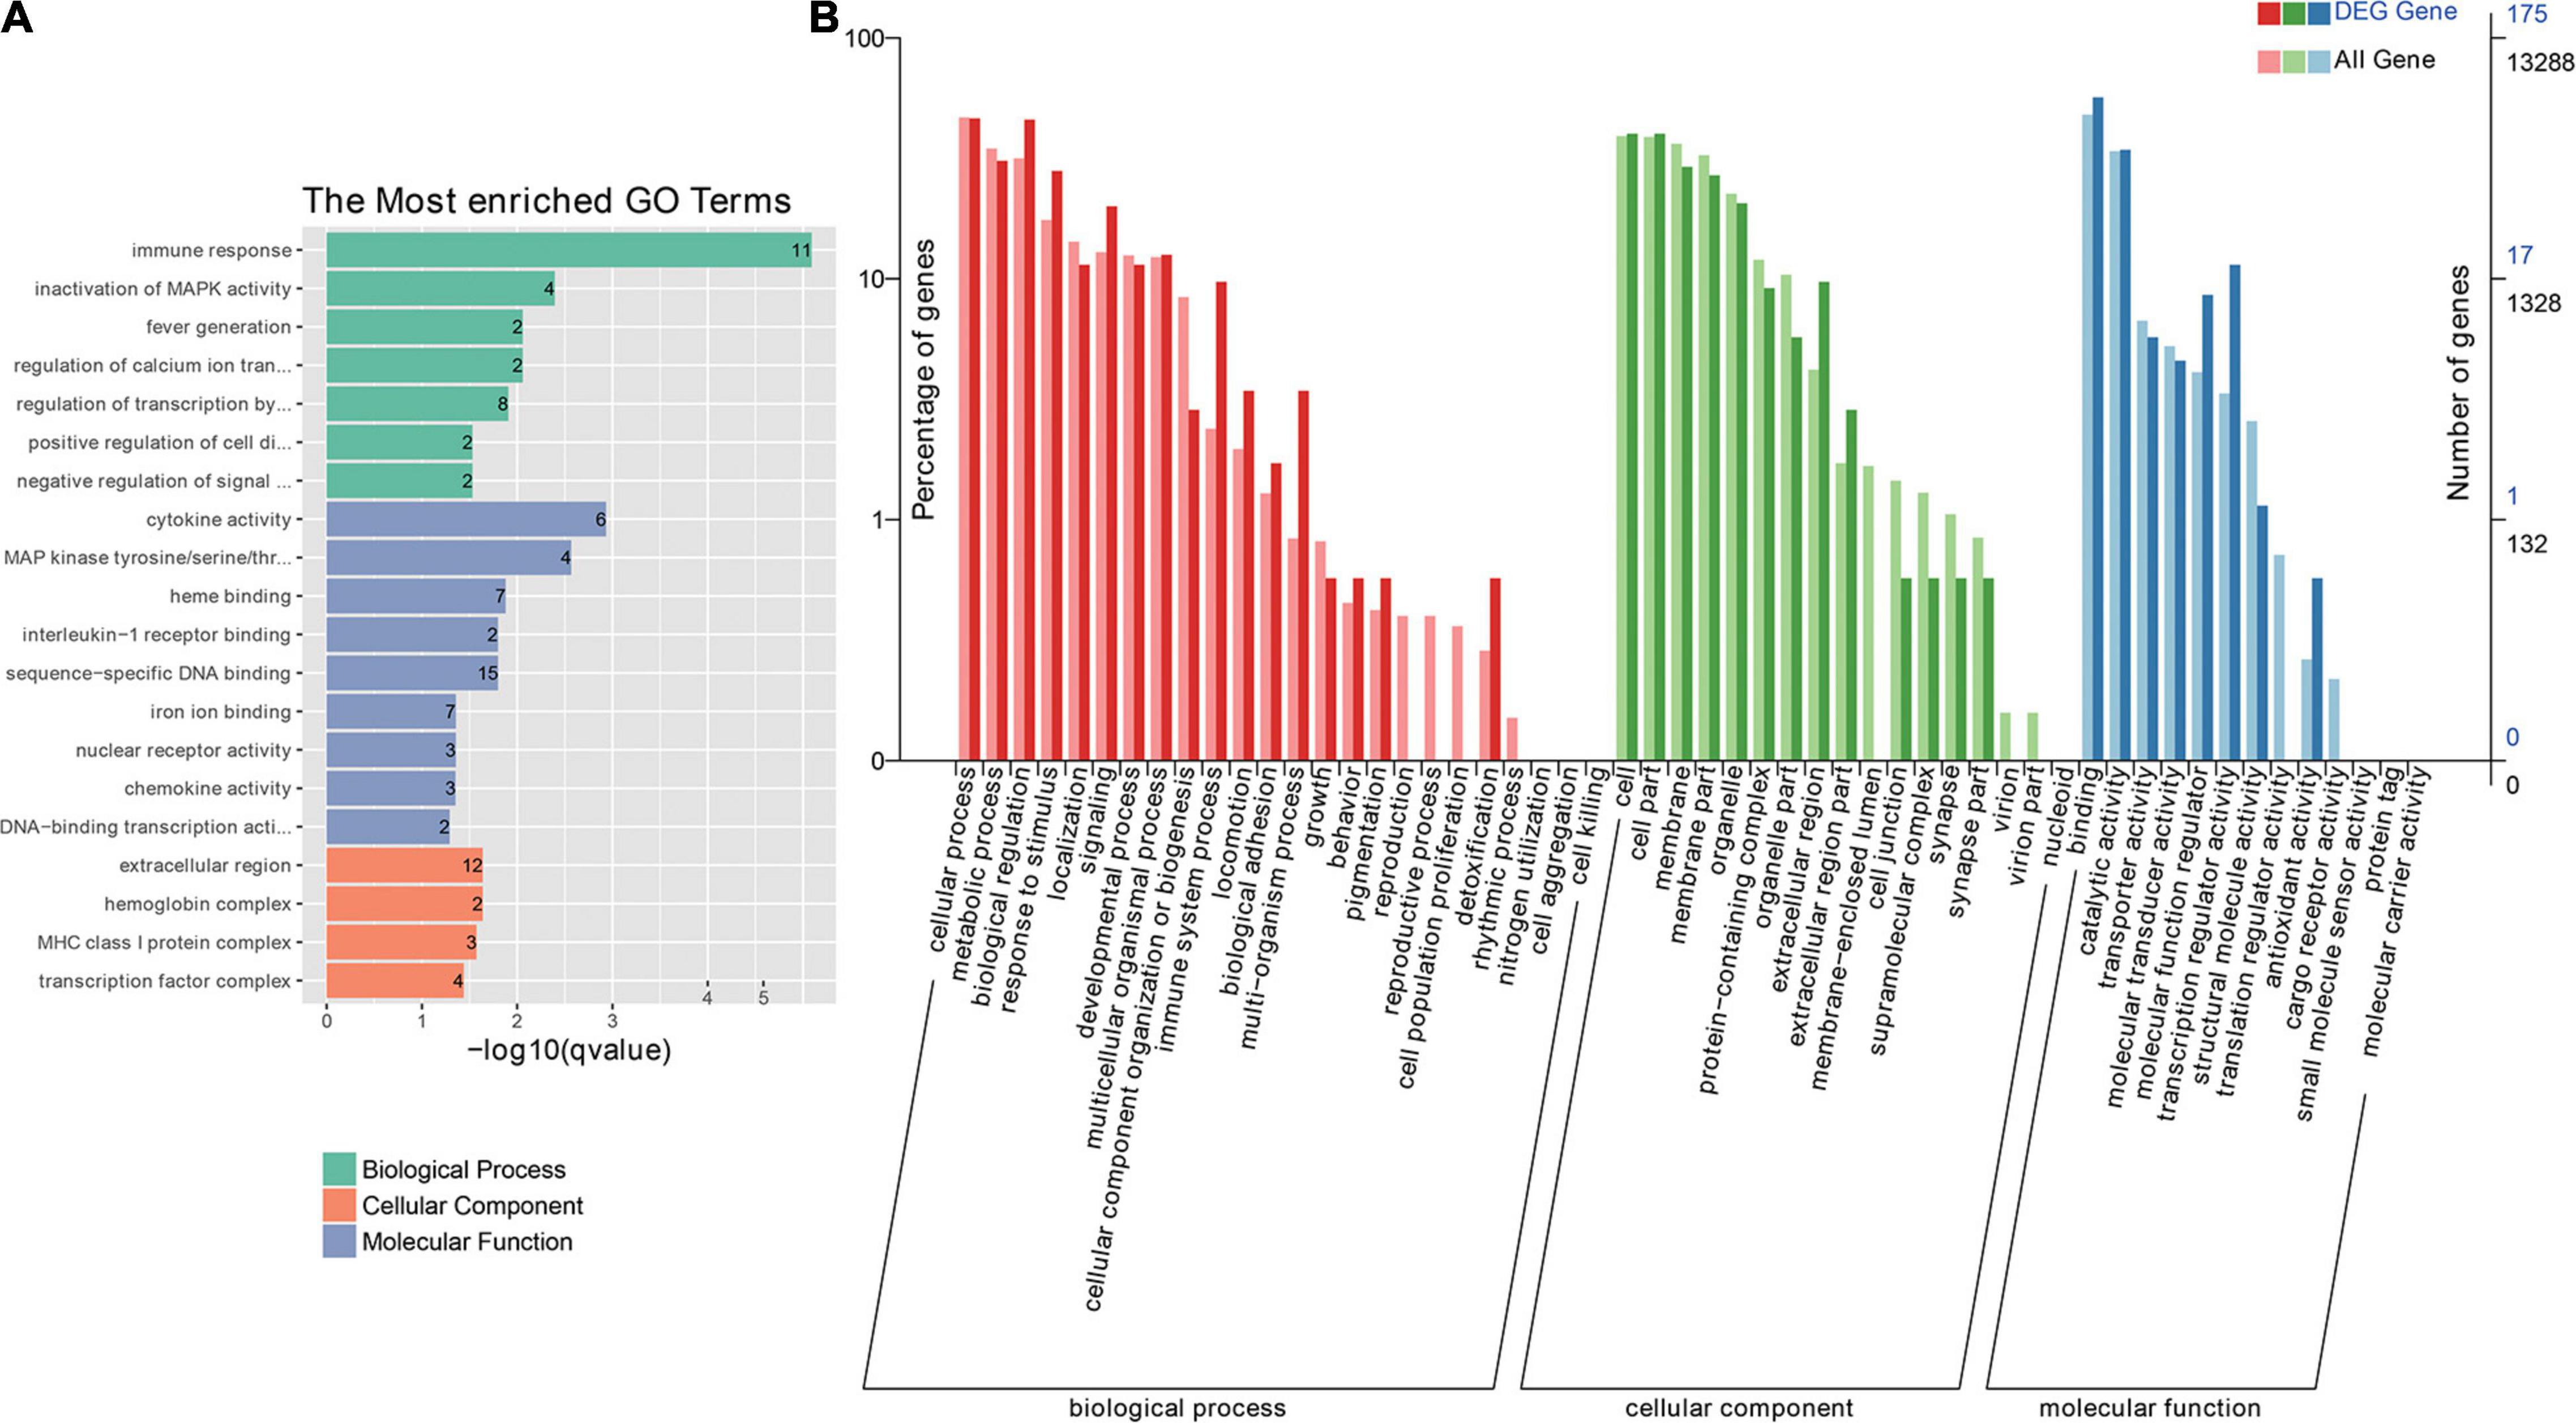
Figure 3. Transcriptome analysis of the ZR and ZB groups. (A) Gene ontology (GO) enrichment of DEGs. (B) DEGs were assigned to GO terms belonging to three main categories, namely, biological process, molecular function, and cellular component.
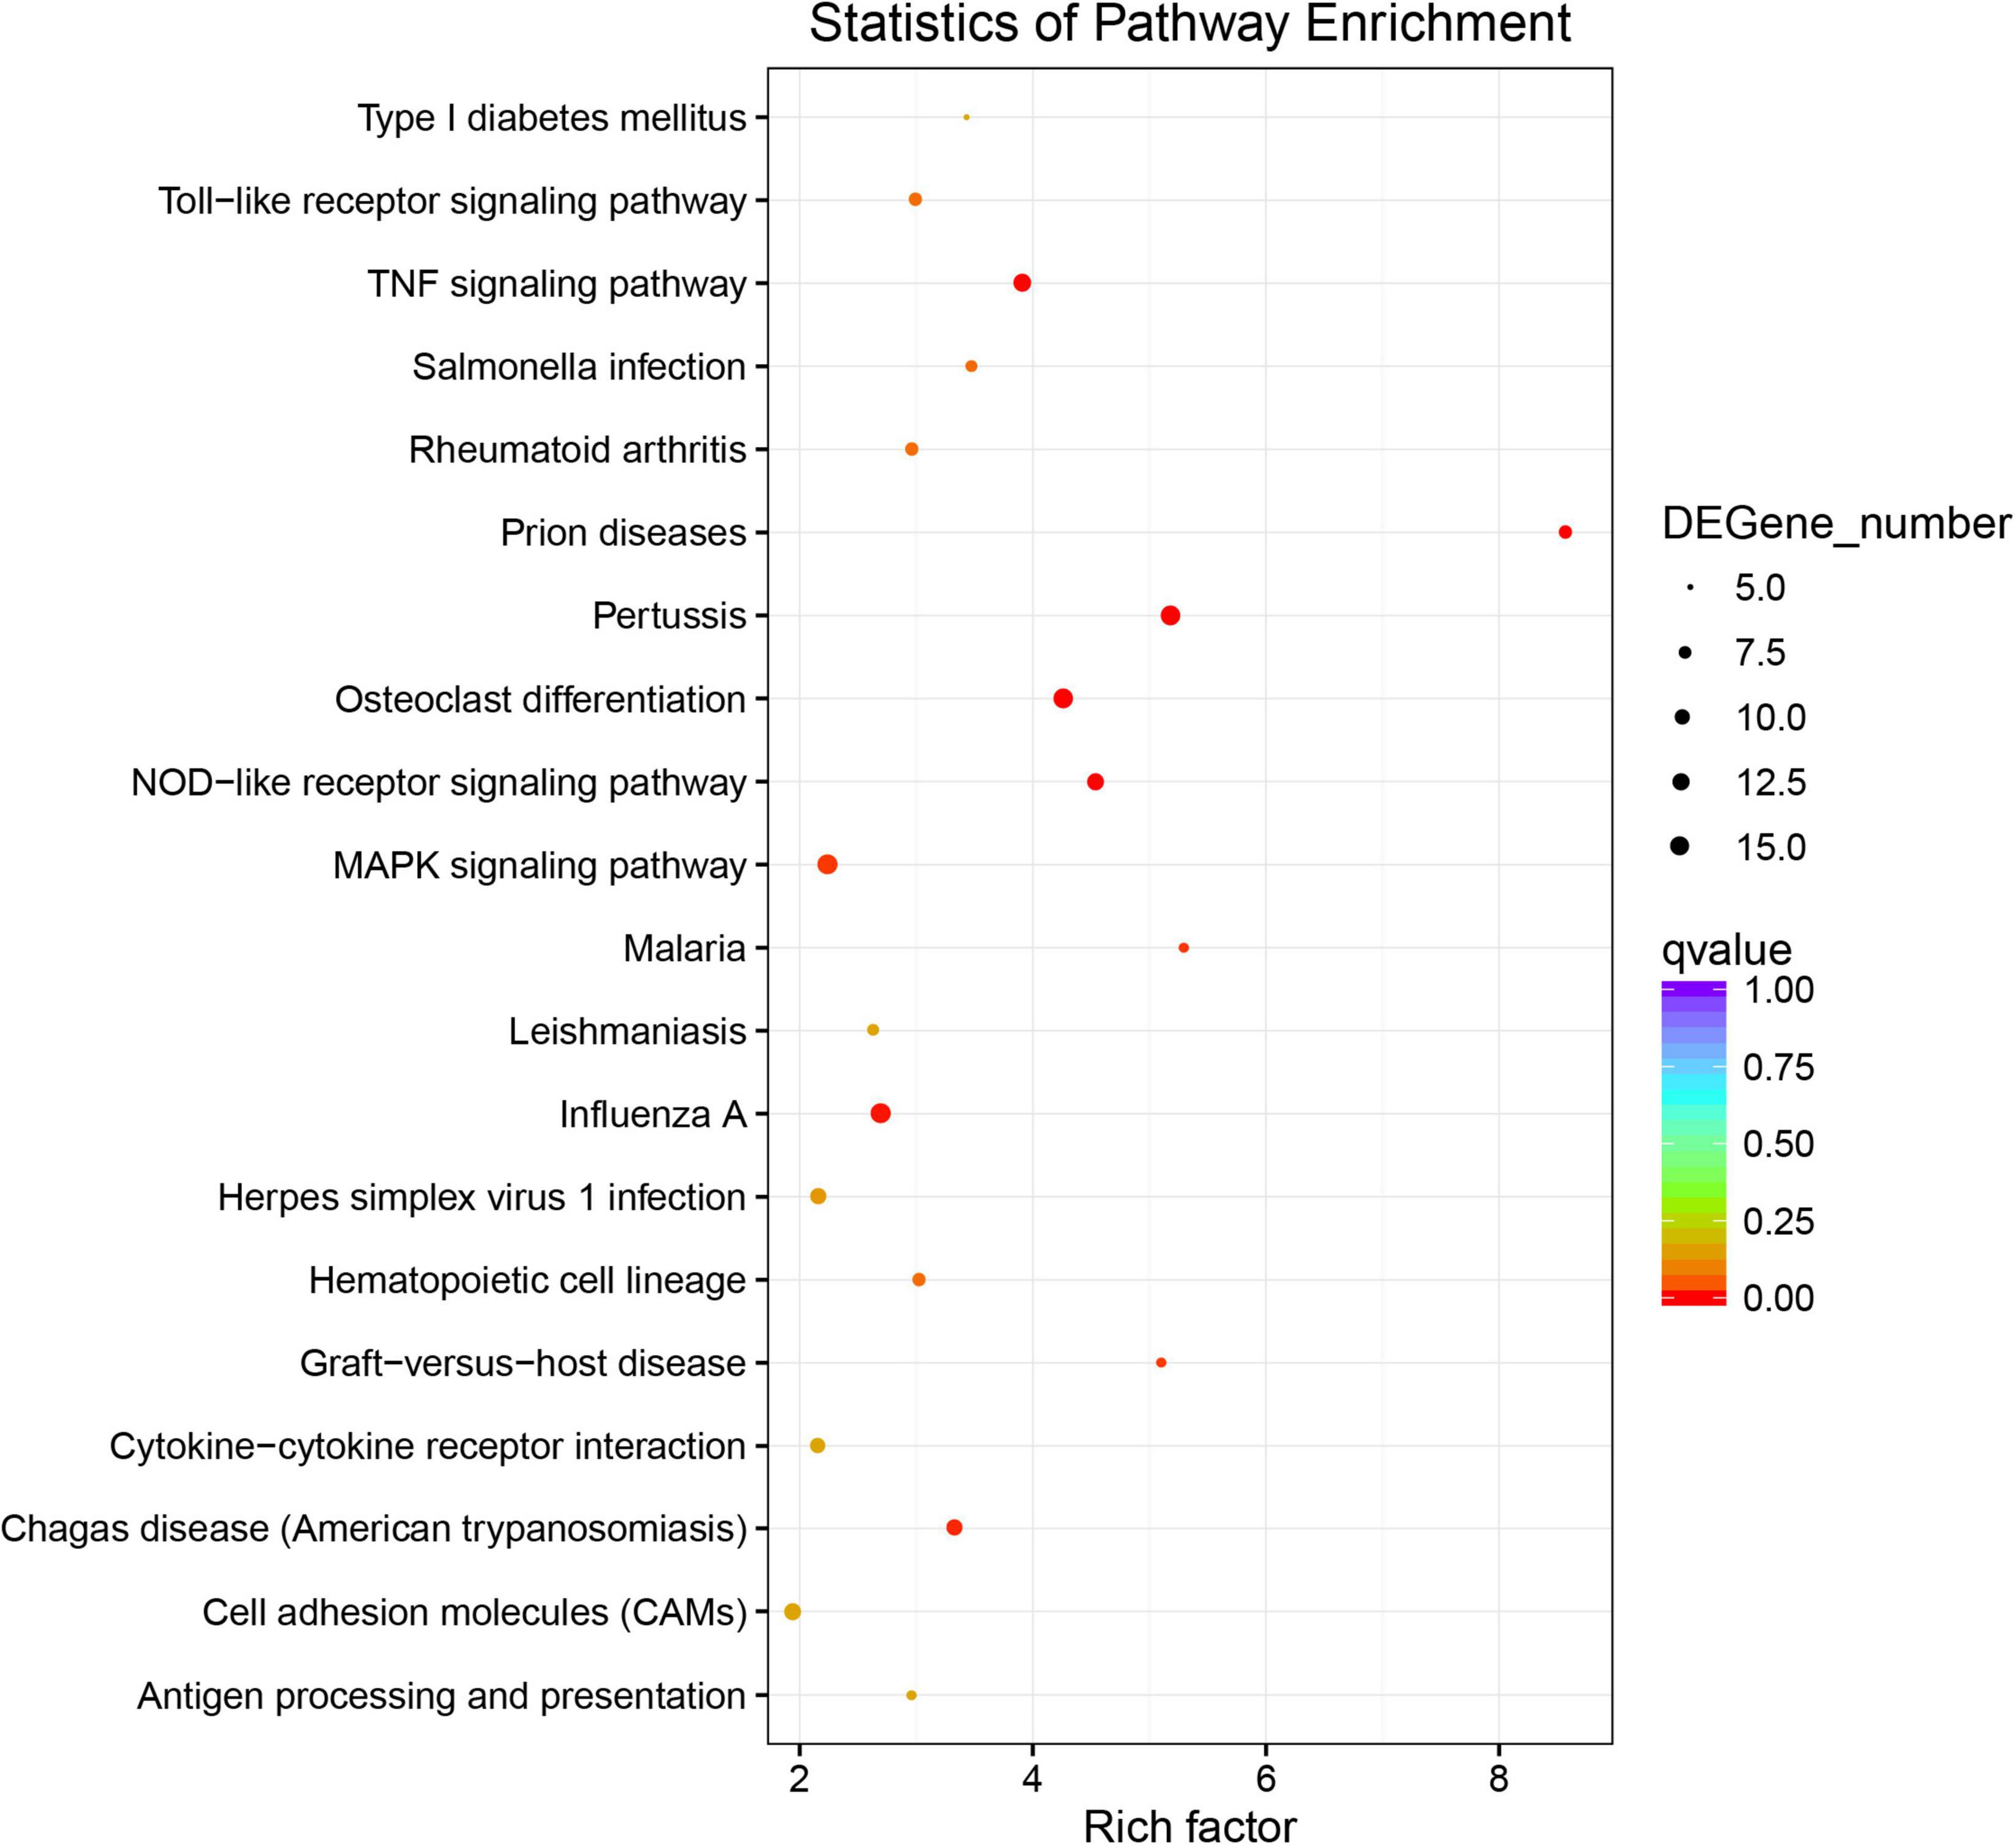
Figure 4. Pathway enrichment analysis of the DEGs.
Metabolome Analysis
A total of 3,358 and 171 valid peaks for skin tissues were obtained in LC-MS positive (POS) and negative (NEG) ion models, after data preprocessing via LC-MS-based metabolomics, respectively. Differences between the two groups were detected by PCA, showing clear separation of the two groups (Figures 5A,D). OPLS-DA was used to elucidate differential metabolic patterns (Figures 5B,E), and the parameters considered for classification were stable and effective for fitting and prediction of the model. The R2Y and Q2 intercept values determined after 200 permutations (Figures 5C,F) supported the robustness of the models, with low overfitting and reliability risks. The two groups in the score plots showed clear separation.
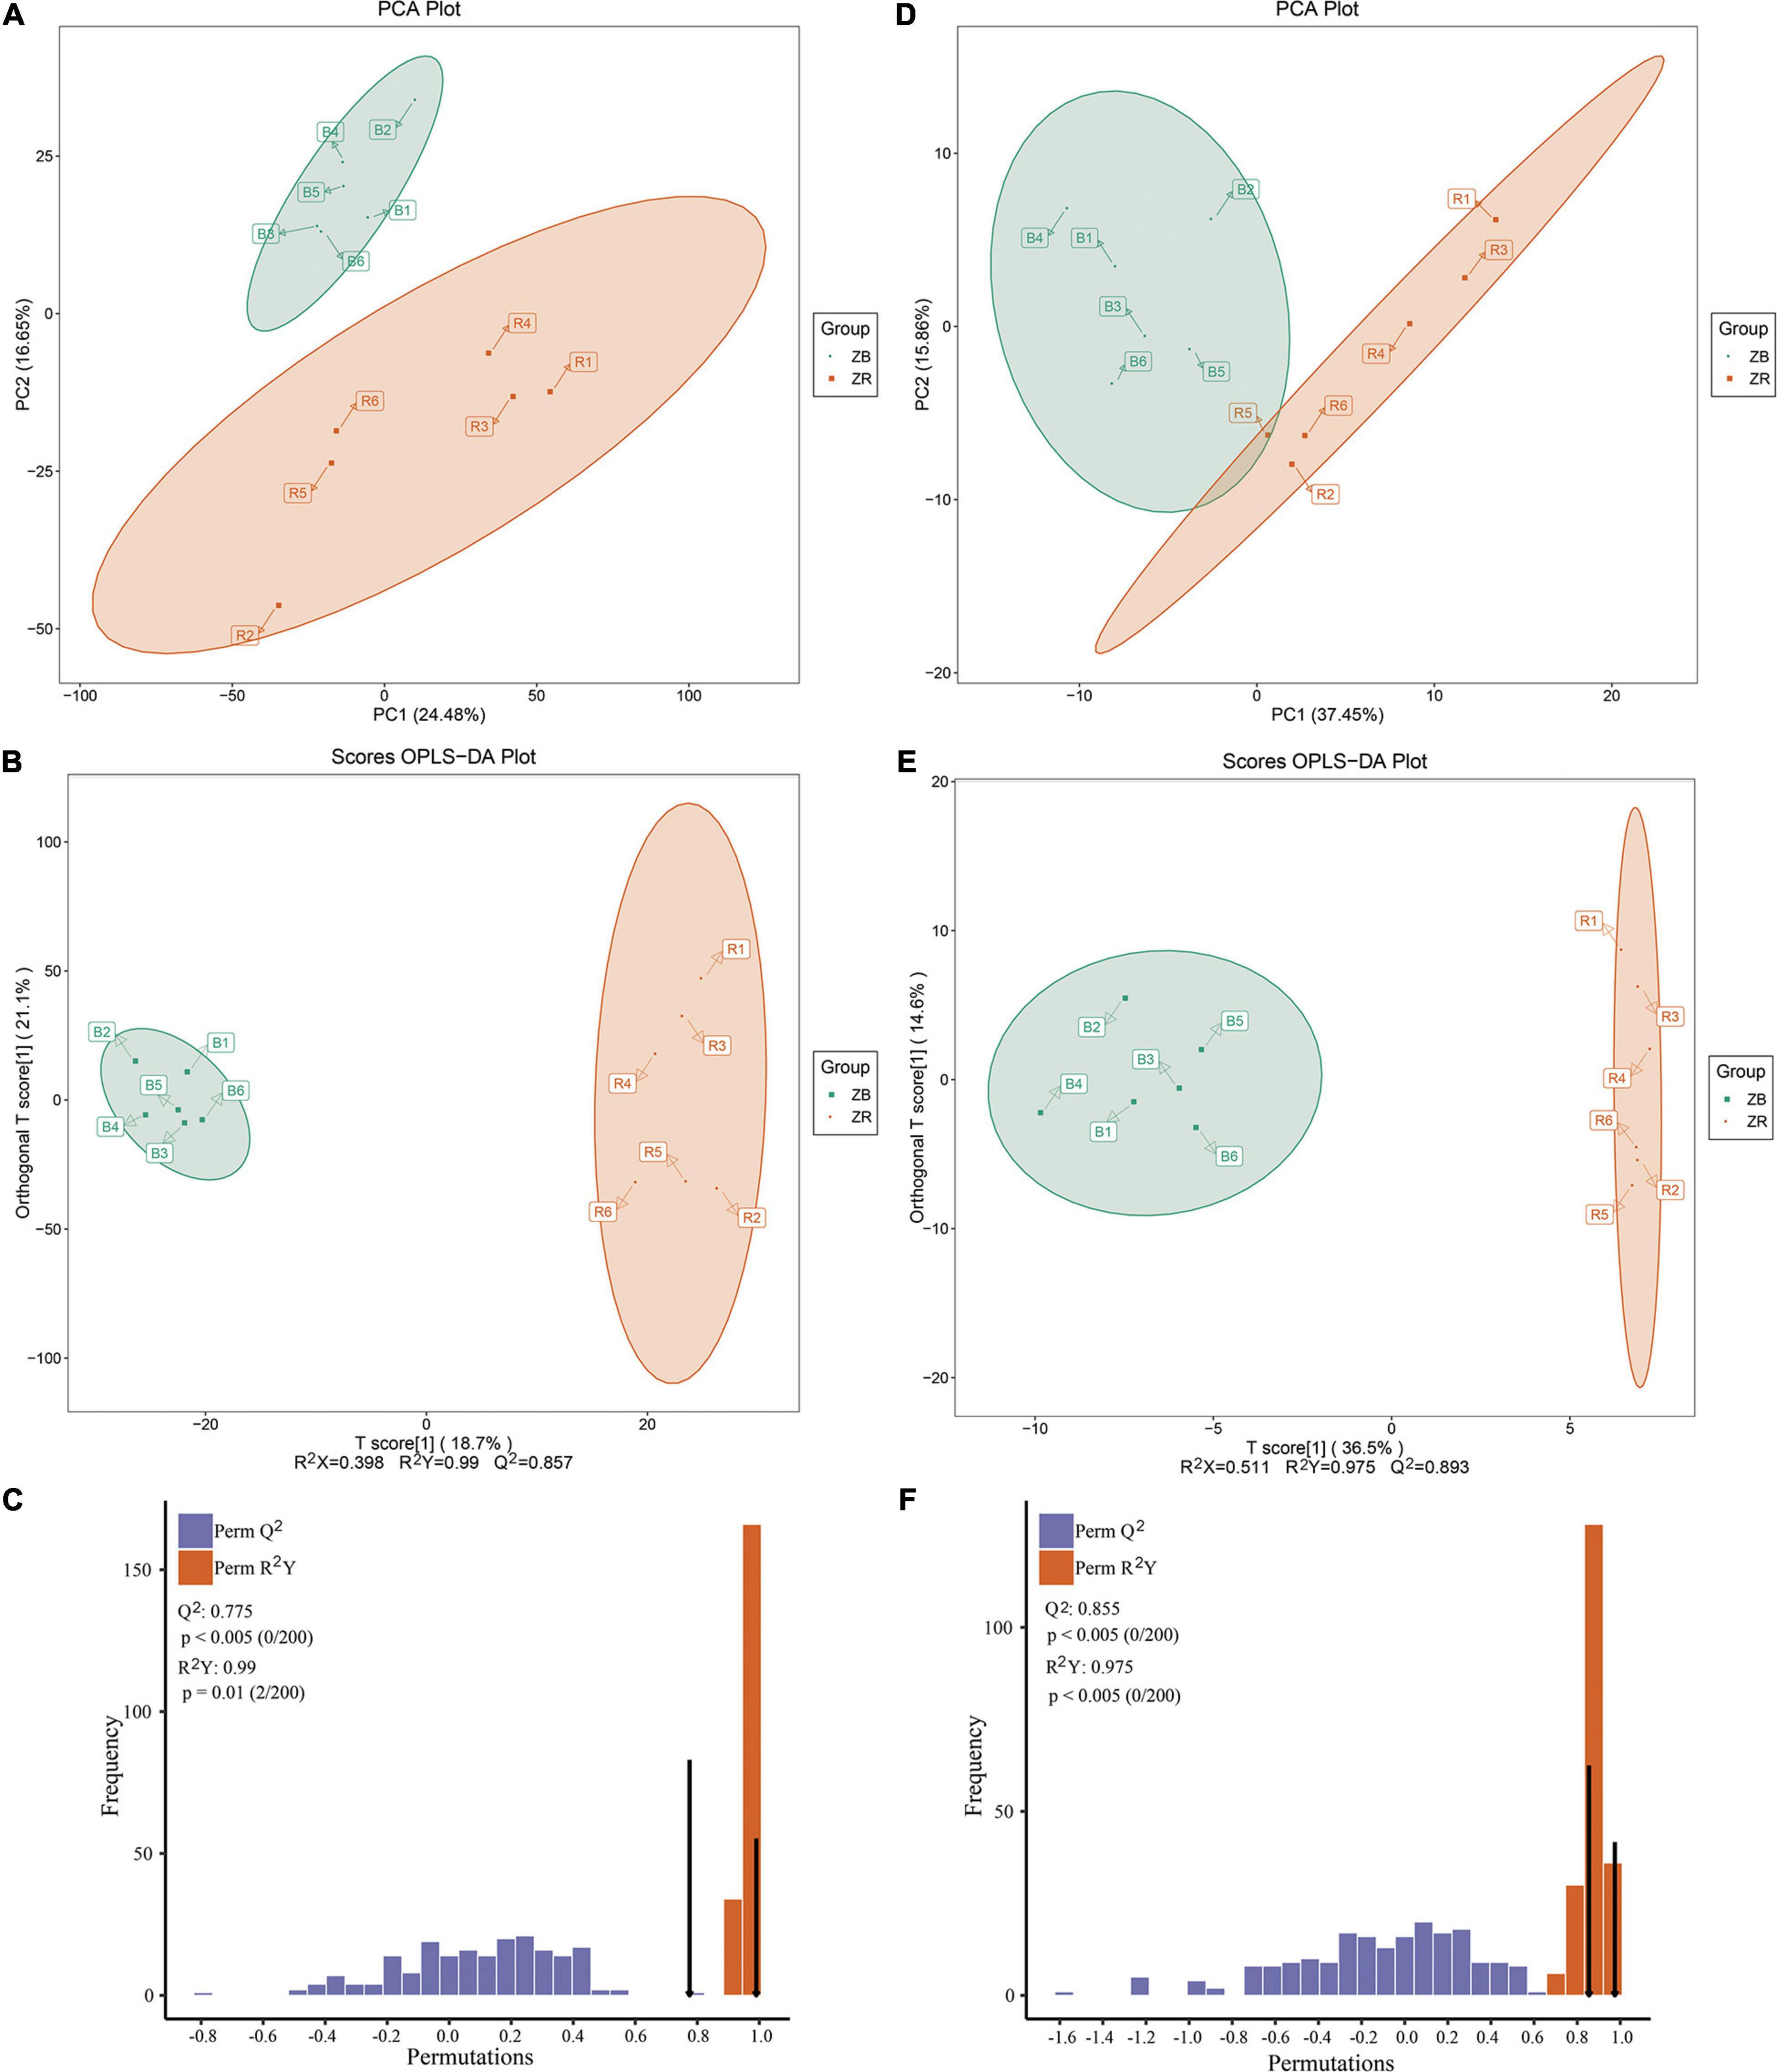
Figure 5. Derived principal component analysis (PCA) score plot, derived orthogonal partial least squares discriminant analysis (OPLS-DA) score plots, and corresponding validation plots of OPLS-DA analysis. (A,D) showed the PCA analysis. (B,E) showed the OPLS-DA score plots analysis. (C,F) represented the corresponding validation plots of OPLS-DA analysis. B represents the ZB group, and R represents the ZR group.
A total of 1,175 metabolites in POS and 78 metabolites in NEG were identified. A total of 425 SDMs for POS and 56 SDMs for NEG between the black-colored and red-colored groups were identified. For the 425 SDMs in POS, the concentrations of 190 and 235 metabolites were higher and lower in the red-colored group than in the black-colored group, respectively (Supplementary Table 4). Among 56 SDMs in NEG, 31 and 25 metabolites had higher concentrations in the red-colored group than in the black-colored group, respectively (Supplementary Table 5).
Pathway enrichment analysis of SDMs was performed. A total of 15 and two pathways were enriched for SDMs between the black-colored and red-colored groups in POS and NEG models, respectively (Supplementary Tables 6, 7). Metabolic pathways, including “Glycerophospholipid metabolism,” “Phenylalanine, tyrosine and tryptophan biosynthesis,” “Linoleic acid metabolism,” and “Arachidonic acid metabolism” were significantly enriched according to the P-value threshold. Tyrosine metabolism, which is involved in the synthesis of melanin, was also enriched and furthermore, tyrosine showed higher concentrations in the red-colored group that in the black-colored group.
Integrated Analysis of Transcriptomic and Metabolomic Data
The DEGs and SDMs from the black-colored vs. red-colored group were utilized for a pathway enrichment analysis using Fisher’s exact tests. Supplementary Figure 2 shows the number of DEGs and SDMs in each pathway. In total, 55 significantly enriched pathways were identified, including melanogenesis and tyrosine metabolism, which are involved in melanin synthesis (Figure 6). Immune-related pathways, including the TNF signaling pathway, interleukin-17 signaling pathway, C-type lectin receptor signaling pathway, Toll-like receptor signaling pathway, and cell and adhesion molecules, were also enriched. Interestingly, long-chain unsaturated fatty acid-related pathways including arachidonic acid metabolism, were also enriched (Figure 6).
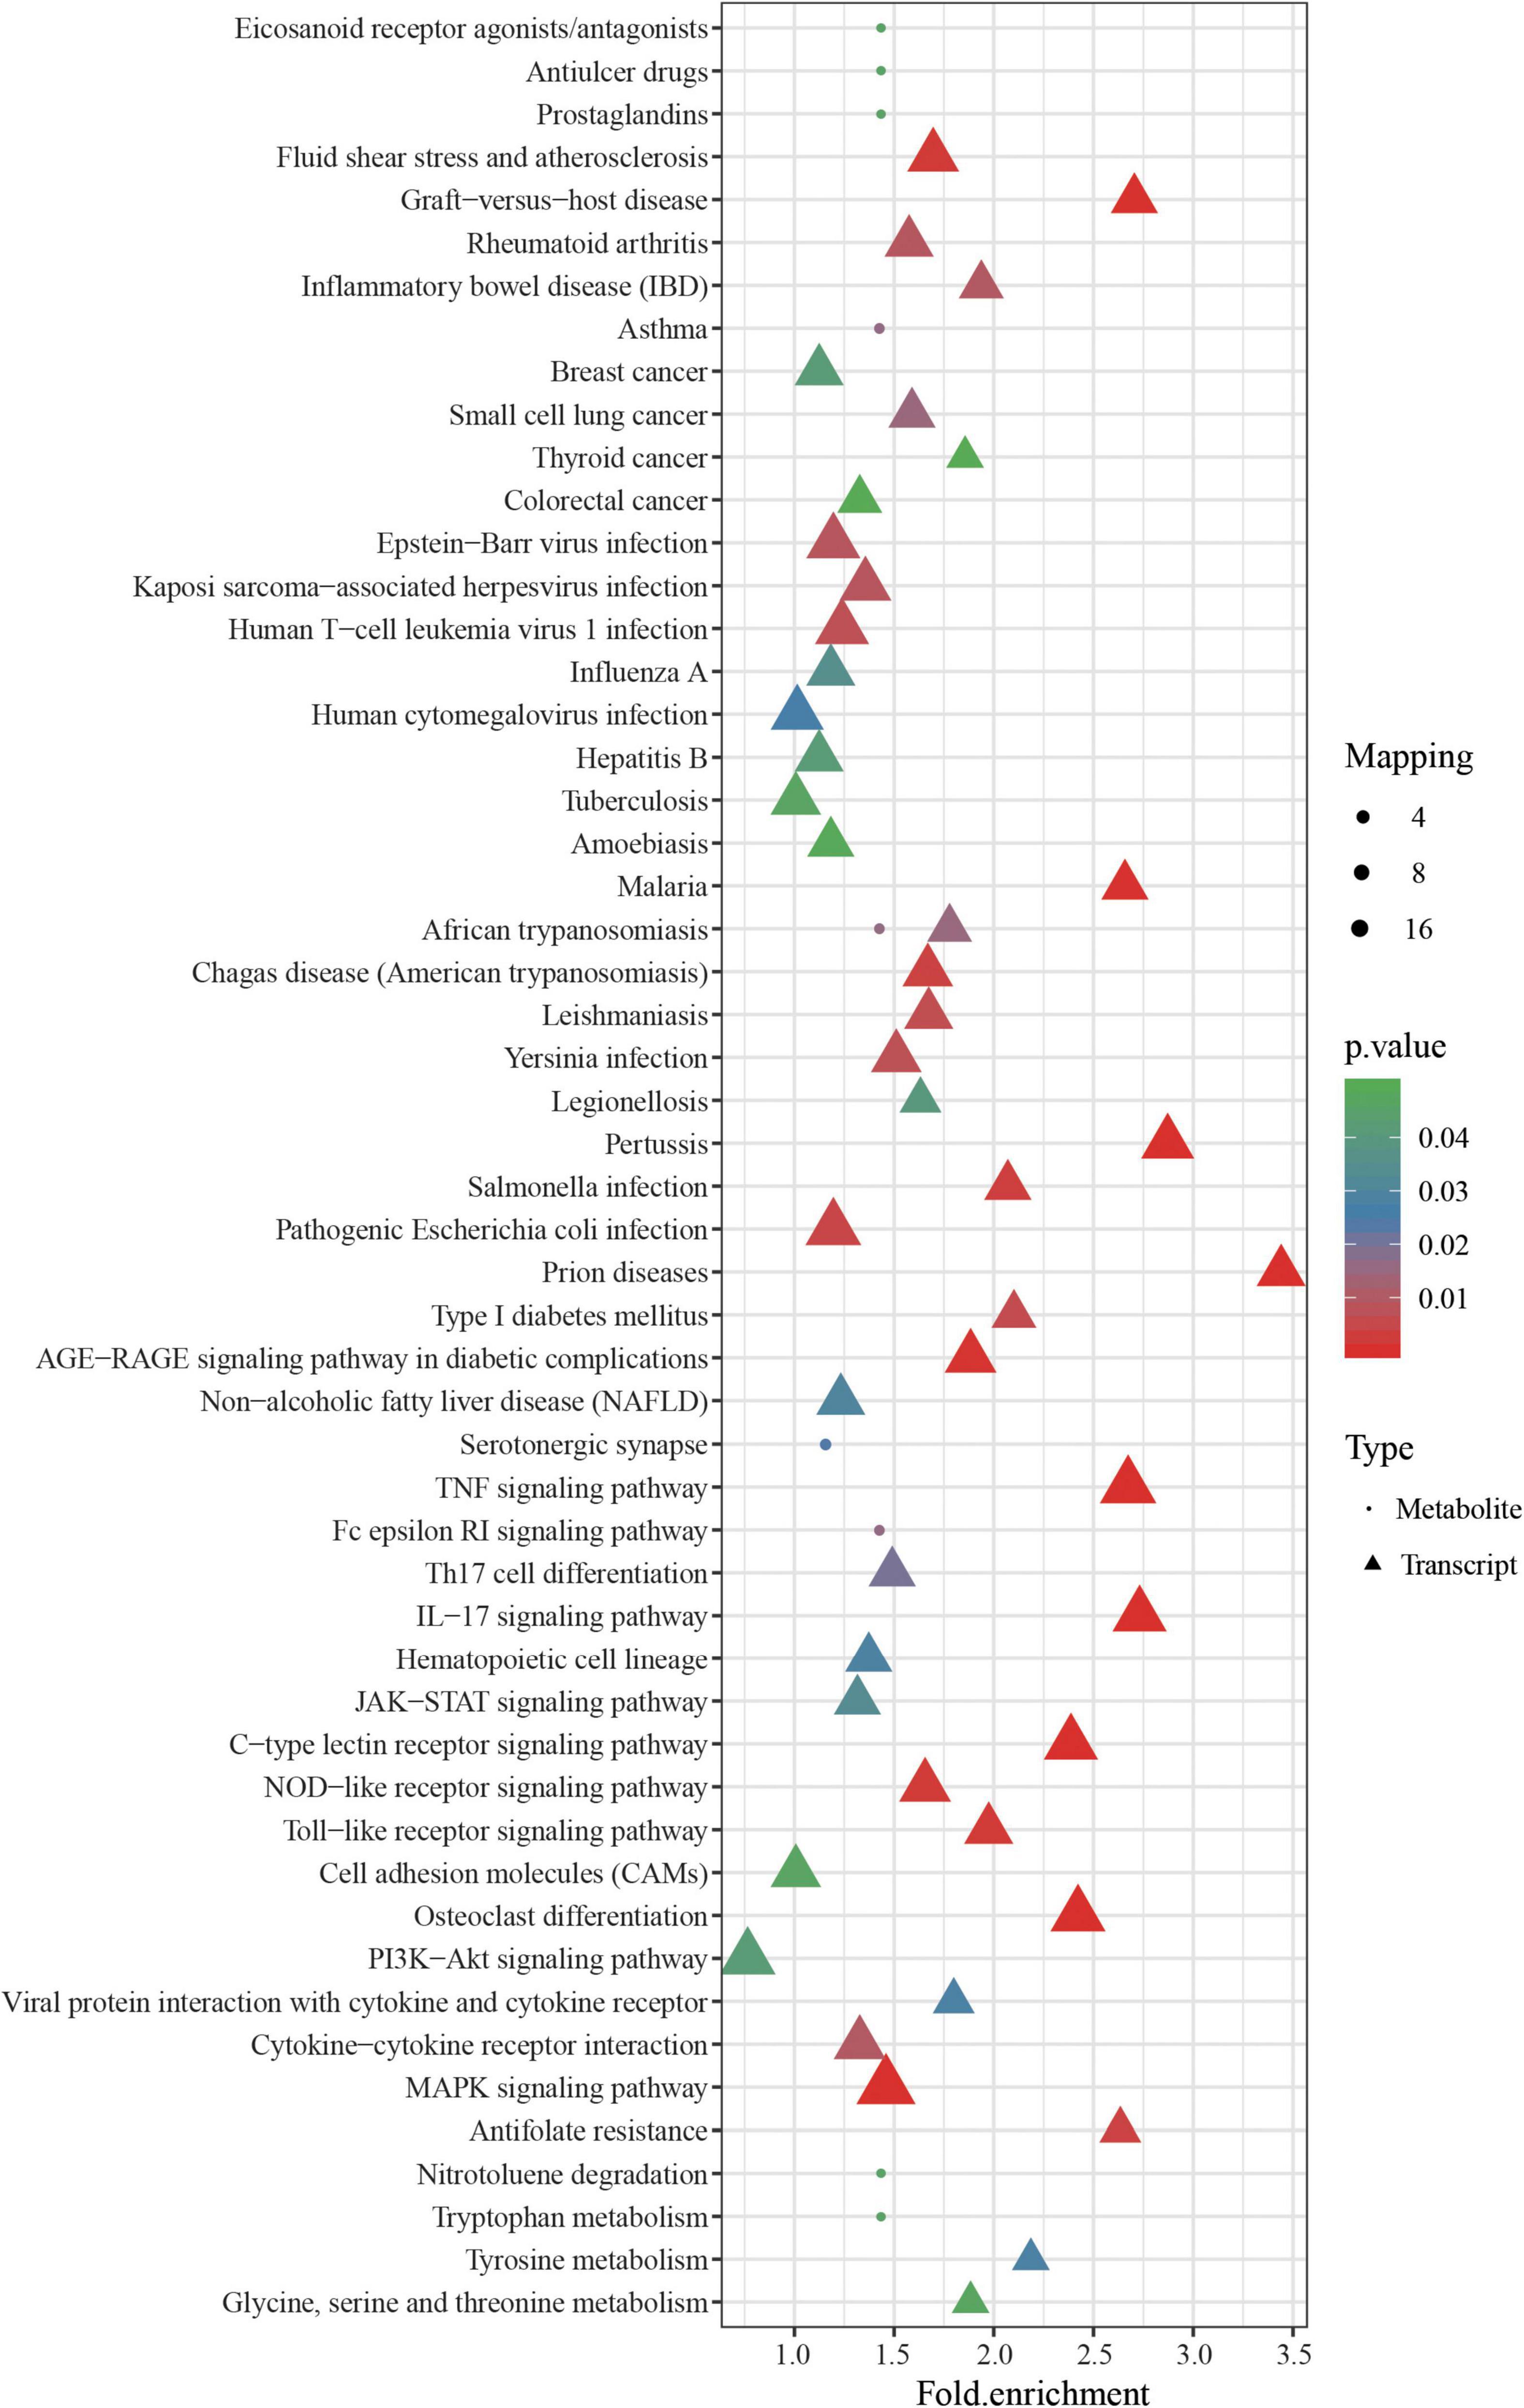
Figure 6. Pathway analysis of significantly different metabolites (SDMs) and DEGs from ZB and ZR groups. The X axis represents pathway enrichment, and the Y axis represents the pathway impact. Symbol point represents the metabolites and triangle showed the transcripts. Large sizes and dark colors of the two symbols represent the major pathway enrichment and high pathway impact values, respectively.
Discussion
Body coloration contributes to social behavior and environmental adaptation (Kelsh, 2004). Extensive efforts have been made to evaluate fish body color formation in model fishes, like zebrafish, and limited reports were exhibited to research the underlying mechanism in non-model fishes (Beirl et al., 2014; Nagao et al., 2014). De novo assembly of transcriptomes of two color morphs of P. leopardus using Trinity has been generated which obtained 38 candidate genes underlying the color patterns and pigmentation (Wang et al., 2015). A reference-based transcriptome was assembled for P. leopardus, providing DEGs associated with carotenoid metabolism between red and brown-colored leopard coral groupers (Yang et al., 2020). In the present study, a reference-based (Zhou et al., 2020) transcriptomic and metabolomic analysis of red and black colored leopard coral groupers were performed, which provided additional insights, beyond those obtained by the transcriptome analysis alone, including the identification of multiple genes associated with black and red-colored group and further differences in immune- and growth-related genes. A comprehensive scan of relationships between genes and metabolites provided key insights into body color formation.
Red Color Formation
Body coloration, especially yellow, orange, and red coloration, is a fundamental aspect of body color diversity in bluebirds and is often produced by diet-derived carotenoid pigments (Toomey et al., 2017). Carotenoids are a class of important bioactive substances frequently found in aquatic animals, such as Patinopecten yessoensis (Li et al., 2015). Carotenoids could strengthen the antioxidant ability, remove reactive oxygen species and free radicals, and enhance resistance to high temperatures in aquatic species and is therefore important for adaptation to changing environments (Babin et al., 2015; Meng et al., 2017). Carotenoids of different color morphs of P. leopardus have been identified including astaxanthin diester and monoester, as well as α-cryptoxanthin ester, tunaxanthin diester, adonixanthin diester, adonirubin ester, and adonirubin and tunaxanthin diester (Maoka et al., 2017). In the present transcriptome analysis, multiple genes involved in the uptake, transport, and absorption of carotenoids were up-regulated in the red-colored group compared with the black-colored group.
The de novo synthesis of carotenoids is difficult in fish, and the uptake and transport efficiency can affect carotenoid accumulation (Ho et al., 2013). During transport to the enterocyte, carotenoids can enter lipoproteins via FATP (Reboul, 2019). Red Chinook show higher FATP levels and improved lipid-mediated astaxanthin transport capacity than those of white fish (Madaro et al., 2020). The fatty acid hydroxylase (Faxdc2) could catalyze the hydroxylation of carotenoids, especially the conversion of β-carotene to zeaxanthin (Wu et al., 2014). Dhrs, a member of the short-chain dehydrogenase/reductase family, catalyzes the reversible oxidation/reduction of retinol and retinal and participates in xanthophore organization (Duester, 2000). Retinoid metabolizing enzyme-related genes are more highly expressed in orange-colored fish than in white clownfish (Salis et al., 2019). In the present study, FATP (Dxb_GLEAN_10019924), Faxdc2 (Dxb_GLEAN_10005589), and Dhrs (Trans_newGene_2068) levels were higher in the red-colored group that in the black-colored group, indicating that the red-colored group may show effective carotenoid transport and conservation. In addition, SCD (Dxb_GLEAN_10009389), a key regulator of lipid metabolism, may facilitate carotenoid accumulation (Li et al., 2015) and was expressed more highly in the red-colored group than in the black-colored group in the present study, emphasizing the efficient carotenoid transport and accumulation of the red-colored group.
Low-density lipoproteins (LDLs) are important carriers of carotenoids and LDL receptor-related protein (LDP) can bind to LDL (Harrison, 2019). LDLR is a glycoprotein membrane receptor involved in the storage, transport, and metabolism of carotenoids (Gong et al., 2011). In the present study, LDL and LDLR genes were not differentially expressed, however, the LDLR adapter 1 (Dxb_GLEAN_10003660) was identified as a DEG, with higher expression in the red-colored group, indicating its potential function in carotenoid metabolism. Cytochrome P450 and oxidoreductase on the carotenoid accumulation associated scaffolds can oxidize various structurally unrelated compounds and are involved in carotenoid metabolism (Du et al., 2017). In the present study, six oxidoreductase and five cytochrome P450 were identified as DEGs, with potential roles in pigment synthesis. In the yellow-colored skin of Maswa (Tropheus duboisi), a transcriptome analysis showed that some DEGs linked to pigment mobilization in xanthophores were involved in signaling, including rgs6, which encodes a regulator of RGS (Hooks et al., 2003), and two GTPase genes. In the present study, Four RGS and 15 GTPase genes were identified in a transcriptomic analysis, and showed their potential roles in body color formation. Differences in the expression of these genes may contribute to the accumulation of carotenoids and skin color differences in P. leopardus and the precise mechanism by which these genes function and interact requires further research.
Black Melanin Coloration
Black coloration is highly correlated with melanin synthesis-related genes in cichlids, and marine and freshwater sticklebacks (Greenwood et al., 2012; Henning et al., 2013). The synthesis of black melanin generally involved the tyrosinase gene family, including tyrosinase (TYR), TYRP1, and dopachrome tautomerase (DCT), which have been detected in fish melanophores and function in melanogenesis (Kwon, 1993). In the present study, tyrosinase gene family members (DCT and TYRP1) were up-regulated in the black-colored group compared with the red-colored group (Figure 7), consistent with the role of the gene family in the enzymatic conversion of tyrosine to melanin. DCT and TYRP1 are highly expressed in black Midas cichlids, consistent with the results of the present study (Henning et al., 2013). TYRP1 functions in pigmentation and color patterning, including the modulation and stabilization of tyrosinase catalytic activity, maintenance of melanosome structure, eumelanin synthesis, and melanocyte proliferation and death (Rad et al., 2004). The knockdown of TYRP1 in zebrafish and medaka results in the formation of brown instead of black eumelanin, accompanied by severe melanosome defects, and revealing the importance of TYRP1 in melanin (Braasch et al., 2009b). DCT is also expressed exclusively in melanophores and melanoblasts and encodes DCT, which functions in the catalysis of dopachrome into 5, 6-Dihydroxyindole-2-carboxylate (Lin et al., 2015). DCT is a key gene in salmonid melanogenesis and its knockout results in a diluted color phenotype (Sivka et al., 2013). DCT and Tyrp1b from Acipenseriformes gueldenstaedtii were significantly down-regulated in the skin of albino sturgeon with a decrease in melanin production (Gong et al., 2019). The down-regulated expression of tyrosinase gene family members (TYRP1 and DCT) and high tyrosine content suggest that melanin synthesis is weaker in the red-colored group than in the black-colored group (Figure 7).
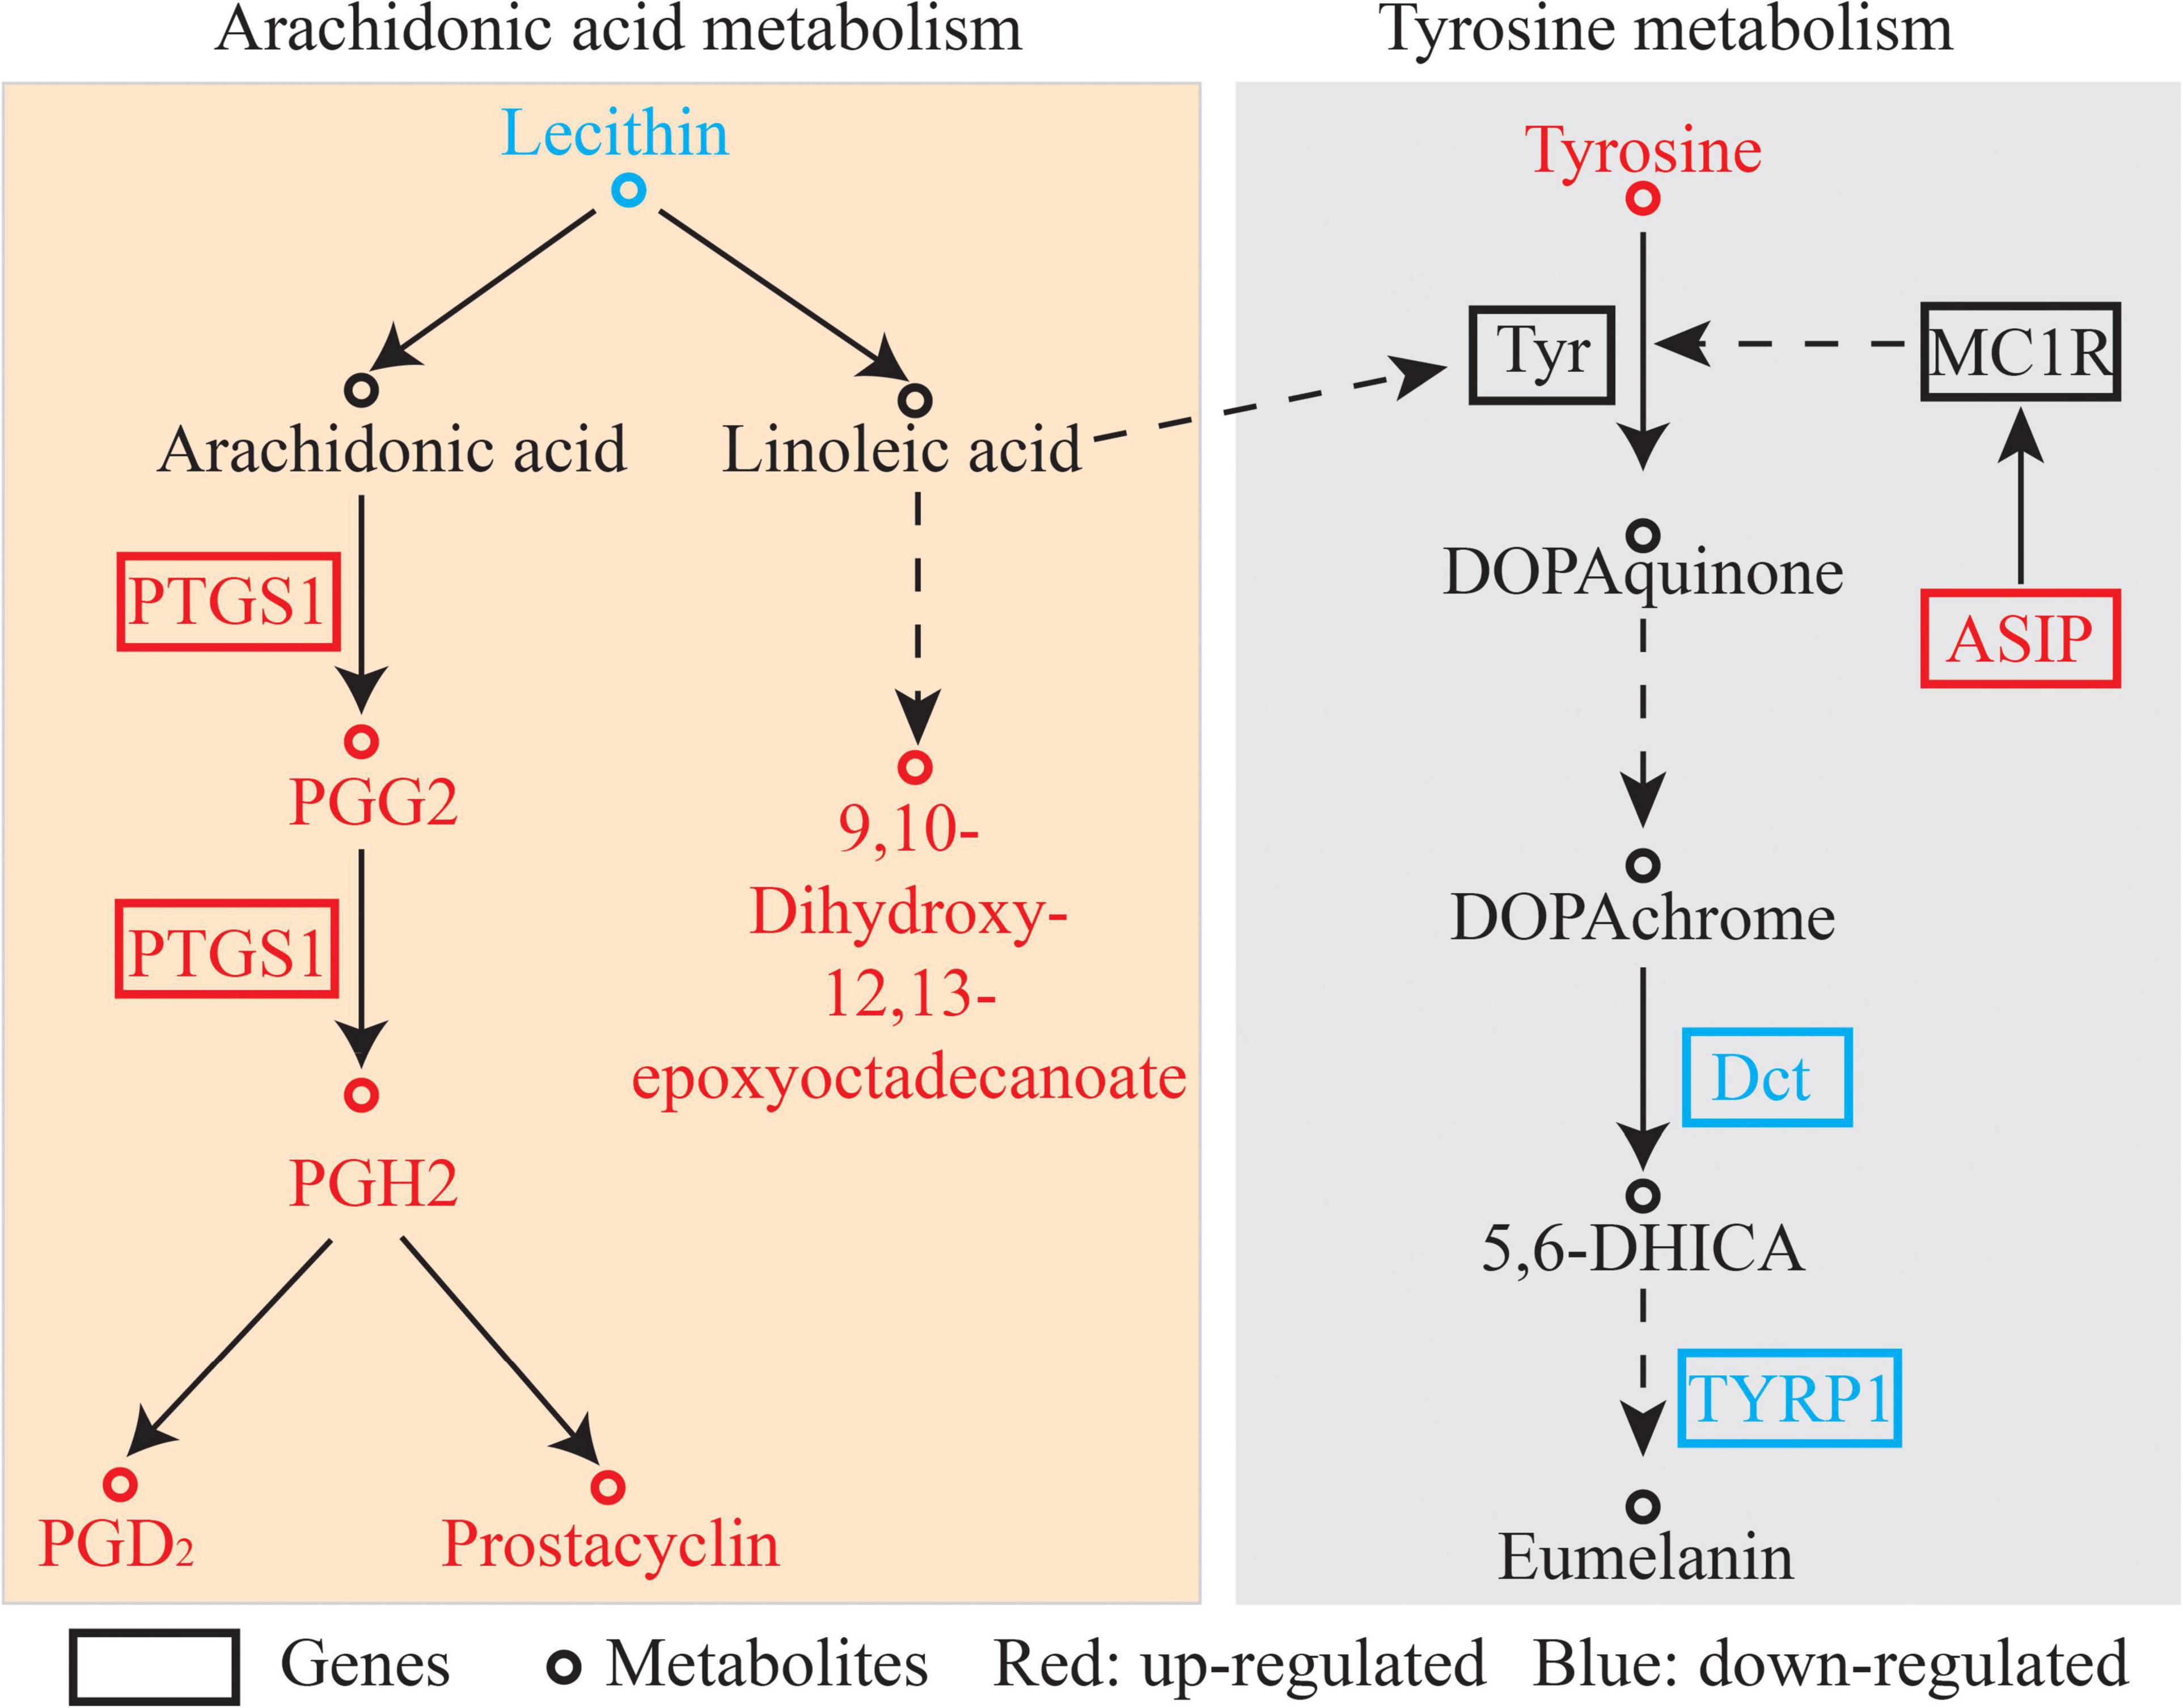
Figure 7. Pathway analysis of color enriched by transcriptome and metabolome. The differentially expressed gene abbreviations identified by the transcriptome analysis are shown in either red (highly expressed in the ZR group) or blue boxes (highly expressed in the ZB group). Differentially abundant metabolites identified by metabolome analysis are shown either in red (highly expressed in the ZR group) or blue letters (highly expressed in the ZB group).
Asip, an endogenous antagonist of alpha-melanocyte stimulating hormone (α-MSH) can block melanin synthesis by competing with α-MSH in binding to melanocortin 1 receptor (MC1R; Bian et al., 2019). Asip expression was higher in the red-colored group in the present study. α-MSH increases tyrosinase activity by activating the MC1R, a key gene in melanogenesis in animals. Therefore, melanin synthesis in the red-colored group was inhibited compared with that in the black-colored group.
Increased Consumption of Arachidonic Acid for Red-Colored Fish
Kyoto Encyclopedia of Genes and Genomes pathway analysis based on transcriptomics and metabolomics analyses indicated that DEGs and SDMs were significantly enriched in arachidonic acid metabolism pathways (Figure 7). Arachidonic acid is associated with malpigmentation and is negatively correlated with the pigmentation rate in flatfish (Bell et al., 2003). Arachidonic acid could mediate biochemical-induced stress relevant to pigmentation, and an appropriate concentration of arachidonic acid also induces the production of fucoxanthin, an important marine carotenoid (Zhang et al., 2017). In addition, linoleic acid, which can be transformed to arachidonic acid, could accelerate the depletion of tyrosinase and inhibit hyperpigmentation, both of which are crucial in pigment development (Ando et al., 1999, 2004). In the present study, genes encoding arachidonic acid metabolism-related enzymes, including prostaglandin-endoperoxide synthase 1, were more highly expressed in the red-colored group than in the black-colored group (3.7-fold change). At the same time, the prostacyclin, prostaglandin D2, and hepoxilin B3 contents were high in the red-colored group, and the lecithin content, which is the origin of arachidonate, was low in red-colored group. These results indicated that red-colored fish may consume more arachidonate for red body color formation.
Differences in Growth and Immune Activity
Carotenoids are a class of natural antioxidants widely found in aquatic animals; they have significant effects on growth, survival, and immunity (Meng et al., 2017). In the present study, multiple genes associated with growth were differentially expressed, indicating a growth difference in the fish. In addition, five interleukin genes showed significantly higher expression in the red-colored group which play vital roles in innate immunity. Multiple immune related DEGs indicated that the fish of different colors differed in immune activity. The upregulation of immune defense in melanic tissue has been reported in invertebrates (McGraw, 2005). Melanin pigments and the associated up-regulation of immune defense in the orange clownfish (Amphiprion percula) have been reported and held the wound-healing ability (Maytin et al., 2018). Differences in immunity and growth potential between the fish of two-color suggest that the morphs differ with respect to adaptation to the environment. Similar differences have been also reported in other species, including Chilean scallop (Wolff and Garrido, 1991), red tilapia (Pradeep et al., 2014), and Oujiang color common carp (Du et al., 2019). A comparative transcriptome analysis of Oujiang color common carp suggested that energy metabolism-related genes are strongly associated with environmental adaption and growth performance and likely affect red and white color formation (Du et al., 2019). Red tilapia has been gaining in popularity owing to its very fast growth, the absence of a black peritoneum, salinity tolerance, and adaptability to any culture system (Pradeep et al., 2014; Zhu et al., 2016).
Conclusion
Transcriptomic and LC-MS-based metabolomic analyses were performed to evaluate differences between black-colored and red-colored group of P. leopardus. Potential mechanisms underlying color diversity in P. leopardus were determined. Integrative analyses showed that the red-colored group possessed high carotenoid transport and conversion activities. The black-colored group showed greater melanin synthesis activity. On the other hand, the red-colored group exhibited greater arachidonic acid digestion compared with those in the black-colored group. This study provides important insight into the key genes and pathways contributing to variation in fish body color formation and further research focused on the roles of genes related to body color formation is needed.
Data Availability Statement
The transcriptome raw data presented in the study are deposited in the Sequence Read Archive (SRA) of the NCBI with the dataset identifier SRP329031 (including SRR15195628, SRR15195629, SRR15195630, SRR15195631, SRR15195632, and 15195633). The accession number is PRJNA748152.
Ethics Statement
The animal study was reviewed and approved by the respective Animal Care and Use Committee of Guangdong Ocean University, China.
Author Contributions
GL designed the research. XZ and RH conducted the research, analyzed the data, and wrote the manuscript. CT, JZ, and CZ contributed to the final writing of the manuscript. All authors have read and approved the final manuscript.
Funding
This work was supported by the Southern Marine Science and Engineering Guangdong Laboratory (Zhanjiang) (Grant No. ZJW-2019-06); Jieyang City Science and Technology Plan Project (Grant No. 2019066); and Southern Marine Science and Engineering Guangdong Laboratory (Zhanjiang) Youth Fund Research Project.
Conflict of Interest
The authors declare that the research was conducted in the absence of any commercial or financial relationships that could be construed as a potential conflict of interest.
Publisher’s Note
All claims expressed in this article are solely those of the authors and do not necessarily represent those of their affiliated organizations, or those of the publisher, the editors and the reviewers. Any product that may be evaluated in this article, or claim that may be made by its manufacturer, is not guaranteed or endorsed by the publisher.
Supplementary Material
The Supplementary Material for this article can be found online at: https://www.frontiersin.org/articles/10.3389/fmars.2021.726102/full#supplementary-material
Supplementary Figure 1 | Coral trout grouper Plectropomus leopardus of different color.
Supplementary Figure 2 | Integrated analysis of DEGs and SDMs of ZR and ZB groups. Blue frame represented the number of transcripts and orange frame showed the number of metabolites.
Footnotes
- ^ http://www.massbank.jp/
- ^ http://kanaya.naist.jp/KNApSAcK/
- ^ http://www.hmdb.ca/
- ^ http://metlin.scripps.edu/index.php
References
Ando, H., Funasaka, Y., Oka, M., Ohashi, A., Furumura, M., Matsunaga, J., et al. (1999). Possible involvement of proteolytic degradation of tyrosinase in the regulatory effect of fatty acids on melanogenesis. J. Lipid Res. 40, 1312–1316. doi: 10.1016/s0022-2275(20)33493-3
Ando, H., Watabe, H., Valencia, J. C., Yasumoto, K., Furumura, M., Funasaka, Y., et al. (2004). Fatty acids regulate pigmentation via proteasomal degradation of tyrosinase: a new aspect of ubiquitin-proteasome function. J. Biol. Chem. 279, 15427–15433. doi: 10.1074/jbc.m313701200
Babin, A., Saciat, C., Teixeira, M., Troussard, J. P., Motreuil, S., Moreau, J., et al. (2015). Limiting immunopathology: interaction between carotenoids and enzymatic antioxidant defences. Dev. Comp. Immunol. 49, 278–281. doi: 10.1016/j.dci.2014.12.007
Bar, I., Kaddar, E., Velan, A., and David, L. (2013). Melanocortin receptor 1 and black pigmentation in the Japanese ornamental carp (Cyprinus carpio var. Koi). Front. Genet. 4:6.
Beirl, A. J., Linbo, T. H., Cobb, M. J., and Cooper, C. D. (2014). Oca2 Regulation of chromatophore differentiation and number is cell type specific in zebrafish. Pigment Cell Melanoma Res. 27, 178–189. doi: 10.1111/pcmr.12205
Bell, J. G., McEvoy, L. A., Estevez, A., Shields, R. J., and Sargent, J. R. (2003). Optimising lipid nutrition in first-feeding flatfish larvae. Aquaculture 227, 211–220. doi: 10.1016/s0044-8486(03)00504-0
Bertolesi, G. E., Atkinson-Leadbeater, K., Mackey, E. M., Song, Y. N., Heyne, B., and McFarlane, S. (2020). The regulation of skin pigmentation in response to environmental light by pineal Type II opsins and skin melanophore melatonin receptors. J. Photochem. Photobiol. B 212:112024. doi: 10.1016/j.jphotobiol.2020.112024
Bian, F., Yang, X., Ou, Z., Luo, J., Tan, B., Yuan, M., et al. (2019). Morphological characteristics and comparative transcriptome analysis of three different phenotypes of Pristella maxillaris. Front. Genet. 10:698.
Braasch, I., Brunet, F., Volff, J. N., and Schartl, M. (2009a). Pigmentation pathway evolution after whole-genome duplication in fish. Genome Biol. Evol. 1, 479–493. doi: 10.1093/gbe/evp050
Braasch, I., Liedtke, D., Volff, J. N., and Schartl, M. (2009b). Pigmentary function and evolution of tyrp1 gene duplicates in fish. Pigment Cell Melanoma Res. 22, 839–850. doi: 10.1111/j.1755-148x.2009.00614.x
Du, J., Chen, X., Wang, J., Chen, H., Yue, W., Lu, G., et al. (2019). Comparative skin transcriptome of two Oujiang color common carp (Cyprinus carpio var. color) varieties. Fish Physiol. Biochem. 45, 177–185. doi: 10.1007/s10695-018-0551-8
Du, X., Song, K., Wang, J., Cong, R., Li, L., and Zhang, G. (2017). Draft genome and SNPs associated with carotenoid accumulation in adductor muscles of bay scallop (Argopecten irradians). J. Genomics 5, 83–90. doi: 10.7150/jgen.19146
Ducrest, A. L., Keller, L., and Roulin, A. (2008). Pleiotropy in the melanocortin system, coloration and behavioural syndromes. Trends Ecol. Evol. 23, 502–510. doi: 10.1016/j.tree.2008.06.001
Duester, G. (2000). Families of retinoid dehydrogenases regulating vitamin A function. Eur. J. Biochem. 267, 4315–4324. doi: 10.1046/j.1432-1327.2000.01497.x
Fraga, C. G., Clowers, B. H., Moore, R. J., and Zink, E. M. (2010). Signature-Discovery Approach for Sample Matching of Nerve-Agent Precursorusing Liquid Chromatography-Mass Spectrometry, XCMS, and Chemometrics. Anal. Chem. 82, 4165–4173. doi: 10.1021/ac1003568
Gong, X., Marisiddaiah, R., Afeld, J., Wiener, D., and Rubin, L. P. (2011). Functional role of xanthophyll metabolism related genes in human retinal pigment epithelial cells. Faseb. J. 2011:25.
Gong, Y., Hu, M., Xu, S., Wang, B., Wang, C., Mu, X., et al. (2019). Comparative transcriptome analysis reveals expression signatures of albino Russian sturgeon, Acipenseriformes gueldenstaedtii. Mar. Genom. 46, 1–7. doi: 10.1016/j.margen.2019.02.004
Gracey, A. Y., and Connor, K. (2016). Transcriptional and metabolomic characterization of spontaneous metabolic cycles in Mytilus californianus, under subtidal conditions. Mar. Genom. 30, 35–41. doi: 10.1016/j.margen.2016.07.004
Greenwood, A. K., Cech, J. N., and Peichel, C. L. (2012). Molecular and developmental contributions to divergent pigment patterns in marine and freshwater sticklebacks. Evol. Dev. 14, 351–362. doi: 10.1111/j.1525-142x.2012.00553.x
Hao, R., Du, X., Yang, C., Deng, Y., Zheng, Z., and Wang, Q. (2019). Integrated application of transcriptomics and metabolomics provides insights into unsynchronized growth in pearl oyster Pinctada fucata martensii. Sci. Total Environ. 666, 46–56. doi: 10.1016/j.scitotenv.2019.02.221
Hao, R., Wang, Z., Yang, C., Deng, Y., Zheng, Z., Wang, Q., et al. (2018). Metabolomic responses of juvenile pearl oyster Pinctada maxima to different growth performances. Aquaculture 491, 258–265. doi: 10.1016/j.aquaculture.2018.03.050
Harrison, E. H. (2019). Mechanisms of Transport and Delivery of Vitamin A and Carotenoids to the Retinal Pigment Epithelium. Mol. Nutr. Food Res. 63, e1801046.
Henning, F., Jones, J. C., Franchini, P., and Meyer, A. (2013). Transcriptomics of morphological color change in polychromatic Midas cichlids. BMC Genomics 14:171. doi: 10.1186/1471-2164-14-171
Ho, A. L. F. C., O Shea, S. K., and Pomeroy, H. F. (2013). Dietary esterified astaxanthin effects on color, carotenoid concentrations, and compositions of clown anemonefish, Amphiprion ocellaris, skin. Aquacult. Int. 21, 361–374. doi: 10.1007/s10499-012-9558-9
Hooks, S. B., Waldo, G. L., Corbitt, J., Bodor, E. T., Krumins, A. M., and Harden, T. K. (2003). RGS6, RGS7, RGS9, and RGS11 stimulate GTPase activity of Gi family G-proteins with differential selectivity and maximal activity. J. Biol. Chem. 278, 10087–10093. doi: 10.1074/jbc.m211382200
Huang, J., Zhong, R., Yang, C., Wang, Q., Liao, Y., and Deng, Y. (2021). Dietary carbohydrate and protein levels affect the growth performance of juvenile peanut worm (Sipunculus nudus): an LC-MS-based metabolomics study. Front. Mar. Sci. 8:702101.
Jiang, Y., Zhang, S., Xu, J., Feng, J., Mahboob, S., Al-Ghanim, K. A., et al. (2014). Comparative transcriptome analysis reveals the genetic basis of skin color variation in common carp. PLoS One 9:e108200. doi: 10.1371/journal.pone.0108200
Kelsh, R. N. (2004). Genetics and evolution of pigment patterns in fish. Pigment Cell Res. 17, 326–336. doi: 10.1111/j.1600-0749.2004.00174.x
Kwon, B. S. (1993). Pigmentation genes: the tyrosinase gene family and the pmel 17 gene family. J. Invest. Dermatol. 100, 134S–140S.
Li, B., Song, K., Meng, J., Li, L., and Zhang, G. (2017). Integrated application of transcriptomics and metabolomics provides insights into glycogen content regulation in the pacific oyster Crassostrea gigas. BMC Genomics 18:713.
Li, K., Zhao, N., Zhang, B., Jia, L., Liu, K., Wang, Q., et al. (2020). Identification and characterization of the melanocortin 1 receptor gene (MC1R) in hypermelanistic Chinese tongue sole (Cynoglossus semilaevis). Fish Physiol. Biochem. 46, 881–890. doi: 10.1007/s10695-019-00758-8
Li, X., Ning, X., Dou, J., Yu, Q., Wang, S., Zhang, L., et al. (2015). An SCD gene from the Mollusca and its upregulation in carotenoid-enriched scallops. Gene 564, 101–108. doi: 10.1016/j.gene.2015.02.071
Lin, C. C., Yang, C. H., Lin, Y. J., Chiu, Y. W., and Chen, C. Y. (2015). Establishment of a melanogenesis regulation assay system using a fluorescent protein reporter combined with the promoters for the melanogenesis-related genes in human melanoma cells. Enzyme Microb. Technol. 68, 1–9. doi: 10.1016/j.enzmictec.2014.09.008
Lutfiyah, L., Budi, D. S., and Ulkhaq, M. F. (2019). The growth and survival rate of the larvae of the sunu grouper (Plectropomus leopardus) in different temperatures. IOP Conf. Ser. Earth Env. Sci. 236:12009.
Madaro, A., Torrissen, O., Whatmore, P., Lall, S. P., Schmeisser, J., Verlhac, T. V., et al. (2020). Red and White Chinook Salmon (Oncorhynchus tshawytscha): Differences in the Transcriptome Profile of Muscle. Liver, and Pylorus. Mar. Biotechnol. 22, 581–593. doi: 10.1007/s10126-020-09980-5
Maoka, T., Sato, W., Nagai, H., and Takahashi, T. (2017). Carotenoids of red, brown, and black specimens of Plectropomus leopardus, the coral trout (Suziara in Japanese). J. Oleo Sci. 66, 579–584. doi: 10.5650/jos.ess16179
Maytin, A. K., Davies, S. W., Smith, G. E., Mullen, S. P., and Buston, P. M. (2018). De novo transcriptome assembly of the clown anemonefish (Amphiprion percula): A new resource to study the evolution of fish color. Front. Mar. Sci. 5:284.
McGraw, K. J. (2005). The antioxidant function of many animal pigments: are there consistent health benefits of sexually selected colourants? Anim. Behav. 69, 757–764. doi: 10.1016/j.anbehav.2004.06.022
Meng, Z., Zhang, B., Liu, B., Li, H., Fan, S., and Yu, D. (2017). High carotenoids content can enhance resistance of selected Pinctada fucata families to high temperature stress. Fish Shellfish Immunol. 61, 211–218. doi: 10.1016/j.fsi.2016.12.032
Nagao, Y., Suzuki, T., Shimizu, A., Kimura, T., Seki, R., Adachi, T., et al. (2014). Sox5 functions as a fate switch in medaka pigment cell development. PLoS Genet. 10:e1004246. doi: 10.1371/journal.pgen.1004246
Ng’Oma, E., Groth, M., Ripa, R., Platzer, M., and Cellerino, A. (2014). Transcriptome profiling of natural dichromatism in the annual fishes Nothobranchius furzeri and Nothobranchius kadleci. BMC Genomics 15:754. doi: 10.1186/1471-2164-15-754
Parichy, D. M., and Johnson, S. L. (2001). Zebrafish hybrids suggest genetic mechanisms for pigment pattern diversification in Danio. Dev. Genes Evol. 211, 319–328. doi: 10.1007/s004270100155
Pradeep, P. J., Srijaya, T. C., Hassan, A., Chatterji, A. K., and Jeffs, A. (2014). Optimal conditions for cold-shock induction of triploidy in red tilapia. Aquacult. Int. 22, 1163–1174. doi: 10.1007/s10499-013-9736-4
Pratchett, M. S., Cameron, D. S., Donelson, J., Evans, L., Frisch, A. J., Hobday, A. J., et al. (2017). Effects of climate change on coral grouper (Plectropomus spp.) and possible adaptation options. Rev. Fish Biol. Fisher. 27, 1–20. doi: 10.1007/978-3-642-40455-9_66-2
Rad, H. H., Yamashita, T., Jin, H. Y., Hirosaki, K., Wakamatsu, K., Ito, S., et al. (2004). Tyrosinase-related proteins suppress tyrosinase-mediated cell death of melanocytes and melanoma cells. Exp. Cell Res. 298, 317–328. doi: 10.1016/j.yexcr.2004.04.045
Reboul, E. (2019). Mechanisms of Carotenoid Intestinal Absorption: Where Do We Stand? Nutrients 11:838. doi: 10.3390/nu11040838
Rondon, R., Akcha, F., Alonso, P., Menard, D., Rouxel, J., Montagnani, C., et al. (2016). Transcriptional changes in Crassostrea gigas oyster spat following a parental exposure to the herbicide diuron. Aquat. Toxicol. 175, 47–55. doi: 10.1016/j.aquatox.2016.03.007
Salis, P., Lorin, T., Lewis, V., Rey, C., Marcionetti, A., Escande, M. L., et al. (2019). Developmental and comparative transcriptomic identification of iridophore contribution to white barring in clownfish. Pigment Cell Melanoma Res. 32, 391–402. doi: 10.1111/pcmr.12766
Setiawati, K. M., Mahardika, K., Alit, A. A. K., Kusumawati, D., and Mastuti, I. (2017). Growth and blood profile of coral trout grouper Plectropomus leopardus seeds in different salinities. Jurnal Ilmu dan Teknologi Kelautan Tropis 9:557. doi: 10.29244/jitkt.v9i2.19290
Shawkey, M. D., Balenger, S. L., Hill, G. E., Johnson, L. S., Keyser, A. J., and Siefferman, L. (2006). Mechanisms of evolutionary change in structural plumage coloration among bluebirds (Sialia spp.). J. R. Soc. Interface 3, 527–532. doi: 10.1098/rsif.2006.0111
Sivka, U., Snoj, A., Palandacic, A., and Susnik, B. S. (2013). Identification of candidate genes involved in marble color pattern formation in genus Salmo. Comp. Biochem. Physiol. Part D Genom. Prot. 8, 244–249. doi: 10.1016/j.cbd.2013.06.003
Sturm, R. A. (2006). A golden age of human pigmentation genetics. Trends Genet. 22, 464–468. doi: 10.1016/j.tig.2006.06.010
Sun, S. M., Guo, Z. B., Fu, H. T., Zhu, J., and Ge, X. P. (2018). Integrated metabolomic and transcriptomic analysis of brain energy metabolism in the male Oriental river prawn (Macrobrachium nipponense) in response to hypoxia and reoxygenation. Environ. Pollut. 243(Pt B), 1154–1165. doi: 10.1016/j.envpol.2018.09.072
Toomey, M. B., Lopes, R. J., Araujo, P. M., Johnson, J. D., Gazda, M. A., Afonso, S., et al. (2017). High-density lipoprotein receptor SCARB1 is required for carotenoid coloration in birds. Proc. Natl. Acad. Sci. U S A 114, 5219–5224. doi: 10.1073/pnas.1700751114
Wang, J. G., Hou, X., Chen, X. W., Zhang, K. J., Wang, J., and Wang, C. H. (2021). Comprehensive analysis of metabolomics and transcriptomics provides insights into growth difference of juvenile Eriocheir sinensis during the molting cycle. Aquaculture 539, 736661. doi: 10.1016/j.aquaculture.2021.736661
Wang, L., Yu, C., Guo, L., Lin, H., and Meng, Z. (2015). In silico comparative transcriptome analysis of two color morphs of the common coral trout (Plectropomus Leopardus). PLoS One 10:e145868.
Wang, Q., Liu, Y., Zheng, Z., Deng, Y., Jiao, Y., and Du, X. (2018). Adaptive response of pearl oyster Pinctada fucata martensii to low water temperature stress. Fish Shellfish Immunol. 78, 310–315. doi: 10.1016/j.fsi.2018.04.049
Wolff, M., and Garrido, J. P. (1991). Comparative study of growth and survival of two color morphs of the Chilean scallop Argopecten purpuratus Lamarck (1819) in suspended culture. J. Shellfish Res. 10, 47–53.
Wu, J., Ji, J., Wang, G., Li, Z., Diao, J., and Wu, G. (2014). Cloning and characterization of a novel beta-carotene hydroxylase gene from Lycium barbarum and its expression in Escherichia coli. Biotechnol. Appl. Biochem. 61, 637–645. doi: 10.1002/bab.1224
Xia, S., Sun, J., Li, M., Zhao, W., and Wu, B. (2019). Influence of dietary protein level on growth performance, digestibility and activity of immunity-related enzymes of leopard coral grouper, Plectropomus leopardus (Lacépède, 1802). Aquacult. Nutr. 26, 242–247. doi: 10.1111/anu.12985
Xu, G. C., Du, F. K., Yan, L., Nie, Z. J., and Xu, P. (2016). Integrated application of transcriptomics and metabolomics yields insights into population-asynchronous ovary development in Coilia nasus. Sci. Rep. 6:31835.
Yang, C., Du, X., Hao, R., Wang, Q., Deng, Y., and Sun, R. (2019). Effect of vitamin D3 on immunity and antioxidant capacity of pearl oyster Pinctada fucata martensii after transplantation: Insights from LC-MS-based metabolomics analysis. Fish Shellfish Immun. 94, 271–279. doi: 10.1016/j.fsi.2019.09.017
Yang, C., Hao, R., Du, X., Wang, Q., Deng, Y., Sun, R., et al. (2018). GC-TOF/MS-based metabolomics studies on the effect of protein sources in formulated diet for pearl oyster Pinctada fucata martensii. Aquaculture 486, 139–147. doi: 10.1016/j.aquaculture.2017.12.020
Yang, Y., Wu, L. N., Chen, J. F., Wu, X., Xia, J. H., Meng, Z. N., et al. (2020). Whole-genome sequencing of leopard coral grouper (Plectropomus leopardus) and exploration of regulation mechanism of skin color and adaptive evolution. Zool. Res. 41, 328–340. doi: 10.24272/j.issn.2095-8137.2020.038
Zhang, J., Xiong, X., Deng, Y., Zheng, Z., Yang, C., and Du, X. (2021). Integrated application of transcriptomics and metabolomics provides insights into the larval metamorphosis of pearl oyster (Pinctada fucata martensii). Aquaculture 532:736067. doi: 10.1016/j.aquaculture.2020.736067
Zhang, Y., Liu, J., Peng, L., Ren, L., Zhang, H., Zou, L., et al. (2017). Comparative transcriptome analysis of molecular mechanism underlying gray-to-red body color formation in red crucian carp (Carassius auratus, red var.). Fish Physiol. Biochem. 43, 1387–1398. doi: 10.1007/s10695-017-0379-7
Zhou, Q., Guo, X., Huang, Y., Gao, H., Xu, H., Liu, S., et al. (2020). De novo sequencing and chromosomal-scale genome assembly of leopard coral grouper. Plectropomus leopardus. Mol. Ecol. Resour. 20, 1403–1413. doi: 10.1111/1755-0998.13207
Keywords: body color, transcriptomics, metabolomics, pigment, Plectropomus leopardus
Citation: Zhu X, Hao R, Tian C, Zhang J, Zhu C and Li G (2021) Integrative Transcriptomics and Metabolomics Analysis of Body Color Formation in the Leopard Coral Grouper (Plectropomus leopardus). Front. Mar. Sci. 8:726102. doi: 10.3389/fmars.2021.726102
Received: 16 June 2021; Accepted: 16 July 2021;
Published: 10 August 2021.
Edited by:
Youji Wang, Shanghai Ocean University, ChinaReviewed by:
Jian-An Xian, Institute of Tropical Bioscience and Biotechnology, ChinaJun Qiang, Freshwater Fisheries Research Center (CAFS), China
Copyright © 2021 Zhu, Hao, Tian, Zhang, Zhu and Li. This is an open-access article distributed under the terms of the Creative Commons Attribution License (CC BY). The use, distribution or reproduction in other forums is permitted, provided the original author(s) and the copyright owner(s) are credited and that the original publication in this journal is cited, in accordance with accepted academic practice. No use, distribution or reproduction is permitted which does not comply with these terms.
*Correspondence: Guangli Li, ligl@gdou.edu.cn
†These authors have contributed equally to this work