
95% of researchers rate our articles as excellent or good
Learn more about the work of our research integrity team to safeguard the quality of each article we publish.
Find out more
ORIGINAL RESEARCH article
Front. Mar. Sci. , 28 October 2021
Sec. Marine Fisheries, Aquaculture and Living Resources
Volume 8 - 2021 | https://doi.org/10.3389/fmars.2021.725628
This article is part of the Research Topic Mollusk Breeding and Genetic Improvement View all 25 articles
 Xue Wang1
 Weijun Wang1*
 Zan Li1Guohua Sun1Tao Xu2Xiaohui Xu1Yanwei Feng1Qihao Luo1Bin Li1,3
 Jianmin Yang1,3*
Glycogen content is a quantitative trait, its phenotype differences are found between individual oysters due to genetic effects and environmental factors which were including food, water temperature, salinity, and so on. In this study, a full sibling family of Pacific oyster Crassostrea gigas showed different phenotypes with high and low glycogen content between South Huanghai Sea (Rizhao offshore area, RZ) and North Huanghai Sea (Kongtong Dao area, KTD), respectively. At the same time, the content of 11 glucogenic amino acids and 13 fatty acids were also significant differences between RZ and KTD. RNA-seq and small RNA-seq technologies were used for transcriptome sequencing and functional enrichment analysis of differentially expressed RNA were used by Gene Ontology (GO) and Kyoto Encyclopedia of Genes and Genomes (KEGG) pathway. A total of 2,084 mRNAs, 1,080 long non-coding RNAs (lncRNAs), 34 circular RNAs (circRNAs), and 7 microRNAs (miRNAs) were differentially expressed. Based on these differentially expressed genes (DEGs), miRNA target interactions (lncRNA/circRNA–miRNA pairs and miRNA–mRNA pairs) were predicted using the miRanda software. The differentially expressed mRNAs in this network were mainly shown to be involved in calcium signaling pathway and insulin signaling pathway. These findings could help to speculate that environmental factors may be epigenetically regulated by non-coding RNA in C. gigas, thereby further affecting glycogen content.
Pacific oyster (Crassostrea gigas) has the characteristics of strong adaptability to the external environment, fast growth, high yield, rich nutrition, and delicious flavor. Therefore, it is widely cultivated worldwide as a high-economic value aquatic product. At present, the improvement of oyster meat quality is one of the important research topics for its industrial development, because the quality of meat is often measured by people’s basic sensory evaluation of taste. Glycogen content accounts for 20–40% of the dry weight of oysters, which directly affects the taste of oysters and is an important quality trait. Previous studies have found that on the one hand, the content of glycogen metabolism-related enzymes directly affects the changes in glycogen content (Hata et al., 1993), on the other hand, the metabolic level of amino acids and fatty acids also affects glycogen metabolism (Randle et al., 1963; Fromentin et al., 2011). Therefore, genetic and environmental factors (temperature, nutrition, salinity, etc.) may affect the glycogen content (Li et al., 2017b). At present, several key genes that have been cloned in the oyster glycogen metabolism pathway, such as: glycogen phosphorylase (Hata et al., 1993), phosphoglucomutase (Tanguy et al., 2006), glycogen synthase kinase (Zeng et al., 2013), glycogenin (Li et al., 2017a), protein phosphatase 1 regulatory subunit 3B (Liu et al., 2019), etc. Glycogen content fluctuates seasonally with gonad development, and glycogen-related genes express differences in different seasons and tissues (Bacca et al., 2005). And the increase of free fatty acid content could lead to reduce the consumption of glycogen. Similarly, high amino acid content also might increase glycogen content, because some amino acids could guide glycogen synthesis (Li et al., 2017b).
With the development of sequencing technology and the continuous improvement of the genome project, the human genome sequencing revealed that there are only about 20,000 protein-coding genes, and the proportion of the total genome sequence is <2%, and the remaining about 98% belong to non-coding RNA (ncRNA) (Chan and Tay, 2018). At present, ncRNA is divided into two types: housekeeping ncRNA and regulatory ncRNA. The common regulatory ncRNAs include microRNA (miRNA), long non-coding RNA (lncRNA), and circular RNA (circRNA). Studies have found that regulatory ncRNA is involved in the larval metamorphosis, shell pigmentation, and immune-related mechanisms (Yu et al., 2016; Feng et al., 2018). However, whether ncRNA mediates the genetic mechanism that causes changes in glycogen content due to environmental factors is still unknown.
Therefore, in order to increase our understanding of the regulation of glycogen content, we performed ncRNA transcriptome analysis. During the research process, we placed a full sibling family of C. gigas in two offshore areas and produced two different phenotypes: high glycogen content and low glycogen content. The gonads of individuals with high and low glycogen content were selected for analysis. These findings may help us to further understand the regulatory effects of ncRNA on glycogen content in different environments, and provide new information for future genetic breeding of C. gigas in aquaculture.
In this study, all experiments were performed according to local and central government regulations. No endangered species were used in the study. No special permission was required to collect oysters or to perform the described experiments.
In this study, we used a near-infrared (NIR) model (Wang et al., 2015) which constructed in our laboratory to determine the phenotypic value of the glycogen content of C. gigas. The families with high breeding value were selected through EBV calculation, and comprehensively consider the genetic relationship between families (the genetic relationship is less than 0.2) which could prevent the occurrence of inbreeding decline. During the oyster breeding season, the phenotypic value of glycogen content of the parents of each candidate family was determined by a NIR spectrometer (MicroNIR 1700 JDSU, United States) on site, and the male and female individuals with high glycogen content between each family were selected. Through mating between families, male and female parents from different families were fertilized to construct a full-sib family. Later, a full sibling family of C. gigas was farmed in the South Huanghai Sea (Rizhao offshore area, RZ) and North Huanghai Sea (Kongtong Dao area, KTD). In March 2018, we collected nine two-year-old oysters from RZ and KTD areas, and measured the glycogen content. In the RZ group and KTD group, three samples with similar growth characteristics were selected for follow-up experiments. We calculated the average glycogen content of RZ and KTD oysters, and each group selected three oyster individuals whose glycogen content was close to the average glycogen content of each group, and collected the gonadal tissues of these samples for RNA-seq and small RNA-seq, and determine its fatty acid content and amino acid composition. All samples were quick-frozen in liquid nitrogen and stored at −80°C.
According to the Chinese National Standard GB 5009.124-2016, the amino acid analysis of the gonadal tissue was performed at the SGS-CSTC Standards Technical Services Co., Ltd. (Qingdao, China). The main steps were as follows. First, 15 mL of 6 mol/L HCl solution was hydrolyzed for 100 mg of sample at 110 ± 1°C for 22 h. Second, filter the acid hydrolysate with filter paper, and then used a tubular concentrator to evaporate under reduced pressure at 50°C. Third, 1.0 mL of sodium citrate buffer (pH = 2.2) was added to the dried hydrolysate, and the resulting solution was passed through a 0.22 μm filter. The external standard method is used in the amino acid analyzer to calculate the amino acid concentration in the sample solution from the peak area.
According to the Chinese National Standard GB 5009.168-2016, the fatty acid composition of the gonadal tissue was measured by gas chromatography (GC). Simply, 2 ml methanol solution of hydrochloric acid, 1 mL n-hexanewere added into 100 mg powder sample and then hydrolyzed at 80°C for 2 h. After cooling down, 3 mL 6% K2CO3 was added to the samples. After filtered using a 0.22−μm membrane, the samples were analyzed on a high performance gas chromatography analyzer (GC-2010, Shimadzu, Japan), each injection volume was 1 μL. The types and relative contents of fatty acids were calculated according to the standard peak time screening and the corrected area normalization method.
RNA-seq and small RNA-seq were completed by Novogene Bioinformatics Technology Co., Ltd. (Beijing, China). The total RNA from gonadal tissue was isolated using TRIzol reagent (Invitrogen, CA, United States) according to the manufacturer’s instructions. The RNA degradation and contamination was monitored on 1% agarose gels, purity was checked using the NanoPhotometer Spectrophotometer® (IMPLEN, CA, United States), concentration was measured using Qubit® RNA Assay Kit in Qubit® 2.0 Flurometer (Life Technologies, CA, United States), integrity was assessed using the Agilent Bioanalyzer 2100 system (Agilent Technologies, CA, United States).
According to the manufacturer’s instructions, a total amount of 3 μg RNA per sample was used as input material for the RNA sample preparations. Firstly, ribosomal RNA was removed by Epicentre Ribo-zeroTM rRNA Removal Kit (Epicentre, United States), and rRNA free residue was cleaned up by ethanol precipitation. Subsequently, sequencing libraries were generated using the rRNA depleted RNA by NEBNext® UltraTM Directional RNA Library Prep Kit for Illumina® (NEB, United States) following manufacturer’s recommendations, products were purified (AMPure XP system) and library quality was assessed on the Agilent Bioanalyzer 2100 system. The clustering of the index-coded samples was performed on a cBot Cluster GenerationSystem using TruSeq PE Cluster Kit v3-cBot-HS (Illumia). After cluster generation, the libraries were sequenced on an Illumina Hiseq 4000 platform and 150 bp paired-end reads were generated.
A total amount of 3 μg total RNA per sample was used as input material for the small RNA library. Sequencing libraries were generated using NEBNext® Multiplex Small RNA Library Prep Set for Illumina® (NEB, United States), library quality was assessed on the Agilent Bioanalyzer 2100 system using DNA High Sensitivity Chips. The clustering using TruSeq SR Cluster Kit v3-cBot-HS (Illumia) After cluster generation, the library preparations were sequenced on an Illumina Hiseq 2500/2000 platform and 50 bp single-end reads were generated.
In RNA-seq, raw data were obtained by removing reads containing adapter, reads on containing ploy-N and low quality reads. At the same time, Q20, Q30, and GC contents of the clean data were calculated. Raw sequencing reads were submitted to Sequence Read Archive in NCBI; the SRA accession numbers were SRR15293269, SRR15293270, SRR15293271, SRR15293272, SRR15293273, and SRR152932741.
The reference genome and gene model annotation files are downloaded from the genome website.2 Index of the reference genome was built using bowtie2 v2.2.8 and paired-end clean reads were aligned to the reference genome using HISAT2 (Langmead et al., 2009) v2.0.4. HISAT2 was run with “–rna-strandness RF,” other parameters were setas default. The mapped reads of each sample were assembled by StringTie (v1.3.1) (Pertea et al., 2016) in a reference-based approach.
In small RNA-seq, raw data were obtained by removing reads containing ploy-N, with 5′ adapter contaminants, without 3′ adapter or the insert tag, containing ploy A or T or G or C and low quality reads. At the same time, Q20, Q30, and GC contents of the clean data were calculated. Raw sequencing reads were submitted to Sequence Read Archive in NCBI; the SRA accession numbers were SRR15293267 and SRR15293268 (see text footnote 1).
The reference genome and gene model annotation files are downloaded from the genome website (see text footnote 2). The small RNA tags were mapped to reference sequence by Langmead et al. (2009) without mismatch to analyze their expression and distribution on the reference.
The spliced transcripts were screened for lncRNA according to the following steps: first, selected transcripts with exon number ≥2 and length >200 bp; second, Cuffcompare software was used to screen annotation lncRNA (Trapnell et al., 2010); third, selected the transcripts with FPKM ≥0.5; finally, CPC (Coding Potential Calculator) and PfamScan were used to screen for coding potential (Kong et al., 2007; Mistry et al., 2007). CircRNA was screened and identified in the constructed lncRNA library. Because of the high false positives in circRNA identification, circRNA was screened using find_circ and CIRI2 (Gao et al., 2018), the results were merged and the intersection of the two was taken.
The mapped small RNA tags were compared with the Danio rerio sequence in miRBase 20.0 to find known miRNAs. The modified software mirdeep2 (Friedlander et al., 2012) and srna-tools-cli3 were used to obtain potential miRNAs and draw secondary structures. To remove tags originating from protein-coding genes, repeat sequences, rRNA, tRNA, snRNA, and snoRNA, small RNA tags were mapped to RepeatMasker, Rfam database. The software miREvo (Wen et al., 2012) and mirdeep2 were integrated to predict novel miRNA. To make every unique small RNA mapped to only one annotation, we follow the following priority rule: known miRNA > rRNA > tRNA > snRNA > snoRNA > repeat > gene > NAT-siRNA > gene > novel miRNA > ta-siRNA.
The lncRNA cis-acting target genes were screened for protein coding genes within 100 kb upstream and downstream; the lncRNA trans-acting target genes were screened for the Pearson correlation coefficient between lncRNA and mRNA than 0.95. Used miRanda (Enright et al., 2003) to predict the target gene of miRNA. The prediction was based on the miRNA binding site in the 3′UTR region of the gene. If the gene was uncertain or there was no 3′UTR region, then the miRNA binding site was determined according to the gene’s stop codon within 1,000 bp downstream point.
Cuffdiff (v2.1.1) was used to calculate FPKMs of both lncRNAs and coding genes in each sample (Trapnell et al., 2010). Gene FPKMs were computed by summing the FPKMs of transcripts in each gene group. MiRNA expression levels were estimated by TPM (transcript per million) through the following criteria (Zhou et al., 2010).
During the analysis, Ballgown was used for differential expression of lncRNA and mRNA analysis (Pertea et al., 2016), DESeq R package (1.10.1) was used for differential expression circRNA analysis, and DESeq R package (1.8.3) was used for differential expression miRNA analysis. The p < 0.05 and | log2FoldChange| > 1 as the threshold for differential screening to identify differential genes.
The GOseq R software package (Young et al., 2010) and KOBAS software (Mao et al., 2005) were used to perform Gene Ontology (GO) enrichment analysis and Kyoto Encyclopedia of Genes and Genomes (KEGG) pathway enrichment analysis on differentially expressed genes (DEGs) or ncRNA target genes, respectively.
Used miRanda to predict the interaction between DEMis and DEG, DELs and DECs (Friedlander et al., 2012) and Cytoscape V3.2 software to visualize it, and choosed to express the trend as “up-down-up” or “down-up-down” network for further research (Saito et al., 2012).
To verify the results of RNA-seq and small RNA-seq, quantitative real-time PCR (qRT-PCR) was performed. The sample used for qRT-PCR was the same as the sequencing sample. The verification primers involved were designed using Primer Premier 5 software (Table 1), and were specifically compared by NCBI Primer Blast, synthesized by Sangon Biotech Co., Ltd. (Shanghai, China). First, total RNA was used as the initial template, using PrimeScriptTM RT reagent Kit with gDNA Eraser (TaKaRa, Beijing, China) (for mRNA and lncRNA), and Evo M-MLV RT Kit for qPCR (Accurate Biotechnology, Hunan, China) (for circRNA), Mir-X miRNA First-Strand Synthesis Kit (TaKaRa, Beijing, China) (for miRNA), convert total RNA into cDNA, with Oligo dT (for mRNA and lncRNA), random hexamer (For circRNA), poly-A RT primer (for miRNA). Second, qPCR used TB Green® Premix Ex TaqTM (TaKaRa, Dalian, China) for mRNAs, lncRNAs, and circRNAs, TB Green® Premix Ex TaqTM II (Tli RNaseH Plus) (TaKaRa, Dalian, China) for miRNAs. Extension factor 1 Genes (EF-1, used for mRNA, lncRNA, and circRNA) and U6 (used for miRNA) were used as endogenous controls (Renault et al., 2011). Finally, the Light Cycler 480 real-time PCR instrument (Roche Diagnostics, Burgess Hill, United Kingdom) was used for amplification, and 2−△△ct method was used to calculate relative gene expression levels (Ballester et al., 2013).
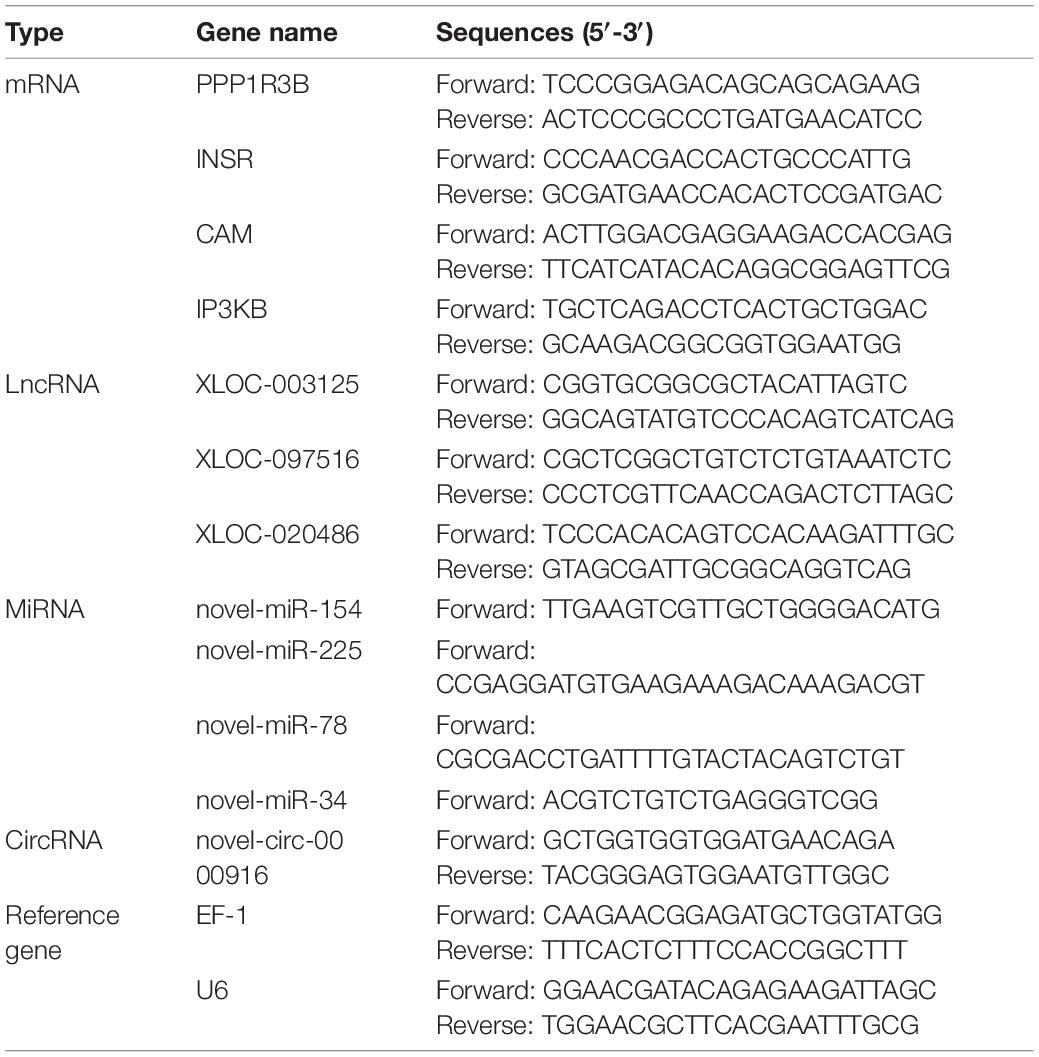
Table 1. The primers for qRT-PCR analysis.
The Student’s t-test analysis in SPSS statistical software v.22 (SPSS, Inc., Chicago, IL, United States) was used to analyze the data of glycogen content, fatty acid content and amino acid content. Quantitative data were expressed as means ± standard deviation (SD), and comparisons between different groups were completed using t-tests. The significance level for the statistical analyses was p < 0.05.
The average glycogen content of the selected samples (fresh samples) in the RZ group and the KTD group were 7.173 ± 0.165 and 2.973 ± 0.055 mg/g, respectively. The differences in glycogen content between the two comparison groups were significantly different (p < 0.001). Therefore, in the follow-up analysis, we divided the two groups of oysters into high glycogen content of RZ (RZGH) group and low glycogen content of KTD (KTDGL) group.
As shown in Table 2, a total of 16 amino acid compositions were measured. 11 glucogenic amino acids were identified that were more abundant in KTDGL oysters (p < 0.05), such as aspartic acid, threonine, serine, glycine, alanine, valine, methionine, isoleucine, tyrosine, phenylalanine, and arginine. As shown in Table 3, there are differences in the content of 13 fatty acids in the RZGH and KTDGL groups (p < 0.05), and the content of 9 fatty acids in the RZGH group was significantly higher than that in the KTDGL group.
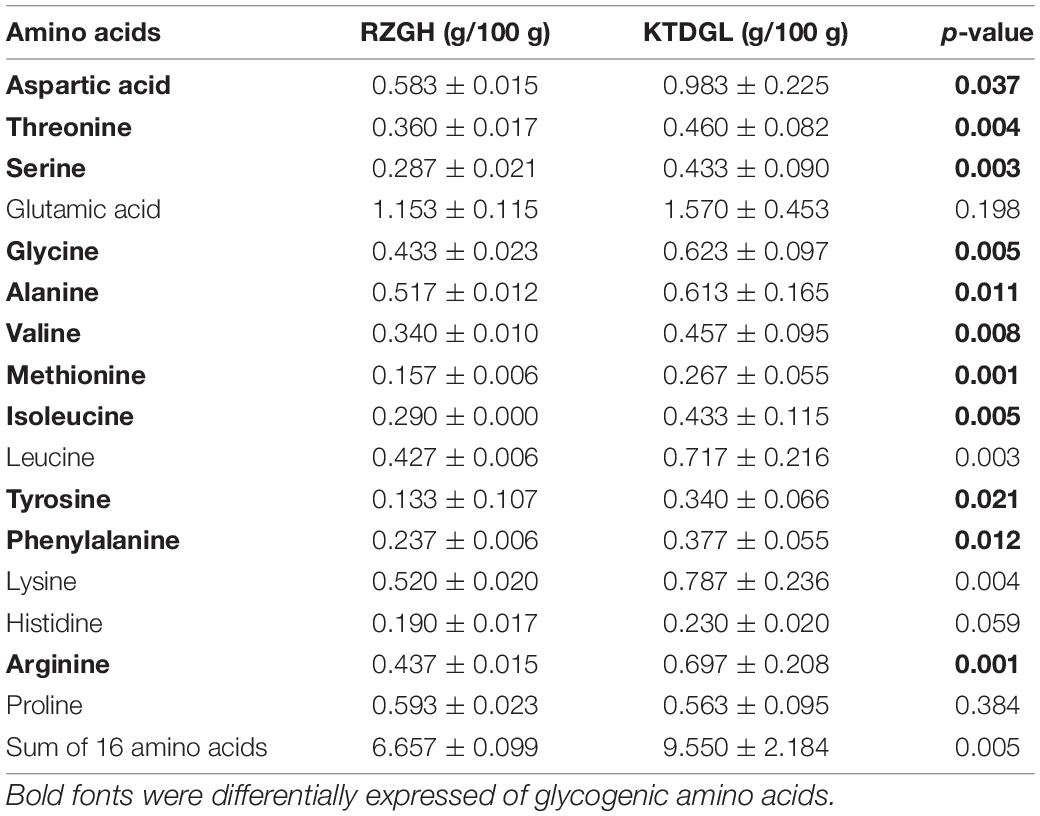
Table 2. Amino acid composition of RZGH and KTDGL oysters.
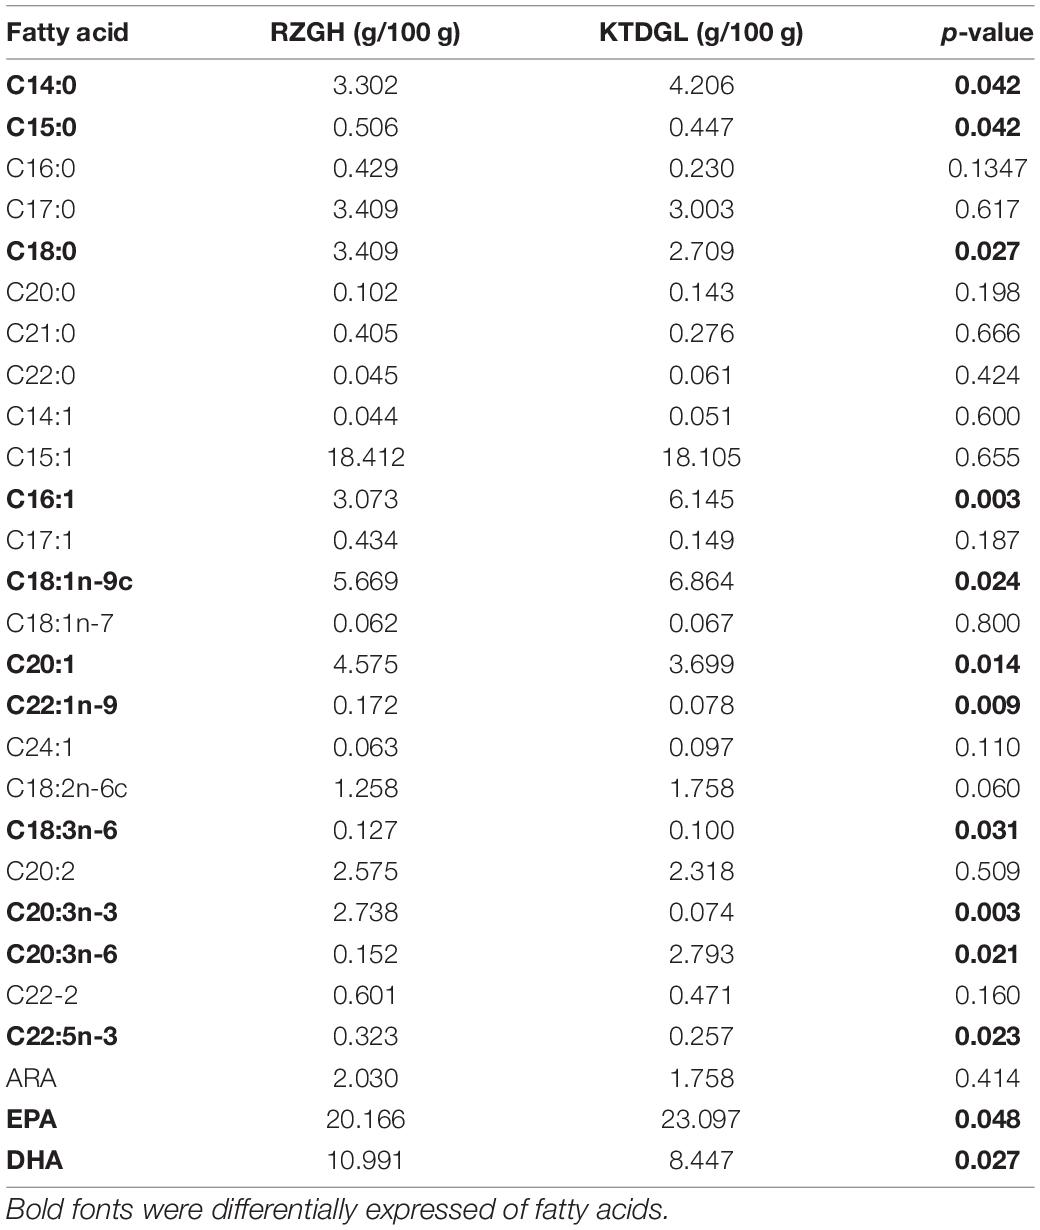
Table 3. Fatty acid content of RZGH and KTDGL oysters.
Compared with KTDGL oysters, there were 2,084 mRNAs (including 844 up- and 1,240 down-regulated), 1,080 lncRNAs (including 923 up- and 157 down-regulated), 34 circRNAs (including 26 up- and 8 down-regulated), and 7 miRNAs (including 4 up- and 3 down-regulated) that were differentially expressed in RZGH oysters (Figures 1A–D).
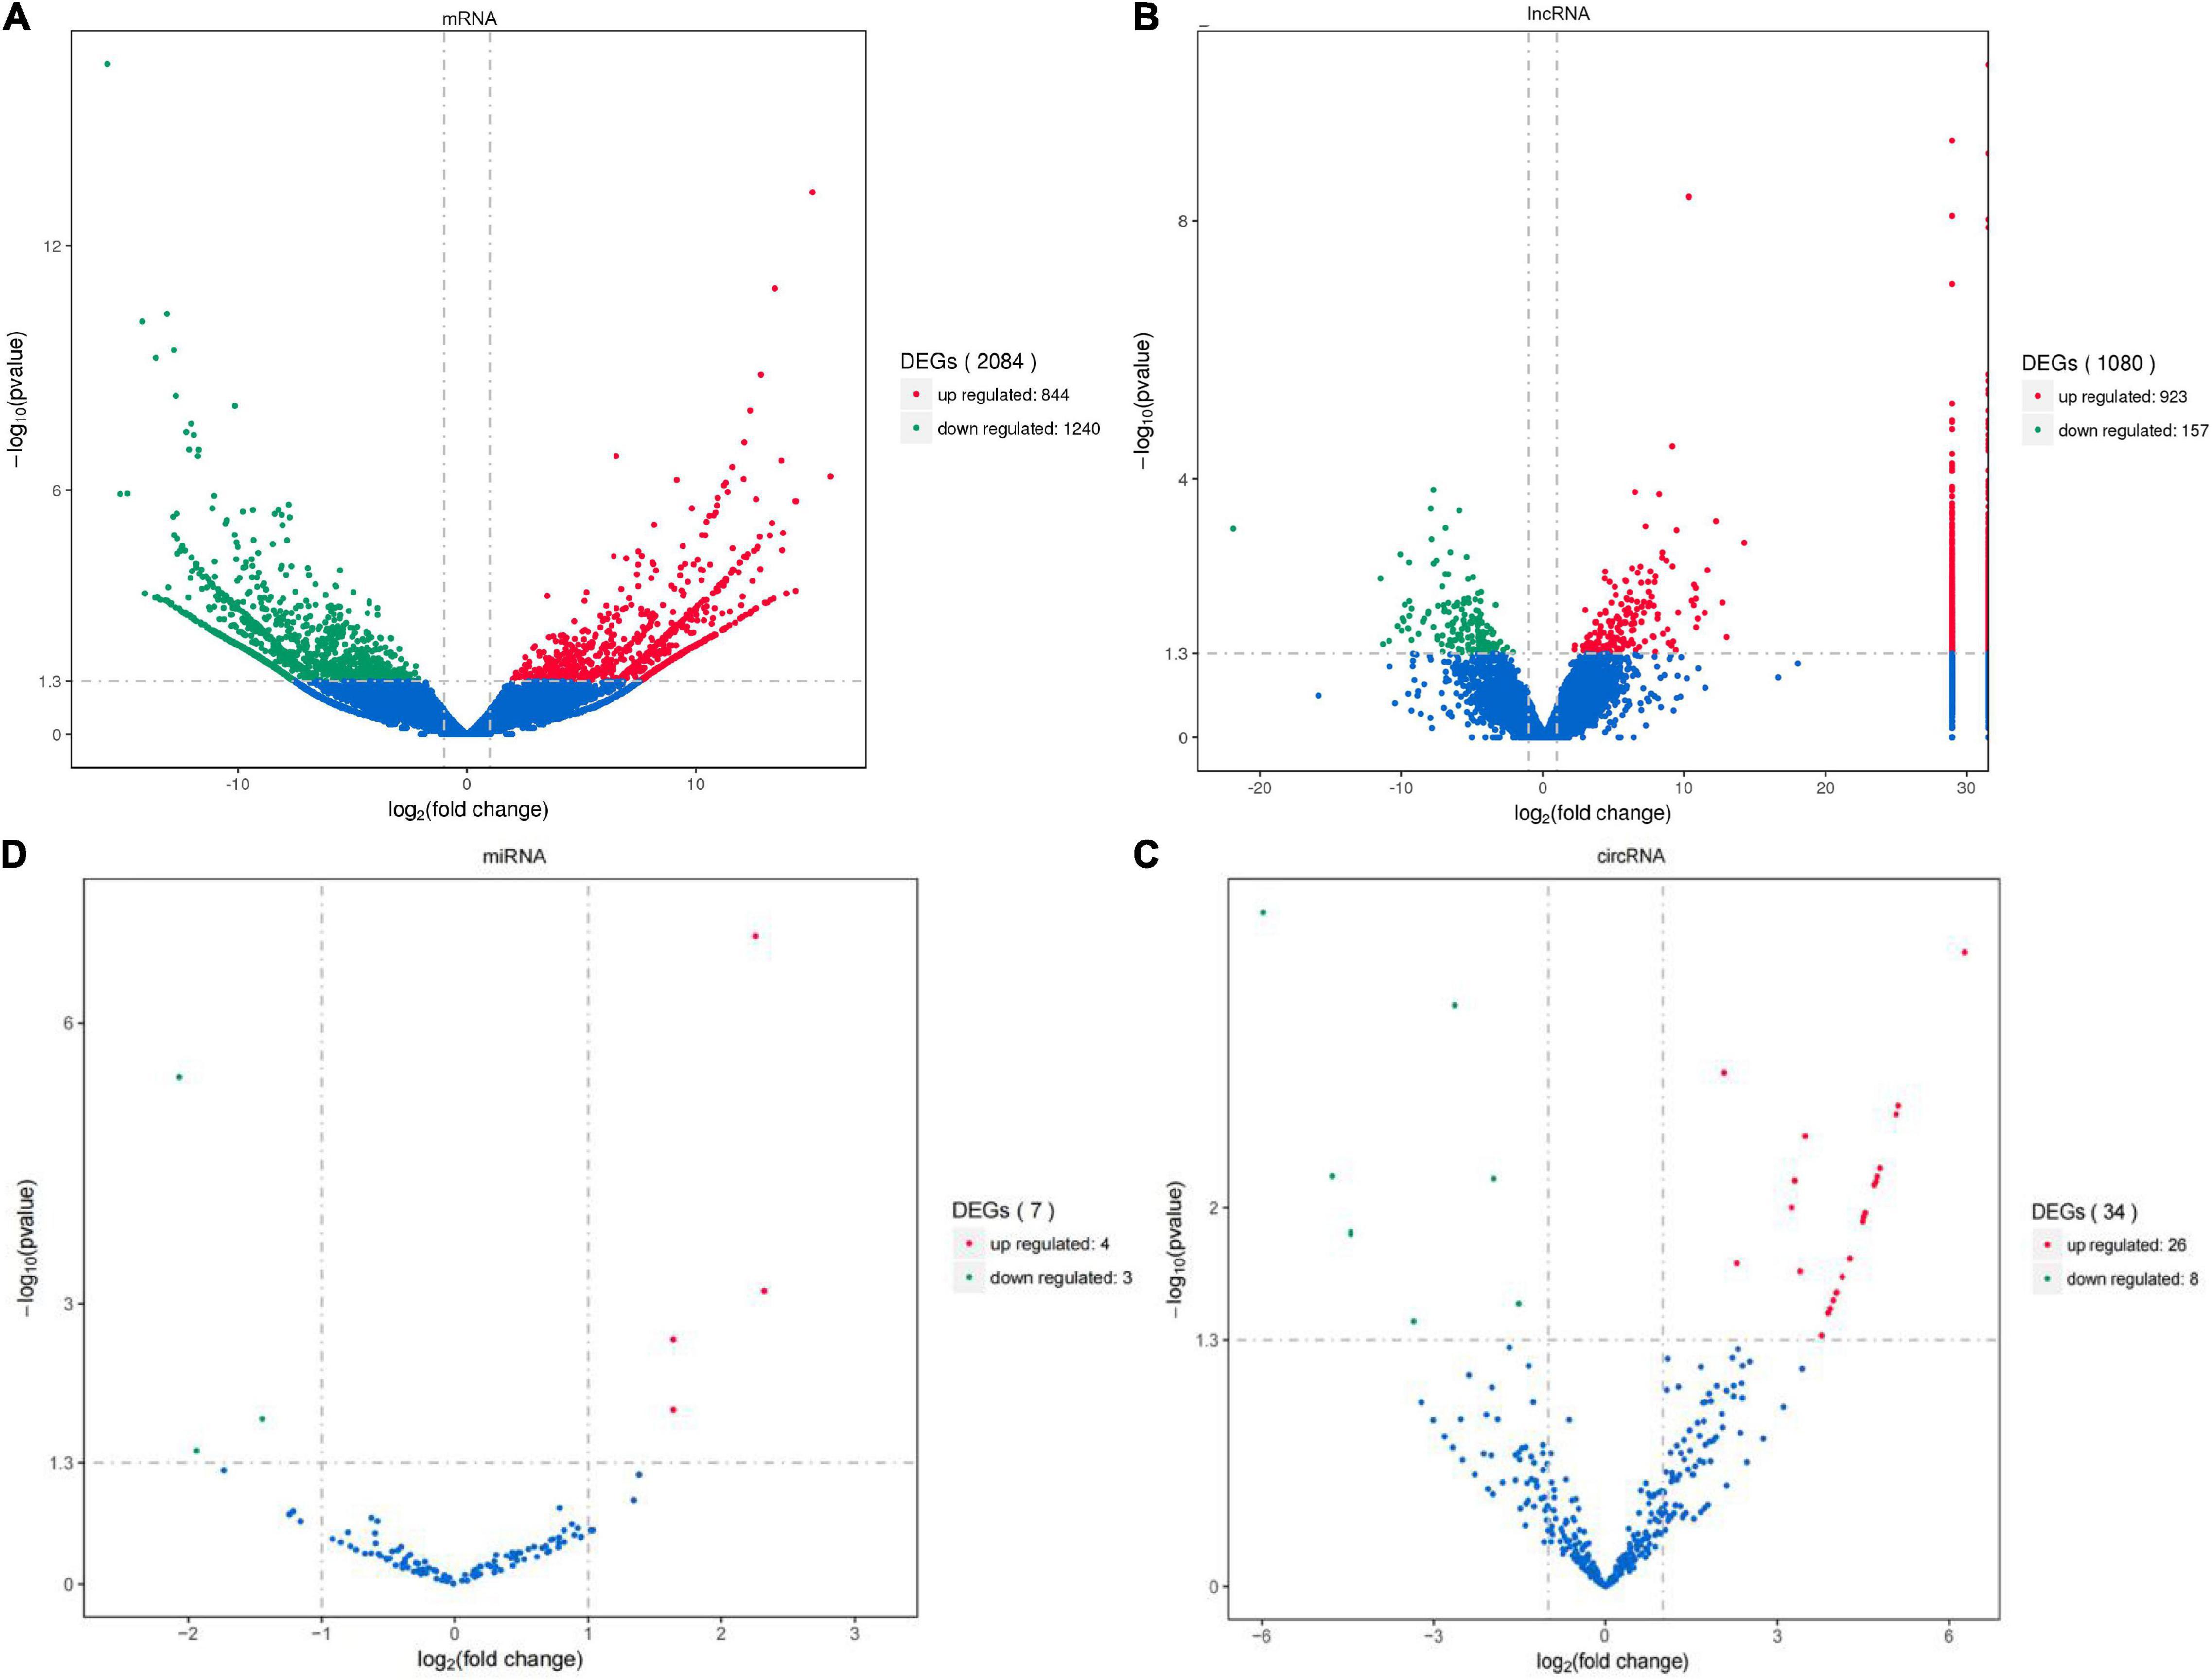
Figure 1. The mRNAs (A), lncRNAs (B), circRNA (C), and miRNAs (D) differentially expressed in RZGH and KTDGL groups. The red points showed the up-regulated, the green points showed the down-regulated, and the blue points showed the equally expressed (p < 0.05 and | log2FoldChange| > 1). The vertical dotted lines indicate | log2FC| = 1, and the horizontal dotted lines indicate p = 0.05.
It mainly includes three categories: biological process (BP) category, cellular component (CC) category, and molecular function (MF) category. GO enrichment analysis found that 120 GO terms were significantly enriched (p < 0.05). Among the three categories, microtubule-based movement, proteinaceous extracellular matrix and intramolecular oxidoreductase activity, and interconverting aldoses and ketoses were the most significant ones, which were selected separately the top 10 terms of significance are displayed (Figure 2A). KEGG enrichment analysis was performed on these DEGs to further determine the metabolic process pathway. The results showed that DEGs were significantly enriched in 13 pathways, such as calcium signaling pathway, ECM–receptor interaction, and insulin signaling pathway, among which 29 genes were enriched into the calcium signaling pathway, and 17 genes were enriched into the insulin signaling pathway (Figure 2B). Including protein phosphatase 1 regulatory subunit 3B (LOC105340237, PPP1R3B), calmodulin (LOC105327344, CAM), protein tyrosine phosphatase (LOC105329458, PTP), insulin-like peptide receptor (LOC105348544, INSR), acetyl coenzyme A carboxylase (LOC105343342, ACCA), inositol Triphosphate 3-kinase B (LOC105336889, IP3KB), and so on.
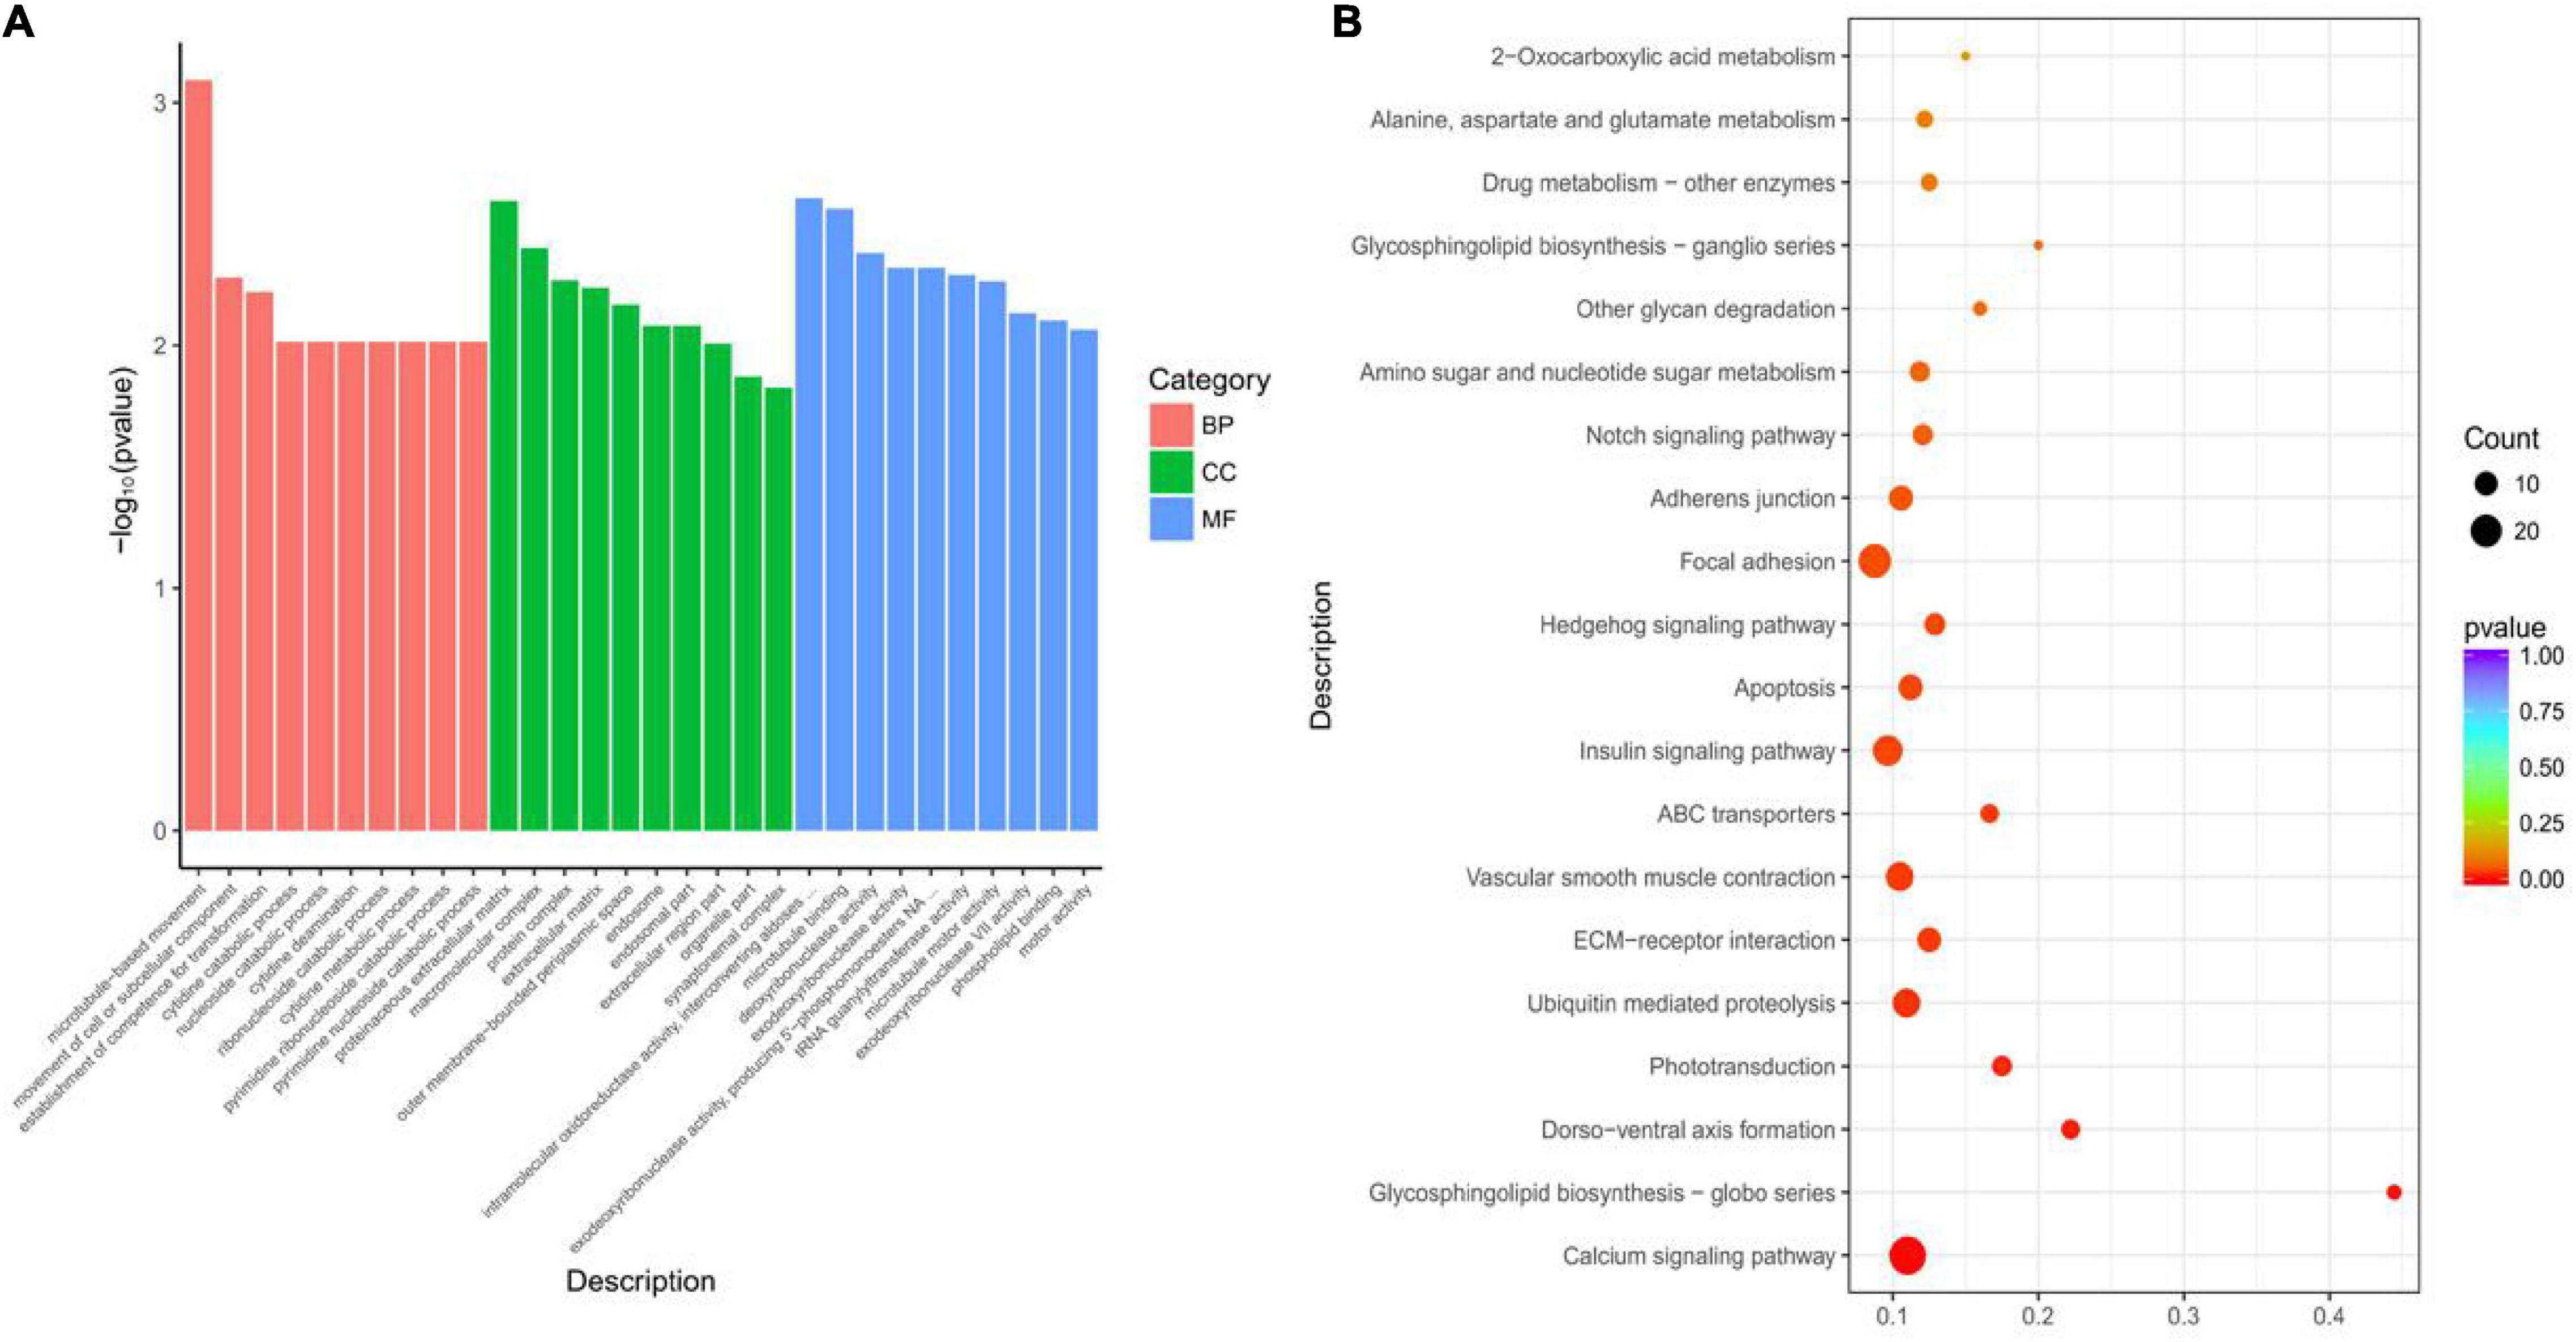
Figure 2. Functional enrichment analysis of differentially expressed mRNAs between RZGH and KTDGL groups. (A) Gene Ontology (GO) terms and (B) KEGG pathways enriched.
To investigate the possible functions of lncRNAs, the cis and trans roles of DELs in target genes were identified, and the filtered mRNAs were analyzed in combination with DEGs. A total of 471 lncRNA–mRNA interactions were found to have cis roles and 1,327 lncRNA–mRNA interactions were found to have trans roles. The target genes were analyzed by GO and KEGG pathway enrichment. In the results of GO enrichment analysis, it was found that fucose metabolic process, mRNA cap binding complex, and L-fucose isomerase activity were the most significant among the three categories, respectively. The top 10 terms of significance were selected for display (Figure 3A). KEGG path analysis of lncRNA target genes to explore its function. Similar to the KEGG pathway of DEGs, it was found that 22 genes were enriched in the calcium signaling pathway, and 14 genes were enriched in the insulin signaling pathway, including PPP1R3B, CAM, PTP, INSR, DDO, etc. (Figure 3B).
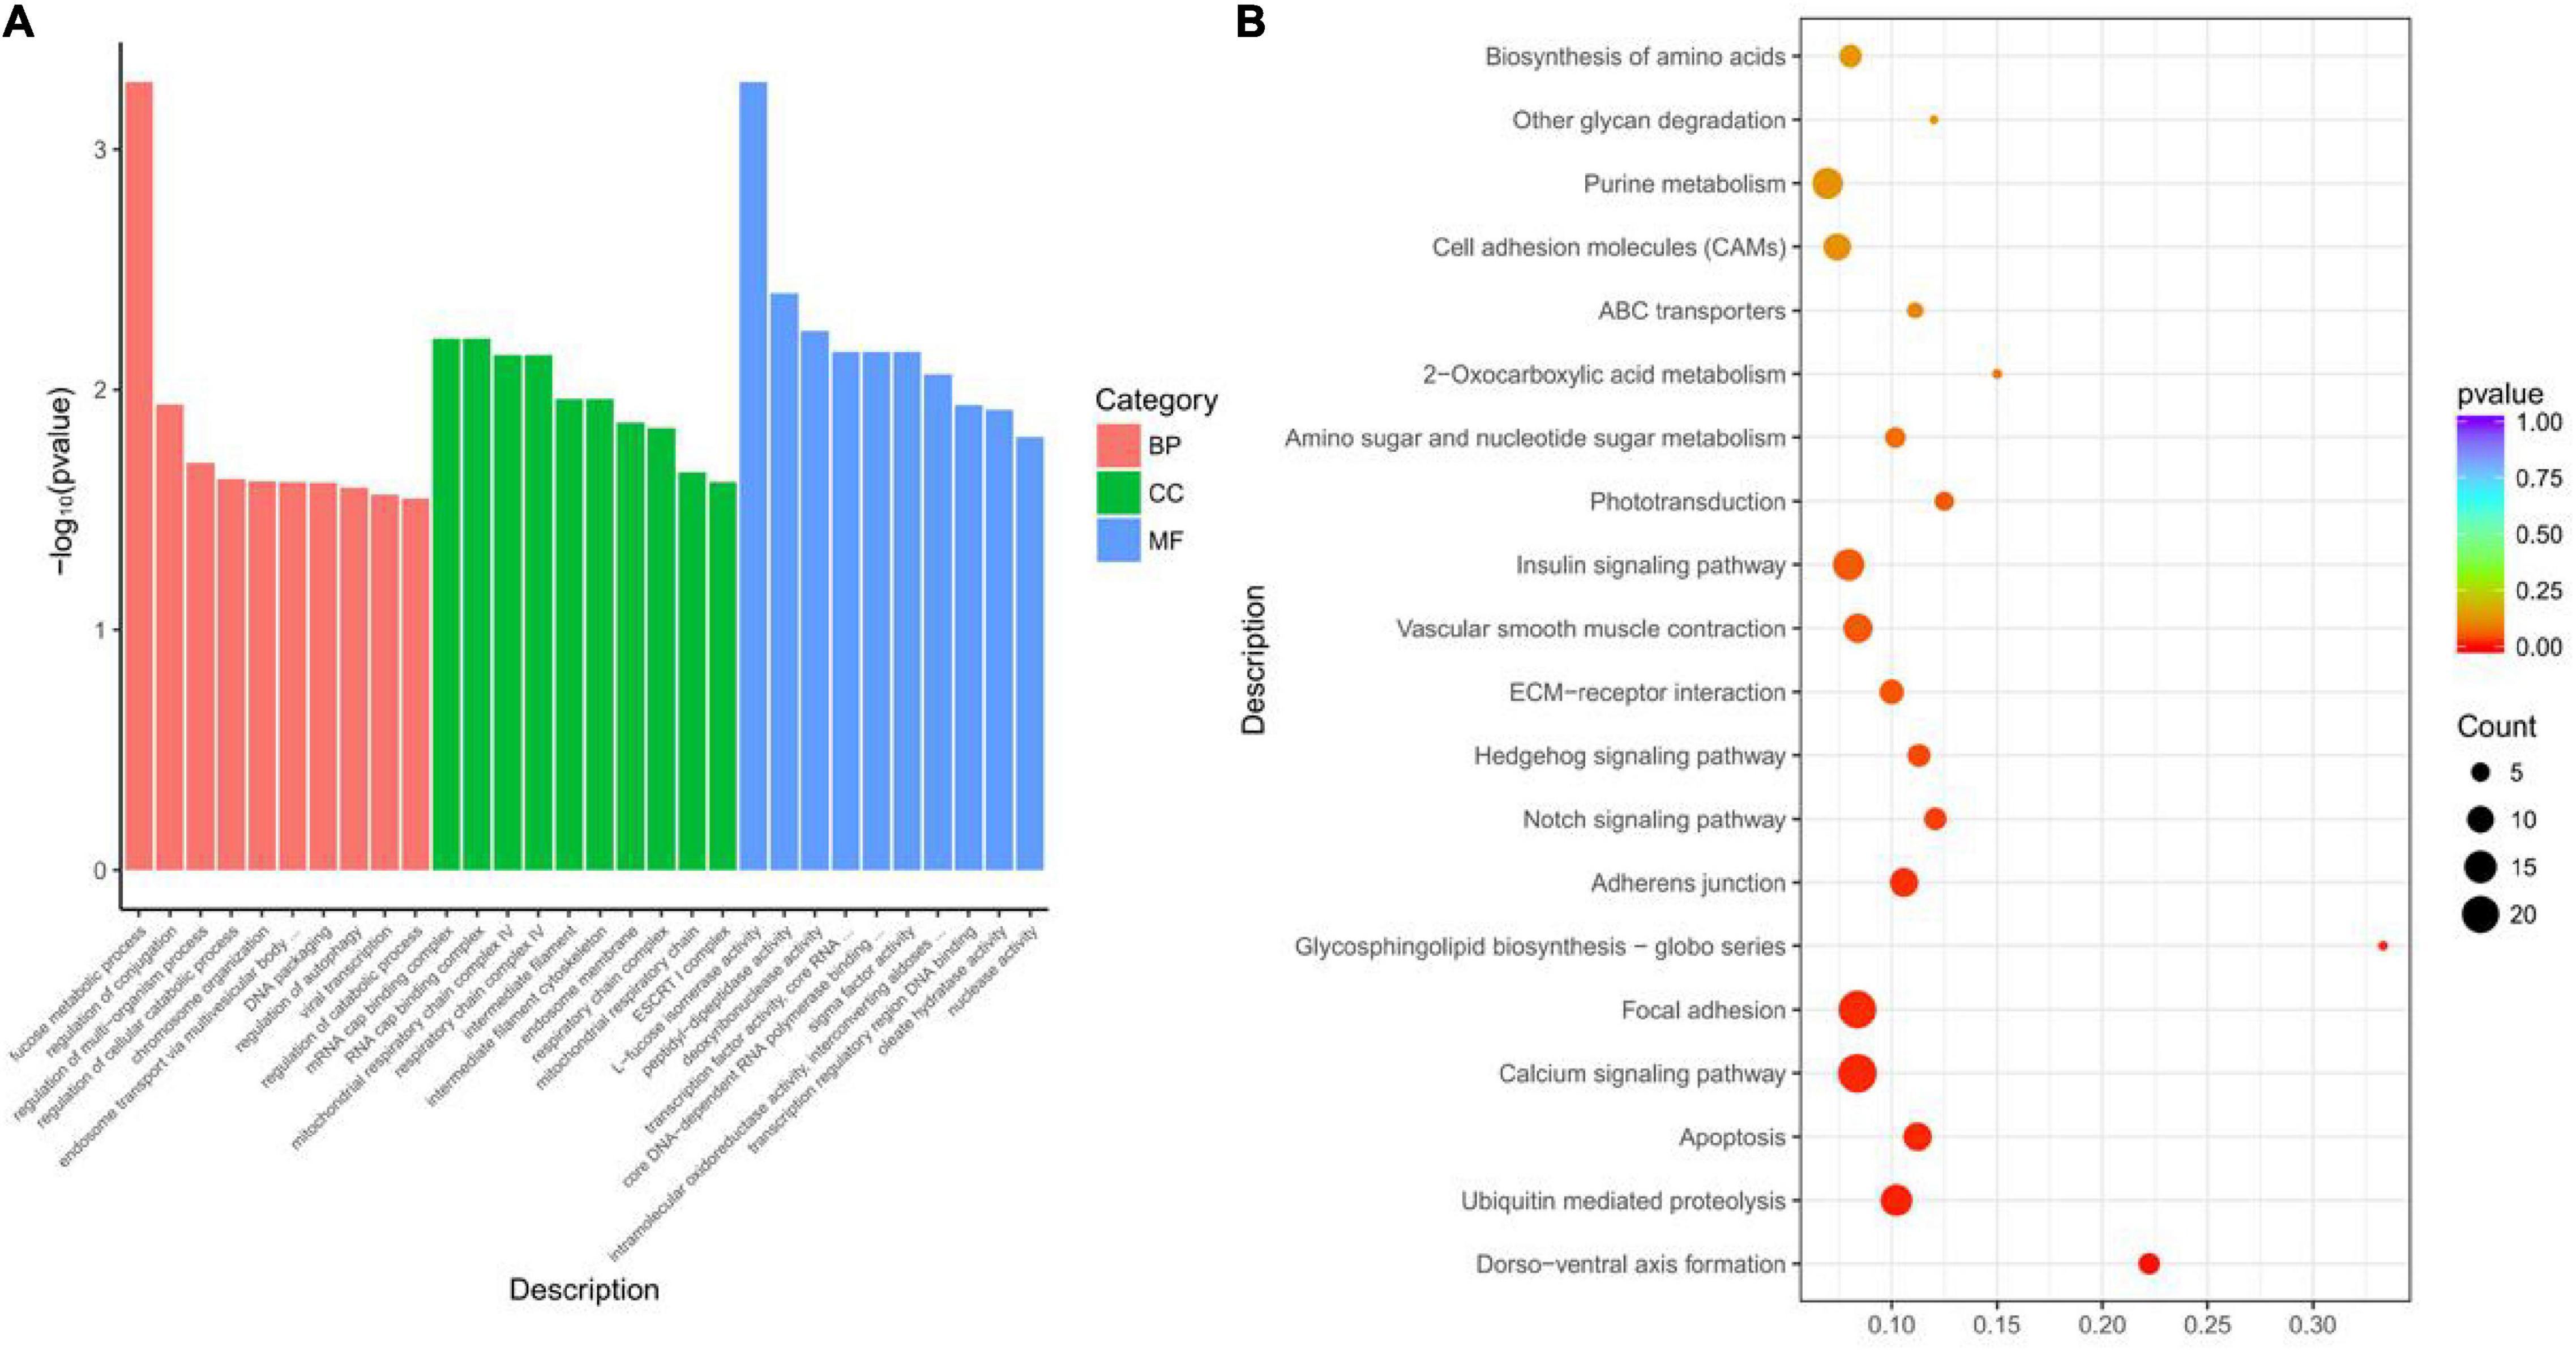
Figure 3. Functional enrichment analysis of differentially expressed lncRNA target genes between RZGH and KTDGL groups. (A) Gene Ontology (GO) terms and (B) KEGG pathways enriched.
The functional enrichment of circRNA host genes was explored, 33 GO terms were significantly enriched (p < 0.05). KEGG pathway analysis was performed on the host genes of DECs to explore its function. The two pathways were significantly enriched (p < 0.05), other glycan degradation and propanoate metabolism. And it was found that novel-circ-0004211 were transcribed from acetyl-CoA synthase 2 (LOC105319828, ACAS2).
A total of seven DEMis (four up- and three down regulated) were screened out with small RNA-seq. By analyzing the predicted target genes and DEGs, a total of 1,077 target genes were found. Analysis found that three down-regulated DEMis, novel-miR-34, novel-miR-78, and novel-miR-13 target a total of 283 up-regulated DELs; four up-regulated DEMis, novel-miR-154, novel-miR-44, novel-miR-225, and novel-miR-263 target a total of 286 down-regulated DELs. In the interacting network, INSR gene and lncRNAs XLOC-116536, XLOC-104062, etc., were all negatively regulated by novel-miR-13 and novel-miR-34, PTP gene and 172 lncRNAs were all negatively regulated by novel-miR-154 and novel-miR-225. Some lncRNA–miRNA–mRNA network interactions are shown in Figure 4A.
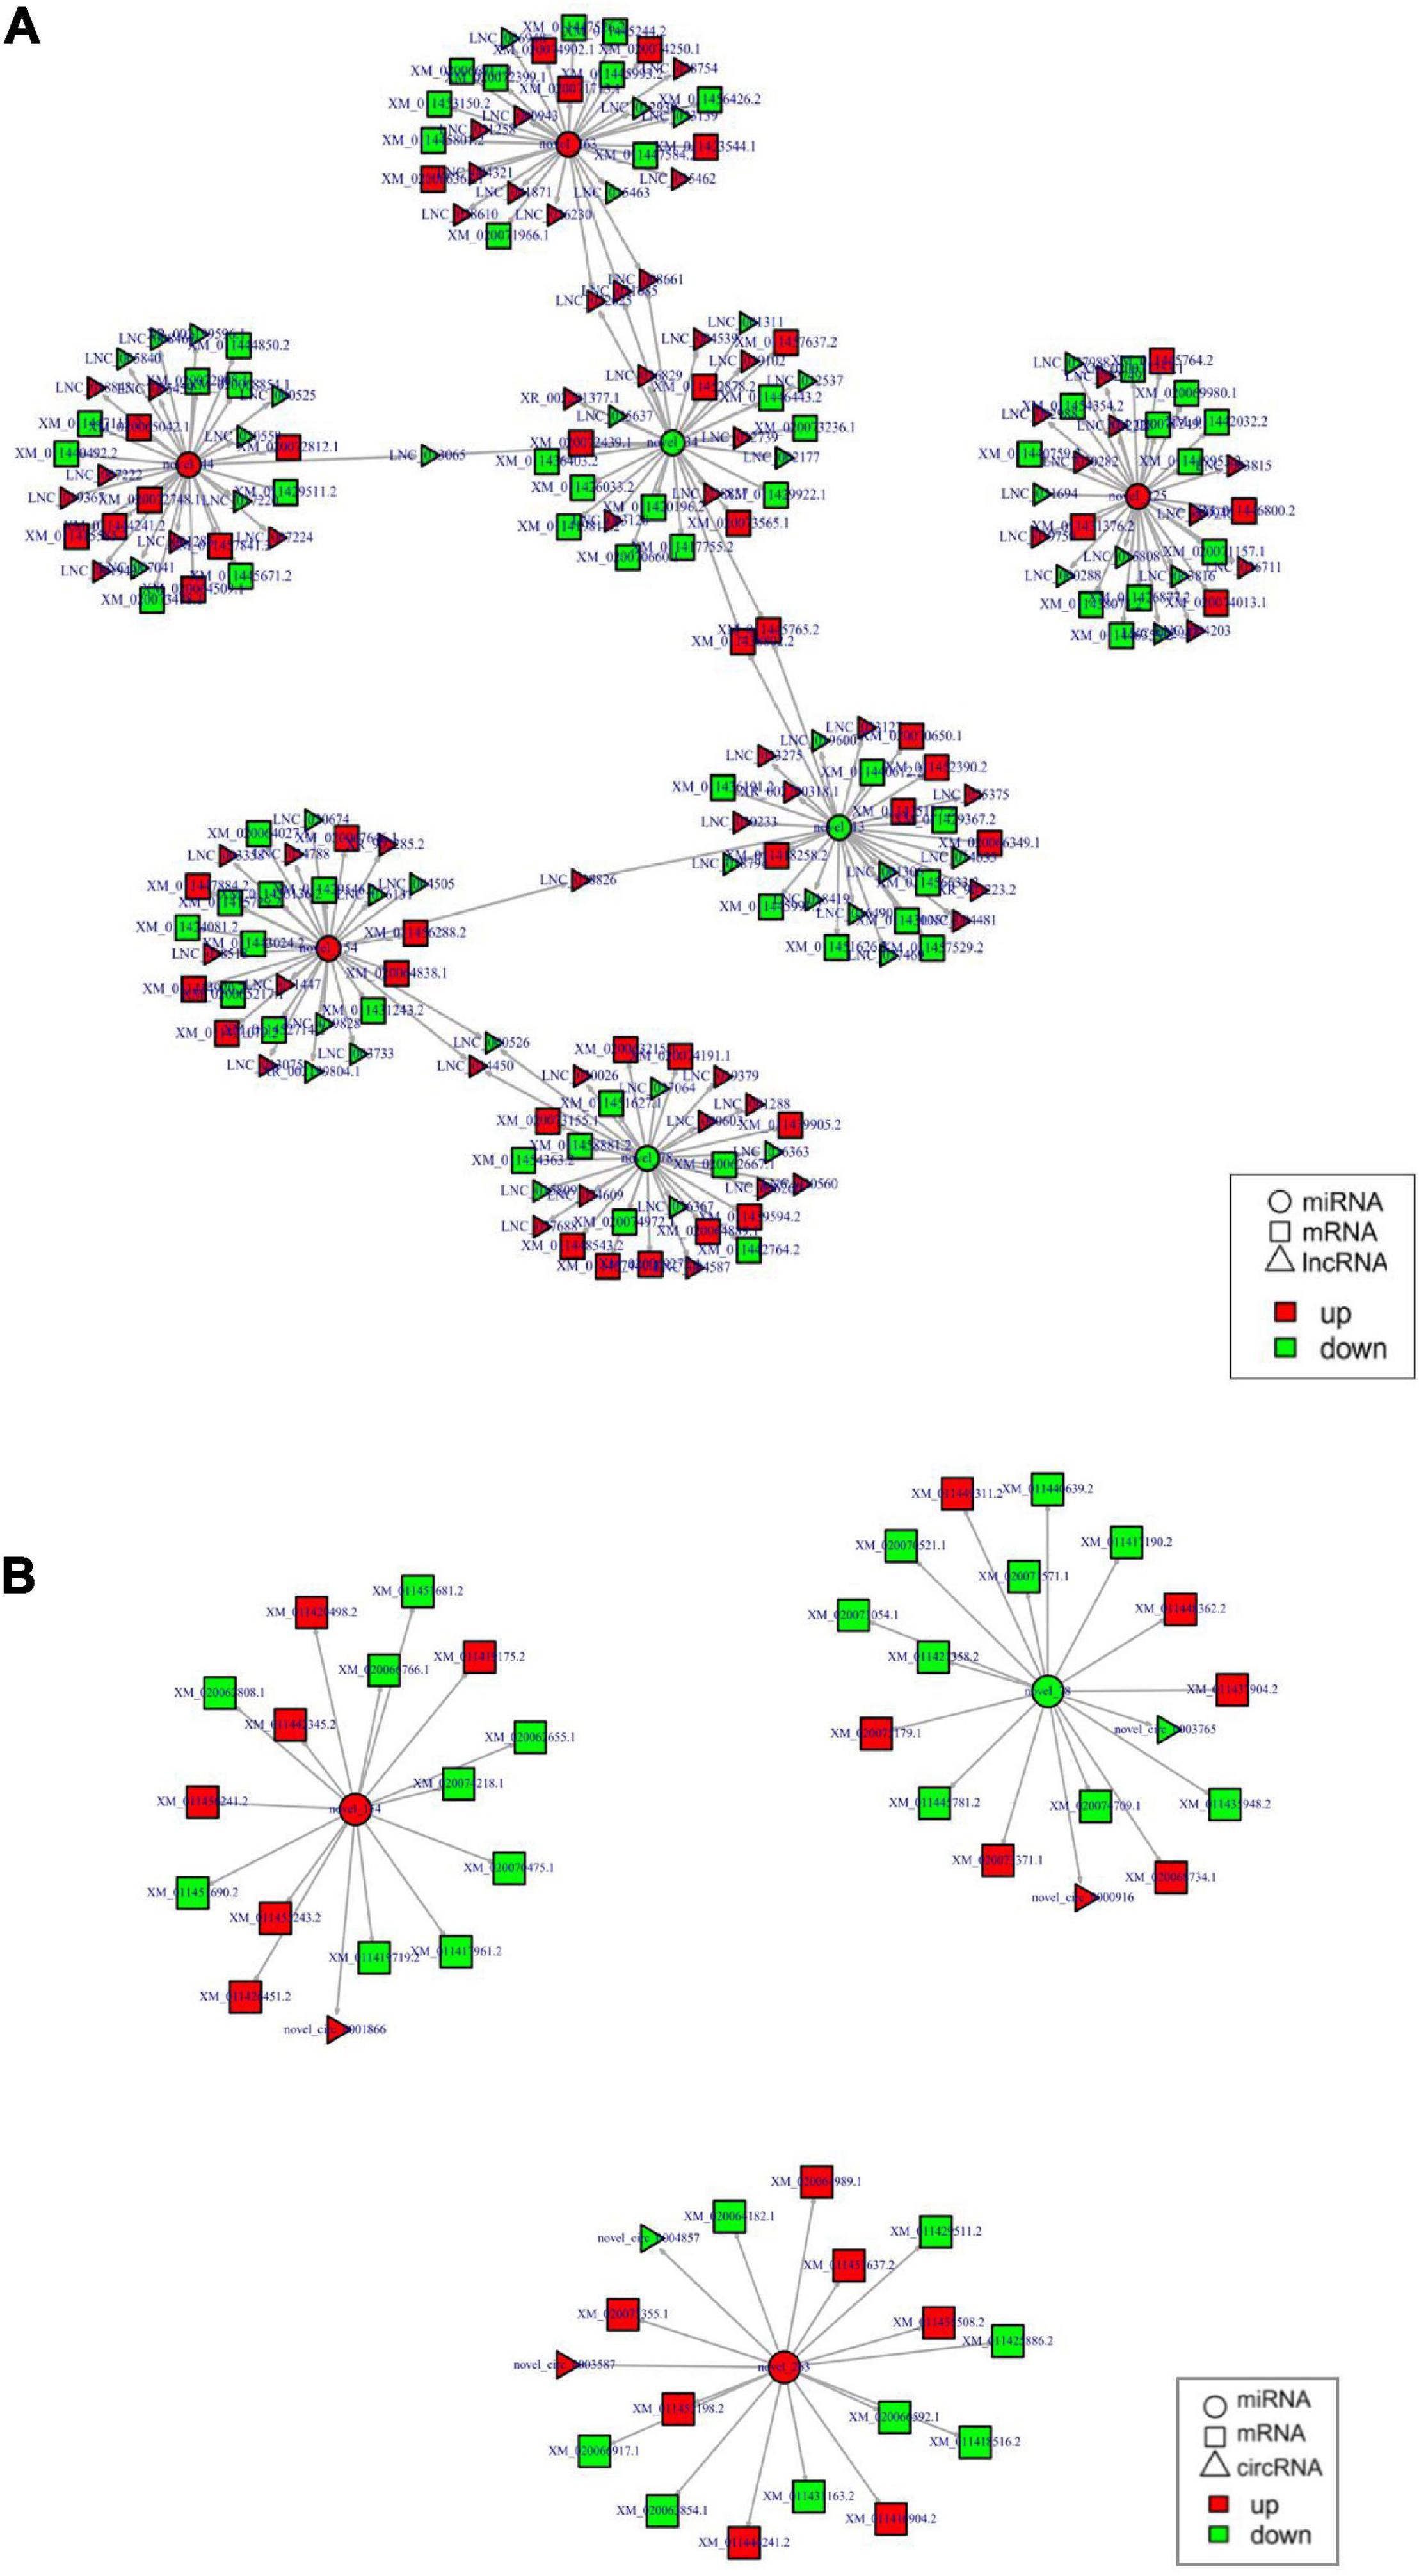
Figure 4. (A) Partial lncRNA–miRNA–mRNA regulatory networks. (B) Partial circRNA–miRNA–mRNA regulatory networks.
In addition, two up-regulated DEMis were found, novel-miR-154 targeted novel-circ-0001866; novel-miR-263 targeted novel-circ-0004857 and novel-circ-0003587. One down-regulated DEMi, novel-miR-78 targets novel-circ-0003765 and novel-circ-0000916. In the interacting network, the other novel-circ-0000916 and INSR gene were all negatively regulated by novel-miR-78. Some circRNA–miRNA–mRNA network interactions were shown in Figure 4B.
Gene Ontology and KEGG pathway analyses of the functions of DEGs were included in the network. A total of 106 GO terms were significantly enriched (p < 0.05), and the top 10 terms of significance in the three categories were selected to display, as shown in Figure 5A. The BP mainly involves the response of microtubule-based motion, fucose metabolism, etc. The MFs mainly involved in deoxyribonuclease activity, mercury ion transmembrane transport protein activity, and intramolecular involvement of aldose, etc. A total of 14 pathways were significantly enriched (p < 0.05), of which 25 genes were enriched into calcium signaling pathway, and 15 genes were enriched into insulin signaling pathway (Figure 5B).
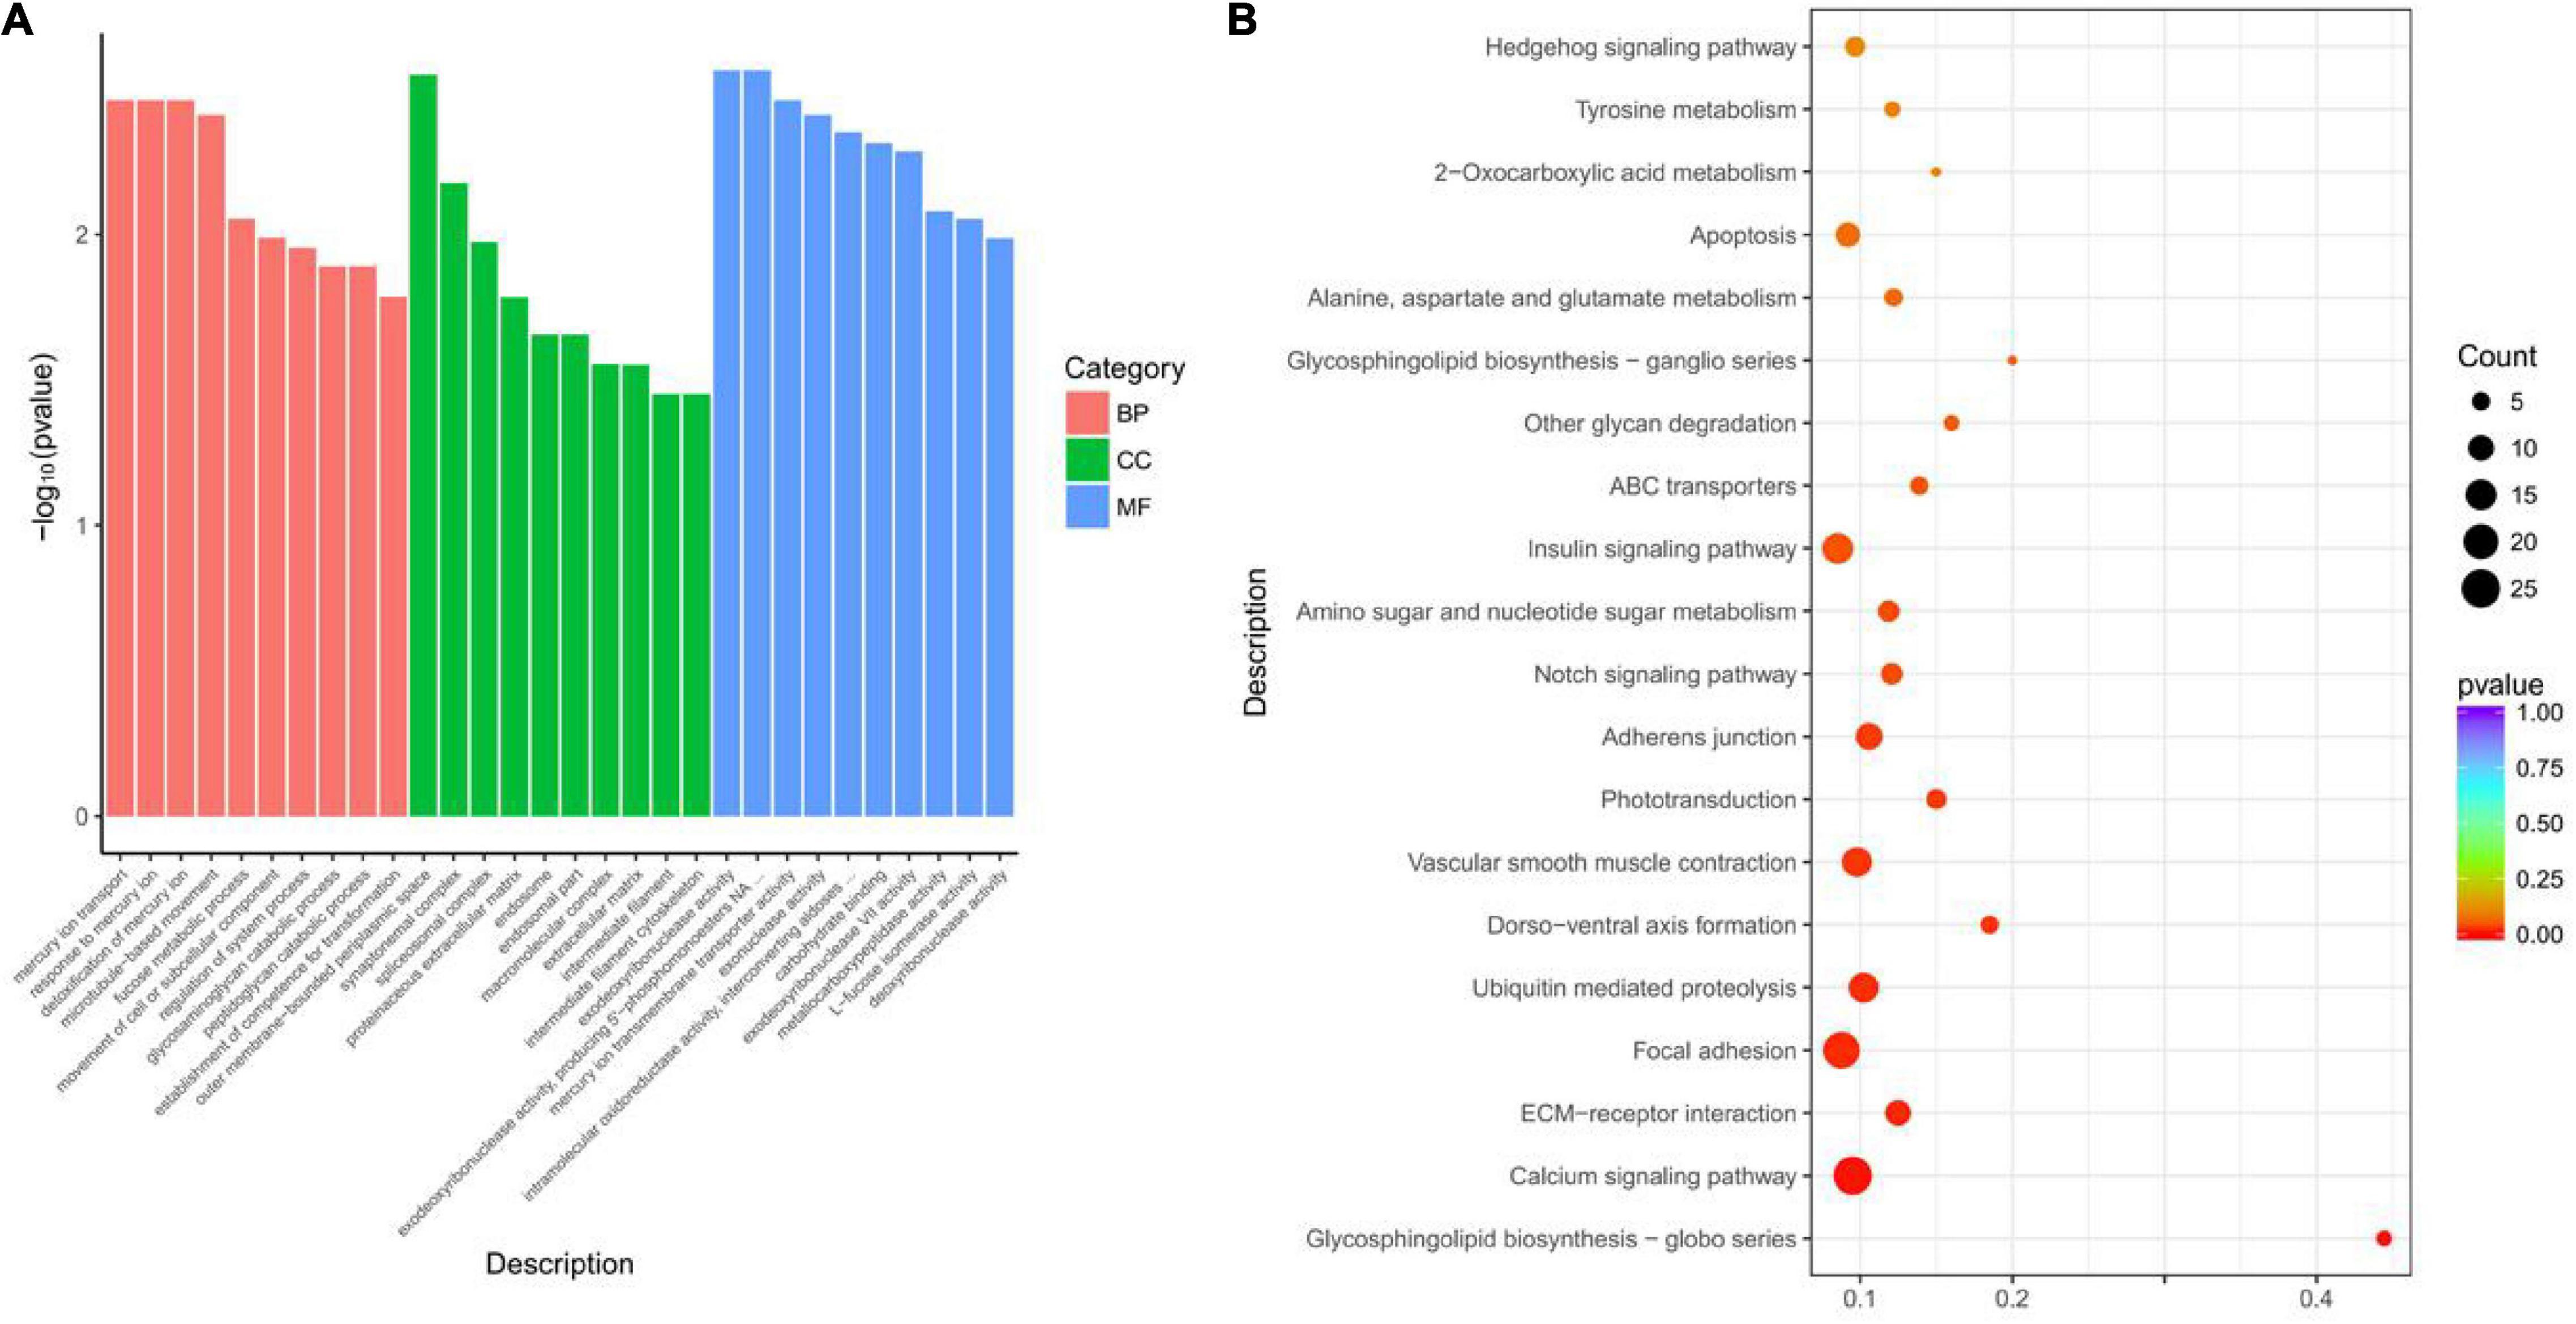
Figure 5. Gene Ontology (GO) and KEGG analyses of the DEGs in the lncRNA/circRNA–miRNA–mRNA network. (A) GO analysis for DEGs in the lncRNA/circRNA–miRNA–mRNA network. (B) Statistics of pathways enrichment of DEGs in the lncRNA/circRNA–miRNA–mRNA network.
The expression of twelve different genes was selected to confirm the utility of RNA-seq in qPCR analysis. The results showed that these transcripts were differentially expressed in oysters with different glycogen contents and were generally consistent with RNA sequencing data (Figure 6).
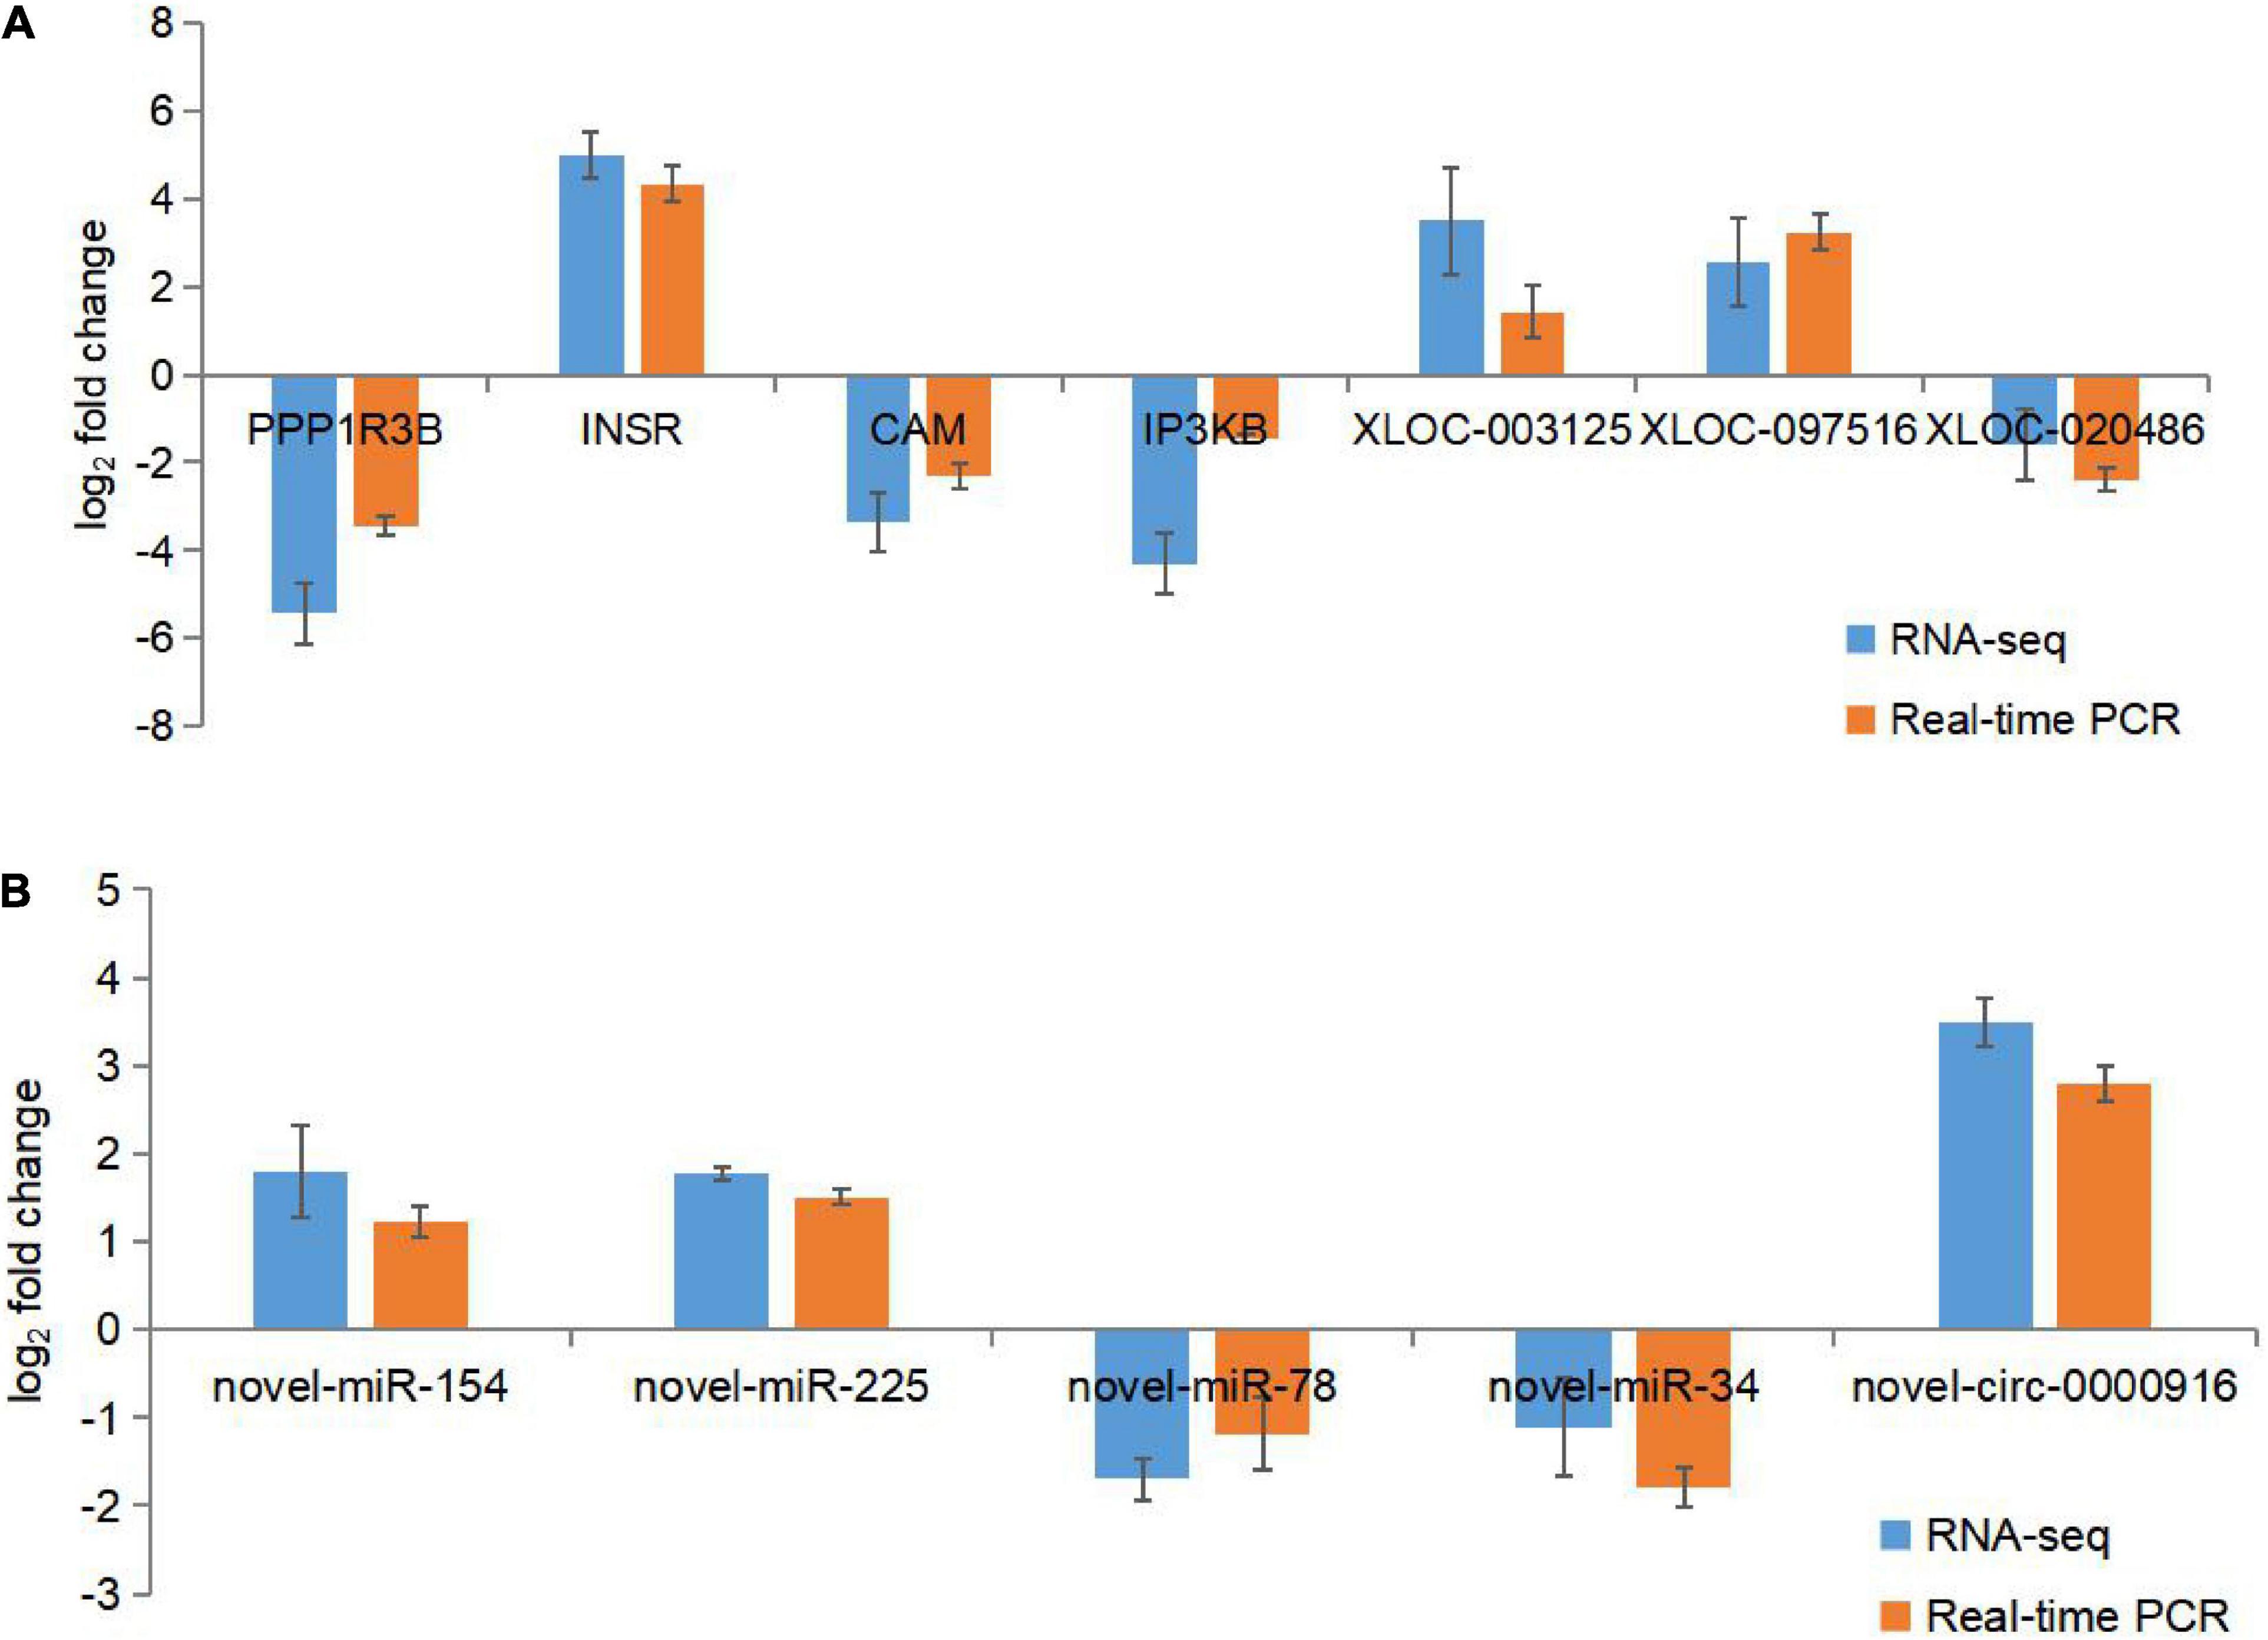
Figure 6. RNA sequence data was verified using qPCR. (A) RNA-seq and q-PCR data for DEGs and DELs expression levels. (B) RNA-seq and q-PCR data of DECs and DEMis expression levels. Using eEF-1 and U6 as reference genes, the data represent the mean ± SD of three biological replicates, and each measurement was repeated three times. The fold change from the qPCR was calculated using the 2−△△ct method.
Oyster glycogen content is a quantitative trait, which varies greatly among individuals (Bacca et al., 2005; Aagesen and Haese, 2014). It is a complex and important trait that is affected by genetic and environmental factors, including seasons, nutrients, salinity, and temperature (Bacca et al., 2005; Varis et al., 2016). Liu’s (2019) previous research showed that March is the proliferation period of oyster gonads, and the glycogen content of oysters is higher than the mature period of oyster gonads. Therefore, in this study, oysters of a full sibling family in two different sea areas RZ and KTD were farmed, to eliminate any potential genetic influence. In March 2018, we collected samples separately and found that the oyster glycogen in the RZ area was significantly higher than that of oysters in the KTD area. Since carbohydrates such as glycogen, amino acids, and fatty acids are the three major nutrients in organisms, their metabolic pathways are interrelated. An increase in free fatty acid levels may lead to an increase in glycogen content by reducing glycogen consumption (Randle et al., 1963). Similarly, a high-protein diet can increase glycogen content, because a large part of dietary amino acids are directed to glycogen synthesis (Fromentin et al., 2011). Therefore, we also measured the amino acid composition and fatty acid composition of the oysters in the RZGH and KTDGL groups, and the results found that there were significant differences in the amino acid composition and fatty acid composition of the oyster gonads between the two groups.
In this study, in order to get insight into the molecular regulation mechanism of glycogen content changes in oysters under different environments, we compared the differences in the expression profiles of mRNA, miRNA, lncRNA, and circRNA in the oyster gonads in the RZGH and KTDGL groups of a full sibling family. To determine the key factors involved in the regulation of glycogen content. Functional analysis of 2,084 differentially expressed genes showed that the insulin-like family genes were significantly enriched. Previous studies had shown that insulin could promote glycogen synthesis in mammals (Li et al., 2019). Lymnaea stagnalis was the first shellfish to discover insulin-like family genes, and for invertebrates, the insulin-like family was widespread and highly conserved (Li et al., 1992). It was mainly involved in growth, development, and metabolism (Brogiolo et al., 2001). However, whether insulin-like in C. gigas was related to glycogen content had not been reported. INSR is an insulin-like receptor protein tyrosine kinase substrate (Payankaulam et al., 2019), PTP dephosphorylates the tyrosine residues on the insulin receptor or its substrate, which prevents the insulin receptor from binding to insulin and negatively regulates insulin signal transduction (Haeusler et al., 2018). During the research, it was found that PTP was lowly expressed in RZGH oyster gonads, and INSR was highly expressed in RZGH oyster gonads. Therefore, it is speculated that the low expression of PTP in RZGH oyster gonads reduces the negative regulation of insulin-like signal transduction and further promotes glycogen synthesis. There are several genes related to glycogen synthesis in the insulin signaling pathway. For example, PPP1R3B was highly expressed in RZGH oyster gonad, it could cause glycogen synthase dephosphorylation, promote glycogen synthase activity, and further promote glycogen synthesis (Liu et al., 2019). LncRNA performs its function mainly by regulating mRNA, and analysis of the potential function of lncRNA is mainly predicted by analyzing their protein-coding target genes (Zhang et al., 2016). In the RZGH vs KTDGL group, it was found that lncRNA cis targets 471 mRNAs and trans targets 1,327 mRNAs. Functional enrichment analysis found that it was similar to differentially expressed mRNA and was related to insulin-like synthesis. For example, some of differentially expressed lncRNAs, XLOC-019254, XLOC-003125, XLOC-097516, and XLOC-020486 regulate CAM, PTP, INSR, IP3KB, etc., respectively. Therefore, lncRNA may play a certain regulatory role in insulin-like metabolism.
In eukaryotes, miRNAs have been reported to affect a variety of BPs, including glycogen metabolism (Dou et al., 2015), and their role in regulation is very important. With the development of high-throughput sequencing technology, studies on the miRNA transcriptome profiles of various mollusks have been reported (Xu et al., 2014; Zhou et al., 2014), and a new theory competitive endogenous RNA (ceRNA) has been proposed. However, in oysters, there is no report about miRNAs targeting glycogen metabolism in different environments. In this study, functional analysis of the seven differentially expressed miRNA target genes revealed that the differentially expressed miRNA might also be related to the insulin signaling pathway. The analysis found that in the network interaction analysis, INSR genes and lncRNAs XLOC-116536, XLOC-104062, etc., were all negatively regulated by novel-miR-13, novel-miR-34, and novel-circ-0000916 and INSR gene were all negatively regulated by novel-miR-78. These reports and our research results indicate that the ceRNA network formed by the interaction of lncRNA–miRNA–mRNA and circRNA–miRNA–mRNA related to the insulin-like signaling pathway may play a role in the regulation of glycogen content in different environments, but the specific function needs further study.
In summary, we compared the expression characteristics of mRNA and ncRNA in the same high-glycogen content sibling family produced two different phenotypes of C. gigas with high and low glycogen content. The results show that there are a large number of ncRNAs in gonadal tissues, and bioinformatics analysis shows that ncRNAs are involved in insulin-like metabolism. These include novel-miR-78, novel-miR-154, novel-miR-225, and novel-circ-0000916 and XLOC-116536, XLOC-105344, and XLOC-104062, etc. These findings may help us to further understand the regulatory effects of ncRNA on glycogen content in different environments, and provide new information for selective breeding of C. gigas in future.
The original contributions presented in the study are publicly available. This data can be found here: https://www.ncbi.nlm.nih.gov/Traces/study/?acc=SRP330386&o=acc_s%3Aa.
WW and JY contributed to the conception and design of the study. WW, XW, ZL, QL, and BL completed the material preparation, and data collection and analysis. GS, TX, XX, and YF supervised the data collection and analysis. WW and XW wrote the first draft. All authors read and approved the final manuscript.
This work was supported by the National Nature Science Foundation of China, No. 31402298, the Earmarked Fund for Agriculture Seed Improvement Project of Shandong Province, China, No. 2020LZGC016, and Innovation and Entrepreneurship Program of Jiangsu Province, China.
BL and JY were employed by the company Yantai Haiyu Marine Science and Technology Co., Ltd.
The remaining authors declare that the research was conducted in the absence of any commercial or financial relationships that could be construed as a potential conflict of interest.
All claims expressed in this article are solely those of the authors and do not necessarily represent those of their affiliated organizations, or those of the publisher, the editors and the reviewers. Any product that may be evaluated in this article, or claim that may be made by its manufacturer, is not guaranteed or endorsed by the publisher.
Aagesen, A. M., and Haese, C. C. (2014). Seasonal effects of heat shock on bacterial populations, including artificial vibrio parahaemolyticus exposure, in the pacific oyster, crassostrea gigas. Food Microbiol. 38, 93–103. doi: 10.1016/j.fm.2013.08.008
Bacca, H., Huvet, A., Fabioux, C., Daniel, J.-Y., Delaporte, M., Pouvreau, S., et al. (2005). Molecular cloning and seasonal expression of oyster glycogen phosphorylase and glycogen synthase genes. Comp. Biochem. Physiol. B Biochem. Mol. Biol. 140, 635–646. doi: 10.1016/j.cbpc.2005.01.005
Ballester, M., Cordon, R., and Folch, J. M. (2013). DAG expression: high-throughput gene expression analysis of real-time PCR data using standard curves for relative quantification. PLoS One 8:e80385. doi: 10.1371/journal.pone.0080385
Brogiolo, W., Stocker, H., Ikeya, T., Rintelen, F., Fernandez, R., and Hafen, E. (2001). An evolutionarily conserved function of the Drosophila insulin receptor and insulin-like peptides in growth control. Curr. Biol. 11, 213–221. doi: 10.1016/S0960-9822(01)00068-9
Chan, J. J., and Tay, Y. (2018). Noncoding RNA:RNA Regulatory Networks in Cancer. Int J Mol Sci. 19, 1310. doi: 10.3390/ijms19051310
Dou, L., Meng, X., Sui, X., Wang, S., Shen, T., and Huang, X. (2015). MiR-19a regulates PTEN expression to mediate glycogen synthesis in hepatocytes. Sci. Rep. 5:11602. doi: 10.1038/srep11602
Enright, A., John, B., Gaul, U., Tuschl, T., Sander, C., Marks, D., et al. (2003). MicroRNA targets in Drosophila. Genome Biol. 4, 1–27. doi: 10.1186/gb-2003-4-11-p8
Feng, D., Li, Q., Yu, H., Kong, L., and Du, S. (2018). Transcriptional profiling of long non-coding RNAs in mantle of Crassostrea gigas and their association with shell pigmentation. Sci. Rep. 8:1436. doi: 10.1038/s41598-018-19950-6
Friedlander, M. R., Mackowiak, S. D., Li, N., Chen, W., and Rajewsky, N. (2012). miRDeep2 accurately identifies known and hundreds of novel microRNA genes in seven animal clades. Nucleic Acids Res. 40, 37–52. doi: 10.1093/nar/gkr688
Fromentin, C., Azzout-Marniche, D., Tomé, D., Even, P., Luengo, C., Piedcoq, J., et al. (2011). The postprandial use of dietary amino acids as an energy substrate is delayed after the deamination process in rats adapted for 2 weeks to a high protein diet. Amino Acids 40, 1461–1472. doi: 10.1007/s00726-010-0756-3
Gao, Y., Zhang, J., and Zhao, F. (2018). Circular RNA identification based on multiple seed matching. Brief Bioinform. 19, 803–810. doi: 10.1093/bib/bbx014
Haeusler, R. A., McGraw, T. E., and Accili, D. (2018). Biochemical and cellular properties of insulin receptor signalling. Nat. Rev. Mol. Cell Biol. 19, 31–44. doi: 10.1038/nrm.2017.89
Hata, K., Hata, M., and Matsuda, K. (1993). Purification and properties of glycogen phosphorylase from the adductor muscle of the oyster, Crassostrea gigas. Comp. Biochem. Physiol. B 105, 481–486. doi: 10.1016/0305-0491(93)90077-I
Kong, L., Zhang, Y., Ye, Z. Q., Liu, X. Q., Zhao, S. Q., Wei, L., et al. (2007). CPC: assess the protein-coding potential of transcripts using sequence features and support vector machine. Nucleic Acids Res. 35, W345–W349. doi: 10.1093/nar/gkm391
Langmead, B., Trapnell, C., Pop, M., and Salzberg, S. L. (2009). Ultrafast and memory-efficient alignment of short DNA sequences to the human genome. Genome Biol. 10:R25. doi: 10.1186/gb-2009-10-3-r25
Li, B., Meng, J., Li, L., Liu, S., Wang, T., and Zhang, G. (2017a). Identification and functional characterization of the glycogen synthesis related gene glycogenin in pacific oysters (Crassostrea gigas). J. Agric. Food Chem. 65, 7764–7773. doi: 10.1021/acs.jafc.7b02720
Li, B., Song, K., Meng, J., Li, L., and Zhang, G. (2017b). Integrated application of transcriptomics and metabolomics provides insights into glycogen content regulation in the Pacific oyster Crassostrea gigas. BMC Genomics 18:713. doi: 10.1186/s12864-017-4069-8
Li, K. W., Geraerts, W. P., and Joosse, J. (1992). Purification and sequencing of molluscan insulin-related peptide II from the neuroendocrine light green cells in Lymnaea stagnalis. Endocrinol 130, 3427–3432. doi: 10.1210/en.130.6.3427
Li, Q., Zhao, Q., Zhang, J., Zhou, L., Zhang, W., Chua, B., et al. (2019). The protein phosphatase 1 complex is a direct target of AKT that links insulin signaling to hepatic glycogen deposition. Cell Rep. 28, 3406–3422. doi: 10.1016/j.celrep.2019.08.066
Liu, P. (2019). Study on Nutrition Quality, Flavor and Plankton Correlation of Crassostrea gigas. Ph.D. thesis. Shanghai: Shanghai Ocean University.
Liu, S., Li, L., Meng, J., Song, K., Huang, B., Wang, W., et al. (2019). Association and functional analyses revealed that PPP1R3B plays an important role in the regulation of glycogen content in the pacific oyster Crassostrea gigas. Front. Genet. 10:106. doi: 10.3389/fgene.2019.00106
Mao, X., Cai, T., Olyarchuk, J. G., and Wei, L. (2005). Automated genome annotation and pathway identification using the KEGG Orthology (KO) as a controlled vocabulary. Bioinformatics 21, 3787–3793. doi: 10.1093/bioinformatics/bti430
Mistry, J., Bateman, A., and Finn, R. D. (2007). Predicting active site residue annotations in the Pfam database. BMC Bioinformatics 8:298. doi: 10.1186/1471-2105-8-298
Payankaulam, S., Raicu, A. M., and Arnosti, D. N. (2019). Transcriptional regulation of INSR, the insulin receptor gene. Genes 10:984. doi: 10.3390/genes10120984
Pertea, M., Kim, D., Pertea, G. M., Leek, J. T., and Salzberg, S. L. (2016). Transcript-level expression analysis of rna-seq experiments with hisat, stringtie and ballgown. Nat. Protoc. 11, 1650–1667. doi: 10.1038/nprot.2016.095
Randle, P. J., Garland, P. B., Hales, C. N., and Newsholme, E. A. (1963). The glucose fatty-acid cycle. its role in insulin sensitivity and the metabolic disturbances of diabetes mellitus. Lancet 281, 785–789. doi: 10.1016/S0140-6736(63)91500-9
Renault, T., Faury, N., Barbosa-Solomieu, V., and Moreau, K. (2011). Suppression substractive hybridisation (SSH) and real time PCR reveal differential gene expression in the Pacific cupped oyster, Crassostrea gigas, challenged with ostreid herpesvirus 1. Dev. Comp. Immunol. 35, 725–735. doi: 10.1016/j.dci.2011.02.004
Saito, R., Smoot, M. E., Ono, K., Ruscheinski, J., Wang, P. L., Lotia, S., et al. (2012). A travel guide to cytoscape plugins. Nat. Methods 9, 1069–1076. doi: 10.1038/nmeth.2212
Tanguy, A., Boutet, I., Boudry, P., Degremont, L., Laroche, J., and Moraga, D. (2006). Molecular identification and expression of the phosphoglucomutase (PGM) gene from the Pacific oyster Crassostrea gigas. Gene 382, 20–27. doi: 10.1016/j.gene.2006.06.005
Trapnell, C., Williams, B. A., Pertea, G., Mortazavi, A., Kwan, G., van Baren, M. J., et al. (2010). Transcript assembly and quantification by RNA-Seq reveals unannotated transcripts and isoform switching during cell differentiation. Nat. Biotechnol. 28, 511–515. doi: 10.1038/nbt.1621
Varis, J., Haverinen, J., and Vornanen, M. (2016). Lowering temperature is the trigger for glycogen build-up and winter fasting in crucian carp (Carassius Carassius). Zool Sci 33, 83–91. doi: 10.2108/zs150072
Wang, W. J., Yang, J. M., Li, Q., Ji, R., Gong, X. H., and Li, L. (2015). Development of calibration models for rapid determination of chemical composition of pacific oyster (Crassostrea gigas) by near infrared reflectance spectroscopy. J. Shellfish Res. 34, 303–309. doi: 10.2983/035.034.0212
Wen, M., Shen, Y., Shi, S., and Tang, T. (2012). miREvo: an integrative microRNA evolutionary analysis platform for next-generation sequencing experiments. BMC Bioinformatics 13:140. doi: 10.1186/1471-2105-13-140
Xu, F., Wang, X., Feng, Y., Huang, W., Wang, W., Li, L., et al. (2014). Identification of conserved and novel microRNAs in the Pacific oyster Crassostrea gigas by deep sequencing. PLoS One 9:e104371. doi: 10.1371/journal.pone.0104371
Young, M. D., Wakefield, M. J., Smyth, G. K., and Oshlack, A. (2010). Gene ontology analysis for RNA-seq: accounting for selection bias. Genome Biol. 11:R14. doi: 10.1186/gb-2010-11-2-r14
Yu, H., Zhao, X., and Li, Q. (2016). Genome-wide identification and characterization of long intergenic noncoding RNAs and their potential association with larval development in the Pacific oyster. Sci. Rep. 6:20796. doi: 10.1038/srep20796
Zeng, Z., Ni, J., and Ke, C. (2013). Expression of glycogen synthase (GYS) and glycogen synthase kinase 3beta (GSK3beta) of the Fujian oyster, Crassostrea angulata, in relation to glycogen content in gonad development. Comp. Biochem. Physiol. B Biochem. Mol. Biol. 166, 203–214. doi: 10.1016/j.cbpb.2013.09.003
Zhang, S., Qin, C., Cao, G., Xin, W., Feng, C., and Zhang, W. (2016). Systematic analysis of long noncoding RNAs in the senescence-accelerated mouse prone 8 brain using RNA sequencing. Mol. Ther. Nucleic Acids 5:e343. doi: 10.1038/mtna.2016.57
Zhou, L., Chen, J., Li, Z., Li, X., Hu, X., Yi, H., et al. (2010). Integrated profiling of micrornas and mrnas: micrornas located on xq27.3 associate with clear cell renal cell carcinoma. PLoS One 5:e15224. doi: 10.1371/journal.pone.0015224
Keywords: Crassostrea gigas, glycogen, ncRNA, ceRNA, epigenetic regulation
Citation: Wang X, Wang W, Li Z, Sun G, Xu T, Xu X, Feng Y, Luo Q, Li B and Yang J (2021) Comprehensive Analysis of Differentially Expressed mRNA, Non-coding RNA, and Their Competitive Endogenous RNA Network of Pacific Oyster Crassostrea gigas With Different Glycogen Content Between Different Environments. Front. Mar. Sci. 8:725628. doi: 10.3389/fmars.2021.725628
Received: 15 June 2021; Accepted: 06 October 2021;
Published: 28 October 2021.
Edited by:
Yuehuan Zhang, South China Sea Institute of Oceanology, Chinese Academy of Sciences (CAS), ChinaReviewed by:
Ryan Spengler, University of Wisconsin–Madison, United StatesCopyright © 2021 Wang, Wang, Li, Sun, Xu, Xu, Feng, Luo, Li and Yang. This is an open-access article distributed under the terms of the Creative Commons Attribution License (CC BY). The use, distribution or reproduction in other forums is permitted, provided the original author(s) and the copyright owner(s) are credited and that the original publication in this journal is cited, in accordance with accepted academic practice. No use, distribution or reproduction is permitted which does not comply with these terms.
*Correspondence: Weijun Wang, d3dqMjUzMDYxNkAxNjMuY29t; Jianmin Yang, bGFkZGVydXBAMTI2LmNvbQ==
Disclaimer: All claims expressed in this article are solely those of the authors and do not necessarily represent those of their affiliated organizations, or those of the publisher, the editors and the reviewers. Any product that may be evaluated in this article or claim that may be made by its manufacturer is not guaranteed or endorsed by the publisher.
Research integrity at Frontiers
Learn more about the work of our research integrity team to safeguard the quality of each article we publish.