- 1Aquatic Sciences, Faculty of Fisheries, Kagoshima University, Kagoshima, Japan
- 2Graduate School of Agriculture, Forestry and Fisheries, Kagoshima University, Kagoshima, Japan
- 3Atmosphere and Ocean Research Institute, The University of Tokyo, Chiba, Japan
- 4Food and Life Sciences, Faculty of Fisheries, Kagoshima University, Kagoshima, Japan
- 5Faculty of Environmental and Symbiotic Sciences, Prefectural University of Kumamoto, Kumamoto, Japan
To evaluate the importance of the northern Satsunan area in southern Japan as a spawning and nursery ground for chub mackerel (Scomber japonicus), we investigated the early life history characteristics (e.g., larval distribution, feeding habits, and growth) of S. japonicus over five successive years. This area is considered the main habitat and spawning ground of the congeneric species, S. australasicus. Using polymerase chain reaction-restriction fragment length polymorphism analysis, we first confirmed that S. japonicus larvae were abundant in the northern Satsunan area, potentially representing a major spawning and nursery ground in the Japanese Pacific coastal area. The number of recorded larvae started to increase in 2016, corresponding to the population dynamics of the Pacific stock of the species, which has shown increasing trends in recent years. Morphological and DNA metabarcoding analyses of gut contents and stable isotope analysis showed that, in addition to copepods, the larvae fed substantially on appendicularians. The trophic pathway involving appendicularians might support the feeding habits of S. japonicus, promoting its coexistence with other dominant species. Both the instantaneous growth rate and daily specific growth rate were comparable to those in the southern East China Sea, which is the main spawning and nursery ground of the species. Our data strongly suggest that the northern Satsunan area has favorable conditions for sustaining high larval population densities, even during phases with high population numbers. Our results provide insights for the fisheries management for S. japonicus in the Japanese Pacific coastal area, especially during high-stock periods.
Introduction
In fish population dynamics, it is essential to ensure successful feeding for the survival of fish larvae (Hirai et al., 2017). At the critical larval stage, fish that have completed yolk absorption start exogenous feeding. Both the quality and quantity of prey are important for the growth of fish (Hjort, 1914). Therefore, the characterization of trophic ecology is essential for understanding the recruitment dynamics of fish (Hirai et al., 2017; Kume et al., 2021). The growth rate of fish is determined by multiple environmental factors, such as water temperature and prey availability (Heath, 1992; Takasuka et al., 2016), along with the key factors regulating the survival potential during the early life stages and the recruitment success of the fish (Shoji et al., 2005; Robert et al., 2007; Kamimura et al., 2015; Takasuka et al., 2016).
The chub mackerel, Scomber japonicus, is one of the most important commercial fishes for the countries adjacent to the East China Sea (Sassa and Tsukamoto, 2010). In Japan, both S. japonicus and the spotted mackerel, S. australasicus, have been managed as a single unit under a total allowable catch system (Yukami et al., 2009). Scomber japonicus is considered as two separate stocks, comprising the Pacific stock and the Tsushima Current stock (Yukami et al., 2009). The population dynamics of S. japonicus respond to climate change in the long term, similar to those of other small pelagic fishes, such as the Japanese sardine (Sardinops melanostictus), Japanese anchovy (Engraulis japonicus), and Pacific saury (Cololabis saira) (Yatsu, 2019). The annual stock size of the Pacific stock of S. japonicus were approximately 3,000–5,000 thousand tons during the 1970s but declined to 153 thousand tons in 2001, which have since increased, reaching 6,808 thousand tons in 2019 (Supplementary Figure 1; Japan Fisheries Research Agency [FRA], 2020b). The population of the Pacific stock of S. japonicus has shown an increasing trend in recent years.
The northern Satsunan area is located south of Kagoshima Prefecture on Kyushu Island, southern Japan (Figure 1). The northern Satsunan area is considerably affected by the meandering and meso-scale eddies of the Kuroshio Current in the East China Sea (Nakamura et al., 2003, 2015). Even under these variable environmental conditions, commercial pelagic fish species, such as E. japonicus and T. japonicus, utilize the area as a major spawning ground on the Pacific coast of Japan (Hattori, 1964). The northern Satsunan was the main spawning ground of S. melanostictus during a high-stock period (Kuroda, 2007). A substantial number of larvae and juveniles that hatch in this area are assumed to be recruited to the Pacific coast via the Kuroshio Current (Hattori, 1964; Konishi, 1983; Miyaji, 1989). The northern Satsunan area functions as a spawning and nursery ground for the Pacific stocks of these pelagic fish species (Hattori, 1964).
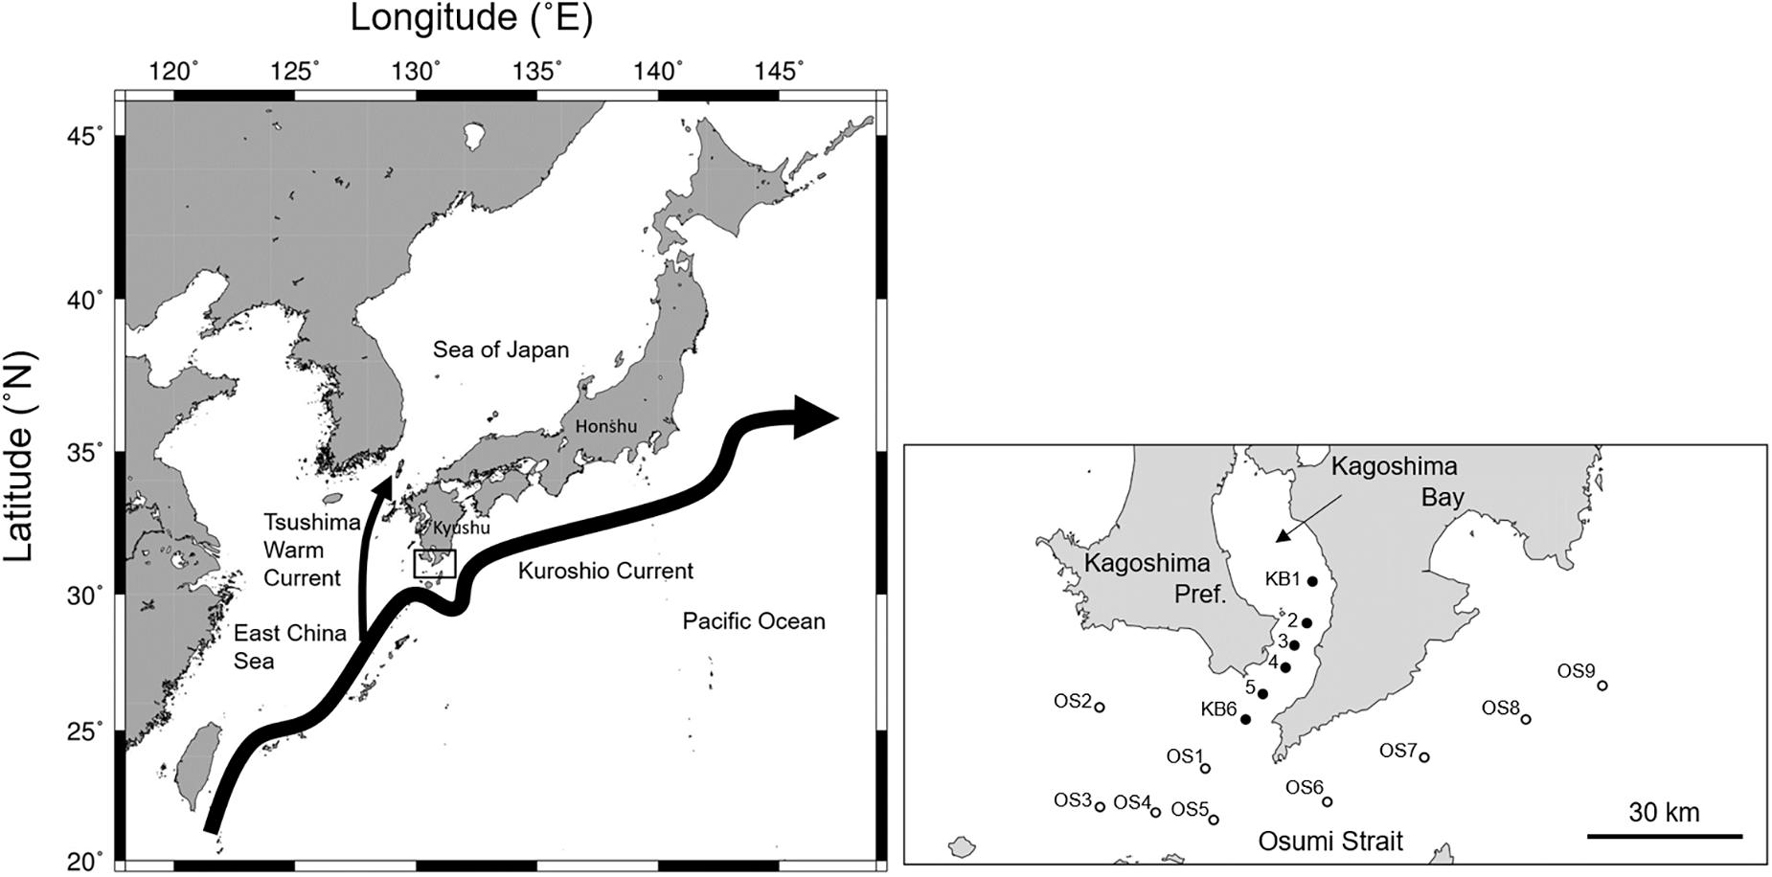
Figure 1. The location of the northern Satsunan area, southern Japan (left), and a close up of the sampling stations in the mouth of Kagoshima Bay and the Osumi Strait (right). Closed and open circles indicate stations in the mouth of Kagoshima Bay (KB1–KB6) and in the Osumi Strait (OS1–9), respectively.
Extensive spawning grounds of both S. japonicus and S. australasicus are found in the southern East China Sea, and a substantial number of larvae reach the Pacific Ocean off the coast of southern Japan via the Kuroshio Current (Sassa and Tsukamoto, 2010). In the northern Satsunan area, both S. japonicus and S. australasicus are caught throughout the year. This area is considered the main habitat and spawning ground for S. australasicus, as catches contain mainly this species (Tanoue, 1956; Fukumoto, 2018). Catches of the Pacific S. australasicus stock have tended to decrease (Japan Fisheries Research Agency [FRA], 2020a), while catches of the Pacific S. japonicus stock have been increasing in recent years with the highest catch (over 2,000 tons) being recorded in the northern Satsunan area in March 2017 during their main spawning season (Fukumoto, 2018). The northern Satsunan area can currently be utilized as an important spawning ground for S. japonicus, rather than for S. australasicus. In addition to the population in the southern East China Sea, the population in the northern Satsunan area might contribute to the Pacific stock as an important source population. However, no studies on the early life history of S. japonicus in the northern Satsunan area have been conducted.
In the present study, we conducted field surveys over five successive years to examine the early life history (including larval distribution, feeding habits, and growth) of S. japonicus in the northern Satsunan area to evaluate the importance of this area as a spawning and nursery ground for S. japonicus. Larval S. japonicus specimens were identified using polymerase chain reaction-restriction fragment length polymorphism (PCR-RFLP) analysis of mitochondrial DNA, and their distribution pattern was confirmed. We evaluated larval feeding habits using morphological and DNA metabarcoding analyses of their gut contents and examined the trophic relationships between the larvae and their prey based on stable isotope analysis. The growth of S. japonicus larvae was estimated based on otolith increments and compared with that in the southern East China Sea. Our results are expected to provide insights for the appropriate fisheries management of S. japonicus in the Japanese Pacific coastal area during high-stock periods.
Materials and Methods
Field Surveys
Field surveys were conducted in the northern Satsunan area onboard the T/S Nansei-maru (Faculty of Fisheries, Kagoshima University) on February 17–March 6, 2015, May 28–30, 2015, March 22–April 5, 2016, April 4–5, 2017, March 24–29, 2018, and March 25–April 2, 2019. This covered the main spawning season for S. japonicus and S. australasicus (Figure 1; Japan Fisheries Research Agency [FRA], 2020b). Field surveys were conducted twice only in 2015. All surveys were conducted during the daytime. Fish specimens were collected from 11 fixed stations: six in the mouth of Kagoshima Bay (KB1–KB6) and five in the Osumi Strait (OS1–OS5). Since 2018, four more stations (OS6–OS9) were added to the Osumi Strait. We could not perform surveys at all stations throughout the five years due to arduous ocean conditions. In the study area, water depth ranged from 82–269 m.
An Ocean Research Institute (ORI) net (diameter: 160 cm; mesh size: 335 μm) was used to sample the fish larvae at each station. The ORI net was obliquely towed from the bottom (approximately 10 m above the sea floor) to the surface of the ocean at approximately 2 knots. The towing layers were estimated based on the length and slope angle of the towrope. A flow meter was attached to the ORI net to record the volume of filtered water. Fish samples were fixed in 5.0% buffered formalin and preserved in 70.0% ethanol in 2015 and 2016. Fish samples were preserved in 99.5% ethanol in 2017, 2018, and 2019.
At each station, water temperature and salinity were recorded from the surface to the near bottom using a conductivity temperature depth profiler (CTD) system (SBE 911plus, Sea-Bird Scientific). Complementary surveys were conducted at KB2, KB5, and OS1 from April 2, 2021 to April 6, 2021 to collect fish samples for stable isotope analysis (Supplementary Table 1). All samples were frozen at −20°C immediately after collection for subsequent analysis.
Environmental Conditions
Water temperature and salinity were recorded as physical factors at the time of capture, as they potentially affect larval distribution and growth rate. Sassa and Tsukamoto (2010) reported that Scomber spp. larvae are concentrated in the upper 30-m layer, with peak densities at a depth of ∼20 m in the southern East China Sea. Accordingly, the water temperature and salinity values recorded at 20 m depth at each station were used for the analysis. The chlorophyll a concentration and abundance of prey were considered proxies for food availability at around the time of capture. Water samples were collected using a carousel multi-sampler system (Sea-Bird Scientific) with an attached CTD from a depth of 20 m. For size-fractionated chlorophyll a, 200–1000 mL samples were filtered through nylon mesh (11 μm, Millipore) and glass microfiber filters [GM/F (2 μm) and GF/F (0.7 μm), Whatman]. Chlorophyll a was immediately extracted in N, N-dimethylformamide in the dark, and stored at −20°C for 24 h (Suzuki and Ishimaru, 1990). The chlorophyll a concentration was measured with a fluorometer (model TD700 or 10AU, Turner Designs) using a non-acidification fluorometric method (Welschmeyer, 1994).
Larval Distribution
Morphologically identified Scomber spp. larvae (n = 4,612) were isolated from samples collected from 2015 to 2019. The densities of the Scomber spp. larvae (individuals per 1,000 m–3) were calculated for each station.
The larval stages were recorded (preflexion, flexion, and postflexion) and the body length (BL; notochord length for preflexion and flexion larvae, and standard length for postflexion larvae) of each specimen was measured to the nearest 0.1 mm, using image analysis software (NIS-Elements D 3.1, Nikon Corporation) and a binocular stereomicroscope (Nikon SMZ1500, Nikon Corporation). For specimens collected in 2018 and 2019, when the sample size was much larger than that from the previous three years, the BLs of a maximum of 100 specimens were measured at each station. The BL composition of Scomber spp. larvae was summarized for each study period (February 17–March 6, 2015, May 28–30, 2015, March 22–April 5, 2016, April 4–5, 2017, March 24–29, 2018, and March 25–April 2, 2019).
Species Identification Using Polymerase Chain Reaction-Restriction Fragment Length Polymorphism Analysis
Morphologically identified Scomber spp. larvae were randomly chosen from fish samples preserved in 99.5% ethanol in 2017, 2018, and 2019. Genomic DNA was extracted from muscle tissue following a standard approach. The muscle samples were incubated in 1.5-mL tubes containing 90 μL 50 mM NaOH, heated at 95°C for 5 − 10 min, and buffered with 10 μL 1 M Tris-HCl (pH 8.0). After centrifugation at 13,000 × g for 10 min, the supernatant was collected. DNA fragments harboring the mitochondrial cytochrome b gene were amplified using PCR with the primer pair SACB-7L (5′-AGT CCC ATA CGT CGG TAC TA-3′) and SACB-8H (5′-CAT TCA GGC TTA ATA TGA GG-3′) (Sezaki et al., 2001). The reaction mixtures were preheated at 94°C for 2 min, followed by 35 cycles of amplification (denaturation at 98°C for 10 s, annealing at 56°C for 30 s, and extension at 68°C for 30 s). The amplified products were purified using the FastGene Gel/PCR extraction kit (Nippon Genetics Co., Ltd.).
The full-length cytochrome b gene (consisting of 1,140 nucleotides in both S. japonicus and S. australasicus) harbors 16 species-specific variations (Sezaki et al., 2001). To distinguish the cytochrome b genes of the two fish species, RFLP analysis was performed using two restriction enzymes. MvaI is specific for the cytochrome b gene of S. japonicus and MboI is specific for that of S. australasicus, with both enzymes producing two fragments (568 and 572 bp, and 753 and 387 bp in S. japonicus and S. australasicus, respectively; Sezaki et al., 2001). In this study, 5 μL amplified products were digested with MvaI and MboI for 2 h. The digested samples were electrophoresed on 1.0% agarose gel. The DNA bands were visualized after ethidium bromide staining and were then photographed. The larvae were identified as S. japonicus or S. australasicus using the PCR-RFLP method. The composition of each species was compared annually between the mouth of Kagoshima Bay and the Osumi Strait.
Morphological Analysis of Larval Gut Contents
Larvae were randomly chosen from the specimens preserved in 99.5% ethanol in 2018 that were identified as S. japonicus by the PCR-RFLP. The larvae (n = 139) were mounted on microscope slides, and their gut contents were extracted using a fine needle. Subsequently, the gut contents were covered with a glycerin drop. The prey were identified morphologically and counted under a binocular stereomicroscope.
Feeding intensity (FI%) was defined as the proportion of larvae with prey in their guts (Kume et al., 2015a, b). This index is considered a measure of feeding success. Diet composition was estimated using the percentage of each item to the total number of prey items examined (%N) and the percentage frequency of occurrence of each prey item (%F) in all the specimens with gut contents (Kume et al., 2015a, b).
DNA Metabarcoding Analysis for Larval Gut Contents
Larvae were randomly chosen from the specimens preserved in 99.5% ethanol in 2019 that were identified as S. japonicus by the PCR-RFLP. In total, 68 S. japonicus larvae were used for metabarcoding analysis. After washing the fish larvae with filtered seawater (0.2 μm pore-sized cartridge filter; Advantec), their whole guts were extracted and used for analysis. Genomic DNA was extracted in a 1.5-mL tube containing 30 μL 5% Chelex buffer (Bio-Rad). The samples were homogenized with a pellet pestle and heated at 95°C for 20 min, following the method of Nagai et al. (2012). After centrifuging at 12,000 rpm for 1 min, the DNA concentration in the supernatant was measured using a QubitTM assay kit (Thermo Fisher Scientific). A library for high-throughput sequencing was prepared following Hirai et al. (2017), with slight modifications. The 18S rRNA V9 region (approximately 130 bp) was amplified using the eukaryotic universal primers 1389F (5′-TTGTACACACCGCCC-3′) and 1510R (5′-CCTTCYGCAGGTTCACCTAC-3′; Amaral-Zettler et al., 2009). All PCR amplifications were performed using KOD Plus version 2 (Toyobo) in 15-μL reaction mixtures containing 7 μL distilled water, 1.5 μL 10 × buffer, 1.5 μL dNTPs (2 mM), 0.9 μL MgSO4 (25 mM), 0.9 μL of each primer (5 μM), 0.3 μL KOD Plus polymerase, and 2 μL template DNA. The first PCR included denaturation at 94°C for 2 min, followed by 25 cycles of 10 s denaturation at 98°C, 30 s annealing at 56°C, and 1 min extension at 68°C, with a final extension at 68°C for 7 min. Adaptor and dual-index sequences were attached during the second and third PCRs (see Hirai et al., 2017 for primer pair sequences). The products of the first and second PCRs were used as templates for the second and third PCRs, respectively. Eight cycles were performed for both the second and third PCRs, with an annealing temperature of 50°C for the second PCR and 59°C for the third PCR. The final PCR products were purified using a QIAquick PCR purification kit (Qiagen), and the concentration of the purified PCR product was measured with a QubitTM assay kit. The quality of the final PCR product was confirmed using an Agilent DNA High Sensitivity kit on a Bioanalyzer (Agilent). High-throughput sequencing was performed using a MiSeq reagent kit v2 on an Illumina MiSeq to obtain 2 × 250 bp paired-end sequence reads.
The raw sequence reads were quality-filtered using Trimmomatic (Bolger et al., 2014) and the paired-end sequences were merged and further quality-filtered in MOTHUR version 1.39.5 (Schloss et al., 2009), according to Hirai et al. (2017). After sequence alignment against the SILVA 119 database (Quast et al., 2013), single-linkage pre-clustering (Huse et al., 2010), and chimera removal using UCHIME (Edgar et al., 2011) in MOTHUR, taxonomic classification was performed based on the V9_PR2 reference database (de Vargas et al., 2015), using a naïve Bayesian classifier (Wang et al., 2007) with a threshold greater than 70%. As the present study focused on eukaryotic organisms, only sequences classified as “Eukaryota” were selected. The taxonomic groups “Craniata” (which includes vertebrates) and “Fungus” were excluded to avoid sequence reads from the host or fungal contaminants. In addition, the taxonomic groups “Alveolata,” “Stramenopiles,” “Euglenozoa,” and “Glycyphagidae” were excluded to avoid amplifying the gut contents of predatory zooplankton (secondary predation) and possible experimental contamination. The final quality-filtered sequences were classified into operational taxonomic units (OTUs). The 99% similarity threshold was used for high taxonomic resolution based on the average neighbor algorithm. As the present study focused on dominant taxonomic groups, rare OTUs with less than 0.01% of the total sequence reads were removed to avoid the erroneous inflation of OTUs.
The proportion of eukaryotic reads was calculated. The proportions of sequence reads were examined within the Metazoan taxonomic groups. Ten dominant OTUs were selected and investigated at the class, family, or genus level, based on a BLAST search against the NCBI database. Diet composition was estimated by calculating the proportion of each OTU in each sample (%N) and the proportion of samples containing each OTU (%F).
Stable Isotope Analysis
Frozen samples collected in 2021 were thawed in filtered seawater, and Scomber spp. were collected. The specimens for stable isotope analysis were chosen randomly. The larval stages were recorded and BL of the specimens measured to the nearest 0.1 mm, using image analysis software (NIS-Elements D 3.1, Nikon Corporation) with a binocular stereomicroscope (Nikon SMZ1500, Nikon Corporation). All specimens were treated as Scomber spp. for the analysis, as they could not be identified genetically. Four or five specimens of preflexion larvae were pooled to fulfill the detection limit for analysis (n = 4) (Supplementary Table 1). Flexion and postflexion larvae were analyzed individually (n = 9) (Supplementary Table 1). The specimens were rinsed with filtered seawater and dried at 60°C for at least 24 h on a nylon mesh (mesh opening: 0.1 mm). Owing to the low δ13C values for lipid fractions (DeNiro and Epstein, 1977; Monson and Hayes, 1982), lipids were extracted and removed from the samples using a 2:1 chloroform-methanol solution (v/v) and a centrifugal separator (8,000 rpm, 10 min) prior to isotopic analysis.
Stable isotope ratios of carbon (δ13C) and nitrogen (δ15N) were estimated for the lipid-free samples using an elemental analyzer/isotope ratio mass spectrometer (Thermo Fisher Scientific FLASH 2000, ConFloIV, DELTA V Advantage). The samples were transferred to pre-cleaned tin capsules and inserted in the mass spectrometer. Isotope values are shown in international relative standard δ-notation:
where, R is the isotopic ratio of 13C to 12C or 15N to 14N in the lipid-free fish sample (RZP) and standard (RSD). Samples were referenced to the Vienna-PeeDee Belemnite limestone standard for carbon and atmospheric nitrogen (AIR) standard for nitrogen. International and/or in-house standard materials (alanine, glycine, and histidine) were measured alongside the samples to calibrate the isotope data (Sato and Suzuki, 2010). The analytical errors associated with the standard materials were less than ± 0.2 for both carbon and nitrogen.
Based on the δ13C and δ15N values of the dominant pelagic and mesopelagic fish larvae (pelagic: Engraulis japonicus, Scomber spp., and Trachurus japonicus; mesopelagic: Sigmops gracilis and Myctophum asperum) during winter-spring in the northern Satsunan area and their prey (Ostracoda, Calanoida, Oithonidae, Harpacticoida, Oncaeidae, and Appendicularia), the trophic links between the fish larvae and their prey were estimated. The data, except for those of the Scomber spp. larvae, were obtained from Kume et al. (2021).
Larval Otolith Analysis
The larvae were randomly chosen from the specimens preserved in 99.5% ethanol in 2018 and 2019 that were identified as S. japonicus by the PCR-RFLP. The sagittal otoliths were dissected from larvae (n = 227) and embedded on a glass slide with enamel resin using a binocular stereomicroscope. The total number of otolith increments was counted using image analysis software (NIS-Elements D 3.2, Nikon Corporation) under a binocular light microscope (Nikon ECLIPSE 50i, Nikon Corporation). In the analysis, the first increment was defined as the hatch check, and the total number of increments on the outside of the hatch check were used to elucidate age, following Sassa and Tsukamoto (2010).
The instantaneous growth rate (G) and relative growth rate (K) were estimated and compared with those in the southern East China Sea, based on Sassa and Tsukamoto (2010), as follows (Yamashita and Bailey, 1989; Mendiola et al., 2009):
and
where L0 is the initial BL (mm) and Lt is the BL at time t (d). Daily specific growth rate (%) was defined as K × 100 (Mendiola et al., 2009).
Statistical Analyses
The environmental parameters (water temperature, salinity, and Chlorophyll a concentrations) and the mean density of larvae were compared between the mouth of Kagoshima Bay (KB 1–6) and the Osumi Strait (OS 1–9) across the five years to analyze the larval distribution pattern. The data were statistically compared using the Mann-Whitney U test because they were not normally distributed, and the sample size was small. In addition, statistical relationships between the larval density and water temperature, salinity, and chlorophyll a concentration were examined using linear regression.
The diet composition was compared with the larval size to test the existence of an ontogenetic dietary shift. The isotopic values (δ13C and δ15N) were compared with the taxonomic groups of the fish and their prey to estimate their trophic relationships. The data were statistically compared using the Kruskal-Wallis test and Dunn’s test because they were not normally distributed, and the sample size was small.
The difference in G between 2018 and 2019 was evaluated, and G was statistically compared between the two years using analysis of covariance (ANCOVA), performed for linearized exponential models.
All statistical analyses were performed using IBM SPSS version 26 (IBM Corp., Tokyo, Japan).
Results
Environmental Conditions
The environmental parameters tended to differ between the mouth of Kagoshima Bay and the Osumi Strait (Figure 2 and Table 1). The mean water temperature and salinity were higher in the Osumi Strait compared to that in the mouth of Kagoshima Bay. Chlorophyll a concentrations were higher in the mouth of Kagoshima Bay compared to that in the Osumi Strait, across all years.
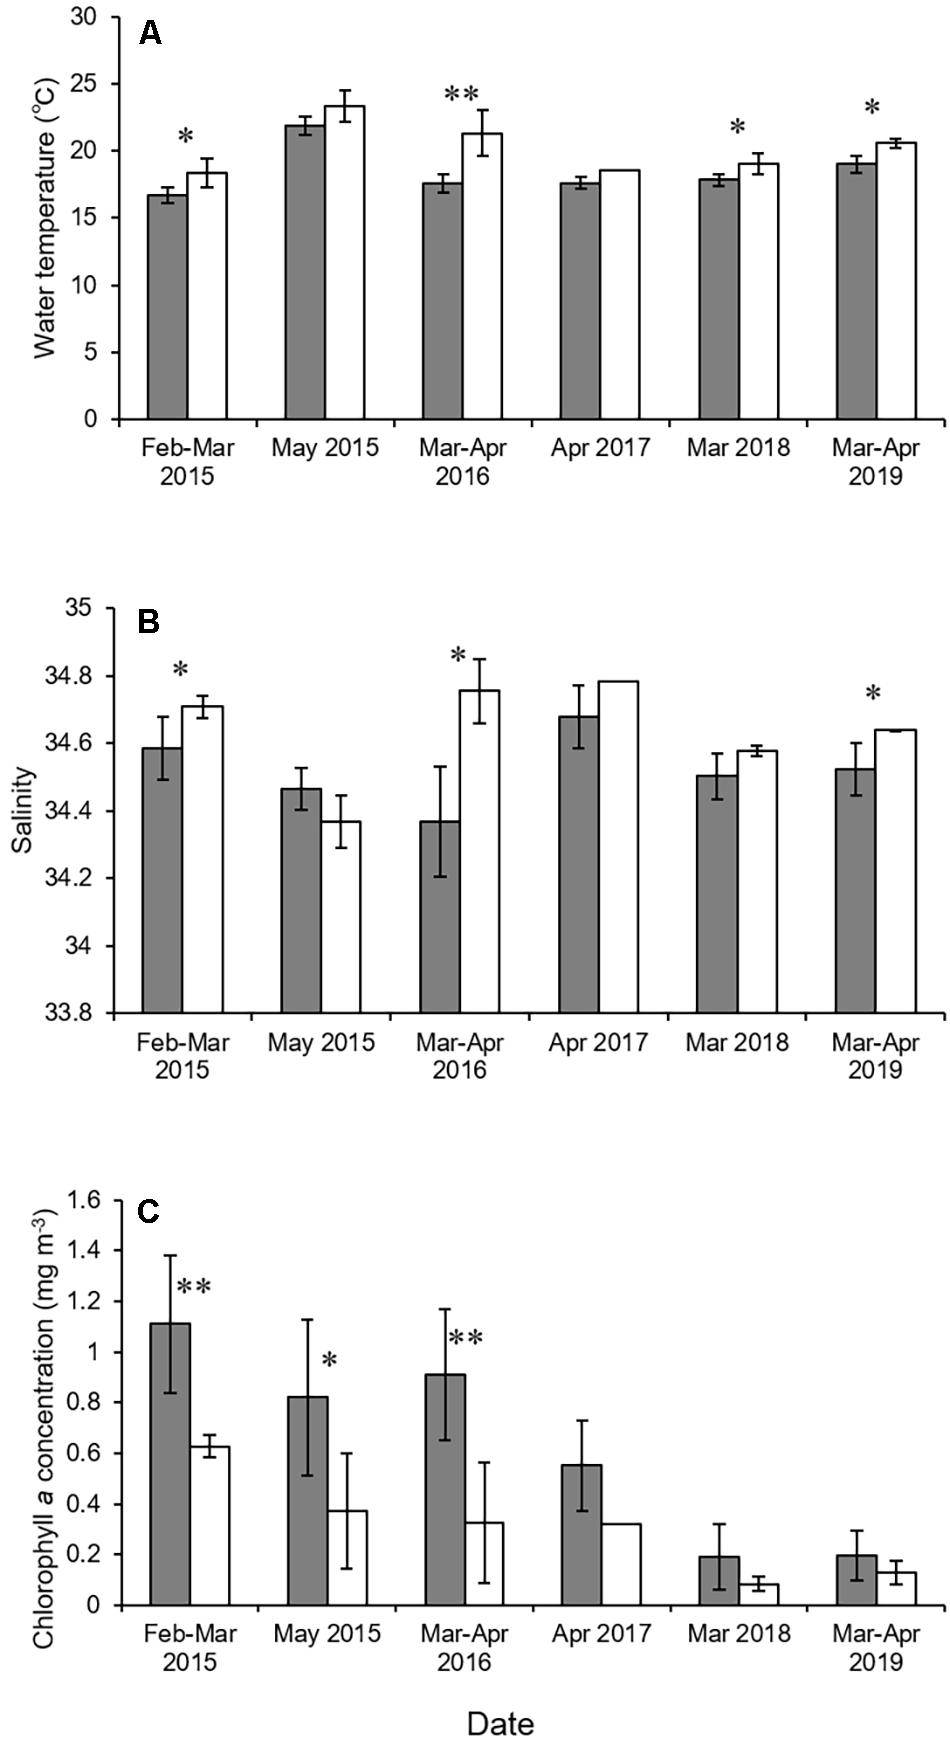
Figure 2. Mean water temperature (A), salinity (B), and chlorophyll a concentration (C) in the mouth of Kagoshima Bay and the Osumi Strait. Black and white bars indicate the mouth of Kagoshima Bay and the Osumi Strait, respectively. Bars indicate standard deviation. The asterisks ∗ and ∗∗ indicate significant levels of P < 0.05 and P < 0.01.
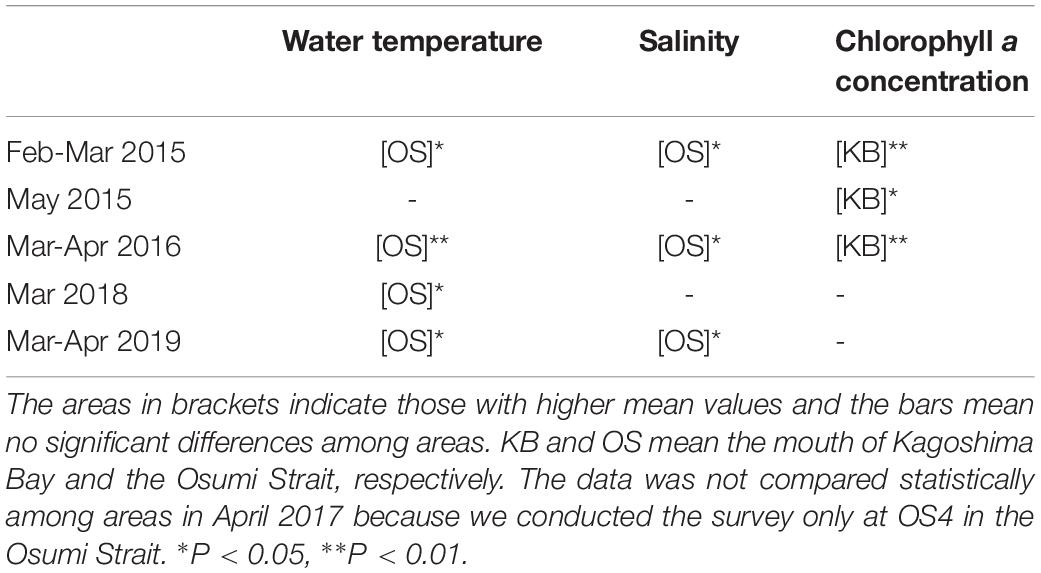
Table 1. Statistical comparison of between the physical and biological environmental parameters in the mouth of Kagoshima Bay and the Osumi Strait by Mann-Whitney U test.
Larval Distribution and Species Composition
We could only detect Scomber spp. larvae at KB3 in 2015 (Figure 3). The mean density of larvae started to increase in 2016 (10.8 individuals per 1,000 m–3 in the mouth of Kagoshima Bay and 3.3 individuals per 1,000 m–3 in the Osumi Strait). The mean density of larvae reached 724.0 and 159.4 individuals per 1,000 m–3 in the mouth of Kagoshima Bay and 343.2 and 8.9 per 1,000 m–3 in the Osumi Strait in 2018 and 2019, respectively (Figure 3). The mean density of larvae did not differ significantly between the two areas across the five years but tended to be higher in the mouth of the Kagoshima Bay than in the Osumi Strait. A significant negative relationship between larval density and chlorophyll a concentration was detected using linear regression analysis (r2 = 0.065, P < 0.05, n = 69).
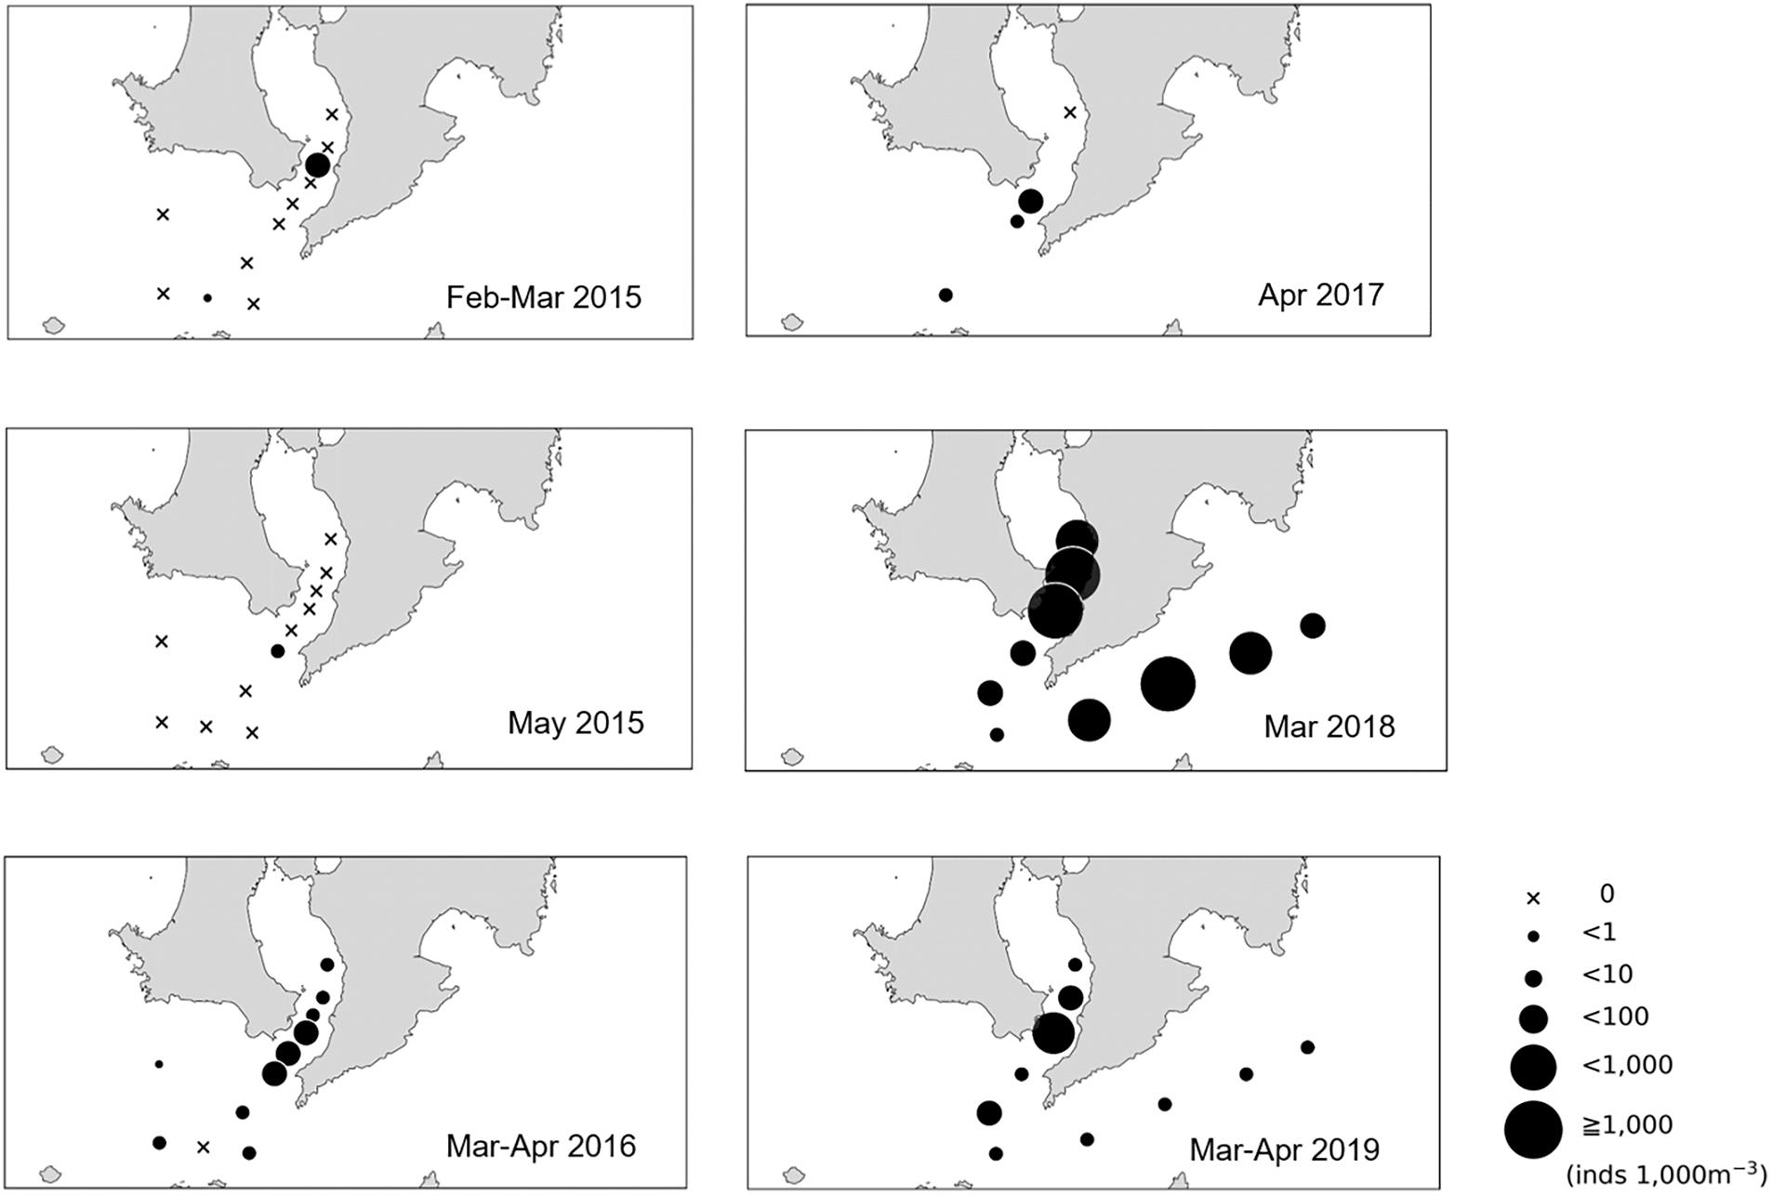
Figure 3. Larval density distribution (per 1,000 m–3) of Scomber spp. in the northern Satsunan area from 2015 to 2019.
The BL composition of the larvae was measured for each study period and ranged from 2.3–9.7 mm over the course of the study period (Figure 4). The difference between the size of the larvae in the mouth of Kagoshima Bay and the Osumi Strait differed among the years as follows. The size of the larvae was not significantly different when comparing the larvae found in the mouth of Kagoshima Bay and those in the Osumi Strait in 2016 and 2019 (Mann-Whitney U test, P = 0.790 and 0.109 for 2016 and 2019, respectively). They were significantly larger in the Osumi Strait in 2017 and in the mouth of Kagoshima Bay in 2018 (Mann-Whitney U test, P < 0.005 and P < 0.001 for 2017 and 2018, respectively).
Of the 305 Scomber spp. specimens collected from 2017 to 2019, S. japonicus larvae were dominant (S. japonicus: n = 273, S. australasicus: n = 32) (Figure 5). The percentages of S. japonicus and S. australasicus were 96.8% and 3.2% in the mouth of the Kagoshima Bay and 87.7% and 12.3% in the Osumi Strait.
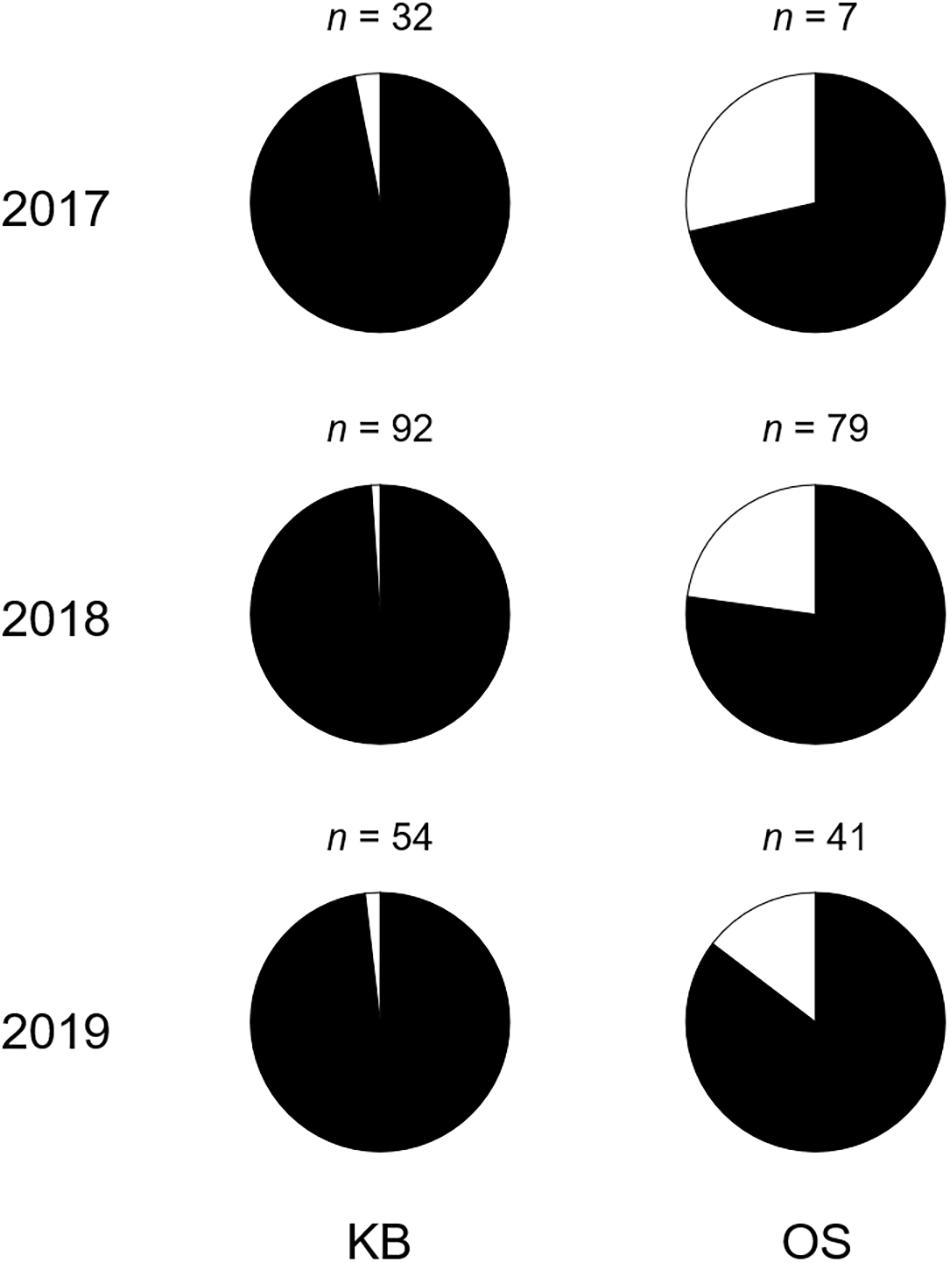
Figure 5. Composition of Scomber japonicus (black) and S. australasicus (white) larvae in the mouth of Kagoshima Bay and the Osumi Strait from 2017 to 2019, identified using PCR-RFLP. KB and OS indicate the mouth of Kagoshima Bay and the Osumi Strait, respectively. Numbers indicate sample size.
Larval Feeding Habits
Based on the morphological analysis of larval gut contents, feeding intensity (FI%) was similarly low in both areas (mouth of Kagoshima Bay: 36.6%, Osumi Strait: 40.4%) and throughout the larval size range (Table 2). Copepods (calanoid and poecilostomatoid), copepod nauplii, cladocerans, ostracods, and appendicularians were observed in the larval guts (Table 3). For appendicularians, only tails were observed in the gut. Diet composition did not differ among areas, and calanoid copepods were the most abundant taxon in both areas, based on%N and%F. Ontogenetic variation in diet was observed (Figure 6). Only large individuals (≥6.0 mm) fed on appendicularians (25.0% for%N).
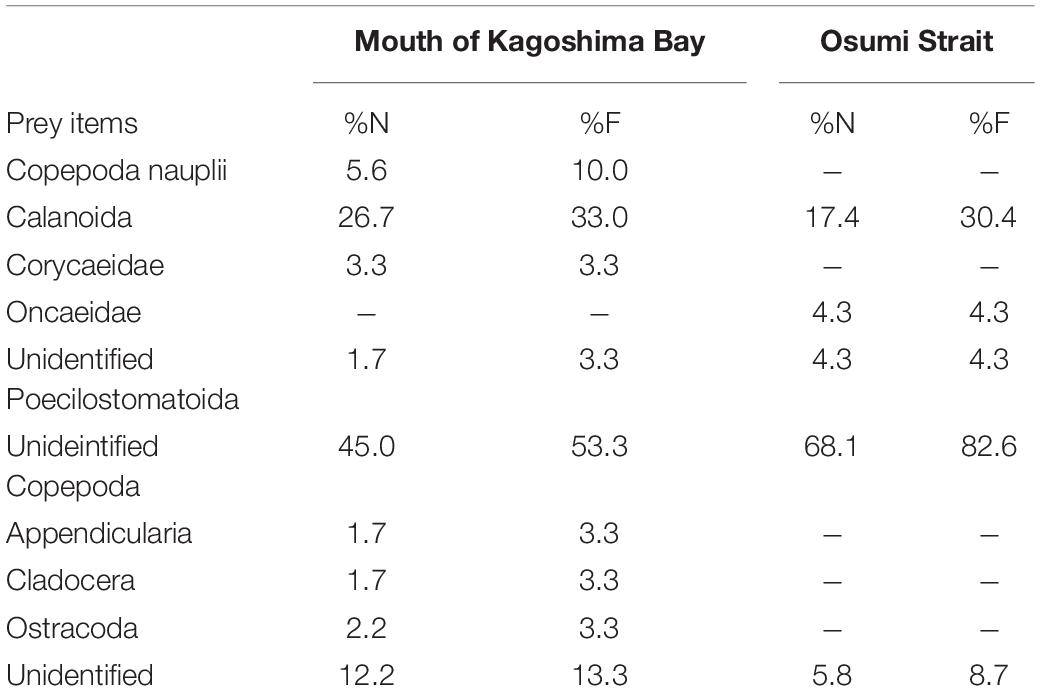
Table 3. Percentage number (%N) and percentage frequency of occurrence (%F) of prey items in diet of Scomber japonicus larvae based on morphological analysis.
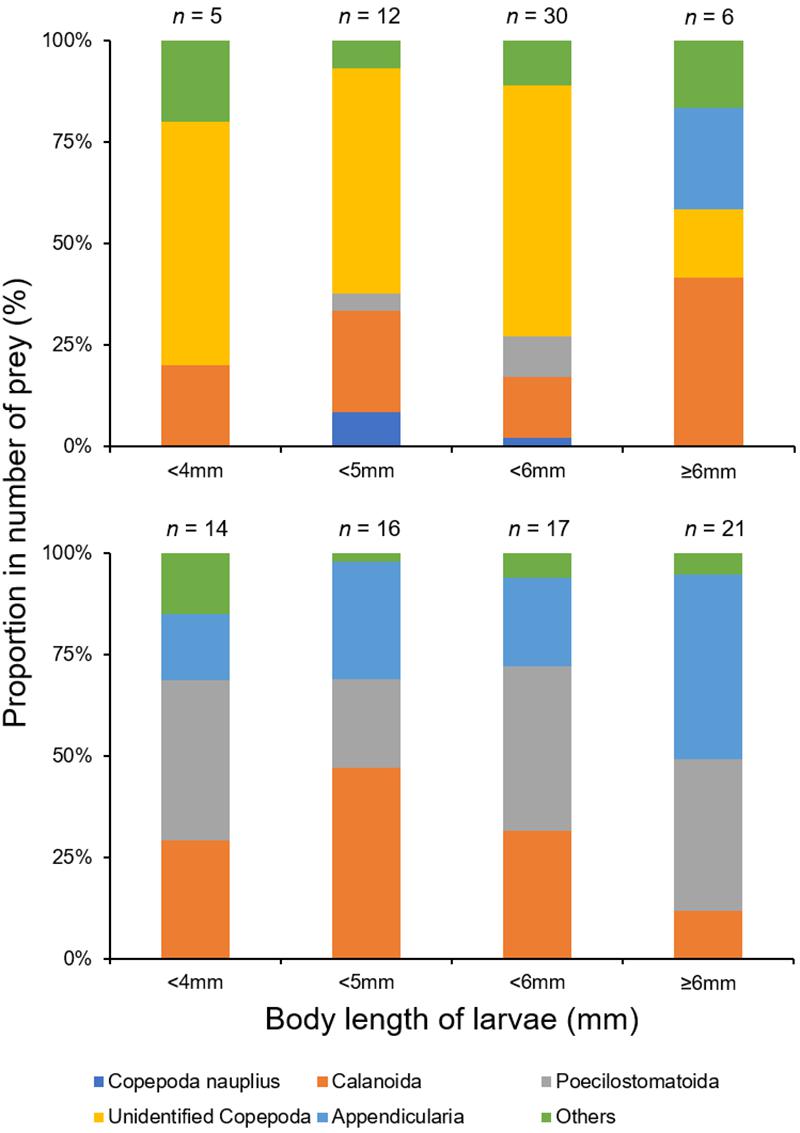
Figure 6. Ontogenetic variations in mean percentage number of prey in the diet of Scomber japonicus larvae, based on both morphological (top) and DNA metabarcoding (bottom) analyses. Numbers indicate sample size.
For metabarcoding analysis, the sequencing reads of prey items were detected in the guts of all larvae. The total number of sequencing reads of prey items in the diet of the larvae used for DNA metabarcoding analysis ranged from 3 to 19,400 (mean ± SD: 1,560 ± 3,631).
Copepoda, Amphipoda, Appendicularia, Bivalvia, Doliolida, Gastropoda, Hydrozoa, Ostracoda, Polychaeta, and Tentaculata were detected (Table 4). Copepods and appendicularians (Oikopleuridae) were abundant in both areas. A variety of copepod taxa was found, including 11 calanoid copepods (Acartiidae, Aetideidae, Calanidae, Calocalanidae, Clausocalanidae, Eucalanidae, Euchaetidae, Metridinidae, Paracalanidae, Ryocalanidae, and Scolecitrichidae), 1 cyclopoid copepod (Oithonidae) and 2 poecilostomatoid copepods (Oncaeidae and Sapphirinidae). Diet composition did not differ among the sites based on%N and%F (Table 4). Appendicularians were more abundant in the metabarcoding analysis (%N: 24.9–32.5%,%F: 42.3–54.8%) than in the morphological analysis (%N: 1.7%,%F: 3.3%) (Table 4). Ontogenetic variation in diet was observed (Figure 6). Large individuals (≥6.0 mm) tended to feed on appendicularians more frequently (45.4% for%N), although this difference was not significant among size ranges (Kruskal-Wallis test, P = 0.263).
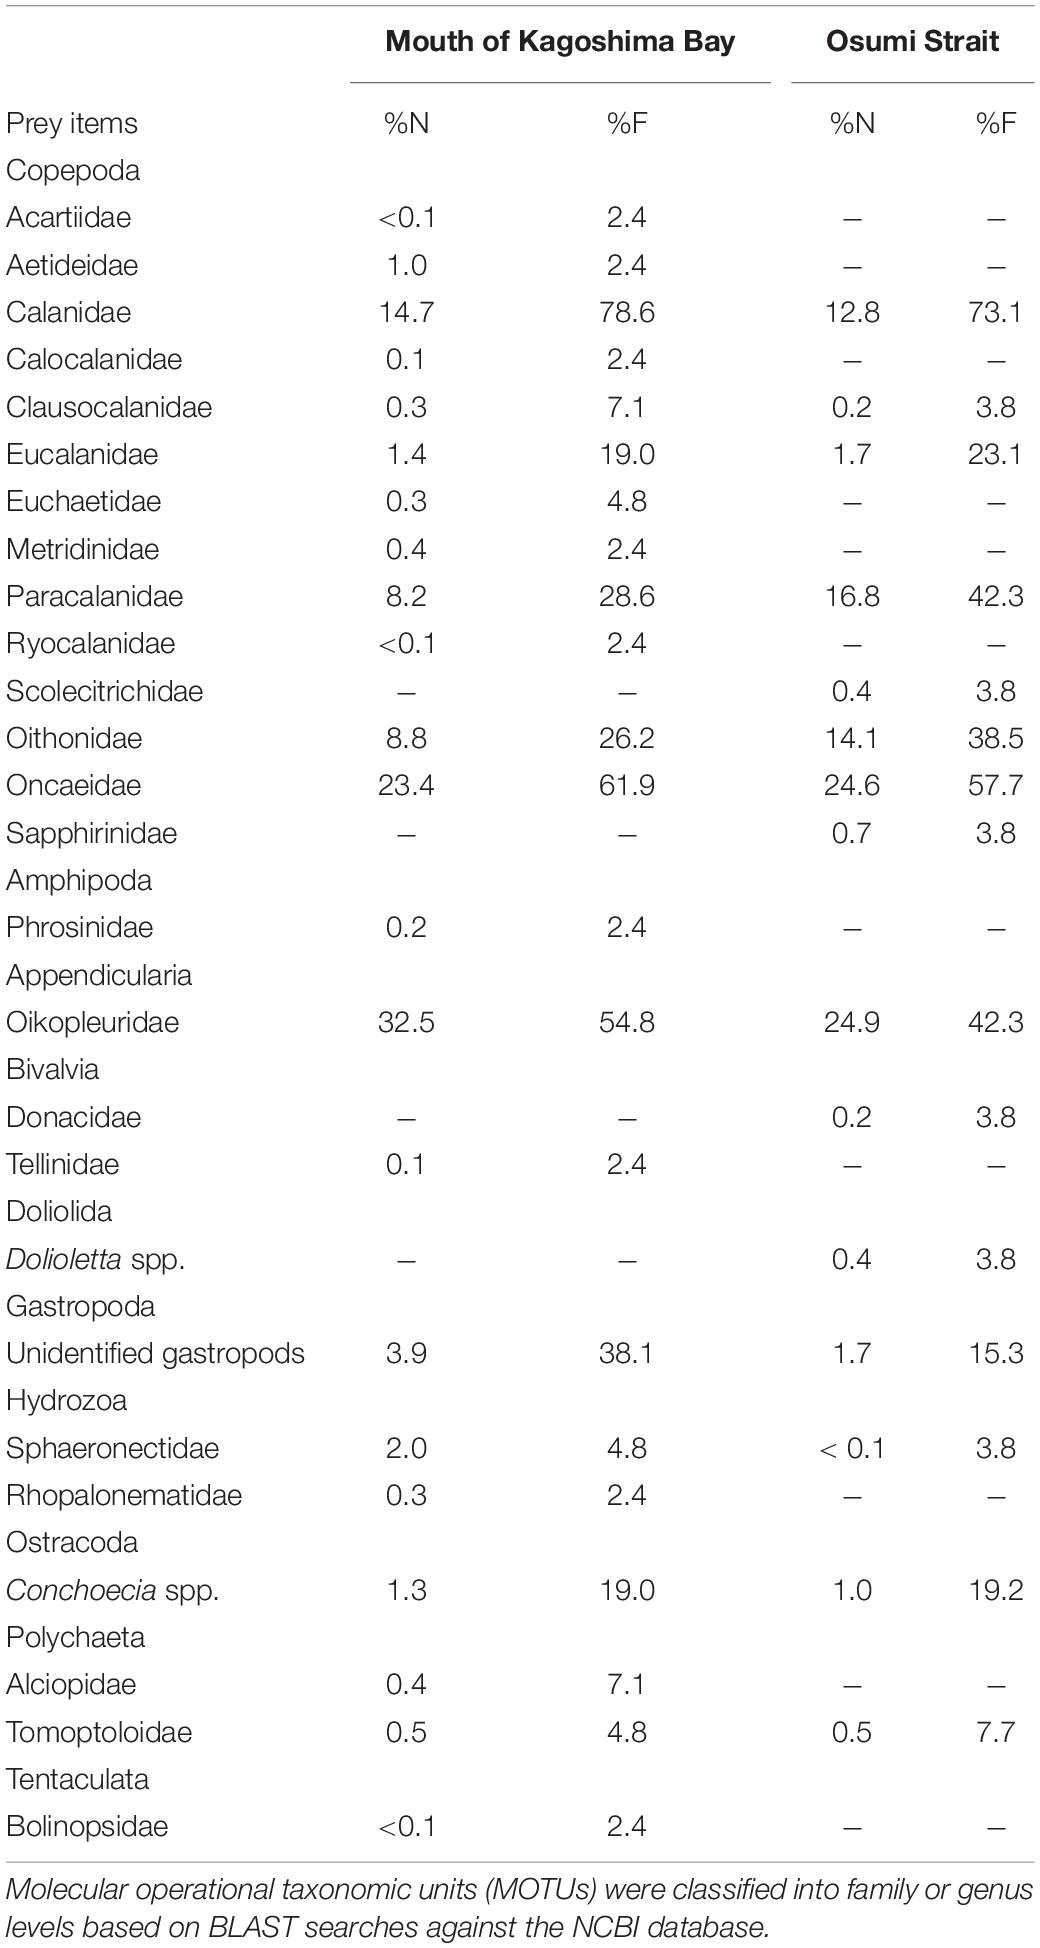
Table 4. Taxonomic percentages of sequence reads (%N and%F) in gut contents of Scomber japonicus larvae.
Stable Isotope Analysis
The δ13C and δ15N values of the fish larvae ranged from -20.5 for M. asperum to -18.9 for T. japonicus, and from 5.4 for M. asperum to 7.5 for E. japonicus (Figure 7). Both the δ13C and δ15N values differed significantly among fish groups (Kruskal-Wallis test, P < 0.001 for δ13C, P < 0.005 for δ15N). The stable isotope values of the Scomber spp. larvae differed significantly from those of M. asperum (Dunn’s test: δ13C = 0.061, δ15N: P < 0.05) and T. japonicus (Dunn’s test: δ13C: P < 0.005, δ15N: P = 0.642). Meanwhile, the stable isotope values of the Scomber spp. larvae did not differ from those of S. gracilis (Dunn’s test: δ13C = 0.819, δ15N: P = 0.991) or E. japonicus (Dunn’s test: δ13C = 0.694, δ15N: P = 0.051).
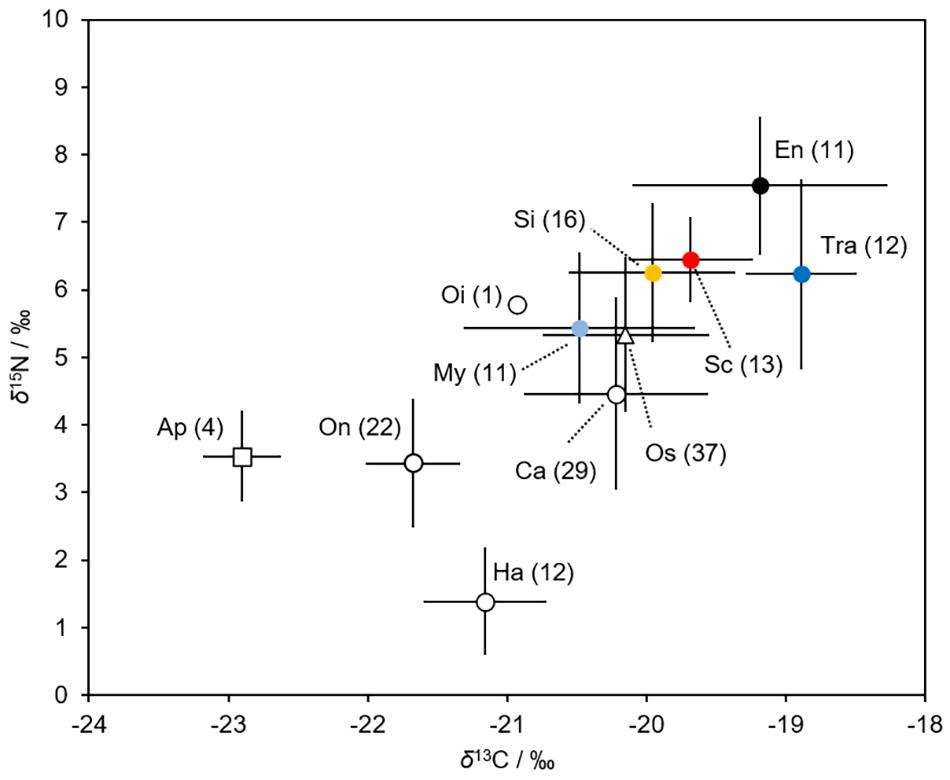
Figure 7. Mean values of carbon (δ13 C/‰ ± SD) and nitrogen (δ15 N/‰ ± SD) stable isotopes of the six fish larvae (filled markers) and their main prey (open markers). The values refer to sample size. Ap, Appendicularia; Ca, Calanoida; En, Engraulis japonicus; Ha, Harpacticoida; My, Myctophum asperum; Oi, Oithonidae; On, Oncaeidae; Os, Ostracoda; Sc, Scomber spp.; Si, Sigmops gracilis; Tra, Trachurus japonicus. The data, except that for the Scomber spp. larvae, are from Kume et al. (2021).
Both the δ13C and δ15N values of the prey differed significantly among prey species (Kruskal-Wallis test, P < 0.001 for δ13C and δ15N) (Figure 7). Appendicularians (−22.9) and harpacticoid copepods (1.4) had the lowest δ13C and δ15N values, respectively. Ostracods (−20.1) and Oithonidae copepods (5.8) had the highest δ13C and δ15N values, respectively.
Larval Growth
The otoliths of 202 larvae were readable. An exponential model fitted the BL and age data of both species better than a linear model (Figure 8 and Table 5). L0 was estimated to be 3.03 mm in 2018 and 3.00 mm in 2019, following the exponential model fitted to the BL and age data (Figure 8 and Table 5). G in 2019 was slightly higher than that in 2018, although this difference was not significant (ANCOVA, P = 0.256) (Table 5). K was slightly higher in 2019 (8.1% BL d–1) than that in 2018 (7.5% BL d–1) (Table 5).
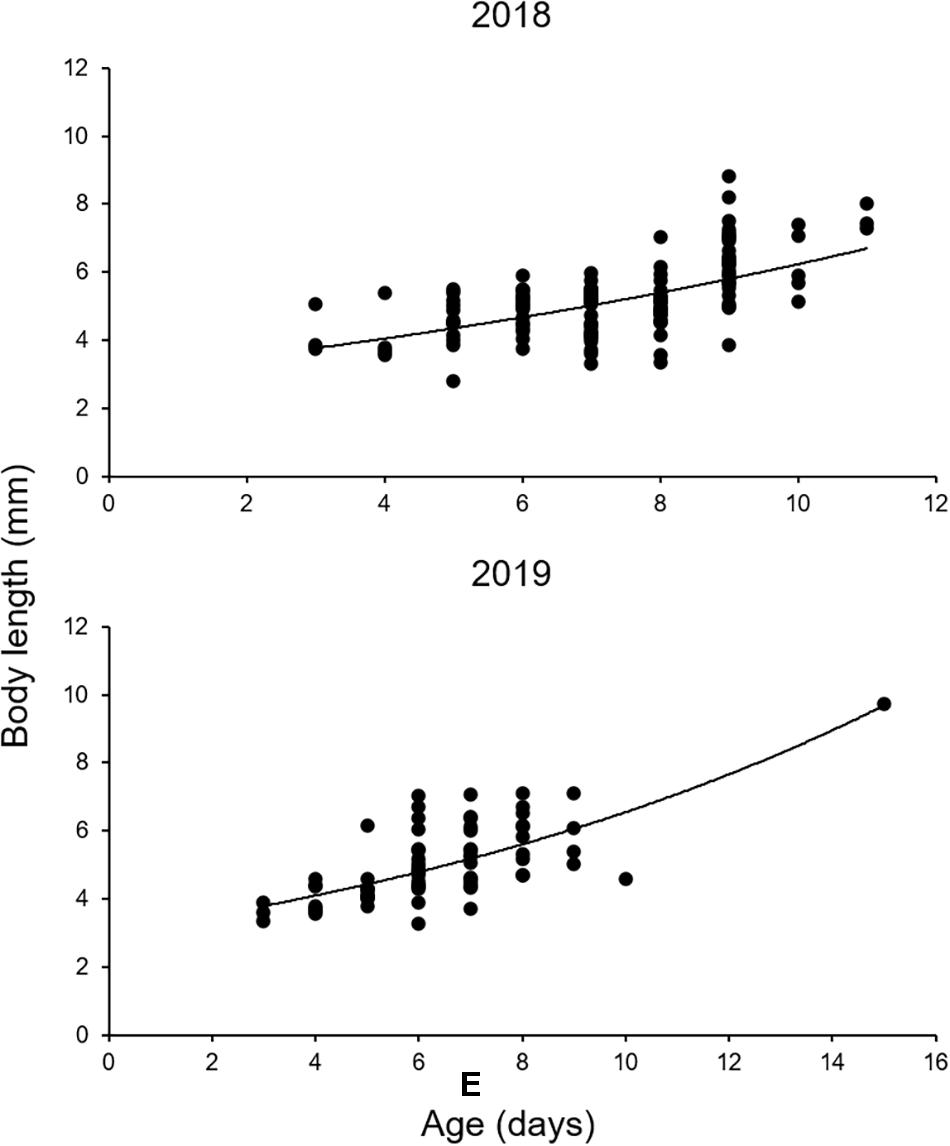
Figure 8. Growth of Scomber japonicus larvae in the northern Satsunan area in 2018 and 2019, based on daily increments in sagittal otoliths. The regression equations and growth coefficients are shown in Table 3.

Table 5. Parameters of the Lt = L0.eG.t growth equation of Scomber japonicus larvae in the northern Satsunan area in 2018 and 2019.
Discussion
Environmental Conditions
Physical conditions differed between the mouth of Kagoshima Bay and the Osumi Strait. Water temperature and salinity were higher in the Osumi Strait than in the mouth of Kagoshima Bay. This is because the Osumi Strait is more strongly affected by the Kuroshio Current, which is warm and salty (Kobari et al., 2020). Chlorophyll a concentrations were higher in the mouth of Kagoshima Bay than in the Osumi Strait across all years. Upwellings are frequently observed in the mouth of Kagoshima Bay in winter and spring, and the nutrients they supply promote phytoplankton blooms (Kobari et al., 2020; Komorita et al., 2021), although the detailed characteristics of these upwellings, such as the areas of maximum upwelling in the bay, seasonal occurrence frequencies, and annual intensities, remain unknown. The mean larval density tended to be higher in the mouth of the Kagoshima Bay than in the Osumi Strait, suggesting that the increased lower-trophic productivity following upwellings could result in favorable conditions for S. japonicus larvae (e.g., prey abundance and availability).
Larval Distribution
The spawning grounds of S. japonicus and S. australasicus are widely distributed along the Pacific coast of Japan (Hattori, 1964). Based on the distribution patterns of spawning individuals, the northern Satsunan area is mainly considered the annual spawning ground of S. australasicus (Tanoue, 1956). However, this accepted assumption has not been verified quantitatively as the eggs and larvae of S. japonicus and S. australasicus cannot be easily distinguished based on their morphological features. In the present study, using a genetic approach, we confirmed that the larvae of S. japonicus are more abundant than those of S. australasicus in the northern Satsunan area. The population of the Pacific S. japonicus stock has shown increasing trends in recent years. This study strongly suggests that the northern Satsunan area is one of the important spawning grounds in the Japanese Pacific coastal area for S. japonicus during high-stock periods.
Scomber australasicus larvae were more abundant in the Osumi Strait than that in the mouth of Kagoshima Bay. In the southern East China Sea, S. japonicus and S. australasicus larvae were abundant at 15 − 22°C and 20 − 23°C, respectively (Sassa and Tsukamoto, 2010). S. australasicus was distributed in more southern areas than S. japonicus, with a higher and narrower habitat temperature range, despite some spatial overlap. Mature S. australasicus was observed in areas with high water temperatures in the East China Sea compared with mature S. japonicus (Yukami et al., 2009). This could allow for the differences in the choice of larval habitat. Therefore, mature S. australasicus would be more abundant in the Osumi Strait, which could also be their main spawning ground as the water temperature in Osumi Strait is higher than that in the mouth of Kagoshima Bay.
Larval Feeding Habits
Morphological analysis revealed geographic variation in the FI of Scomber spp. The S. japonicus larvae along the Pacific coast of Boso-Kashimanada had low FI values throughout the larval and juvenile stages (Taga et al., 2019), which were similar to those observed in the present study (≤44.7%). Furthermore, the FI of Scomber spp. (S. japonicus and S. australasicus) was generally higher and tended to decrease with ontogeny, i.e., decreasing from 96.2% at <4 mm BL to 78.9% in the largest size class (8–10 mm BL), in the East China Sea (Sassa et al., 2008).
Previous studies showed that Scomber spp. mainly feed on mesozooplankton, including crustacean eggs, cladocerans, copepod nauplii, Calanoida, Cyclopoioda, Poechilostomatoida, appendicularians, and fish larvae; however, diet composition also varies among areas (Ozawa et al., 1991; Shoji et al., 2001; Sassa et al., 2008; Taga et al., 2019). Previous studies also confirmed ontogenetic variation in diet, with larger individuals feeding more actively on appendicularians, as observed in the present study (Ozawa et al., 1991; Sassa et al., 2008).
DNA metabarcoding analysis showed that the main food items included copepods, such as Calanidae, Paracalanidae, Oithonidae, and Oncaeidae, and appendicularians. The morphological analysis and DNA metabarcoding of the gut contents of S. japonicus larvae were comparable, although the latter provided more data on prey composition at lower taxa levels than the former. Nonetheless, these methods differed regarding the importance of appendicularians as prey. Appendicularians were more frequently detected across all larval sizes in DNA metabarcoding than in the morphological analysis. However, overall, both methods showed that larger individuals fed on appendicularians more actively than their smaller counterparts.
Appendicularians build and live in a complex mucoid balloon called a ‘house’, which is equipped with an incurrent feeding filter (Alldredge, 1976; Flood, 2003). The houses and house rudiments of appendicularians frequently have a transparent appearance and are often fragmented in the digestive tract contents of fish larvae, owing to their fragile and amorphous materials; therefore, detecting them accurately under a stereomicroscope is challenging. Takatsu et al. (2007) stained the gut contents of the larvae of stone flounder, Platichthys bicoloratus, with methylene blue to detect the houses of appendicularians and avoid undercounting them. In the present study, only the tails of appendicularians were observed in the guts. Without staining the gut contents, the transparent houses and house rudiments of appendicularians could have been underestimated in the microscopic analysis if they were preyed upon by S. japonicus larvae. In that case, the FI values would also have been underestimated in the morphological analysis of the present study.
Appendicularians are important prey for fish larvae, including anguillids, scombrids, and some mesopelagic species (Mochioka and Iwamizu, 1996; Llopiz et al., 2010; Yoshinaga et al., 2021), and feed on bacteria and pico- to nano-autotrophs (e.g., Deibel, 1998; Flood and Deibel, 1998; Gorsky and Fenaux, 1998). In the study area, appendicularians are not dominant in the mesozooplankton assemblage (Kobari et al., 2020), indicating that S. japonicus larvae must feed selectively on them. Our data strongly suggest that, in addition to the ordinary trophic pathway (grazing food chain) in the northern Satsunan area, the microbial loop involving appendicularians may support the feeding habits of S. japonicus larvae.
Prey items, such as copepods, can be identified to lower taxonomic levels when using DNA metabarcoding analysis. In addition, small portions of prey and/or digested prey can be identified, which could not be detected using morphological analysis. The contribution of appendicularians to the diet was estimated more accurately using DNA metabarcoding, which is a powerful tool for analyzing the diet of S. japonicus larvae. Previous studies showed that Scomber spp. larvae feed on fish larvae in the central Seto Inland Sea (Shoji et al., 2001). However, fish larvae were not detected from the DNA metabarcoding analysis in our study, as the taxonomic group “Craniata” was excluded to avoid sequence reads from host contaminants in the bioinformatics procedure. In addition, it was not possible to distinguish nauplii, which were abundantly consumed by Scomber spp. larvae in the East China Sea (Sassa et al., 2008), from adult copepods. In the present study, fish larvae were not observed, while copepod nauplii were marginally detected, in the morphological analysis. Therefore, we assumed that the underestimation of fish larvae and copepod nauplii in the DNA metabarcoding analysis was negligible. Our combinatorial approach enabled us to investigate the prey composition of the larvae with high accuracy.
Trophic Relationship With Dominant Small Pelagic and Mesopelagic Fish Larvae
Isotopic analysis aids in determining fish diets, as prey can be distinguished isotopically (Minagawa and Wada, 1984). Kume et al. (2021) showed that the larvae of M. asperum and S. gracilis fed substantially on appendicularians in the northern Satsunan area. The δ13C values of appendicularians are lower than those of copepods. The δ13C values of Scomber spp., M. asperum, and S. gracilis were lower than those of E. japonicus and T. japonicus, which feed exclusively on copepods (Kume et al., 2021). This suggests that appendicularians are an important food source for Scomber spp., M. asperum, and S. gracilis, compared with E. japonicus and T. japonicus. The stable isotope values of Scomber spp. and S. gracilis differed significantly from those of M. asperum, implying that M. asperum feeds on appendicularians most frequently among the three species.
Mesopelagic fish larvae are mainly found in the epipelagic layer (Sassa et al., 2007; Watanabe et al., 2010; Sassa and Takahashi, 2018), and their distribution zones overlap considerably with those of commercial small pelagic species (Kuwahara and Suzuki, 1982; Hirota et al., 2009). Scomber spp. larvae are concentrated in the upper 30 m layer, with peak densities at ∼20 m depth (Sassa and Tsukamoto, 2010). In contrast, the peak densities of M. asperum and S. gracilis were below 50 m (Watanabe et al., 2010). This difference in vertical distribution may alleviate competition for prey between Scomber spp. and mesopelagic species. The stable isotope values for Scomber spp. did not differ from those of E. japonicus. However, the morphological and DNA metabarcoding analyses of the gut contents suggest that diet composition differs between these two species (Kume et al., 2021).
Our results imply that Scomber spp. larvae occupy niches that differ from those of other dominant small pelagic and mesopelagic species. Thus, the present study shows that the tunicate food chain plays an important role in the trophodynamics of larval fish in the northern Satsunan area. This trophic pathway via appendicularians may support the feeding of Scomber spp. and other dominant species and promote their coexistence in the study area.
Larval Growth
Both G and K were slightly higher in 2019 than in 2018, suggesting that more favorable environmental conditions, such as prey availability for S. japonicus larvae, might have existed in 2019 than in 2018. This may have been an effect of population density, as larvae were more abundant in 2018 than in 2019. Furthermore, both values in the present study are comparable to those in the southern East China Sea (G: 0.060–0.079, K: 6.2–8.2% BL d–1) (Sassa and Tsukamoto, 2010). Our data suggest that the northern Satsunan area possesses favorable conditions (e.g., prey abundance and availability) to sustain high larval population densities.
Conclusion
This is the first study to confirm that the northern Satsunan area is an important spawning and nursery ground of S. japonicus during high-stock periods. The trophic pathway via appendicularians may support the feeding habits of Scomber spp. and other dominant species, promoting coexistence in the study area. Our results strongly suggest that the northern Satsunan area possesses favorable conditions to sustain a high larval population density, even during high population phases. S. japonicus larvae that hatch in the northern Satsunan area may contribute to the Pacific stock as an important source population. Our results provide insights for the appropriate fisheries management of S. japonicus in the Japanese Pacific coastal area during high-stock periods, by paying attention to the disregarded spawning and nursery ground of the species in the Japanese Pacific coastal area.
Data Availability Statement
The datasets presented in this study can be found in online repositories. The names of the repository/repositories and accession number(s) can be found below: NCBI [accession: PRJDB11717].
Ethics Statement
The animal study was reviewed and approved by Kagoshima University.
Author Contributions
GK, TS, MI, TKom, AH, FM, and TKob led the field surveys. GK, TS, KS, and MO led the distribution, gut contents, and growth analyses for the fish larvae. GK, TS, TKob, and JH led the DNA metabarcoding analysis for the larval gut contents. GK and TS led the stable isotope analysis for the fish larvae and prey components. GK conducted the literature research. All authors contributed to the article and approved the submitted version.
Funding
This work was supported by 17K00522, 18H04920, 20K06186, and 20K12151 (JSPS), and grants from the Study of Kuroshio Ecosystem Dynamics for Sustainable Fisheries (JPMXD0511102330: MEXT) and Functional Enhancement Expenses in Kagoshima University Operating Cost (Advanced Research Infrastructure of Biology and Physiology of Eel Species Inhabiting Southern Kyushu, Japan, Taiwan, and Southeast Asia, and the Creation of Industry-Academia-Government Network to Induce the Social Implementation of those Research Results).
Conflict of Interest
The authors declare that the research was conducted in the absence of any commercial or financial relationships that could be construed as a potential conflict of interest.
Publisher’s Note
All claims expressed in this article are solely those of the authors and do not necessarily represent those of their affiliated organizations, or those of the publisher, the editors and the reviewers. Any product that may be evaluated in this article, or claim that may be made by its manufacturer, is not guaranteed or endorsed by the publisher.
Acknowledgments
We are grateful to the crew of the T/S Nansei-maru, for their help with oceanographic observations and fish samplings. We thank Editage (https://www.editage.com) for English language editing.
Supplementary Material
The Supplementary Material for this article can be found online at: https://www.frontiersin.org/articles/10.3389/fmars.2021.725227/full#supplementary-material
References
Alldredge, A. L. (1976). Field behavior and adaptive strategies of appendicularians (Chordata: tunicata). Mar. Biol. 38, 29–39. doi: 10.1007/BF00391483
Amaral-Zettler, L. A., McCliment, E. A., Ducklow, H. W., and Huse, S. M. (2009). Amethod for studying protistan diversity using massively parallelsequencing of V9 hypervariable regions of small-subunit ribosomalRNA genes. PLoS One 4:e6372. doi: 10.1371/journal.pone.0006372
Bolger, A. M., Lohse, M., and Usadel, B. (2014). Trimmomatic: a flexible trimmer for Illumina sequence data. Bioinformatics 30, 2114–2120. doi: 10.1093/bioinformatics/btu170
de Vargas, C., Audic, S., Henry, N., Decelle, J., Mahé, F., Logares, R., et al. (2015). Ocean plankton. Eukaryotic plankton diversity in the sunlit ocean. Science 348:1261605. doi: 10.1126/science.1261605
Deibel, D. (1998). “Feeding and metabolism of Appendicularia,” in The Biology of Pelagic Tunicates, ed. Q. Bone (Oxford: Oxford University Press), 139–149.
DeNiro, M. J., and Epstein, S. (1977). Mechanism of carbon isotope fractionation associated with lipid synthesis. Science 197, 261–263. doi: 10.1126/science.327543
Edgar, R. C., Haas, B. J., Clemente, J. C., Quince, C., and Knight, R. (2011). UCHIME improves sensitivity and speed of chimera detection. Bioinformatics 27, 2194–2200. doi: 10.1093/bioinformatics/btr381
Flood, P. R. (2003). House formation and feeding behaviour of Fritillaria borealis (Appendicularia: tunicata). Mar. Biol. 143, 467–475. doi: 10.1007/s00227-003-1075-y
Flood, P. R., and Deibel, D. (1998). “The Appendicularian house,” in The Biology of Pelagic Tunicates, ed. Q. Bone (Oxford: Oxford University Press), 105–124.
Fukumoto, R. (2018). Increasing phenomenon of catch of chub mackerel Scomber japonicus in the sea of Satsunan, off southern Kyushu, in recent spring. Fish Biol. Oceanogr. Kuroshio 19, 59–62.
Gorsky, G., and Fenaux, R. (1998). “The role of Appendicularia in marine food webs,” in The Biology of Pelagic Tunicates, ed. Q. Bone (Oxford: Oxford University Press), 161–169.
Hattori, S. (1964). Studies on fish larvae in the Kuroshio and adjacent waters. Bull. Tokai Reg. Fish. Res. Lab. 40, 1–111.
Heath, M. R. (1992). Field investigations of the early life stages of marine fish. Adv. Mar. Biol. 28, 1–174. doi: 10.1016/S0065-2881(08)60039-5
Hirai, J., Hidaka, K., Nagai, S., and Ichikawa, T. (2017). Molecular-based diet analysis of the early post-larvae of Japanese sardine Sardinops melanostictus and Pacific round herring Etrumeus teres. Mar. Ecol. Prog. Ser. 564, 99–113. doi: 10.3354/meps12008
Hirota, Y., Honda, H., Sakaji, H., and Uehara, S. (2009). Ontogenetic and diel variation in the vertical distribution of larvae of jack mackerel Trachurus japonicus in the East China sea. Fish. Sci. 75, 577–584. doi: 10.1007/s12562-009-0075-3
Hjort, J. (1914). Fluctuations in the great fisheries of northern Europe viewed in the light of biological research. Rapp. P-V Reun. 20, 1–228.
Huse, S. M., Welch, D. M., Morrison, H. G., and Sogin, M. L. (2010). Ironing out the wrinkles in the rare biosphere through improved OTU clustering. Environ. Microbiol. 12, 1889–1898. doi: 10.1111/j.1462-2920.2010.02193.x
Japan Fisheries Research Agency [FRA] (2020b). The Stock Assessment for the Pacific Stock of Scomber japonicus in 2020. Available Online at: http://abchan.fra.go.jp/digests2020/details/202005.pdf. [accessed Aug 19, 2021].
Japan Fisheries Research Agency [FRA] (2020a). The Stock Assessment for the Pacific Stock of Scomber australasicus in 2020. Available Online at: http://abchan.fra.go.jp/digests2020/details/202007.pdf. [accessed Aug 19, 2021].
Kamimura, Y., Takahashi, M., Yamashita, N., Watanabe, C., and Kawabata, A. (2015). Larval and juvenile growth of chub mackerel Scomber japonicus in relation to recruitment in the western North Pacific. Fish. Sci. 81, 505–513. doi: 10.1007/s12562-015-0869-4
Kobari, T., Yamasaki, A., Endo, Y., Kume, G., Komorita, T., Ichinomiya, M., et al. (2020). Temporal and spatial variability of mesozooplankton community in the northern Satsunan area, southern Kyushu. Oceanogr. Japan 29, 217–232. doi: 10.5928/kaiyou.29.6_217
Komorita, T., Kobari, T., Kume, G., Sawada, D., Nagata, T., Habano, A., et al. (2021). Spring phytoplankton blooms in the northern Satsunan region, Japan, stimulated by the intrusion of Kuroshio branch water. Estuar. Coast. Shelf Sci. 259:107472.
Konishi, Y. (1983). Distribution of eggs and larvae of sardine in the Satsunan area, 1976–1981. Bull. Nansei Reg. Fish. Res. Lab. 15, 103–121.
Kume, G., Furumitsu, K., Nakata, H., Suzuki, T., Handa, M., and Yamaguchi, A. (2015a). Spatiotemporal occurrence and feeding habits of tonguefish, Cynoglossus lighti Norman, 1925, larvae in Ariake Bay, Japan. J. Appl. Ichthyol. 31, 276–281. doi: 10.1111/jai.12498
Kume, G., Yagishita, N., Furumitsu, K., Nakata, H., Suzuki, T., Handa, M., et al. (2015b). The role of molecular methods to compare distribution and feeding habits in larvae and juveniles of two co-occurring sciaenid species Nibea albiflora and Pennahia argentata. Estuar. Coast. Shelf Sci. 167, 516–525. doi: 10.1016/j.ecss.2015.10.034
Kume, G., Kobari, T., Hirai, J., Kuroda, H., Takeda, T., Ichinomiya, M., et al. (2021). Diet niche segregation of co-occurring larval stages of mesopelagic and commercially important fishes in the Osumi Strait assessed through morphological, DNA metabarcoding, and stable isotope analyses. Mar. Biol. 168:6. doi: 10.1007/s00227-020-03810-x
Kuroda, K. (2007). Population increasing processes of Japanese sardine. Nippon Suisan Gakkaishi 73, 750–753. doi: 10.2331/suisan.73.750
Kuwahara, A., and Suzuki, S. (1982). Vertical distribution and feeding habits of a horse mackerel Trachurus japonicus and barracuda Sphyraena pinguis larvae in the western Wakasa Bay. Bull. Kyoto Ocean. Fish. Sci. 6, 13–17.
Llopiz, J. K., Richardson, D. E., Shiroza, A., Smith, S. L., and Cowen, R. K. (2010). Distinctions in the diets and distributions of larval tunas and the important role of appendicularians. Limnol. Oceanogr. 55, 983–996. doi: 10.4319/lo.2010.55.3.0983
Mendiola, D., Yamashita, Y., Matsuyama, M., Masuda, R., Okamoto, K., Alvarez, P., et al. (2009). Estimation of the daily food intake and gross growth efficiency of chub mackerel (Scomber japonicus) larvae under various temperatures. Aquacult. Sci. 57, 291–299. doi: 10.11233/aquaculturesci.57.291
Minagawa, M., and Wada, E. (1984). Stepwise enrichment of 15N along food chains: further evidence and the relation between δ15N and animal age. Geochim. Cosmochim. Acta 48, 1135–1140. doi: 10.1016/0016-7037(84)90204-7
Miyaji, K. (1989). The main environmental factors related to the formation of sardine spawning ground in the waters south of Kyushu. Bull. Coast. Oceanogr. 27, 57–66.
Mochioka, N., and Iwamizu, M. (1996). Diet of anguilloid larvae: leptocephali feed selectively on larvacean houses and fecal pellets. Mar. Biol. 125, 447–452. doi: 10.1007/BF00353257
Monson, K. D., and Hayes, J. M. (1982). Carbon isotopic fractionation in the biosynthesis of bacterial fatty acids. Ozonolysis of unsaturated fatty acids as a means of determining the intramolecular distribution of carbon isotopes. Geochim. Cosmochim. Acta 46, 139–149. doi: 10.1016/0016-7037(82)90241-1
Nagai, S., Yamamoto, K., Hata, N., and Itakura, S. (2012). Study of DNA extraction methods for use in loop-mediated isothermal amplification detection of single resting cysts in the toxic dinoflagellates Alexandrium tamarense and A. catenella. Mar. Genomics 7, 51–56. doi: 10.1016/j.margen.2012.03.002
Nakamura, H., Hiranaka, R., Ambe, D., and Saito, T. (2015). Local wind effect on the Kuroshio path state off the southeastern coast of Kyushu. J. Oceanogr. 71, 575–596. doi: 10.1007/s10872-015-0309-1
Nakamura, H., Ichikawa, H., Nishina, A., and Lie, H. (2003). Kuroshio path meander between the continental slope and the Tokara Strait in the East China Sea. J. Geophys. Res. 108:3360. doi: 10.1029/2002JC001450
Ozawa, T., Kawai, K., and Uotani, I. (1991). Stomach content analysis of chub mackerel Scomber japonicus larvae by quantification I method. Nippon Suisan Gakkaishi 57, 1241–1245. doi: 10.2331/suisan.57.1241
Quast, C., Pruesse, E., Yilmaz, P., Gerken, J., Schweer, T., Yarza, P., et al. (2013). The SILVA ribosomal RNA gene database project: improved data processing and web-based tools. Nucleic Acids Res. 41, D590–D596. doi: 10.1093/nar/gks1219
Robert, D., Castonguay, M., and Fortier, L. (2007). Early growth and recruitment in Atlantic mackerel Scomber scombrus: discriminating the effects of fast growth and selection for fast growth. Mar. Ecol. Prog. Ser. 337, 209–219. doi: 10.3354/meps337209
Sassa, C., Kawaguchi, K., Hirota, Y., and Ishida, M. (2007). Distribution depth of the transforming stage larvae of myctophid fishes in the subtropical–tropical waters of the western North Pacific. Deep Sea Res. I Oceanogr. Res. Pap. 54, 2181–2193. doi: 10.1016/j.dsr.2007.09.006
Sassa, C., and Takahashi, M. (2018). Comparative larval growth and mortality of mesopelagic fishes and their predatory impact on zooplankton in the Kuroshio region. Deep Sea Res. I Oceanogr. Res. Pap. 131, 121–132. doi: 10.1016/j.dsr.2017.11.007
Sassa, C., and Tsukamoto, Y. (2010). Distribution and growth of Scomber japonicus and S. australasicus larvae in the southern East China Sea in response to oceanographic conditions. Mar. Ecol. Prog. Ser. 419, 185–199. doi: 10.3354/meps08832
Sassa, C., Tsukamoto, Y., and Konishi, Y. (2008). Diet composition and feeding habits of Trachurus japonicus and Scomber spp. larvae in the shelf break region of the East China Sea. Bull. Mar. Sci. 82, 137–153.
Sato, R., and Suzuki, Y. (2010). Carbon and nitrogen stable isotope analysis by EA/IRMS. Res. Org. Geochem. 26, 21–29. doi: 10.20612/rog.26.0_21
Schloss, P. D., Westcott, S. L., Ryabin, T., Hall, J. R., Hartmann, M., Hollister, E. B., et al. (2009). Introducing Mothur: open-source, platform-independent, community-supported software for describing and comparing microbial communities. Appl. Environ. Microbiol. 75, 7537–7541. doi: 10.1128/AEM.01541-09
Sezaki, K., Kuboshima, Y., Mitani, I., Fukui, A., and Watabe, S. (2001). Identification of chub and spotted mackerels with mitochondrial cytochrome b gene and its application to respective pelagic eggs fixed with formalin. Nippon Suisan Gakkaishi 67, 17–22. doi: 10.2331/suisan.67.17
Shoji, J., Maehara, T., and Tanaka, M. (2005). Larval growth and mortality of Japanese Spanish mackerel (Scomberomorus niphonius) in the central Seto Inland Sea, Japan. J. Mar. Biol. Assoc. U. K. 85, 1255–1261. doi: 10.1017/S0025315405012403
Shoji, J., Tanaka, M., and Maehara, T. (2001). Comparative diets and growth of two scombrid larvae, chub mackerel Scomber japonicus and Japanese Spanish mackerel Scomberomorus niphonius, in the central Seto Inland Sea, Japan. UJNR Tech. Rep. 30, 93–103.
Suzuki, R., and Ishimaru, T. (1990). An improved method for the determination of phytoplankton chlorophyll using N, N-dimethylformamide. J. Oceanogr. 46, 190–194. doi: 10.1007/BF02125580
Taga, M., Kamimura, Y., and Yamashita, Y. (2019). Effects of water temperature and prey density on recent growth of chub mackerel Scomber japonicus larvae and juveniles along the Pacific coast of Boso–Kashimanada. Fish. Sci. 85, 931–942. doi: 10.1007/s12562-019-01354-8
Takasuka, A., Nishikawa, K., Kuroda, H., Okunishi, T., Shimizu, Y., Sakaji, H., et al. (2016). Growth variability of Pacific saury Cololabis saira larvae under contrasting environments across the Kuroshio axis: survival potential of minority versus majority. Fish. Oceanogr. 25, 390–406. doi: 10.1111/fog.12160
Takatsu, T., Suzuki, Y., Shimizu, A., Imura, K., Hiraoka, Y., and Shiga, N. (2007). Feeding habits of stone flounder Platichthys bicoloratus larvae in Mutsu Bay. Japan Fish. Sci. 73, 142–155. doi: 10.1111/j.1444-2906.2007.01312.x
Tanoue, T. (1956). A consideration on the spawning-season of the mackerel (Pneumatophorus tapeinocephalus) in the southern sea of Kyushu. Mem. Fac. Fish. Kagoshima Univ. 5, 42–52.
Wang, Q., Garrity, G. M., Tiedje, J. M., and Cole, J. R. (2007). Naïve Bayesian classi?er for rapid assignment of rRNA sequences into the new bacterial taxonomy. Appl. Environ. Microbiol. 73, 5261–5267. doi: 10.1128/AEM.00062-07
Watanabe, H., Sassa, C., and Ishida, M. (2010). Late winter vertical distribution of mesopelagic fish larvae in the Kuroshio Current region of the western North Pacific. Bull. Jpn. Soc. Fish. Oceanogr. 74, 153–158.
Welschmeyer, N. A. (1994). Fluorometric analysis of chlorophyll a in the presence of chlorophyll b and phaeopigments. Limnol. Oceanogr. 39, 1985–1992. doi: 10.4319/lo.1994.39.8.1985
Yamashita, Y., and Bailey, K. M. (1989). A laboratory study of the bioenergetics of larval walleye pollock, Theragra chalcogramma. Fish. Bull. 87, 525–536.
Yatsu, A. (2019). Review of population dynamics and management of small pelagic fishes around the Japanese Archipelago. Fish. Sci. 85, 611–639. doi: 10.1007/s12562-019-01305-3
Yoshinaga, S., Kobari, T., Tanonaka, N., Yamanoue, K., and Kume, G. (2021). Feeding habits of the mesopelagic fish Sigmops gracilis larvae in the Kuroshio and its adjacent water, southern Japan. Ichthyol. Res. 68, 171–176. doi: 10.1007/s10228-020-00760-8
Keywords: larval ecology, nursery ground, DNA metabarcoding, stable isotope analysis, tunicate food chain, otolith microstructure, population dynamics
Citation: Kume G, Shigemura T, Okanishi M, Hirai J, Shiozaki K, Ichinomiya M, Komorita T, Habano A, Makino F and Kobari T (2021) Distribution, Feeding Habits, and Growth of Chub Mackerel, Scomber japonicus, Larvae During a High-Stock Period in the Northern Satsunan Area, Southern Japan. Front. Mar. Sci. 8:725227. doi: 10.3389/fmars.2021.725227
Received: 29 June 2021; Accepted: 15 September 2021;
Published: 07 October 2021.
Edited by:
Pierluigi Carbonara, COISPA Tecnologia & Ricerca, ItalyReviewed by:
Paula Pattrick, Elwandle Coastal Node, South African Environmental Observation Network, South AfricaMaria Flavia Gravina, University of Rome “Tor Vergata”, Italy
Gualtiero Basilone, Istituto per l ’Ambiente Marino Costiero (IAMC), Italy
Copyright © 2021 Kume, Shigemura, Okanishi, Hirai, Shiozaki, Ichinomiya, Komorita, Habano, Makino and Kobari. This is an open-access article distributed under the terms of the Creative Commons Attribution License (CC BY). The use, distribution or reproduction in other forums is permitted, provided the original author(s) and the copyright owner(s) are credited and that the original publication in this journal is cited, in accordance with accepted academic practice. No use, distribution or reproduction is permitted which does not comply with these terms.
*Correspondence: Gen Kume, a3VtZUBmaXNoLmthZ29zaGltYS11LmFjLmpw
 Gen Kume
 Taichi Shigemura2
 Junya Hirai
 Kazuhiro Shiozaki
 Mutsuo Ichinomiya
 Tomohiro Komorita
 Toru Kobari
