 Bo Kyung Kim
 Misa Jeon1
 Hyoung Min Joo
 Jisoo Park
 Sun-Yong Ha
- 1Division of Ocean Sciences, Korea Polar Research Institute, Incheon, South Korea
- 2Unit of Next Generation IBRV Building Program, Korea Polar Research Institute, Incheon, South Korea
- 3Division of Atmospheric Sciences, Korea Polar Research Institute, Incheon, South Korea
Rapidly changing conditions in high-latitude coastal systems can significantly impact biogeochemical cycles because these systems are strongly influenced by freshwater discharged from melting glaciers and streams on land. Generally, Antarctic coastal areas are considered high-productivity areas in which phytoplankton growth prevails under various environmental conditions (e.g., oceanographic and meteorological conditions). This study provides carbon uptake rates of phytoplankton in Marian Cove during summer (January-February 2019). Daily depth-integrated carbon uptake varied greatly and averaged 0.8 g C m–2 day–1, with a maximum of 4.52 mg g C m–2 day–1 recorded on 14 January. Similarly, the observed biomass standing stocks were very high (up to 19.5 mg m–3 chlorophyll a) and were dominated by microphytoplankton (20–200 μm), representing 84% of total chlorophyll a (chl-a). The depth-integrated chl-a and carbon uptake decreased from outer to inner areas (close to the glacial front) in the cove. As the austral summer progressed, the freshening of the surface waters coincided with high water stability and suspended material and with low productivity when nanophytoplankton were present (2–20 μm; >60%). These findings suggest that both photosynthetically active radiation penetrating the water column and enhanced turbidity control light availability for phytoplankton, as well as their community compositions.
Introduction
High-latitude polar regions are more vulnerable to climate change than other regions. The Western Antarctic Peninsula (WAP) is the region experiencing the greatest warming in the world (Vaughan et al., 2003; Meredith and King, 2005; Turner et al., 2005), and the temperature has increased at an average rate of 0.5 degrees per decade in some locations in the WAP (Vaughan et al., 2003; Oliva et al., 2017). These changes include shifting patterns in wind speed and direction, reductions in sea ice and in the ice shelf, and glacial retreat (Cook et al., 2005, 2016; Marshall et al., 2006; Stammerjohn et al., 2008; Montes-Hugo et al., 2009; Rückamp et al., 2011; Rignot et al., 2013; Turner et al., 2013).
Antarctic coastal ecosystems in the WAP are sensitive to climate change in which major fluctuations occur in various gradients of nutrients, temperature, and salinity, including seasonal freshwater flux associated melts from glaciers and Upper Circumpolar Deep Water (UCDW) intrusions and sea ice extent changes (Prézelin et al., 2000; Martinson et al., 2008; Annett et al., 2015; Cook et al., 2016; Llanillo et al., 2019). These changes are directly linked to observed changes in coastal water ecosystems (Atkinson et al., 2004; Moline et al., 2004; Moon et al., 2015; Arrigo et al., 2017; Bae et al., 2021; Gutt et al., 2021).
In particular, phytoplankton is the base of the food web, play critical roles in biogeochemical cycles and eventually transfer energy up through the entire marine food chain (Clarke, 1988; Pauly and Christensen, 1995; Doney et al., 2012; Deppeler and Davidson, 2017). Their growth is greatly influenced by abiotic environmental factors, and increasing irradiance, anticyclones and nutrient supplies, along with environmental factors, are the main drivers of phytoplankton blooms in the coastal waters of Antarctica (Saba et al., 2014; Schloss et al., 2014). Phytoplankton blooms in seasonally ice-covered regions are initiated after sea ice melting (Jena et al., 2019; Jena and Pillai, 2020; Turner et al., 2020) and are composed of large phytoplankton cells (>20 μm, e.g., diatoms). High primary productivity (carbon uptake) and phytoplankton blooms mainly occur in summer (Fiala et al., 1998; Biggs et al., 2019) and represent an important part of the annual primary production and chlorophyll a concentration trends (Kang et al., 1997, 2002; Arrigo et al., 2008; Vernet et al., 2012; Lee et al., 2015). In this sense, distinct changes in the productivity and biomass of phytoplankton reflect shifts in environmental conditions.
Marian Cove represents one of the fastest glacial front retreat zones in the WAP (Rückamp et al., 2011) and contains marine biological hotspots in fjords; this region experiences ecosystem changes due to warming-induced glacial retreat and melt (Gutt et al., 2021). In this area, the mean retreat of the ice cliff was 480 m (up to 680 m) from December 1956 to January 1994 (Park et al., 1998), with an accelerating rate of retreat (1.7 km) observed during the last 51 years (1956–2006) (Lee et al., 2008). Recent studies have shown that benthic and bacterial community structures are associated with glacial melting areas (Moon et al., 2015; Ahn et al., 2016; Kim S. et al., 2020; Bae et al., 2021). Intense benthic diatom blooms, an indicator of glacial retreat, are linked to thriving filter-feeding consumers in Marian Cove (Ha et al., 2019). The temporal patterns of size-fractionated chl-a concentrations were by Kang et al. (1997, 2002) and Lee et al. (2015) based on long-term monitoring at a fixed coastal site near King Sejong Station. However, the carbon uptake rate of phytoplankton has rarely been reported in previous studies. Therefore, research on phytoplankton developmental processes in Marian Cove and on the carbon dynamics of phytoplankton was undertaken to better understand the ecosystem structure and functioning. The aims of this study were (1) to examine the temporal and spatial variations in the carbon uptake rates of phytoplankton as phytoplankton succession occurred during summer (January–February 2019) in Marian Cove and (2) to investigate the mechanisms controlling the carbon dynamics that are related to environmental conditions.
Materials and Methods
Study Site and Sampling
Marian Cove is a tributary embayment of Maxwell Bay on the southwestern side of King George Island, WAP, with a length of ∼4.5 km, a width up to 1.5 km, and a maximum depth of 110 m (Figure 1). To obtain data at different stages of phytoplankton development and nutrient consumption, three summer cruises (14 January, 31 January, and 8 February 2019) were undertaken at four stations (MC3, MC7, MC13, and MC16) in Marian Cove (Figure 1 and Table 1). MC16 is located near the tidewater glacier of Marian Cove, while MC3 is located at the mouth of the cove where it enters Maxwell Bay. All water samples except for the suspended particulate matter and phytoplankton community samples were collected at discrete depths (100, 30, and 1% of surface photosynthetically active radiation; PAR) using a rosette sampler equipped with 5-L Niskin bottles during flood tides. The seawater samples were prefiltered onboard through a 200-μm pore mesh to remove large particles and zooplankton and were kept in the dark until subsampling was performed in the laboratory.
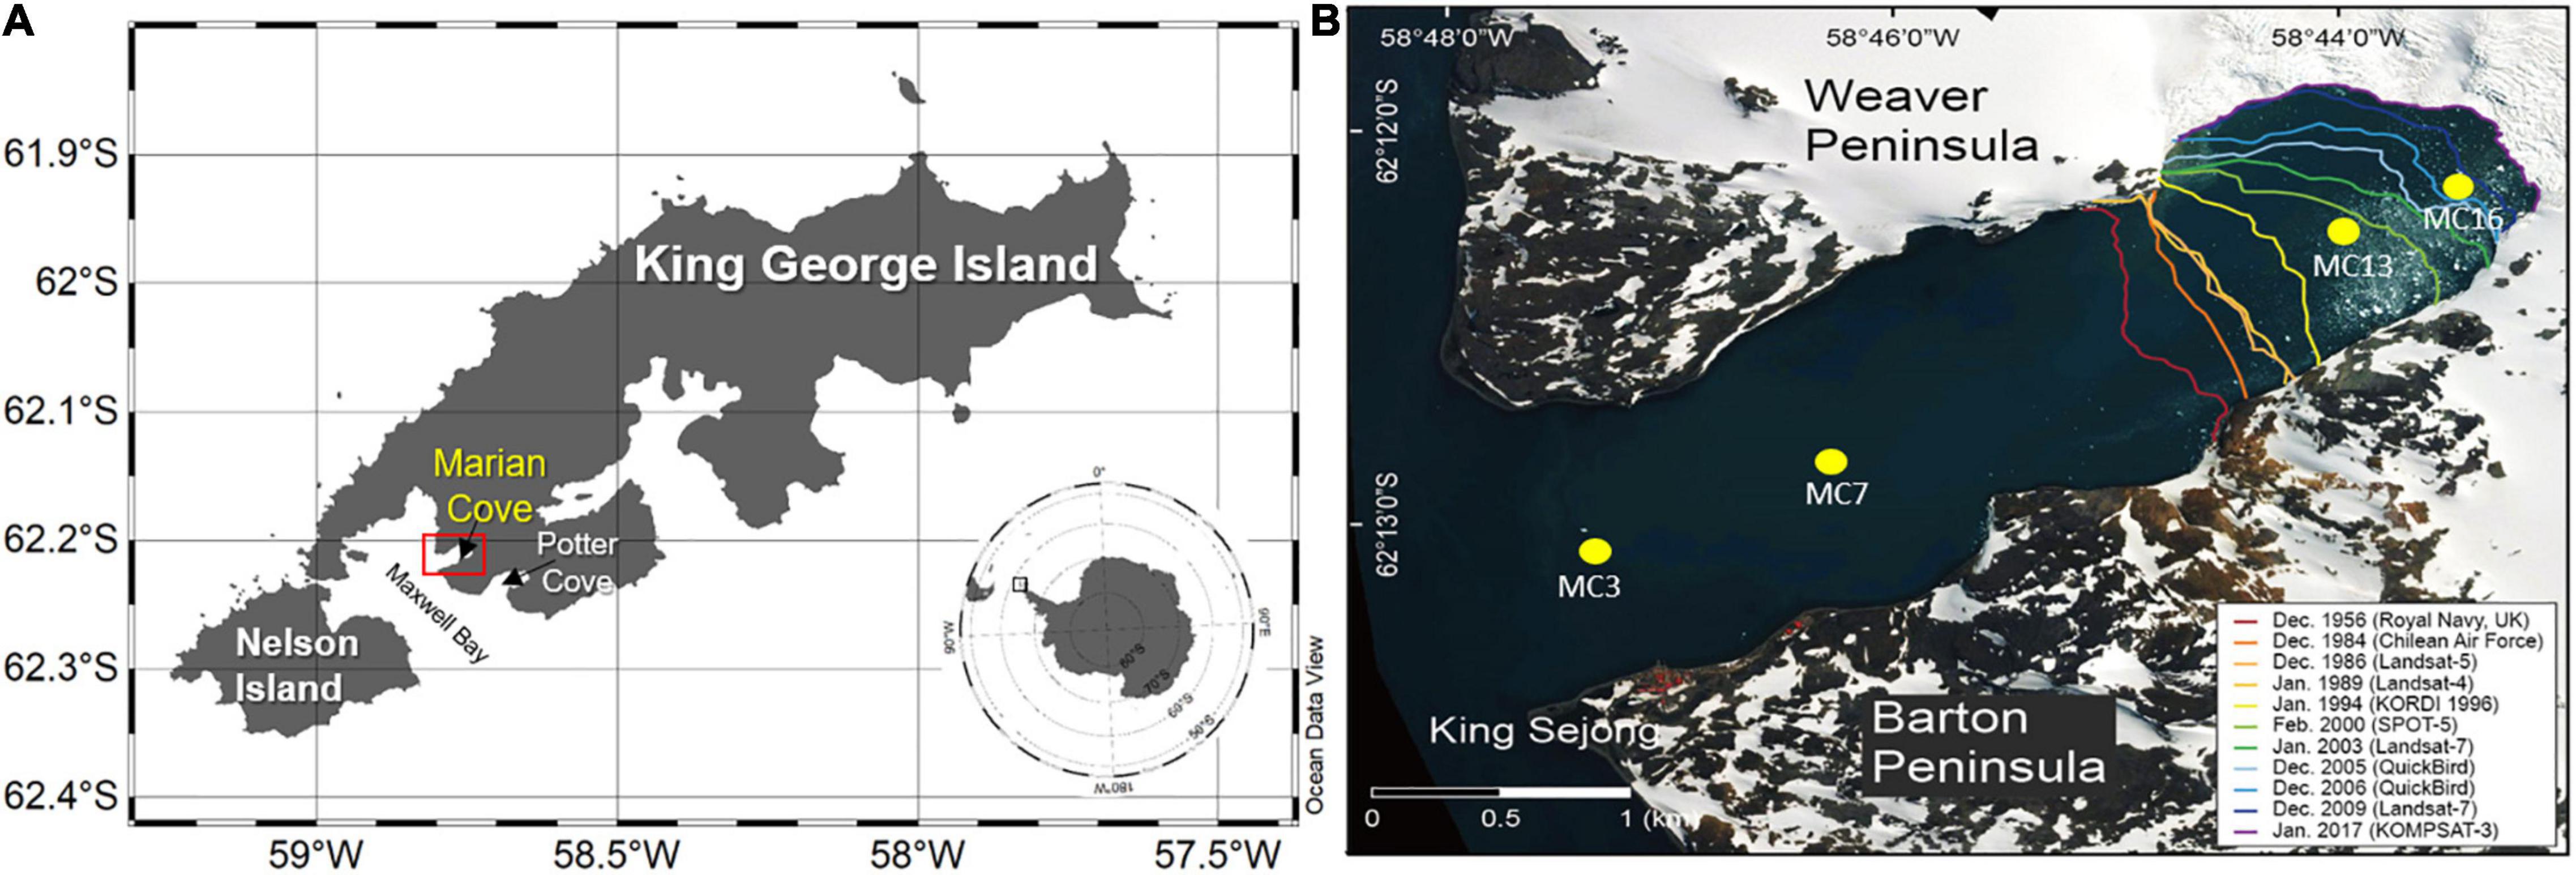
Figure 1. Geographic location of the study area and sampling sites. (A) Location of King George Island and (B) sampling stations are labeled (MC3, MC7, MC13, and MC16) in Marian Cove. Glacier lines are drawn based on information from satellite images and aerial photographs.
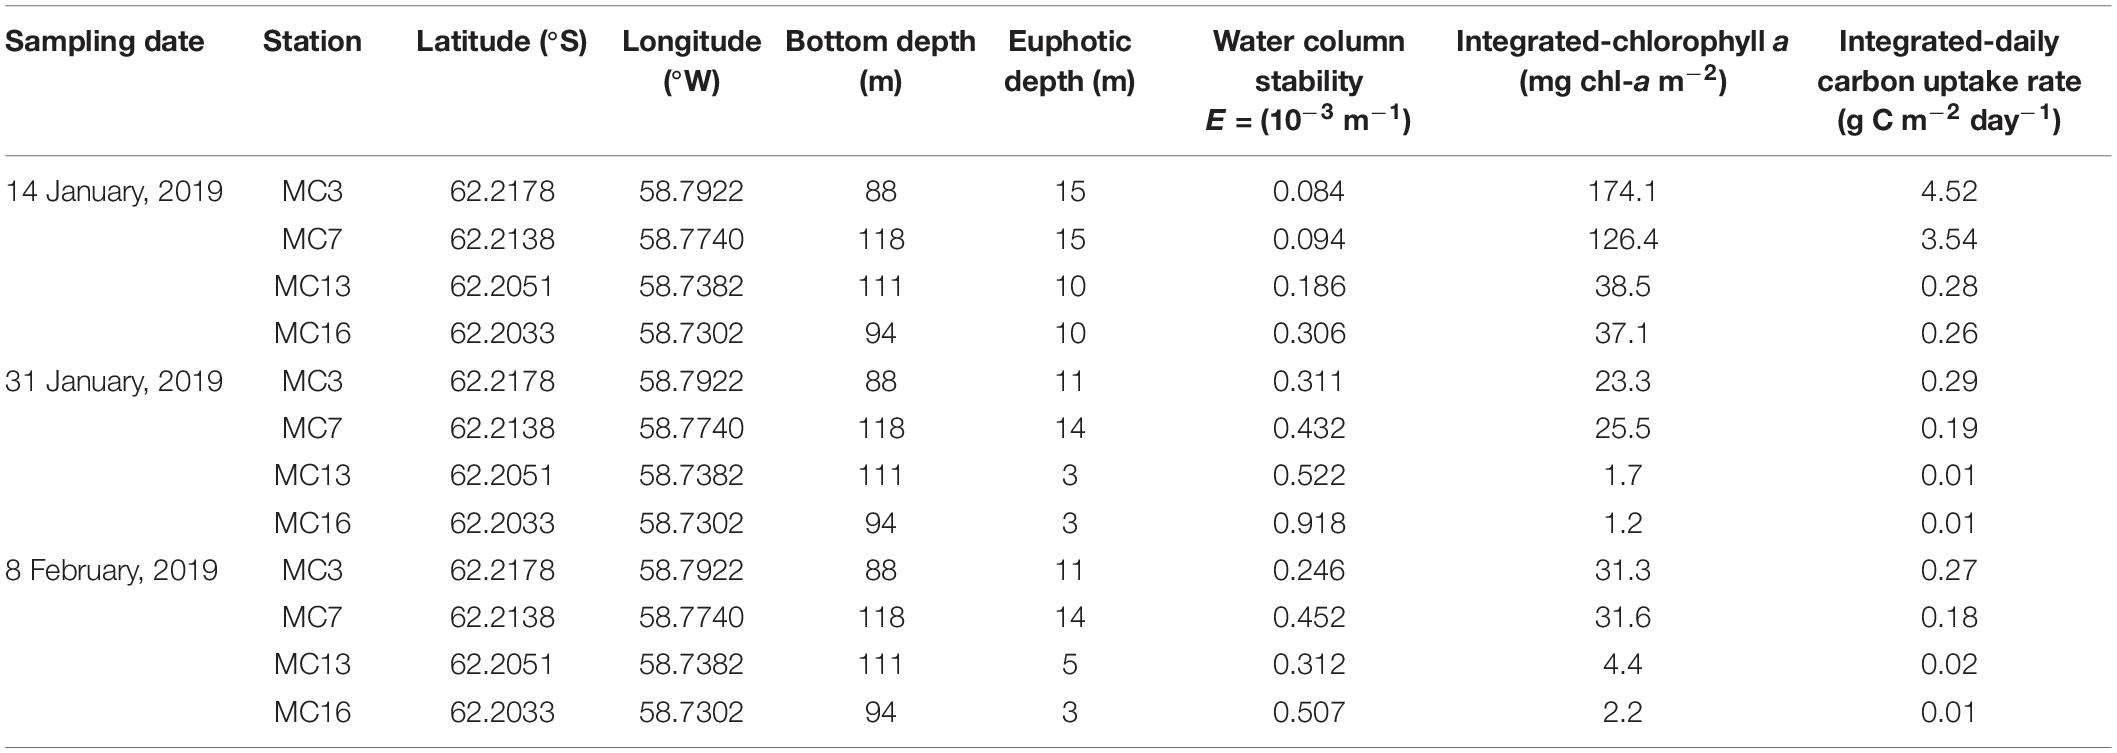
Table 1. Sampling location and data on bottom depth (m), euphotic depth (m), water column stability (E = 10–3 m–1), depth-integrated values of chl-a (mg chl-a m–2) and carbon uptake (g C m–2 day–1) at stations MC3, MC7, MC13, and MC16 during summer (sampling dates are 14 January, 31 January, and 8 February 2019). Depth-integrated values are from the euphotic zone.
The transparency of the water at the sampling sites was determined using a Secchi disk. The euphotic zone was defined as the depth at 1% of the surface PAR. To measure the suspended particulate matter (SPM; g m–3), the water samples were passed through preweighed glass fiber filters (GF/F, nominal 0.7 μm; Whatman, United Kingdom) and then dried in an oven at 103–105°C. The SPM was calculated as the difference in the weight of the filter. The vertical profiles of hydrographic properties (potential temperature, salinity, and potential density) at each station were obtained with a conductivity-temperature-depth (CTD; Sea-Bird SBE 19plus V2, Sea-Bird Electronics, Bellevue, WA, United States) probe. CTD data were processed using the manufacturer provided program (Seabird Data Processing, Version 7.26.7). Water column stability (E; 10–3 m–1) was calculated using the following Equation 1:
where (∂sigma_t)/∂z is the vertical gradient of potential density between the surface and a depth of 20 m, [sigma_t(20)-sigma_t(0)]/20, and sigma_t (mean) is the mean potential density given by [sigma_t(20) + sigma_t(0)]/2 (Mengesha et al., 1998; Garibotti et al., 2003; Höfer et al., 2019). The 20 m depth includes the euphotic layer and was assumed to approximate density stratification where freshwater signatures (isopycnals 27.4 and 27.35 and isohalines 34.1 and 34; Llanillo et al., 2019) were observed in our study. The list and locations of sampling stations are shown in Table 1 and Figure 1, respectively. The integrated parameter values (chl-a concentrations and carbon uptake rates) were calculated using the trapezoidal method of integration within the euphotic layer.
Meteorological data, including air temperature, wind speed, wind direction, and precipitation in this study were obtained from the automatic meteorological observation system (AMOS-3) of the King Sejong Station. The wind vane was located 10 m above the ground, a thermometer was at 2 m, and a rain gauge was at approximately 1.5 m (Park et al., 2013). Ten-min interval data were averaged into daily data.
Dissolved Inorganic Nutrients, Chlorophyll a, and Phytoplankton Community Analyses
Dissolved nutrient samples (phosphate, DIP; nitrite + nitrate + ammonium, DIN; and silicate, DSi) were filtered and frozen at −20°C in polyethylene bottles until home-based laboratory analysis. Nutrients were analyzed in duplicate using an automated nutrient analyzer (QuAAtro, SEAL Analytical, Southampton, United Kingdom) according to the manufacturer’s instructions and manual (Parsons et al., 1984).
For the analysis of total chlorophyll a (chl-a), seawater was filtered using glass fiber filters (GF/F, nominal 0.7 μm; Whatman, United Kingdom). Size fractionation of chl-a was used to determine the chl-a concentrations in three size classes, picophyplankton (0.7–2 μm), nanophytoplankton (2–20 μm), and microphytoplankton (20–200 μm); this method involves filtering water through filters of different pore sizes. For each water sample collected, the seawater was filtered sequentially through 20 and 2 μm pore size polycarbonate membrane filters (GVS Life Sciences, Morecambe, United Kingdom) and GF/F filters. The filters were immediately extracted in 90% acetone overnight at 4°C and then measured using a Trilogy fluorometer (Turner design, Sunnyvale, CA, United States) calibrated with a chl-a standard (P/N 10-850, Turner design, Sunnyvale, CA, United States) according to Parsons et al. (1984).
The samples used to analyze the phytoplankton community composition in surface waters were fixed with glutaraldehyde (1% final concentration) and filtered onto 25 mm, 0.45 μm GN-6 Metricel filters. At least 10 fields or 300 cells were counted through either a fluorescence or optical microscope (Zeiss Axiophot, Germany). The carbon biomasses (pg C) of phytoplankton were estimated from the cell volumes according to the protocol described in Jeon et al. (2021).
Carbon Uptake Rates of Phytoplankton
The method used to determine the carbon uptake rate of phytoplankton was previously described by Kim B. K. et al. (2020). Briefly, water samples were collected in duplicate to determine carbon uptake rates in 1-L polycarbonate bottles. Each incubation bottle was spiked with 4–10% ambient concentration of C13-labeled sodium bicarbonate (99% 13C, Cambridge Isotope Laboratories, MA, United States). The bottles were incubated for a short time (4–5 h) to reduce the isotope dilution effect (Glibert et al., 1982; Harrison and Harris, 1986) in an outdoor incubator with plumbed seawater to maintain the ambient seawater temperature and were wrapped with neutral-density screens (Lee Filters, Hampshire, United Kingdom) simulating in situ light conditions. Upon termination of the incubation period, the water samples were filtered through 25 mm GF/F filters (precombusted at 450°C for 4 h). To remove the dissolved inorganic carbon before analysis, the filters were fumed with HCl overnight. The total amount of particulate carbon and the 13C/12C ratios were measured using an elemental analyzer-isotope ratio mass spectrometer (Delta V plus, Thermo Fisher Scientific, San Jose, CA, United States) at the Alaska Stable Isotope Facility of the University of Alaska Fairbanks. The absolute carbon uptake rate (denoted ρ; mg C m–3 h–1) and specific uptake rate (V, rate of uptake or transport of product; h–1) at each site were calculated as described by Hama et al. (1983). To calculate the carbon uptake, the following Equation 2 was used:
where PC is the particulate carbon concentration of the sample measured at the end of the incubation period. The depth-integrated carbon uptake rates, from the surface to the 1% light depth, were calculated using the trapezoidal integration of the discrete depth values.
Statistical Analysis
Statistical analysis was performed using SPSS software (version 12.0K), and Student’s t-tests were conducted to obtain comparisons of mean values among regions. Significance at the 5% probability level was applied in all analyses. The geographic map and figures were created using ODV software (R. Schlitzer, Ocean Data View1).
Results
Spatiotemporal Distributions of Physical Properties
The spatial and temporal variations in water temperature and salinity obtained at the four stations over the observational period are shown in Figure 2. From the surface to the bottom depths, the water temperatures on 14 January, 31 January and 8 February in the cove ranged from 0.3 to 1.4°C, from 0.4 to 1.5°C, and from 0.6 to 1.5°C, respectively, with average values of 0.6 ± 0.2°C, 0.9 ± 0.2°C, and 1.1 ± 0.2°C, respectively. The temperature gradually increased with depth, and warm water (>1°C) was located at water depths of approximately 20 m at MC3 and MC7 on 14 January and then reached a depth of 80 m at MC16 on the last sampling date. Overall, the surface temperature exhibited a decreasing trend from the outer cove to the inner cove (Figure 2).
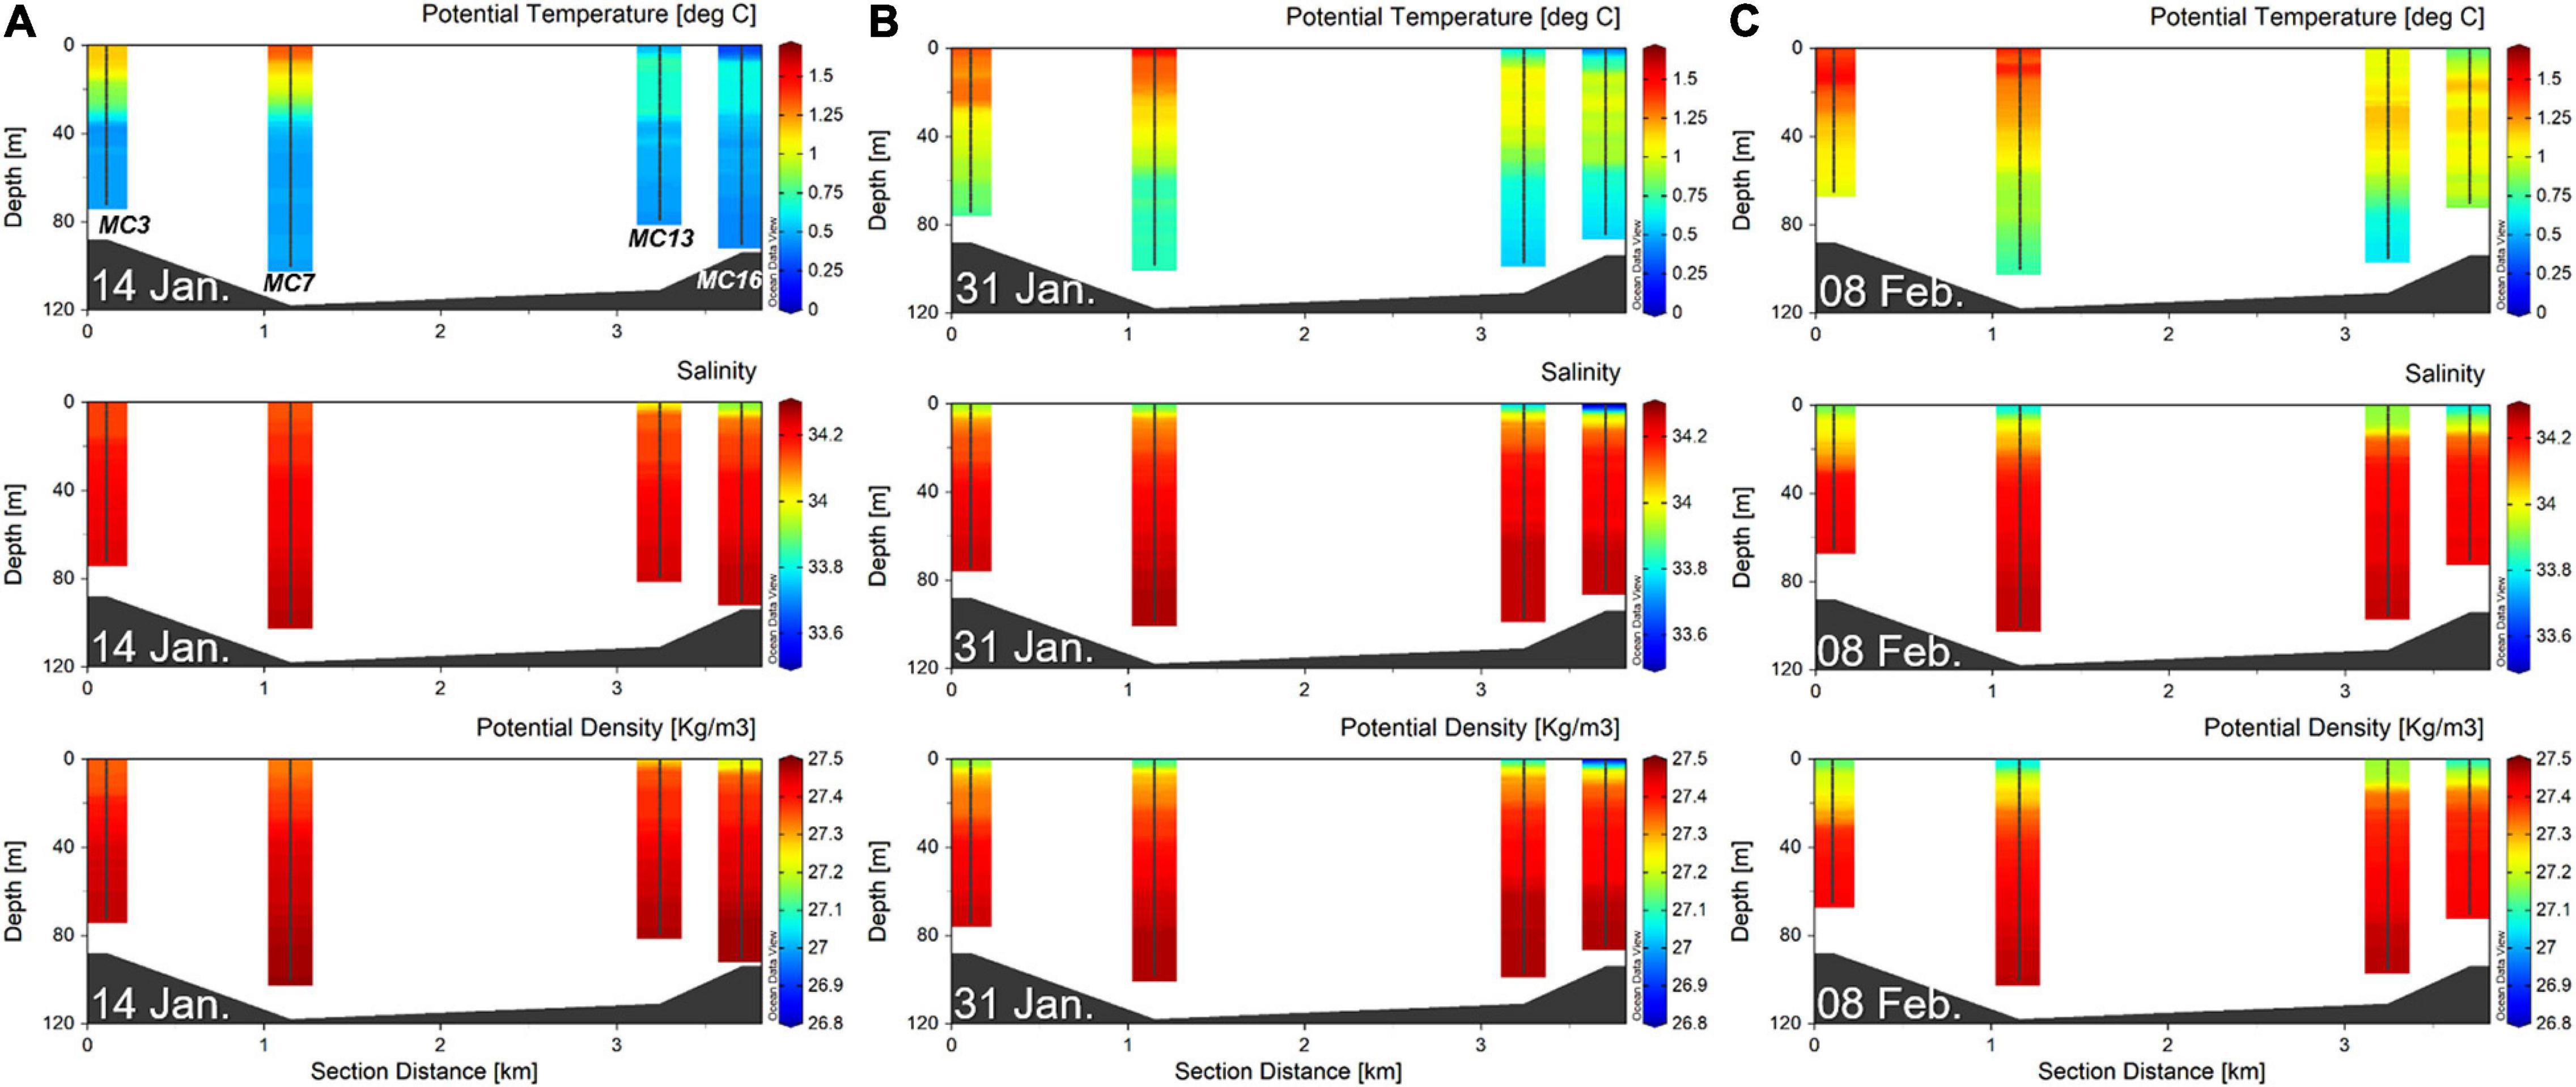
Figure 2. Distribution of potential temperature, salinity and potential density in water column along a longitudinal (west-to-east) section. The data for the (A) 14 January, (B) 31 January, and (C) 8 February are presented. The map with bathymetry was created using Ocean Data View (version 5.1.0) (AWI, Bremerhaven, Germany, Schlitzer, R.). Stations are ordered in the direction from outer cove to inner cove.
From January to February, the salinity of the surface water ranged from 33.51–34.15. On 14 January, the horizontal gradient in salinity was relatively high, while the salinity of the bottom layer was almost constant in the range of 34.23–34.27 at Marian Cove (Figure 2A). Similar to the distribution pattern of temperature, the salinity of surface water was lower in the inner cove than in the outer cove. The distribution pattern of salinity values at the surface of the outer cove was similar to that in the bottom water on 14 January; then, a relatively low-salinity water mass (<34) spread out over Marian Cove on 8 February. In the case of MC7, the salinity variation ranged from 34.13 to 34.27 and from 33.82 to 34.26 on the first and last sampling dates, respectively (Figure 2).
Time series of the euphotic depth and corresponding water stability observations are shown for all stations (Table 1). Throughout the study period, the euphotic depth extended below 15 m at MC3 and MC7 by 14 January and then declined to range between 3 and 14 m by 8 February (Table 1). The euphotic depth of MC 7 was 14.3 ± 0.6 m on average and showed little change over time. The euphotic depth decreased from MC3 (outer cove) to MC16 (inner cove). Distinctive patterns were observed in the spatial and temporal variations in water stability. The water column stability varied from 0.08 10–3 m–1 to 0.92 10–3 m–1, with an average 0.36 10–3 m–1 (± 0.23 10–3 m–1) at Marian Cove (Table 1). An increasing gradient was observed from MC3 (0.08–0.31 10–3 m–1) to MC16 (0.31–0.92 10–3 m–1). The highest values in MC3 and MC7 occurred on 8 February, while in MC13 and MC16, the highest values occurred on 31 January (Table 1).
Meteorological Data (Air Temperature, Wind Speed and Direction, and Precipitation)
The daily average air temperature, wind speed, wind direction, and daily total precipitation of each day are shown in Supplementary Figure 1. Air temperature decreased gradually in February. The average air temperatures for January and February were 1.6 and 0.9°C, respectively. The daily values of wind speed were in the range of 2.4 to 9.7 m s–1. On three sampling dates (14 and 31 January and 8 February), the prevailing wind direction was west–northwest with wind speeds of 4–6 m s–1. Although the daily amount and frequency of precipitation tended to be higher in January than in February, daily total precipitation did not exceed 0.5 mm on our sampling dates.
Dissolved Inorganic Nutrients
The dissolved inorganic nutrient concentrations within the euphotic depth are shown in Figure 3. DIP (0.9–1.8 μM) and DIN (11.0–26.2 μM) had wide ranges on 14 January, with average values of 1.5 ± 0.3 μM and 21.8 ± 4.7 μM, respectively. On 31 January and 8 February, the average concentrations of DIP were similar (1.7 ± 0.1 μM and 1.6 ± 0.2 μM, respectively), and the DIN concentrations also showed similar mean values (22.6 ± 0.9 μM and 22.8 ± 0.7 μM, respectively). The DSi concentrations were initially low on 14 January, increased to 73.3 μM on 31 January, and then remained replete over the observation area. DIP and DIN showed prominently increasing gradients from the outer cove to the inner cove on 14 January; thereafter, no clear spatial pattern was observed.
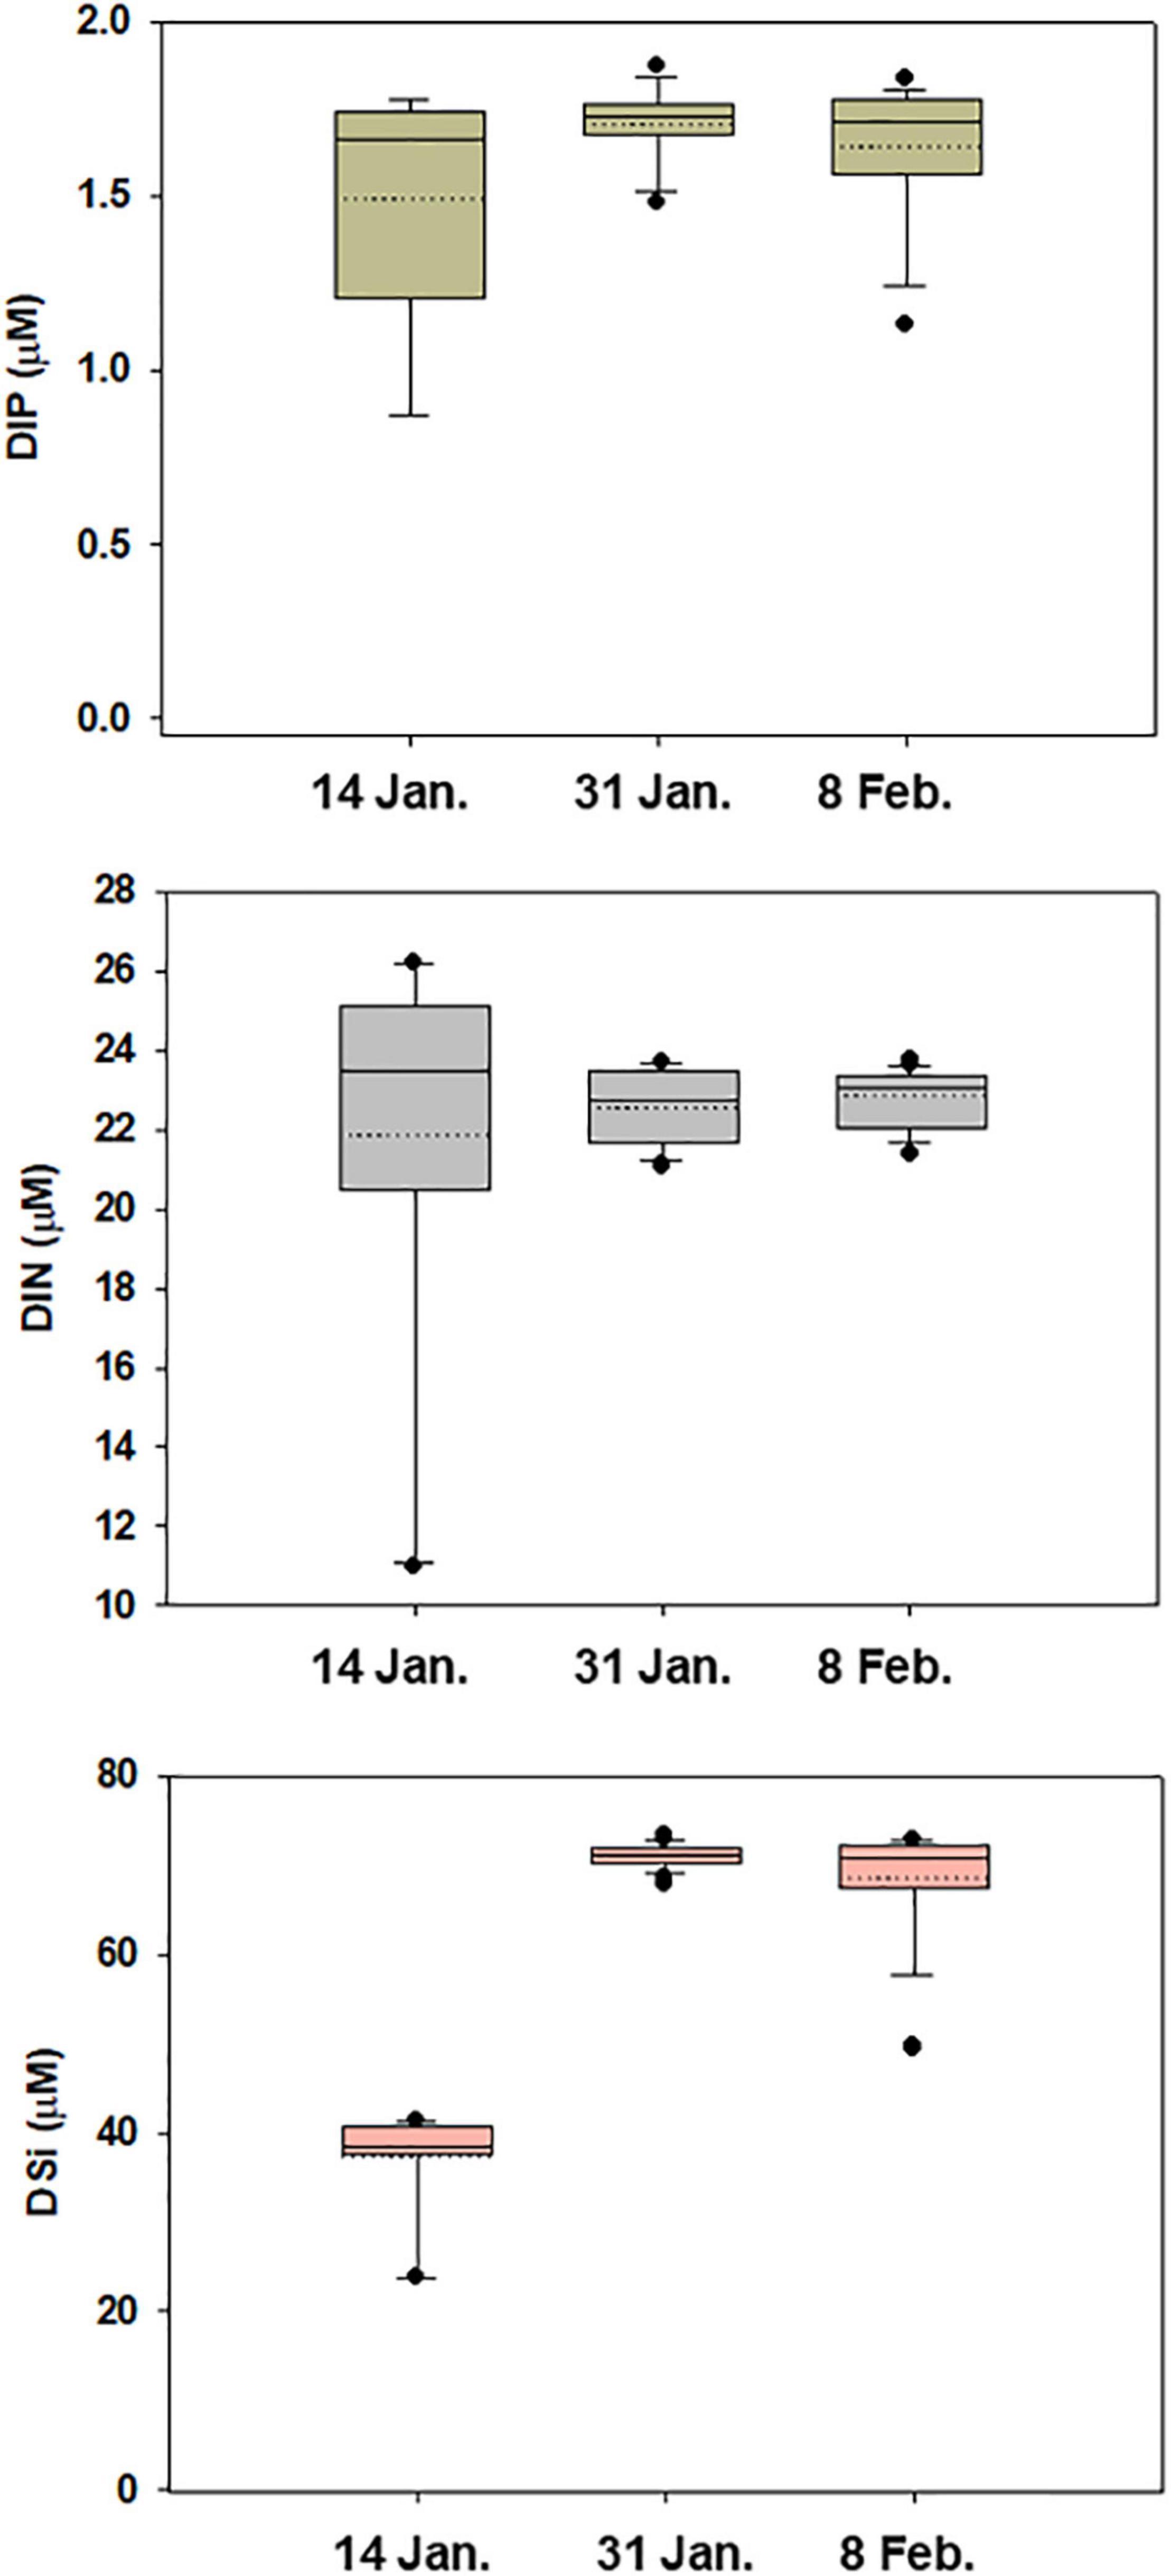
Figure 3. Boxplots of the data for each nutrient concentration within euphotic zone. Solid and dashed horizontal lines represent median and mean values, respectively.
Total and Size-Fractionated Chlorophyll-a and Phytoplankton Community
The total chlorophyll-a (chl-a) concentrations ranged from 0.3 mg m–3 at MC13 (31 January 2019) to 19.5 mg m–3 at MC7 (14 January 2019) (Figure 4). The mean value of chl-a for all stations on 14 January (7.5 mg m–3) was more than 4 times higher than those on 31 January (1.2 mg m–3) and 8 February (1.6 mg m–3). The depth-integrated total chl-a showed a decreasing gradient from MC3 (31.3–174.1 mg chl-a m–2) to MC16 (1.2–37.1 mg chl-a m–2) (Table 1). Microphytoplankton (200–20 μm) accounted for a large fraction of the total chl-a (84.0%), while nanophytoplankton (2–20 μm) were mainly distributed (>60%) within the euphotic zone after 14 January. In particular, closer to the glaciers, nanophytoplankton had a high contribution to the total chl-a, reaching 85.2% at MC16 (Figure 4).
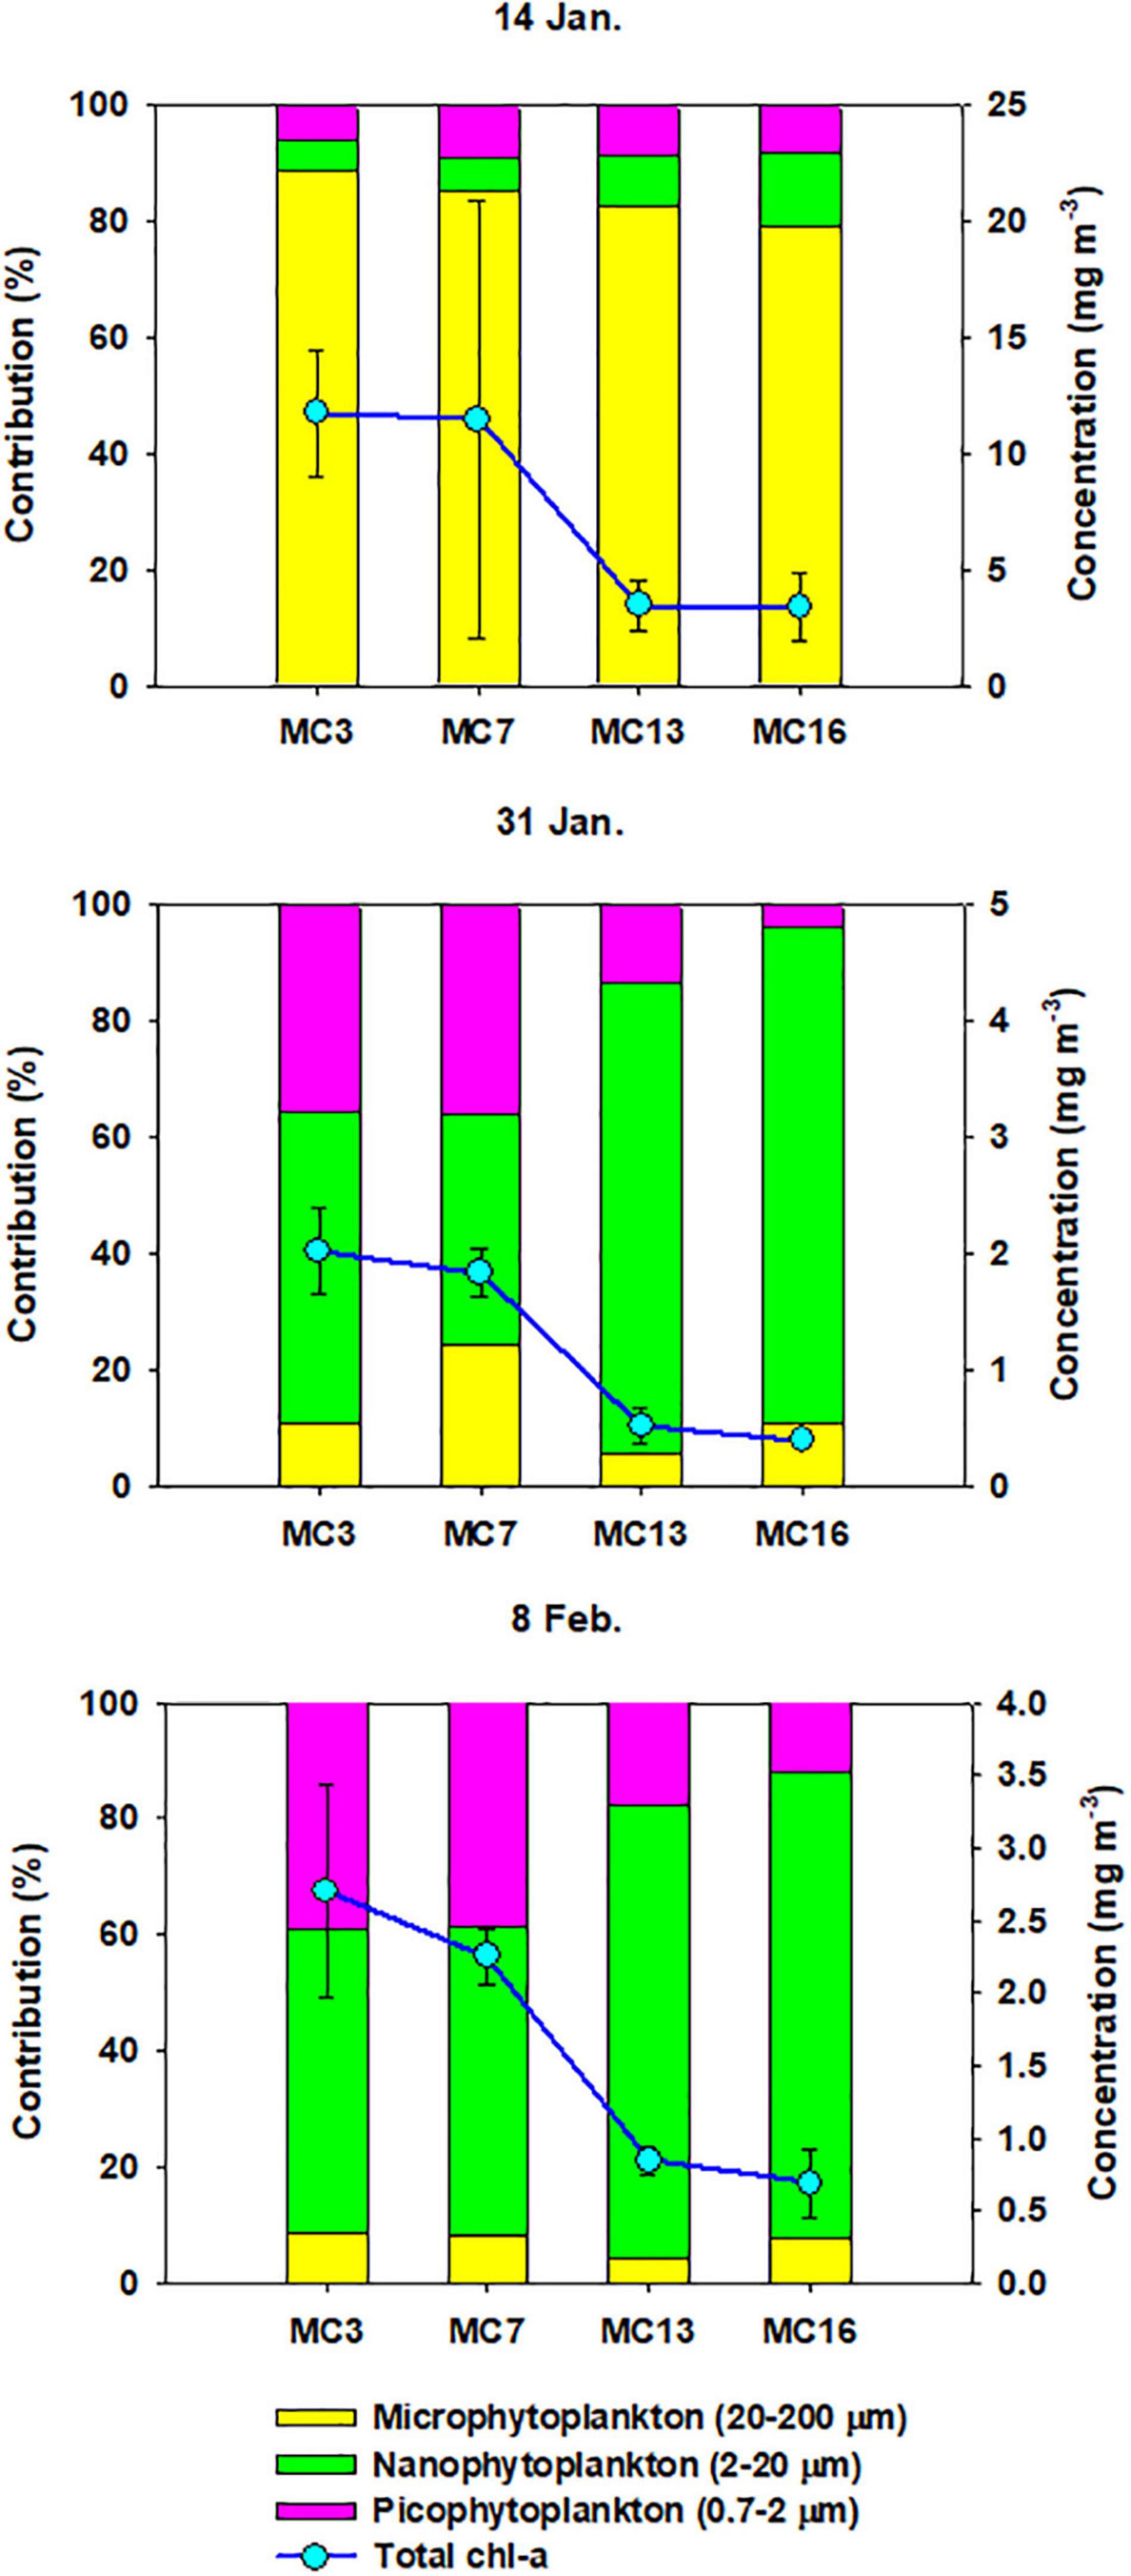
Figure 4. Spatio-temporal differences of the total chl-a and percentage of size-fractionated chl-a among sampling stations during summer. Solid lines and dots represent the total mean chl-a concentrations within euphotic zone. Error-bars represent standard deviation (n = 3).
The large contribution of the microphytoplankton fraction to the phytoplankton carbon biomass at the beginning of the survey (14 January) was mostly due to the development of Thalassiosira spp. (>20 μm), constituting a large contribution, 69.7% (SD = ± 22.7%), and reaching a maximum at MC7 (92%) in the surface layer. At the end of January, the phytoplankton assemblies were characterized by a larger contribution of unidentified spp. (nanosize; mean ± SD = 53.2 ± 15.4%) and by a moderate proportion of small diatom Minidiscus spp. (<10 μm; mean ± SD = 17.2 ± 7.6%). At the site nearest to the glacier (MC16), unidentified spp. (nanosize; 81%) became the prevailing fraction of phytoplankton on 8 February. Cryptomonas sp. was observed at some stations (MC3 and MC7) and ranged from 11.0 to 28.1%, except on 14 January (Supplementary Table 1).
Suspended Particulate Matter
The suspended particulate matter (SPM) concentrations measured in the water samples ranged from 20.0 g m–3, measured on 8 February at the water surface at MC3, to 42.0 g m–3, measured on 31 January at MC16, close to the glacier (Figure 5A). On 14 January, the mean SPM concentration was approximately 28.6 g m–3, and this value increased to 32.8 g m–3 at the end of January. The mean SPM value on 8 February (29.5 g m–3) was slightly higher than that on 14 January. A comparison of the SPM distribution revealed clear spatial variability. From the outer cove to the inner cove, SPM was predominantly observed in the area near the glacier regardless of the sampling date. The correlation between SPM and the euphotic depth was −0.812 during the sampling period (p < 0.001, Figure 5B).
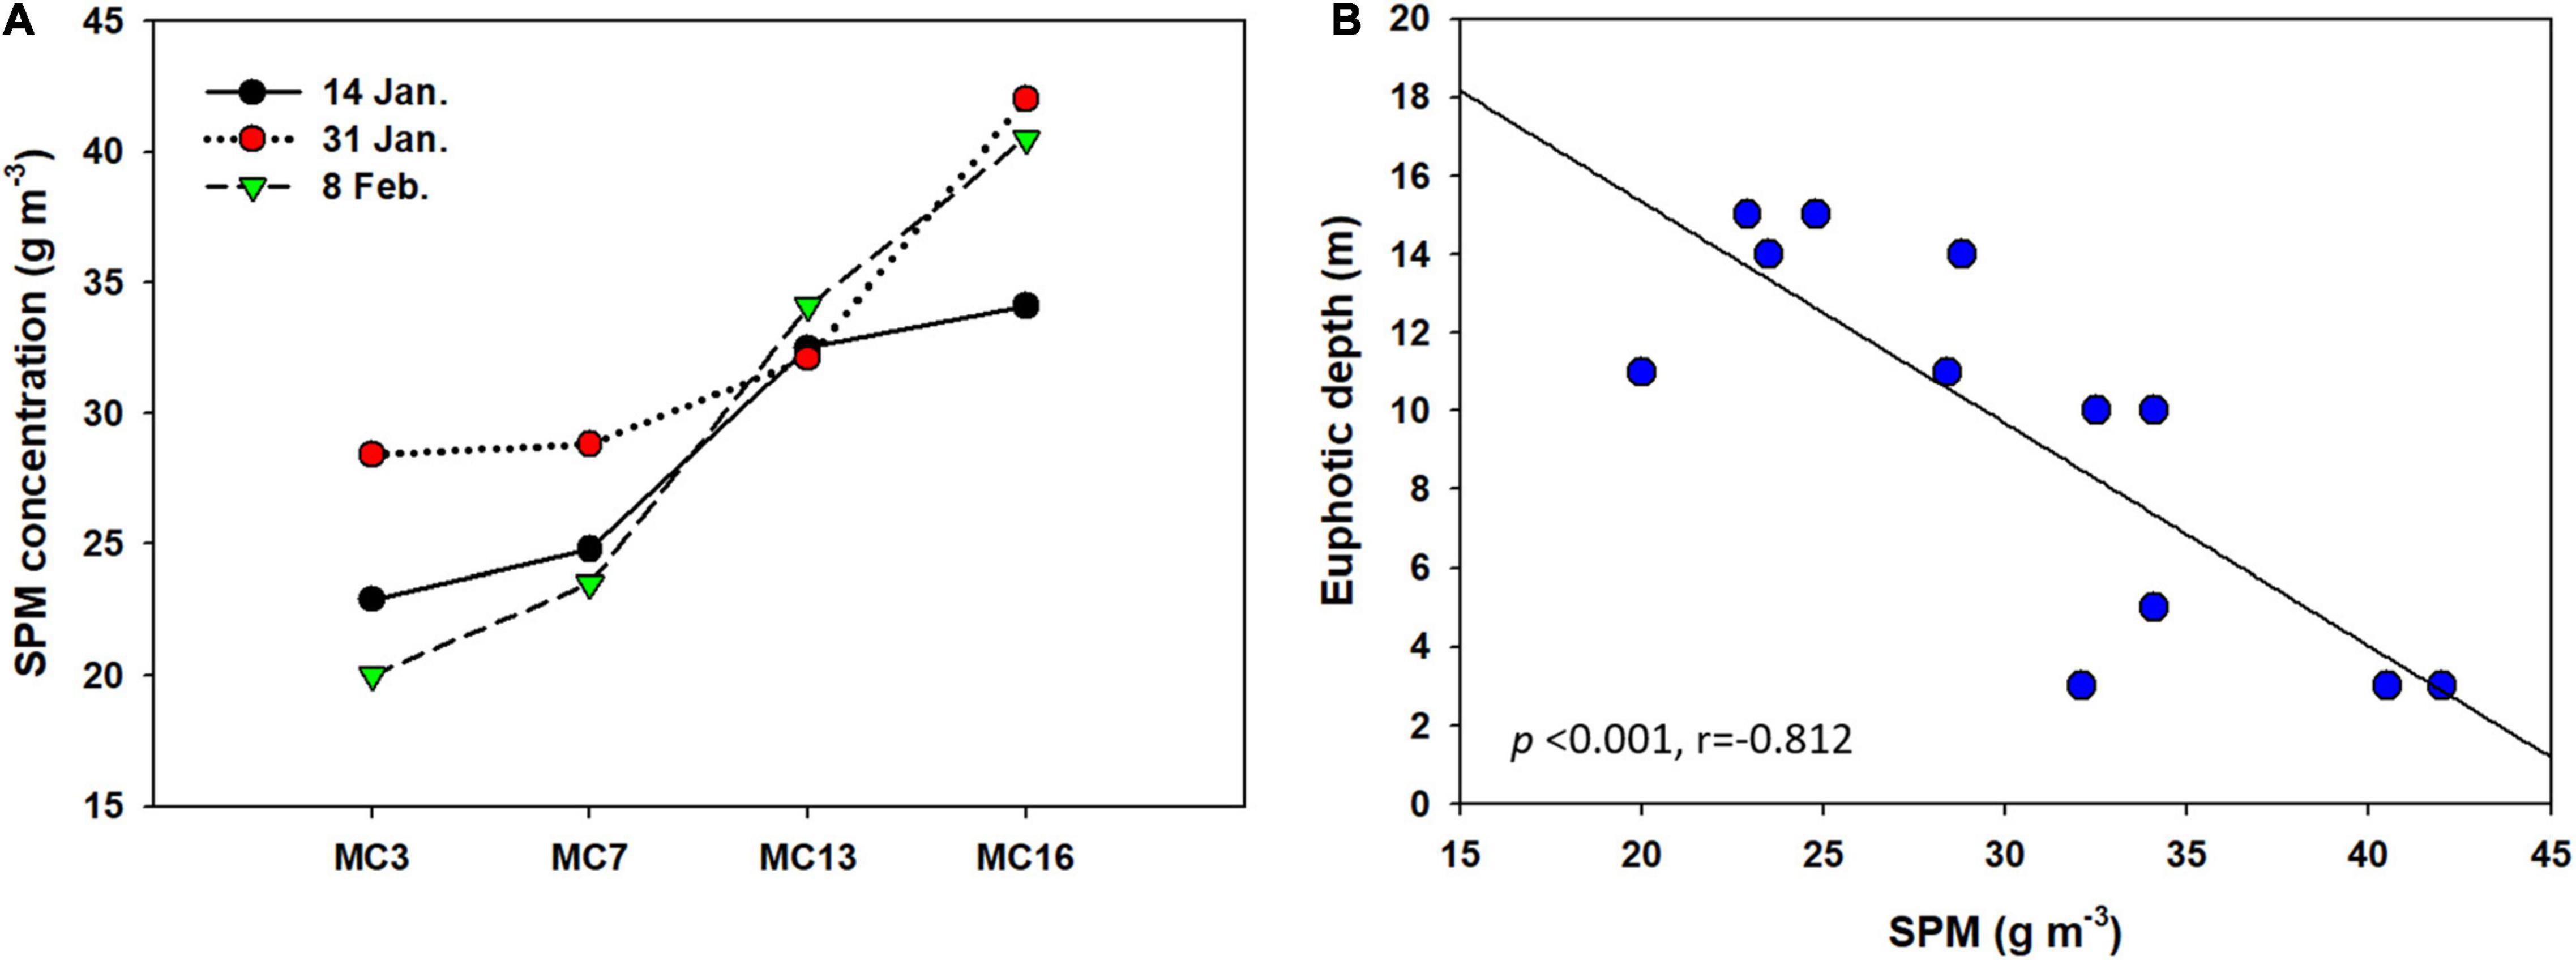
Figure 5. (A) Suspended particulate matter (SPM) concentration at surface water and (B) linear regressions between SPM and euphotic depth in (R2 = 0.70).
Carbon Uptake in the Euphotic Zone
Considering all samples, a wide range of absolute carbon uptake (from 0.01 to 31.05 mg C m–3 h–1) was observed throughout the summer. The mean absolute uptake (mg C m–3 h–1) of carbon was highest (9.8 mg C m–3 h–1) on 14 January, followed by a reduction of an order of magnitude in the uptake rates thereafter (Figure 6). Overall, the uptake rates of carbon decreased from the outer cove to the inner cove throughout Marian Cove, and the depth profiles of the uptake rates generally decreased with depth over the entire sampling period (Figure 6). The specific uptake rate (h–1) of carbon ranged from 0.00002 to 0.04430 h–1 and showed a significantly positive correlation with the absolute uptake rate (p < 0.001). The depth-integrated hourly carbon uptake rates ranged from 0.8 to 282.8 mg C m–2 h–1 with an average of 50.0 mg C m–2 h–1 (SD = ± 95.5 mg C m–2 h–1) (Figure 7). To obtain the daily productivity, these values were multiplied by 16 h for the photoperiod based on the solar radiation data (data not shown). The daily primary productivity ranged from 0.01 to 4.52 g C m–2 day–1 (mean ± SD = 0.80 ± 0.35 g C m–2 day–1) (Table 1). The integrated uptake rates followed a similar pattern as the absolute uptake rates, with a generally decreasing trend from the outer cove to the inner cove (Figure 7).
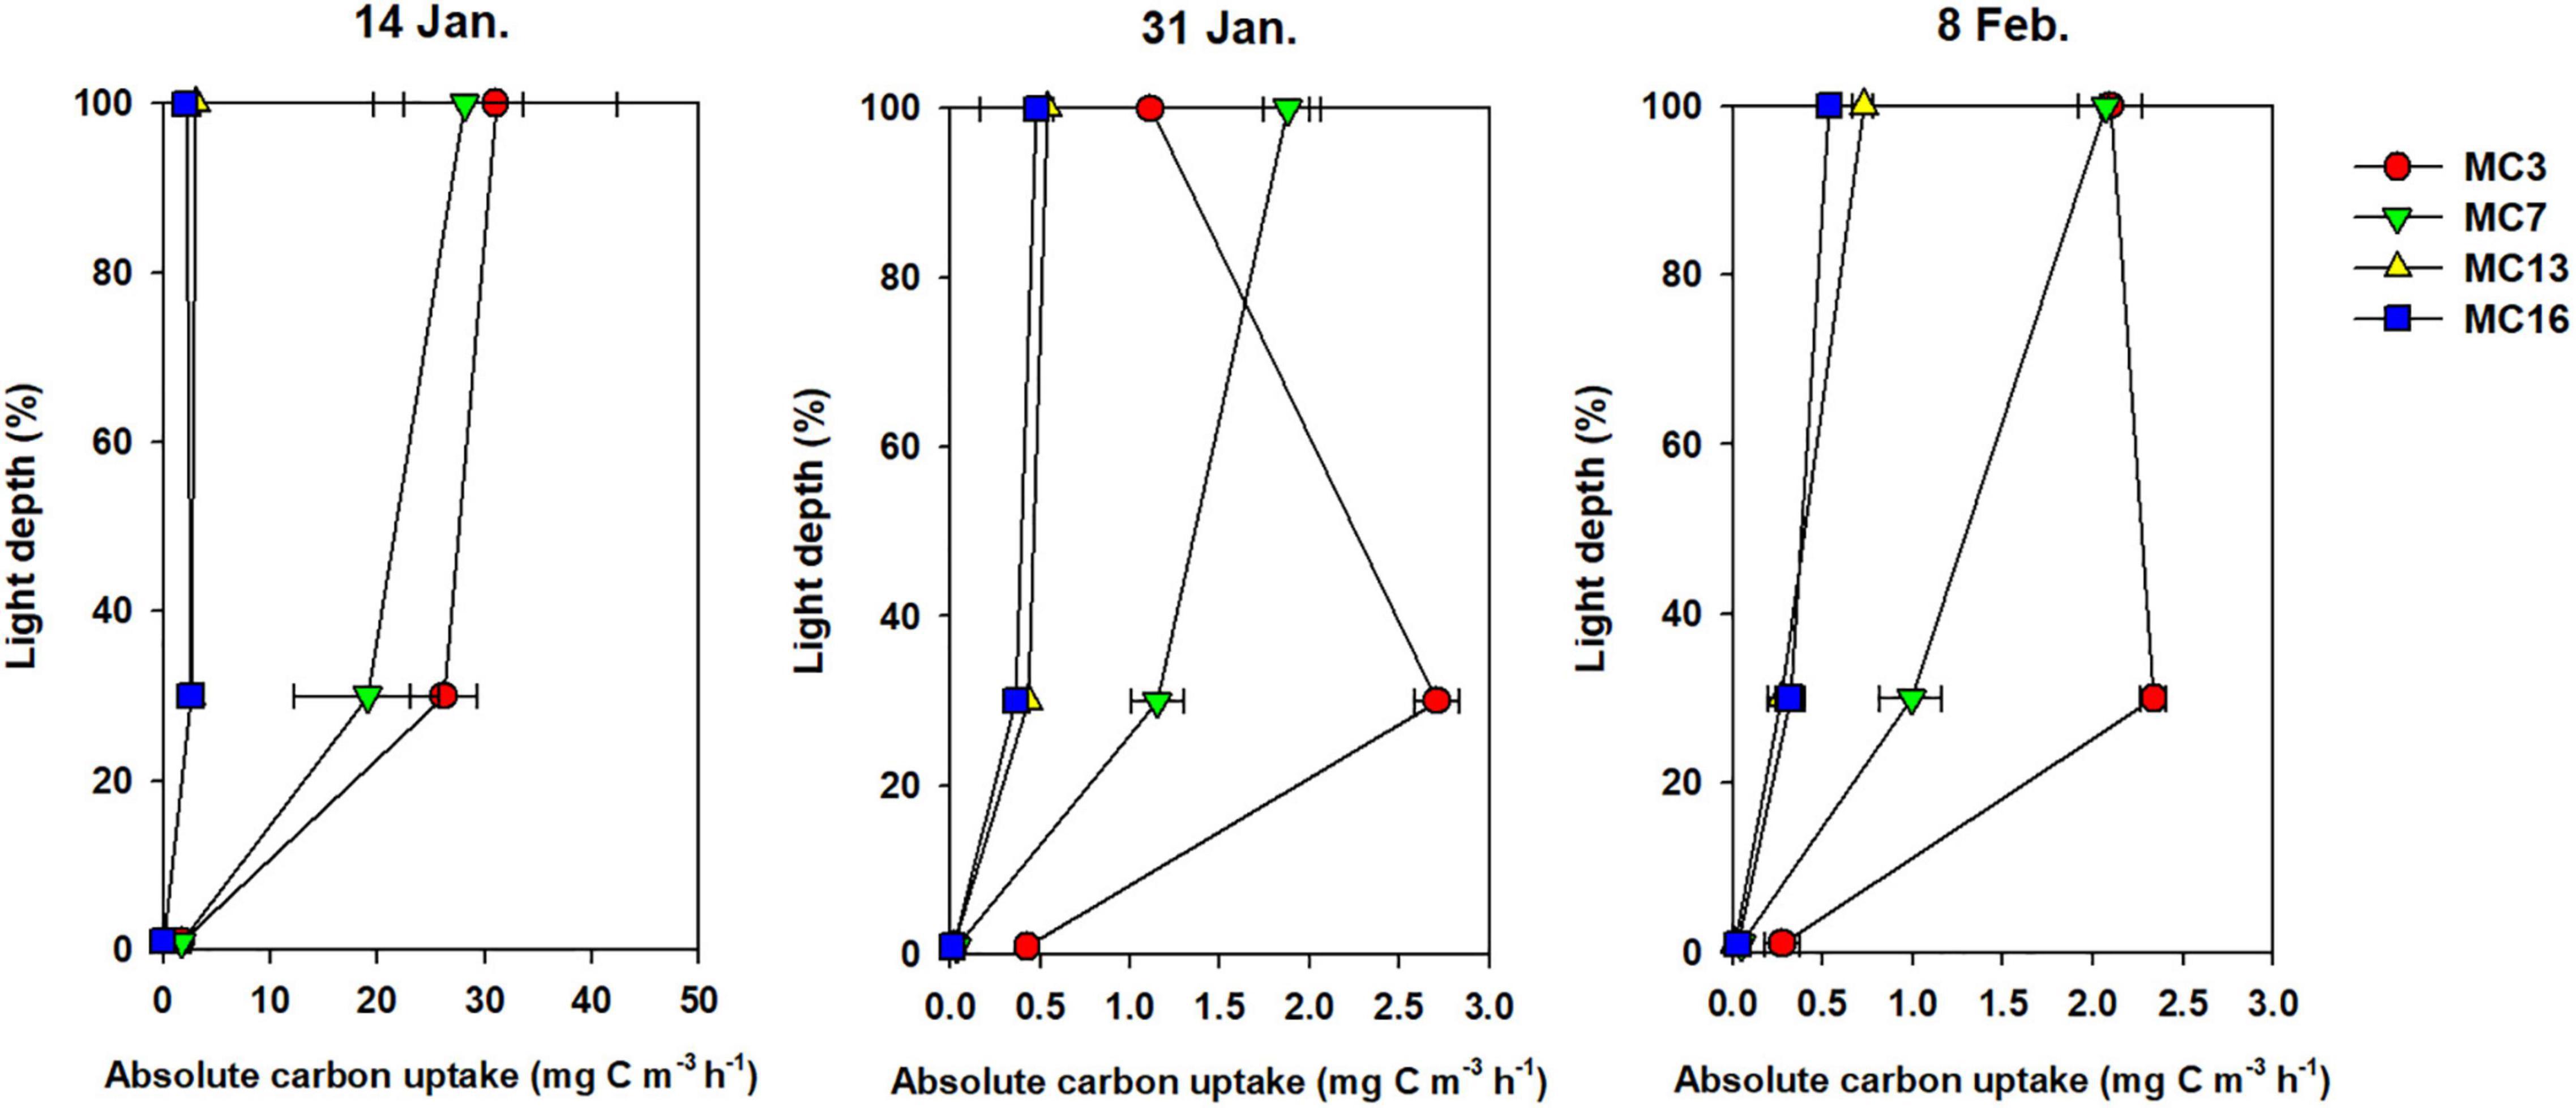
Figure 6. The vertical pattern of absolute carbon uptake rates at each light depth (100, 30, and 1% light depth). Error bars show the standard deviation of duplicate measurements.
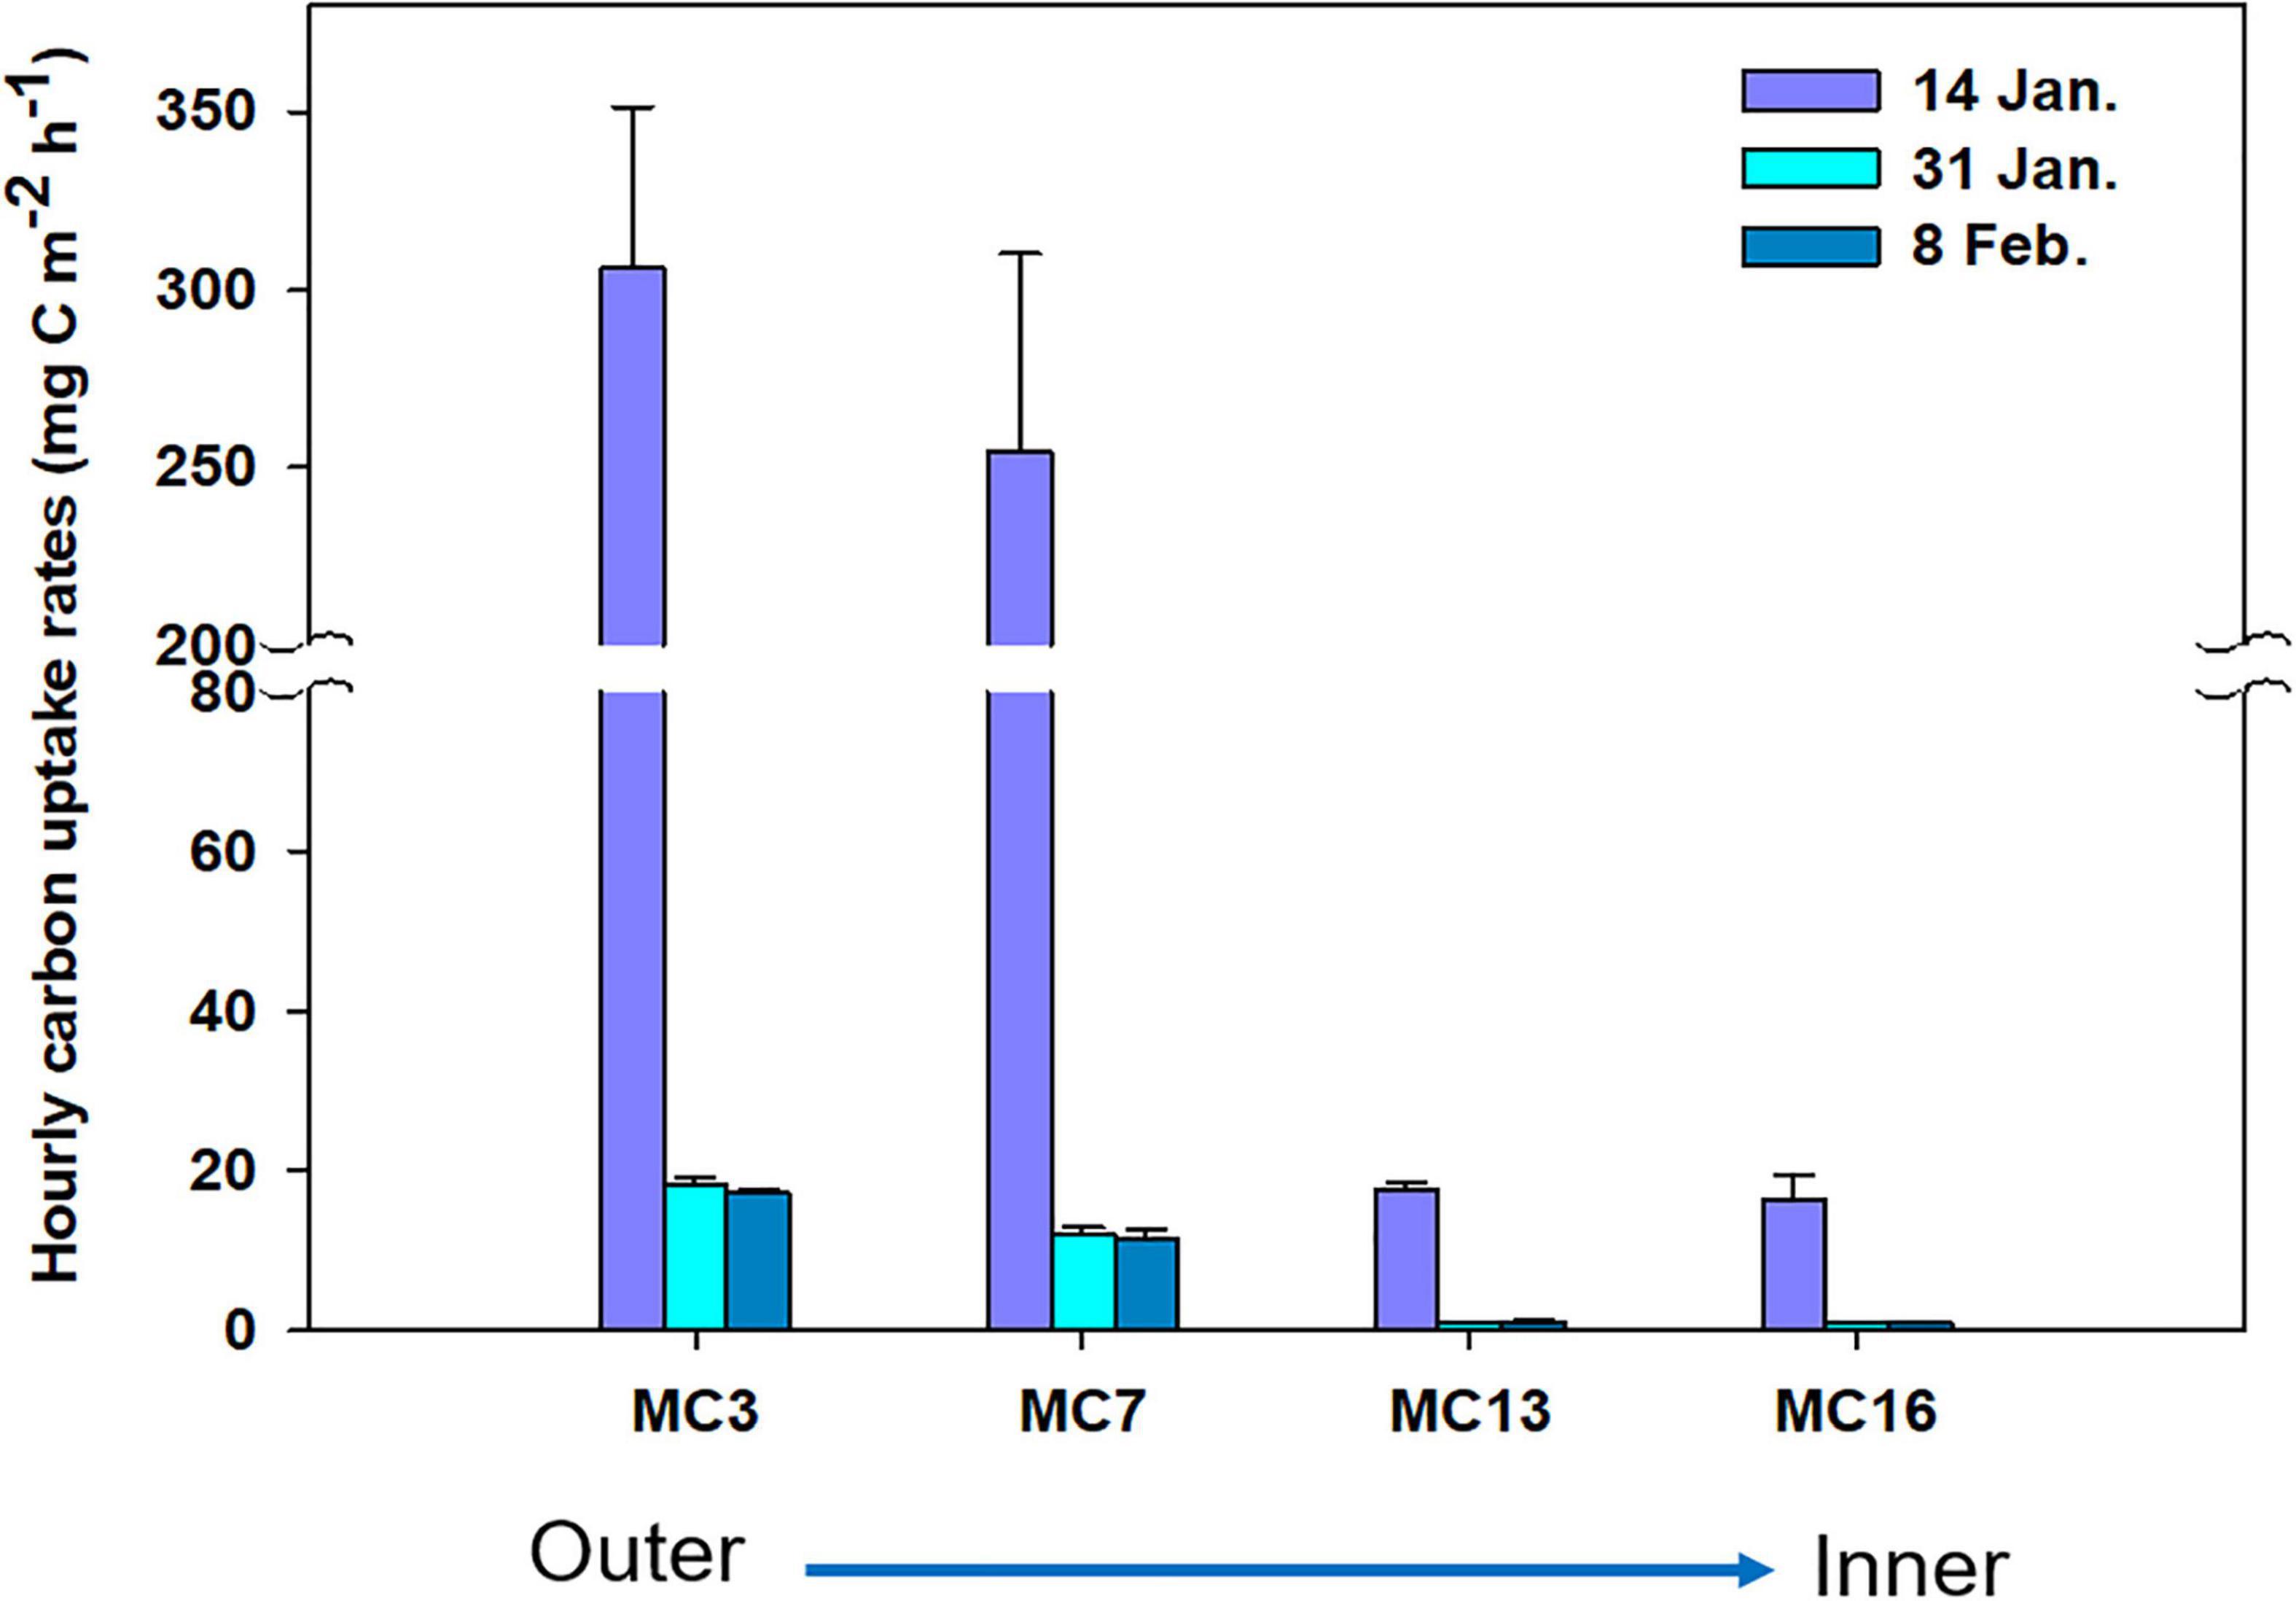
Figure 7. Carbon uptake rates of phytoplankton in sampling sites. The bar charts show mean concentrations ± standard deviation of carbon uptake rates.
Discussion
The inner cove exhibited low temperatures, low salinities and high water stability, while the outer cove exhibited relatively high temperatures, high salinities and low water stability. Hydrographic changes between Maxwell Bay and Marian Cove occur due to tidal mechanisms, strong estuarine circulation, and winds over the mouth of the cove and the inner sill (c. 70 m deep) (Yoo et al., 1999, 2015; Llanillo et al., 2019). In Marian Cove, the mean tidal amplitude is 1.5 m, with the amplitude reaching up to 2.8 m (Yoon et al., 1998), and the tidal variability in salinity is higher than that of Maxwell Bay or Collins Bay (Llanillo et al., 2019). At the beginning of the investigation (on 14 January), observations of relatively cold temperatures (∼0.3°C) with fresh (<34) surface waters were most pronounced at the innermost cove close to the glacial front in our study. As the austral summer progressed, the overlying freshwater in the upper 20 m spread throughout the cove, and the water column was warmer in February than at the beginning of the study period (January). This feature is probably explained by the tides, winds, and freshwater from meltwater and precipitation and by the inward motion of warm modified upper circumpolar deep water (m-UCDW) during summer. However, this study is based on the assumption that the effects of tides and wind were negligible because sampling was performed under similar conditions (flood tides and west-northwest wind directions) (Supplementary Figure 1). Meltwater discharged from sea ice and precipitation was also not strongly affected by hydrography in our study since neither sea ice nor strong precipitation events were observed during the survey (Supplementary Figure 1). Hence, in the inner cove, freshwater inputs are sourced from glacial meltwater or stream discharge, causing significant freshening and further stabilizing the waters and creating a low-salinity water layer.
Our data suggest that the cove was influenced by glaciers, showing distinct primary productivity, phytoplankton biomass, light regime, and hydrographic conditions, as mentioned above. Antarctic continental shelf zone waters contribute to high productivity, with an average of 4.6 g C m–2 day–1 (Arrigo et al., 2008). Even though the spatiotemporal distribution patterns differed slightly throughout the cove, the coastal regions are more productive, reaching a maximum of 3.2 g C m–2 day–1 in the Gerlache Strait (Serret et al., 2001), 6.9 g C m–2 day–1 in Marguerite Bay (Rozema et al., 2017), and 8.8 g C m–2 day–1 in South Bay (Höfer et al., 2019). These results indicate that high primary productivity is one of the major characteristics of more stratified water columns primarily via freshwater input from sea ice melt and coastal glaciers. Studies on the carbon uptake rates of phytoplankton have also been conducted in some waters of King George Island (Yang, 1990; Aracena et al., 2018; Höfer et al., 2019). In the present study, the depth-integrated daily carbon uptake rates showed a wide range of variation (ranging from 0.01 to 4.52 g C m–2 day–1) during the investigation period that was within the range recorded in the abovementioned studies. Our measured mean daily carbon uptake rate was 0.80 g C m–2 day–1 (SD = ± 1.53 g C m–2 day–1), which was ∼5 times higher than the observation-based estimates at one point station in Marian Cove (0.14 g m–2 day–1; Yang, 1990) but was similar to that measured in the WAP (0.74 g C m–2 day–1; Vernet et al., 2008). These carbon uptake change trends were very similar to those of chl-a, suggesting that the carbon uptake rate primarily depended on the quantity of phytoplankton biomass.
The high chl-a concentrations, jointly with the high microphytoplankton and consumption of DSi, as well as the high primary production, suggest that a bloom event occurred during the 14 January sampling in Marian Cove. The maximum chl-a concentration (19.5 mg m–3) obtained in the present study was similar to that measured by Höfer et al. (2019) (>15 mg m–3) in Maxwell Bay. Summer chl-a concentrations typically exceed 20 mg m–3 (up to 25 mg m–3), with yearly variations in chl-a and a peak observed in January in Ryder Bay, northern Marguerite Bay, Antarctica (Clarke et al., 2008). These are intense blooms, and the peak total chl-a values measured during the observation period fit well with those observed in nearshore waters off Antarctica (Mitchell and Holm-Hansen, 1991; Clarke and Leakey, 1996; Vernet et al., 2008). In the present study, the samples were composed mainly of large diatoms (>20 μm, Thalassiosira spp.; >50%) during the bloom. This is consistent with previous reports of summer phytoplankton blooms, and large diatoms and colonial forms are typical for coastal waters elsewhere in Antarctica (Clarke et al., 2008; Biggs et al., 2019; Mangoni et al., 2019). The seasonal patterns of phytoplankton biomass and productivity are closely dependent on changes in sea ice, sea surface temperature, and inflow of UCDW (Kavanaugh et al., 2015; Biggs et al., 2019). In particular, the initial interleaving of m-UCDW into Maxwell Bay adjacent to Marian Cove leads to increases in the temperature, salinity and density of subsurface waters (Llanillo et al., 2019). In Marian Cove, phytoplankton biomass generally began in late November and peaked around January, when the water temperature was the warmest for an on-record year (Lee et al., 2015). Hence, our summer bloom was probably initiated by an inflow of relatively warmer water from Maxwell Bay as a means of controlling growth and stimulating phytoplankton biomass accumulation. The evidence showed that production maxima (4.52 g C m–2 day–1) and chl-a accumulation (174.1 mg chl-a m–2) were high on 14 January at MC3, near the mouth of cove.
Following the bloom, the direct input of SPM occurred along with glacial meltwater and streams entering the surface; consequently, summer production was limited by turbidity and water stability. Even when comparing the specific uptake rate (h–1), it showed a similar trend to the absolute suptake rate, suggesting that it was not only due to the difference in biomass of phytoplankton. Nutrients have an important influence on the growth of phytoplankton and are generally not limited, while there is evidence that trace metals affect production in Antarctic coastal waters more than in the open ocean (Sañudo-Wilhelmy et al., 2002). Direct measurements of nutrient concentrations (DIN, DIP, and DSi) and dissolved iron in ice or snow show that these concentrations are much lower and higher than those in seawater, respectively (Kim et al., 2015). However, in Marian Cove, major nutrients (such as DIN, DIP, and DSi) are not limiting factors for phytoplankton productivity or biomass during summer (Yang, 1990; Lee et al., 2015). Temporally, the DSi values, measured with large concentration differences between peaks and between 31 January (t-test: t = −23.1, p < 0.01) and 8 February (t-test: t = −11.5, p < 0.01), were relatively lower during intense blooms regardless of the sampling station. It was suggested that the DSi concentration is important for the growth of diatoms and that DSi is directly used by microsized phytoplankton (mainly diatoms) (Weber and Deutsch, 2010). This confirms that the comparison of nutrients between the inner cove and outer cove did not show a significant difference in our study. Therefore, in our results, the lower carbon uptake rates in the region near the glacier were not more severely affected by the additional inputs of trace metals and nutrients.
Concomitant with meltwater inputs, SPM in surface waters strongly impacts the light regime. In addition to the stability of the water column, phytoplankton entering shallow mixed layers with higher light intensities serve to enhance phytoplankton biomass and production (Mitchell and Holm-Hansen, 1991; Schloss et al., 2002); however, SPM inputs during summer could have negative effects by attenuating light penetration (Yang, 1990; Schloss et al., 2002; Kim et al., 2018). The dispersal patterns of SPM were previously reported in Marian Cove by Yoon et al. (1998), Yoo et al. (1999), and Yoo et al. (2003). These authors concluded that surface plumes (cold, freshened, and highly turbid water in the upper 2 m) result from either supraglacial discharge by meltwater streams along the coast or by waterfalls off ice cliffs. They pointed out that this discrepancy is greater in areas characterized by high levels of SPM (>28 g m–3) occurring on the northern side of Marian Cove. In the present study, it was also shown that the SPM concentrations measured during summer led to marked spatial variations in light penetration, and these variations increased with distance to the glacier. The freshening of the surface waters coincided with high turbidity-low productivity conditions, suggesting limited light availability for phytoplankton. Because the high turbidity resulting from the high suspended material in meltwater hinders light penetration into the water, enhanced stratification also permits phytoplankton to remain within unfavorable conditions, preventing deeper mixing. It was confirmed that the comparison between the inner and outer parts of the cove in the euphotic depth, which has an important influence on the carbon uptake rates of phytoplankton, was generally low in the inner cove area. This is consistent with a previous report of summer phytoplankton in Marian Cove, in which low chl-a content and low primary productivity indebted mostly to nanophytoplankton were observed at shallow euphotic depths caused by suspended solids resulting from strong winds and ice-carried debris (Yang, 1990). The turbid water released by glacial melt and riverine discharge, can restrict phytoplankton growth, even though promoting phytoplankton growth by enhanced water column stability (Schloss et al., 2002; Kim et al., 2018). This fact suggested that reduction of light penetration into water column by high load of particulate matter can control phytoplankton bloom development in shallow coastal area (Schloss et al., 2002). Large phytoplankton blooms (dominated by diatoms) are closely dependent on light availability and the ability of phytoplankton to adapt and photosynthesize at higher light levels (Vernet et al., 2008). Smaller cells more efficiently utilize light than larger cells in light-limited conditions since they are less affected by the package effect (Kirk, 1994; Finkel, 2001). For this reason, theoretically, there is a tendency that smaller cells with greater photosynthetic efficiency can thrive under conditions of high turbidity and low light. In addition, motile flagellate is able to move, exploit different light regimes, and select for optimal light (Klais et al., 2016; Roselli et al., 2017). Likewise, phytoplankton communities showing changes in their community and cell size composition (unidentified nanophytoplankton and flagellate) were more pronounced close to the glacial front in our study. This process was suggested to be a strategic response to low light availability that gives the nanophytoplankton and flagellate (e.g., Cryptomonas sp.) a competitive advantage over microphytoplankton (diatom). Therefore, our findings provide insight that the increases in particulate matter caused by freshwater inputs determine light availability, which in turn may serve as mechanisms to control phytoplankton production, biomass accumulation and community dynamics.
Summary and Conclusion
The average primary production rates in Marian Cove varied by two orders of magnitude, from 0.01 to 4.52 g C m–2 day–1. The spatiotemporal patterns of summer phytoplankton biomass and productivity are associated with increased meltwater from glaciers and/or streams in this area. Freshwater discharges into the surface waters, increasing water column stability. The deepening of the average euphotic depth toward the slope establishes an inner-outer gradient in average productivity. In contrast, the role of nutrients cannot be clearly observed. The high variabilities in productivity and biomass reflect higher inputs of SPM loads that drive strong gradients in light availability. Thus, phytoplankton is more exposed to unfavorable light conditions, which leads to the development of smaller cells, including unidentified spp. (nanophytoplankton) and flagellate species.
The freshening of surface water has resulted in increased glacial melt, showing a shift in the size distribution of phytoplankton from diatom-dominated assemblages to cryptophytes and small flagellates in the WAP (Moline et al., 2004) and influencing changes in krill recruitment, abundance and availability to predators (Moline et al., 2004; Ducklow et al., 2017). To date, specific studies on zooplankton abundance have not been conducted in Marian Cove. Instead, in Potter Cove, a tributary basin adjacent to Marian Cove, microsized diatom blooms (> 15 mg m–3) directly affect the large copepod abundances under cold conditions (preventing glacial melting), and nanophytoplankton and microzooplankton (aloricate ciliates and dinoflagellates) have been observed after blooms and coincide with intense glacial melting (Garcia et al., 2016).
As the WAP continues to warm, the open-water season is expected to become increasingly longer, and the glacial front is expected to retreat further. New areas of open water may be created in Marian Cove, stimulating phytoplankton blooms and increasing productivity in previously ice-related habitats. However, the high particle concentrations observed on the surface in this study highlighted interesting linkages regarding the effects of meltwater discharge and particle dynamics on primary production and phytoplankton composition in shallow coastal area; these relationships warrant further studies.
Data Availability Statement
The original contributions presented in the study are included in the article/Supplementary Material, further inquiries can be directed to the corresponding author.
Author Contributions
S-YH conceived of the study, participated in its design and helped to draft the manuscript. BK drafted the manuscript and performed the field and laboratory experiments. MJ and HJ carried out the analysis of the chl-a and phytoplankton community. T-WK processed the CTD data. S-JP provided meteorological data. JP was the leader of the Korean Antarctic Research Program and provided scientific advice. All authors have read and agreed to the published version of the manuscript.
Funding
This study was supported by the Korea Polar Research Institute (KOPRI) and undertaken as part of “Carbon cycle change and ecosystem response under the Southern Ocean warming (PE21110).”
Conflict of Interest
The authors declare that the research was conducted in the absence of any commercial or financial relationships that could be construed as a potential conflict of interest.
Publisher’s Note
All claims expressed in this article are solely those of the authors and do not necessarily represent those of their affiliated organizations, or those of the publisher, the editors and the reviewers. Any product that may be evaluated in this article, or claim that may be made by its manufacturer, is not guaranteed or endorsed by the publisher.
Acknowledgments
We would like to thank 32th King Sejong Station Overwintering Team for assistance during sampling.
Supplementary Material
The Supplementary Material for this article can be found online at: https://www.frontiersin.org/articles/10.3389/fmars.2021.725173/full#supplementary-material
Footnotes
References
Ahn, I.-Y., Moon, H.-W., Jeon, M., and Kang, S.-H. (2016). First record of massive blooming of benthic diatoms and their association with megabenthic filter feeders on the shallow seafloor of an Antarctic Fjord: does glacier melting fuel the bloom? Ocean Sci. J. 51, 273–279. doi: 10.1007/s12601-016-0023-y
Annett, A. L., Skiba, M., Henley, S. F., Venables, H. J., Meredith, M. P., Statham, P. J., et al. (2015). Comparative roles of upwelling and glacial iron sources in Ryder Bay, coastal western Antarctic Peninsula. Mar. Chem. 176, 21–33.
Aracena, C., González, H. E., Garcés-Vargas, J., Lange, C. B., Pantoja, S., Muñoz, F., et al. (2018). Infuence of summer conditions on surface water properties and phytoplankton productivity in embayments of the South Shetland Islands. Polar Biol. 41, 2135–2155. doi: 10.1007/s00300-018-2338-x
Arrigo, K. R., van Dijken, G. L., Alderkamp, A.-C., Erickson, Z. K., Lewis, K. M., Lowry, K. E., et al. (2017). Early spring phytoplankton dynamics in the Western Antarctic Peninsula. J. Geophys. Res. Oceans 122, 9350–9369. doi: 10.1002/2017jc013281
Arrigo, K. R., van Dijken, G. L., and Bushinsky, S. (2008). Primary production in the Southern Ocean, 1997-2006. J. Geophys. Res. Oceans 113:C8. doi: 10.1029/2007JC004551
Atkinson, A., Siegel, V., Pakhomov, E., and Rothery, P. (2004). Long-term decline in krill stock and increase in salps within the Southern Ocean. Nature 432, 100–103. doi: 10.1038/nature02996
Bae, H., Ahn, I.-Y., Park, J., Song, S. J., Noh, J., Kim, H., et al. (2021). Shift in polar benthic community structure in a fast retreating glacial area of Marian Cove, West Antarctica. Sci. Rep. 11:241. doi: 10.1038/s41598-020-80636-z
Biggs, T. E. G., Alvarez-Fernandez, S., Evans, C., Mojica, K. D. A., Rozema, P. D., Venables, H. J., et al. (2019). Antarctic phytoplankton community composition and size structure: importance of ice type and temperature as regulatory factors. Polar Biol. 42, 1997–2015. doi: 10.1007/s00300-019-02576-3
Clarke, A. (1988). Seasonality in the antarctic marine environment. Comp. Biochem. Physiol. B 90, 461–473.
Clarke, A., and Leakey, R. J. G. (1996). The seasonal cycle of phytoplankton, macronutrients, and the microbial community in a nearshore antarctic marine ecosystem. Limnol. Oceanogr. 41, 1281–1294. doi: 10.4319/lo.1996.41.6.1281
Clarke, A., Meredith, M. P., Wallace, M. I., Brandon, M. A., and Thomas, D. N. (2008). Seasonal and interannual variability in temperature, chlorophyll and macronutrients in northern Marguerite Bay, Antarctica. Deep. Sea Res. Part II 55, 1988–2006. doi: 10.1016/j.dsr2.2008.04.035
Cook, A. J., Fox, A. J., Vaughan, D. G., and Ferrigno, J. G. (2005). Retreating glacier fronts on the Antarctic Peninsula over the past half-century. Science 308, 541–544. doi: 10.1126/science.1104235
Cook, A. J., Holland, P. R., Meredith, M. P., Murray, T., Luckman, A., and Vaughan, D. G. (2016). Ocean forcing of glacier retreat in the western Antarctic Peninsula. Science 353, 283–286. doi: 10.1126/science.aae0017
Deppeler, S. L., and Davidson, A. T. (2017). Southern ocean phytoplankton in a changing climate. Front. Mar. Sci. 4:40. doi: 10.3389/fmars.2017.00040
Doney, S. C., Ruckelshaus, M., Duffy, J. E., Barry, J. P., Chan, F., English, C. A., et al. (2012). Climate change impacts on marine ecosystems. Ann. Rev. Mar. Sci. 4, 11–37.
Ducklow, H. W., Baker, K., Martinson, D. G., Quetin, L. B., Ross, R. M., Smith, R. C., et al. (2017). Marine pelagic ecosystems: the West Antarctic Peninsula. Philos. Trans. R. Soc. B 362, 67–94. doi: 10.1098/rstb.2006.1955
Fiala, M., Kopczynsk, E. E., Jeandel, C., Oriola, L., and Vetion, G. (1998). Seasonal and interannual variability of size-fractionated phytoplankton biomass and community structure at station Kerfix, off the Kerguelen Islands, Antarctica. J. Plankton Res. 20, 1341–1356. doi: 10.1093/plankt/20.7.1341
Finkel, Z. V. (2001). Light absorption and size scaling of light-limited metabolism in marine diatoms. Limnol. Oceanogr. 46, 86–94. doi: 10.4319/lo.2001.46.1.0086
Garcia, M. D., Hoffmeyer, M. S., Abbate, M. C. L., de Cao, M. S. B., Pettigrosso, R. E., Almandoz, G. O., et al. (2016). Micro- and mesozooplankton responses during two contrasting summers in a coastal Antarctic environment. Polar Biol. 39, 123–137. doi: 10.1007/s00300-015-1678-z
Garibotti, I. A., Vernet, M., Ferrario, M. E., Smith, R. C., Ross, R. M., and Quetin, L. B. (2003). Phytoplankton spatial distribution patterns along the western Antarctic Peninsula (Southern Ocean). Mar. Ecol. Prog. Ser. 261, 21–39. doi: 10.3354/meps261021
Glibert, P. M., Goldman, J. C., and Carpenter, E. J. (1982). Seasonal variations in the utilization of ammonium and nitrate by phytoplankton in Vineyard Sounds, Massachusetts, USA. Mar. Biol. 70, 237–249. doi: 10.1007/bf00396842
Gutt, J., Isla, E., Xavier, J. C., Adams, B. J., Ahn, I.-Y., Cheng, C.-H. C., et al. (2021). Antarctic ecosystems in transition – life between stresses and opportunities. Biol. Rev. 96, 798–821. doi: 10.1111/brv.12679
Ha, S.-Y., Ahn, I.-Y., Moon, H.-W., Choi, B., and Shin, K.-H. (2019). Tight trophic association between benthic diatom blooms and shallow-water megabenthic communities in a rapidly deglaciated Antarctic fjord. Estuar. Coast. Shelf Sci. 218, 258–267. doi: 10.1016/j.ecss.2018.12.020
Hama, T., Miyazaki, T., Ogawa, Y., Iwakuma, T., and Takahashi, M. (1983). Measurement of photosynthetic production of a marine phytoplankton population using a stable 13C isotope. Mar. Biol. 73, 31–36.
Harrison, W. G., and Harris, L. H. (1986). Isotope-dilution and its effects on measurements of nitrogen and phosphorus uptake by oceanic microplankton. Mar. Ecol. Prog. Ser. 27, 253–261. doi: 10.3354/meps027253
Höfer, J., Giesecke, R., Hopwood, M. J., Carrera, V., Alarcón, E., and González, H. E. (2019). The role of water column stability and wind mixing in the production/export dynamics of two bays in the Western Antarctic Peninsula. Prog. Oceanogr. 174, 105–116. doi: 10.1016/j.pocean.2019.01.005
Jena, B., and Pillai, A. N. (2020). Satellite observations of unprecedented phytoplankton blooms in the Maud Rise polynya, Southern Ocean. Cryosphere 14, 1385–1398. doi: 10.5194/tc-14-1385-2020
Jena, B., Ravichandran, M., and Turner, J. (2019). Recent reoccurrence of large open-ocean polynya on the Maud Rise Seamount. Geophys. Res. Lett. 46, 1320–4329.
Jeon, M., Iriarte, J. L., Yang, E. J., Kang, S.-H., Lee, Y., Joo, H. M., et al. (2021). Phytoplankton succession during a massive coastal diatom bloom at Marian Cove, King George Island, Antarctica. Polar Biol. 44, 1993–2010. doi: 10.1007/s00300-021-02933-1
Kang, J.-S., Kang, S.-H., Lee, J. H., and Lee, S. (2002). Seasonal variation of microalgal assemblages at a fixed station in King George Island, Antarctica, 1996. Mar. Ecol. Prog. Ser. 229, 19–32. doi: 10.3354/meps229019
Kang, S.-H., Kang, J.-S., Chung, K.-H., Lee, M.-Y., Lee, B.-Y., Chung, H., et al. (1997). Seasonal variation of nearshore antarctic microalgae and environmental factors in Marian Cove, King George Island, 1996. KOREAN J. Polar Res. 8, 9–27.
Kavanaugh, M. T., Abdala, F. N., Ducklow, H., Glover, D., Fraser, W., Martinson, D., et al. (2015). Effect of continental shelf canyons on phytoplankton biomass and community composition along the western Antarctic Peninsula. Mar. Ecol. Prog. Ser. 524, 11–26. doi: 10.3354/meps11189
Kim, B. K., Joo, H. M., Jung, J., Lee, B., and Ha, S.-Y. (2020). In situ rates of carbon and nitrogen uptake by phytoplankton and the contribution of icophytoplankton in Kongsfjorden, Svalbard. Water 12:2903. doi: 10.3390/w12102903
Kim, H., Ducklow, H. W., Abele, D., Barlett, E. M., Buma, A. G. J., Meredith, M. P., et al. (2018). Inter-decadal variability of phytoplankton biomass along the coastal West Antarctic Peninsula. Phil. Trans. R. Soc. A 376:20170174. doi: 10.1098/rsta.2017.0174
Kim, I., Kim, G., and Choy, E. J. (2015). The significant inputs of trace elements and rare earth elements from melting glaciers in Antarctic coastal waters. Polar Res. 34:24289. doi: 10.3402/polar.v34.24289
Kim, S., Kim, J.-H., Lim, J.-H., Jeong, J.-H., Heo, J.-M., and Kim, I.-N. (2020). Distribution and control of bacterial community composition in Marian Cove Surface Waters, King George Island, Antarctica during the Summer of 2018. Microorganisms 8:1115. doi: 10.3390/microorganisms8081115
Kirk, J. T. O. (1994). Light and Photosynthesis in Aquatic Ecosystems. Cambridge: Cambridge University Press, 509.
Klais, R., Norros, V., Lehtinen, S., Tamminen, T., and Olli, K. (2016). Community assembly and drivers of phytoplankton functional structure. Funct. Ecol. 31, 760–767. doi: 10.1111/1365-2435.12784
Lee, J., Jin, Y. K., Hong, J. K., Yoo, H. J., and Shon, H. (2008). Simulation of a tidewater glacier evolution in Marian Cove, King George Island, Antarctica. Geosci. J. 12, 33–39.
Lee, S. H., Joo, H. M., Joo, H., Kim, B. K., Song, H. J., Jeon, M., et al. (2015). Large contribution of small phytoplankton at Marian Cove, King George Island, Antarctica, based on long-term monitoring from 1996 to 2008. Polar Biol. 38, 207–220.
Llanillo, P. J., Aiken, C. M., Cordero, R. R., Damiani, A., Sepúlveda, E., and Fernández-Gómez, B. (2019). Oceanographic variability induced by tides, the intraseasonal cycle and warm subsurface water intrusions in Maxwell Bay, King George Island (West-Antarctica). Sci. Rep. 9:18571. doi: 10.1038/s41598-019-54875-8
Mangoni, O., Saggiomo, M., Bolinesi, F., Casterllano, M., Povero, P., Saggiomo, V., et al. (2019). Phaeocystis antarctica unusual summer bloom in stratified antarctic coastalwaters (Terra Nova Bay, Ross Sea). Mar. Environ. Res. 151:104733. doi: 10.1016/j.marenvres.2019.05.012
Marshall, G. J., Orr, A., van Lipzig, N. P. M., and King, J. C. (2006). The impact of a changing southern hemisphere annular mode on Antarctic Peninsula summer temperatures. J. Clim. 19, 5388–5404. doi: 10.1175/jcli3844.1
Martinson, D. G., Stammerjohn, S. E., Iannuzzi, R. A., Smith, R. C., and Vernet, M. (2008). Western Antarctic Peninsula physical oceanography and spatio–temporal variability. Deep Sea Res. Part II Top. Stud. Oceanogr. 55, 18–19.
Mengesha, S., Dehairs, F., Fiala, M., Elskens, M., and Goeyens, L. (1998). Seasonal variation of phytoplankton community structure and nitrogen uptake regime in the Indian Sector of the Southern Ocean. Polar Biol. 20, 259–272.
Meredith, M. P., and King, J. C. (2005). Rapid climate change in the ocean west of the Antarctic Peninsula during the second half of the 20th century. Geophys. Res. Lett. 32:L19604. doi: 10.1029/2005GL024042
Mitchell, B. G., and Holm-Hansen, O. (1991). Observations of modeling of the Antartic phytoplankton crop in relation to mixing depth. Deep Sea Res. Part A 38, 981–1007.
Moline, M. A., Claustre, H., Frazer, T. K., Schofield, O., and Vernet, M. (2004). Alteration of the food web along the Antarctic Peninsula in response to a regional warming trend. Glob. Change Biol. 10, 1973–1980.
Montes-Hugo, M., Doney, S. C., Ducklow, H. W., Fraser, W., Martinson, D., Stammerjohn, S. E., et al. (2009). Recent changes in phytoplankton communities associated with rapid regional climate change along the western Antarctic Peninsula. Science 323, 1470–1473. doi: 10.1126/science.1164533
Moon, H.-W., Wan Hussin, W. M. R., Kim, H.-C., and Ahn, I.-Y. (2015). The impacts of climate change on Antarctic nearshore mega-epifaunal benthic assemblages in a glacial fjord on King George Island: responses and implications. Ecol. Indic. 57, 280–292.
Oliva, M., Navarro, F., Hrbáček, F., Hernández, A., Nývlt, D., Pereira, P., et al. (2017). Recent regional climate cooling on the Antarctic Peninsula and associated impacts on the cryosphere. Sci. Total Environ. 580, 210–223. doi: 10.1016/j.scitotenv.2016.12.030
Park, B. K., Chang, S. K., Yoon, H. I., and Chung, H. (1998). Recent retreat of ice cliffs, King George Island, South Shetland Islands, Antarctic Peninsula. Ann. Glaciol. 27, 633–635. doi: 10.3189/1998aog27-1-633-635
Park, S. J., Choi, T. J., and Kim, S. J. (2013). Heat flux variations over sea ice observed at the coastal area of the Sejong Station, Antarctica. Asia Pac. J. Atmos. Sci. 49, 443–450. doi: 10.1007/s13143-013-0040-z
Parsons, T. R., Maita, Y., and Lalli, C. M. (1984). A Manual of Chemical and Biological Methods for Seawater Analysis. Oxford: Pergamon Press, 173.
Pauly, D., and Christensen, V. (1995). Primary production required to sustain global fisheries. Nature 374, 255–257. doi: 10.1038/374255a0
Prézelin, B. B., Hofmann, E. E., Mengelt, C., and Klinck, J. M. (2000). The linkage between Upper Circumpolar Deep Water (UCDW) and phytoplankton assemblages on the west Antarctic Peninsula continental shelf. J. Mar. Res. 58, 165–202. doi: 10.1357/002224000321511133
Rignot, E., Jacobs, S., Mouginot, J., and Scheuchl, B. (2013). Ice-shelf melting around Antarctica. Science 341, 266–270. doi: 10.1126/science.1235798
Roselli, L., Litchman, E., Stanca, E., Cozzoli, F., and Basset, A. (2017). Individual trait variation in phytoplankton communities across multiple spatial scales. J. Plankton Res. 39, 577–588. doi: 10.1093/plankt/fbx001
Rozema, P. D., Kulk, G., Veldhuis, M. P., Buma, A. G. J., Meredith, M. P., and van de Poll, W. H. (2017). Assessing drivers of coastal primary production in Northern Marguerite Bay. Antarct. Front. Mar. Sci. 4:184. doi: 10.3389/fmars.2017.00184
Rückamp, M., Braun, M., Suckro, S., and Blindow, N. (2011). Observed glacial changes on the King George Island ice cap, Antarctica, in the last decade. Glob. Planet Change 79, 99–109. doi: 10.1016/j.gloplacha.2011.06.009
Saba, G. K., Fraser, W. R., Saba, V. S., Iannuzzi, R. A., Coleman, K. E., Doney, S. C., et al. (2014). Winter and spring controls on the summer food web of the coastal West Antarctic Peninsula. Nat. Commun. 5:4318. doi: 10.1038/ncomms5318
Sañudo-Wilhelmy, S. A., Olsen, K. A., Scelfo, J. M., Foster, T. D., and Flegal, A. R. (2002). Trace metal distributions off the Antarctic Peninsula in the Weddell Sea. Mar. Chem. 77, 157–170. doi: 10.1016/s0304-4203(01)00084-6
Schloss, I. R., Ferreyra, G. A., and Ruiz-Pino, D. (2002). Phytoplankton biomass in Antarctic shelf zones: a conceptual model based on Potter Cove, King George Island. J. Mar. Syst. 36, 129–143. doi: 10.1016/s0924-7963(02)00183-5
Schloss, I. R., Wasilowska, A., Dumont, D., Almandoz, G. O., Hernando, M. P., Michaud-Tremblay, C.-A., et al. (2014). On the phytoplankton bloom in coastal waters of southern King George Island (Antarctica) in January 2010: an exceptional feature? Limnol. Oceanogr. 59, 195–210. doi: 10.4319/lo.2014.59.1.0195
Serret, P., Fernández, E., Anadón, R., and Varela, M. (2001). Trophic control of biogenic carbon export in Bransfield and Gerlache Straits, Antarctica. J. Plankton Res. 23, 1345–1360.
Stammerjohn, S. E., Martinson, D. G., Smith, R. C., Yuan, X., and Rind, D. (2008). Trends in Antarctic annual sea ice retreat and advance and their relation to El Niño–Southern Oscillation and Southern Annular Mode variability. J. Geophys. Res. Oceans 113:C3. doi: 10.1029/2007JC004269
Turner, J., Colwell, S. R., Marshall, G. J., Lachlan-Cope, T. A., Carleton, A. M., Jones, P. D., et al. (2005). Antarctic climate change during the last 50 years. Int. J. Climatol. 25, 279–294.
Turner, J., Guarino, M. V., Arnatt, J., Jena, B., Marshall, G. J., Philips, T., et al. (2020). Recent Decrease of summer sea ice in the Weddell Sea, Antarctica. Geophys. Res. Lett. 47:e2020GL087127.
Turner, J., Hosking, J. S., Phillips, T., and Marshall, G. J. (2013). Temporal and spatial evolution of the Antarctic sea ice prior to the September 2012 record maximum extent. Geophys. Res. Lett. 40, 5894–5898. doi: 10.1002/2013gl058371
Vaughan, D. G., Marshall, G. J., Connolley, W. M., Parkinson, C., Mulvaney, R., Hodgson, D. A., et al. (2003). Recent rapid regional climate warming on the Antarctic Peninsula. Clim. Change 60, 243–274.
Vernet, M., Kozlowski, W. A., Yarmey, L. R., Lowe, A. T., Ross, R. M., Quetin, L. B., et al. (2012). Primary production throughout austral fall, during a time of decreasing daylength in the western Antarctic Peninsula. Mar. Ecol. Prog. Ser. 452, 45–61.
Vernet, M., Martinson, D., Iannuzzi, R., Stammerjohn, S., Kozlowski, W., Sines, K., et al. (2008). Primary production within the sea-ice zone west of the Antarctic Peninsula: I—Sea ice, summer mixed layer, and irradiance. Deep. Res. Part II Top. Stud. Oceanogr. 55, 2068–2085.
Weber, T. S., and Deutsch, C. (2010). Ocean nutrient ratios governed by plankton biogeography. Nature 467, 550–554. doi: 10.1038/nature09403
Yang, J. S. (1990). Nutrients, Chlorophyll-a and primary productivity in Maxwell Bay, King George Island, Antarctica. KOREAN J. Polar Res. 1, 11–18.
Yoo, K.-C., Lee, M. K., Yoon, H. I., Lee, Y. I., and Kang, C. Y. (2015). Hydrography of Marian Cove, King George Island, West Antarctica: implications for ice-proximal sedimentation during summer. Antarct. Sci. 27, 185–196. doi: 10.1017/s095410201400056x
Yoo, K.-C., Yoon, H. I., Oh, J.-K., Kang, C. Y., Kim, Y., and Bae, S.-H. (2003). Wind- and rain-induced variations of water column structures and dispersal pattern of suspended particulate matter (SPM) in Marian Cove, the South Shetland Islands, West Antarctica during the austral summer 2000. Sea 8, 357–368. [Korean],
Yoo, K.-C., Yoon, H. I., Oh, J.-K., Kim, Y., and Kang, C. Y. (1999). Water column properties and dispersal pattern of suspended particulate matter (SPM) of Marian Cove during austral summer, King George Island, West Antarctica. Sea 4, 266–274. [Korean],
Keywords: phytoplankton, carbon uptake rate, stable isotope, Marian Cove, Antarctica
Citation: Kim BK, Jeon M, Joo HM, Kim T-W, Park S-J, Park J and Ha S-Y (2021) Impact of Freshwater Discharge on the Carbon Uptake Rate of Phytoplankton During Summer (January–February 2019) in Marian Cove, King George Island, Antarctica. Front. Mar. Sci. 8:725173. doi: 10.3389/fmars.2021.725173
Received: 15 June 2021; Accepted: 28 October 2021;
Published: 24 November 2021.
Edited by:
Il-Nam Kim, Incheon National University, South KoreaReviewed by:
Babula Jena, National Centre for Polar and Ocean Research (NCPOR), IndiaKarsten Lettmann, University of Oldenburg, Germany
Copyright © 2021 Kim, Jeon, Joo, Kim, Park, Park and Ha. This is an open-access article distributed under the terms of the Creative Commons Attribution License (CC BY). The use, distribution or reproduction in other forums is permitted, provided the original author(s) and the copyright owner(s) are credited and that the original publication in this journal is cited, in accordance with accepted academic practice. No use, distribution or reproduction is permitted which does not comply with these terms.
*Correspondence: Sun-Yong Ha, c3loYUBrb3ByaS5yZS5rcg==