 Candice B. Untiedt
 Alan Williams
 Franziska Althaus
 Phil Alderslade
 Malcolm R. Clark
- 1CSIRO Coasts and Oceans Research, Hobart, TAS, Australia
- 2School of Natural Sciences, University of Tasmania, Hobart, TAS, Australia
- 3National Institute of Water and Atmospheric Research, Ltd. (NIWA), Wellington, New Zealand
An increased reliance on imagery as the source of biodiversity data from the deep sea has stimulated many recent advances in image annotation and data management. The form of image-derived data is determined by the way faunal units are classified and should align with the needs of the ecological study to which it is applied. Some applications may require only low-resolution biodiversity data, which is easier and cheaper to generate, whereas others will require well-resolved biodiversity measures, which require a larger investment in annotation methods. We assessed these trade-offs using a dataset of 5 939 images and physical collections of black and octocorals taken during surveys from a seamount area in the southwest Pacific Ocean. Coral diversity was greatly underestimated in images: only 55 black and octocoral ‘phototaxa’ (best-possible identifications) were consistently distinguishable out of a known 210 species in the region (26%). Patterns of assemblage composition were compared between the phototaxa and a standardized Australian classification scheme (“CATAMI”) that uses morphotypes to classify taxa. Results were similar in many respects, but the identities of dominant, and detection of rare but locally abundant, coral entities were achieved only when annotation was at phototaxon resolution, and when faunal densities were recorded. A case study of data from 4 seamounts compared three additional classification schemes. Only the two with highest resolution – phototaxon and a combined phototaxon-morphological scheme – were able to distinguish black and octocoral communities on unimpacted vs. impacted seamounts. We conclude that image annotation schemes need to be fit-for-purpose. Morphological schemes such as CATAMI may perform well and are most easily standardized for cross-study data sharing, but high resolution (and more costly) annotation schemes are likely necessary for some ecological and management-based applications including biodiversity inventory, change detection (monitoring) – and to develop automated annotation using machine learning.
Introduction
There is an increasing use of benthic image-based surveys in the deep sea due to the ethical concerns of using extractive sampling, like trawling, in sensitive habitats and the ability of image-based surveys to sample larger areas and collect both qualitative and quantitative data (Althaus et al., 2015; Bicknell et al., 2016; Bowden and Jones, 2016; Durden et al., 2016; Howell et al., 2019; Long et al., 2020). Advancements in camera technology and imaging platforms have also facilitated the acquisition of higher quality imagery, enabling more accurate species identification (Durden et al., 2016; Schoening et al., 2016; Clark et al., 2019). There are a variety of deep sea studies using benthic imagery and encompassing a broad range of objectives including biodiversity assessments (Thresher et al., 2014; Auscavitch et al., 2020; Lapointe et al., 2020; Salinas-de-León et al., 2020), identification of vulnerable marine ecosystems (VME) (FAO, 2009; Jones and Lockhart, 2011; Dautova et al., 2019; Baco et al., 2020; Williams et al., 2020a), marine protected area (MPA) planning (Davies et al., 2017) and monitoring and recovery studies related to activities such as fishing (Althaus et al., 2009; Clark et al., 2019; Baco et al., 2020; Williams et al., 2020b) and potential seabed mining (Boschen-Rose et al., 2021).
The achievable taxonomic resolution of benthic fauna identifications from deep sea imagery is governed by several factors including the taxonomic knowledge of the region, sampling design (i.e., targeted sampling), choice of imaging platform (ROV, AUV, towed camera) as well as imaging technology (e.g., optics, lighting) and quality aspects (e.g., turbidity, altitude) (Bowden and Jones, 2016; Durden et al., 2016; Schoening et al., 2016; Davies et al., 2017; Howell et al., 2019; Horton et al., 2021). The requirements for taxonomic resolution differ depending on the specific objectives of the study. High resolution taxonomic information is required for biodiversity studies reliant on species identifications (Auscavitch et al., 2020; Lapointe et al., 2020; Salinas-de-León et al., 2020). Multivariate analyses of community structure or bioregional studies are not as reliant on species level data, because data are commonly combined over several taxa or aggregated to higher taxonomic levels (Williams et al., 2010; Tanner et al., 2018; Clark et al., 2019). Similarly, MPA planning and monitoring studies may require a lower resolution of faunal data based on vulnerable marine ecosystem (VME) indicator taxa or groups composed of multiple species (Jones and Lockhart, 2011; Davies et al., 2017; Morato et al., 2018; Dautova et al., 2019; Baco et al., 2020; Du Preez et al., 2020; Long et al., 2020).
Using benthic imagery rather than specimen collections has the drawback that accurate identification of fauna is challenging (Durden et al., 2016; Howell et al., 2019; Horton et al., 2021). This has led to the development of other taxonomic and morphological based classification schemes for the identification and annotation of marine fauna from imagery. Most studies use a set of region-specific phototaxa/morphospecies termed operational taxonomic units (OTUs) that are usually identified based on a combination of taxonomic knowledge and appearance including morphology and/or color; these are considered a proxy for species (Bewley et al., 2015; Howell et al., 2019; Auscavitch et al., 2020; Horton et al., 2021). This approach requires understanding and knowledge of the regional species pool, taxonomic and annotation expertise and is expensive (Williams et al., 2010; Schoening et al., 2016). These high-resolution classification schemes also suffer from a lack of standardization because individual research groups often apply their own naming, identification and documentation conventions, making it impossible to compare or combine data from multiple studies or regions (Bewley et al., 2015; Howell et al., 2019; Horton et al., 2021). Lower-resolution classification schemes that consider morphology, particularly with regards to ecological function and limited taxonomy (e.g., general benthic taxa – Althaus et al., 2015; sponges – Schoenberg in press) or high-level taxonomy only (VME indicator taxa – Parker et al., 2009; Morato et al., 2018) have the advantages of standardization and requiring less expertise, time and cost to implement, but lack high taxonomic resolution (Althaus et al., 2015). Decisions regarding the taxonomic resolution of benthic fauna identifications required from imagery and the classification schemes used during annotation represent a trade-off between standardization and resolution, which should be considered relative to study objectives. While several studies have investigated trade-offs between taxonomic resolution at different levels of the hierarchy (taxonomic sufficiency) (e.g., Tanner et al., 2018), few have compared the trade-offs between using phototaxon and morphological classification schemes to identify benthic fauna from deep sea imagery (Brind’Amour et al., 2014).
Habitat forming benthic fauna including stony corals, black and octocorals are among the most abundant and diverse components of deep-sea ecosystems (Jones and Lockhart, 2011; Althaus et al., 2017; Baco et al., 2020; Williams et al., 2020a). These groups represent important management units in the deep sea in the context of VME indicator taxa because they have biological characteristics (i.e., sessile, slow-growing, long-lived) and ecological traits (i.e., habitat engineers) that exacerbate the effects of impacts from activities such as fishing and mining (Parker et al., 2009; Clark et al., 2016; Morato et al., 2018; Du Preez et al., 2020; Long et al., 2020). The identification of many octocoral species is impossible from imagery due to a poor understanding of the species pool in many deep-sea regions and the fact that much of their taxonomy is based on the arrangement, size and shape of microscopic structures in their tissues (Howell et al., 2019; Long et al., 2020).
Australia’s deep sea octocoral species pool consists of 512 species (Althaus et al., 2017) but there is no database or reference guide for octocoral phototaxa from benthic imagery for any deep-sea region off Australia. The only standardized classification scheme that exists for this group is the Collaborative and Automated Tools for Analysis of Marine Imagery (CATAMI) morphology-based classification scheme for black and octocorals (Althaus et al., 2015). The CATAMI scheme comprises a hierarchy of standardized terms, each with a definition and unique Codes for Australian Aquatic Biota (CAAB) code, for annotating marine biota in imagery, based primarily on morphology, but combining coarse-level taxonomy (i.e., Phylum, Class). In the Phylum Cnidaria, corals are divided into two broad groups; “Stony corals” and “black and octocorals” (Althaus et al., 2015). Only the latter group is considered herein and represent more than one taxonomic order within the Anthozoa (i.e., Alcyonacea and Antipatharia). CATAMI was developed in 2013 through engagement with users and taxonomic experts with the aim of providing a standard set of morphological descriptors for image annotation. It has been applied in historical surveys of the Tasmanian seamounts region (Althaus et al., 2009; Thresher et al., 2014; Williams et al., 2015) as well as receiving uptake by several groups both nationally (e.g., Bewley et al., 2015; James et al., 2017) and internationally (e.g., Carlier et al., 2020; Pillay et al., 2021).
The “Tasmanian Seamounts” area, a region of continental slope south of Tasmania with some 130 small conical volcanic seamounts, has been a focus of studies that combined physical biodiversity sampling with camera surveys (Koslow et al., 2001; Althaus et al., 2009; Williams et al., 2010, 2015, 2020a,b; Thresher et al., 2014). Expert identification of collected specimens has facilitated an extensive knowledge of the region’s black and octocoral fauna (see Alderslade et al., 2014; Althaus et al., 2017). Our primary goal in this paper was to use this information to examine alternative classification strategies for image annotation and understand their strengths and weaknesses. There were three more specific aims: (1) to determine the lowest taxonomic resolution at which we could confidently and consistently identify black coral and octocoral taxa in in situ imagery (phototaxa); (2) to understand the strengths and weaknesses of alternative approaches through comparing the information content from this ‘best-possible’ phototaxa classification with approaches based on gross morphology; and (3) to examine the suitability and trade-offs of each approach in the context of a range of ecological and management-based applications including biodiversity inventory, detecting change (monitoring) and spatial management aiming to conserve vulnerable taxa.
Materials and Methods
Study Area and Data Collection
Benthic imagery and physical collections of corals were taken from the Tasmanian Seamounts region off the east and south coasts of Tasmania, Australia (Figure 1) during three surveys on Australia’s National Marine Facility vessels, two on the RV Southern Surveyor in 1997 (Koslow et al., 2001) and 2006/7 (Williams et al., 2010, 2015) and one on the RV Investigator (MNF, 2021) in 2018 (Williams et al., 2020a).
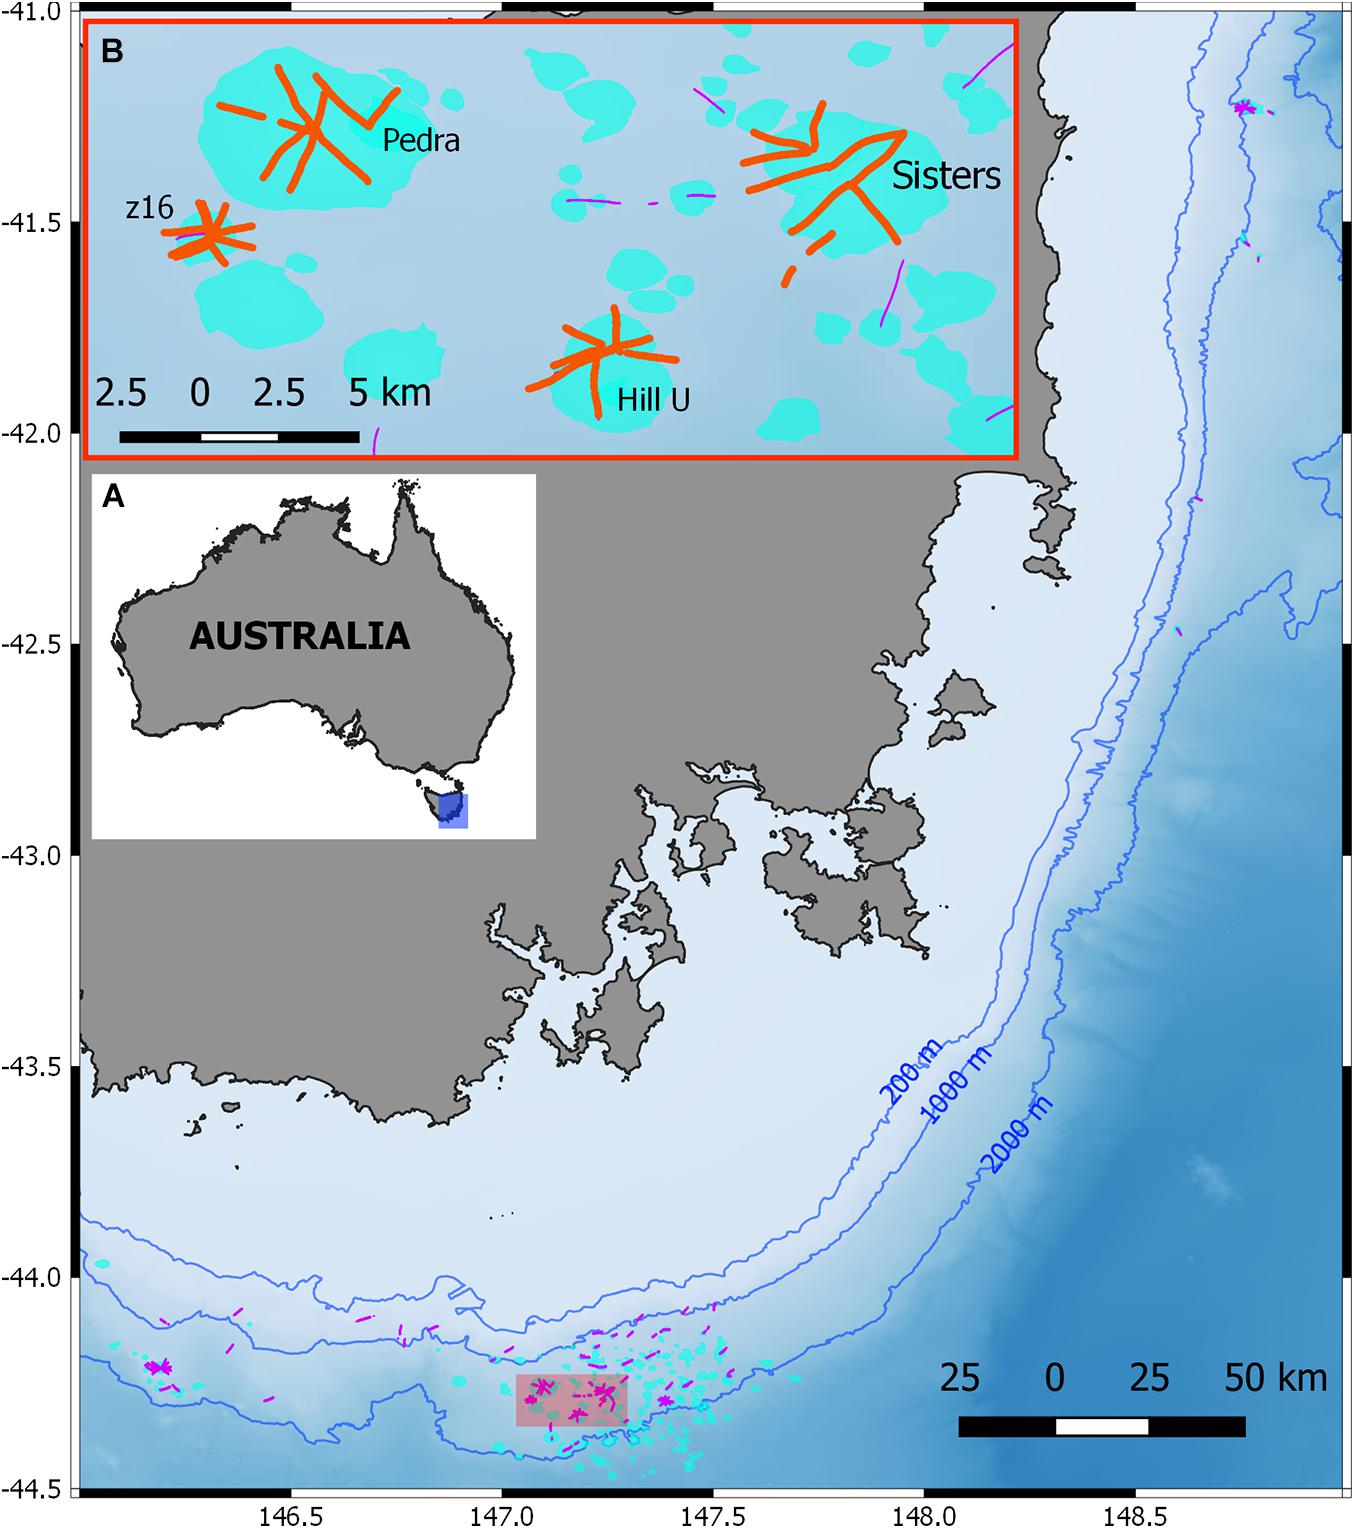
Figure 1. (A) Overview map of the Tasmanian seamounts region showing seamounts (light blue) and image transects (black lines). Background shading shows depth range, with major contours indicated. (B) Inset shows seamounts selected for the case study analysis showing image transects (orange lines) included in this dataset.
Specimens were collected using benthic sleds and beam trawls (Koslow et al., 2001; Williams et al., 2010, 2015; Supplementary Table 2) with many of the collections co-located with camera transects (e.g., Williams et al., 2015). At sea, the trawl catch was sorted to the best taxonomic resolution possible and each unique taxon photographed to record form and color. Detailed examination and identification of octocorals in the laboratory was conducted following protocols in Alderslade et al. (2014). The new records were integrated into the CSIRO held database of deep-sea black and octocorals (80–4000 m depth) from Australia (Althaus et al., 2017) and each unique taxon was assigned a numeric 8-digit Codes for Australian Aquatic Biota (CAAB) code that incorporates phylum, family and species information, and accommodates project-specific codes for new genera and species, some of which are awaiting formal description (Alderslade et al., 2014). Based on these data, a total of 210 species of black and octocorals have been recorded for the Tasmanian seamounts region (Alderslade et al., 2014; Althaus et al., 2017; unpublished data from survey IN2018_V06).
Imagery used in this analysis was taken on the 2018 voyage (Williams et al., 2020a) that used a towed camera system (Marouchos et al., 2017) to collect HD video and stereo stills along 113 transects on 40 different seamounts and 19 slope stations. A subsample of 10% of the stills were selected randomly for quantitative analysis (n = 5 939) (Foster et al., 2020). The imagery were aligned with geographical data and registered in the Video Annotation and Reference System (VARS), a data management and image annotation platform developed by the Monterey Bay Aquarium Research Institute (Schlining and Jacobsen Stout, 2006). Photogrammetric methods in the SeaGIS software (EventMeasure and TransectMeasure, SeaGIS, 2020) were used to project quadrats of an average of 7.02 m2 onto each selected image to enable densities of selected biota, including a coarse “black and octocorals” category to be annotated.
Black Coral and Octocoral Classification Schemes and Annotation
We applied two classification schemes to annotate and analyze the entire image set: (1) a taxonomic scheme for black and octocoral phototaxa (“Phototaxa 2018”), and (2) an independently developed morphological scheme: the Collaborative and Automated Tools for Analysis of Marine Imagery (“CATAMI”) (Althaus et al., 2015).
A phototaxon is herein defined as the lowest resolution taxonomic unit which can be confidently and consistently identified and annotated from imagery, this being analogous to the more commonly used terms “morphospecies” or “operational taxonomic units (OTUs)” (e.g., Howell et al., 2019). The suite of phototaxa was developed in a detailed cross-referencing of specimens of the 210 known species of black and octocorals collected from this region with 3 000+ images – the 2 075 images from 2018 selected for analysis, augmented by ∼1 000 additional images from this survey. Black coral and octocoral phototaxa were subject to a rigorous review and validation by annotators and taxonomic experts from CSIRO.
The CATAMI scheme comprises a set of standardized terms, each with a definition and unique CAAB identifier, for annotating marine biota in imagery, based primarily on morphology, but combining coarse-level taxonomy (i.e., Phylum, Class). However, groups of epibenthic invertebrates that have inherently plastic growth-forms such as sponges and corals are classified principally by morphology within the CATAMI scheme, which often results in inconsistent mapping between CATAMI classes and higher resolution taxonomy. In the Phylum Cnidaria, corals are divided into two broad groups: “stony corals” and “black and octocorals” as the two taxonomic Orders represented by the latter (i.e., Alcyonacea and Antipatharia) can easily be confused in imagery.
Applying the published CATAMI scheme in this study, we found it needed some refinement, expansion, and clarification in order to improve its usability and applicability, acknowledging that CATAMI classes are based on morphology from imagery and may not correspond with the taxonomic use of the morphological terms used. To accommodate the morphological forms encountered in our imagery, and to improve the overall clarity and usability of the scheme we added a “Flexible” sub-branch to the “Fan (2D)” branch, to provide an alternative to the “rigid” category in CATAMI, and differentiated the “Whip” branch into “simple” and “complex.” We also changed the parental relationship of the “Fleshy” branch, moving it from being a sub-branch of the “Branching (3D)” category to be a primary branch of the “black and octocorals” classification (Figure 2). In addition, we updated and clarified/tightened the descriptions of several CATAMI morphotypes (Table 1). Notwithstanding, some subjectivity is inherent because there are aspects of octocoral morphology, for example rigidity, that exist along a continuum and are difficult to define into discrete categories. Similar continua can be expected to be encountered in most groups of benthic animals and present challenges to evolving and implementing any standardized, image-based schemes.
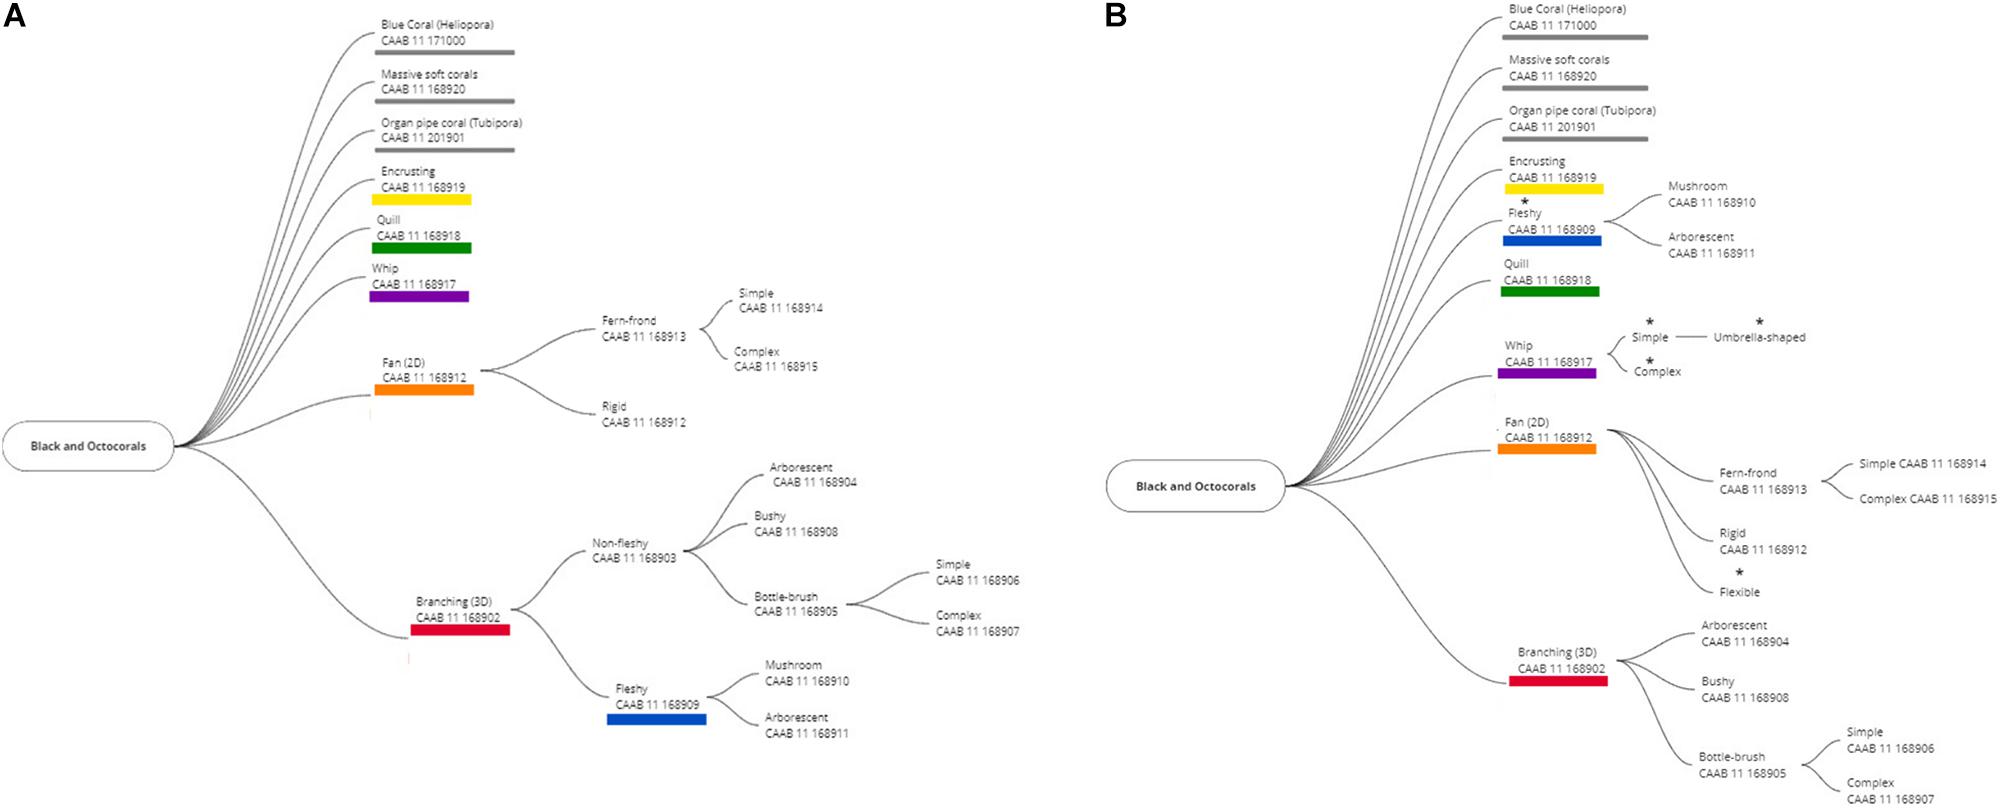
Figure 2. The original (A) and revised (B) CATAMI classification system for black and octocorals. *Indicates added groups and changed relationships. Primary branches, which are not colored have not been used in this study.
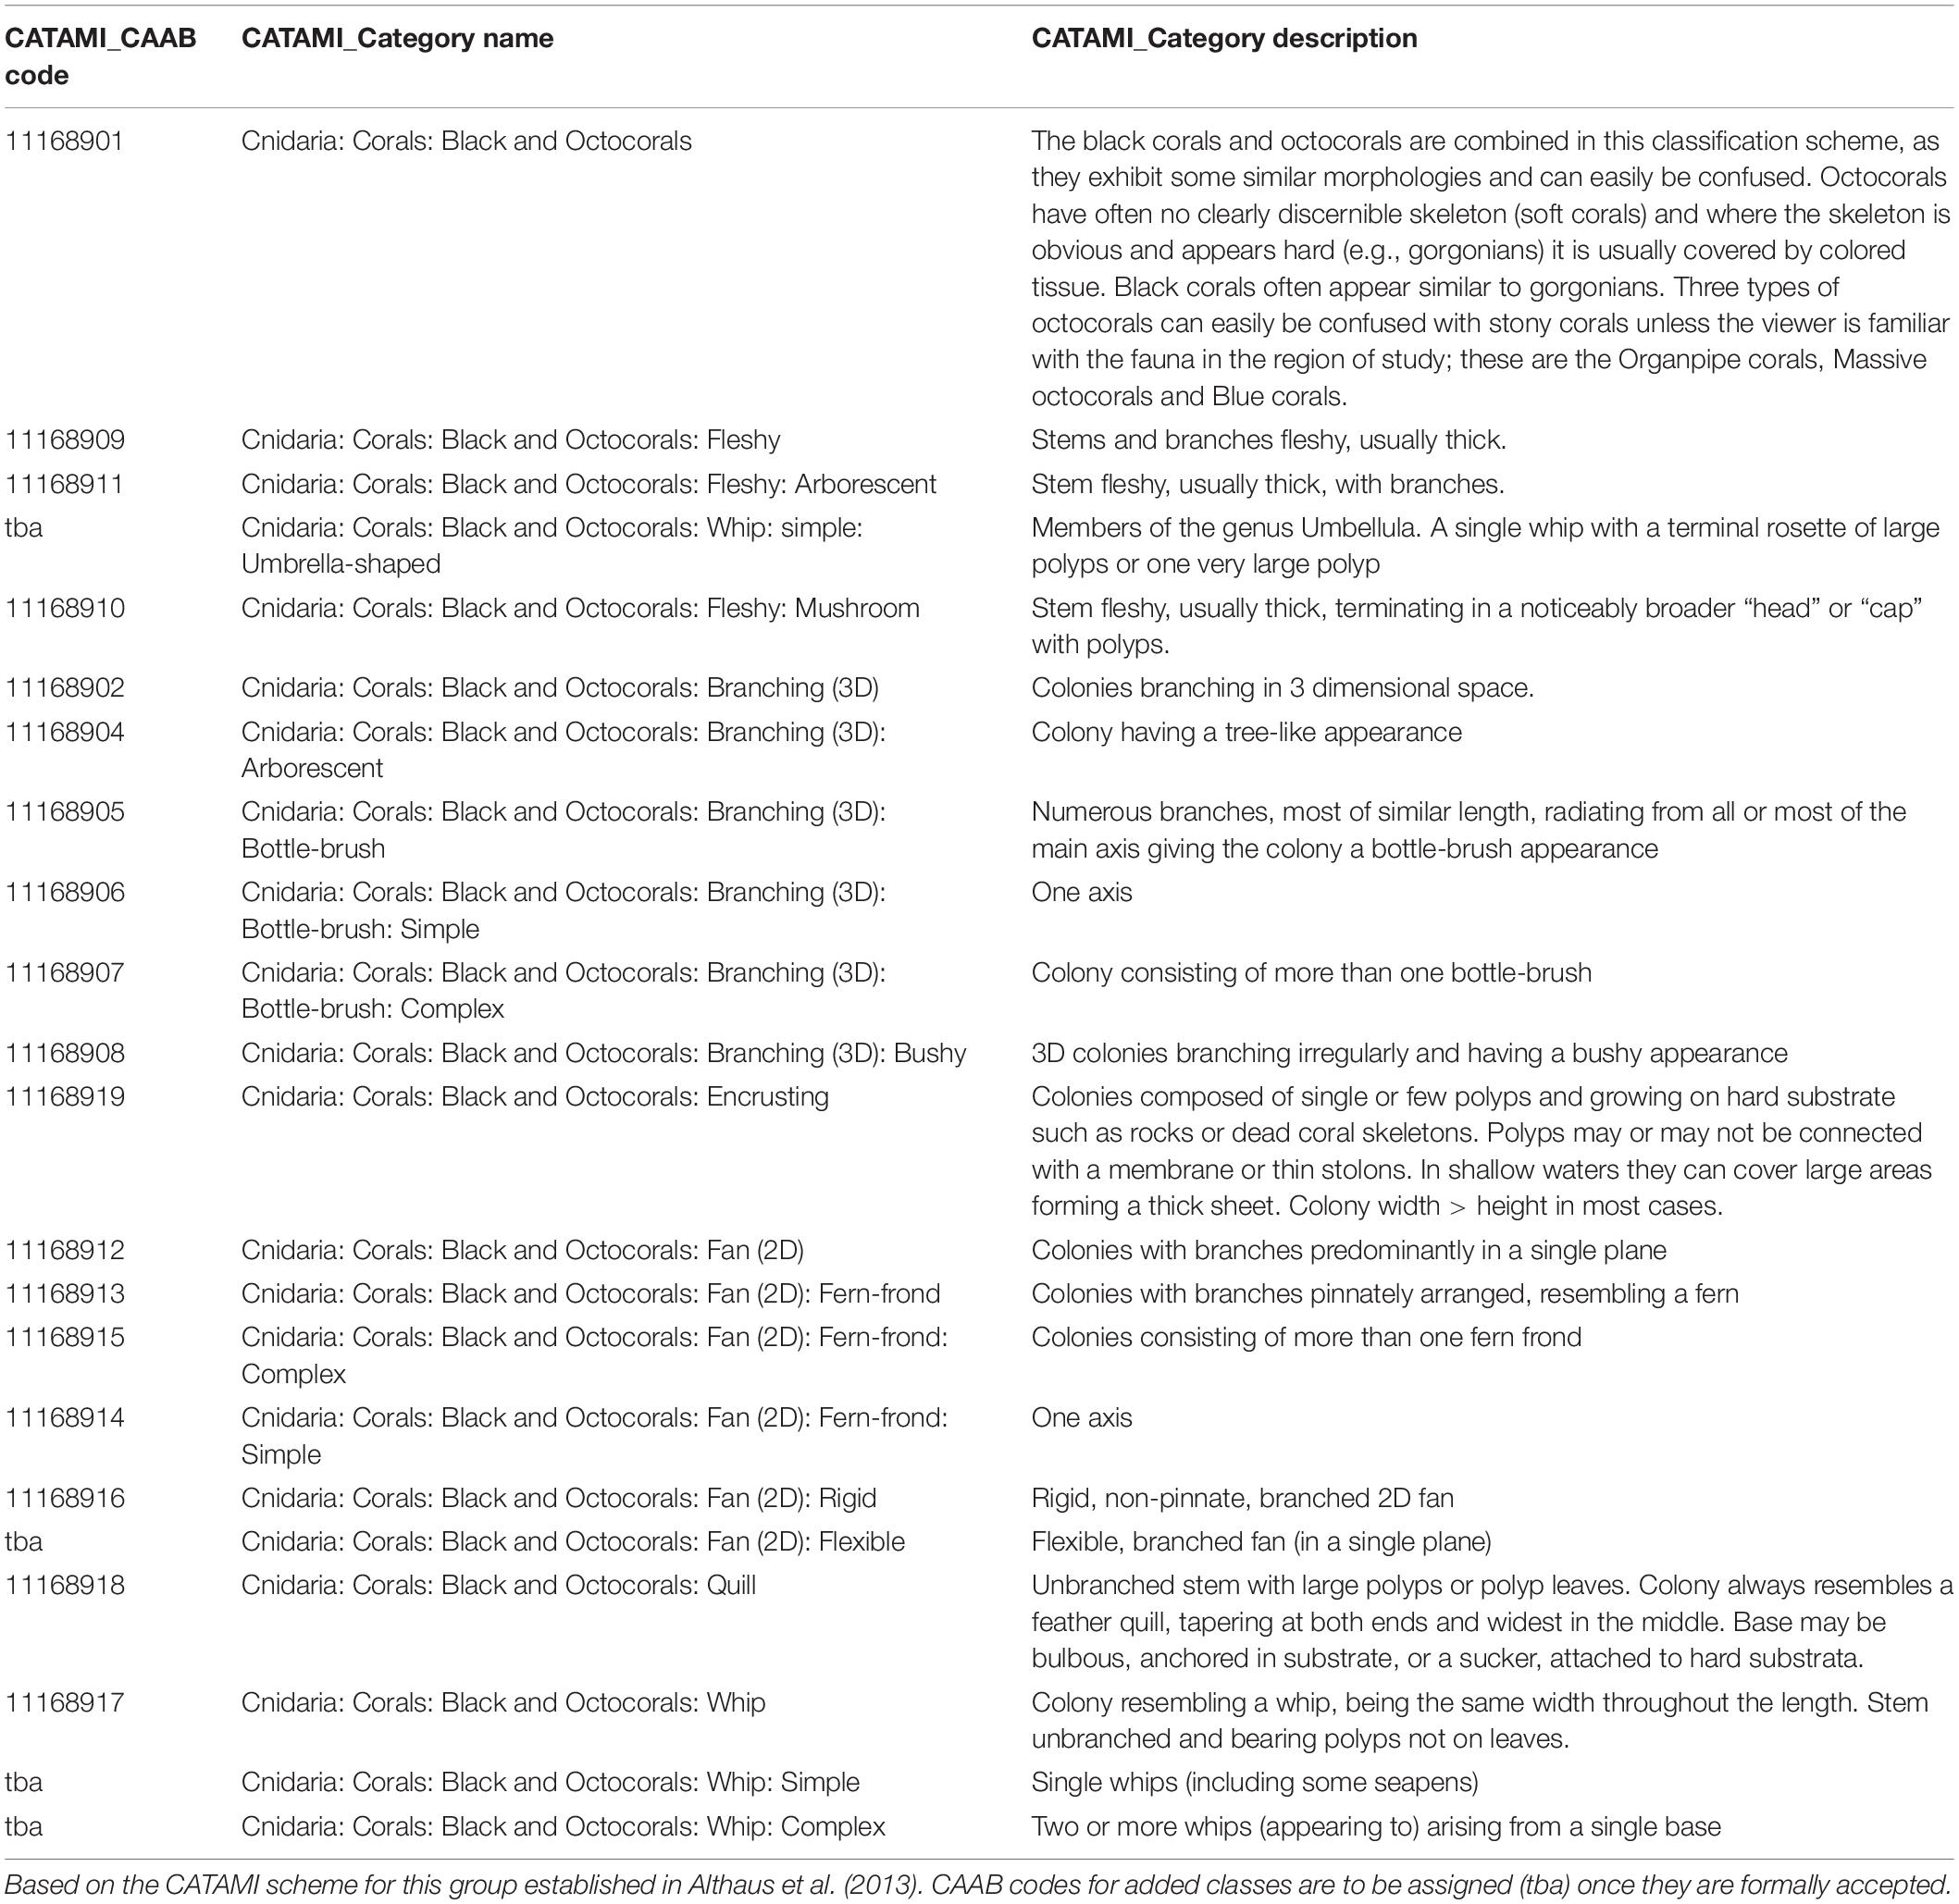
Table 1. Details of CATAMI categories used in the annotation of “black and octocorals” with updated and revised descriptions.
The phototaxa and CATAMI schemes were compared using summary statistics of annotation data across the entire data set. Three metrics were used: (1) occurrence – presence summed over all annotated images; (2) total density – area-standardized numerical abundance summed over all images; and (3) average density – area-standardized numerical abundance averaged over all images where the morphotype or phototaxon occurs.
Case Study
We compared black and octocoral diversity metrics and community composition patterns at four selected seamounts with known characteristics of biodiversity and trawling impact. Seamounts z16 and Hill U were determined to have the largest spatial extent of stony coral reef in the region (Williams et al., 2020a) and relatively low trawling impact. In contrast, Pedra and Sisters seamounts have sparse extent of coral reef cover and relatively heavy trawling impact (Williams et al., 2020b). These differing habitats and stony coral densities enable us to examine the ‘trade-offs’ and implications of using different classification schemes in varying settings. Trade-offs in this context are the balance between gaining improved information or insights from a more highly resolved annotation vs. the costs of establishing a highly resolved scheme. The phototaxa and CATAMI classification schemes (1 and 2 below) were compared to a less-developed phototaxonomy (3), a coarsely resolved resolution of VME taxa (4), and a scheme that combined the present phototaxa with CATAMI (5). Units of analysis in each case are referred to as coral “entities.”
1) “Phototaxa 2018” – taxonomic classification based on phototaxa established herein
2) “CATAMI” – morphological classification scheme based on Althaus et al. (2013) Althaus et al. (2015)
3) “Phototaxa 2007” – the historical taxonomic classification used in previous studies in this region between 2006 and 2008 and detailed in Althaus et al. (2009); Thresher et al. (2014); and Williams et al. (2015).
4) “Vulnerable Marine Ecosystem (VME) taxa” – coarse resolution, taxonomic-based scheme identifying groups detailed in Parker et al. (2009).
5) “CATAMI and Phototaxa 2018 combined” – the highest resolution data achieved through using a dual annotation method.
To acquire the data for schemes 3 and 4 we established a translation between our CATAMI and the Phototaxon 2018 combined data and the respective schemes (Table 2). For the VME scheme we used the groups: Antipatharia, Pennatulacea, Gorgonacea, and Alcyonacea. Here we consider Gorgonacea (Alcyonacea with a solid axis; i.e., Scleraxonia, Calcaxonia, and Holaxonia) as separate from other Alcyonacea (soft corals without a solid axis; herein referred to as “Alcyonacea excluding gorgonians”), because gorgonians have a different growth form than other Alcyonaceans and are treated as separate VME indicator taxa in the South Pacific Regional Fisheries Management Organisation (SPRFMO) region and many other RMFOs (Parker et al., 2009). For a small number of annotations we assigned a concatenated VME indicator group.
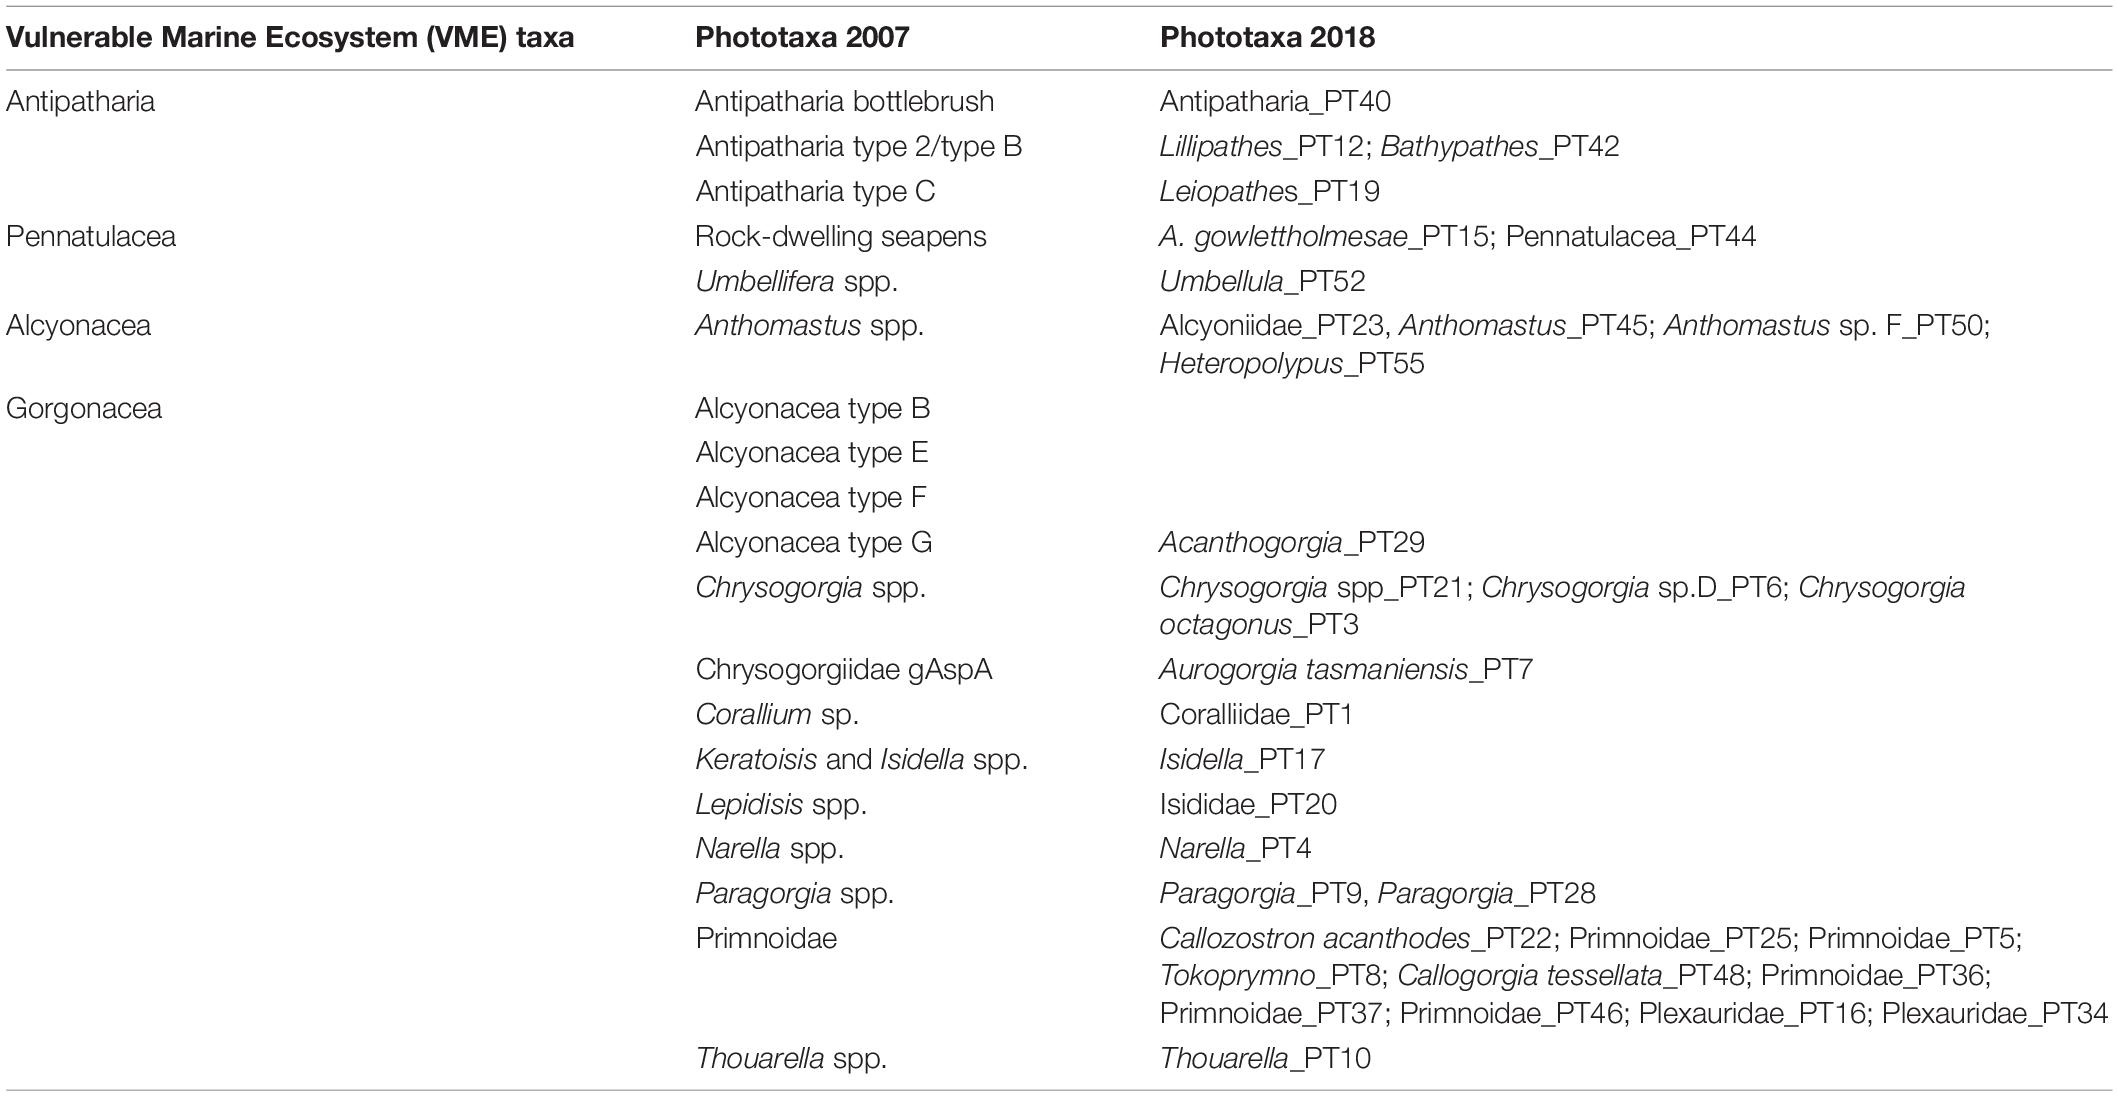
Table 2. VME indicator groups of phototaxa and a comparison between black coral and octocoral phototaxa (PT) previously established (Phototaxa 2007) and those established herein (Phototaxa 2018).
Separate data matrices of average density by transect were constructed for each of the five classification schemes. Shannon-Weiner’s diversity was computed for the selected seamounts for each classification scheme and ANOVA used to test for significant differences across seamount and classification scheme. For significant differences we performed a post hoc, multiple pair-wise Tukey test. Multivariate analyses using non-metric multidimensional scaling ordination (nMDS) of the Bray-Curtis dissimilarity between transects, based on 4th root transformed density data was carried out to compare the patterns obtained using the five classification schemes. We coded seamounts as either high or low impact and superimposed these a priori defined clusters onto the ordination of each classification scheme. A two-stage nMDS, based on Spearman’s rank correlation was performed to assess the concordance between patterns obtained from each of the five classification schemes. To identify the coral entities discriminating and contributing the most to average dissimilarity between impacted and unimpacted seamounts, SIMPER analyses was carried out.
Results
Refinements to Classification Schemes and Annotation
In total we enumerated 32 322 black corals and octocorals (n = 5 159 annotations) in a combined area of 35 301.84 m2 over 2 075 images. Only 42 annotations lacked a phototaxonomic identification because image quality was insufficient to confidently assign a phototaxon (0.008% of the total) and another 260 could not be identified beyond family or order (0.05% of the total) (Supplementary Table 2). The finest taxonomic resolution at which we could confidently and consistently identify black and octocorals was greatly improved with the Phototaxa 2018 approach, with the list of phototaxa expanded from 19 in 2007 to 55 in 2018 (Table 3 and Supplementary Figure 1). There was a 1:1 match between the earlier and current classifications in 10 cases, although taxonomic resolution was improved for most (Table 2). There was no match in three cases, because the taxonomic resolution and reference imagery was not sufficient to determine which current phototaxon would be a match to historical ones (Table 2).
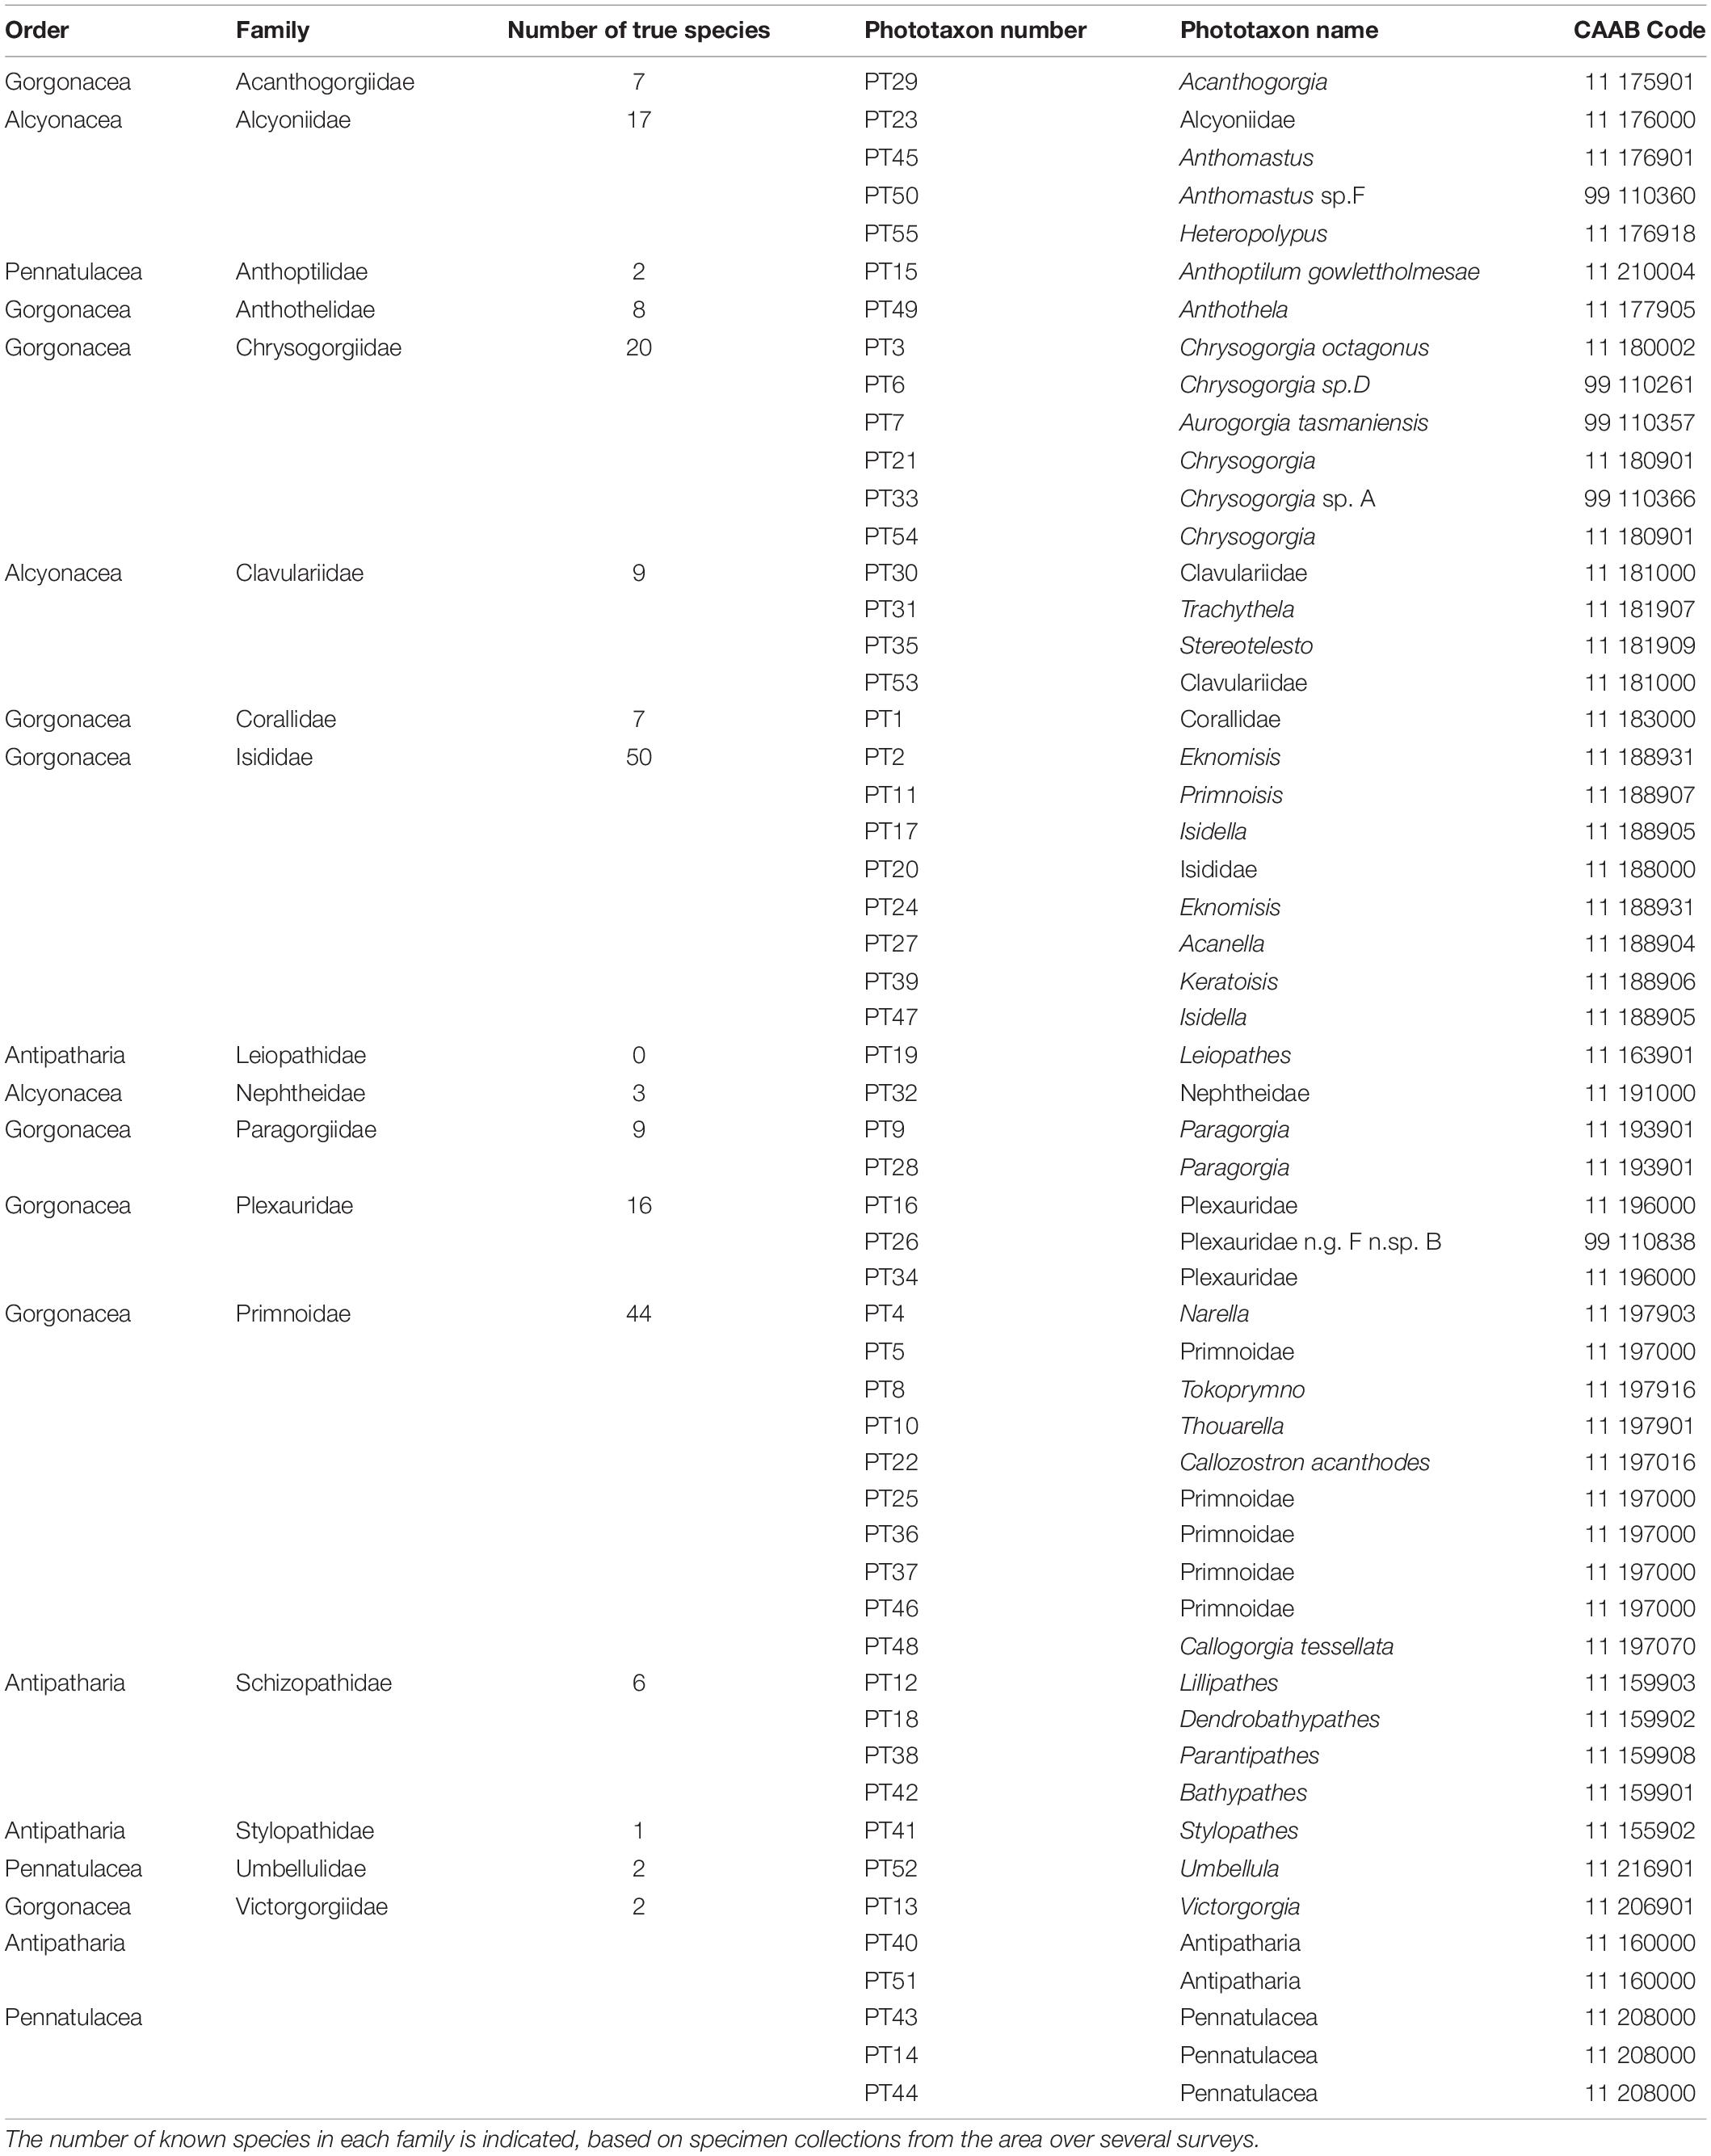
Table 3. Details of black and octocoral phototaxa (PT) scored from imagery.
Morphology was found to vary within a phototaxon based on three factors: ontogeny, environment and image angle and quality. For example, small, possibly juvenile specimens of the commonly occurring octocoral Thouarella sp. (phototaxon 10) appear as single bottlebrush colonies while more mature specimens form complex bottlebrush colonies (Figure 3A). Similarly, reproducing colonies of adult, mushroom shaped Alcyoniidae (phototaxon 23) have young colonies consisting of a single or few polyps, which grow on hard substrate and have been classified as encrusting in imagery acknowledging that this may not align with the taxonomic use of this term (Figure 3B).
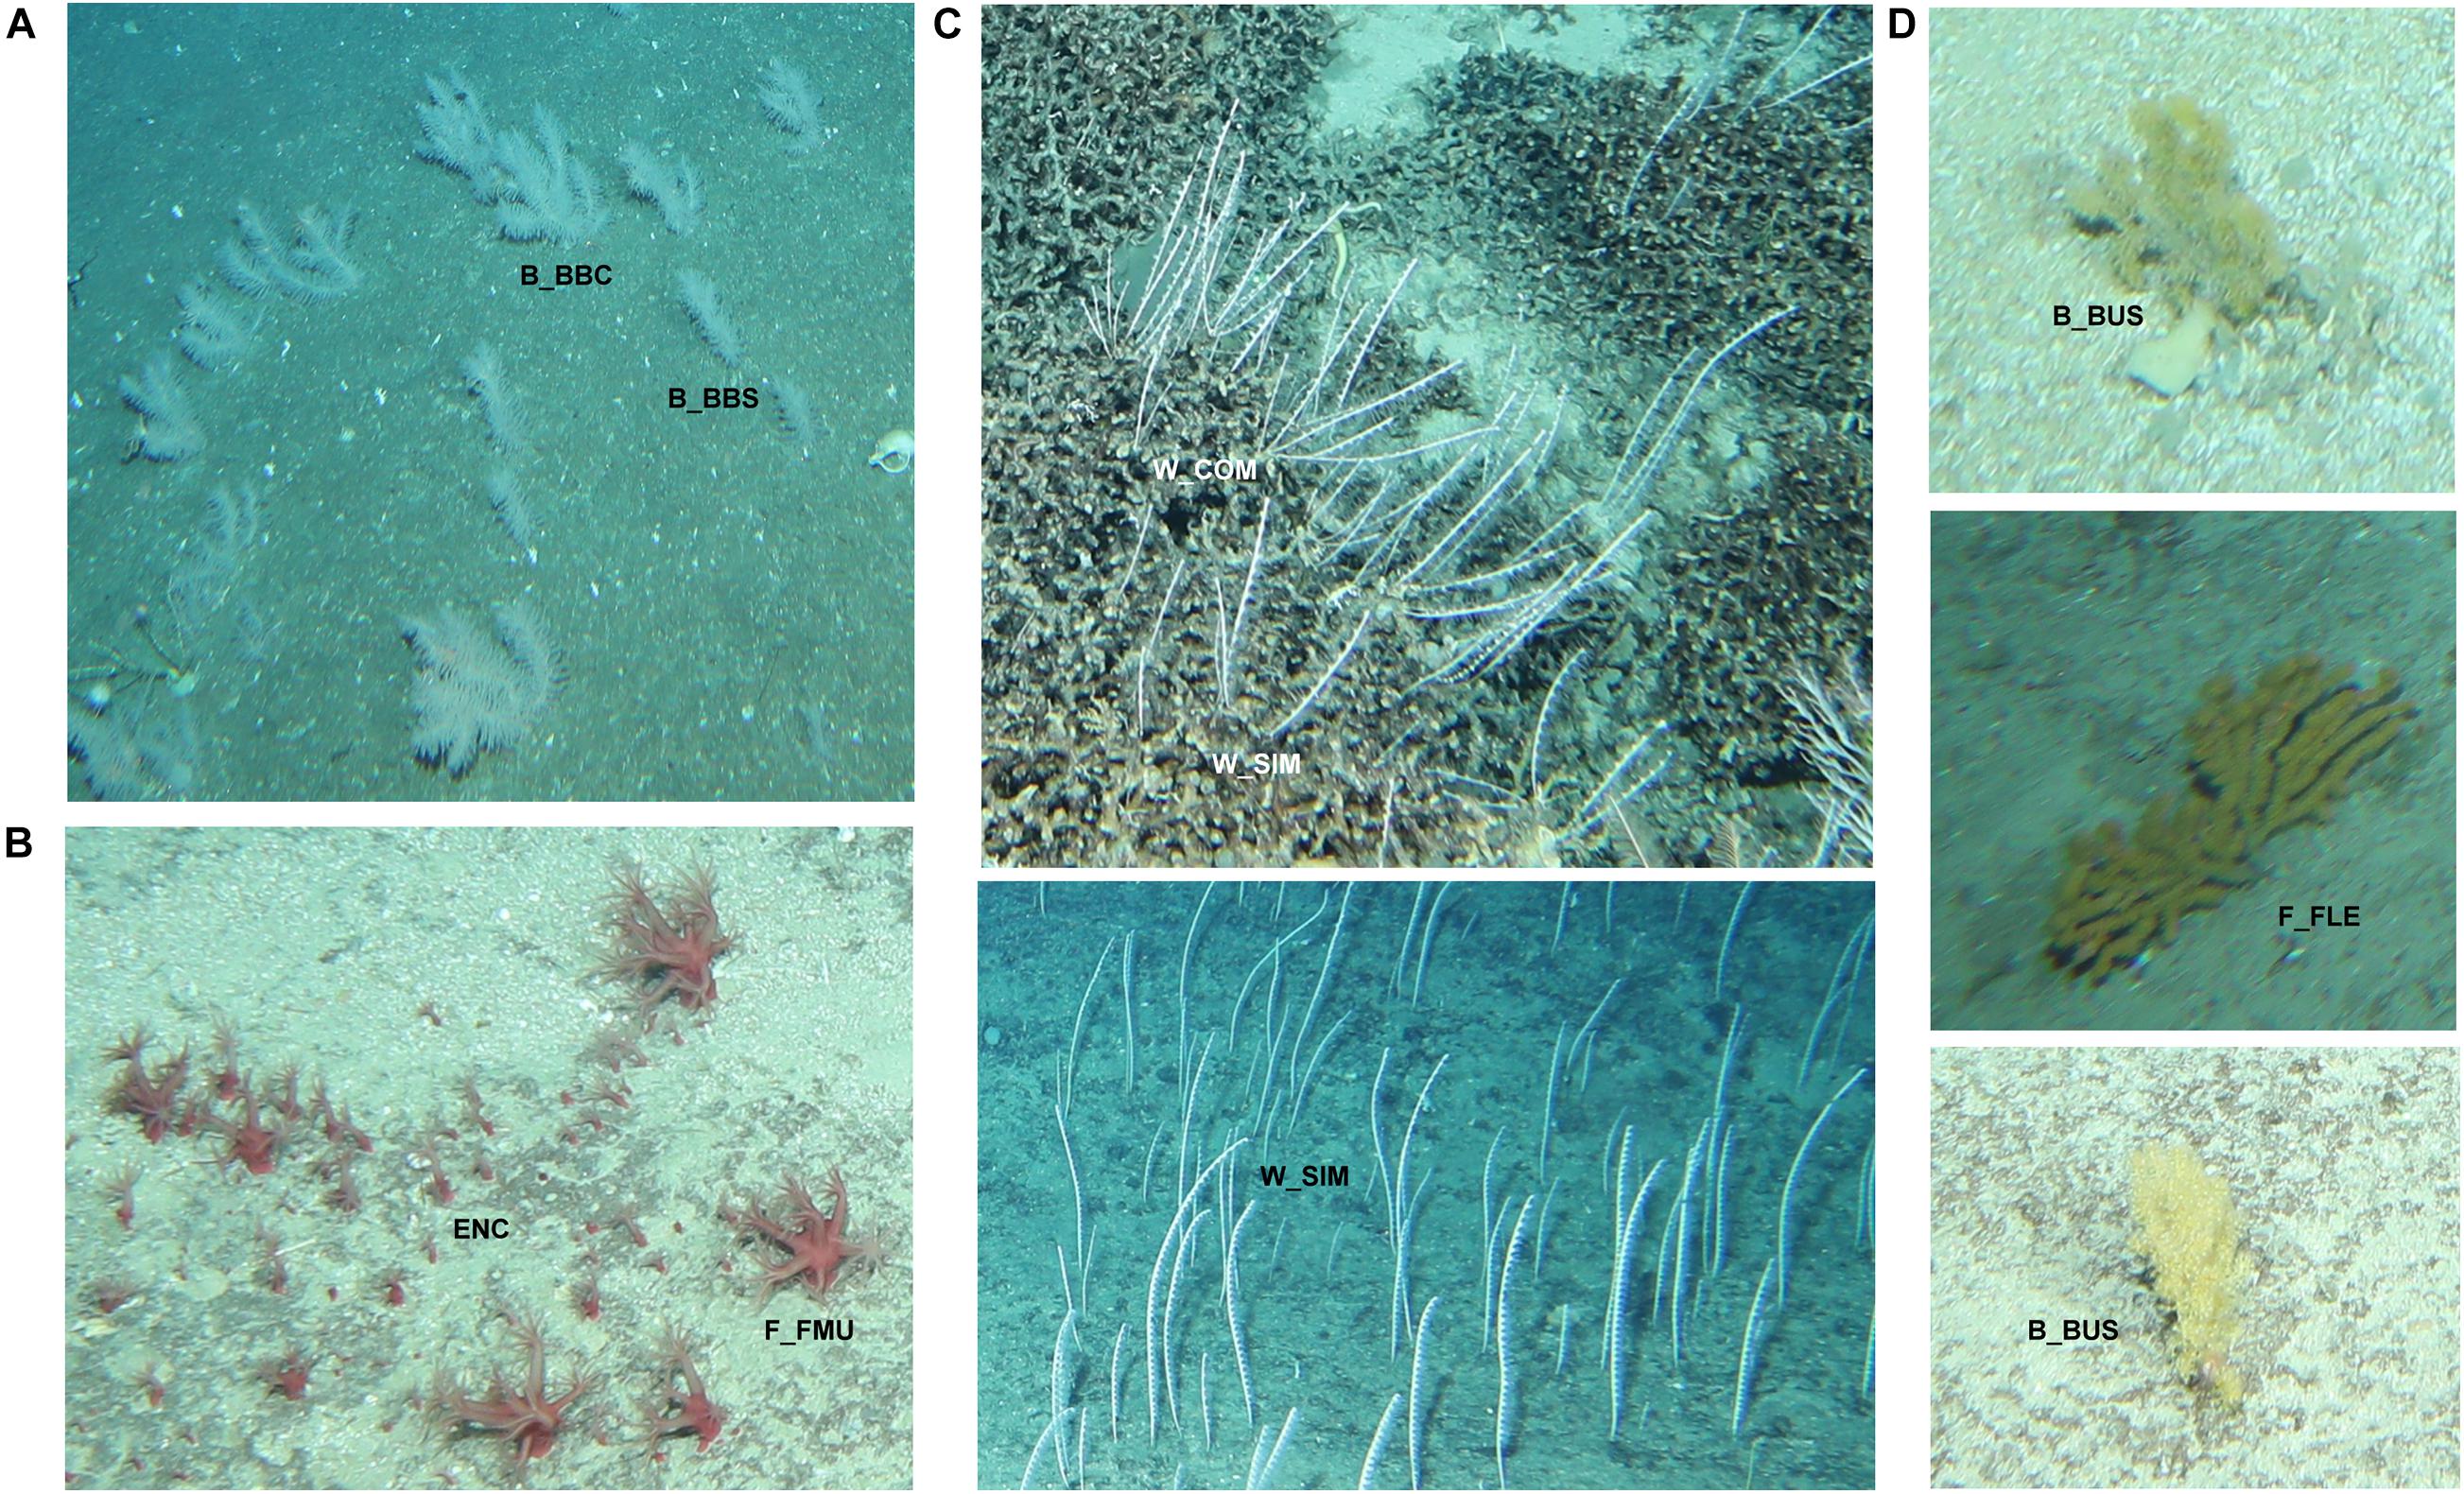
Figure 3. Morphological character variation of selected black and octocoral phototaxa. Ontogenetic variation in (A) Thouarella (phototaxon 10) (B) Alcyoniidae (phototaxon 23). Morphological variation due to environmental and image related factors in (C) Aurogorgia tasmaniensis (phototaxon 7), and (D) Acanthogorgia (phototaxon 29). B_BBC, Bottle-brush: complex; B_BBS, Bottle-brush: simple; ENC, encrusting; F_FMU, Fleshy: mushroom; W_COM, whip: complex; W_SIM, whip: simple; B_BUS, Branching (3D): Bushy; F_FLE, Fan(2D) flexible.
While colonies of Aurogorgia tasmaniensis (phototaxon 7) are clearly single whips when occurring on rocky substrates, they appear to be complex whips when growing on stony coral reef substrate (Figure 3C). Another example of apparent variable growth form due to image or environmental factors is Acanthogorgia sp. (phototaxon 29), which can appear as flexible, 2D fan or as a bushy, 3D branching morphology in imagery (Figure 3D).
Morphological variation due to ontogenetic, environmental or image related factors was observed in 17 of the 55 phototaxa and all primary branches of the CATAMI scheme except the “Quill” morphotype. Variation within a phototaxon, where one morphotype is encrusting and the other is a more complex fan or branching form, represented ontogenetic variation. Environmental variation is inferred where a single phototaxon adopts multiple morphologies withing a single primary branch (e.g., Chrysogorgia phototaxon 21, can be either a single or complex bottle brush shaped colony). Variation within phototaxa which can exhibit either 2D fan or 3D branching morphologies represented variation due to factors related to image quality. As mentioned above, a small number of annotations (302; 0.06% of total annotations) could not be taken to the phototaxon level, representing a loss of information, which is not transferred to the morphological scheme.
During this development we found that trying to fit a single phototaxon onto a single CATAMI branch was compromising the scheme’s utility and value because morphological characters cannot always be universally applied in imagery. Therefore, annotations were made using two classifications: a CATAMI morphology category in conjunction with a phototaxon (Figure 4), to maintain the integrity of morphological and taxonomic information contained in each scheme and to allow the detection of morphological variability within a phototaxon, which may carry important ecological information (Figure 4). Both schemes make use of unique CAAB codes assigned to each category and taxon, which are traceable through time and, in the case of taxon codes can correspond to a project-specific collected specimen (Figure 2 and Tables 1, 3).
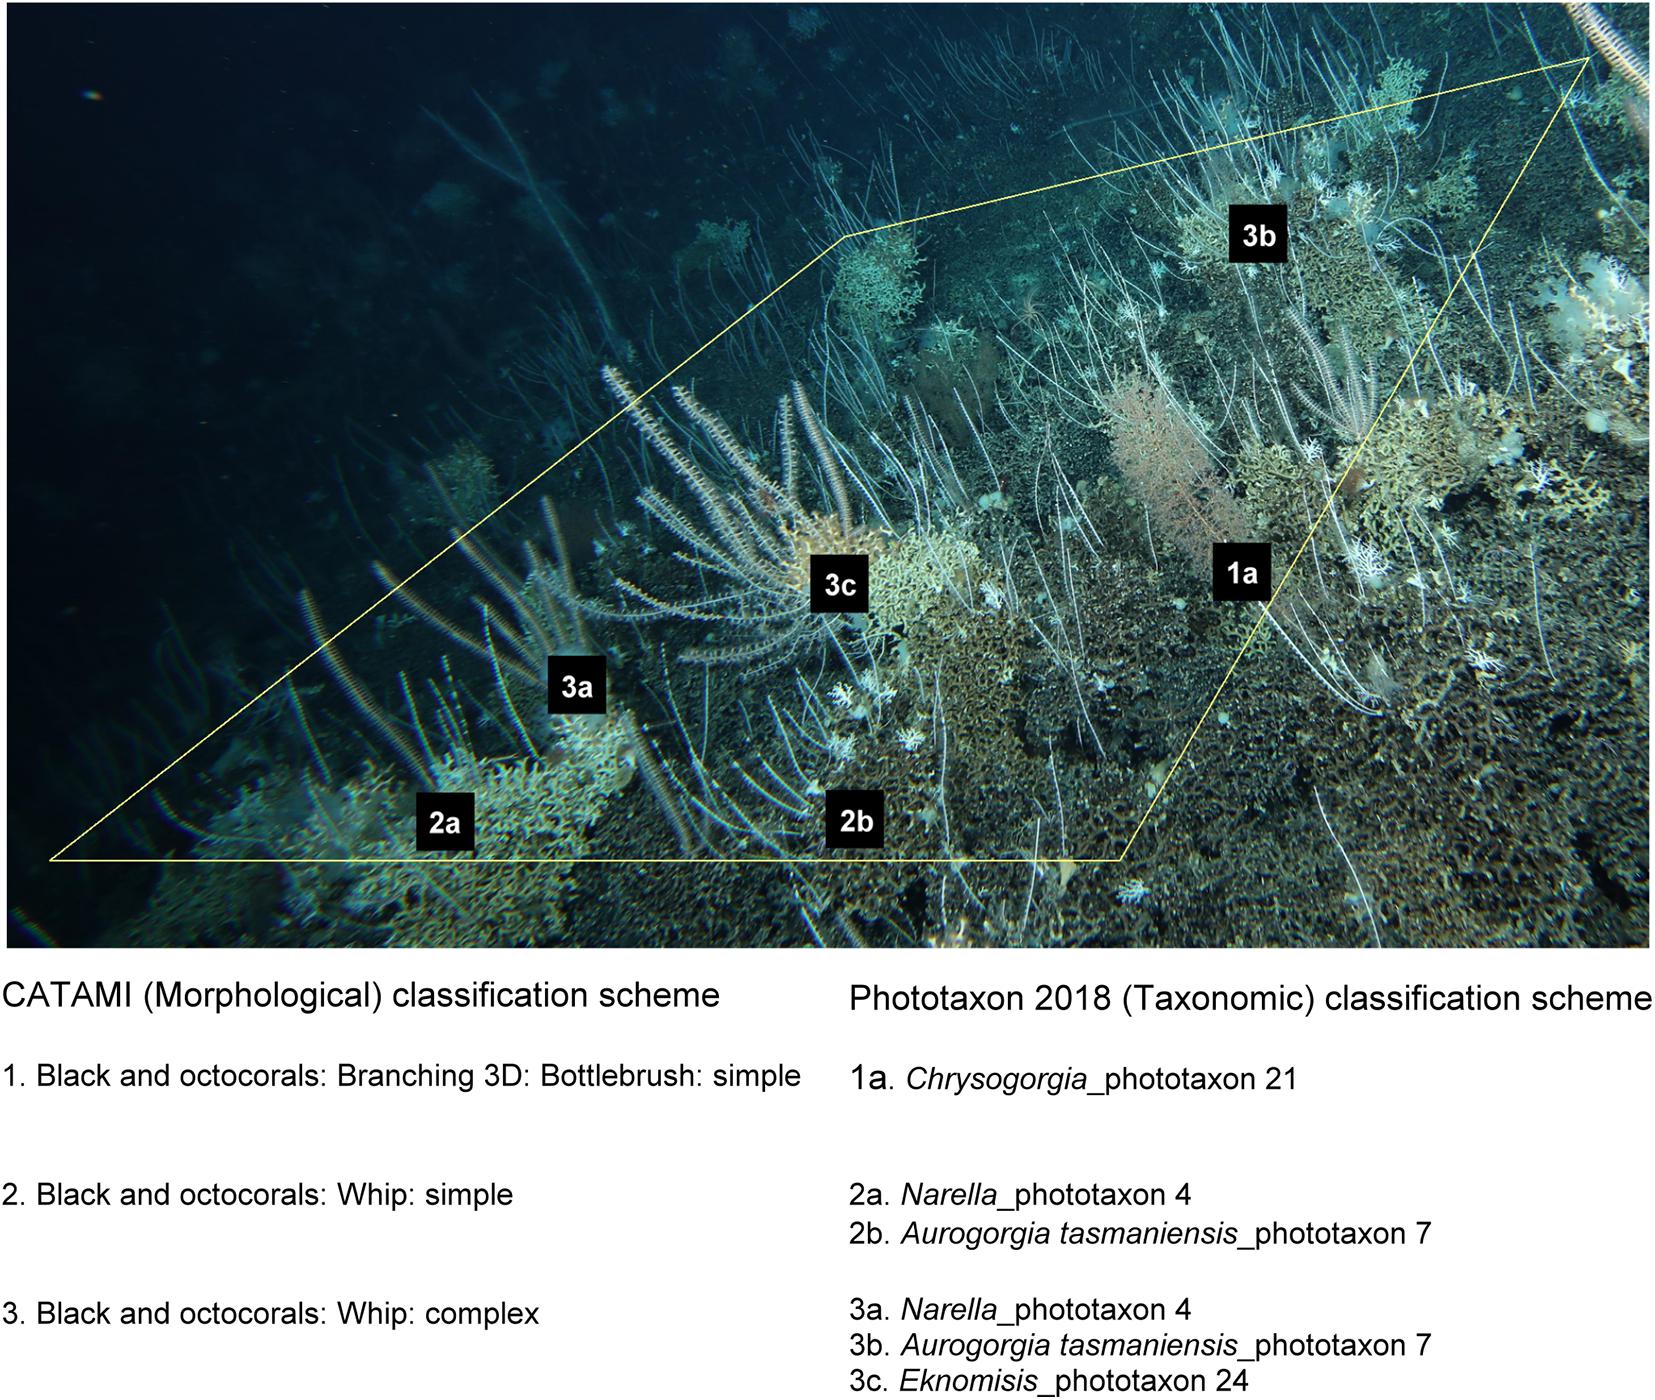
Figure 4. Example of the CATAMI morphological and Phototaxa 2018 taxonomic classification schemes for black and octocorals. These two schemes were used together in the dual annotation method.
Characteristics of Phototaxa and CATAMI Classifications
The composition of the Tasmanian seamount black and octocoral assemblage, with entities being annotated as either phototaxa (Phototaxa 2018) or CATAMI morphotypes, is shown for metrics of occurrence, total density and average density (Figure 5).
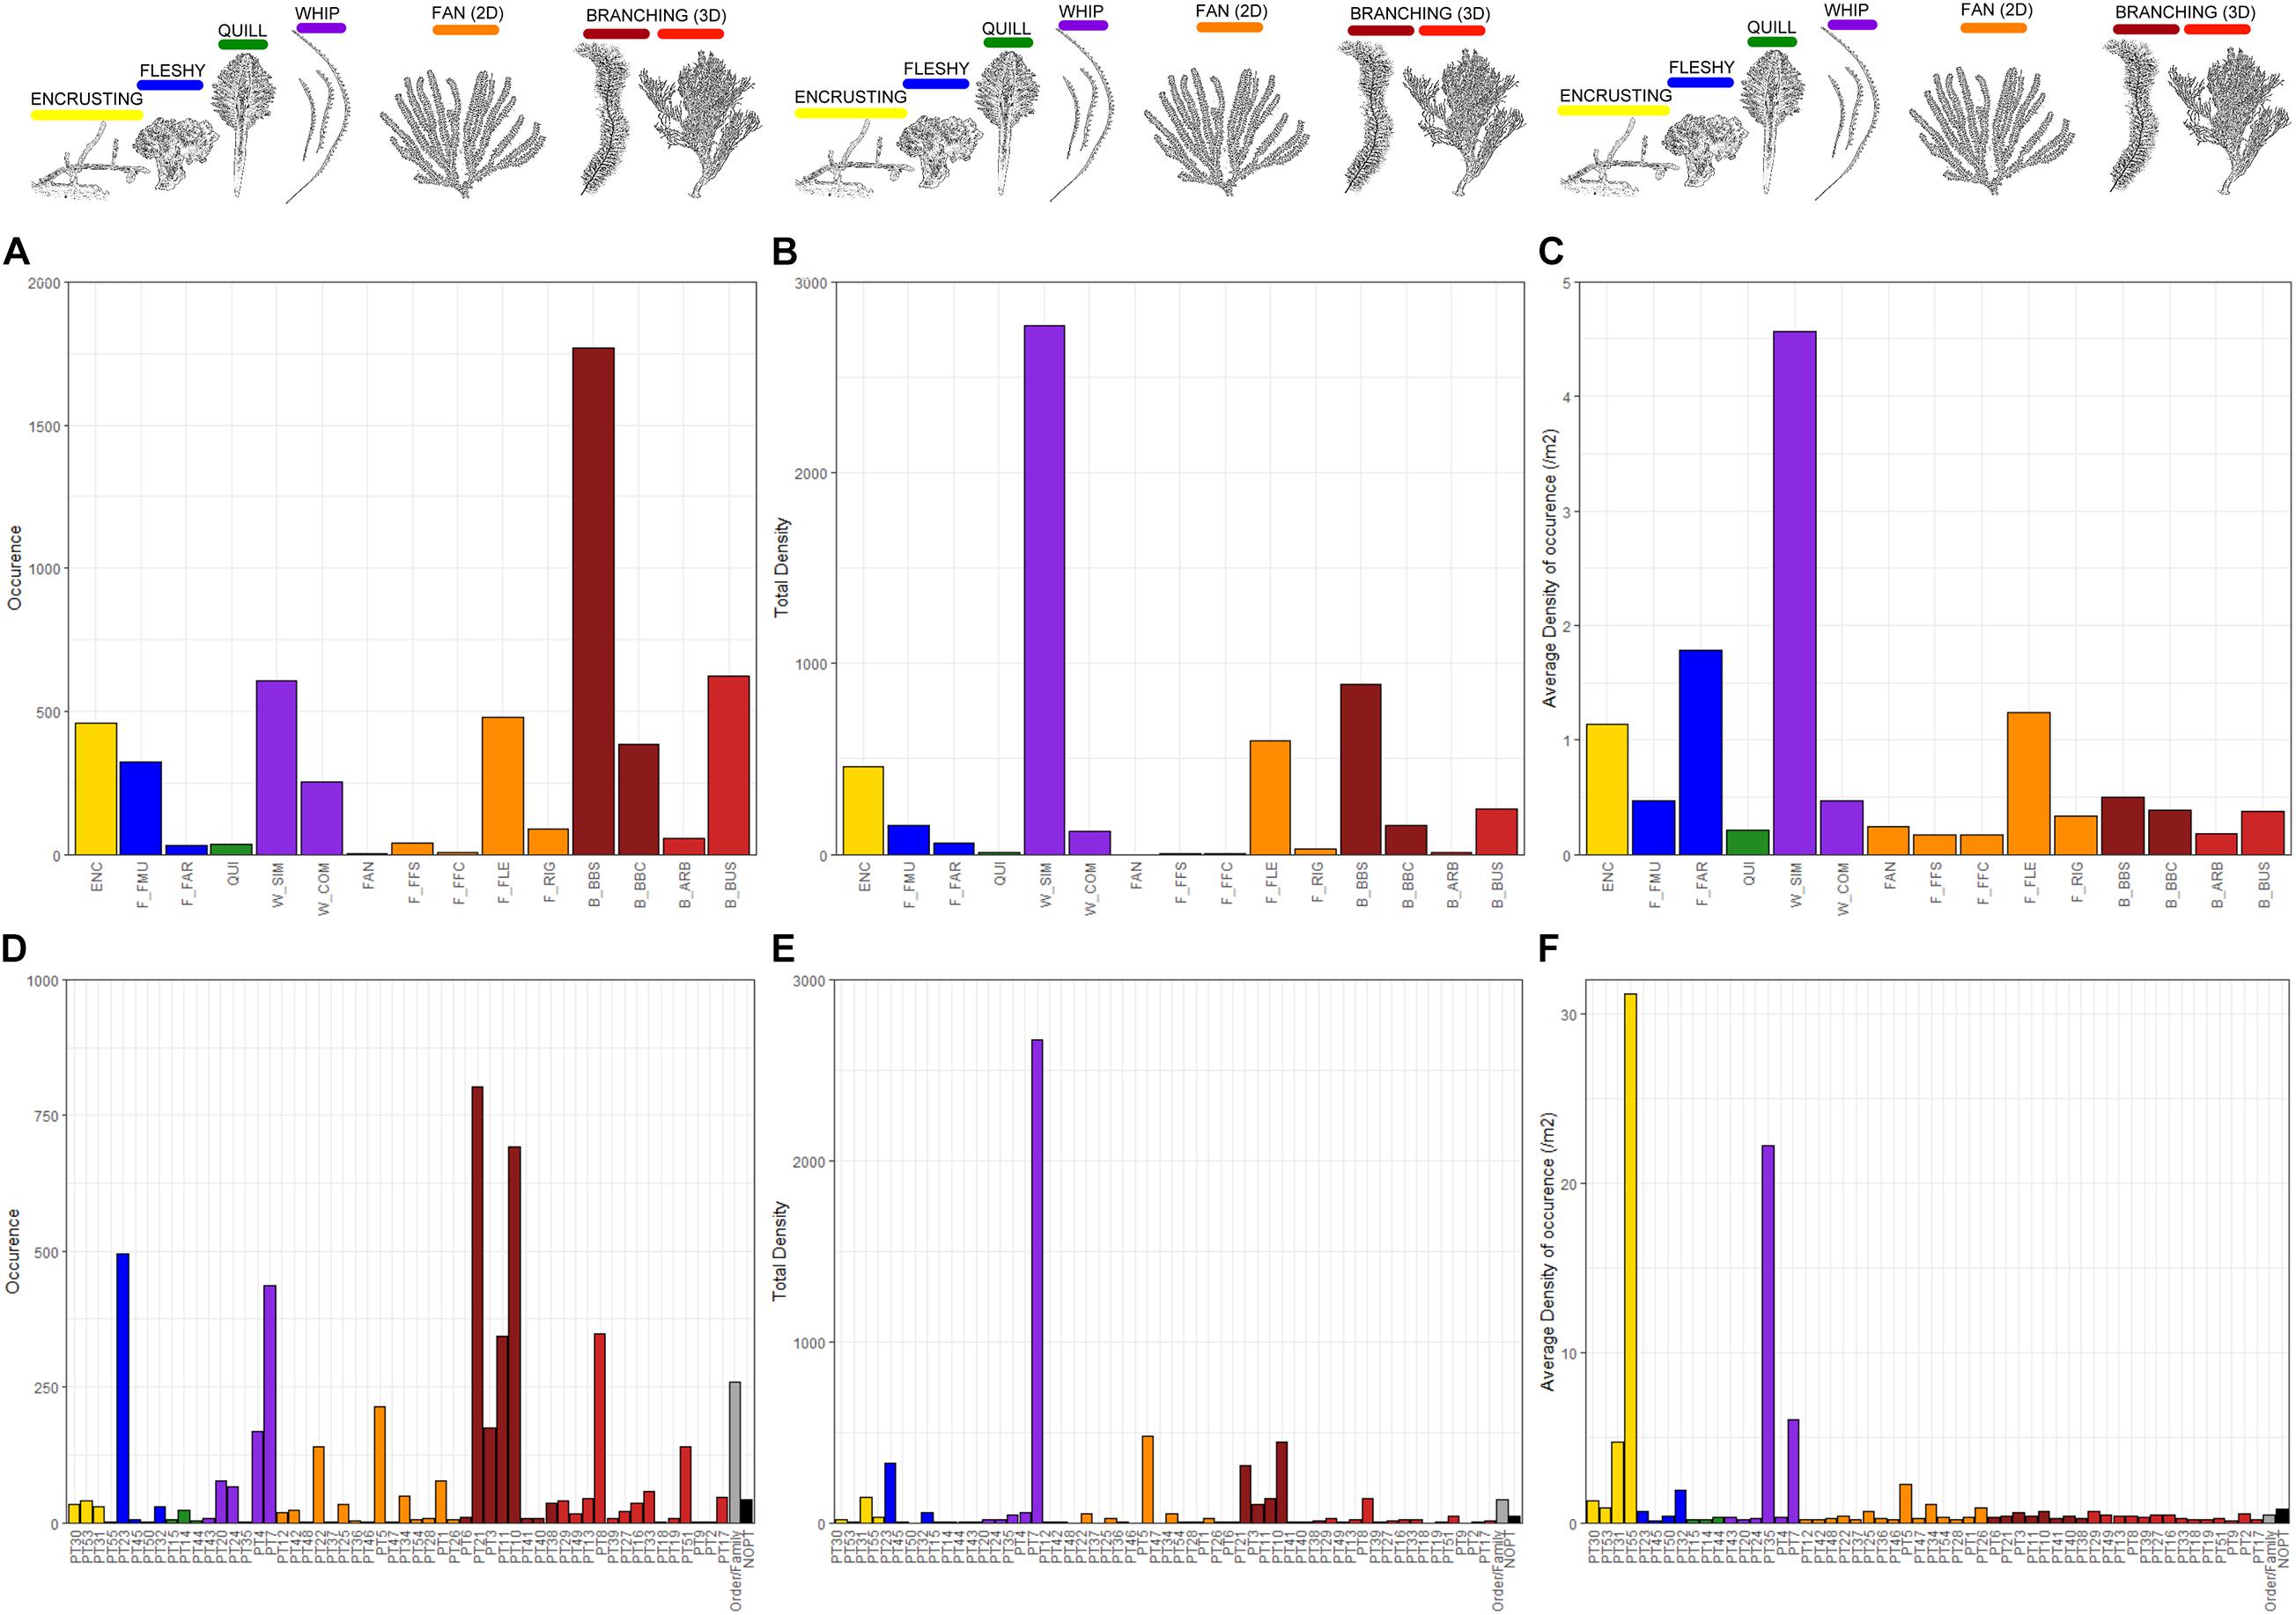
Figure 5. Metrics of occurrence, total and average density (per m2 of occurrence) calculated across the analyzed data set (n = 2 075 images) for the CATAMI (A–C) and Phototaxa 2018 (D–F) classification schemes. ENC, encrusting; F_FMU, Fleshy: mushroom; F_FAR, Fleshy: arborescent; QUI, Quill; W_SIM, whip: simple; W_COM, whip: complex; FAN, Fan(2D); F_FFC, Fan(2D): Fern-frond: simple; Fan(2D), Fern-frond: complex; F_FLE, Fan(2D) flexible; F_RIG, Fan(2D): Rigid; B_BBS, Bottle-brush: simple; B_BBC, Bottle-brush: complex; B_ARB, Branching (3D): Arborescent; B_BUS, Branching (3D): Bushy.
Patterns of assemblage composition based on either CATAMI or Phototaxa 2018 were similar in many respects (Figures 5A,D). Based on occurrence (presence across all images), corals with complex forms were most commonly represented in both classifications. This reflected the inherent underlying linkage of taxonomy to gross morphology in these corals, and the dominance of gorgonians in this deep-sea region. Under the CATAMI scheme, 3D branching bottlebrush colonies had the highest occurrence with the most commonly occurring phototaxa being Chrysogorgia (phototaxon 21) and Thouarella (phototaxon 10), both gorgonians with bottlebrush shaped colonies, which can be either simple or complex (Figure 5). Flexible 2D fans and simple, whip shaped colonies were also relatively common morphotypes (Figure 5).
Patterns of assemblage composition were similar across schemes when based on total density (the numerical abundance across combined quadrat area), and similar to those determined by occurrence. The density metric showed that gorgonians were found in high abundance as well as being commonly encountered, and that this characteristic is captured similarly by morphotype and photo-taxonomic classifications. A difference between metrics was the greater emphasis given to simple whip-shaped corals that occurred at very high density relative to others (Figures 5B,E). This assemblage characteristic was detected by both classifications, but the phototaxonomic scheme identified phototaxon Aurogorgia tasmaniensis (phototaxon 7) as dominant – with a total density exceeding 5 times that of any other phototaxon (Figure 5E).
Some difference between metrics and schemes were seen when considering average density, which considers numerical abundance per image where present and has the effect of emphasizing rare aggregations. Whip-like morphotypes were again prominent because they commonly occurred in relatively high densities, but this metric identified a second, rarer phototaxon, Stereotelesto (phototaxon 25), as prominent despite being annotated in only 2 images. Encrusting and fleshy forms were also emphasized by this metric, especially in the phototaxon scheme where encrusting Heteropolypus (PT_55) is present in only 1 image but at the highest average density of any phototaxon (Figure 5F). This peak/dominance is not reflected in the CATAMI scheme due to the inherent lumping of multiple phototaxa into a single morphotype.
Across all metrics, the least common CATAMI morphotypes were complex and simple fern-fronds as well as quill shaped colonies (Figures 5A–C). Almost half of the phototaxa (26 out of 55) were annotated 20 or fewer times, at low abundances and densities, with seven of these being present in only a single image (Figures 5A–C).
Case Study Analysis
Prior to implementing the case study analysis, we examined the variable resolution of coral entities in each of the five classification schemes in relation to their accumulation in the total image set (Figure 6). The VME classification scheme had the lowest number of entities (6), followed by the CATAMI classification (15), the Phototaxa 2007 (16), and the Phototaxa 2018 scheme (55). The combined morphology and taxonomy scheme had 76 unique entities – containing the same 55 taxonomic entities, the increase of 21 resulted from capture of morphological variation within phototaxa. This is therefore an increase in functional richness not species richness, where the functional units are coral entities defined by a unique combination of a morphological and taxonomic classification. As expected, the coarse-grained classifications (VME, CATAMI and Phototaxa 2007) rapidly reach asymptote, being fully represented by fewer than the analyzed data set of 5 939 images. In contrast, curves for both the new phototaxa and the combined CATAMI and Phototaxa 2018 do not reach an asymptote consistent with the expectation that richness of the regional coral species pool is not yet fully sampled and translated into phototaxa (Figure 6).
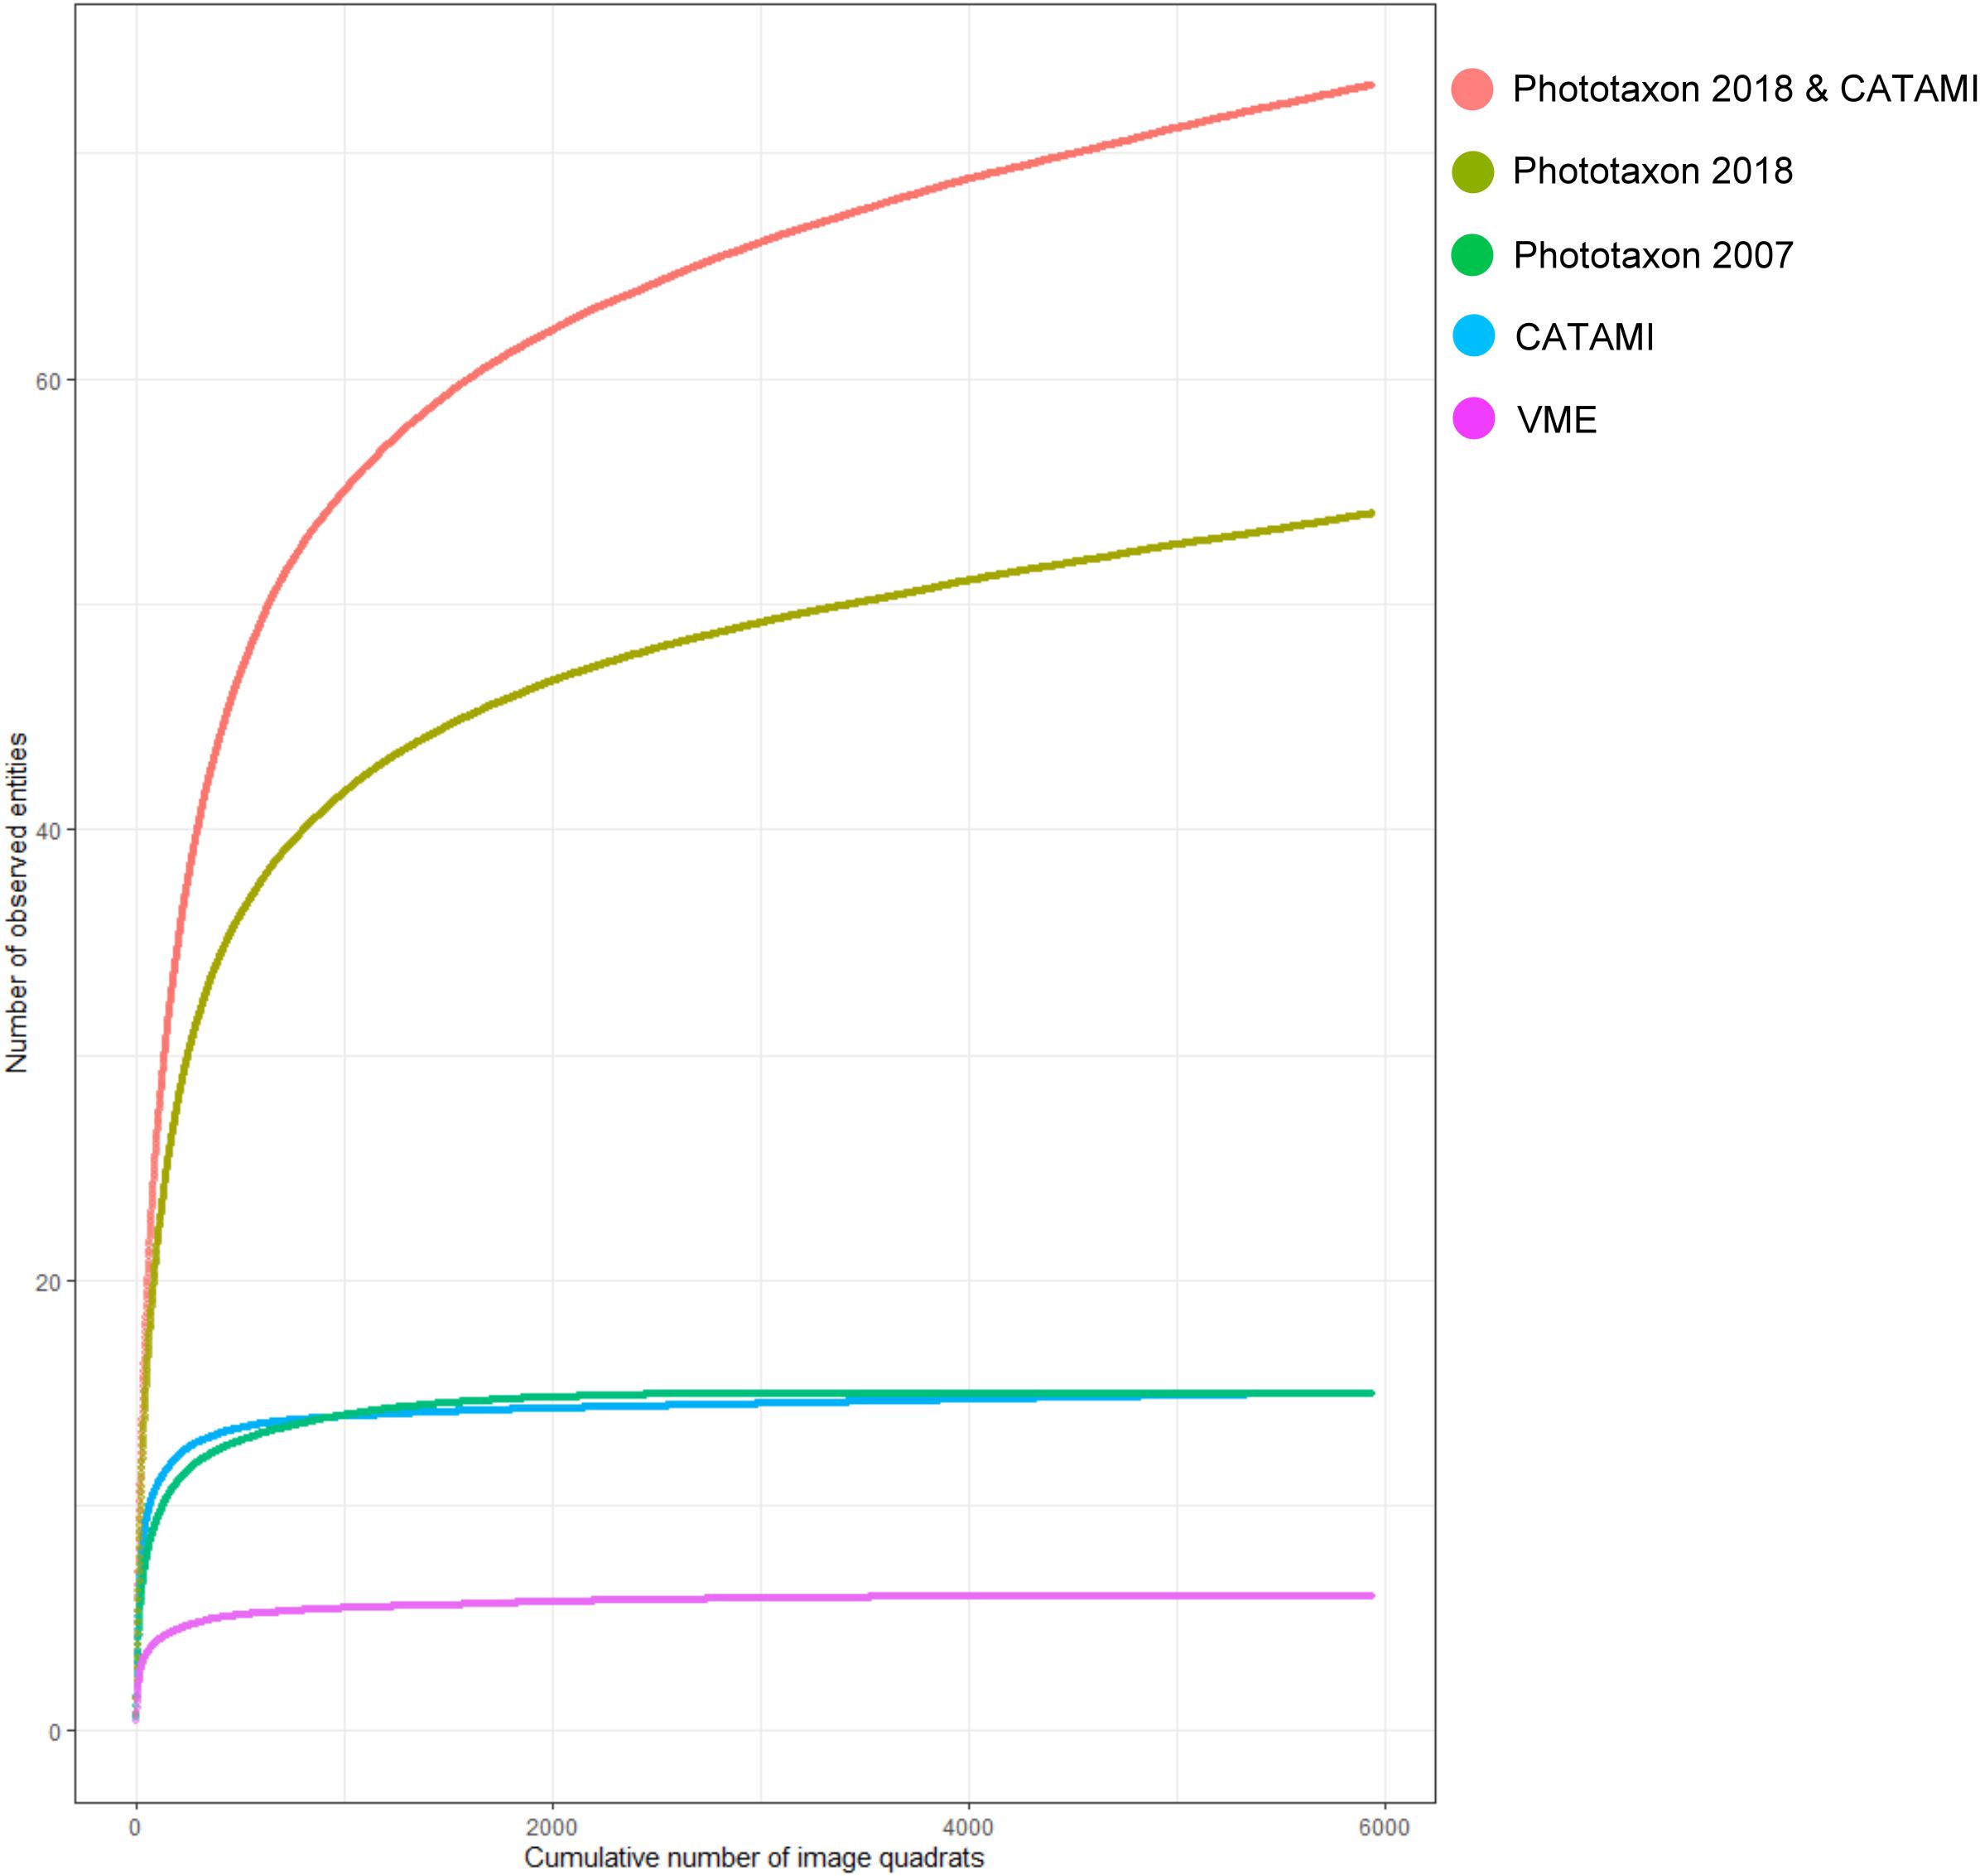
Figure 6. Coral entity accumulation curves calculated for the entire image data set (n = 5 939 images) for the five classification schemes under consideration. PT_2018, Phototaxa 2018; PT_2007, Phototaxa 2007.
Coral entity richness and diversity were compared between seamounts and classification schemes by determining the number of entities recorded in a cumulative area of 2 140 m2, the area of imagery viewed on the smallest seamount z16. Surprisingly, one of the impacted seamounts, Pedra, had the highest number of entities, regardless of classification scheme (Table 4). Increasing resolution of the classification schemes naturally increased the number of entities sampled (F = 134.213, p < 0.0001), but patterns between seamounts were similar regardless of classification scheme. The exception was the lower entity richness at Sisters seamount using the combined scheme (Table 4); this is likely due to phototaxa on Sisters exhibiting less morphological variation compared with phototaxa on the other seamounts. Diversity was also significantly dependant on classification scheme (F = 44.26, p < 0.0001), and seamount (F = 17.10, p < 0.0001), but there was no significant interaction between these factors (F = 0.844, p = 0.605). The diversity of black and octocorals on Hill U was significantly higher (p < 0.0001) than other seamounts in all classification schemes and demonstrates the strength of a relatively low-resolution classification scheme to elucidate diversity patterns. There were no differences in diversity (p > 0.1) between the other seamounts using the Phototaxa 2018, CATAMI or combined CATAMI and Phototaxa 2018 schemes but values from the other schemes (Phototaxa 2007 and VME) were significantly lower (p < 0.05, p < 0.0001, respectively) (Figure 7). Collectively, these results show the predictable effect of lost information (entity richness) stemming from low resolution in the classification scheme, but a surprising similarity of pattern (diversity) across schemes – except at the lowest VME resolution.
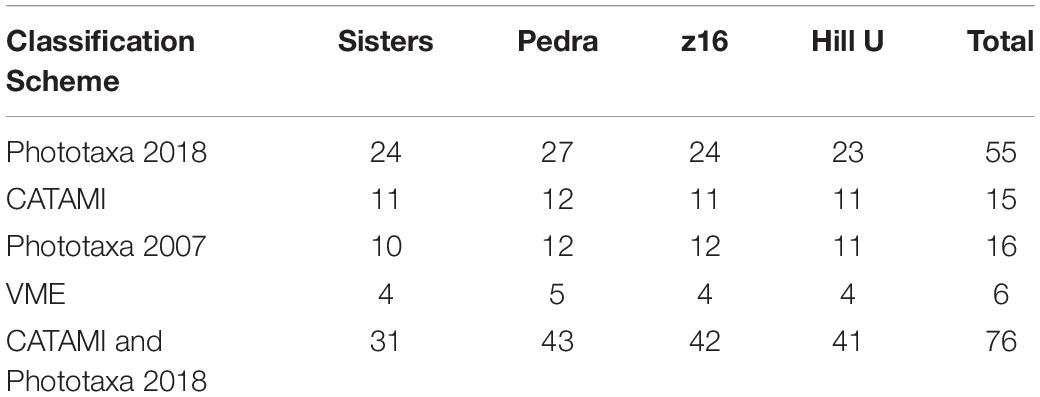
Table 4. Coral entity richness by seamount and classification scheme calculated in a cumulative area of 2 140 m2, the area of imagery viewed on the smallest seamount, z16.
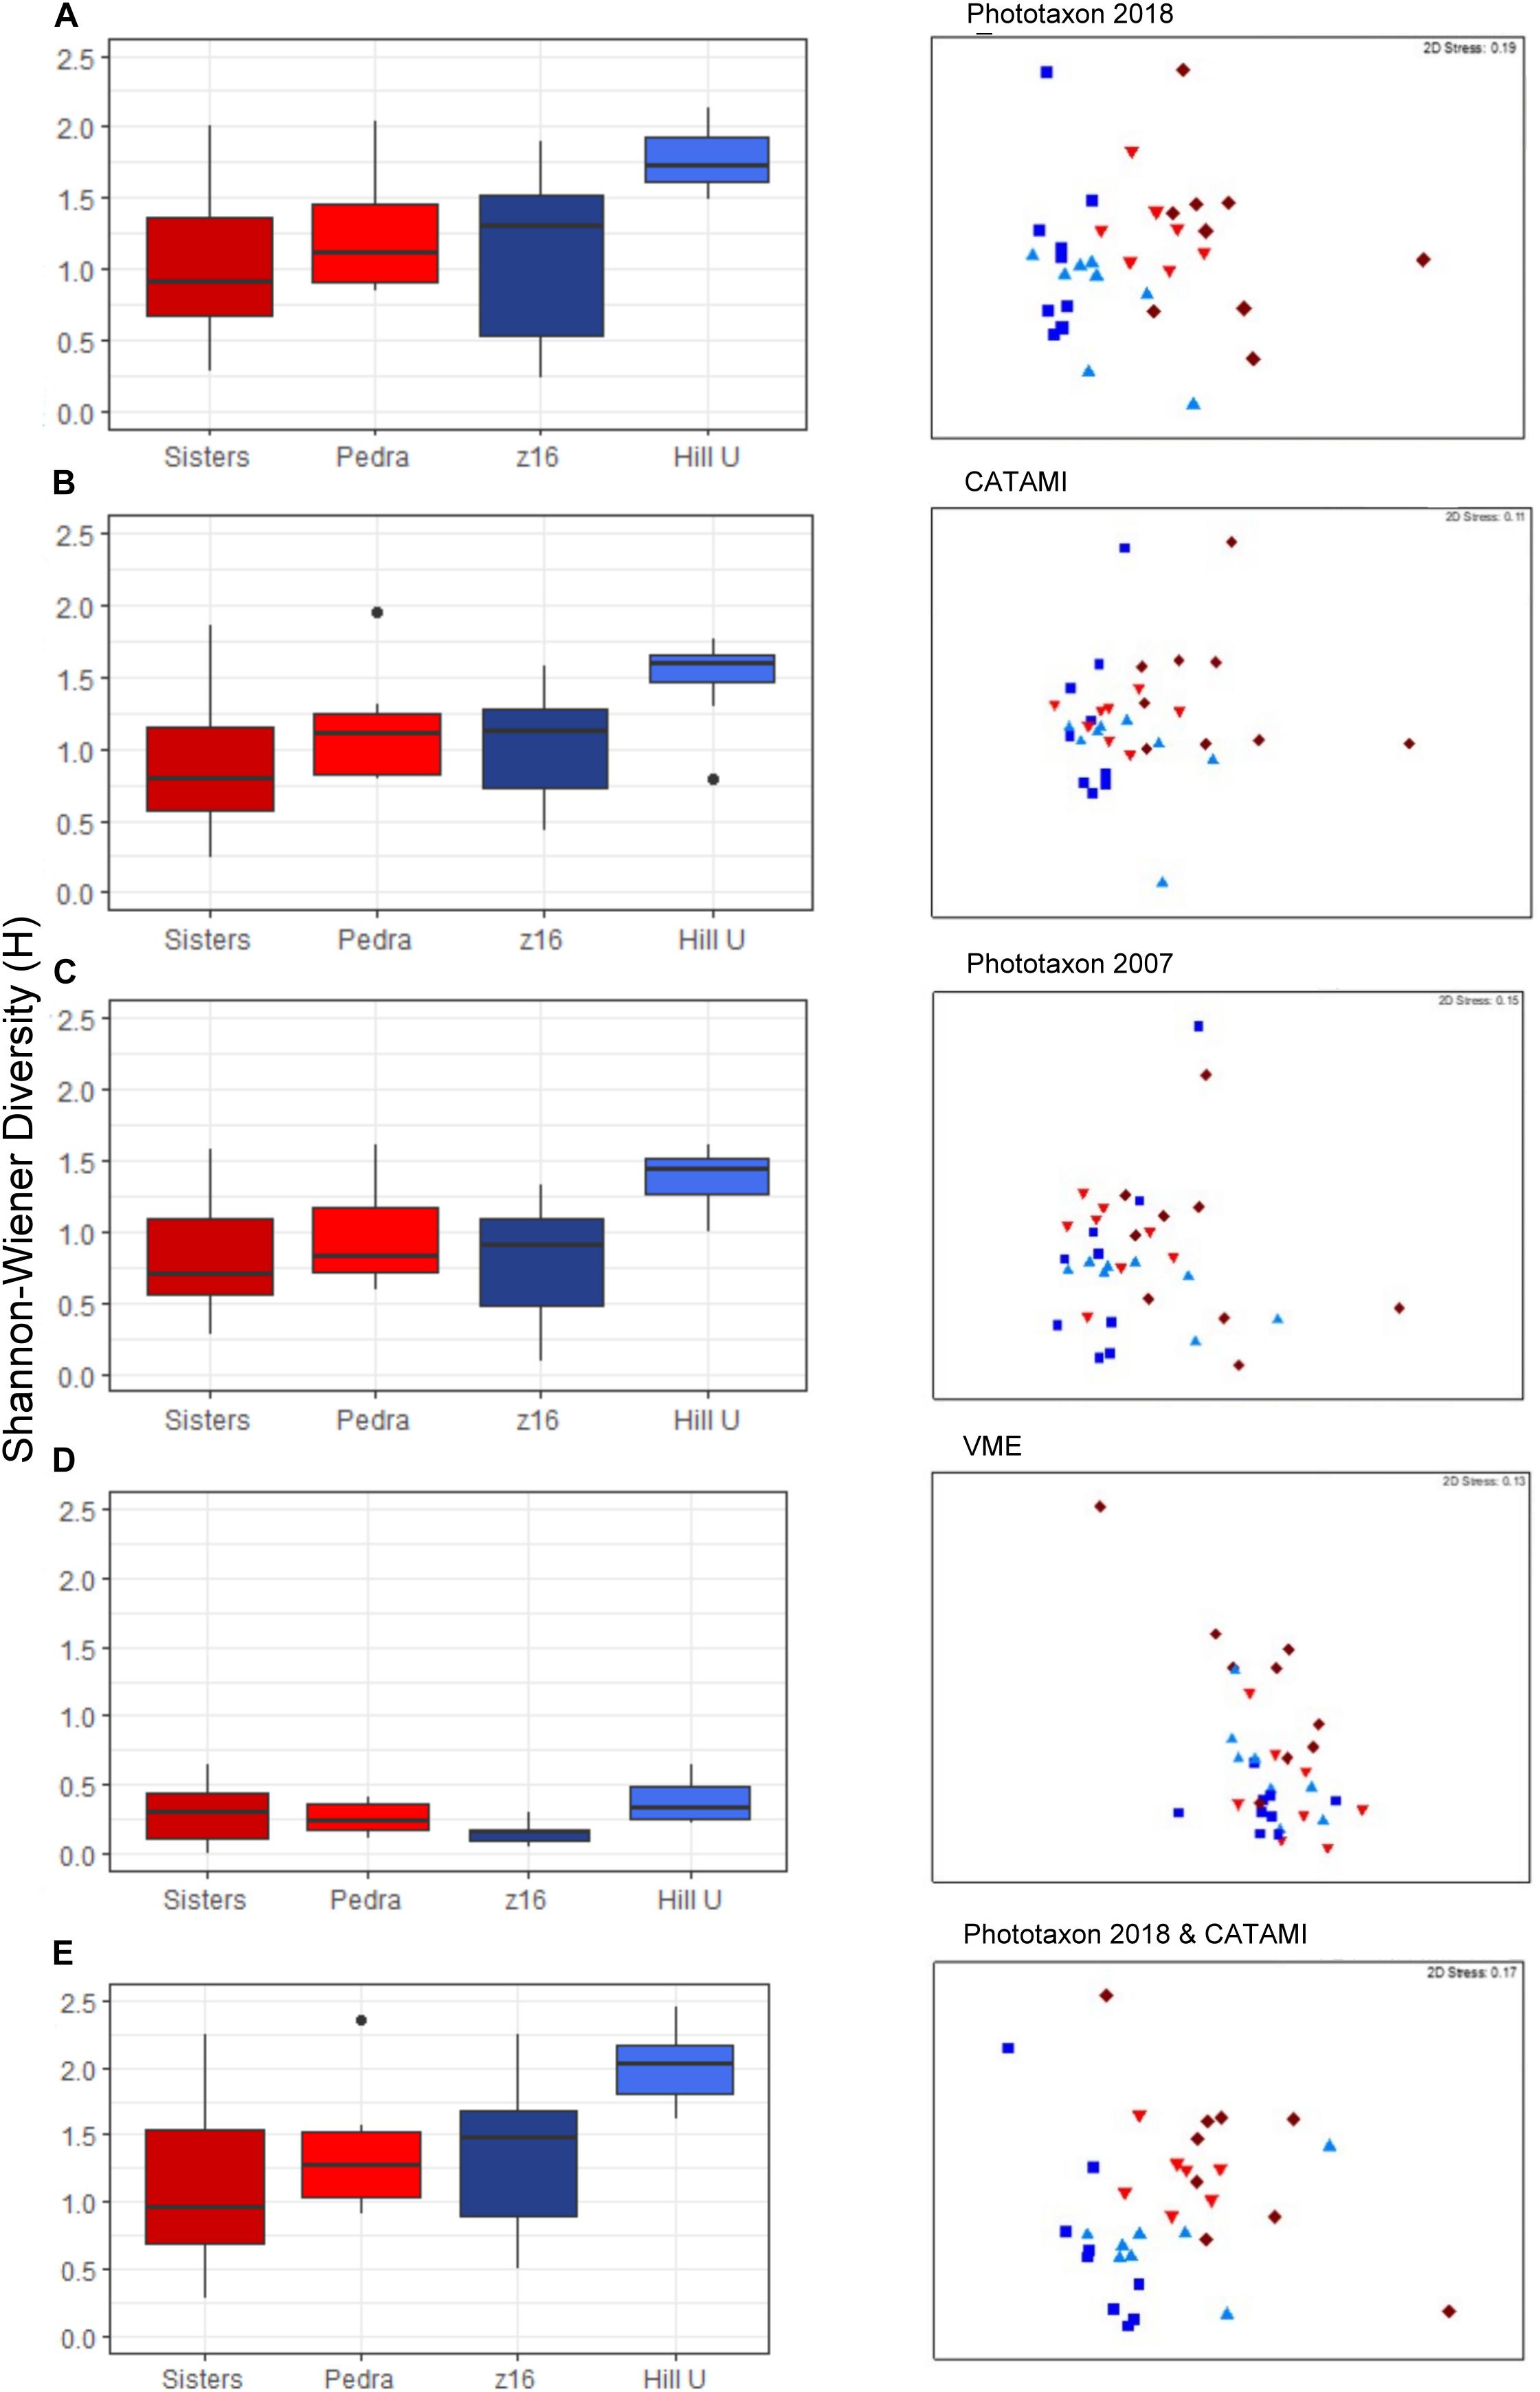
Figure 7. Shannon-Wiener Diversity of coral entities and non-metric multidimensional scaling (nMDS) ordination plots of coral entity community patterns on low impact for low impact (blues: Hill U, z16) and high impact (reds: Sisters, Pedra) seamounts, for each of the five classification schemes under consideration.
Community differentiation between high and low impact seamounts was only achieved when applying high resolution taxonomic schemes. Ordinations show that Pedra and Sisters seamounts (high impact) were clearly separated from Hill U and z16 (low impact) only with the higher resolution schemes (Phototaxa 2018 and CATAMI and Phototaxa 2018; Figures 7A,E). The VME scheme appears particularly low in resolution, unable to distinguish transects within and between seamounts (Figure 7D). The concordance of patterns obtained using different classification schemes is confirmed by a second-stage nMDS, which shows the highest correlation between the Phototaxa 2018 and CATAMI and Phototaxa 2018 schemes and relatively close proximity of the CATAMI and Phototaxa 2007 schemes, while the VME scheme is situated in a substantially different ordination space (Figure 8). The highest average dissimilarity (57.24%) between impacted and unimpacted seamounts was achieved when applying the CATAMI and Phototaxa 2018 classification scheme, with the simple whip form of Aurogorgia tasmaniensis (phototaxon 7) making the greatest contribution (Table 5). Together with the flexible fan Primnoidae (phototaxon 5), the simple bottlebrush form of Thouarella (phototaxon 10), both the encrusting and bushy form of Tokoprymno (phototaxon 8) and the bushy Antipatharian (phototaxon 51), these six entities accounted for 35% of the difference between high and low impact seamounts (Figure 8). The most discriminating entities were both morphological forms of Tokoprymno (phototaxon 8) and the bushy Antipatharian (phototaxon 51), all of which were present in higher average densities on the unfished seamounts z16 and Hill U (Table 5). Average dissimilarity between the seamount groups was similarly high (53.65%) for the Phototaxa 2018 classification scheme, with the same phototaxa identified as being the greatest contributors. Antipatharia (phototaxon 51) and Corallidae (phototaxon 1) were good discriminators and present in higher average densities on unfished seamounts (Table 5). For the CATAMI, Phototaxa 2007 and VME classification schemes the average dissimilarity between high and low impact seamounts was <38%, and lowest for the VME scheme: 25.49%. Aurogorgia tasmaniensis (phototaxon 7) and Thouarella (phototaxon 10) contributed most to average dissimilarity between unfished and fished seamounts in both the Phototaxa 2007 and Phototaxa 2018 schemes despite the increased resolution of the latter. In the Phototaxa 2007 scheme, Corallidae (phototaxon 1) and Chrysogorgia (phototaxon 21) were identified as being the most discriminating taxa, with higher abundances of these fauna recorded on unfished seamounts (Table 5).
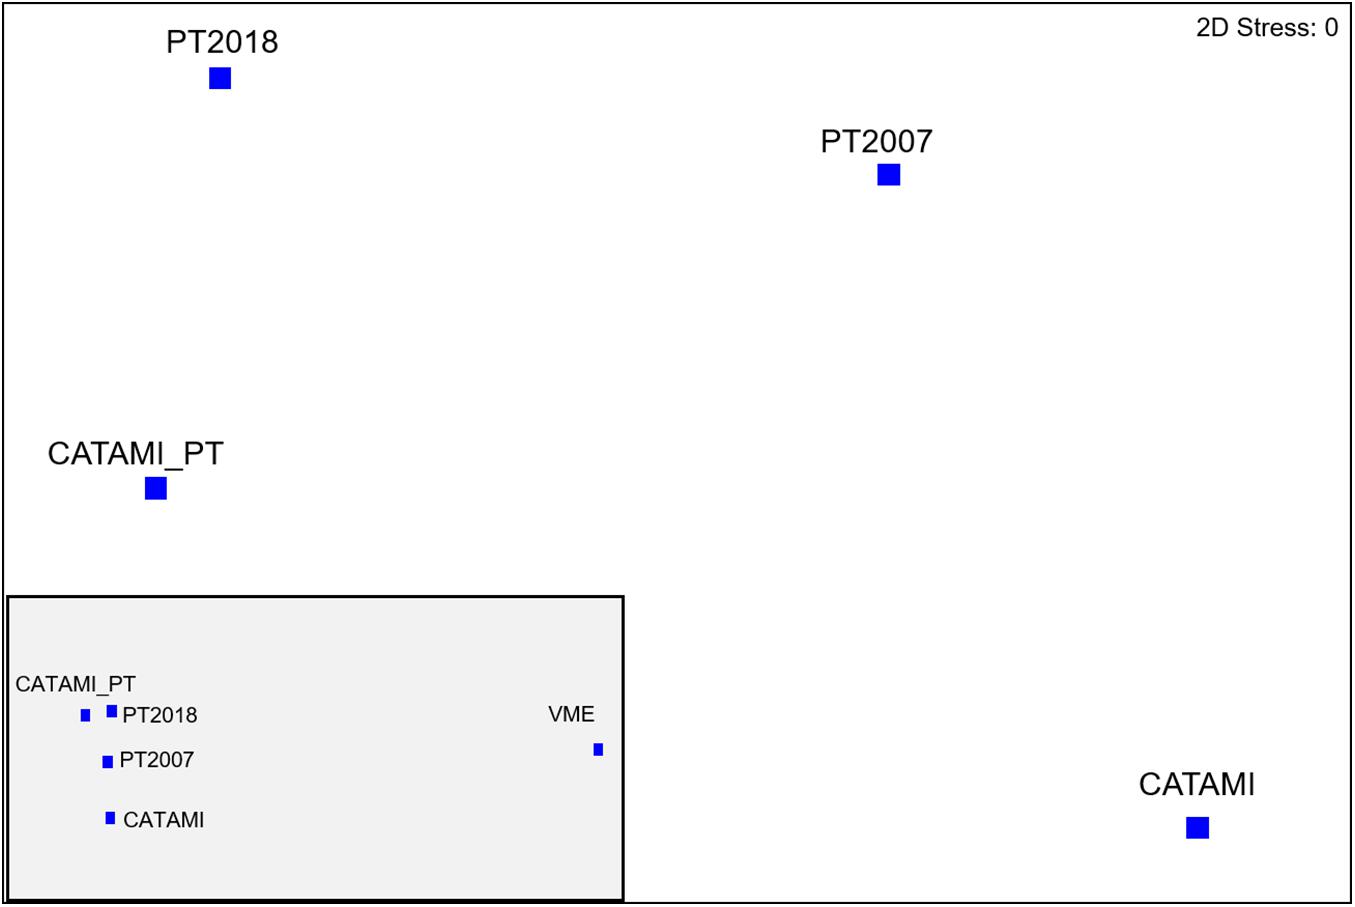
Figure 8. Second-stage nMDS, showing the concordance in community patterns between the five classification schemes applied.
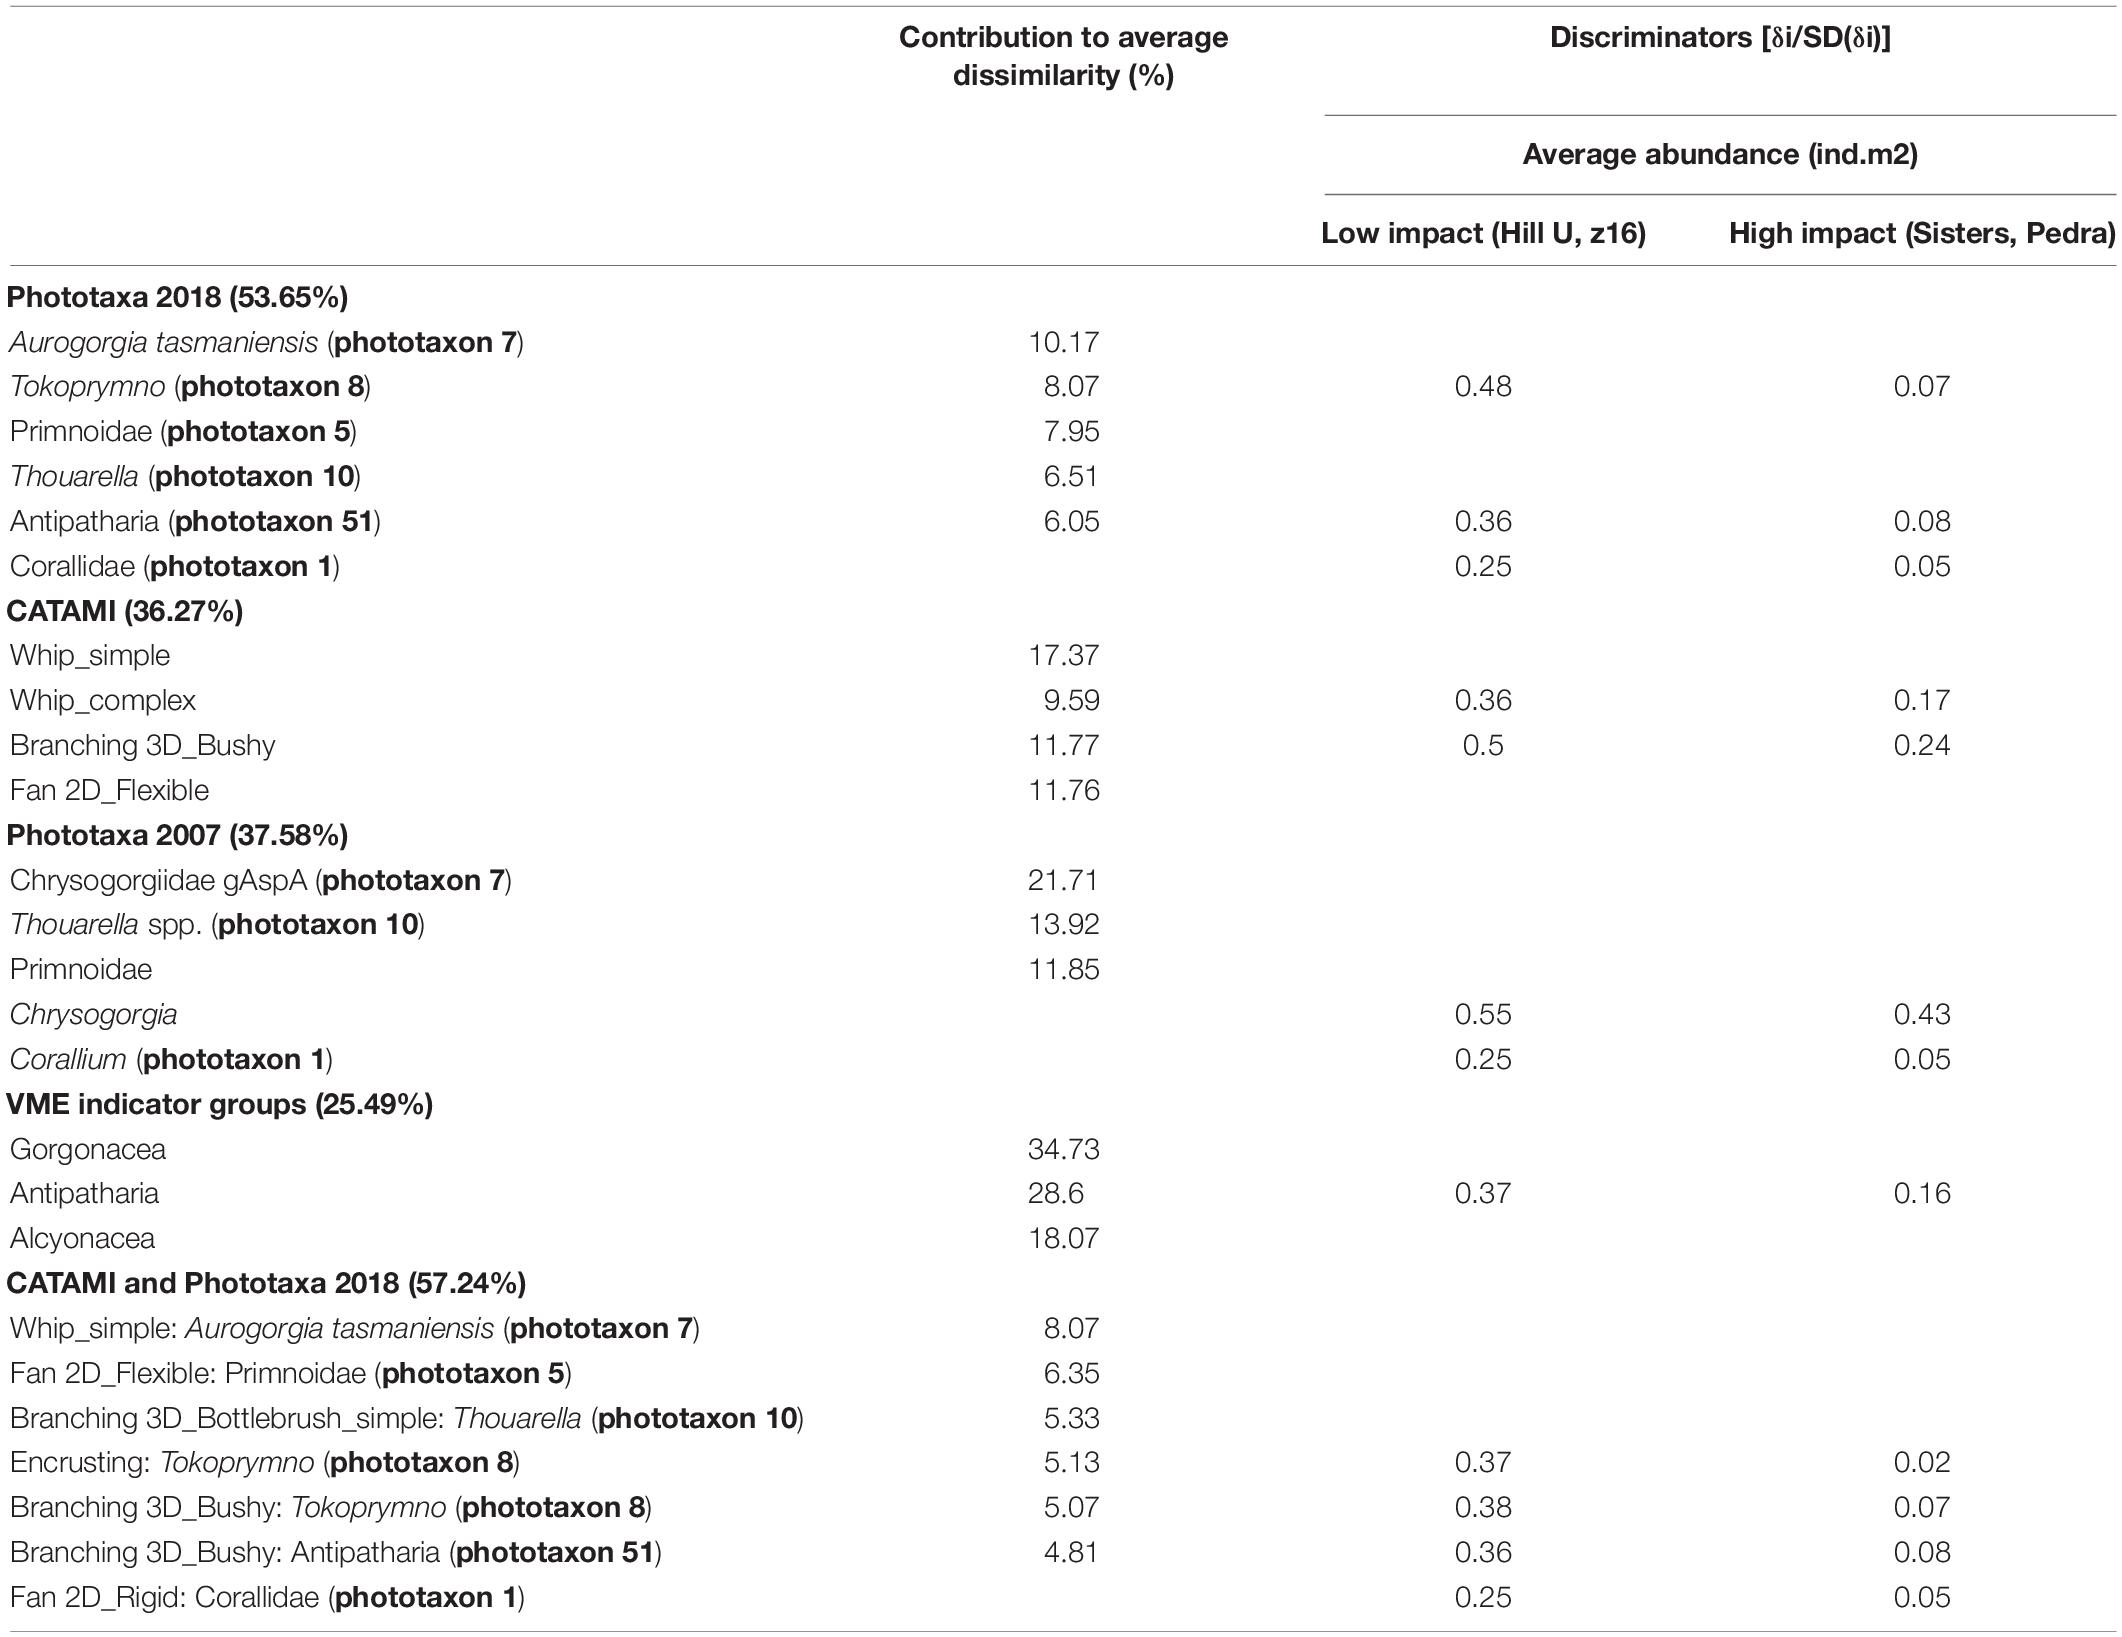
Table 5. Results from SIMPER analysis of average dissimilarity between low impact (Hill U, z16) and high impact (Sisters, Pedra) seamounts detailing coral entities contributing most to average dissimilarity between groups of seamounts and the average abundance of discriminating entities.
Discussion
Limitations for Identifying Black and Octocorals From Imagery
Many factors determine the taxonomic level at which octocorals can be resolved from in situ photographic imagery. These include a variety of technical properties such as platform stability, proximity to the seafloor, image angle, and camera lens that determine image quality (Durden et al., 2016; Davies et al., 2017), but also the maturity of regional taxonomy – the foundational faunal knowledge against which image-based identifications are calibrated. We were able to make a substantial improvement on the taxonomic resolution achieved compared to previous studies in this region (Althaus et al., 2009; Thresher et al., 2014) with an increase from 19 to 55 black and octocoral phototaxa being confidently and consistently identified in imagery. This increase mainly reflected improvements in camera systems and imagery over time, the increase in taxonomic knowledge over time, which was applied to imagery and the intensive effort we invested in examining the imagery from this survey, which extended to images outside the analyzed set. Despite this gain, our phototaxa represent only 26% of the southeast Australian regional pool of 210 presently known species (Althaus et al., 2017; CSIRO unpublished data). It therefore seems likely that the underestimate of coral diversity in image data (e.g., Williams et al., 2015) will generally be very high, but the extent is only recognizable in regions where the established taxonomic knowledge is relatively mature. This under-sampling of coral diversity in imagery could also be due to image transects not crossing over areas where some of the 210 known species occur and thus not being recorded in imagery, but the collective area viewed with cameras is significantly larger than the area sampled with trawls. There could also be cryptic species present that a taxonomist could distinguish from specimens, but the diagnostic characters are not visible in imagery. Therefore, for black and octocorals, irrespective of further investment in taxonomic study and image quality, it is highly unlikely that image-based resolution of black and octocorals will ever reach a 1:1 resolution because external morphology is variable, is shared between several species and higher level groups, and diagnostic features are microscopic and therefore not visible in situ imagery (Howell et al., 2019; Long et al., 2020). In our substantial regional-scale data, only nine of 55 phototaxa represented a single species. The large underestimates of total recorded diversity were because the number of known species greatly exceeds the number of resolvable phototaxa in the most species-rich and abundant families including Chrysogrogiidae, Isididae, and Primnoidae. In our study, 24 out of 55 phototaxa were represented by these families and the three most common and abundant phototaxa were Chrysogorgia (PT21), the primnoid Thouarella (PT10) and the recently described chrysogorgiid species, Aurogorgia tasmaniensis (PT7). Chrysogorgids are commonly reported as being the most abundant and common constituents of other deep-sea regions (Dautova et al., 2019). Thus, these “one phototaxon to many species” patterns (Table 3) are likely to be mirrored in other areas of world oceans because the family level composition of deep-sea octocorals is similar.
Evaluation of Classification Systems and Annotation Methods for Black and Octocorals From Imagery
The best resolved phototaxon-based classification schemes require good knowledge of the regional species pool and a significant expertise, time and cost investment but generally are not standardized (Morato et al., 2018; Howell et al., 2019). Standardization is important so that data can be compared or combined by research groups within and between regions, and will become increasingly relevant as image-based data collection and the requirements for data sharing are widely embraced (Bowden and Jones, 2016; Howell et al., 2019). Efforts to standardize classification schemes within regions advocate the use of numbers together with the OTU/morphospecies/phototaxon name (Howell et al., 2019). The addition of a unique identifier which, unlike a taxonomic name, will not change over time, resolves the common problem of different research groups developing unstandardized phototaxon schemes with disparate naming, identification, and documentation. We support the recommendations of Howell et al. (2019) and have included both numbers and CAAB codes with our phototaxon names in our in-house reference guide. While Howell et al. (2019) advocate using operational taxonomic units (OTUs) such as “Porifera branching ms1” in which morphological and taxonomic information is combined into one classification, our combined scheme of CATAMI and phototaxa (e.g., “Chrysogorgia PT_21: bottle brush simple/complex”) uses standardized CATAMI morphotype terminology together with a taxonomic classification, maintaining the integrity of information in each scheme and facilitating the detection of morphological variability within a phototaxon. Our combined scheme represents the highest cost in terms of development, but may represent the best way to capture community-level information, particularly when environmental or ontogenetic patterns are important – such as monitoring studies of community recovery from perturbations such as bottom trawling or pollution events.
Less resolved taxonomic (e.g., VME) and standardized morphological classification schemes have strong appeal where taxonomies are not established or local expertise is limited, because they require relatively low expertise, time and resources to implement. Importantly, they provide good opportunities for data sharing (e.g., CATAMI; Althaus et al., 2015) although taxonomic information cannot always be inferred from morphological classes (Althaus et al., 2015), and low resolution fails to distinguish some biodiversity characteristics, e.g., community-level patterns.
While we found similar patterns in occurrence and density using the CATAMI or phototaxon based classification schemes, the VME classification scheme lacked the resolution to provide comparable information. In several RFMOs black coral and octocoral VME indicator groups are refined to family level (Jones and Lockhart, 2011; Du Preez et al., 2020). For the SPRFMO region, VME indicator groups correspond roughly with Orders in the Phylum Cnidaria, but large, erect gorgonian colonies are considered separately from other soft, fleshy and low relief forms (Parker et al., 2009). In the VME context this separation is meaningful, although not taxonomically accurate, because these groupings carry some information about growth form, from which susceptibility or resilience can be inferred (e.g., Clark et al., 2016). The CATAMI scheme provided herein captures morphological information for black and octocorals and we recommend using this scheme in addition to or in preference of a VME indicator group/ordinal level classification scheme alone. Important information regarding the function, fragility and life history of black corals and octocorals can potentially be inferred from the morphological levels provided in our amended CATAMI morphology scheme, suggesting that some VME indicator groups, e.g., Gorgonacea, should be considered more vulnerable than others, e.g., “Alcyonacea” (Althaus et al., 2015; Clark et al., 2016; Morato et al., 2018). One means of doing so is to include ecological traits in evaluating the sensitivity of taxa to disturbance by fishing or mining (e.g., de Juan and Demestre, 2012; Kaikkonen et al., 2018; Boschen-Rose et al., 2021; Miatta et al., 2021). An approach by Morato et al. (2018) was to apply a multi criteria assessment (MCA) weighting to the vulnerability of different types of VMEs using a combined VME indicator score obtained from individual scores considering several traits (i.e., uniqueness, fragility, life history). When applied to a deep-sea region in the NE Atlantic it successfully identified areas in need of protection (Morato et al., 2018). In their method a higher VME indicator score was obtained for black corals and gorgonians when compared with sea pens and other soft corals (Morato et al., 2018). Future development of VME indicator taxa for the SPRFMO region could consider a similar, spatially aggregated and weighted MCA index for a number of coral taxa for incorporation into a classification scheme, which would better capture the vulnerability and importance of communities.
Implications and Trade-Offs of Using Different Classification Schemes in Ecological Studies
Identifying a method to generate biodiversity data from imagery typically includes considering the trade-off between standardization and resolution of the data required (Morato et al., 2018; Long et al., 2020). However, the implications of using different classification schemes for ecological assessments has not been previously assessed.
Overall patterns of occurrence and density of black and octocorals were similar for phototaxa and morphology (CATAMI) schemes. However, the identities of dominant entities and detection of locally abundant, rarely seen entities were evident only when annotation was at phototaxon resolution, and when faunal densities were recorded. Importantly, only the two highest resolution classification schemes – phototaxon and a combined phototaxon-morphological scheme – were able to distinguish black and octocoral communities on unimpacted vs. impacted seamounts. The combined scheme used here provides a solution to the inherent difficulty of classifying a continuum of morphology into discrete categories, without compromising the taxonomic identification.
These findings indicate that high resolution and more costly annotation schemes are likely to be necessary for a range of ecological and management-based applications – including biodiversity inventory and change detection (monitoring) – where community-level differentiation is necessary.
The CATAMI scheme captured comparable information to phototaxa schemes despite its lack of reliance on intrinsic taxonomic information indicating its possible suitability to deep-sea studies. More broadly, a morphological scheme has the potential to provide data with relatively low investment in foundational taxonomy and is relatively easily standardized for cross-study data sharing. Our analyses showed CATAMI can be expected to perform well for many ecological applications. Notwithstanding, there are many challenges to the development of any classification and annotation scheme that aims to facilitate cross-study data sharing. The need to evolve such a scheme is demonstrated by the additions and amendments to the CATAMI black and octocorals scheme presented here. Our findings also indicated it will be important to add modifiers such as size, color and other morphological and life history traits to a morphological-based (such as CATAMI) scheme to capture ontogenetic or environmental change. These types of changes, applicable to many taxa beyond corals, would need formal consideration and establishment through a collective and coordinated effort locally by CATAMI stakeholders and scientists, and continued maintenance through updates and revisions to ensure continuity of use (e.g., Howell et al., 2019). Standardization is a global issue, and efforts are needed to adopt an international approach where as much as possible there is consistency between equipment, its operation, and collection and analysis of sampling data (Clark et al., 2016). This is a key future challenge for image-derived biodiversity data, particularly because machine learning algorithms that aim to automate identification of black and octocorals will rely on having large, varied, high quality, and expertly annotated reference datasets to train algorithms (Bewley et al., 2015). Recent initiatives, however, offer hope that this can be progressed, with attempts to coordinate on what is being measured in the deep-sea (e.g., Woodall et al., 2018; Danovaro et al., 2020) and coordination as part of the UN Decade of Ocean Science and the Challenger 150 programme (Howell et al., 2020).
Data Availability Statement
The original contributions presented in the study are included in the article/Supplementary Material, further inquiries can be directed to the corresponding author/s.
Author Contributions
AW, CU, and MC acquired the data at sea. CU performed the image annotation. CU and FA performed the data analyses. CU and AW led the writing. All authors made substantial contributions to developing the methodology, designed the study, discussing the analyses, results and writing and revising the manuscript.
Funding
This work originates from a project that is funded, collectively, by CSIRO Oceans and Atmosphere, Parks Australia and the Australian Government National Environmental Science Program (NESP), Marine Biodiversity Hub. Project data were collected during voyages on the Southern Surveyor and Australia’s Marine National Facility Vessel, RV Investigator, funded through the Australian Government. The first author was supported by a Ph.D. scholarship provided through the University of Tasmania.
Conflict of Interest
The authors declare that the research was conducted in the absence of any commercial or financial relationships that could be construed as a potential conflict of interest.
Publisher’s Note
All claims expressed in this article are solely those of the authors and do not necessarily represent those of their affiliated organizations, or those of the publisher, the editors and the reviewers. Any product that may be evaluated in this article, or claim that may be made by its manufacturer, is not guaranteed or endorsed by the publisher.
Acknowledgments
We acknowledge the committees and staff of Australia’s Marine National Facility (MNF) for access to the research vessel RV Investigator, and the captain and the crew of the vessel for their hard work in making the 2018 survey successful. We also thank the sea-going staff from the MNF whose support was vital to the field collection of data. We especially thank our many colleagues from CSIRO Oceans and Atmosphere and Parks Australia who helped process photographic imagery whilst at sea, and gratefully acknowledge the many other engineering, technical and administrative staff at CSIRO who contributed in various ways to supporting the project that provided the data for this manuscript. In particular, for the design and fabrication of the camera platform, and for maintaining and piloting the system at sea, we thank Matt Sherlock, Jeff Cordell, Karl Forcey and Aaron Tyndall, and for advice and assistance with development of the classification schemes and verification of taxonomic assignment of images to phototaxa established herein we are indebted to Phil Alderslade (taxonomic expert in octocorals), Karen Gowlett-Holmes and Kylie Maguire. Finally, we thank staff from the IT and Data Centre at CSIRO, notably Pamela Brodie and Christopher Jacket, made invaluable contributions to handling and processing the image data sets and maintaining annotation systems. We also thank Christopher Burridge for valuable contributions and comments on the manuscript prior to submission.
Supplementary Material
The Supplementary Material for this article can be found online at: https://www.frontiersin.org/articles/10.3389/fmars.2021.722839/full#supplementary-material
References
Alderslade, P., Althaus, F., McEnnulty, F., Gowlett-Holmes, K., and Williams, A. (2014). Australia’s deep-water octocoral fauna: historical account and checklist, distributions and regional affinities of recent collections. Zootaxa 3796, 435–452. doi: 10.11646/zootaxa.3796.3.2
Althaus, F., Hill, N., Ferrari, R., Edwards, L., Przeslawski, R., Schonberg, C. H., et al. (2015). A standardised vocabulary for identifying benthic biota and substrata from underwater imagery: the CATAMI classification scheme. PLoS One 10:e0141039. doi: 10.1371/journal.pone.0141039
Althaus, F., Williams, A., Alderslade, P., Schlacher, T. A., and Beger, M. (2017). Conservation of marine biodiversity on a very large deep continental margin: How representative is a very large offshore reserve network for deep-water octocorals? Divers. Distrib. 23, 90–103. doi: 10.1111/ddi.12501
Althaus, F., Williams, A., Schlacher, T. A., Kloser, R. J., Green, M. A., Barker, B. A., et al. (2009). Impacts of bottom trawling on deep-coral ecosystems of seamounts are long-lasting. Mar. Ecol. Prog. Ser. 397, 279–294. doi: 10.3354/meps08248
Auscavitch, S. R., Lunden, J. J., Barkman, A., Quattrini, A. M., Demopoulos, A. W. J., and Cordes, E. E. (2020). Distribution of deep-water scleractinian and stylasterid corals across abiotic environmental gradients on three seamounts in the Anegada Passage. PeerJ 8:e9523. doi: 10.7717/peerj.9523
Baco, A. R., Roark, E. B., and Morgan, N. B. (2020). Amid fields of rubble, scars, and lost gear, signs of recovery observed on seamounts on 30- to 40-year time scales. Sci. Adv. 5:eaaw4513. doi: 10.1126/sciadv.aaw4513
Bewley, M., Friedman, A., Ferrari, R., Hill, N., Hovey, R., Barrett, N., et al. (2015). Australian sea-floor survey data, with images and expert annotations. Sci. Data 2:150057.
Bicknell, A. W. J., Godley, B. J., Sheehan, E. V., Votier, S. C., and Witt, M. J. (2016). Camera technology for monitoring marine biodiversity and human impact. Front. Ecol. Environ. 14, 424–432. doi: 10.1002/fee.1322
Boschen-Rose, R. E., Clark, M. R., Rowden, A. A., and Gardner, J. P. A. (2021). Assessing the ecological risk to deep-sea megafaunal assemblages from seafloor massive sulphide mining using a functional traits sensitivity approach. Ocean Coast. Manage. 210:105656. doi: 10.1016/j.ocecoaman.2021.105656
Bowden, D. A., and Jones, D. O. B. (2016). “Towed cameras. Chapter 12,” in Biological Sampling in the Deep Sea, eds M. R. Clark, M. Consalvey, and A. A. Rowden (Oxford: Wiley Blackwell), 260–284. doi: 10.1002/9781118332535.ch12
Brind’Amour, A., Laffargue, P., Morin, J., Vaz, S., Foveau, A., and Le Bris, H. (2014). Morphospecies and taxonomic sufficiency of benthic megafauna in scientific bottom trawl surveys. Cont. Shelf Res. 72, 1–9. doi: 10.1016/j.csr.2013.10.015
Carlier, A., Tancray, A., Metral Thiesse, E., Dugornay, O., Caisey, X., Desroy, N., et al. (2020). Optimizing image-based protocol to monitor macroepibenthic communities colonizing artificial structures. ICES J. Mar. Sci. 77, 835–845. doi: 10.1093/icesjms/fsz249
Clark, M. R., Althaus, F., Schlacher, T., Williams, A., Bowden, D., and Rowden, A. A. (2016). The impacts of deep-sea fisheries on benthic communities: a review. ICES J. Mar. Sci. 73(Suppl.1), 51–69. doi: 10.1093/icesjms/fsv123
Clark, M. R., Bowden, D. A., Rowden, A. A., and Stewart, R. (2019). Little evidence of benthic community resilience to bottom trawling on seamounts after 15 Years. Front. Mar. Sci. 6:63. doi: 10.3389/fmars.2019.00063
Danovaro, R., Fanelli, E., Aguzzi, J., Billett, D., Carugati, L., Corinaldesi, C., et al. (2020). Ecological variables for developing a global deep-ocean monitoring and conservation strategy. Nat. Ecol. Evol. 4, 181–192. doi: 10.1038/s41559-019-1091-z
Dautova, T. N., Galkin, S. V., Tabachnik, K. R., Minin, K. V., Kireev, P. A., Moskovtseva, A. V., et al. (2019). The first data on the structure of vulnerable marine ecosystems of the emperor chain seamounts: indicator Taxa, landscapes, and biogeography. Russ. J. Mar. Biol. 45, 408–417. doi: 10.1134/s1063074019060026
Davies, J. S., Guillaumont, B., Tempera, F., Vertino, A., Beuck, L., Ólafsdóttir, S. H., et al. (2017). A new classification scheme of European cold-water coral habitats: implications for ecosystem-based management of the deep sea. Deep Sea Res. Part II Top. Stud. Oceanogr. 145, 102–109. doi: 10.1016/j.dsr2.2017.04.014
de Juan, S., and Demestre, M. (2012). A trawl disturbance indicator to quantify large scale fishing impact on benthic ecosystems. Ecol. Indic. 18, 183–190. doi: 10.1016/j.ecolind.2011.11.020
Du Preez, C., Swan, K. D., and Curtis, J. M. R. (2020). Cold-water corals and other vulnerable biological structures on a north pacific seamount after half a century of fishing. Front. Mar. Sci. 7:17. doi: 10.3389/fmars.2020.00017
Durden, J. M., Bett, B. J., Schoening, T., Morris, K. J., Nattkemper, T. W., and Ruhl, H. A. (2016). Comparison of image annotation data generated by multiple investigators for benthic ecology. Mar. Ecol. Prog. Ser. 552, 61–70. doi: 10.3354/meps11775
FAO (2009). “International Guidelines for the Management of Deep-Sea Fisheries in the HIGH Seas. (Rome: FAO), 73.
Foster, S. D., Hosack, G., Monk, J., Lawrence, E., Barrett, N., Williams, A., et al. (2020). Spatially-balanced designs for transect-based surveys. Methods Ecol. Evol. 11, 95–105. doi: 10.1111/2041-210X.13321
Horton, T., Marsh, L., Bett, B. J., Gates, A. R., Jones, D. O. B., Benoist, N. M. A., et al. (2021). Recommendations for the standardisation of open taxonomic nomenclature for image-based identifications. Front. Mar. Sci. 8:620702. doi: 10.3389/fmars.2021.620702
Howell, K. L., Davies, J. S., Allcock, A. L., Braga-Henriques, A., Buhl-Mortensen, P., Carreiro-Silva, M., et al. (2019). A framework for the development of a global standardised marine taxon reference image database (SMarTaR-ID) to support image-based analyses. PLoS One 14:e0218904. doi: 10.1371/journal.pone.0218904
Howell, K. L., Hilario, A., Allcock, L., Bailey, D., Baker, M., and Clark, M. R. (2020). A blueprint for an inclusive, global deep-sea Ocean Decade field Programme. Front. Mar. Sci. 7:584861. doi: 10.3389/fmars.2020.584861
James, L. C., Marzloff, M. P., Barrett, N., Friedman, A., and Johnson, C. R. (2017). Changes in deep reef benthic community composition across a latitudinal and environmental gradient in temperate Eastern Australia. Mar. Ecol. Prog. Ser. 565, 35–52. doi: 10.3354/meps11989
Jones, C. D., and Lockhart, S. J. (2011). Detecting vulnerable marine ecosystems in the southern ocean using research trawls and underwater imagery. Mar. Policy 35, 732–736. doi: 10.1016/j.marpol.2011.02.004
Kaikkonen, L., Venesjarvi, R., Nygard, H., and Kuikka, S. (2018). Assessing the impacts of seabed mineral extraction in the deep sea and coastal marine environments: current methods and recommendations for environmental risk assessment. Mar. Pollut. Bull. 135, 1183–1197. doi: 10.1016/j.marpolbul.2018.08.055
Koslow, J. A., Gowlett-Holmes, K., Lowry, J. K., O’Hara, T., Poore, G. C. B., and Williams, A. (2001). Seamount benthic macrofauna off southern Tasmania: community structure and impacts of trawling. Mar. Ecol. Prog. Ser. 213, 111–125. doi: 10.3354/meps213111
Lapointe, A. E., Watling, L., France, S. C., and Auster, P. J. (2020). Megabenthic assemblages in the lower bathyal (700–3000 m) on the New England and Corner Rise Seamounts, Northwest Atlantic. Deep Res. Part I Oceanogr. Res. Pap. 165:103366. doi: 10.1016/j.dsr.2020.103366
Long, S., Sparrow-Scinocca, B., Blicher, M. E., Hammeken Arboe, N., Fuhrmann, M., Kemp, K. M., et al. (2020). Identification of a soft coral garden candidate vulnerable marine ecosystem (VME) using video imagery, Davis strait, west Greenland. Front. Mar. Sci. 7:460. doi: 10.3389/fmars.2020.00460
Marouchos, A., Sherlock, M., Filisetti, A., and Williams, A. (2017). “Underwater imaging on self-contained tethered systems,” in Proceedings of the 2017 IEEE Oceans Anchorage, Anchorage, AK, 18–21.
Miatta, M., Bates, A. E., and Snelgrove, P. V. R. (2021). Incorporating biological traits into conservation strategies. Annu. Rev. Mar. Sci. 13, 421–443. doi: 10.1146/annurev-marine-032320-094121
MNF (2021). IN208_V06 - Seamount Coral Survey 2018. Available online at: https://mnf.csiro.au/en/Voyages/IN2018_V06 (accessed June 1, 2021).
Morato, T., Pham, C. K., Pinto, C., Golding, N., Ardron, J. A., Durán Muñoz, P., et al. (2018). A multi criteria assessment method for identifying vulnerable marine ecosystems in the North-East Atlantic. Front. Mar. Sci. 5:460. doi: 10.3389/fmars.2018.00460
Parker, S. J., Penney, A. J., and Clark, M. R. (2009). Detection criteria for managing trawl impacts on vulnerable marine ecosystems in high seas fisheries of the South Pacific Ocean. Mar. Ecol. Prog. Ser. 397, 309–317. doi: 10.3354/meps08115
Pillay, T., Cawthra, H. C., Lombard, A. T., and Sink, K. (2021). Benthic habitat mapping from a machine learning perspective on the Cape St Francis inner shelf, Eastern Cape, South Africa. Mar. Geol. 440:106595. doi: 10.1016/j.margeo.2021.106595
Salinas-de-León, P., Marti-Puig, P., Buglass, S., Arnes-Urgelles, C., Rastoin-Laplane, E., Creemers, M., et al. (2020). Characterization of deep-sea benthic invertebrate megafauna of the Galapagos Islands. Sci. Rep. 10:1 3894.
Schlining, B., and Jacobsen Stout, N. (2006). “MBARI’s video annotation and reference system,” in Proceedings of the Marine Technology Society/Institute of Electrical and Electronics Engineers Oceans Conference, Boston, MA, 1–5.
Schoening, T., Osterloff, J., and Nattkemper, T. W. (2016). RecoMIA—recommendations for marine image annotation: lessons learned and future directions. Front. Mar. Sci. 3:59. doi: 10.3389/fmars.2016.00059
SeaGIS (2020). Available online at: https://www.seagis.com.au/index.html#about (accessed June 1, 2021).
Tanner, J. E., Althaus, F., Sorokin, S. J., and Williams, A. (2018). Benthic biogeographic patterns in the southern Australian deep sea: Do historical museum records accord with recent systematic, but spatially limited, survey data? Ecol. Evol. 8, 11423–11433. doi: 10.1002/ece3.4565
Thresher, R., Althaus, F., Adkins, J., Gowlett-Holmes, K., Alderslade, P., Dowdney, J., et al. (2014). Strong depth-related zonation of megabenthos on a rocky continental margin (approximately 700-4000 m) off southern Tasmania, Australia PLoS One 9:e85872. doi: 10.1371/journal.pone.0085872
Williams, A., Althaus, F., Green, M., Maguire, K., Untiedt, C., Mortimer, N., et al. (2020a). True Size matters for conservation: a robust method to determine the size of deep-sea coral reefs on seamounts in the Southwest Pacific ocean. Front. Mar. Sci. 7:187. doi: 10.3389/fmars.2020.00187
Williams, A., Althaus, F., Maguire, K., Green, M., Untiedt, C., Alderslade, P., et al. (2020b). The fate of deep-sea coral reefs on seamounts in a fishery-seascape: What are the impacts, what remains, and what is protected? Front. Mar. Sci. 7:567002. doi: 10.3389/fmars.2020.567002
Williams, A., Althaus, F., and Schlacher, T. A. (2015). Towed camera imagery and benthic sled catches provide different views of seamount benthic diversity. Limnol. Oceanogr. Methods 13, 62–73.
Williams, A., Schlacher, T. A., Rowden, A. A., Althaus, F., Clark, M. R., Bowden, D. A., et al. (2010). Seamount megabenthic assemblages fail to recover from trawling impacts. Mar. Ecol. 31, 183–199. doi: 10.1111/j.1439-0485.2010.00385.x
Keywords: benthic habitats, seamounts, vulnerable marine ecosystems, biodiversity, towed camera, morphospecies, image annotation
Citation: Untiedt CB, Williams A, Althaus F, Alderslade P and Clark MR (2021) Identifying Black Corals and Octocorals From Deep-Sea Imagery for Ecological Assessments: Trade-Offs Between Morphology and Taxonomy. Front. Mar. Sci. 8:722839. doi: 10.3389/fmars.2021.722839
Received: 09 June 2021; Accepted: 28 September 2021;
Published: 16 November 2021.
Edited by:
Chiara Romano, Spanish National Research Council (CSIC), SpainReviewed by:
Jorge Paramo, University of Magdalena, ColombiaLes Watling, University of Hawai’i at Mānoa, United States
Copyright © 2021 Untiedt, Williams, Althaus, Alderslade and Clark. This is an open-access article distributed under the terms of the Creative Commons Attribution License (CC BY). The use, distribution or reproduction in other forums is permitted, provided the original author(s) and the copyright owner(s) are credited and that the original publication in this journal is cited, in accordance with accepted academic practice. No use, distribution or reproduction is permitted which does not comply with these terms.
*Correspondence: Candice B. Untiedt, Y2FuZGljZS51bnRpZWR0QGNzaXJvLmF1