 Erick Barrera-Falcon
 Rodolfo Rioja-Nieto
 Roberto C. Hernández-Landa
 Edgar Torres-Irineo
- 1Posgrado en Ciencias del Mar y Limnología, Universidad Nacional Autónoma de México, Mérida, Mexico
- 2Laboratorio de Análisis Espacial de Zonas Costeras (COSTALAB), Unidad Multidisciplinaria de Docencia e Investigación-Sisal, Facultad de Ciencias, Universidad Nacional Autónoma de México, Mérida, Mexico
- 3Escuela Nacional de Estudios Superiores, Unidad Mérida, Universidad Nacional Autónoma de México, Mérida, Mexico
The precise assessing and monitoring of coral reefs are necessary to address and understand the threats and changes in coral communities. With the development of new technologies and algorithms for image processing, new protocols like underwater photogrammetry are implemented to study these ecosystems. This study compares the main ecological metrics for reef condition assessment, obtained with an underwater digital photogrammetry protocol (UWP) and traditional sampling design simulations in coral reefs of the Cozumel Reefs National Park. Three orthomosaics (380 m2) per reef on six fringing reefs were constructed, and the hard coral community characterized using a Geographic Information System (GIS). The orthomosaics were also used as a basis to simulate transect lines and obtain data on the hard coral community according to the video transect (VT) protocol, point intercept (PIT) protocol, and the Atlantic and Gulf Rapid Reef Assessment (AGRRA) protocol. Higher colony abundance, species richness, and lower coral cover estimates (p < 0.05) were obtained with the UWP. This protocol was also sensitive to small sized species. All the sampling designs showed similar capability to identify dominant species in terms of colony abundance and coral cover. The VT, PIT, and AGGRA showed similar coral cover values (p > 0.05), which seems to indicate that these sampling designs overestimate this important metric. Our results will help to understand and integrate the observations obtained with UWP with long-term data obtained with commonly used monitoring protocols in the Caribbean region.
1. Introduction
The depletion of coral reefs and the rapid loss of living coral tissue are a consequence of a synergy of disturbances of human and natural origin, and effects related to climate change (Jackson et al., 2001; Hughes et al., 2003, 2018; Pandolfi et al., 2003; Steffen et al., 2011). Since the early 1990s, several systematic visual surveys have been used throughout the Caribbean and other regions, for the evaluation and monitoring of coral reef ecosystems (English S, 1997; Hill and Wilkinson, 2004). Widely used protocols in the Caribbean include the line intercept transect protocol (LIT), point intercept transect (PIT) protocol, Caribbean coastal marine productivity (CARICOMP) protocol, and Atlantic and Gulf Reef Rapid Reef Assessment (AGRRA) protocol (http://www.agrra.org/), Reef Check (http://www.reefcheck.org), among others (for details see English S, 1997; Kjerfve, 1998; Hill and Wilkinson, 2004; Lang et al., 2010; Jokiel et al., 2015). These protocols are based on the counting of points having as sampling unit line-transects, which were previously established by Loya (1972) and Porter (1972). Quadrants and images obtained by means of underwater photography or video were later incorporated, and are also commonly used to estimate relative percentages of cover of reef benthic organisms and other key ecological attributes such as species richness and colony abundance (Aronson et al., 1994; English S, 1997; Kjerfve, 1998; Hill and Wilkinson, 2004; Lang et al., 2010; Jokiel et al., 2015).
The choice of monitoring protocol depends on different characteristics. Main drivers might be related to the socialization of the protocol (training availability and experience of surveyors), needs for data standardization between regions, and objectives of the monitoring program and availability of financial resources. The time required for acquisition and data processing may also influence which protocol is most appropriate (Wilkinson et al., 2003; Brown et al., 2004). Therefore, coral reef researchers and managers are often faced with the challenge of obtaining data while maintaining a compromise between high accuracy, reproducibility, and statistical power, with low cost and time for analysis (Aronson et al., 1994).
Comparisons between PIT, AGRRA, and videotransect (VT) have been previously performed to assess their efficiency (Leujak and Ormond, 2007; Jokiel et al., 2015). The main findings indicate that the protocols based on visual surveys like, AGRRA and PIT, have low repeatability and high variability on benthic cover estimates, when compared to image-based protocols (Carleton and Done, 1995; Brown et al., 2004; Lam et al., 2006; Leujak and Ormond, 2007; Montilla et al., 2020). The use of VT has also shown to provide more accurate estimates on the benthic cover of organisms (Aronson et al., 1994; Leujak and Ormond, 2007; Jokiel et al., 2015). Image-based protocols also produce a permanent record, where species identification and other metrics are obtained under laboratory conditions (Page et al., 2016).
Underwater digital photogrammetry protocols (UWP) with different approaches have recently been used to address changes in the 3D structure associated with natural disturbances (Burns et al., 2015; Peck et al., 2021), assess patterns in the spatial distribution of reef-building corals (Edwards et al., 2017) and reef structural complexity (Burns et al., 2016; Price et al., 2019), and characterize the ecological structure and demographic characteristics of coral colonies (Capra et al., 2017; Edwards et al., 2017; Young et al., 2017; Bianchi, 2019; Lechene et al., 2019; Neyer et al., 2019; Bayley and Mogg, 2020; Burns et al., 2020; Hernández-Landa et al., 2020; Nocerino et al., 2020; Rossi et al., 2020). Results on comparisons between UWP and monitoring protocols to assess reefs characteristics obtained from sites in the Indian and Pacific ocean have been varied. Urbina-Barreto et al. (2021) showed that the LIT overestimates coral cover in comparison to UWP. However, Couch et al. (2021) observed a high consistency of data between UWP and field visual surveys. Considering the advantages and recent integration of underwater photogrammetry to monitor coral reefs, there is a clear need to compare its performance with commonly used protocols. For the Caribbean region, where several standard monitoring protocols are used to assess coral reefs, this has not yet been performed. In this study, we compare the difference in terms of community structure, coral cover, abundance, and species richness estimates, between UWP and simulations of the VT, PIT, and AGRRA sampling designs, using the insular reefs of Cozumel as a case study. These reefs have differences in terms of depth, coral cover, community structure, and structural complexity and can be considered as representative of coral reefs in the region.
2. Materials and Methods
The Cozumel Reefs National Park (CRNP) is located 16 km from the coast of Quintana Roo, México (Figure 1). The characteristic seascape of the CRNP is a mixture of fringing reefs, patch reefs, and mixed corals on hard calcareous substrate, with algal and seagrass beds, and mangrove areas (Rioja-Nieto et al., 2019). The shallow sublittoral slope tends to be narrow, with the most developed reefs found along the edge of the southwestern insular shelf (Muckelbauer, 1990).
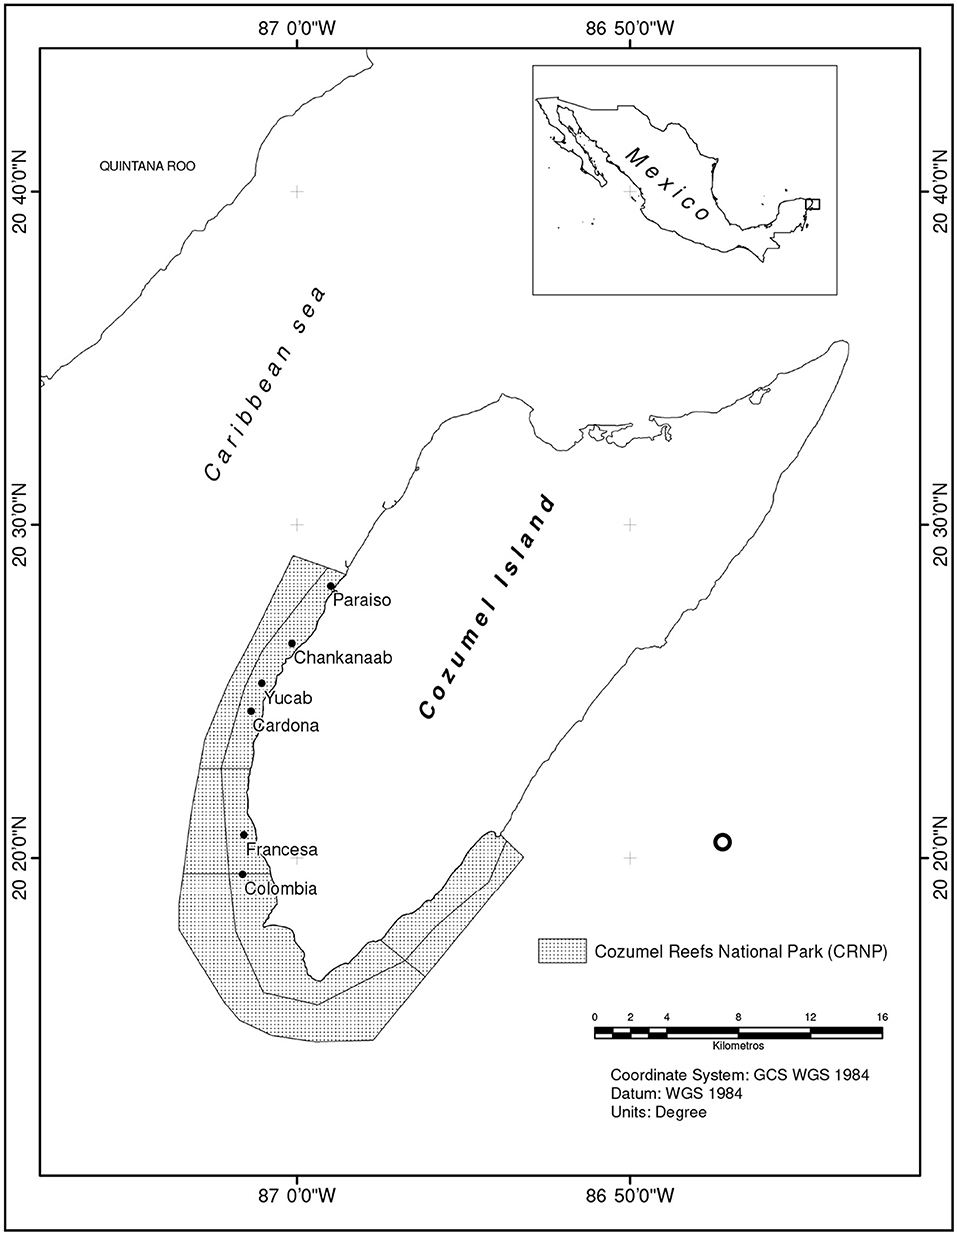
Figure 1. Location of six reefs within the Cozumel Reefs National Park, where comparisons between sampling designs were performed.
Six fringing reefs (6–14 m depth), distributed in a north to south gradient in terms of increasing reef structural complexity (Fenner, 1988; Muckelbauer, 1990), and abundance and live coral cover of dominant species (Hernández-Landa et al., 2020), were characterized using a UWP (Figure 1).
On each reef, photographs were obtained by divers along transects that followed the development of the reef (Table 1).

Table 1. Sampling protocols used for benthic communities, underwater digital photogrammetry (UWP), videotransect (VT), point intercept transect (PIT), and Atlantic and Gulf Rapid Reef Assessment (AGRRA).
The divers swam at a constant speed 2 m above the average depth of the reef, taking photographs with the self-timer setting of the camera to ensure a high overlap (>80%) across and along images. The obtained images were processed with Agisoft metashape (v. 1.5) to construct orthomosaics and obtain Digital Surface Models. Custom made quadrants of vinyl polychloride (PVC), measuring 0.6 m, were used as a scale constraint in order to get accurate measurements from coral colonies. Vector files based on the orthomosaics were constructed with ArcMap v.10.5 by digitizing all coral colonies with a size >5 cm [for further details, see Hernández-Landa et al. (2020), determined that for the CRNP re]. The coral species were identified using the Humann and DeLoach (2002) and Lang et al. (2010), identification guides.
The orthomosaics (three per reef measuring c.a 150 m2 each) were used as a basis for a surface analysis (UWP) and to simulate transects to obtain data on the hard coral community according to the VT, PIT, and AGRRA monitoring protocols (Table 1). For the UWP, a surface area of 380 m2 was delimited from the orthomosaics in each reef. This area of analysis is considered to be representative of >90% of the hard coral species richness in these same reefs (Hernández-Landa et al., 2020). The percentage of cover of each species, based on the digitized vector files described above, was estimated as the percentage of the total area surveyed that was covered by a hard coral species (Figure 2).
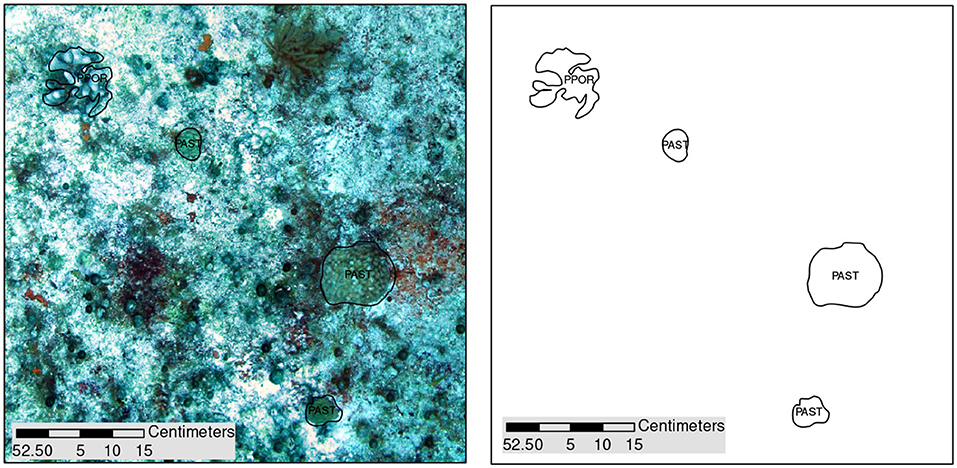
Figure 2. Stony corals from a high-resolution (1.3 mm/pixel) orthomosaic (left). The boundaries of each coral colony (right) were digitized and identified (Porites porites, PPOR; Porites astreoides, PAST), The benthic cover was estimated with the spatial information in each vector on the software Arcmap v.10.5. The code used is in accordance with the AGRRA protocol (see https://www.agrra.org/training-tools/coral-training/).
For the VT, two transects (six per reef) on each orthomosaic (0.6 × 29.6 m) were randomly simulated. In order to sample 100 m2 (Aronson et al., 1994; Leujak and Ormond, 2007), frames were extracted every 0.63 m at a scale that ensured an area covering 60 × 60 cm per frame (Figure 3). Thirteen randomly distributed points were selected on each frame, and a spatial intersection function with the vector files was used to select coral colonies. The number of points analyzed per frame was chosen considering the average between the analyzed points reported by Aronson et al. (1994) and Leujak and Ormond (2007). The coral cover for each reef was estimated as the percentage of points that intersected with a coral species.
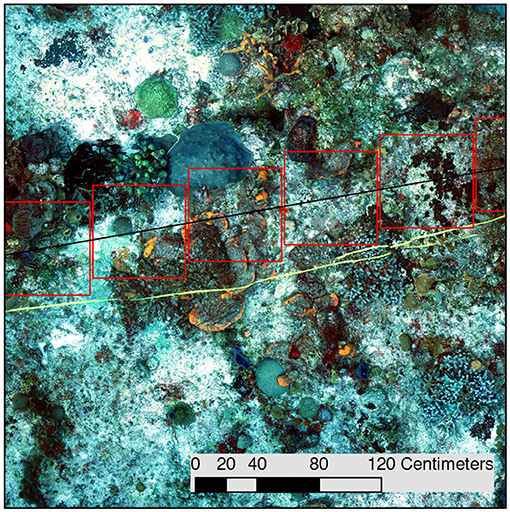
Figure 3. Example of a simulated video transect. The black line is a polyline resembling a transect over the orthomosaic. Each red box represents an extracted frame. The yellow line is the original transect.
In the PIT, three transects, 16.7 m long (one per orthomosaic), were randomly simulated to survey c.a. 50 m (Hill and Wilkinson, 2004) on each reef. The identity of the substrate intersected by the transect was recorded every 10 cm (Figure 4), and coral cover estimated as the percentage of points where a hard coral species was detected.
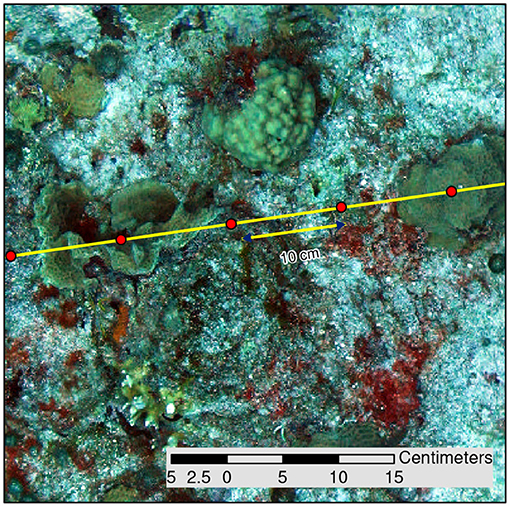
Figure 4. Simulated transect line, where the identity of the substrate was assessed every 10 cm.
In the case of AGRRA, six transects per reef (two per orthomosaic), with a 10 m length, were randomly simulated. Coral cover was estimated following the same procedure described for the PIT sampling design.
For all sampling designs, species richness and colony abundance were estimated as the number of species detected or colonies counted in the area (380 m2 for UWP) or points analyzed (3601 for VT, 500 for PIT, and 600 for AGRRA), considering the representative sample size published in the literature (Table 1). For the definition of colony, we followed Loya (1972), where a coral colony was considered a detached set of polyps interconnected by live tissue, regardless of neighboring colonies.
2.1. Data Analysis
The sampling techniques simulations were compared in terms of percentage of cover, species richness, and species abundance. Given the different characteristics in the coral community structure between reefs (Hernández-Landa et al., 2020), each reef was considered as a replica for the analysis.
Generalized linear models (GLM) were used to assess differences on percentage of cover and species richness among monitoring sampling designs. A Gamma and Poisson error distributions for coral cover and species richness, respectively, were assumed (Zuur et al., 2009). The species richness presented overdispersion; thus, SE were corrected using a quasi-GLM model (Zeileis and Hothorn, 2002; Hothorn et al., 2008; Zuur et al., 2009). The models were validated using standard residual diagnostics. A plot of residuals vs. fitted values was used for the assumption of homoscedasticity, and q-q plots of residuals were used to test the residual normality assumption. Species abundance estimates did not accomplish GLM assumptions. Therefore, a generalized estimating equation (GEE) approach was used to compare species abundance among monitoring sampling designs. GEE is similar to GLM but allows for the use of a correlation matrix structure that takes into account the lack of independence of each cluster (Yan, 2002; Yan and Fine, 2004; Halekoh et al., 2006; Zuur et al., 2009). The abundance estimates for each species from the monitoring sampling designs can violate the independence assumption, increasing the risk of type I error. Thus, they were compared among correlation structures (i.e., independence, exchangeable, and ar1) to consider correlation between abundance measures for the same cluster (i.e., each species). The correlation structure with the lowest value of correlation information criterion was the ar1. In all cases, a log link function, and a one-factor ANOVA (Zuur et al., 2009) were used. Community structure characteristics were considered as dependent variables, and the sampling designs were defined as factors. When a significant difference (p < 0.05) was observed, a Tukey HSD post-hoc multiple comparison test was used to identify differences among sampling techniques simulations (Bauer, 2000). All data were analyzed in R v3.6.1 (R Core Team, 2019).
To identify the species that contributed to 90% of the abundance and cover (dominant species) according to each sampling design, a SIMPER analysis (Clarke and Warwick, 2001), was performed with PRIMER v.7.
3. Results
3.1. Coral Colony Abundance
The average number of colonies observed was 2024 (UWP), 325 (VT), 62 (AGRRA), and 54 (PIT). The values obtained with each sampling design per reef are presented in Supplementary Table 1. The UWP recorded a significantly higher mean colony abundance than the other sampling designs (p < 0.001) (see Supplementary Table 2). VT recorded a higher mean colony abundance than AGRRA and PIT (p < 0.001). No significant differences (p > 0.05) were observed between AGRRA and PIT (Figure 5). The species Agaricia agaricites, Porites porites, and Siderestrae siderea were identified as those with the highest percentage of contribution to abundance in all the sampling designs (Table 2). However, important differences on the percentage of contribution between sampling designs can be observed. Porites astreoides was not detected as dominant by the VT but was identified in the other survey designs. Orbicella annularis was only identified by PIT, AGRRA, and VT. The UWP was the only protocol where the Eusmilia fastigiata was identified as a dominant species.
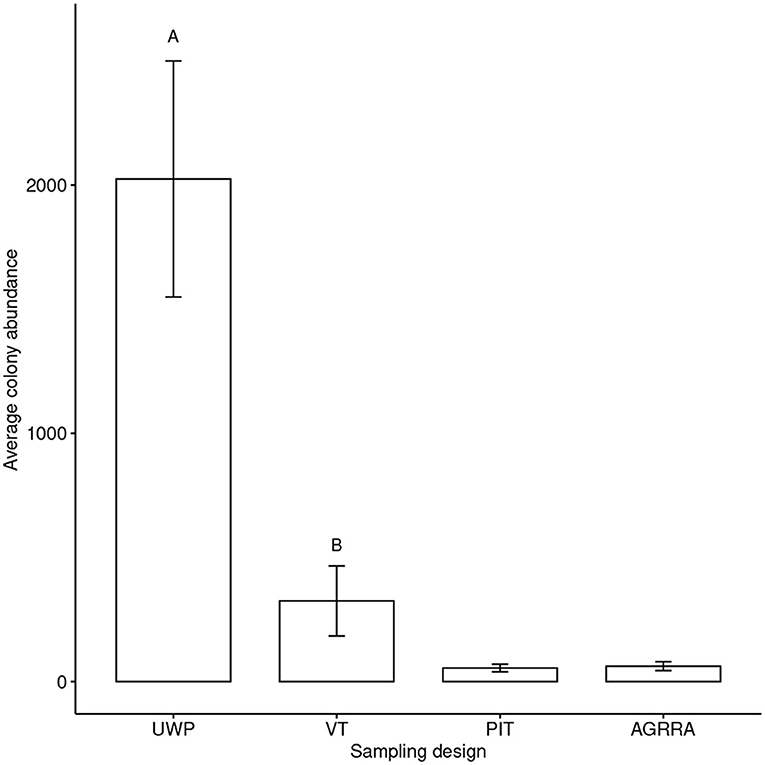
Figure 5. Average colony abundance (±SD) obtained with each sampling design. Underwater digital photogrammetry (UWP), videotransect (VT), point intercept transect (PIT), and Atlantic and Gulf Rapid Reef Assessment (AGRRA). Letters indicate the sampling designs where the average colony abundance had a significant difference (p < 0.001).
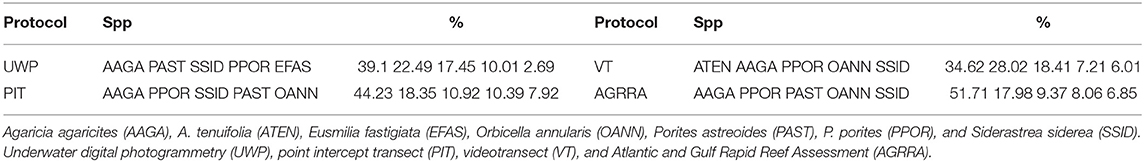
Table 2. Dominant species in terms of abundance, identified with a SIMPER analysis by each sampling design.
3.2. Coral Cover
The average percent of coral cover obtained was 6.02 (UWP), 8.86 (VT), 10.96 (PIT), and 10.38 (AGRRA). The values obtained with each sampling design per reef are presented in Supplementary Table 3. The UWP estimated a lower coral cover (p < 0.03) than the other sampling designs (Figure 6). No other significant differences were observed (p > 0.05; see Supplementary Table 4). Agaricia agaricities and Siderestrae siderea accounted for the majority of coral cover recorded across methods (Table 3). Differences in the species contribution are observed. Porites astreoides was considered dominant according to the UWP, PIT, and AGRRA. The species Agaricia tenuifolia is dominant for the UWP, VT, and AGRRA. UWP and AGGRA listed the same dominant species P. porites, S. siderea, and P. astreoides (Table 3).
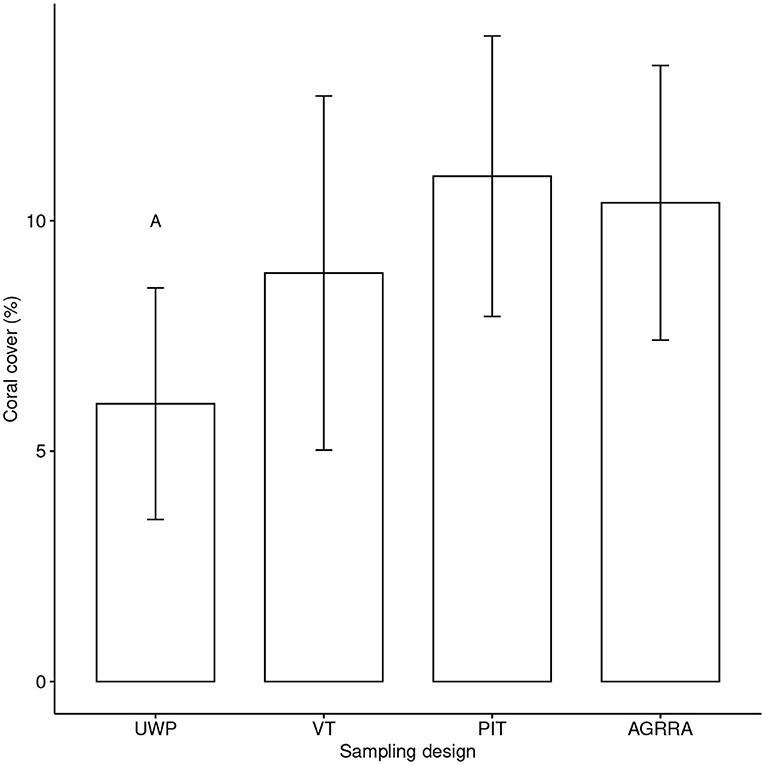
Figure 6. Average percentage of coral cover (±SD) estimated with each sampling design. Underwater digital photogrammetry (UWP), videotransect (VT), point intercept transect (PIT), and Atlantic and Gulf Rapid Reef Assessment (AGRRA). The letter indicates the sampling design where the percentage of coral cover was significantly different (p < 0.03).
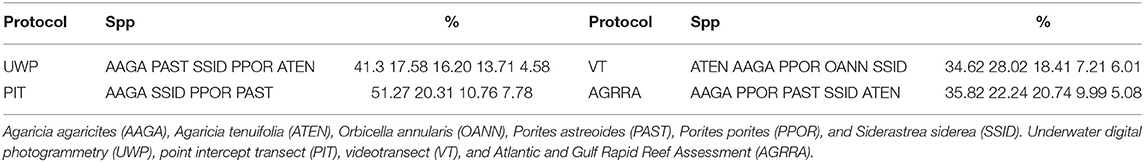
Table 3. Dominant species in terms of cover, identified with a SIMPER analysis by each sampling design, the order of appearance indicates the contribution to the total cover.
3.3. Species Richness
Considering all sampling designs, a total of 31 species were recorded (Table 4). The UWP detected more species (p < 0.001, Supplementary Table 5) than VT, PIT, and AGGRA (Figure 7). The species Dichocoenia stokessi, Solenastrea Bournoni, Scolymia sp., Isophyllia rigida, Colpophyllia natans, and Manicina areolata, were only detected by UWP (Table 4). With the exception of O. franksi and M. lamarckiana for species abundance, and A. tenuifolia, P. furcata, M. cavernosa, O. faveolata, and P. clivosa for coral cover, the observations obtained with UWP showed higher values for the species abundance and lower values for coral cover than the other sampling designs.
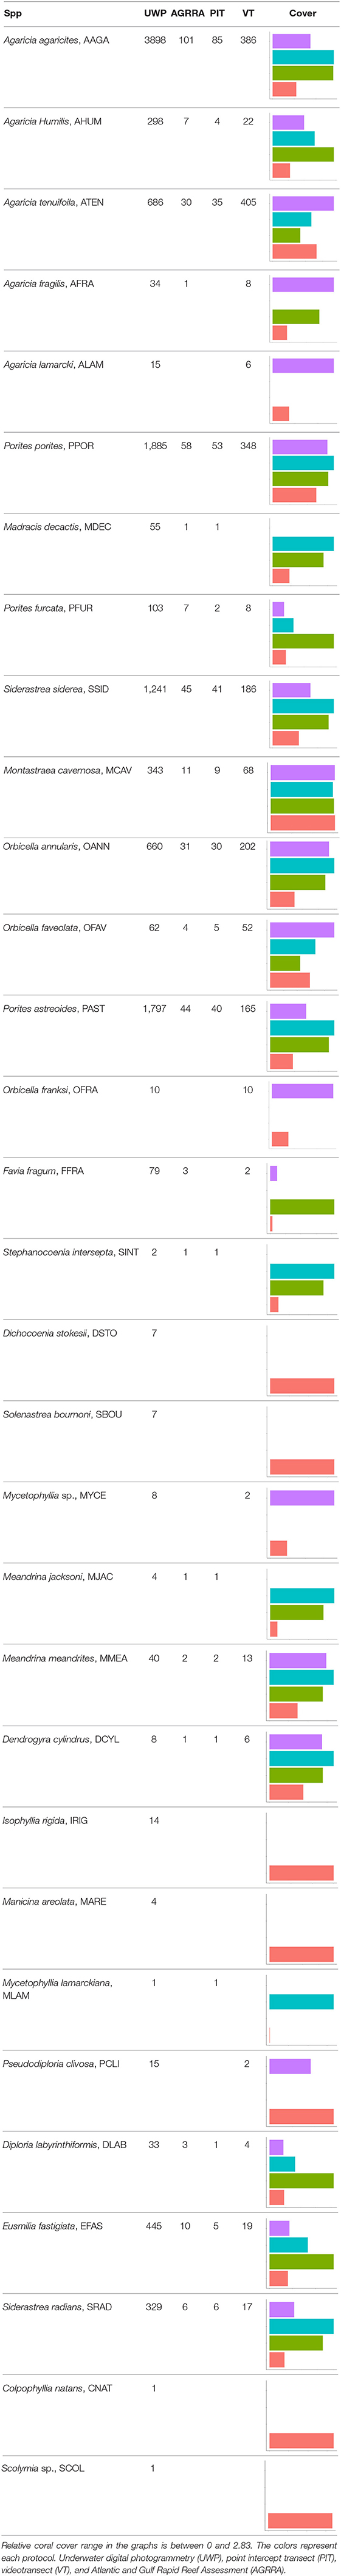
Table 4. Colony abundance for each of the species recorded by the sampling designs.
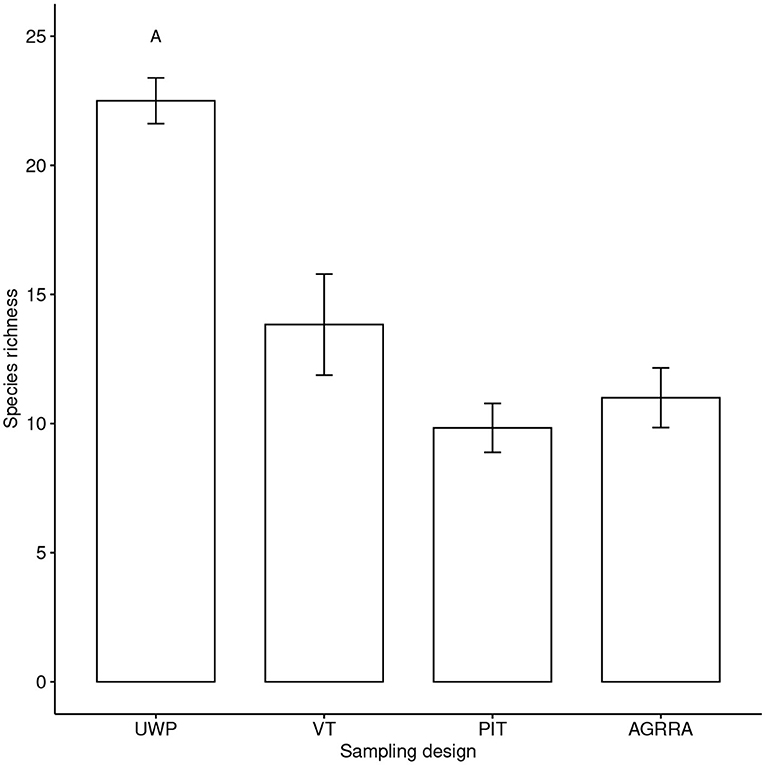
Figure 7. Average number of species (±SD) obtained with each sampling design. Underwater digital photogrammetry (UWP), videotransect (VT), point intercept transect (PIT), and Atlantic and Gulf Rapid Reef Assessment (AGRRA). UWP recorded the highest number of species. The letter indicates a significant difference (p < 0.001).
4. Discussion
Higher colony abundance, species richness, and lower coral cover estimates were obtained with the UWP. However, all the sampling designs showed a similar capability to identify dominant species in terms of colony abundance and coral cover. The VT, PIT, and AGRRA showed similar coral cover values, which seems to indicate that these commonly used protocols overestimate this metric. The reefs used for the analyses are distributed at different depths and have differences in structural complexity and community structure, representing reef characteristics observed in other regions of the Caribbean.
4.1. Coral Cover, Colony Abundance, and Species Richness
In terms of coral cover, our results are similar to the study of Urbina-Barreto et al. (2021), where underwater photogrammetry provided significantly lower estimates on coral cover than the line intercept protocol. The average percentage of coral cover obtained by the UWP (c.a. 6), is lower than those reported from visual surveys for reefs in Cozumel. Reyes-Bonilla et al. (2014), Barranco et al. (2016), and McField et al. (2018) have reported coral cover values of c.a. 11, 29, and 17%, respectively.
The standardization of underwater photogrammetry protocols needs to be considered. In a recent study, Couch et al. (2021) detected no differences on the estimation of coral cover and other metrics (e.g., species richness, adult colony density, and average colony diameter) between an underwater photogrammetry protocol and in water visual surveys. This seems to be related to the area of analysis used in that study (60 m2). It has been reported that this same surveyed area with photogrammetry only represents 55% of all benthic features (Lechene et al., 2019). Furthermore, Hernández-Landa et al. (2020), determined that for the CRNP reefs an area of c.a. 380 m2 is needed to obtain representative species richness data.
The species A. agaricites, P. porites, and S. siderea were identified in all cases as dominant and have been reported as typical of the Caribbean region (Reyes-Bonilla et al., 2014; Barranco et al., 2016; González-Barrios and Álvarez Filip, 2018). Other species such as P. astreoides and A. tenuifolia were also considered important in most of the sampling designs. For UWP, the species E. fastigiata was identified as dominant. This is an uncommon and small sized species (colonies about 20 cm in adult phase) (Veron J.E.N. and L.M., 2016; Horton et al., 2021), which suggests this sampling design to be sensitive to detect species with similar morphological characteristics and colony size. AGRRA, PIT, and VT are known to underestimate colonies that are too small or rare (Leujak and Ormond, 2007; Jokiel et al., 2015; Facon et al., 2016). VT was the only protocol that identified the massive species O. annularis as dominant in terms of cover. With big sized massive species, the area of the colonies can exceed the size of the evaluated frame. In this case, all the points distributed on the frame detect the same colony, but are assumed to belong to different ones (Bennett et al., 2016; Page et al., 2016). If these types of colonies are recurrent in the transect band, the proportions are prone to generate estimates that differ from the true values (Hill and Wilkinson, 2004). This can also occur with AGRRA and PIT when the diameter of the colonies exceeds c.a. 20 cm (Leujak and Ormond, 2007). For the UWP, it is important to consider local ecological characteristics, and maintain an homogeneous definition of a colony. The latter is particularly important, as an increase in the number of colonies could be related to partial colony mortality and the fission and fragmentation of colonies as a result of disturbance (Hughes and Jackson, 1980; Jaramillo González and Acosta, 2016).
The UWP recorded six uncommon species that were not detected by the other sampling designs. Five of these, D. stokesii, S. bournoni, M. areolata, Scolymia sp., and I. rigida, are small sized with adult colonies measuring c.a. 20 cm (Veron J.E.N. and L.M., 2016; Horton et al., 2021) C. natans is a massive species (Torruco et al., 2021). Considering the large area of analysis and the detailed colony digitization on the orthomosaics, the species richness based on the UWP is not affected by species traits such as colony size or abundance.
4.2. Comparisons Between Monitoring Protocols
Point Intercept Transect and AGRRA are suitable for coral reef characterization due to their ease of use and fast data availability (Carleton and Done, 1995; Hill and Wilkinson, 2004; Leujak and Ormond, 2007; Facon et al., 2016). Also, in sites with a high structural complexity (i.e., spurs and grooves), PIT performs better given the orthographic projection to a 2D that is needed for image-based protocols (Nadon and Stirling, 2006). However, these protocols need well-trained experienced divers for in situ species identification and data collection. The ecological characteristics of the sampling sites (e.g., sites with low coral coverage or high structural complexity) can also have an effect on the estimates based on the data obtained from these sampling designs. In sites with low coral cover, such as most of the sites sampled in here (and arguably in the Caribbean region), the obtained data tend to have low representativeness and be less accurate (Molloy et al., 2013). Furthermore, the contour effect of the colonies, where transect lines follow the edge of large coral colonies, can also affect data collection (Lam et al., 2006).
Video Transect is a cost-effective protocol that can reduce the economic costs of data acquisition for large areas vs. PIT and AGRRA (Aronson et al., 1994). This monitoring protocol has the necessary inputs to adopt a photogrammetric approach by applying small adjustments, and should be explored. Like UWP, VT generates a permanent record that can be later verified. However, the taxonomic identification on some benthic groups (e.g., macroalgae and sponges) can be limited by the images resolution (Aronson et al., 1994; Carleton and Done, 1995).
Underwater digital photogrammetry is a rapid survey protocol for large areas without the need for trained personnel in species identification (Chirayath and Instrella, 2019; Lechene et al., 2019; Price et al., 2019; Bayley and Mogg, 2020; Hernández-Landa et al., 2020). This protocol allows extracting not only cover and community metrics but also important demographic information on the size of the colonies and the spatial relationships in the benthic community (Edwards et al., 2017; Hernández-Landa et al., 2020). With the use of UWP, accurate 3D, and digital elevation models can also be produced. Furthermore, establishing permanent markers on the substrate can allow precise long-term monitoring of coral common (e.g., coral cover and species richness), and marginally explored characteristics (e.g., colony size variation and spatial distribution, changes in 3D metrics over depth, or disturbance gradients) of the reef community at large spatial scales. This will increase our understanding of the processes that shape coral reef communities. The image processing in UWP and subsequent data analysis can be time-consuming (2–3 months for a full time experienced person) or expensive to implement considering the need of specialized hardware and software. However, there are several options for the adoption of free or proprietary software (Leon et al., 2015; Lechene et al., 2019) and the use of affordable devices such as the Jetson Nano GPU NVIDIA (Barba-Guaman et al., 2020). For the data analysis, automated species identification and artificial intelligence are being developed (Chirayath and Instrella, 2019; Pavoni et al., 2020; Yuval et al., 2021) and may reduce the time needed to obtain valuable information.
Underwater photogrammetry protocols are increasingly being used to assess coral reefs. To our knowledge, at least six studies using underwater photogrammetry for coral reef monitoring have been published. The protocols mainly differ in the area sampled for analysis, ranging from 60 to 1,655 m2, but are similar in image acquisition procedure, cameras utilized, image processing algorithms, fieldwork environmental conditions during data collection (clear water, shallow sites), use of internal control points, and the colony data processing (Palma et al., 2017, 2019; Lechene et al., 2019; Hernández-Landa et al., 2020; Couch et al., 2021; Urbina-Barreto et al., 2021). UWP relies on the surface analysis of the benthic substrate, and obtained metrics seem to be biased by the area considered. More studies are needed to determine the representative sampling area for photogrammetric analysis in the different regions where coral reefs distribute. This will ensure that direct comparisons in different regions, can be made between long-term monitoring programs. Our results also suggest that commonly used monitoring protocols in the Caribbean are overestimating coral cover, and underestimating species richness and colony abundance with the “standardized” sampling effort, and this needs to be further explored. Finally, it is important to consider that the data obtained for the VT, PIT, and AGGRA protocols presented in here were not obtained under field conditions. Therefore, circumstances that can have an impact on the quality of the data acquired with these sampling designs such as current effects, availability of time to conduct the surveys, and in situ species identification, among others, are not considered.
Data Availability Statement
The original contributions presented in the study are included in the article/Supplementary Material, further inquiries can be directed to the corresponding author.
Author Contributions
EB-F, RR-N, and RH-L: conceptualization, methodology, validation, writing—review and editing, and writing—original draft preparation. EB-F, RR-N, and ET-I: formal analysis. EB-F: investigation, visualization, and software. RR-N: supervision, project administration, resources, and funding acquisition. All authors have read and agreed to the published version of the manuscript.
Funding
This research was funded by the PAPIIT grant (IN218219) from the National Autonomous University of Mexico supported this work. EB-F was supported by a CONACYT postgraduate scholarship. RH-L was funded by a postdoctoral scholarship awarded by the Programa de Becas Posdoctorales Convocatoria 2017, UNAM-DGAPA.
Conflict of Interest
The authors declare that the research was conducted in the absence of any commercial or financial relationships that could be construed as a potential conflict of interest.
Publisher's Note
All claims expressed in this article are solely those of the authors and do not necessarily represent those of their affiliated organizations, or those of the publisher, the editors and the reviewers. Any product that may be evaluated in this article, or claim that may be made by its manufacturer, is not guaranteed or endorsed by the publisher.
Acknowledgments
The authors would like to thank M. C. Carlos Cruz Vázquez and the CRNP staff for field work assistance.
Supplementary Material
The Supplementary Material for this article can be found online at: https://www.frontiersin.org/articles/10.3389/fmars.2021.722569/full#supplementary-material
References
Aronson, R. B., Edmunds, J. P., Precht, F. W., Swanson, W. D., and Levitan, R. D. (1994). Large-scale, long-term monitoring of caribbean coral reefs: simple, quick, inexpensive techniques. Atoll Res. Bull. 421, 1–19. doi: 10.5479/si.00775630.421.1
Barba-Guaman, L., Eugenio Naranjo, J., and Ortiz, A. (2020). Deep learning framework for vehicle and pedestrian detection in rural roads on an embedded GPU. Electronics 9:589. doi: 10.3390/electronics9040589
Barranco, L., Carriquiry, J., Rodriguez Zaragoza, F., Cupul-Magaña, A., Villaescusa, J., and Calderon-Aguilera, L. (2016). Spatiotemporal variations of live coral cover in the northern Mesoamerican reef system, Yucatan peninsula, Mexico. Sci. Mar. 80, 143–150. doi: 10.3989/scimar.04294.23A
Bauer, P. (2000). Multiple comparisons- theory and methods. Stat. Med. 19:1951. doi: 10.1002/1097-0258(20000730)19:14 <1951::AID-SIM471>3.0.CO;2-W
Bayley, D. T. I., and Mogg, A. O. M. (2020). A protocol for the large-scale analysis of reefs using structure from motion photogrammetry. Methods Ecol. Evol. 11, 1410–1420. doi: 10.1111/2041-210X.13476
Bennett, K., Wilson, S. K., Shedrawi, G., McLean, D. L., and Langlois, T. J. (2016). Can diver operated stereo-video surveys for fish be used to collect meaningful data on benthic coral reef communities? Limnol. Oceanogr. 14, 874–885. doi: 10.1002/lom3.10141
Bianchi, C. N. (2019). “2019 IWMS 2D photogrammetry Maldives,” in Conference: 2019 IMEKO TC-19 International Workshop on Metrology for the Sea Genoa (Genova).
Brown, E., Cox, E., Jokiel, P., Rodgers, K., Smith, W., Tissot, B., et al. (2004). Development of benthic sampling methods for the coral reef assessment and monitoring program (cramp) in Hawai'i. Pac. Sci. 58, 145–158. doi: 10.1353/psc.2004.0013
Burns, J. H. R., Delparte, D., Gates, R. D., and Takabayashi, M. (2015). Integrating structure-from-motion photogrammetry with geospatial software as a novel technique for quantifying 3d ecological characteristics of coral reefs. PeerJ 3:e1077. doi: 10.7717/peerj.1077
Burns, J. H. R., Delparte, D., Kapono, L., Belt, M., Gates, R. D., and Takabayashi, M. (2016). Assessing the impact of acute disturbances on the structure and composition of a coral community using innovative 3d reconstruction techniques. Methods Oceanogr. 15–16, 49–59. doi: 10.1016/j.mio.2016.04.001
Burns, J. H. R., Weyenberg, G., Mandel, T., Ferreira, S. B., Gotshalk, D., Kinoshita, C. K., et al. (2020). A comparison of the diagnostic accuracy of in-situ and digital image-based assessments of coral health and disease. Front. Mar. Sci. 7:304. doi: 10.3389/fmars.2020.00304
Capra, A., Castagnetti, C., Dubbini, M., Gruen, A., Guo, T., Mancini, F. T., et al. (2017). “High accuracy underwater photogrammetric surveying,” in 3rd IMEKO International Conference on Metrology for Archeology and Cultural Heritage (Lecce).
Carleton, J. H., and Done, T. J. (1995). Quantitative video sampling of coral reef benthos: large-scale application. Coral Reefs 14, 35–46. doi: 10.1007/BF00304070
Chirayath, V., and Instrella, R. (2019). Fluid lensing and machine learning for centimeter-resolution airborne assessment of coral reefs in American Samoa. Remote Sens. Environ. 235:111475. doi: 10.1016/j.rse.2019.111475
Clarke, K., and Warwick, R. (2001). Clarke KR, Warwick RM.Change in Marine Communities: An Approach to Statistical Analysis and Interpretation. Plymouth: Primer-E Ltd.
Couch, C. S., Oliver, T. A., Suka, R., Lamirand, M., Asbury, M., Amir, C., et al. (2021). Comparing coral colony surveys from in-water observations and structure-from-motion imagery shows low methodological bias. Front. Mar. Sci. 8:622. doi: 10.3389/fmars.2021.647943
Edwards, C. B., Eynaud, Y., Williams, G. J., Pedersen, N. E., Zgliczynski, B. J., Gleason, A. C. R., et al. (2017). Large-area imaging reveals biologically driven non-random spatial patterns of corals at a remote reef. Coral Reefs 36, 1291–1305. doi: 10.1007/s00338-017-1624-3
English, S., Wilkinson, C., and Baker, V. (1997). Survey Manual for Tropical Marine Resources. Townsville, QLD: Australian Institute of Marine Science.
Facon, M., Pinault, M., Obura, D., Pioch, S., Pothin, K., Bigot, L., et al. (2016). A comparative study of the accuracy and effectiveness of line and point intercept transect methods for coral reef monitoring in the southwestern Indian ocean islands. Ecol. Indic. 60, 1045–1055. doi: 10.1016/j.ecolind.2015.09.005
Fenner, D. P. (1988). Some leeward reefs and corals of Cozumel, Mexico. Bull. Mar. Sci. 42, 133–144.
González-Barrios, F. J., and Álvarez Filip, L. (2018). A framework for measuring coral species-specific contribution to reef functioning in the Caribbean. Ecol. Indic. 95, 877–886. doi: 10.1016/j.ecolind.2018.08.038
Halekoh, U., Højsgaard, S., and Yan, J. (2006). The R package geepack for generalized estimating equations. J. Stat. Softw. 15/2, 1–11. doi: 10.18637/jss.v015.i02
Hernández-Landa, R. C., Barrera-Falcon, E., and Rioja-Nieto, R. (2020). Size-frequency distribution of coral assemblages in insular shallow reefs of the Mexican Caribbean using underwater photogrammetry. PeerJ 8:e8957. doi: 10.7717/peerj.8957
Hill, J., and Wilkinson, C. (2004). Methods for Ecological Monitoring of Coral Reefs. Townville, QLD: Australian Institute of Marine Science.
Horton, T., Kroh, A., Ahyong, S., Bailly, N., Boyko, C., Brandão, S., et al. (2021). World Register of Marine Species (Worms). Available online at: https://www.marinespecies.org (accessed August 13, 2021).
Hothorn, T., Bretz, F., and Westfall, P. (2008). Simultaneous inference in general parametric models. Biometr. J. 50, 346–363. doi: 10.1002/bimj.200810425
Hughes, T. P., Anderson, K. D., Connolly, S. R., Heron, S. F., Kerry, J. T., Lough, J. M., et al. (2018). Spatial and temporal patterns of mass bleaching of corals in the anthropocene. Science 359:80. doi: 10.1126/science.aan8048
Hughes, T. P., Baird, A. H., Bellwood, D. R., Card, M., Connolly, S. R., Folke, C., et al. (2003). Climate change, human impacts, and the resilience of coral reefs. Science 301:929. doi: 10.1126/science.1085046
Hughes, T. P., and Jackson, J. B. C. (1980). Do corals lie about their age? Some demographic consequences of partial mortality, fission, and fusion. Science 209:713. doi: 10.1126/science.209.4457.713
Humann, P., and DeLoach, N. (2002). Reef Creature Identification: Florida, Caribbean, Bahamas. Jacksonville, FL: New World Publications.
Jackson, J. B. C., Kirby, M. X., Berger, W. H., Bjorndal, K. A., Botsford, L. W., Bourque, B. J., et al. (2001). Historical overfishing and the recent collapse of coastal ecosystems. Science 293:629. doi: 10.1126/science.1059199
Jaramillo González, J., and Acosta, A. (2016). Comparación temporal en la estructura de una comunidad coralina en primeros estados de sucesión, isla de san andrés, Colombia. Boletén de Invest. Mar. Costeras 38, 29–53. doi: 10.25268/bimc.invemar.2009.38.2.170
Jokiel, P. L., Rodgers, K. S., Brown, E. K., Kenyon, J. C., Aeby, G., Smith, W. R., et al. (2015). Comparison of methods used to estimate coral cover in the Hawaiian Islands. PeerJ 3:e954. doi: 10.7717/peerj.954
Lam, K., Shin, P. K. S., Bradbeer, R., Randall, D., Ku, K. K. K., Hodgson, P., et al. (2006). A comparison of video and point intercept transect methods for monitoring subtropical coral communities. J. Exp. Mar. Biol. Ecol. 333, 115–128. doi: 10.1016/j.jembe.2005.12.009
Lang, J., Marks, K., Kramer, P., Kramer, P., and Ginsburg, R. (2010). Agrra protocols version 5.4. ReVision (Miami, FL).
Lechene, M. A., Haberstroh, A. J., Byrne, M., Figueira, W., and Ferrari, R. (2019). Optimising sampling strategies in coral reefs using large-area mosaics. Remote Sens. 11:2907. doi: 10.3390/rs11242907
Leon, J. X., Roelfsema, C. M., Saunders, M. I., and Phinn, S. R. (2015). Measuring coral reef terrain roughness using “structure-from-motion” close-range photogrammetry. Geomorphology 242, 21–28. doi: 10.1016/j.geomorph.2015.01.030
Leujak, W., and Ormond, R. F. G. (2007). Comparative accuracy and efficiency of six coral community survey methods. J. Exp. Mar. Biol. Ecol. 351, 168–187. doi: 10.1016/j.jembe.2007.06.028
Loya, Y. (1972). Community structure and species diversity of hermatypic corals at eilat, red sea. Mar. Biol. 13, 100–123. doi: 10.1007/BF00366561
McField, M., Kramer, P., Alvarez-Filip, L., Drysdale, I., Flores, M., Petersen, A., et al. (2018). 2018 Mesoamerican Reef Report Card (Washington, DC). doi: 10.13140/RG.2.2.19679.36005
Molloy, P. P., Evanson, M., Nellas, A. C., Rist, J. L., Marcus, J. E., Koldewey, H. J., et al. (2013). How much sampling does it take to detect trends in coral-reef habitat using photoquadrat surveys? Aquat. Conserv. 23, 820–837. doi: 10.1002/aqc.2372
Montilla, L. M., Miyazawa, E., Ascanio, A., López-Hernández, M., Mariño-Briceño, G., Rebolledo-Sánchez, Z., et al. (2020). The use of pseudo-multivariate standard error to improve the sampling design of coral monitoring programs. PeerJ 2020:e8429. doi: 10.7717/peerj.8429
Muckelbauer, G. (1990). The shelf of cozumel, mexico: topography and organisms. Facies 23, 185–200. doi: 10.1007/BF02536713
Nadon, M.-O., and Stirling, G. (2006). Field and simulation analyses of visual methods for sampling coral cover. Coral Reefs 25, 177–185. doi: 10.1007/s00338-005-0074-5
Neyer, F., Nocerino, E., and Gruen, A. (2019). Image quality improvements in low-cost underwater photogrammetry. Int. Arch. Photogramm. Remote Sens. Spatial Inf. Sci. XLII-2/W10, 135–142. doi: 10.5194/isprs-archives-XLII-2-W10-135-2019
Nocerino, E., Menna, F., Gruen, A., Troyer, M., Capra, A., Castagnetti, C., et al. (2020). Coral reef monitoring by scuba divers using underwater photogrammetry and geodetic surveying. Remote Sens. 12:3036. doi: 10.3390/rs12183036
Page, C. A., Field, S. N., Pollock, F. J., Lamb, J. B., Shedrawi, G., and Wilson, S. K. (2016). Assessing coral health and disease from digital photographs and in situ surveys. Environ. Monitor. Assess. 189:18. doi: 10.1007/s10661-016-5743-z
Palma, M., Magliozzi, C., Rivas Casado, M., Pantaleo, U., Fernandes, J., Coro, G., et al. (2019). Quantifying coral reef composition of recreational diving sites: a structure from motion approach at seascape scale. Remote Sens. 11:3027. doi: 10.3390/rs11243027
Palma, M., Rivas Casado, M., Pantaleo, U., and Cerrano, C. (2017). High resolution orthomosaics of African coral reefs: a tool for wide-scale benthic monitoring. Remote Sens. 9:705. doi: 10.3390/rs9070705
Pandolfi, J. M., Bradbury, R. H., Sala, E., Hughes, T. P., Bjorndal, K. A., Cooke, R. G., et al. (2003). Global trajectories of the long-term decline of coral reef ecosystems. Science 301:955. doi: 10.1126/science.1085706
Pavoni, G., Corsini, M., Callieri, M., Fiameni, G., Edwards, C., and Cignoni, P. (2020). On improving the training of models for the semantic segmentation of benthic communities from orthographic imagery. Remote Sens. 12:3106. doi: 10.3390/rs12183106
Peck, M., Tapilatu, R. F., Kurniati, E., and Rosado, C. (2021). Rapid coral reef assessment using 3d modelling and acoustics: acoustic indices correlate to fish abundance, diversity and environmental indicators in west Papua, Indonesia. PeerJ 9:e10761. doi: 10.7717/peerj.10761
Porter, J. W. (1972). Patterns of species diversity in Caribbean reef corals. Ecology 53, 745–748. doi: 10.2307/1934796
Price, D. M., Robert, K., Callaway, A., Lo lacono, C., Hall, R. A., and Huvenne, V. A. I. (2019). Using 3d photogrammetry from ROV video to quantify cold-water coral reef structural complexity and investigate its influence on biodiversity and community assemblage. Coral Reefs 38, 1007–1021. doi: 10.1007/s00338-019-01827-3
R Core Team (2019). R: A Language and Environment for Statistical Computing. Vienna: R Foundation for Statistical Computing.
Reyes-Bonilla, H., Millet, E., and Alvarez-Filip, L. (2014). Community structure of scleractinian corals outside protected areas in Cozumel Island, Mexico. Atoll Res. Bull. 601, 1–16. doi: 10.5479/si.00775630.601
Rioja-Nieto, R., Garza-Pérez, R., Álvarez Filip, L., Ismael, M.-T., and Cecilia, E. (2019). “Chapter 27 - The Mexican Caribbean: from Xcalak to holbox,” in World Seas: An Environmental Evaluation, 2nd Edn. ed C. Sheppard (London: Academic Press), 637–653. doi: 10.1016/B978-0-12-805068-2.00033-4
Rossi, P., Castagnetti, C., Capra, A., Brooks, A. J., and Mancini, F. (2020). Detecting change in coral reef 3d structure using underwater photogrammetry: critical issues and performance metrics. Appl. Geomat. 12, 3–17. doi: 10.1007/s12518-019-00263-w
Steffen, W., Persson, A., Deutsch, L., Zalasiewicz, J., Williams, M., Richardson, K., et al. (2011). The anthropocene: from global change to planetary stewardship. AMBIO 40:739. doi: 10.1007/s13280-011-0185-x
Torruco, D., González-Solis, A., and Torruco-González, A. D. (2021). Large-scale and long-term distribution of corals in the Gulf of Mexico and Caribbean sea of Mexico and adjacent areas: corals distribution in Mexico and adjacent areas. Region. Stud. Mar. Sci. 44:101764. doi: 10.1016/j.rsma.2021.101764
Urbina-Barreto, I., Garnier, R., Elise, S., Pinel, R., Dumas, P., Mahamadaly, V., et al. (2021). Which method for which purpose? A comparison of line intercept transect and underwater photogrammetry methods for coral reef surveys. Front. Mar. Sci. 8:577. doi: 10.3389/fmars.2021.636902
Veron J.E.N Stafford-Smith M.G T. E. L.M D. (2016). Corals of the World. Available online at: http://www.coralsoftheworld.org/species_factsheets/ (accessed May 1, 2021).
Wilkinson, C. R., Green, A., Almany, J., and Dionne, S. (2003). Monitoring Coral Reef Marine Protected Areas: A Practical Guide on How Monitoring Can Support Effective Management of MPAs (Townsville, AU). Available online at: https://repository.library.noaa.gov/view/noaa/10859
Yan, J. (2002). Geepack: Yet another package for generalized estimating equations. R-News. 2/3, 12–14.
Yan, J., and Fine, J. P. (2004). Estimating equations for association structures. Stat. Med. 23, 859–880. doi: 10.1002/sim.1650
Young, G. C., Dey, S., Rogers, A. D., and Exton, D. (2017). Cost and time-effective method for multi-scale measures of rugosity, fractal dimension, and vector dispersion from coral reef 3d models. PLoS ONE 12:e0175341. doi: 10.1371/journal.pone.0175341
Yuval, M., Alonso, I., Eyal, G., Tchernov, D., Loya, Y., Murillo, A. C., et al. (2021). Repeatable semantic reef-mapping through photogrammetry and label-augmentation. Remote Sens. 13:659. doi: 10.3390/rs13040659
Zeileis, A., and Hothorn, T. (2002). Diagnostic checking in regression relationships. R News 2, 7–10. Available online at: https://www.r-project.org/doc/Rnews/Rnews_2002-3.pdf
Keywords: underwater photogrammetry, coral reef monitoring, standard monitoring protocols, ecological metrics, coral cover
Citation: Barrera-Falcon E, Rioja-Nieto R, Hernández-Landa RC and Torres-Irineo E (2021) Comparison of Standard Caribbean Coral Reef Monitoring Protocols and Underwater Digital Photogrammetry to Characterize Hard Coral Species Composition, Abundance and Cover. Front. Mar. Sci. 8:722569. doi: 10.3389/fmars.2021.722569
Received: 09 June 2021; Accepted: 06 September 2021;
Published: 14 October 2021.
Edited by:
James Davis Reimer, University of the Ryukyus, JapanReviewed by:
Ruy Kenji Papa De Kikuchi, Federal University of Bahia, BrazilAndrew G. Bauman, National University of Singapore, Singapore
Copyright © 2021 Barrera-Falcon, Rioja-Nieto, Hernández-Landa and Torres-Irineo. This is an open-access article distributed under the terms of the Creative Commons Attribution License (CC BY). The use, distribution or reproduction in other forums is permitted, provided the original author(s) and the copyright owner(s) are credited and that the original publication in this journal is cited, in accordance with accepted academic practice. No use, distribution or reproduction is permitted which does not comply with these terms.
*Correspondence: Rodolfo Rioja-Nieto, cnJpb2phQGNpZW5jaWFzLnVuYW0ubXg=