 Lisa Rönspieß
 Günther Nausch
 Detlef Schulz-Bull
- Department of Marine Chemistry, Leibniz Institute for Baltic Sea Research Warnemünde, Rostock, Germany
Phosphorus (P) is a major driver of eutrophication, especially in anthropogenically impacted coastal waters, and determining its bioavailability is important for providing a good estimation of the eutrophication potential in aquatic systems. Therefore, we observed the bioavailability of P in four laboratory experiments on water samples collected in March, June, September, and December 2018. In the experiments, all P fractions of the sampled water were investigated in three treatments (“unfiltered” and “10 μm”- and “1.2 μm”-filtered). The bioavailability (utilization by organisms within several days) ranged from 9 to 100% for dissolved P, and 34 to 100% for particulate P. However, one of the particulate P fractions was bound in biomass and therefore was not directly bioavailable. The conditions in the March experiment represented a natural spring bloom with a residual potential for planktonic growth. In June and September, the nutrients needed for growth were depleted in the different treatments. In December, a spring bloom was simulated by the laboratory conditions. Preferential P uptake by a specific group of organisms could not be observed directly, although a trend of higher utilization of dissolved P by heterotrophic bacteria was observed. In conclusion, the bioavailable P (sum of dissolved P fractions and one particulate P fraction) accounted for between 20 and 94% of the total P. Consequently, our experiments demonstrated that the commonly monitored P fractions lead to an underestimation of the bioavailable P and thus of potential for eutrophication in aquatic systems, too.
Introduction
Connection Between P and Eutrophication
Phosphorous (P) is essential for life because it is a component of important biomolecules (e.g., DNA and ATP). Together with nitrogen (N), it is primarily responsible for eutrophication, especially in surface waters (OECD, 1982; Hecky and Kilham, 1988). Eutrophication is a global problem in limnic and marine systems (e.g., Yang et al., 2008; Chrislock et al., 2013; Jessen et al., 2015). The elevated nutrient loads into the aquatic systems lead to an increase in organic matter and with it a decrease of water quality (e.g., Larsson et al., 1985; Nixon, 1995).
Since the 20th century, anthropogenic activity has led to excessive input of both P and N into aquatic systems and caused shifts in the trophic status of European waters, such as the Baltic Sea, which shifted from an oligo- to a eutrophic system (Gustafsson et al., 2012). To address the eutrophication problem, regulations such as the Water Framework Directive (WFD, 2000/60/EC), the Marine Strategy Framework Directive (MSFD, 2008/56/EC), and the Helsinki Commission’s (HELCOM) Baltic Sea Action Plan (BSAP, HELCOM, 2007, 2013) were adopted to achieve higher water quality. For example, nutrient inputs were reduced by technically improving sewage plants in Germany (Nausch et al., 2011). Nevertheless, the level of eutrophication remains high in 95% of the Baltic Sea (LUNG, 2016; HELCOM, 2018a,b), and further reductions of the nutrient inputs are needed. Therefore, the catchment areas of the rivers that discharge into the Baltic Sea have become a focus of HELCOM’s efforts.
Different P fractions were monitored in the water column of the lowland Warnow River and its estuary in northeastern Germany monthly between August 2016 and August 2018 (Bitschofsky and Nausch, 2019; Rönspieß et al., 2020). The 3,024 km2 catchment of the river is one of the largest catchments in Germany that discharges into the Baltic Sea. Its agricultural land use is quite typical for the catchments of the southern Baltic Sea (HELCOM, 2010). Consequently, the Warnow system represents an appropriate model system for such investigations.
Phosphorus plays an important role in the Baltic Sea environment because elevated P concentrations promote N fixation, partly by toxic cyanobacteria (cyanos; Finni et al., 2001). Regular monitoring programs observe the status of the aquatic systems as the Baltic Sea and its coastal waters. Commonly, P is only monitored as total P (TP) and dissolved inorganic P (DIP). The scope of the monitoring approach in the Project PhosWaM (P from source to sea), which is within the scope of this work, was extended to analyze the particulate and dissolved P forms as well as organic and inorganic P. The extension was necessary because in the determination of P via the reaction with molybdate (Murphy and Riley, 1962). DIP as well as a small but unknown amount of labile organic P is measured (Jarvie et al., 2002). To prevent overestimation, the traditional terms for the P fractions, namely, DIP, dissolved organic P (DOP), particulate inorganic P (PIP), and particulate organic P (POP), were changed based on their analytical behavior (Felgentreu et al., 2018) into dissolved molybdate-reactive P (DRP; similar to DIP), dissolved non-molybdate-reactive P (DNP; similar to DOP), particulate molybdate-reactive P (PRP; similar to PIP), and particulate non-molybdate-reactive P (PNP; similar to POP). The determination of these fractions and their respective bioavailability allow a more effective estimation of the eutrophication potential.
Bioavailability of P
Boström et al. (1988) defined bioavailable P (BAP) “as the sum of immediately available P and P that can be transformed into an available form by naturally occurring physical (e.g., desorption), chemical (e.g., dissolution) and biological processes (e.g., enzymatic degradation).” Based on this definition, Reynolds and Davies (2001) studied P bioavailability with respect to P utilization by algae and plants, and other authors (e.g., Sonzogni et al., 1982) described BAP as the part of TP that is used for growth. According to our experimental design and analytics, we defined BAP as the P fractions that can be utilized by organisms within several days, taking into account the fact that P can also be released over longer periods of time. P uptake occurs either directly or after transformation into a usable P fraction on the given time scale.
Many bioavailability studies have focused on the bioavailability of sedimentary P (e.g., Sonzogni et al., 1982; Ekholm, 1994; Tang et al., 2018). Nevertheless, the analyses differ from those used for water column P determination. In the sediment, BAP is extracted by different chemicals that release loosely bound P or P bound to iron and manganese (e.g., Psenner et al., 1984; Ruttenberg, 1992). Although there are also some studies on the bioavailability of P in the water column (e.g., Stepanauskas et al., 2002; Lønborg et al., 2009), these mostly focus on the dissolved P fractions.
In the water column, TP and DRP are the traditionally monitored fractions. Therefore, DRP is considered representative of BAP (Boström et al., 1988; Thingstad et al., 1993) and can be used to estimate the potential for eutrophication. However, the differences between TP and DRP are large, especially in eutrophic waters (Rönspieß et al., 2020), and the remaining P fractions (DNP, PRP, and PNP) may play a role in the eutrophication of such systems. Nausch and Nausch (2006, 2007) previously characterized DNP as a main P source for phytoplankton and bacterial growth, although the particulate P fractions could also be bioavailable (e.g., Sonzogni et al., 1982; Ekholm, 1994; Tang et al., 2018). The present study aims to clarify the bioavailability of the P fractions in the water column without interaction with the sediment by answering the following questions:
1. Are the particulate P fractions also bioavailable, and if so, how differ the amounts of bioavailability between the BAP fractions?
2. Do the BAP fractions show seasonal variability?
3. Is it possible to differentiate the BAP fractions taken up by phytoplankton and bacterioplankton?
These questions will be answered through the experiments described herein. In conclusion, the impact of all BAP fractions can be evaluated in comparison to that of only DRP in the estimation of the eutrophication potential of the Warnow Estuary. Moreover, the results can indicate the importance of these fractions in general (seasonal variability e.g., for monitoring programs or official regulation of fertilization).
Materials and Methods
Study Area
The Warnow Estuary is separated from the Warnow River by a weir in the southern part of Rostock (population ca. 207,500 in 2016), which completely surrounds the estuary. Thus, the estuary is highly anthropogenically influenced. It is relatively shallow (mean water depth 4 m), has an area of 12 km2 and widens toward the river mouth in the north of the estuary (Bachor, 2005). The salinity in the Warnow Estuary varies depending on the influence of the water masses from both the Warnow River and the Baltic Sea.
Sampling
The water samples for the laboratory experiments were taken at the Hundsburg station in the middle of the course of the Warnow Estuary (latitude 54.13000, longitude 12.09660) once per meteorological season (March, June, September, and December 2018). Surface water was collected from a former ferry dock with a bucket and poured into canisters. During the sampling, accompanying parameters (air and water temperature, conductivity, pH, and oxygen) were measured with two different multi-parameter probes (HQ40d from HACH, HI 9828 from ATP Messtechnik GmbH; Supplementary Material 1), with conductivity especially important as it was used to classify the hydrodynamic situation of the estuary (influence of the Baltic Sea or Warnow River). The sampled water was stored overnight in the canisters in a 15°C cooling room.
Experimental Design
In the laboratory, four experiments (one for each meteorological season: March, June, September, and December) were performed in three treatments with three replicates each. For the treatments, the sampled water was sequentially filtered. For the “unfiltered” treatment, the sampled water was used to represent the natural biological community (zooplankton, phytoplankton, and bacteria). For the “10 μm” treatment, the filtrate from 10 μm-filtered water (nylon membrane with Ø = 47 mm; vacuum pressure constant at 850 hPa), from which most zooplankton were excluded, was used. For the “1.2 μm” treatment, the filtrate from 1.2 μm-filtered water (GF/C with Ø = 47 mm or mixed cellulose ester membrane with Ø = 142 mm; vacuum pressure constant at 850 hPa), from which the zooplankton and most phytoplankton were removed, thus leaving only the bacterial community, was used.
The water for the treatments (each replicate was approximately 12 l) was poured into 15 l reaction bottles (NALGENE) that were permanently ventilated and stored in a 15°C cooling room with a day-night cycle of 16 h:8 h. The water was sampled once per day over 9 days (d0 to d8). The bioavailability of the P fractions was estimated by measuring the changes in the concentrations of the different fractions over the duration of each experiment.
Determination of P, N, and Carbon
In addition to TP, four P fractions (DRP, DNP, PRP, and PNP) were measured. The reason for the extension of the P analysis from the traditionally monitored TP and DRP was the large difference between these fractions due to the higher amount of particulate matter in shallow eutrophic waters (Felgentreu et al., 2018). The P fractions were categorized using the adapted nomenclature based on their reactivity with molybdenum blue. In general, P is analyzed calorimetrically after Murphy and Riley (1962). While the DRP and PRP fractions were measured immediately, the TP, DNP and PNP fractions were measured after alkaline persulfate digestion following Koroleff (1999). The dissolved and particulate P were differentiated via filtration (GF/F-filter, retention range 0.7 μm) of the water samples, and an analysis was performed for the original sample and the filtrate (for dissolved fractions). The particulate fractions were calculated as the difference between the sample and the filtrate (Felgentreu et al., 2018).
Nitrogen was analyzed as dissolved (nitrate and nitrite only) and total particulate N. A volume of 50–85 ml was filtered (GF/F-filter, Ø = 25 mm, retention range 0.7 μm) using vacuum pressure (850 hPa). In the filtrate, nitrate and nitrite were measured with an autoanalyser (Evolution III, Alliance Instruments) according to Koroleff (1999) and HELCOM (2017a). The filters were stored frozen (−20°C) for the determination of the total particulate N and carbon (C). Prior to the analysis with an elemental analyzer (varioMICRO cube, Elementar), the filters were dried at 60°C for 6–8 h and stored in a desiccator at ambient temperature. Directly before measurement, the filters were again dried at 60°C for 2–4 h. For the analysis, the filters were wrapped in tin boats. The analysis followed the instructions of Ehrhardt and Koeve (1999) and HELCOM (2017a). In this study, the total particulate N and C were analyzed. Thus, the step for eliminating inorganic N and C was omitted.
Analysis of the Biological Community
The biological community was first estimated based on the chlorophyll a (Chla) concentration. Water (50–700 ml) from each replicate of the three treatments was filtered (GF/F-filter, Ø = 25 mm, retention range 0.7 μm; vacuum pressure constant at 850 hPa). The filters were stored frozen at −80°C for approximately 12 h, and then the Chla was extracted by 96% ethanol for 3 h and measured with a fluorometer (Turner 110, 10-AU-005) according to Wasmund et al. (2006) and HELCOM (2017b).
The community was also analyzed by microscopic observations. Therefore, samples from the “unfiltered” and the “10 μm” treatments were taken at the beginning (d0) and the end (d8) of each experiment and fixed with Lugol’s solution (0.5 ml for 100 ml sample; Willén, 1962; HELCOM, 2017c). For the observations, an Utermöhl microscope (Axiovert 100) was used. The community was divided into taxonomic groups (Table 1), and the relative abundances of the organisms in the groups were estimated and clustered into categories (Table 2).
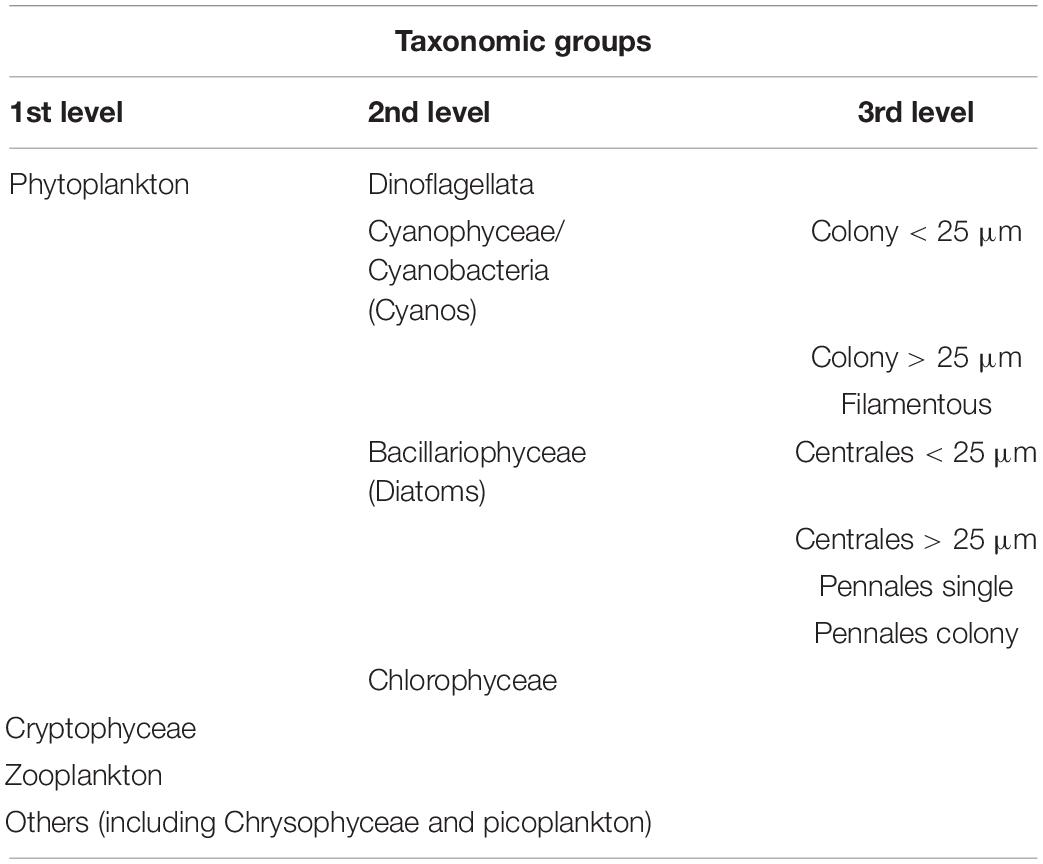
Table 1. Division of the biological community in taxonomic groups.
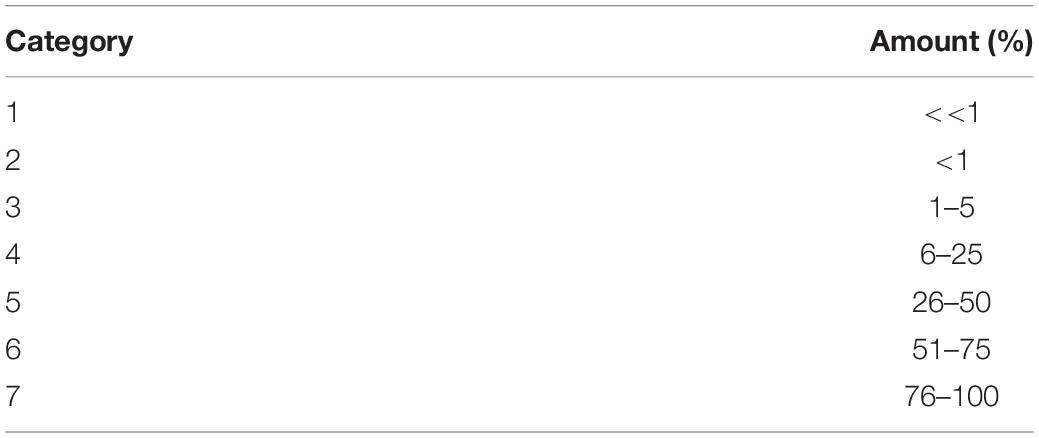
Table 2. Classification of the relative abundance of organism groups into categories.
The abundances of heterotrophic and autotrophic bacteria were analyzed with a flow cytometer (FacsCalibur, Becton Dickinson Biosciences) following the instructions of Gasol (1999). Therefore, 2 ml of the water samples (d0 and d8 of the “unfiltered” and “10 μm” treatment, d0 to d8 of the “1.2 μm” treatment) were fixed with 200 μl sterile filtered formaldehyde (CH2O). After 30 min, the samples were stored frozen at −80°C until they were measured.
Results
Variability of P Fractions
The median TP did not vary substantially over the 9 days in the respective treatments of each experiment but differed among the four experiments (Table 3 and Supplementary Material 2). In the “unfiltered” treatment, the maximum TP concentration was measured in June, and the minimum was measured in September. Due to filtration and the seasonality, the TP concentration in the “10 μm” treatment was 71–98% of the TP concentration in the “unfiltered” treatment, while in the “1.2 μm” treatment, it was 28–96% of the TP concentration in the “unfiltered” treatment (minimum amounts in June, maximum amounts in December).
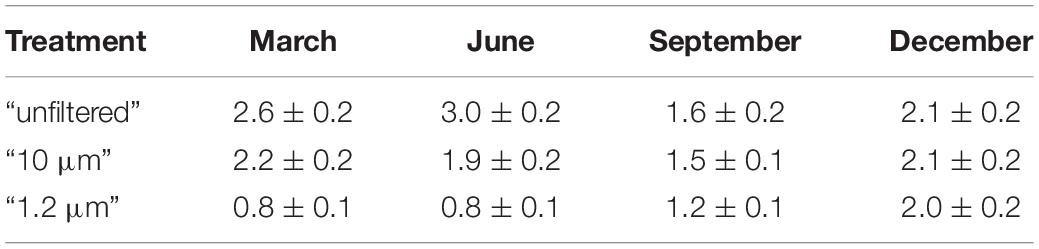
Table 3. Median of the total phosphorus [μM] with the standard error for all treatments during the experiments.
The “unfiltered” and “10 μm” treatments reacted similarly. In general, the concentrations of the molybdate-reactive P fractions (DRP and PRP) decreased over the duration of each experiment, while the PNP fraction increased (Figure 1 and Supplementary Material 2). The DNP concentrations seemed to remain essentially stable. As a consequence of filtration, the dissolved P fractions dominated in the “1.2 μm” treatment.
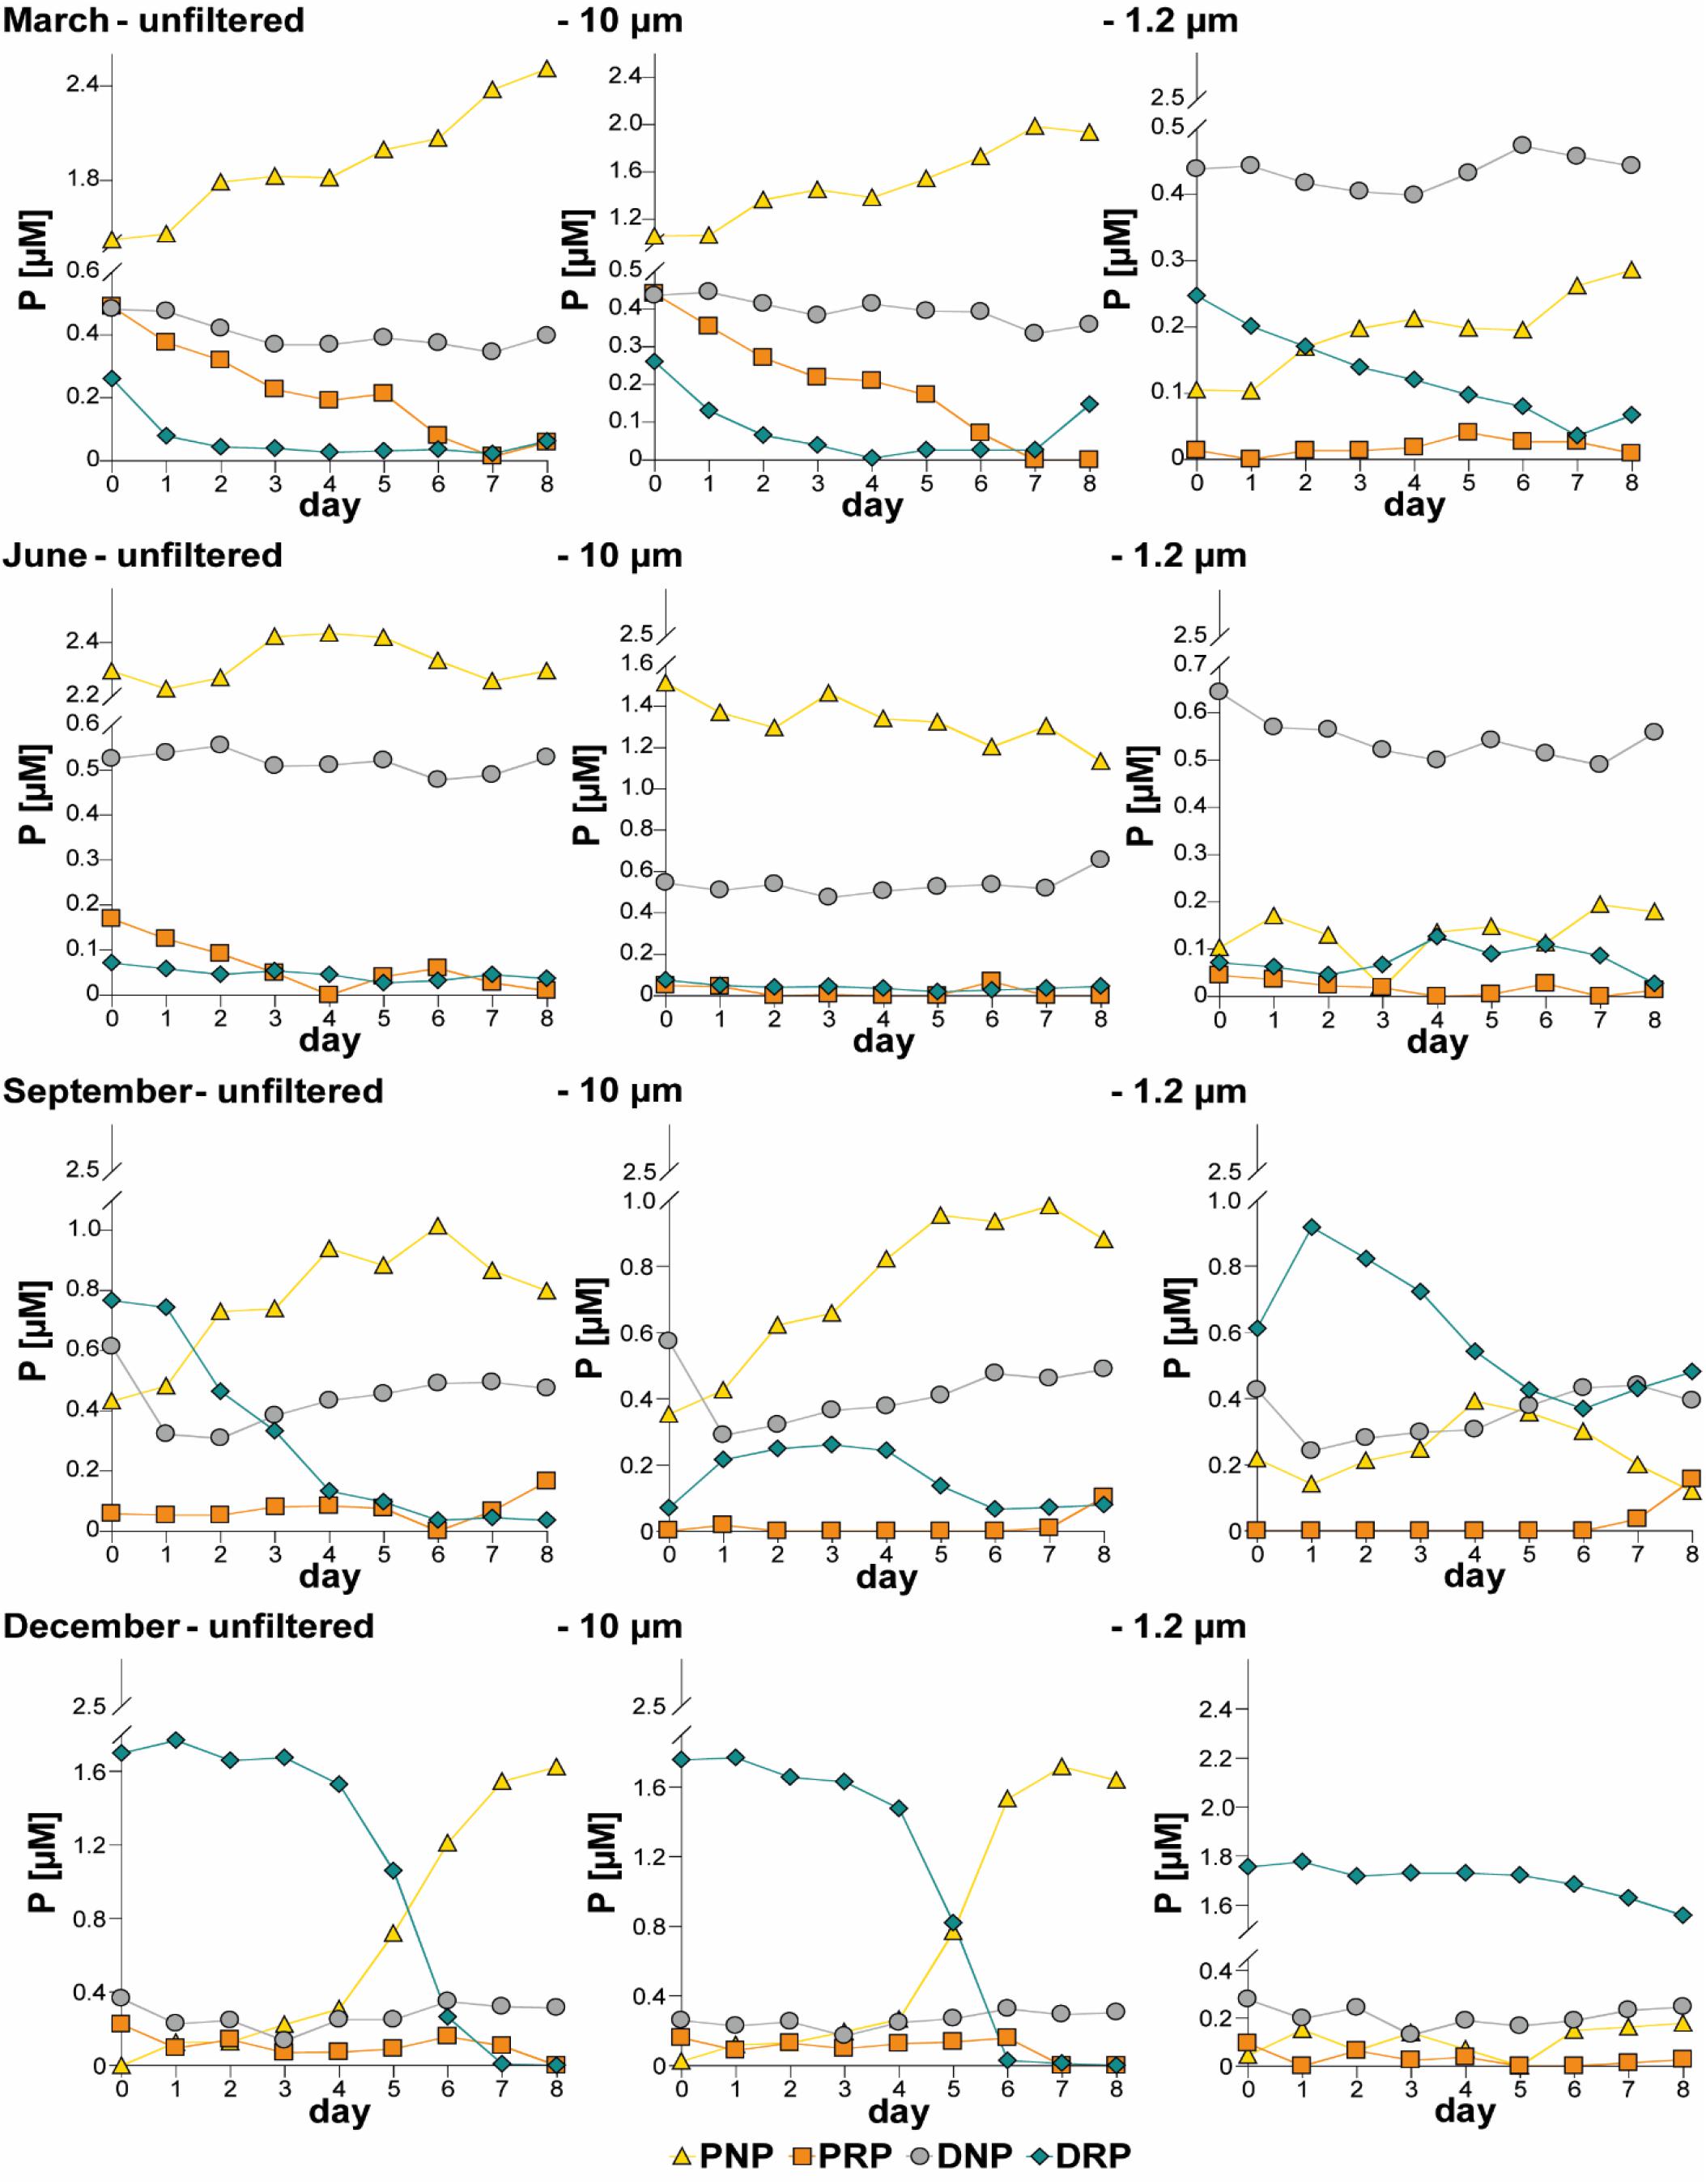
Figure 1. Development of the phosphorus (P) fractions (median of triplicates) in all treatments (“unfiltered,” “10 μm,” “1.2 μm”) during the four experiments, DRP, dissolved molybdate-reactive P; DNP, dissolved non-molybdate-reactive P; PRP, particulate molybdate-reactive P; PNP, particulate non-molybdate-reactive P.
During March, DRP decreased while PNP increased in all treatments. Additionally, the PRP concentration decreased in the “unfiltered” and “10 μm” treatments. In June, the P fractions did not vary substantially among each of the treatments. In September, the DNP concentration dropped on the first day but increased slightly afterward and approached its original concentration by the end of the experiment in all treatments. In this experiment, the DRP curves differed among the treatments. DRP decreased in a sigmoidal curve in the “unfiltered” treatment. In the “10 μm” treatment, DRP initially increased, then stagnated and finally decreased. A similar pattern was observed in the “1.2 μm” treatment, where DRP increased during the first day but decreased immediately and slightly increased afterward. The PNP concentration increased and stabilized in the “unfiltered” and “10 μm” treatments, while it decreased in the “1.2 μm” treatment during September. In December, DRP decreased while PNP increased in the “unfiltered” and “10 μm” treatments. DNP and PRP did not vary much during this experiment. In the “1.2 μm” treatment, no major variation in the P fractions was observed in December.
Development of the Biological Community
The development of phytoplankton was estimated based on the Chla concentration (Figure 2 and Supplementary Material 2). The curves of the Chla concentration presented similar variations like the PNP curves in the “unfiltered” and the “10 μm” treatments. As expected, the “1.2 μm” treatment had a much lower Chla concentration than the other treatments (approximately 1–11% of the Chla in the “unfiltered” treatment).
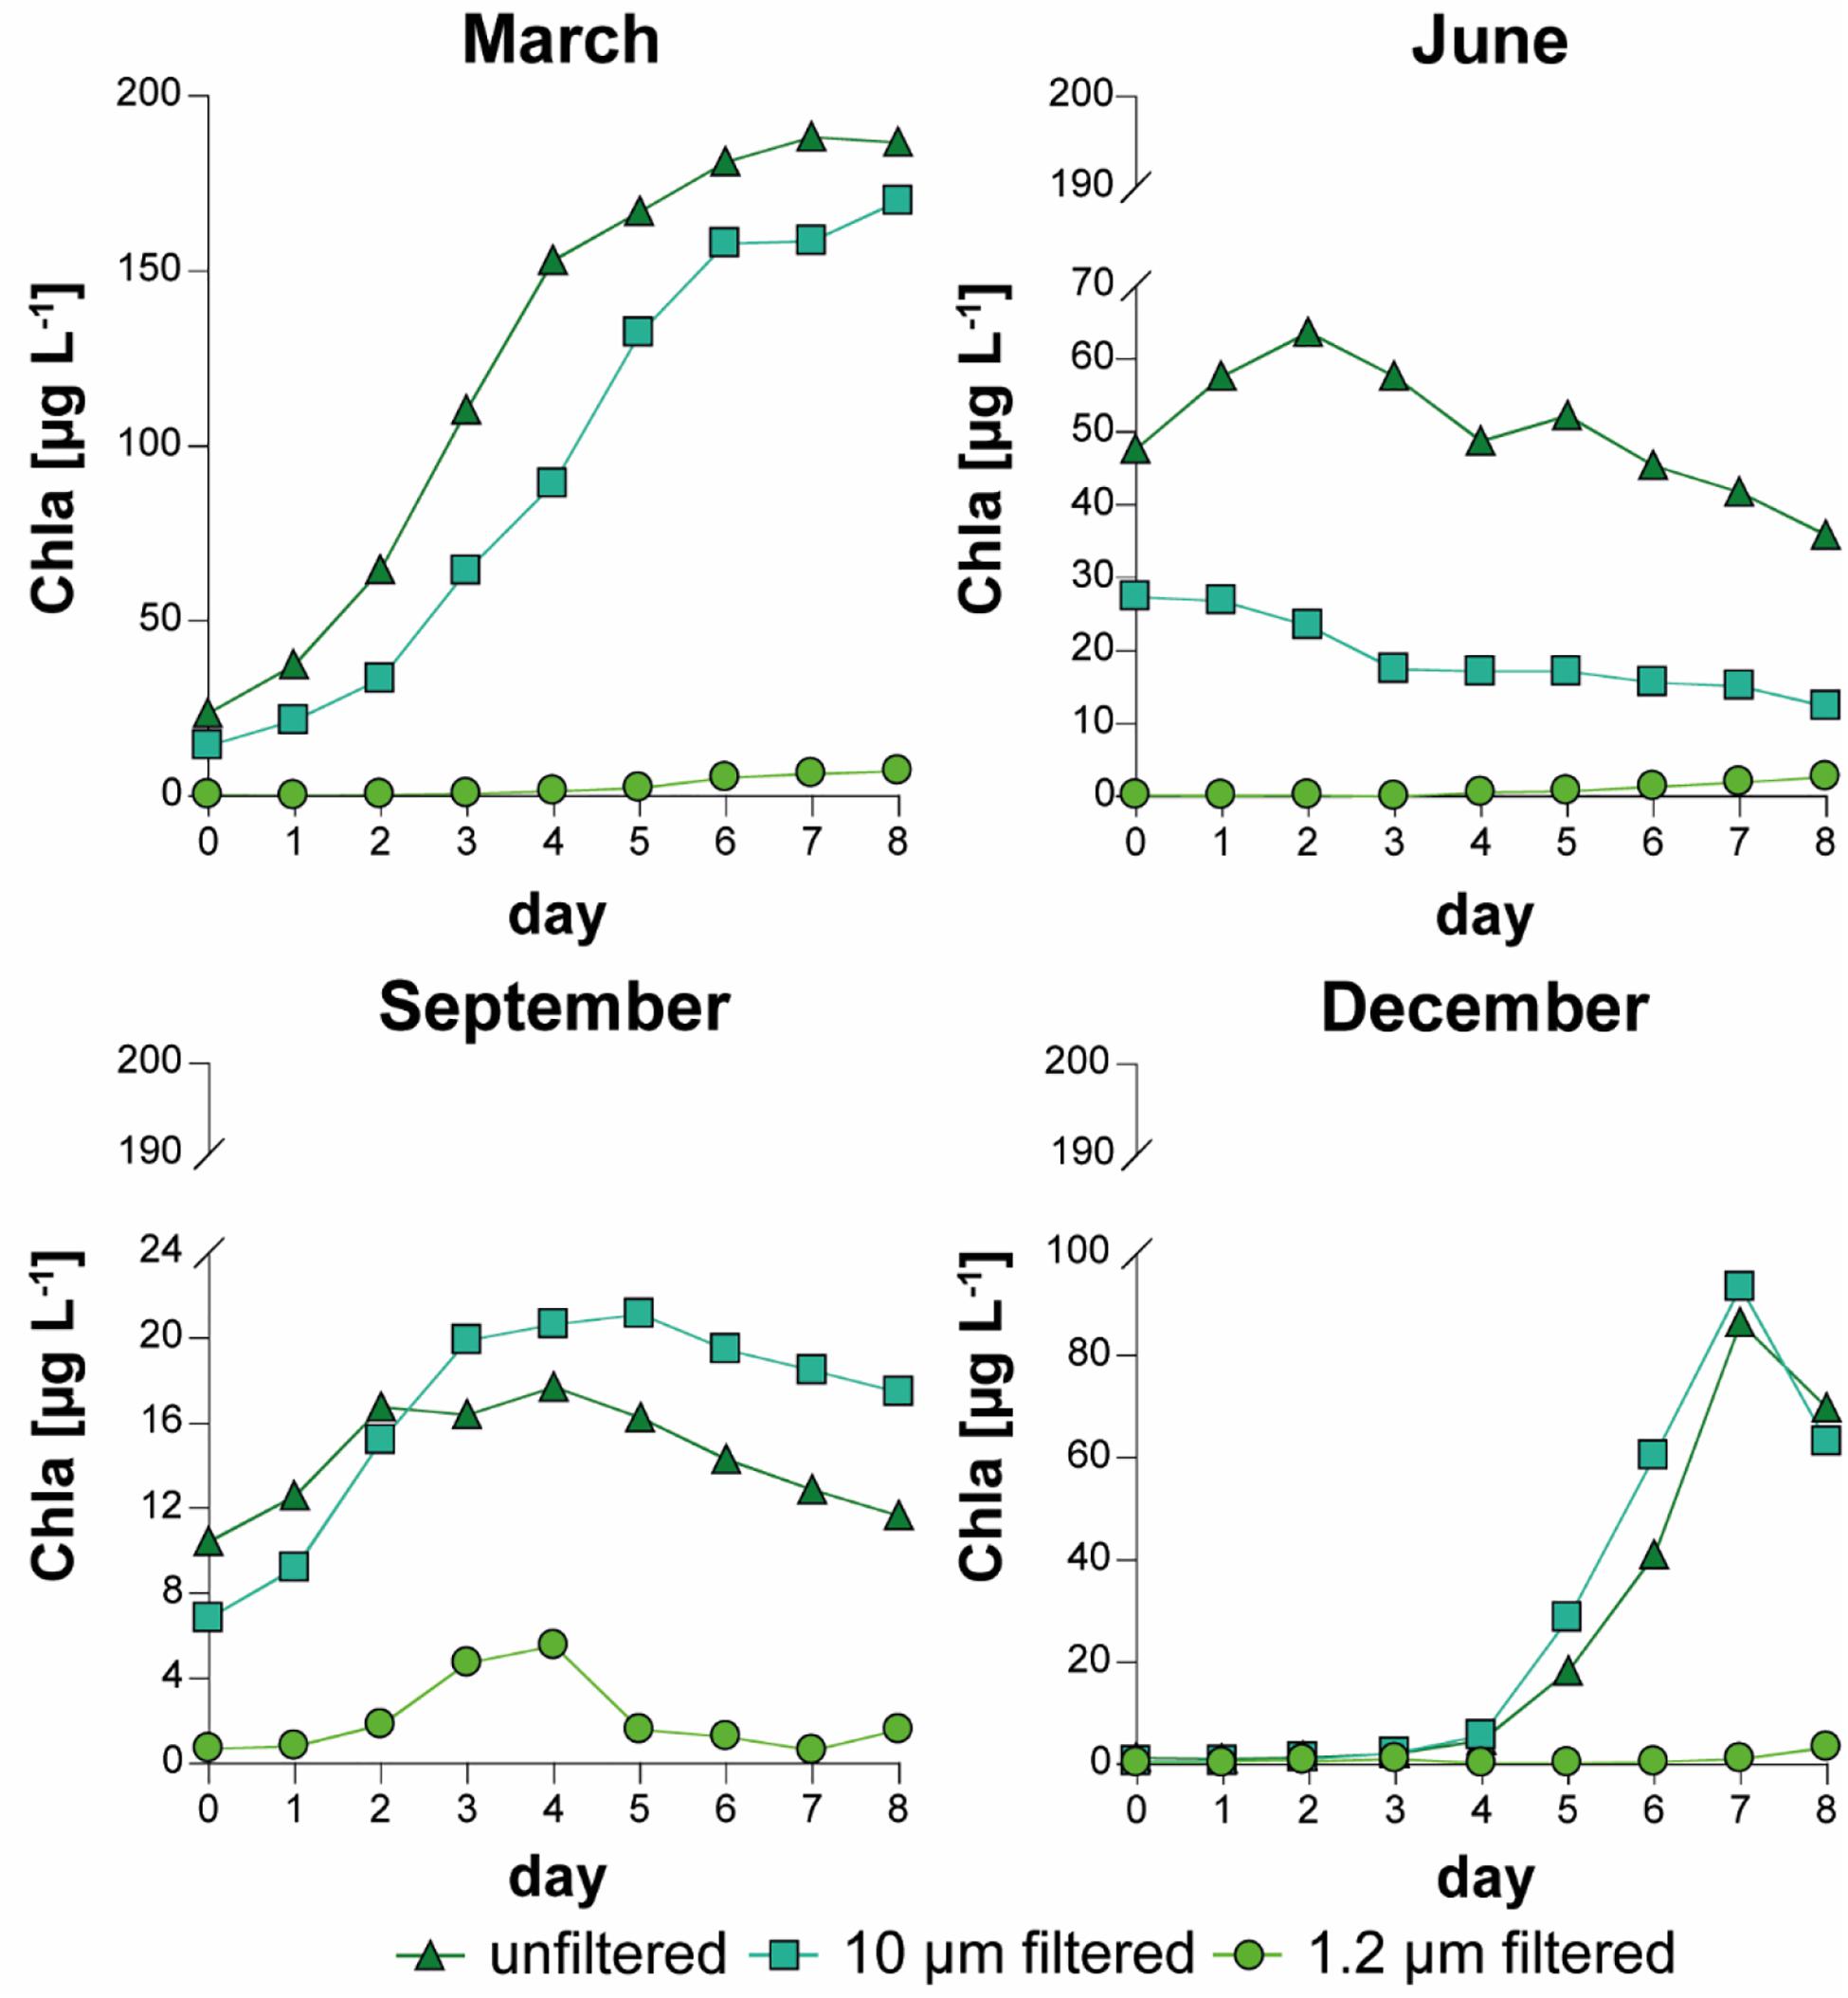
Figure 2. Variation in chlorophyll a (Chla, median of triplicates) in all treatments and experiments.
The biological communities of the “unfiltered” and “10 μm” treatments were similar to each other (Figure 3 and Supplementary Material 3). The main difference was that zooplankton were more present in the “unfiltered” treatment than in the “10 μm” treatment, although their classification (>>1%; Table 2) did not show this difference. In general, centric diatoms (Centrales under and above 25 μm) were the dominant organisms at the end of all experiments. Additionally, the group “Others,” which mainly consisted of picoplankton, dominated in both treatments, especially in September and at the beginning of December. Small cyano-colonies played a role in both treatments at the beginning of March, June and September. Filamentous cyanos were highly abundant at the end of June in both treatments and at the end of March in the “10 μm” treatment.
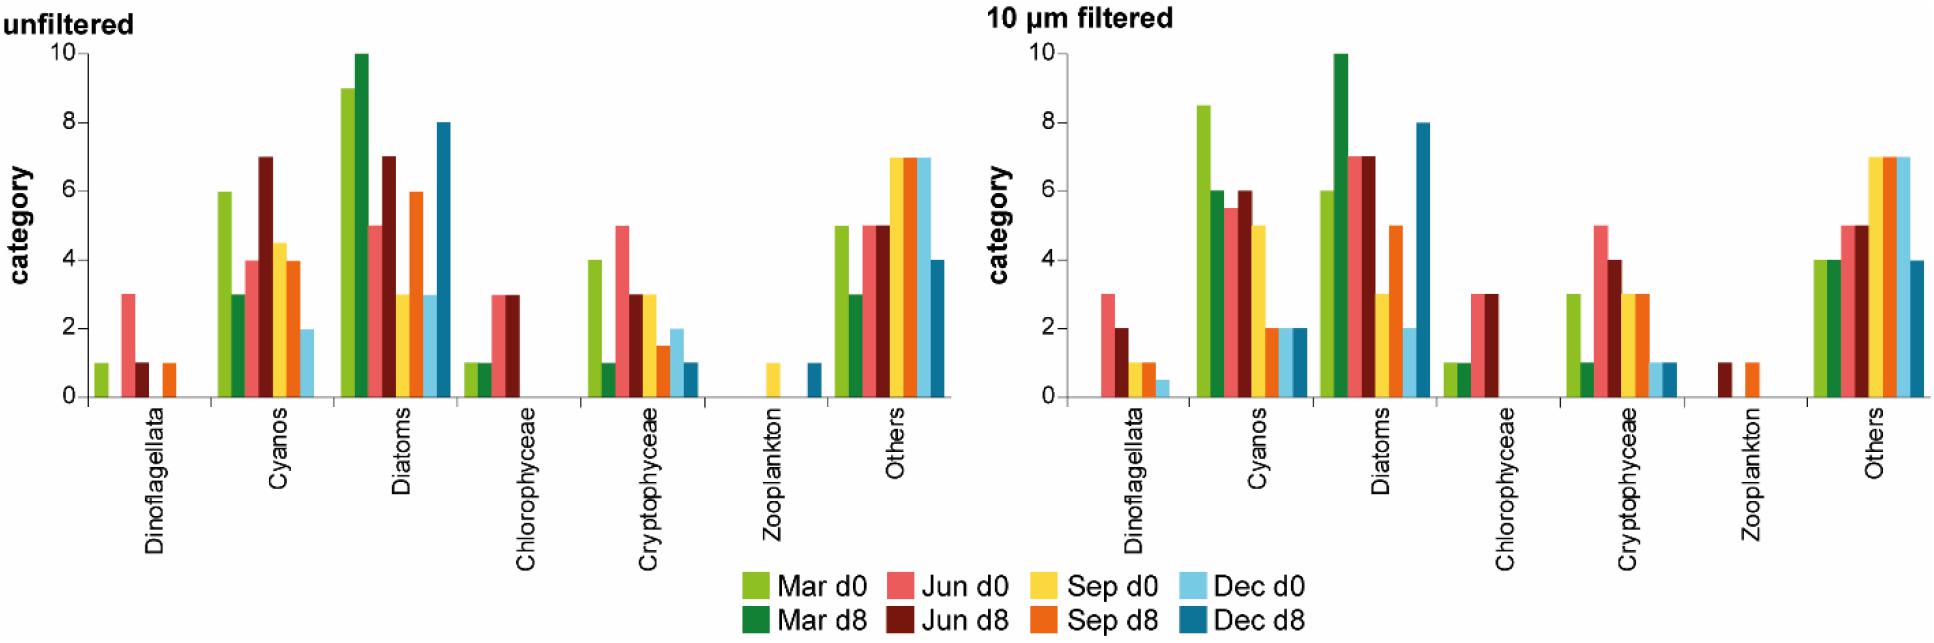
Figure 3. Biological community (median of triplicates) in the “unfiltered” and “10 μm” treatment; for the definitions of categories, see Table 2, Cyanobacteria (Cyanos) and Diatoms are summed and shown as stacked bars, Mar, March; Jun, June; Sep, September; Dec, December; d0, day 0; d8, day 8.
In the flow cytometric analysis of all treatments, more heterotrophic bacteria than autotrophic bacteria were counted (Supplementary Material 4 and Figure 4 for “1.2 μm” treatment). The development of heterotrophic and autotrophic bacteria was visualized through daily measurements of the “1.2 μm” treatment (Figure 4 and Supplementary Material 4). The fewest events per ml were observed in December for both types of bacteria. The experiment in March showed a classic growth curve for heterotrophic bacteria (the number of bacteria increased, reached stagnation and decreased). The highest count of heterotrophic bacteria occurred in June, while the highest count of autotrophic bacteria occurred in September.
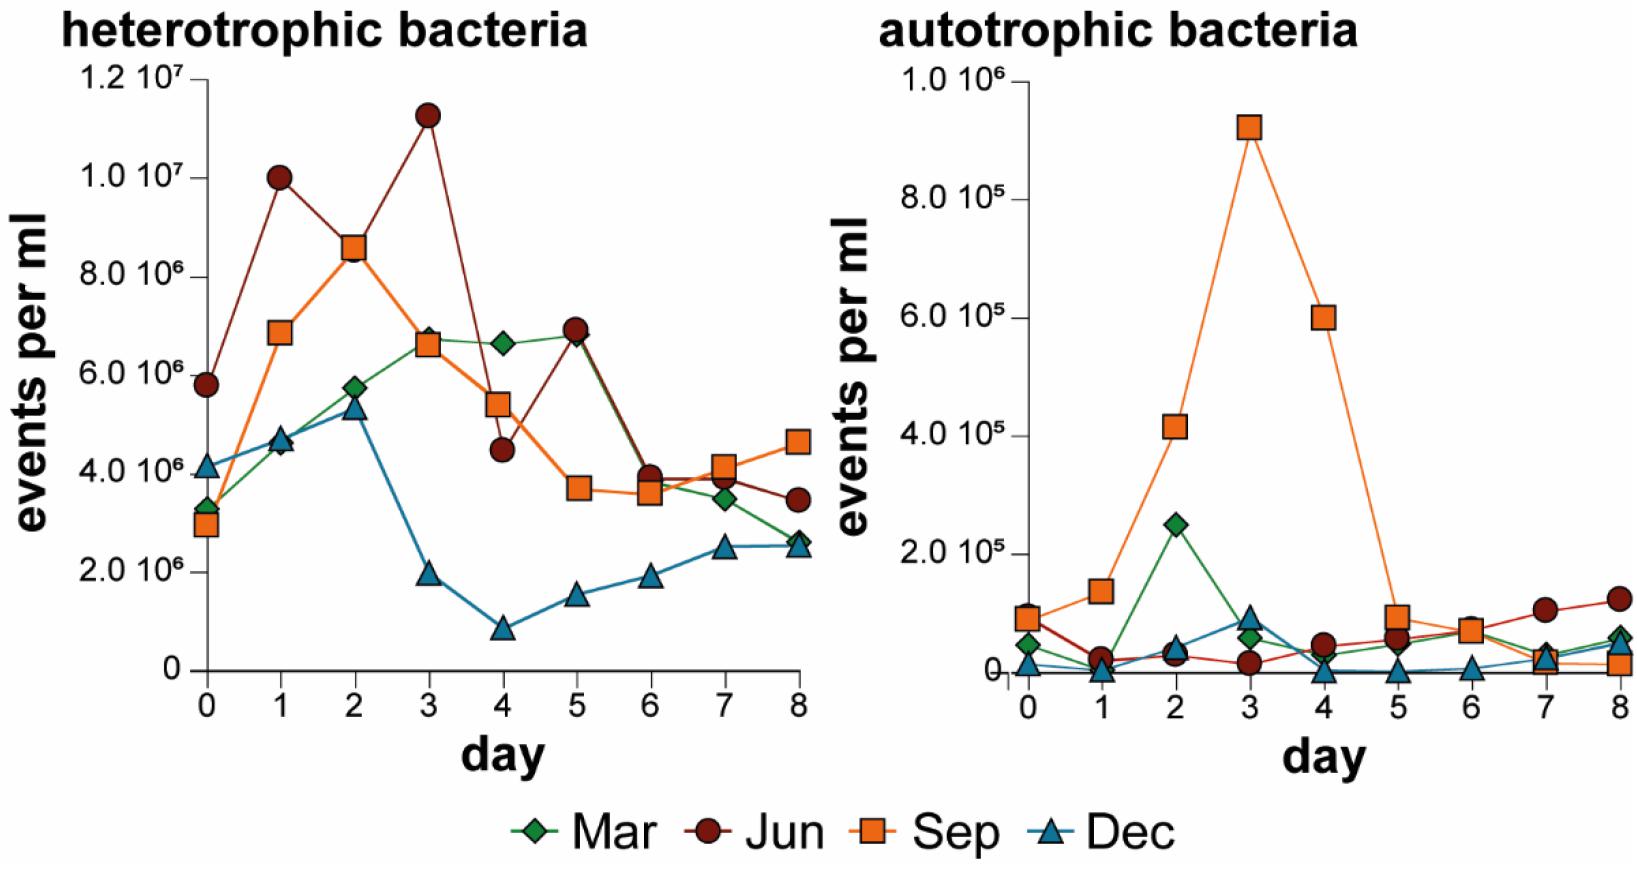
Figure 4. Development of heterotrophic and autotrophic bacteria (median of triplicate experiments) in the “1.2 μm” treatment over the four experiments.
Discussion
N:P Ratios and Their Effects on the Biological Community
The biological community in this study contained a large proportion of Chla, which is an indicator of the presence of primary producers if the amount of Chla and the total particulate C content are correlated. Based on the median of all experiments, these parameters were significantly correlated in all three treatments (Table 4, second column). In the individual experiments, the significance of the correlations changed. In the “unfiltered” treatment, the correlation between Chla and total particulate C was not significant during June and September, which indicates that the biomass of the biological community was dominated by organisms other than primary producers, e.g., zooplankton such as copepods and ciliates (Figure 3).
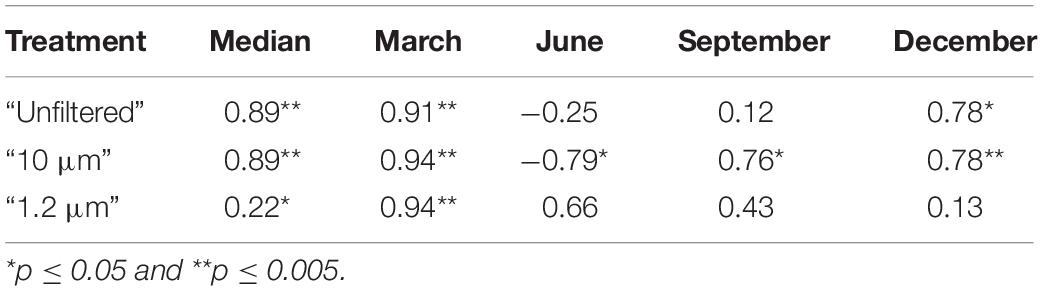
Table 4. Coefficients of the Pearson correlation between chlorophyll a and total particulate carbon (values as medians for the particular experiment/treatment); * and ** indicate significance.
The bacterial community consisted of more heterotrophic than autotrophic bacteria in all experiments (Figure 4) as indicated by the correlation between Chla and total particulate C, which was only significant in the “1.2 μm” treatment during March (Table 4). The higher correlation between this parameter in March corresponded to a lower amount of autotrophic bacteria, which was supported by the finding that the highest amount of autotrophic bacteria occurred in September (Figure 4).
According to Redfield et al. (1963), the classical C:N:P ratio should be 116:16:1. Nevertheless, there can be sizeable variations in this ratio, especially among bacteria (Godwin and Cotner, 2015). The relationships among these nutrients (Supplementary Material 5) can indicate limitations. Under limiting conditions for just one of the three nutrients, the biomass production of aquatic organisms is also limited (Fleming, 1940; Redfield et al., 1963).
The ratio of the sum of nitrite and nitrate (ΣN) and dissolved P was <1 in June in approximately 77% of the measurements (Supplementary Material 5), which indicated N limitation over the whole experiment and in all treatments. Consequently, the biological community was not able to grow, which was visible through the decreasing Chla concentrations (Figure 2) and the stagnating concentrations of the P fractions (Figure 1). Nevertheless, the amount of heterotrophic bacteria, which presumably transform DNP into DRP (Figure 1), increased during this experiment in all treatments (Figure 4 and Supplementary Material 4).
The experiment in September also showed N limitation. Here, 74% of the measurements had a ΣN:dissolved P ratio of <1 (Supplementary Material 5). Compared with June, the Chla concentrations increased first, stagnated and then decreased, which was similar to the typical growth curve (Figure 2). Even the P fractions varied (Figure 1). Nevertheless, the Chla and TP concentrations were up to three and two times higher, respectively, in June than in September. A possible reason for the differences from June could be N fixation by cyanos, which is suggested by the increasing trend in the sum of ΣN and total particulate N. Moreover, ammonium and organic N species can be used for phytoplankton growth. However, the concentrations of these species were not measurable with the methods used.
During December, 81% of the measurements indicated a N limitation. Compared with June and September, the ΣN:dissolved P ratio in December was <1 in only 7% of the measurements (Supplementary Material 5). Similar to the case in September, the generally increasing Chla concentration (Figure 2) might have resulted from the unmeasured N species that could result in phytoplankton growth. The variations in the P fractions (Figure 1), however, matched the variations in the Chla concentrations, suggesting a simulated spring bloom in the laboratory.
Bioavailability of the Different P Fractions
The bioavailability of P is herein defined as those P fractions that were utilized by organisms, presumably by phytoplankton and bacteria, over short-term scales (within several days). The concentrations of the P fractions decrease or increase due to their transformation. The P fractions with decreasing concentrations were combined as BAP.
Chla and total particulate C are commonly used as proxies for biomass, and both were positively correlated with PNP (Table 5). Consequently, PNP is bound to organisms and thus is not directly bioavailable. However, PNP can become available over long-term scales and in combination with transformation into the remaining P fractions, which are bioavailable over short-term scales (Table 6 and Supplementary Materials 6,7). This availability is crucial because, in line with various studies (e.g., Sonzogni et al., 1982; Thingstad et al., 1993; Reynolds and Davies, 2001), it is assumed that only phosphate (PO43–) can be directly taken up by organisms (phytoplankton and bacteria). Thus, because of the rapid transformation of DNP and PRP into DRP and the uptake of DRP, only decreases in these fractions were detectable under the sampling frequency of the study.
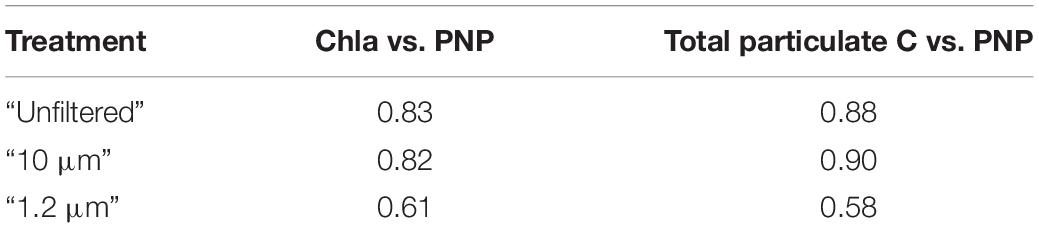
Table 5. Spearman correlation coefficients (p ≤ 0.005) between chlorophyll a (Chla) or total particulate carbon (C) and particulate non-molybdate-reactive phosphorus (PNP).
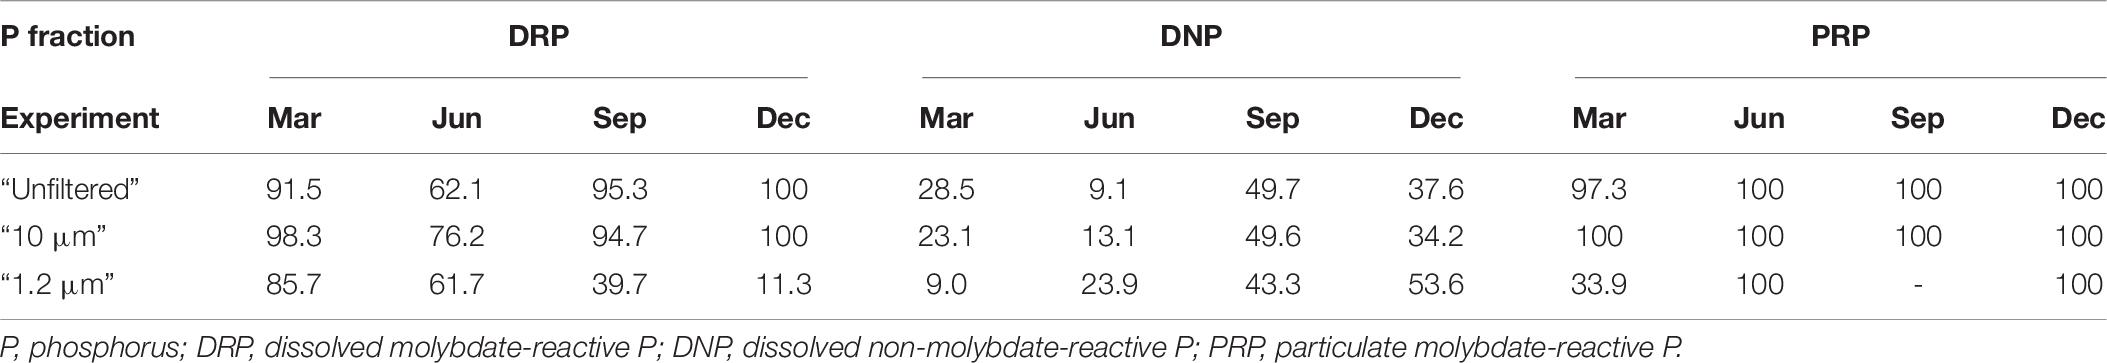
Table 6. Relative bioavailability [%] of all treatments during the four experiments based on the respective median values.
In the central Baltic Sea, Nausch and Nausch (2006, 2007) found that the relative bioavailability of DNP (DOP) was between 9% and 65%. The DNP in this study showed a similar range of relative bioavailability (“unfiltered” 9–50%, “10 μm” 13–50%, “1.2 μm” 9–54%, Table 6). The minimum DNP utilization was observed in June, when the biomass of the “unfiltered” and “10 μm” treatments stagnated due to N limitation. In the June and December experiments, the transformation of DNP was highest in the “1.2 μm” treatment (24 and 54%, Table 6). Consistent with the negative correlation between the total particulate C and DNP in the “1.2 μm” treatment (Spearman: 0.38; p ≤ 0.005), the transformation of DNP indicates that DNP is mostly taken up by bacteria, likely heterotrophic bacteria (Figure 4), which transform DNP into PNP or DRP. Based on the low concentrations of PRP (Supplementary Material 2), which are often close to the detection limit (0.07 μM according to Felgentreu et al., 2018), approximately 100% of PRP was used (Supplementary Material 6). The exceptions are in the “1.2 μm” treatment in March and September.
Although relative bioavailability is useful as a value for orientation, it does not provide information about the concentration of a nutrient. Low concentrations can decrease more quickly to values below the detection limit and result in higher relative bioavailability. Consequently, degradation rates were also calculated for the different P fractions (Table 7 and Supplementary Material 6). Increasing concentrations of the P fractions were defined by positive rates, while decreasing concentrations were defined by negative rates. Again, the “unfiltered” and “10 μm” treatments were similar. The order of bioavailability according to median degradation rate was as follows (the highest uptake by the biological community is shown first): DRP (“unfiltered” = −3.27 nM h–1, “10 μm” = −3.59 nM h–1) > DNP (“unfiltered” = −2.02 nM h–1, “10 μm” = −1.13 nM h–1) > PRP (“unfiltered” = −1.01 nM h–1, “10 μm” = −1.03 nM h–1). In the case of the “1.2 μm” treatment, the rates were ordered as follows: DNP (−4.86 nM h–1) > DRP (−1.16 nM h–1) > PRP (−0.25 nM h–1). These rates further indicate the preferential DNP transformation and uptake by heterotrophic bacteria that dominate the “1.2 μm” treatment (Figure 4), which was also found by Nausch and Nausch (2007).
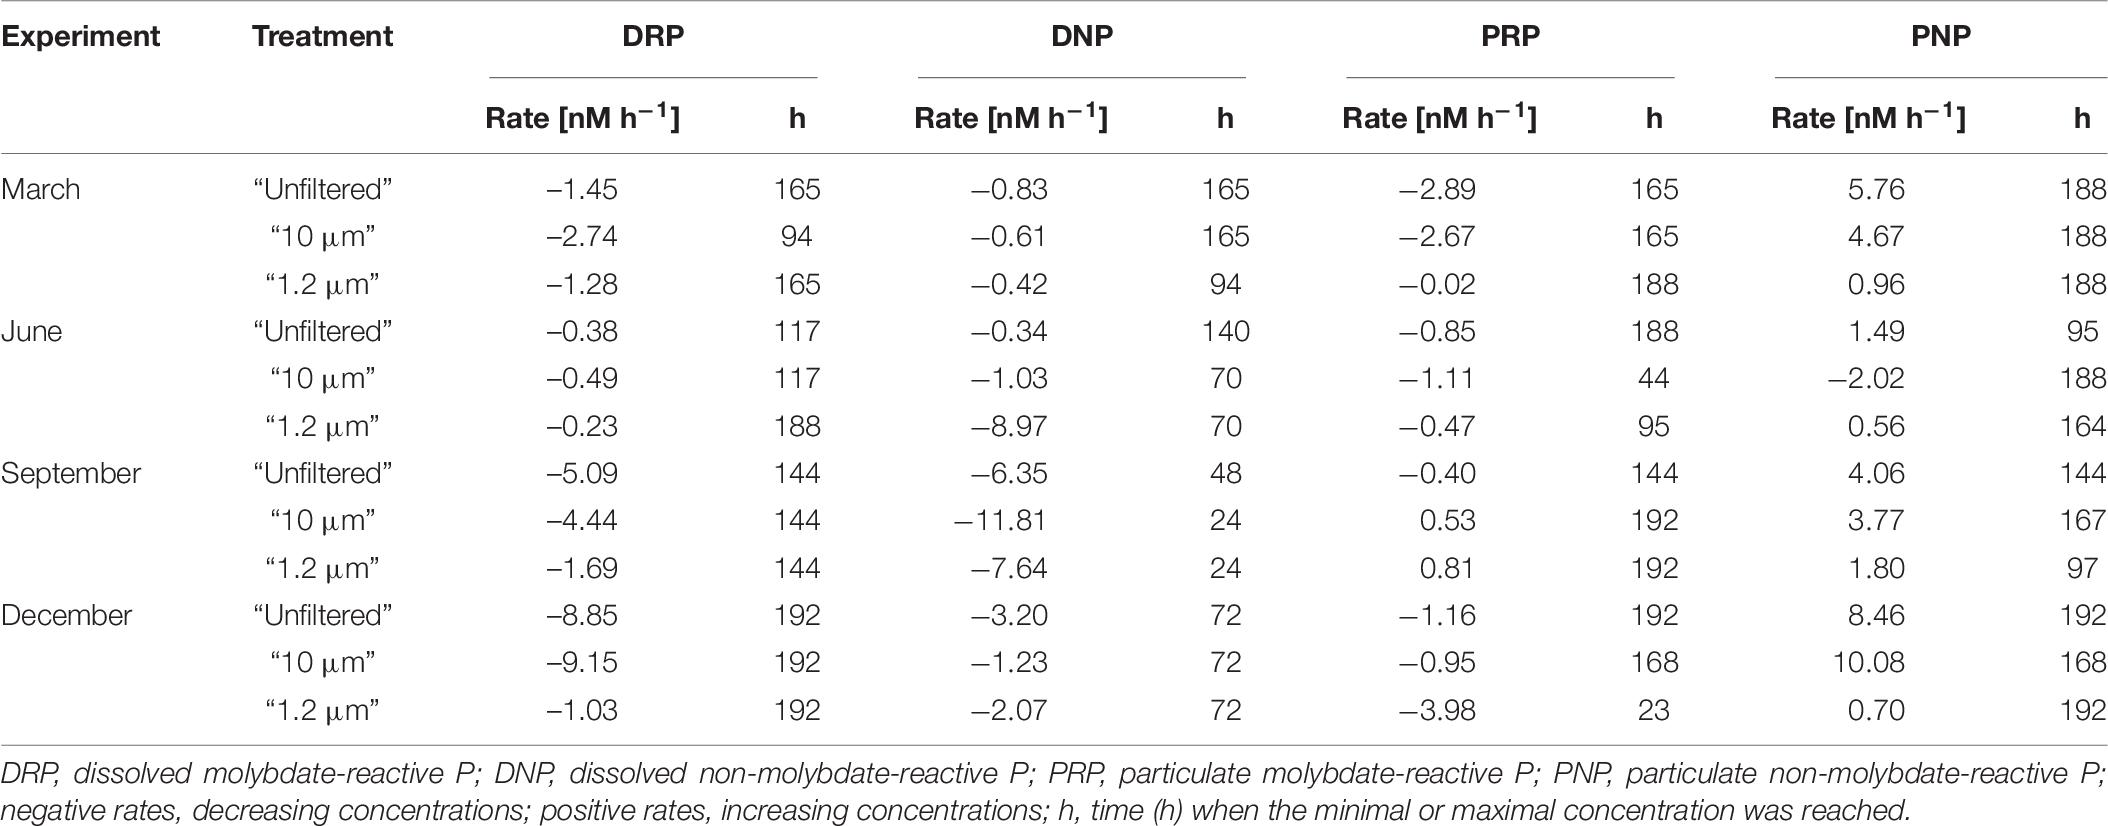
Table 7. Degradation rate of the phosphorus (P) fractions in experiments based on respective median values.
Compared with the DRP degradation rates in the Warnow Estuary, which varied form approximately −0.2 to −9.2 nM h–1, the uptake of PO43– in Hawaiian coastal waters had a lower range (usually between −2 and −4 nM h–1) but a similar dimension (Björkman and Karl, 1994). The documented DNP uptake rates for the Baltic Proper ranged from −0.4 to −4.9 nM h–1 (Nausch and Nausch, 2006). The DNP values in the estuary varied more than those in the Baltic Proper (between −0.3 and −11.8 nM h–1; Table 7). A reason for the wider range in the coastal area is potential competition among utilizing organisms. It has been proven that in addition to heterotrophic bacteria, phytoplankton can use DNP for growth in the absence of DRP (Björkman and Karl, 1994 and references therein).
Regarding the time when the minimum concentration was reached, DNP degraded the fastest among all the fractions. However, the highest DNP degradation rate (−11.81 nM h–1, “10 μm” treatment in September; Table 7 and Supplementary Material 6) indicates that the minimum concentration was approximately 50% of the starting concentration. In contrast, the degradation rates of DRP (−9.15 nM h–1 in the “10 μm” treatment in December; Table 7 and Supplementary Material 6) and PRP (−3.98 nM h–1, “1.2 μm” treatment in December; Table 7 and Supplementary Material 6) both peaked when the minimum concentrations of these fractions were under the detection limit.
During March, the degradation rates of DRP, DNP and PRP together with the build-up rate of PNP hinted at increases in biomass in the “unfiltered” and “10 μm” treatments. Biomass growth increased in both December and March, and the degradation and build-up rates were higher in December than in March. This finding indicated that a simulated spring bloom occurred in the December experiment, which is also demonstrated by the curves of the P, Chla and total particulate C concentrations. The water from the estuary was approximately 8°C when sampled and was stored at 15°C. Together with the day-night rhythm and the already available nutrients, spring conditions were simulated. Consequently, the biomass production of microorganisms, especially primary producers, such as diatom, began after an acclimation period of 4 days (Figure 3).
On average, DNP reached its minimum concentration after 72 h (median over all experiments and treatments), DRP reached its minimum after approximately 154 h (median over all experiments and treatments) and PRP reached its minimum after approximately 166 h (median over all experiments and treatments). Usually, the PNP concentration was highest at the end of the experiments (median approximately 178 h). Thus, although DNP was used first, DRP generally had higher degradation rates, especially in the “unfiltered” and “10 μm” treatments. Thus, DRP appears to be preferred over DNP (Nausch and Nausch, 2006 and references therein). However, our research seems to support at least some concurrent use. The utilization of PRP depends on the concentration of both PRP and DRP, which is consistent with the results of Sonzogni et al. (1982), who found that the release of particulate P from suspended sediment particles depends on the DRP concentration in the surrounding water. Furthermore, our results indicate that a higher PRP concentration corresponds to a higher PRP degradation rate compared to that of DRP (Figure 1).
Moreover, the differences between seasons present greater fluidity under climate change; thus, the results should be interpreted with caution (Kahru et al., 2016; Wasmund et al., 2019). Rönspieß et al. (2020) stated that differentiation via meteorological seasons was not practical in the Warnow Estuary. However, seasonal differences in bioavailability were generally observed. In March, PRP showed the highest degradation rate (−2.67 nM h–1 as the median over all treatments). In June and September, when N was limiting, DNP had the highest degradation rate (−1.03 nM h–1 in June and −7.64 nM h–1 in September as the median over all treatments). In December, DRP had the highest degradation rate (−8.85 nM h–1 as the median over all treatments). These findings indicate that the water sampled from the Warnow Estuary in March was collected after the peak of the spring bloom had been reached. The June and September samplings represented the summer nutrient limitation situation in the estuary, with June representing the beginning of summer and September representing the end of summer. In December, the nutrients in the water samples were mostly re-mineralized. Thus, we observed a simulated spring bloom in the laboratory. Finally, in terms of the uptake of BAP, our results are consistent with that of Sonzogni et al. (1982), who stated that DRP uptake depends on several factors (levels of other essential nutrients, algal species and abundances, light, temperature, and pH). The seasonal effect of the level of N, which is an essential nutrient for life, was particularly evident because the BAP in the ecosystem was not utilized under N limitation (Figure 1).
In summary, BAP consists of DRP, DNP and PRP. BAP as a percentage of TP also varied seasonally and ranged between 20 and 94% among all the treatments (Table 8). The TP concentration in the “1.2 μm” treatment was 28–96% (Table 3) of that in the “unfiltered” treatment, and the proportion of BAP to TP was higher in the “1.2 μm” treatment than in the other treatments. However, the starting concentrations of BAP in the “1.2 μm” treatment were similar to those in the “unfiltered” and “10 μm” treatments (Supplementary Material 6). The difference is that in the “unfiltered” and “10 μm” treatments, more PNP was built up (Table 7).
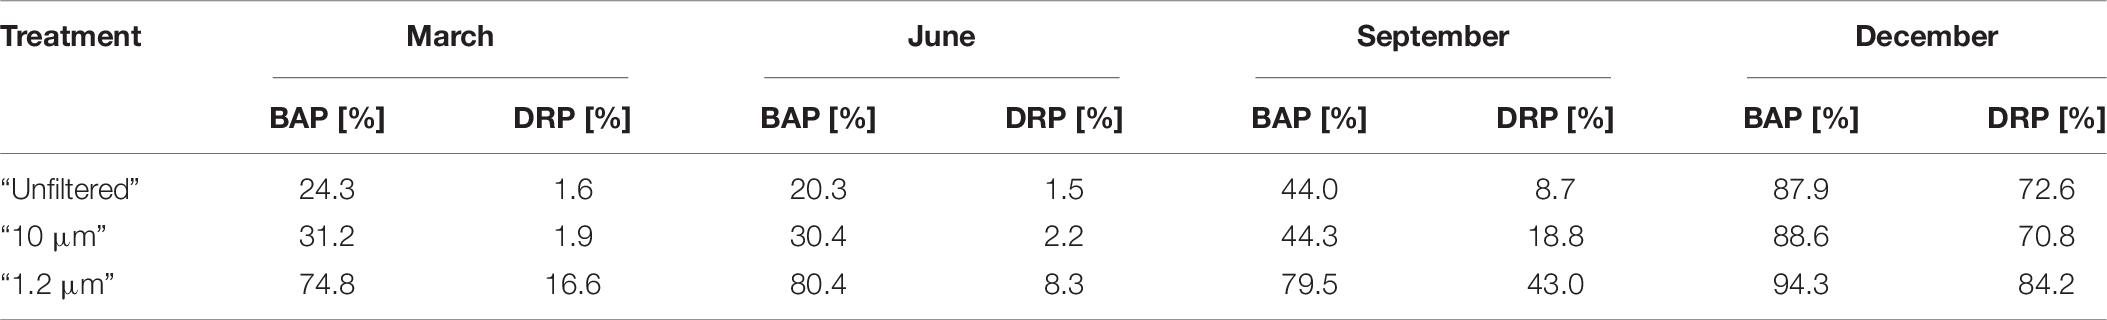
Table 8. Bioavailable phosphorus (BAP) and dissolved molybdate-reactive phosphorus (DRP) as an amount of the total phosphorus (TP) differentiated via the different treatments and experiments based on respective median values.
Comparing the proportions of BAP and DRP in the TP, DRP always accounted for less of the TP than BAP (Table 8), although the DRP was up to 100% bioavailable. The ratio of DRP to BAP was higher during the December experiment than during the other experiments. Consequently, in March, June, and September, the BAP content was more dependent on the use of P by the biological community than in December.
Focusing on the natural (“unfiltered”) treatment, because of the higher proportion of BAP than DRP in the TP, monitoring DRP only would lead to an underestimation of the potential for eutrophication by approximately 21% (median of the differences between BAP and DRP in the experiments). Thus, the advice given by Rönspieß et al. (2020) to extend the scope of the monitoring and include DNP, PRP and PNP should be followed. The minimum DRP, DNP and PRP should be monitored regularly because those P fractions are definitely bioavailable over short-term scales. The DNP and PRP fractions were more important during the summer half-year than during the winter months, when the biological community was inactive. This appears to support the hypothesis that only DRP or PO43– is directly taken up by microorganisms. Consequently, DNP and PRP were transformed into DRP very quickly. These transformations are likely regulated by microorganisms (e.g., Hagström et al., 2001; Nausch and Nausch, 2004).
Conclusion
In the following the answers to the three initial questions were summarized according to the findings of the bioavailability experiments:
1. DRP, DNP and PRP are bioavailable over short-term scales (within several days). Consequently, they should be included into regular monitoring programs for a better estimation of eutrophication (avoiding an underestimation of approximately 21%).
2. The bioavailability of the different P fractions varied seasonally depending on their availability, on those of other nutrients (e.g., N), and on the biological community using the P fractions.
3. A clear trend which group of organisms is utilizing which P fraction was not clearly observed. However, DNP is most likely taken up by heterotrophic bacteria.
Data Availability Statement
The original contributions presented in the study are included in the article/Supplementary Material, further inquiries can be directed to the corresponding author/s.
Author Contributions
LR planned and conducted the experiments, analyzed the samples, interpreted the data, and wrote the manuscript. DS-B and GN supported LR during the writing process with ideas for the manuscript design. All authors involved in contributing the conception and design of the study, manuscript revision, and read and approved the submitted version.
Funding
This study was part of the PhosWaM project (Phosphorus from source to sea—Integrated phosphorus and water resource management for sustainable water protection), which was funded by the Federal Ministry of Education and Research, Germany (FKZ 033W042A). It was also performed within the scope of the Leibniz Science Campus Phosphorus Research Rostock.
Conflict of Interest
The authors declare that the research was conducted in the absence of any commercial or financial relationships that could be construed as a potential conflict of interest.
Publisher’s Note
All claims expressed in this article are solely those of the authors and do not necessarily represent those of their affiliated organizations, or those of the publisher, the editors and the reviewers. Any product that may be evaluated in this article, or claim that may be made by its manufacturer, is not guaranteed or endorsed by the publisher.
Acknowledgments
We would like to thank Susanne Busch, Madleen Dierken, Jenny Jeschek, Annett Grüttmüller, Katja Käding, and Jens Ringel for their assistance in the lab and Franziska Bitschofsky, Sandra Jahn, and Monika Nausch for discussing their experiments with us and providing additional perspectives for the implementation and discussion of the results of the designed experiments. LR would also like to thank Malte Pallentin for his company in the lab on weekends.
Supplementary Material
The Supplementary Material for this article can be found online at: https://www.frontiersin.org/articles/10.3389/fmars.2021.715238/full#supplementary-material
Abbreviations
Σ N, sum of nitrate and nitrite; BSAP, Baltic Sea Action Plan; C, carbon; Chla, chlorophyll a; cyanos, Cyanophyceae/Cyanobacteria; DIP, dissolved inorganic phosphorus; DNP, dissolved non-molybdate-reactive phosphorus; DOP, dissolved organic phosphorus; DRP, dissolved molybdate-reactive phosphorus; HELCOM, Helsinki Commission; MSFD, Marine Strategy Framework Directive; N, nitrogen; P, phosphorus; PIP, particulate inorganic phosphorus; PNP, particulate non-molybdate-reactive phosphorus; PO43–, phosphate; POP, particulate organic phosphorus; PRP, particulate molybdate-reactive phosphorus; TP, total phosphorus; WFD, Water Framework Directive.
References
Bachor, A. (2005). Nährstoff- und Schwermetallbilanzen der Küstengewässer Mecklenburg-Vorpommerns unter besonderer Berücksichtigung ihrer Sedimente. Mecklenburg-Vorpommern: Landesamt für Umwelt, Naturschutz und Geologie, 233.
Bitschofsky, F., and Nausch, M. (2019). Spatial and seasonal variations in phosphorus speciation along a river in a lowland catchment (Warnow, Germany). Sci. Tot. Environ. 657, 671–685. doi: 10.1016/j.scitotenv.2018.12.009
Björkman, K., and Karl, D. M. (1994). Bioavailability of inorganic and organic phosphorus compounds to natural assemblages of microorganisms in Hawaiian coastal waters. Mar. Ecol. Prog. Ser. 111, 265–273. doi: 10.3354/meps111265
Boström, B., Persson, G., and Broberg, B. (1988). Bioavailability of different phosphorus forms in freshwater systems. Hydrobiologia 170, 133–155. doi: 10.1007/bf00024902
Chrislock, M. F., Doster, E., Zitomer, R. A., and Wilson, A. E. (2013). Eutrophcation: Causes, Consequences, and Control in Aquatic Ecosystems. Nature Education Knowledge 4, 1–10.
Ehrhardt, M., and Koeve, W. (1999). “Determination of particulate organic carbon and nitrogen,” in Methods Of Seawater Analysis, 3rd Edn, eds K. Grasshoff, M. Ehrhardt, and M. Kremling (Weinheim: Verlag Chemie), 437–444. doi: 10.1002/9783527613984.ch17
Ekholm, P. (1994). Bioavailability of phosphorus in agriculturally loaded rivers in southern Finland. Hydrobiologia 287, 179–194. doi: 10.1007/BF00010733
Felgentreu, L., Nausch, G., Bitschofsky, F., Nausch, M., and Schulz-Bull, D. (2018). Colorimetric chemical differentiation and detection of phosphorus in eutrophic and high particulate waters: advantages of a new monitoring approach. Front. Mar. Sci. 5:212. doi: 10.3389/fmars.2018.00212
Finni, T., Kononen, K., Olsonen, R., and Wallström, K. (2001). The history of cyanobacterial blooms in the baltic sea. AMBIO 30, 172–178. doi: 10.1579/0044-7447-30.4.172
Fleming, R. H. (1940). The composition of plankton and units for reporting populations and production. Proc. Paci. Sci. Congr. 3, 535–539.
Gasol, J. M. (1999). How to count picoalgae and bacteria with the FACScalibur flow cytometer. Barcelona: Department Biología Marina y Oceanografía.
Godwin, C. M., and Cotner, J. B. (2015). Aquatic heterotrophic bacteria have highly flexible phosphorus content and biomass stoichiometry. ISME J. 9, 2324–2327. doi: 10.1038/ismej.2015.34
Gustafsson, B. G., Schenk, F., Blenckner, T., Eilola, K., Meier, H. E. M., Müller-Karulis, B., et al. (2012). Reconstructing the Development of Baltic Sea Eutrophication 1850-2006. Ambio 41, 534–548. doi: 10.1007/s13280-012-0318-x
Hagström, Å, Azam, F., Kuparinen, J., and Zweifel, U.-L. (2001). “Pelagic plankton growth and resource limitations in the Baltic Sea,” in A Systems Analysis of the Baltic Sea. Ecological Studies (Analysis and Synthesis), Vol 148, eds F. V. Wulff, L. A. Rahm, and P. Larsson (Berlin: Springer), 177–210. doi: 10.1007/978-3-662-04453-7_7
Hecky, R. E., and Kilham, P. (1988). Nutrient limitation of phytoplankton in freshwater and marine environments: a review of recent evidence on the effects of enrichment. Limnol. Oceanogr. 33, 796–822. doi: 10.4319/lo.1988.33.4part2.0796
HELCOM. (2007). “HELCOM baltic sea action plan,” in Proceedings of the HELCOM Extraordinary Ministerial Meeting, Krakow, 101.
HELCOM. (2013). Taking further action to implement the Baltic Sea action plan - reaching good environmental status for a healthy Baltic Sea. Copenhagen: Baltic Marine Environment Protection Commission.
HELCOM. (2017a). Manual for Marine Monitoring in the COMBINE Programme of HELCOM. Washington: Helsinki Commission.
HELCOM. (2017c). Monitoring of phytoplankton species composition, abundance and biomass – proposed update of HELCOM monitoring guidelines. Helsinki: HELCOM.
HELCOM. (2018a). HELCOM Activities Report-Implementation of the Baltic Sea Action Plan. Baltic Sea Environment Proceedings 154:89.
HELCOM. (2018b). State of the Baltic Sea-second HELCOM holistic assessment 2011-2016. Baltic Sea Environment Proceedings 155:155.
Jarvie, H. P., Withers, P. J. A., and Neal, C. (2002). Review of robust measurement of phosphorus in river water: sampling, storage, fractionation and sensitivity. Hydrol. Earth Sys. Sci. 6, 113–131. doi: 10.5194/hess-6-113-2002
Jessen, C., Bednarz, V. N., Rix, L., Teichberg, M., Wild, C. (2015). “Marine eutrophication,” in Environmental Indicators, eds R. H. Armon and O., Hänninen Dodrecht: Springer Science + Business Media, 177–203.
Kahru, M., Elmgren, R., and Savchuk, O. P. (2016). Changing seasonality of the Baltic Sea. Biogeosciences 13, 1009–1018. doi: 10.5194/bg-13-1009-2016
Koroleff, F. (1999). “Determination of nutrients,” in Methods of seawater analysis, 3rd Edn, eds K. Grasshoff, M. Ehrhardt, and K. Kremling (Verlag Chemie), 205–226.
Larsson, U., Elmgren, R., and Wulff, F. V. (1985). Eutrophication and the Baltic Sea: causes and consequences. Ambio 14, 9–14.
Lønborg, C., Davidson, K., Álvarez-Salgado, X. A., and Miller, A. E. J. (2009). Bioavailability and bacterial degradation rates of dissolved organic matter in a temperate coastal area during an annual cycle. Mar. Chem. 113, 219–226. doi: 10.1016/j.marchem.2009.02.003
LUNG. (2016). Konzept zur Minderung der diffusen Nährstoffeinträge aus der Landwirtschaft in die Oberflächengewässer und in das Grundwasser in Mecklenburg-Vorpommern - Fortschreibung für den zweiten Bewirtschaftungszeitraum 2016 bis 2021. Mecklenburg Vorpommern: Umwelt und Verbraucherschutz.
Murphy, J., and Riley, J. P. (1962). A modified single solution method for the determination of phosphate in natural waters. Anal. Chim. Acta 27, 31–36. doi: 10.1016/s0003-2670(00)88444-5
Nausch, G., Bachor, A., Petenati, T., Voß, J., and Von Weber, M. (2011). Nährstoffe in den deutschen Küstengewässern der Ostsee und angrenzenden Gebieten. Meeresumwelt Aktuell Nord- und Ostsee 1, 1–16.
Nausch, M., and Nausch, G. (2004). Bacterial utilization of phosphorus pools after nitrogen and carbon amendment and its relation to alkaline phosphatase activity. Aquat. Microb. Ecol. 37, 237–245. doi: 10.3354/ame037237
Nausch, M., and Nausch, G. (2006). Bioavailability of dissolved organic phosphorus in the Baltic Sea. Mar. Ecol. Prog. Ser. 321, 9–17. doi: 10.3354/meps321009
Nausch, M., and Nausch, G. (2007). Bioavailable dissolved organic phosphorus and phosphorus use by heterotrophic bacteria. Aquat. Biol. 1, 151–160. doi: 10.3354/ab00012
Nixon, S. W. (1995). Coastal marine eutrophication: a definition, social causes, and future concerns. Ophelia 41, 199–219. doi: 10.1080/00785236.1995.10422044
OECD. (1982). Eutrophication of waters: monitoring, assessment and control. Paris: Organisation for Economic Co-Operation and Development, 154.
Psenner, R., Pucsko, R., and Sager, M. (1984). Die Fraktionierung organischer und anorganischer Phosphorverbindungen von Sedimenten-Versuch einer Definition ökologisch wichtiger Fraktionen. Archiv für Hydrobiologie 10, 115–155.
Redfield, A. C., Ketchum, B. H., and Richards, F. A. (1963). “The influence of organisms on the composition of seawater,” in The Sea - Ideas and Observations on Progress in the Study of the Seas, Vol. 2, ed. M. N. Hill (New York, NY: John Wiley & Sons, Inc.), 26–77.
Reynolds, C. S., and Davies, P. S. (2001). Sources and bioavailability of phosphorus fractions in freshwaters: a British perspective. Biological reviews 76, 27–64. doi: 10.1017/S1464793100005625
Rönspieß, L., Dellwig, O., Lange, X., Nausch, G., and Schulz-Bull, D. (2020). Spatial and seasonal phosphorus dynamics in a eutrophic estuary of the southern Baltic Sea. Estuar. Coast. Shelf Sci. 233:106532. doi: 10.1016/j.ecss.2019.106532
Ruttenberg, K. C. (1992). Development of a sequential extraction method for different forms of phosphorus in marine sediments. Limnol. Oceanogr. 37, 1460–1482. doi: 10.4319/lo.1992.37.7.1460
Sonzogni, W. C., Chapra, S. C., Armstrong, D. E., and Logan, T. J. (1982). Bioavailability of Phosphorus Inputs to Lakes. J. Environ. Qual. 11, 555–563. doi: 10.2134/jeq1982.00472425001100040001x
Stepanauskas, R., Jørgensen, N. O. G., Eigaard, O. R., Žvikas, A., Tranvik, L. J., and Leonardson, L. (2002). Summer inputs of riverine nutrients to the Baltic Sea: bioavailability and eutrophication relevance. Ecol. Monogr. 72, 579–597. doi: 10.1890/0012-9615(2002)072[0579:siornt]2.0.co;2
Tang, X., Wu, M., and Li, R. (2018). Phosphorus distribution and bioavailability dynamics in the mainstream water and surface sediment of the Three Gorges Reservoir between 2003 and 2010. Water Res. 145, 321–331. doi: 10.1016/j.watres.2018.08.041
Thingstad, T. F., Skjoldal, E. F., and Bohne, R. A. (1993). Phosphorus cycling and algal-bacterial competition in Sandsfjord, western Norway. Mar. Ecol. Prog. Ser. 99, 239–259. doi: 10.3354/meps099239
Wasmund, N., Nausch, G., Gerth, M., Busch, S., Burmeister, C., Hansen, R., et al. (2019). Extension of the vegetation period of phytoplankton in the western Baltic Sea-response to climate change. Mar. Ecol. Prog. Ser. 622, 1–16. doi: 10.3354/meps12994
Wasmund, N., Topp, I., and Schories, D. (2006). Optimising the storage and extraction of chlorophyll samples. Oceanologia 48, 125–144.
Willén, T. (1962). Studies on the phytoplankton of some lakes connected with or recently isolated from the Baltic. Oikos 13, 169–199. doi: 10.2307/3565084
Keywords: bioavailability, phosphorus fractions, eutrophication potential, Warnow Estuary, Baltic Sea
Citation: Rönspieß L, Nausch G and Schulz-Bull D (2021) Bioavailability of Various Phosphorus Fractions and Their Seasonality in a Eutrophic Estuary in the Southern Baltic Sea – A Laboratory Approach. Front. Mar. Sci. 8:715238. doi: 10.3389/fmars.2021.715238
Received: 26 May 2021; Accepted: 31 July 2021;
Published: 20 August 2021.
Edited by:
Zheng Gong, Hohai University, ChinaCopyright © 2021 Rönspieß, Nausch and Schulz-Bull. This is an open-access article distributed under the terms of the Creative Commons Attribution License (CC BY). The use, distribution or reproduction in other forums is permitted, provided the original author(s) and the copyright owner(s) are credited and that the original publication in this journal is cited, in accordance with accepted academic practice. No use, distribution or reproduction is permitted which does not comply with these terms.
*Correspondence: Lisa Rönspieß, bGlzYS5yb2Vuc3BpZXNzQGlvLXdhcm5lbXVlbmRlLmRl