
95% of researchers rate our articles as excellent or good
Learn more about the work of our research integrity team to safeguard the quality of each article we publish.
Find out more
ORIGINAL RESEARCH article
Front. Mar. Sci. , 11 October 2021
Sec. Coastal Ocean Processes
Volume 8 - 2021 | https://doi.org/10.3389/fmars.2021.711832
This article is part of the Research Topic Oceanographic Processes Linking Nearshore, Continental Shelf, and Shelf Break View all 34 articles
Coastal oceans interacting with terrestrial ecosystems play an important role in biogeochemical cycles. It is therefore essential to research land–ocean interactions for further understanding of the processes influencing nutrients dynamics in coastal areas. We investigated the seasonal and spatial distribution of nutrient concentrations and light absorption coefficients of colored dissolved organic matter (CDOM), non-algal particles (NAP), and phytoplankton in a wetland-influenced river–eelgrass meadows–coastal waters continuum in the protected and semi-enclosed coastal sea of Akkeshi-ko estuary (AKE) and Akkeshi Bay (AB), Japan from April 2014 to February 2015. The mixing dilution lines of the CDOM absorption coefficient at 355 nm [aCDOM(355)] relative to salinity predicted by two end-members between freshwater and coastal water showed conservative mixing in AB. Silicate concentrations were significantly correlated with salinity and aCDOM(355) in AB in each month except for December 2014. These results suggest that silicate and CDOM in AB primarily originates from wetland-influenced river discharge. However, samples collected from the eelgrass meadows of AKE, where mariculture is developed, showed non-conservative mixing of silicate concentrations and aCDOM(355) with salinity except for June 2014. Elevated phosphate concentrations, probably released from sediments, were also found in the eelgrass meadows of AKE, especially during summer. These results suggest that the metabolic activities of mariculture and seagrass ecosystem significantly contribute to the nutrient cycles and CDOM absorption in AKE and to the distinct water-mass systems inside and outside AKE. The relative absorption properties of NAP [aNAP(443)], phytoplankton [aph(443)], and aCDOM(443) showed that CDOM is the main factor affecting the light distribution in AKE. However, the relative absorption properties varied seasonally in AB because of spring and autumn phytoplankton blooms and ice cover during winter. Significant relationships were observed between the Secchi disk depth (ZSD), aNAP(443), and aCDOM(443). Chl a concentration and aph(443) were not good indicators for predicting ZSD in our study region. These results suggest that incorporating inherent optical properties and CDOM from mariculture and seagrass ecosystem into ecosystem models could improve predictions of light distribution along the freshwater–eelgrass–coastal waters continuum in optically complex coastal waters.
Coastal oceans account for approximately 7–10% of the ocean’s surface, but contribute significantly to biogeochemical cycles (Walsh, 1991; Borges, 2005; Muller-Karger et al., 2005). The coastal ocean also provides important ecosystem services, including carbon burial in salt marshes (Duarte et al., 2005; Zedler and Kercher, 2005) and nursery habitats for many commercially valuable fish and carbon stocks (i.e., blue carbon) in seagrass beds (Fourqurean et al., 2012; Bertelli and Unsworth, 2014; Macreadie et al., 2019). However, the extent of coastal wetlands (Hu et al., 2017a,b) and seagrass beds (Waycott et al., 2009) is declining due to various anthropogenic activities. Coastal oceans are formed by the interconnection among several distinct ecosystems, such as rivers, coastal wetlands, including saltmarshes and seagrass meadows, estuaries, and the continental shelf (Hedges et al., 1997; Duarte et al., 2005; Bauer et al., 2013). It is therefore essential to research land–ocean interactions and the processes influencing the sources, sinks, exchange, and fate of nutrients in coastal areas.
In coastal areas, nutrients and particulate and dissolved organic matter (DOM) are transported from the land to the ocean through rivers (Blough et al., 1993; Hedges et al., 1997; Canuel and Hardison, 2016). Silicate chemical weathering is one of the most importance process for transporting dissolved silicate from land to coastal areas via rivers (Tréguer et al., 1995; Tréguer and De La Rocha, 2013). Especially, wetland ecosystems are large reservoirs of silicate and important places for silicate transport to the adjacent estuary (Struyf and Conley, 2009). Therefore, the relationship between salinity and silicate concentration is used to interpret conservative mixing between freshwater and seawater in coastal areas (e.g., Zhang et al., 2020). DOM is one of the largest carbon pools in most aquatic ecosystems (Ogawa and Tanoue, 2003; Hansell and Carlson, 2014). The portion of DOM that exhibits strong absorption in the ultraviolet (UV) and blue visible wavebands in water is defined as colored dissolved organic matter (CDOM) (Bricaud et al., 1981; Nelson and Seigel, 2013). CDOM mainly consists of fulvic and humic acids originating from soils, terrestrial land plants, and wetlands (Coble, 2007). In particular, wetlands provide an important source of DOM and CDOM from terrestrial to coastal environments (Yamashita et al., 2010; Tzortziou et al., 2011, 2015; Wagner et al., 2015; Najjar et al., 2018). The optical absorption properties of CDOM [aCDOM(λ)] can be used to identify different sources of DOM and dissolved organic carbon (DOC) along estuarine salinity gradients and are a valuable tool for tracing the influence of river discharge on coastal ecosystems (Coble, 2007; Stedmon and Nelson, 2014). The slope parameters of aCDOM(λ) at 275–295 nm (S275–295) and 350–400 nm (S350–400), as well as the ratio of the two spectral slope parameters (SR = S275–295/S350–400), are used as indicators of CDOM history in response to biological and photochemical changes (Helms et al., 2008; Fichot and Benner, 2012). CDOM also plays an important role in many biological and photochemical processes of the carbon cycle in aquatic environments. For example, the characteristics of UV-absorbing CDOM can protect UV-sensitive aquatic organisms (Tedetti and Sempéré, 2006), but can also alter and reduce the water transparency and intensity and spectral distribution of light in the water column (IOCCG, 2000). Thus, variability in nutrients, CDOM, and suspended sediments from rivers to coastal waters could affect the photosynthesis and photoacclimation strategies of primary producers, including seagrass (Waycott et al., 2005; Tanaka and Nakaoka, 2007; Park et al., 2021) and phytoplankton (Isada et al., 2013; Urtizberea et al., 2013).
The Bekanbeushi wetlands and Akkeshi-ko estuary (AKE), designated as wetland sites of international importance under the Ramsar Convention (Ramsar Information Sheet [RIS], 2005), are located in the eastern part of Hokkaido, Japan (Figure 1). The northern part of AKE is connected to the mouth of the Bekanbeushi River, which is a cold-temperate wetland-influenced river. In contrast, the southwestern part of AKE is connected to Akkeshi Bay (AB), which is affected by the Oyashio Current, a cold western boundary current in the western subarctic Pacific (Yasuda, 2003; Isada et al., 2019). The shallow areas of AKE are covered with eelgrass (Zostera marina) meadows. Additionally, mariculture of Manila clams and Pacific oysters is currently prospering in both AKE and AB (Hasegawa et al., 2014, 2015). Thus, the Akkeshi watershed is characterized by several distinct ecosystems: the Bekanbeushi wetland/river, salt marshes, eelgrass meadows, oyster and Manila clam mariculture, and the coastal waters of the Oyashio Current, as well as ice cover in AKE during winter (Figure 1). Maie et al. (2014) conducted snapshot observations of the DOC concentration and optical properties of CDOM at the mouth of AKE along the lower salinity range (salinity < 10) during summer, and suggested plankton and/or submerged aquatic vegetation as additional sources besides terrestrial inputs. Moreover, recent studies have shown the contribution of aquaculture as a source of CDOM in the water column (Zhang et al., 2018; Tanaka et al., 2019). Therefore, eelgrass meadows and mariculture in AKE may provide key CDOM cycles in the Akkeshi watershed. However, the seasonal and spatial distribution of nutrients and CDOM from the river through the brackish AKE to AB and the relationships between nutrients and light absorption properties have not yet been fully evaluated.
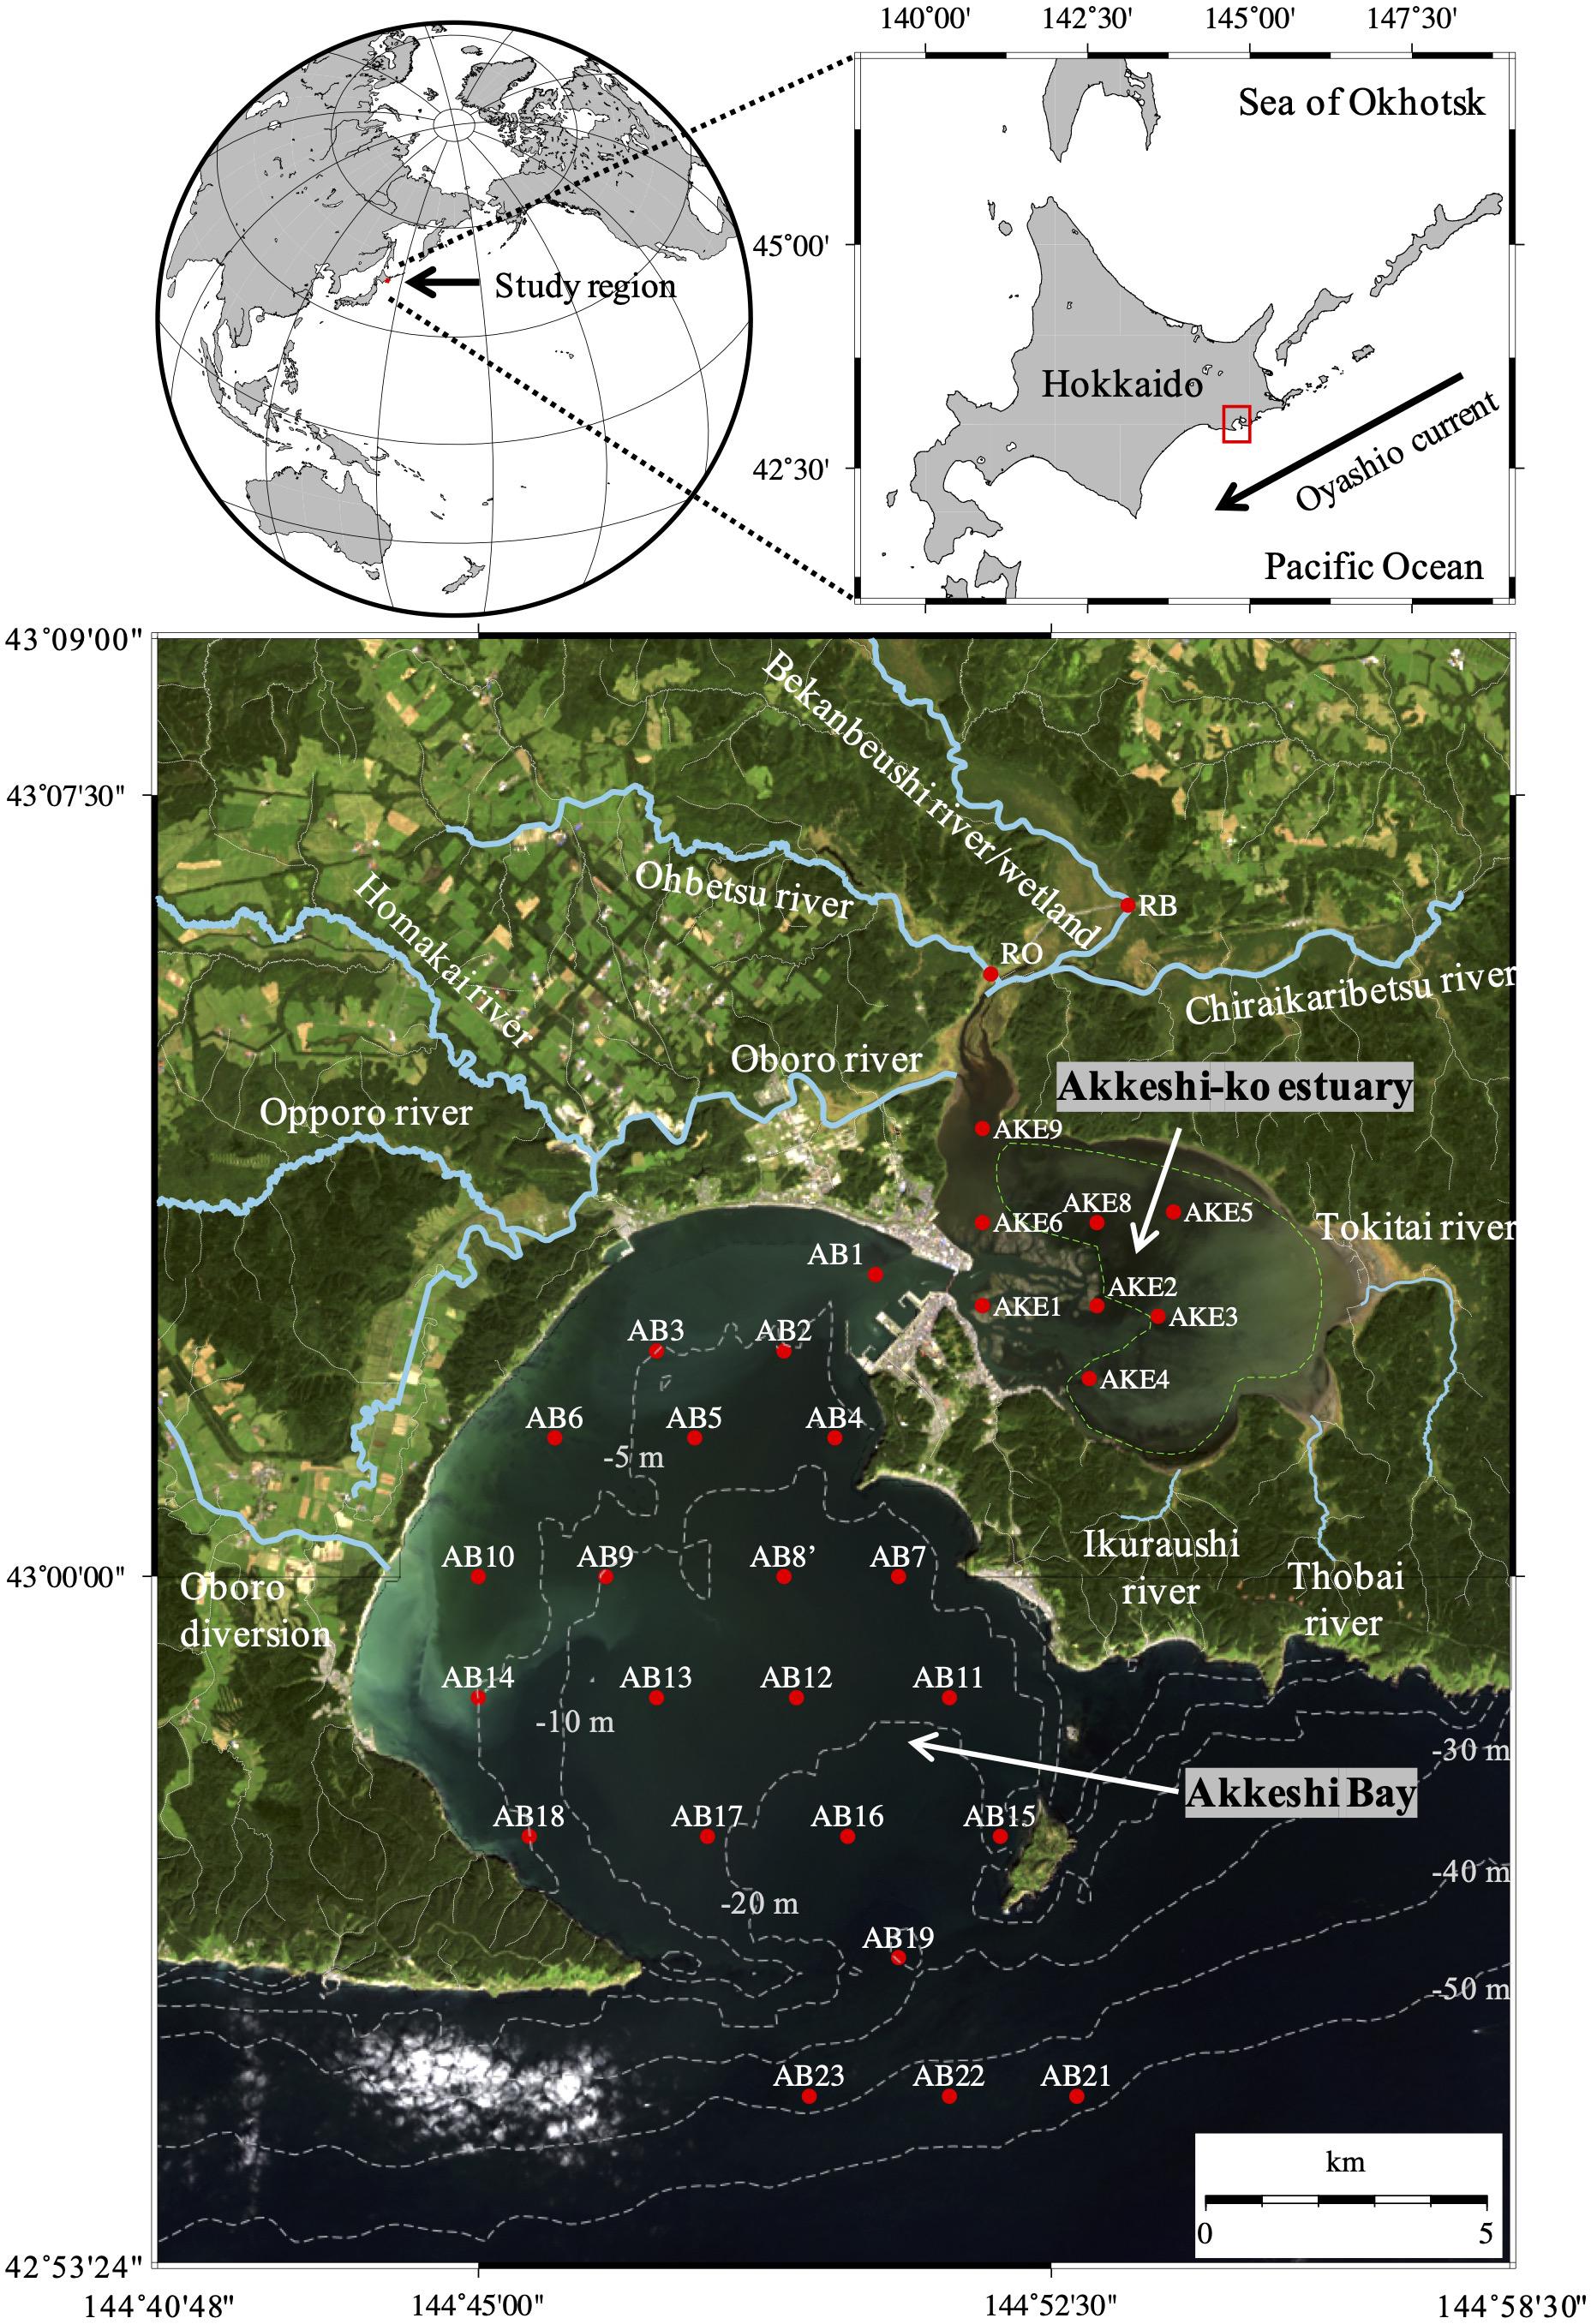
Figure 1. Sampling stations in the rivers (RO and RB), Akkeshi-ko estuary (AKE), and Akkeshi Bay (AB) superimposed on a quasi-true color image derived from Landsat 8 (USGS/NASA) on September 22, 2014. Area enclosed by the green dashed line in AKE represents the eelgrass (Zostera marina) meadow after Hasegawa et al. (2008).
Therefore, the objectives of this study are to: (1) characterize seasonal and spatial changes in the optical absorption properties of CDOM, phytoplankton, and non-algal particles (NAP) as a function of temperature, salinity, nutrients, and water transparency along the river–salt marsh–eelgrass meadows–coastal waters continuum in the semi-enclosed coastal sea of AKE and AB, Japan; and (2) identify the factors controlling water transparency in the water column of the Akkeshi watershed. The importance of integrating light absorption properties and CDOM from mariculture and eelgrass ecosystem into ecosystem models for predicting the intensity and spectral distribution of light in optically complex coastal waters is also discussed.
The Bekanbeushi wetland is the second largest wetland in Japan and includes the 43-km-long Bekanbeushi River, which is a cool-temperate river. The Bekanbeushi River runs through low moorland and is connected with the brackish water of AKE in the semi-enclosed coastal area (Figure 1). These regions (total area of 527.7 km2) were designated as a Ramsar wetland site in June 1993 (Ramsar Information Sheet [RIS], 2005) and a Quasi-National Park of Japan in March 2021. Although the upper stream of the catchment has experienced periods of deforestation (Inukai and Nishio, 1937), the Akkeshi watershed has largely preserved the natural characteristics of forests and wetlands because of its protected status, which is attributed to strong leadership from Akkeshi Town Government and the engagement of citizens and interest groups (Fletcher et al., 2011). The surface area of AKE is approximately 35 km2, and the water depth in most parts is typically less than 2 m. Most of AKE is covered with eelgrass, i.e., Zostera marina (Figure 1). From December to March, AKE and the rives are covered with ice. The Akkeshi watershed has a microtidal regime, and the tidal ranges during the spring and neap tides are approximately 1.2 and 0.7 m, respectively. AKE is connected to AB by a narrow channel 500 m wide and 10 m deep. The south of Akkeshi Bay is open to the western subarctic Pacific, and influenced by the cold Oyashio Current (Yasuda, 2003).
Water sampling was conducted at eight stations in AKE and 22 stations in AB from April 2014 to February 2015 on the research boats Etopirika, Umiaisa, and TR/V Misago Maru (Figure 1). Before water sampling, vertical profiles of temperature and salinity were measured with a conductivity, temperature, and depth (CTD) instrument (RINKO-Profiler, ASTD 102, JEF Advantech Inc.), with recording at 0.1-m intervals. In AB, water transparency in the water column was measured using a Secchi disk. The Secchi disk depth (ZSD, m) was defined as the depth of the disk when it was no longer viewable by an observer at the surface. In this study, ZSD was measured at 0.5-m intervals. Samples for subsequent analysis of nutrients, chlorophyll a (Chl a) concentrations, and light absorption coefficients of non-algal particles [aNAP(λ)], phytoplankton [aph(λ)], and CDOM [aCDOM(λ)] at the surface were collected using an acid-clean bucket. Sampling for the analysis of nutrients and aCDOM(λ) in the Bekanbeushi (RB) River was also conducted from April to November 2014, excluding August, when samples of aCDOM(λ) were taken only from Ohbetsu (RO) River. The salinity at both stations was assumed to be zero (Nagao et al., 2016).
Samples for nutrient analysis (50 mL) were filtered through a 0.45-μm syringe filter (ADVANTEC MFS, Inc.) and stored at −80°C in a deep freezer prior to analysis. Nitrates and nitrites (hereafter denoted as nitrates), phosphate, and silicate concentrations were measured with a BL-Tec autoanalyzer (QuAAtro) and a BRAN + LUEBBE autoanalyzer (TRACCS 800). Nutrient concentrations measured in this study were quality controlled against reference material for nutrients in seawater (RMNS) (KANSO TECHNOS CO., Ltd.) (Aoyama et al., 2012).
Samples (120–200 mL) were filtered through glass-fiber filters (Whatman GF/F, 25 mm diameter) under a gentle vacuum (<0.013 MPa). The filters were folded in half, blotted with filter paper, and soaked in 6 mL of N,N-dimethylformamide (FUJIFILM Wako Pure Chemical Corporation, Ltd.) in a FisherbrandTM Disposable borosilicate glass tubes (Fisher Scientific) at –20°C for more than 24 h (Suzuki and Ishimaru, 1990). The Chl a concentration was determined using a Turner Designs fluorometer (Model 10-AU) according to the non-acidification method of Welschmeyer (1994).
Water samples (200–1,000 mL) for the measurement of particle absorption were filtered through glass-fiber filters (Whatman GF/F, 25 mm diameter) under gentle vacuum pressure (<0.013 MPa). The filters were immediately analyzed on land. The optical density of all particles (ODp) was measured from 350 to 750 nm at 1-nm intervals using a double beam spectrophotometer (UV-2600, Shimadzu) equipped with an integrated sphere (ISR-2600, Shimadzu) following the glass-fiber filter technique of Kishino et al. (1985). A blank filter wetted with filtered seawater was used as a baseline correction. Next, the filters containing particles were soaked in a methanol solution to extract phytoplankton pigments. The extracted filters were then sufficiently rinsed with filtered seawater and measured to obtain the optical densities of non-algal particles (ODNAP). Correction for the path length amplification effect for the measured ODp and ODNAP values was performed using the equation of Stramski et al. (2015), which converted these values to absorption coefficients for particles [ap(λ)] and non-algal particles [aNAP(λ)]. The absorption coefficients of phytoplankton [aph(λ)] were obtained by subtracting aNAP(λ) from ap(λ).
For the measurement of aCDOM(λ), water samples were filtered into acid-cleaned amber glass bottles using 0.2-μm Nuclepore Trach-Etch membranes (Whatman, 47 mm diameter) under low vacuum pressure (<0.013 MPa). The optical density of CDOM [ODCDOM(λ)] was measured in a 10-cm quartz cylinder cell (Shimadzu) from 250 to 750 nm at 1-nm intervals using a double beam spectrophotometer (UV-2600, Shimadzu) with reference to Milli-Q water. A baseline correction for the ODCDOM(λ) spectrum was made following the method described in Babin et al. (2003). Finally, the measured ODCDOM(λ) values were converted into absorption coefficients for CDOM [aCDOM(λ)] using the following equation:
where 2.303 is a factor for converting between log10 and loge, and 0.1 is the optical path length (m). We also estimated the spectral slope parameter (S) of CDOM for wavelengths of 275–295 nm (S275–295) and 350–400 nm (S350–400), as well as their ratio (slope ratio, SR = S275–295/S350–400) following the methods of Helms et al. (2008) and Fichot and Benner (2012).
In this study, aCDOM(355) was used as a tracer of river discharge and CDOM abundance. To characterize the dominant absorption component, aCDOM(443), aNAP(443), and aph(443) were selected because of an absorption peak of chlorophyll pigments at 443 nm and ocean color remote sensing application. The values of aCDOM(443) were linearly correlated with aCDOM(355) in this study (y = 0.2258x + 0.0062, R2 = 0.995, n = 265).
The differences in temperature, salinity, Chl a concentration, and nutrient concentrations between AKE and AB in each month were evaluated using the Wilcoxon rank sum test. The relationships between nutrients, environmental variables (temperature, salinity, and Chl a concentration), and light absorption properties [aCDOM(355), aCDOM(443), aph(443), aNAP(443)] in AKE and AB were evaluated using the non-parametric Kendall rank correlation coefficient (τ). In this study, a p-value less than 0.01 is defined as statistically significant. The data with small sample size (n < 5) were eliminated for the Kendall rank correlation analysis. The linear regression analysis was performed to examine conservative mixing between salinity and aCDOM(355) in AKE and AB samples and to calculate the mixing lines by two end-members between freshwater and coastal water. The relationships among water transparency (ZSD), Chl a concentrations, and optical absorption properties in AB were evaluated using linear regression of the log-transformed power law function. All statistical analyses were conducted with the R software v. 4.1.1 (R Core Team, 2021) with exactRankTests (Hothorn and Hornik, 2021) and psych (Revelle, 2021) packages.
The hydrographic conditions in AKE and AB during this study period showed remarkable seasonal and spatial changes in temperature and salinity (Table 1 and Figure 2). A high to low spatial gradient of sea surface temperature (SST) was found from AKE to AB during April to September 2014 (Wilcoxon rank sum test; each month: p < 0.001) (Figures 2A–F). In contrast, low to high SST gradients were found from AKE to AB in October and December 2014 and January 2015 (Wilcoxon rank sum test; each month: p < 0.01) (Figures 2G,I,J). No significant difference in SST between AKE and AB was found in November 2014 (Wilcoxon rank sum test; p = 0.07) (Figure 2H). The SST of AB in February 2015 was less than 0°C. Salinity at the surface (SSS) showed low to high spatial gradients from AKE to AB throughout the study period due to the influence of river discharge (Wilcoxon rank sum test; each month: p < 0.01).
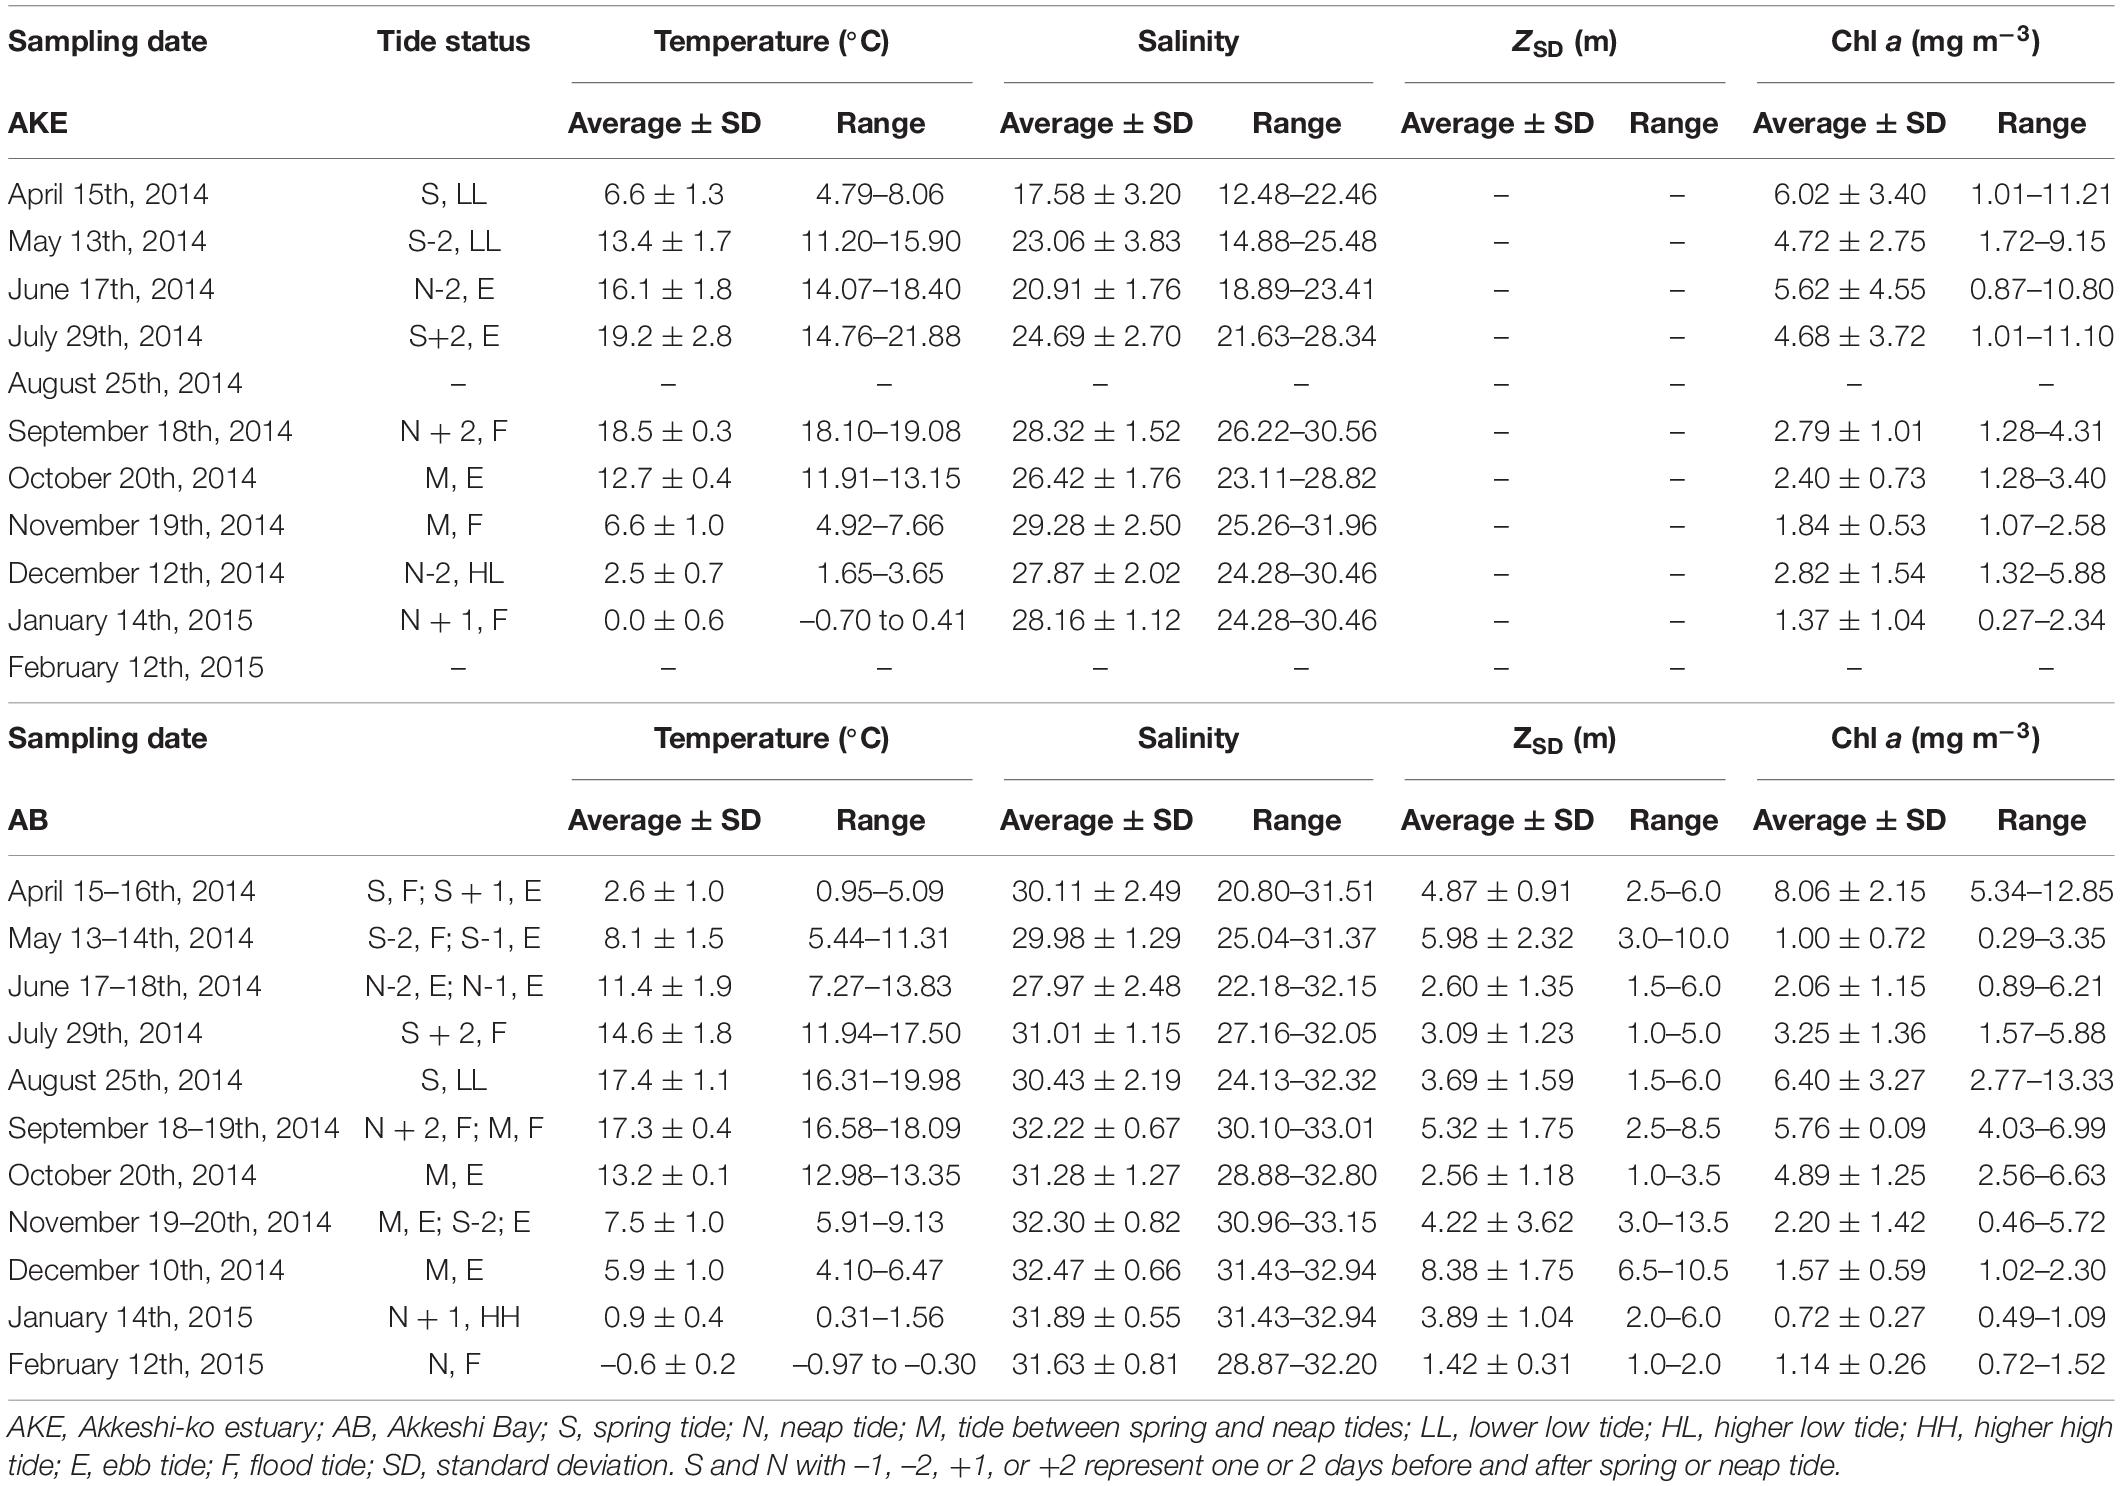
Table 1. Summary of temperature, salinity, and Chl a concentration at the surface and Secchi disk depth (ZSD) during sampling cruises.
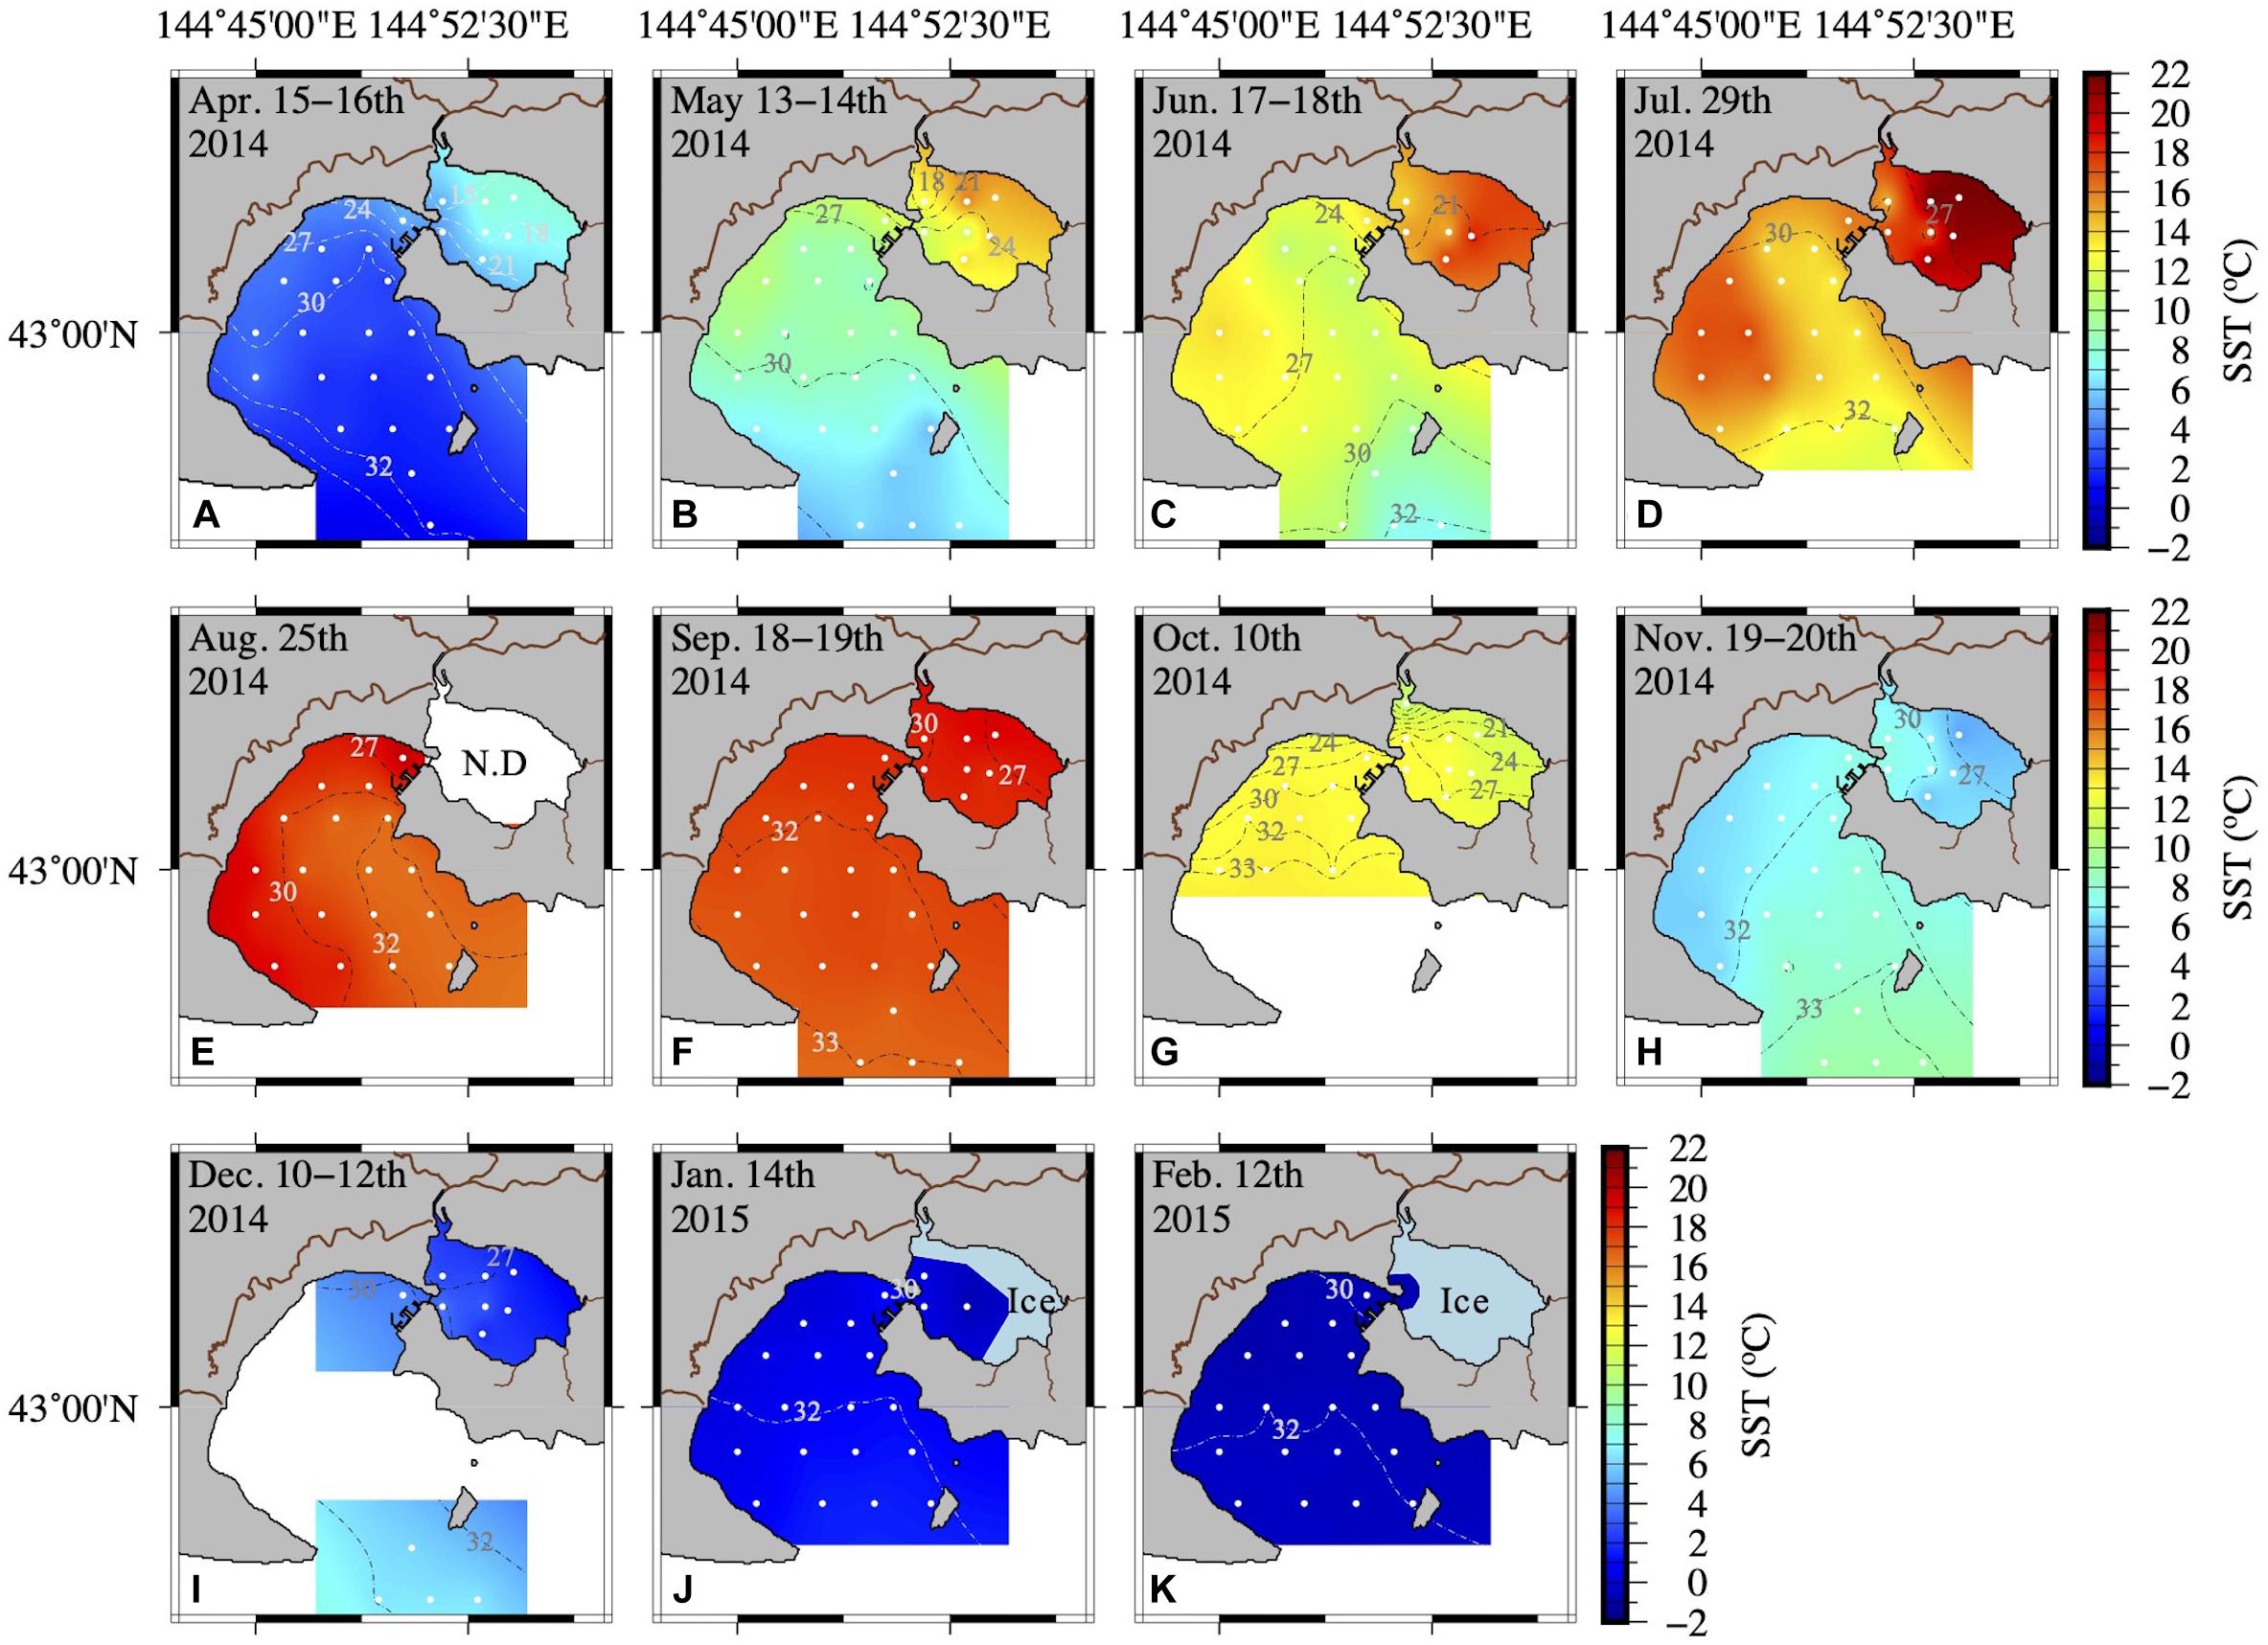
Figure 2. Spatial distribution of seawater temperature and salinity at the surface (A–K) from April 2014 to February 2015. Inter- and extrapolation of temperature and salinity were implemented by the General Mapping Tools. White symbols and dashed lines in each figure represent the sampling sites and salinity, respectively.
Nitrates remained from April to June 2014 in AKE due to fresh water from snowmelt, but were almost depleted from April to August of 2014 in AB (Table 1 and Figures 3A,B). After August 2014, the nitrate concentrations in both AKE and AB gradually increased. Higher nitrate concentrations were found in AKE and AB in January and February 2015. Phosphate concentrations in AKE showed seasonal changes, with the highest concentrations in September 2014 (Figure 3C). The phosphate concentrations in AB relatively remained stable from April to August 2014 then increased slightly after August 2014 (Figure 3D). The phosphate concentrations in AB were significantly higher than those in AKE in April 2014 and January 2015 (Wilcoxon rank sum test; each month: p < 0.01). In contrast, the phosphate concentrations in AKE were significantly higher than those in AB in July, September, and October 2014 (Wilcoxon rank sum test; each month: p < 0.01). Silicates were not depleted at either station throughout the study period (Figures 3E,F). The silicate concentrations in AKE were higher than those in AB throughout the study period (Wilcoxon rank sum test; each month: p < 0.01) except for June 2014. To better understand the potentially limiting nutrients for primary production of phytoplankton, nutrient ratios were compared to the Redfield ratio (N:P:Si = 16:1:16; Redfield, 1958) (Figures 3G,H). Higher Si:N ratios (>1) relative to the Redfield ratio were found in almost all samples throughout the study period. Nutrient concentrations in rivers exhibited higher N:P ratios (>16). Although the N:P ratios of some samples taken from AKE and AB in April (n = 9), May 2014 (n = 1), and January 2015 (n = 1) were higher than the Redfield ratio of 16:1, the N:P ratios of all other samples taken in AKE and AB (n = 228) fell within the stoichiometric N-limited range.
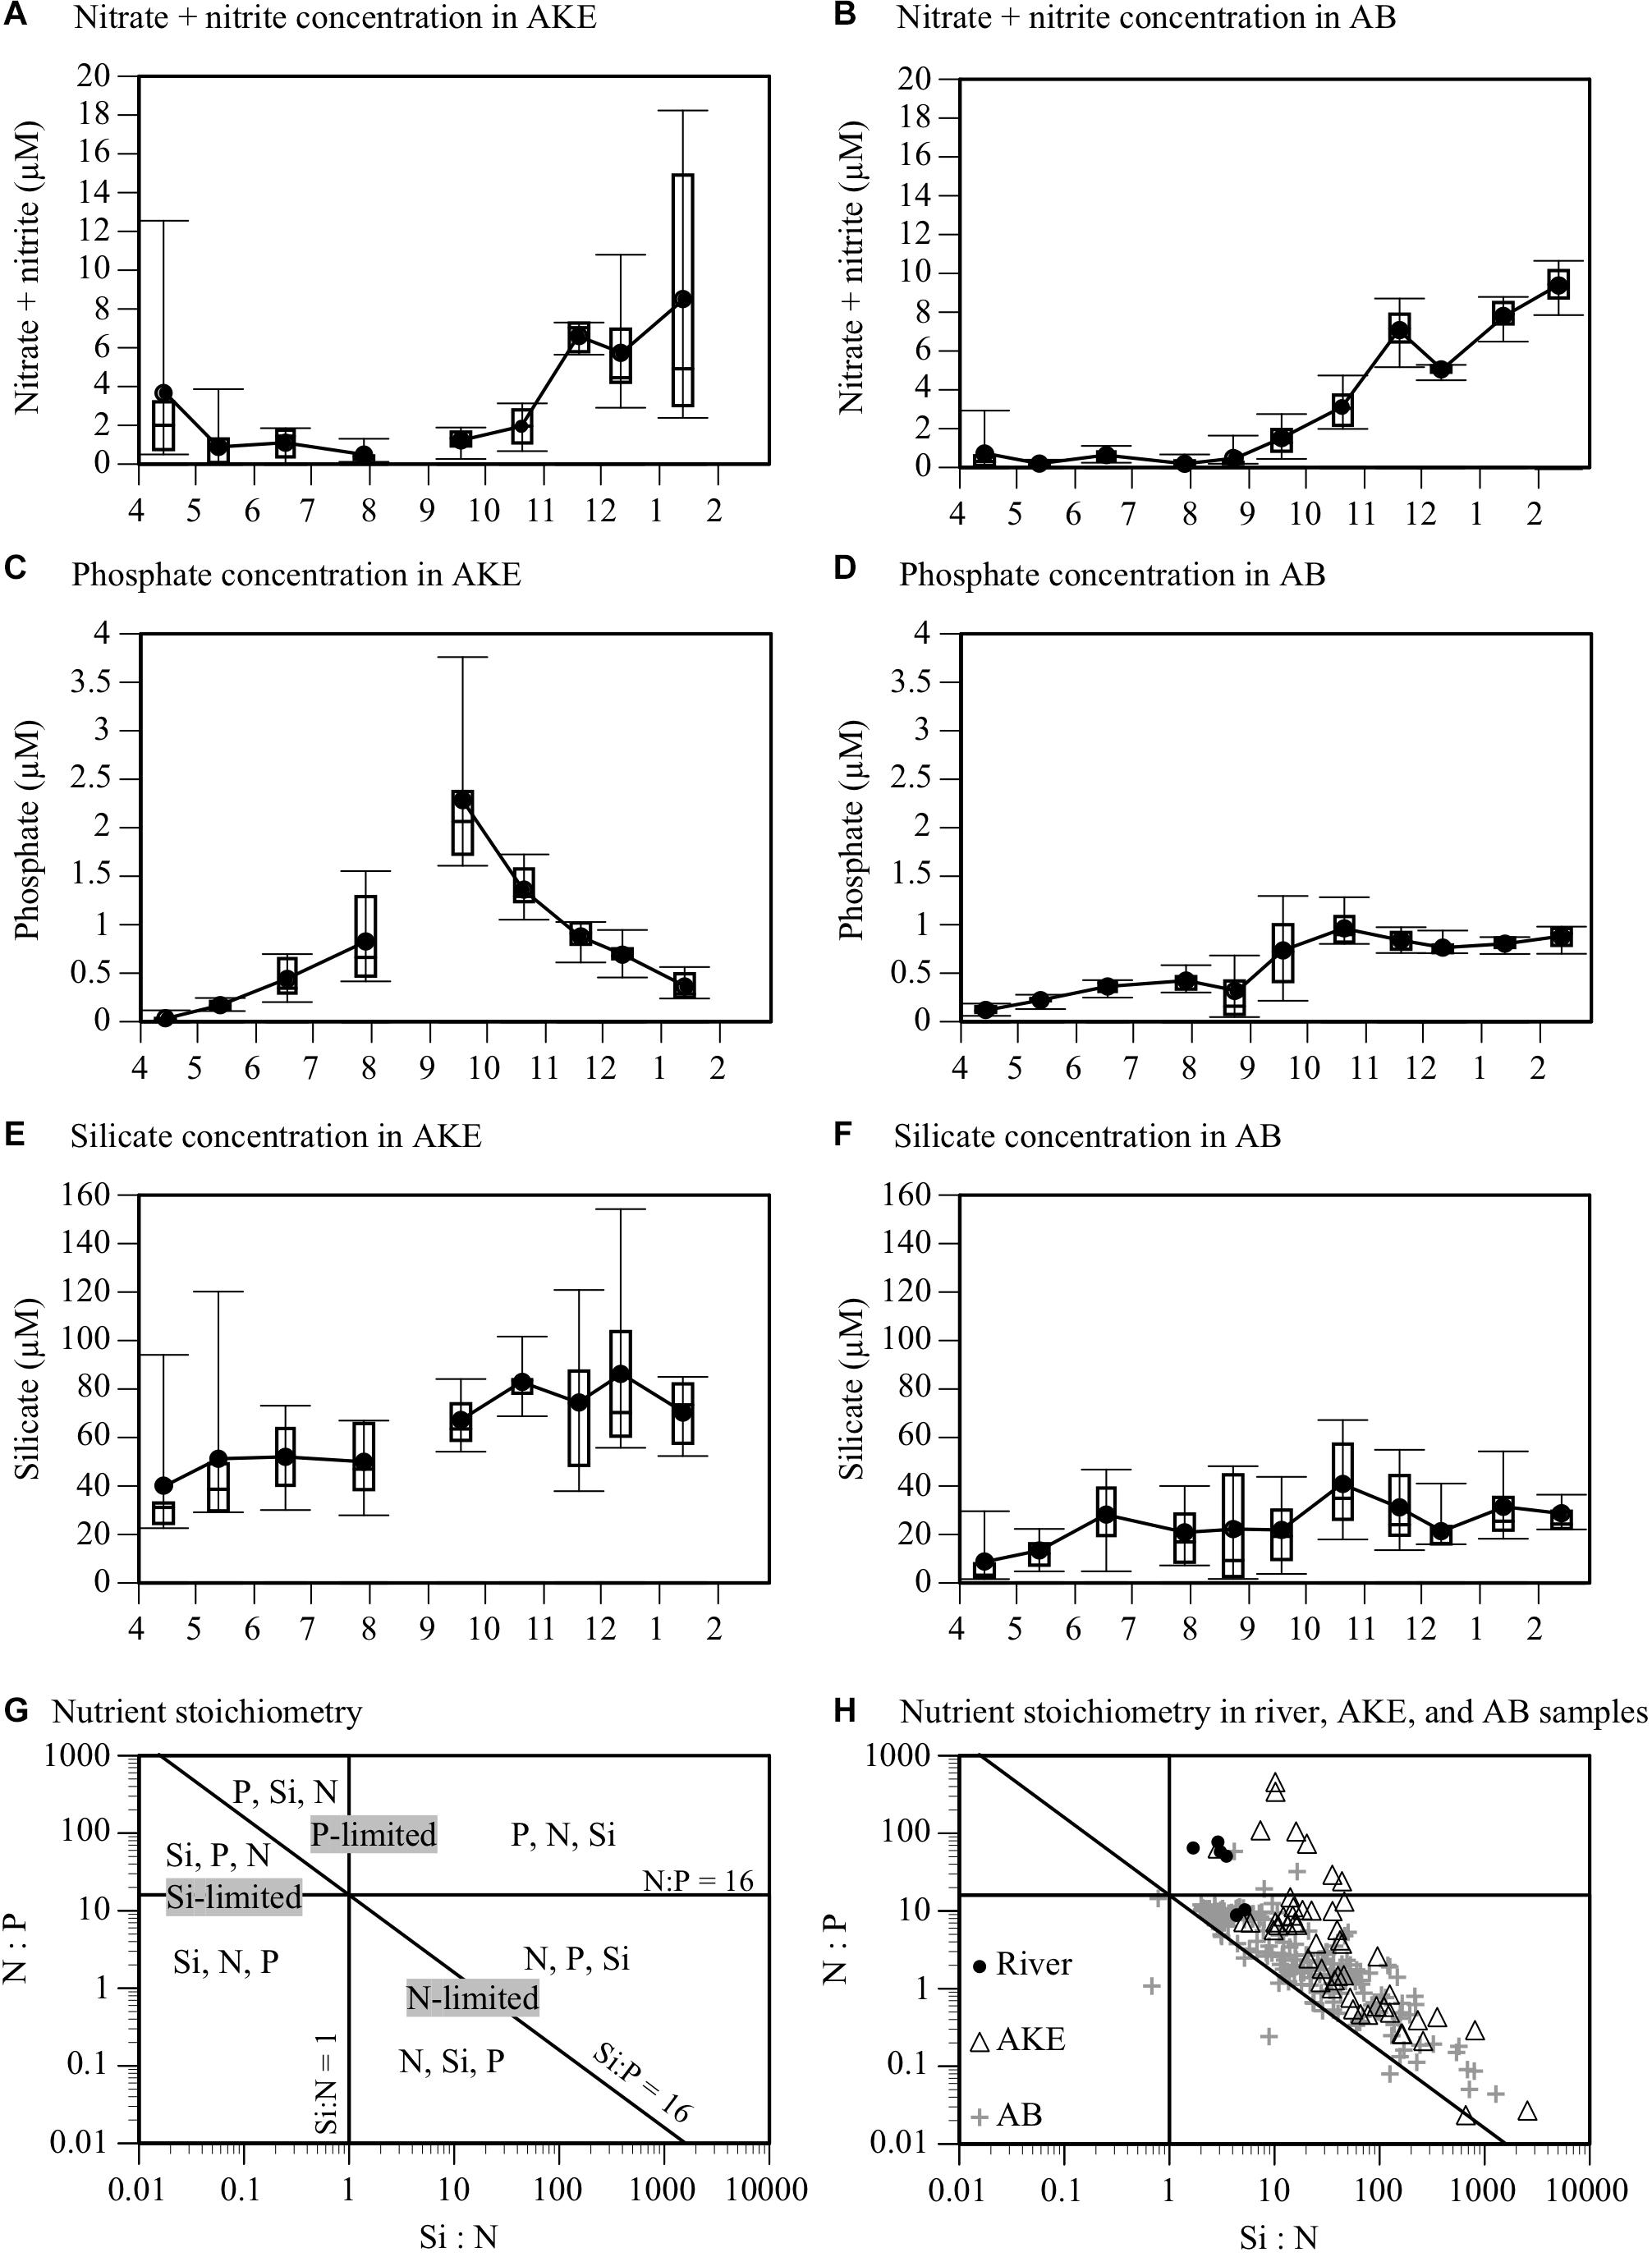
Figure 3. Time-series box plots of (A,B) nitrate plus nitrite, (C,D) phosphate, and (E,F) silicate concentrations in AKE and AB from April 2014 to February 2015. Rectangles, horizontal lines in boxes, black closed circles, and I-bars represent inter-quartile ranges, medians, means, and minimum and maximum values, respectively, except for outliers exceeding 1.5 times the interquartile range. (G) Synthetic graph of the N:P:Si nutrient stoichiometric ratio. The vertical (Si:N), horizontal (N:P), and diagonal (Si:P) lines and each area delimited by the lines represent the Redfield ratio (N:P:Si = 16:1:16) and the potential limiting nutrients. Nutrients are given in the order of their limitations for each area determined by the Redfield ratio. (H) Scatter plot of N:P:Si ratio at the surface in rivers, AKE, and AB from April 2014 to February 2015.
The Chl a concentration in AKE and AB showed more than a 40-fold variation across all seasons. Spring phytoplankton blooms with higher Chl a concentrations were found in AB in April 2014 (Table 1 and Figure 4A). Subsequently, Chl a concentrations at the surface were low in AB. Spatially heterogeneous Chl a concentrations were found in AKE from April to July 2014 and in AB in August 2014 (Figures 4A–E). Although Chl a concentrations in AKE were significantly higher than those in AB in May 2014 (Wilcoxon rank sum test; p < 0.001), the opposite trend was observed from September to October 2014 (Wilcoxon rank sum test; September: p < 0.001; October: p < 0.01) (Figures 4F,G). In other seasons, no significant difference in Chl a concentration between AKE and AB was found (Figures 4A,C,D,H–K). Secchi disk depths (ZSD) in AB showed a 10-fold variation across all seasons. Higher values of ZSD were observed in November and December 2014, whereas lower values of ZSD were observed in February 2015 (Table 1).
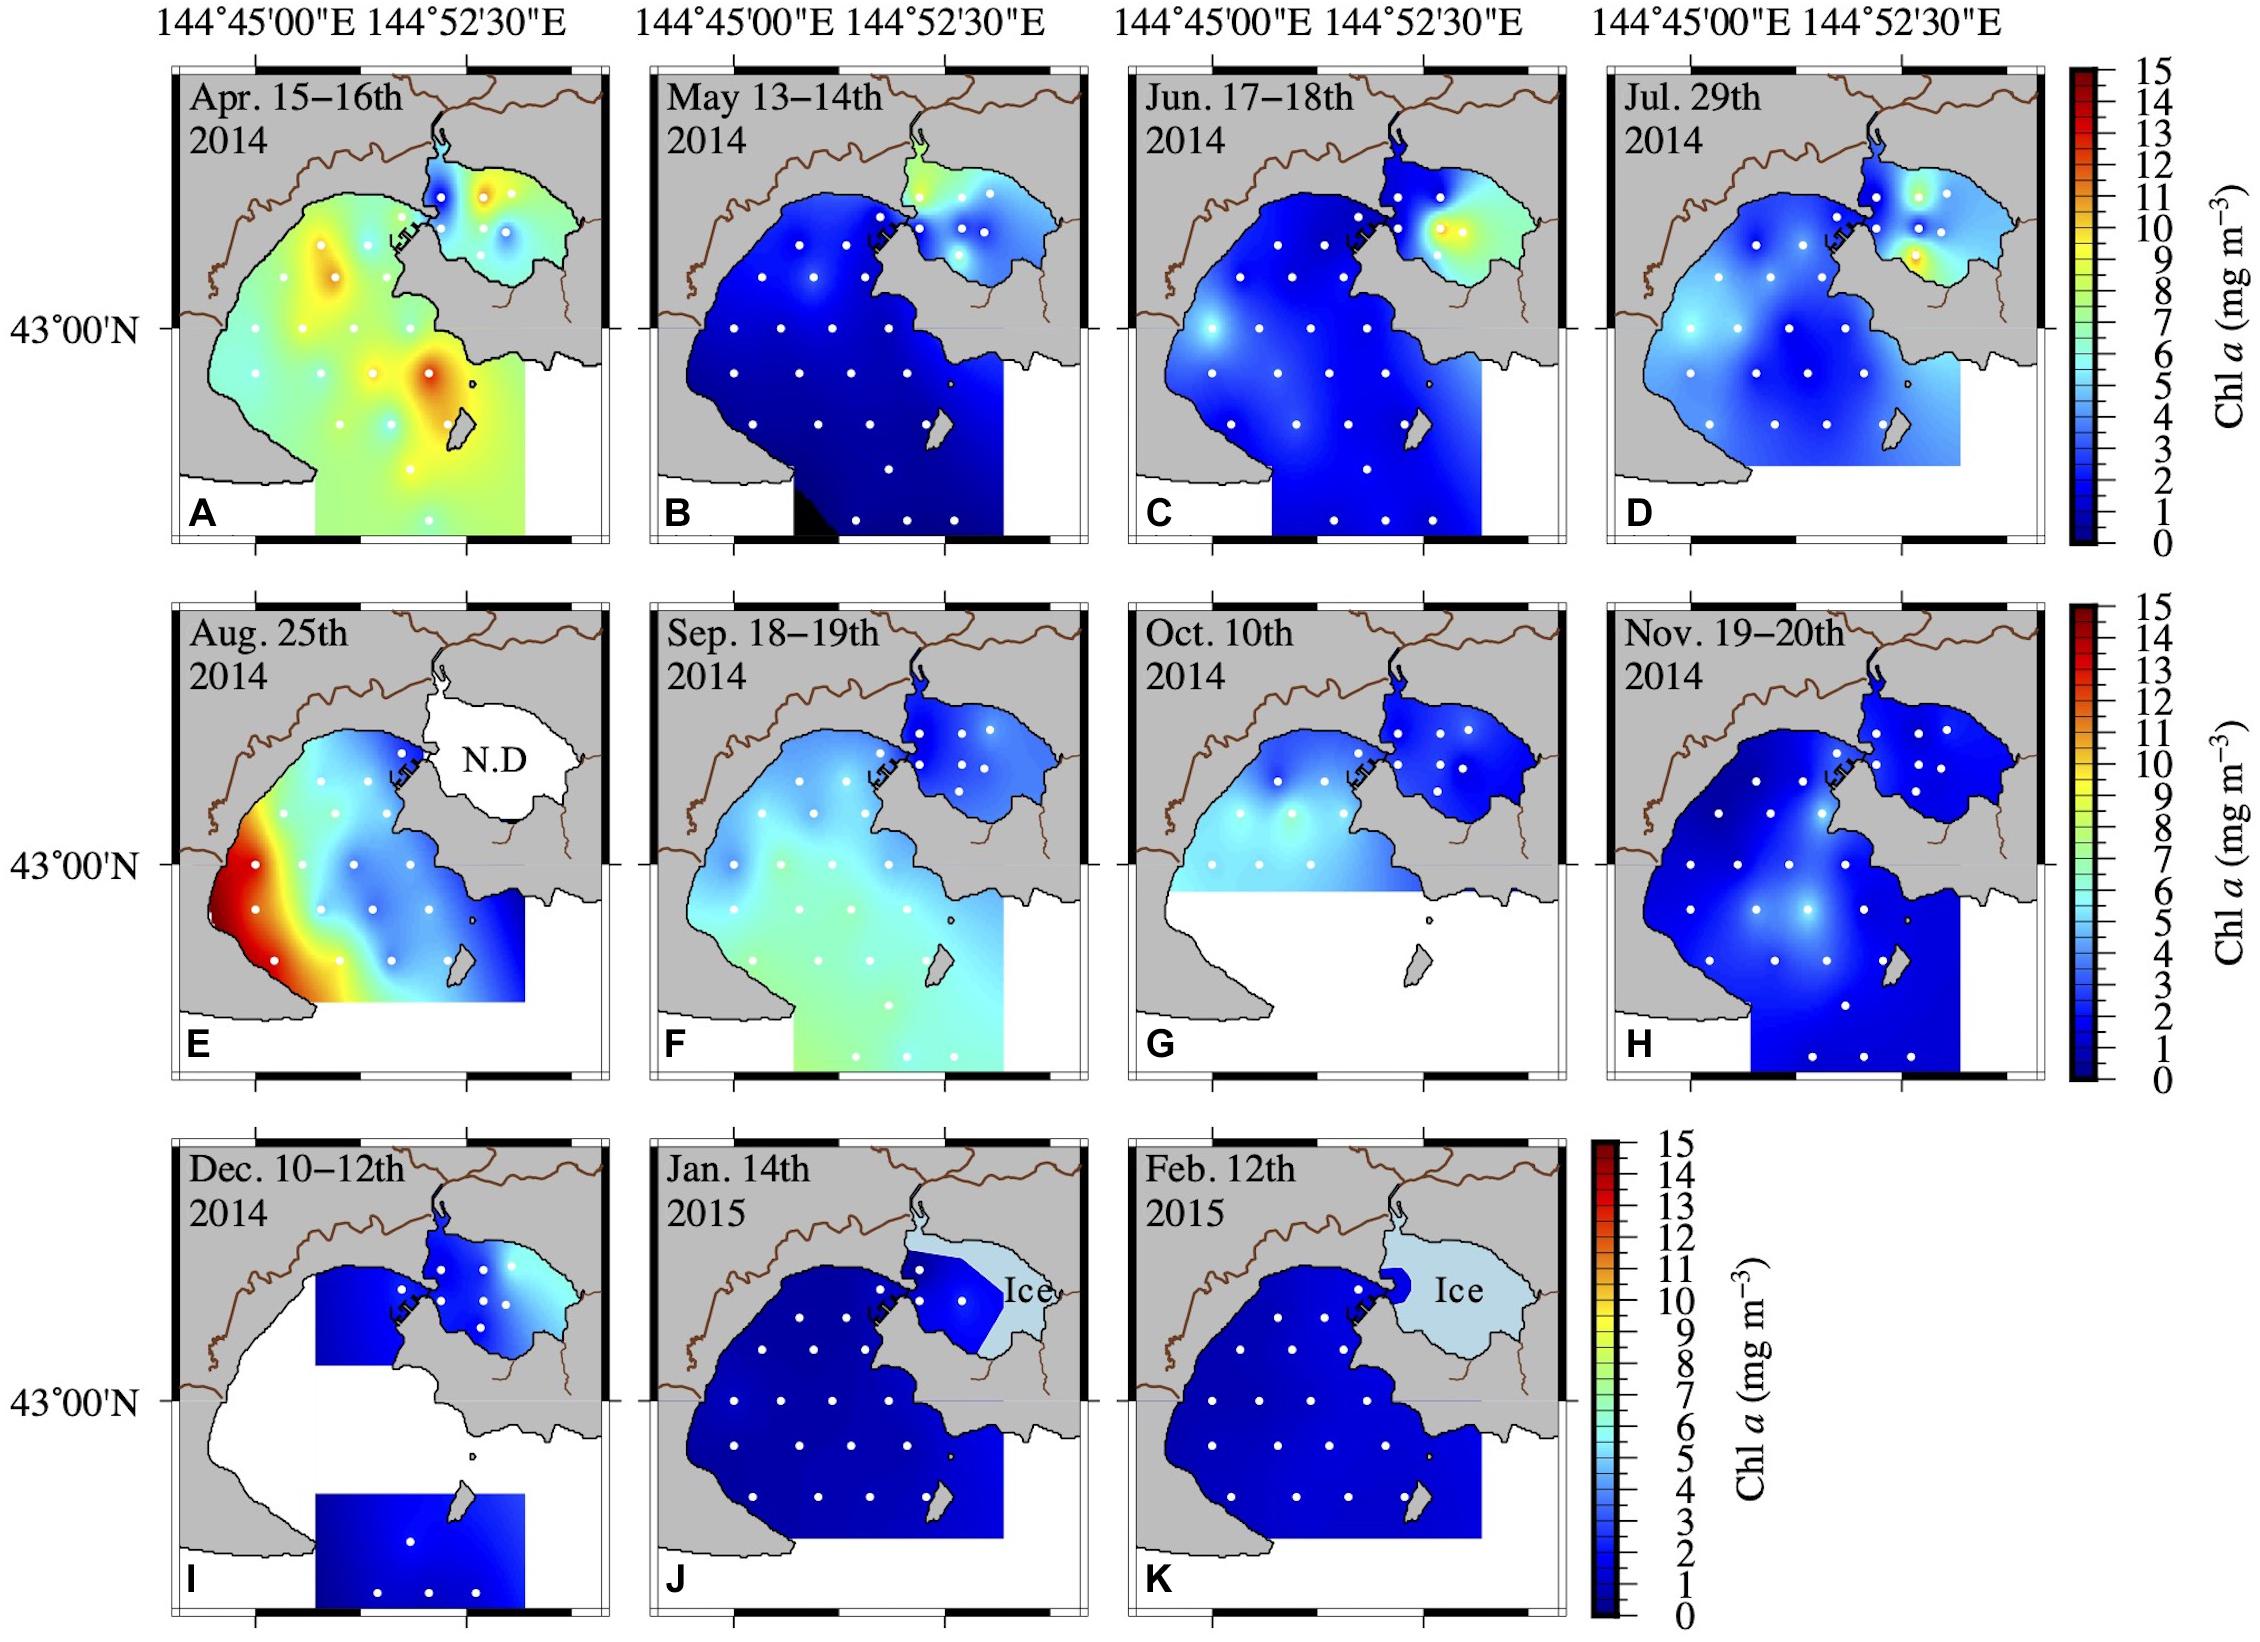
Figure 4. Spatial distribution of Chl a concentration at the surface (A–K) from April 2014 to February 2015. Inter- and extrapolation of the data were implemented by the General Mapping Tools. White symbols in each figure represent the sampling sites.
The absorption coefficient of CDOM at 355 nm [aCDOM(355)] in surface waters showed large spatial gradients from freshwater to coastal waters (Figure 5). The values of aCDOM(355) were highest in RB and RO, ranging from 4.454 to 19.210 m–1. These values decreased to 0.510–8.249 m–1 in AKE and to 0.258–7.350 m–1 in AB. Comparisons of the regression lines between salinity and aCDOM(355) in AKE and AB samples with the mixing lines predicted by two end-members between freshwater and coastal water indicated conservative mixing in aCDOM(355) with salinity from CDOM-rich wetland water to the coastal waters in AB during each month (Table 2 and Figure 5). In contrast, the regression lines in AKE indicated non-conservative mixing in CDOM with salinity. Although the slope and y-intercept of the regression line for AKE samples in April 2014 was about the same values calculated by the mixing line predicted by two end-members, the coefficient of determination (R2) was low in comparison to the regression line for AB samples (Table 2). The spectral slope coefficient (S275–295) in the river was lower than that at the AKE and AB sampling stations. The values of S275–295 ranged from 0.0114 to 0.0282 nm–1 and showed an exponential dependence on salinity (Figure 6A). In contrast, S350–400, which ranged from 0.0105 to 0.0182 nm–1, showed a lack of dependence on salinity (Figure 6B). As a result, SR increased with increasing salinity along the freshwater–estuary–coastal ocean continuum (Figure 6C). However, samples collected from AKE lay outside of the exponential mixing line from river to marine samples.
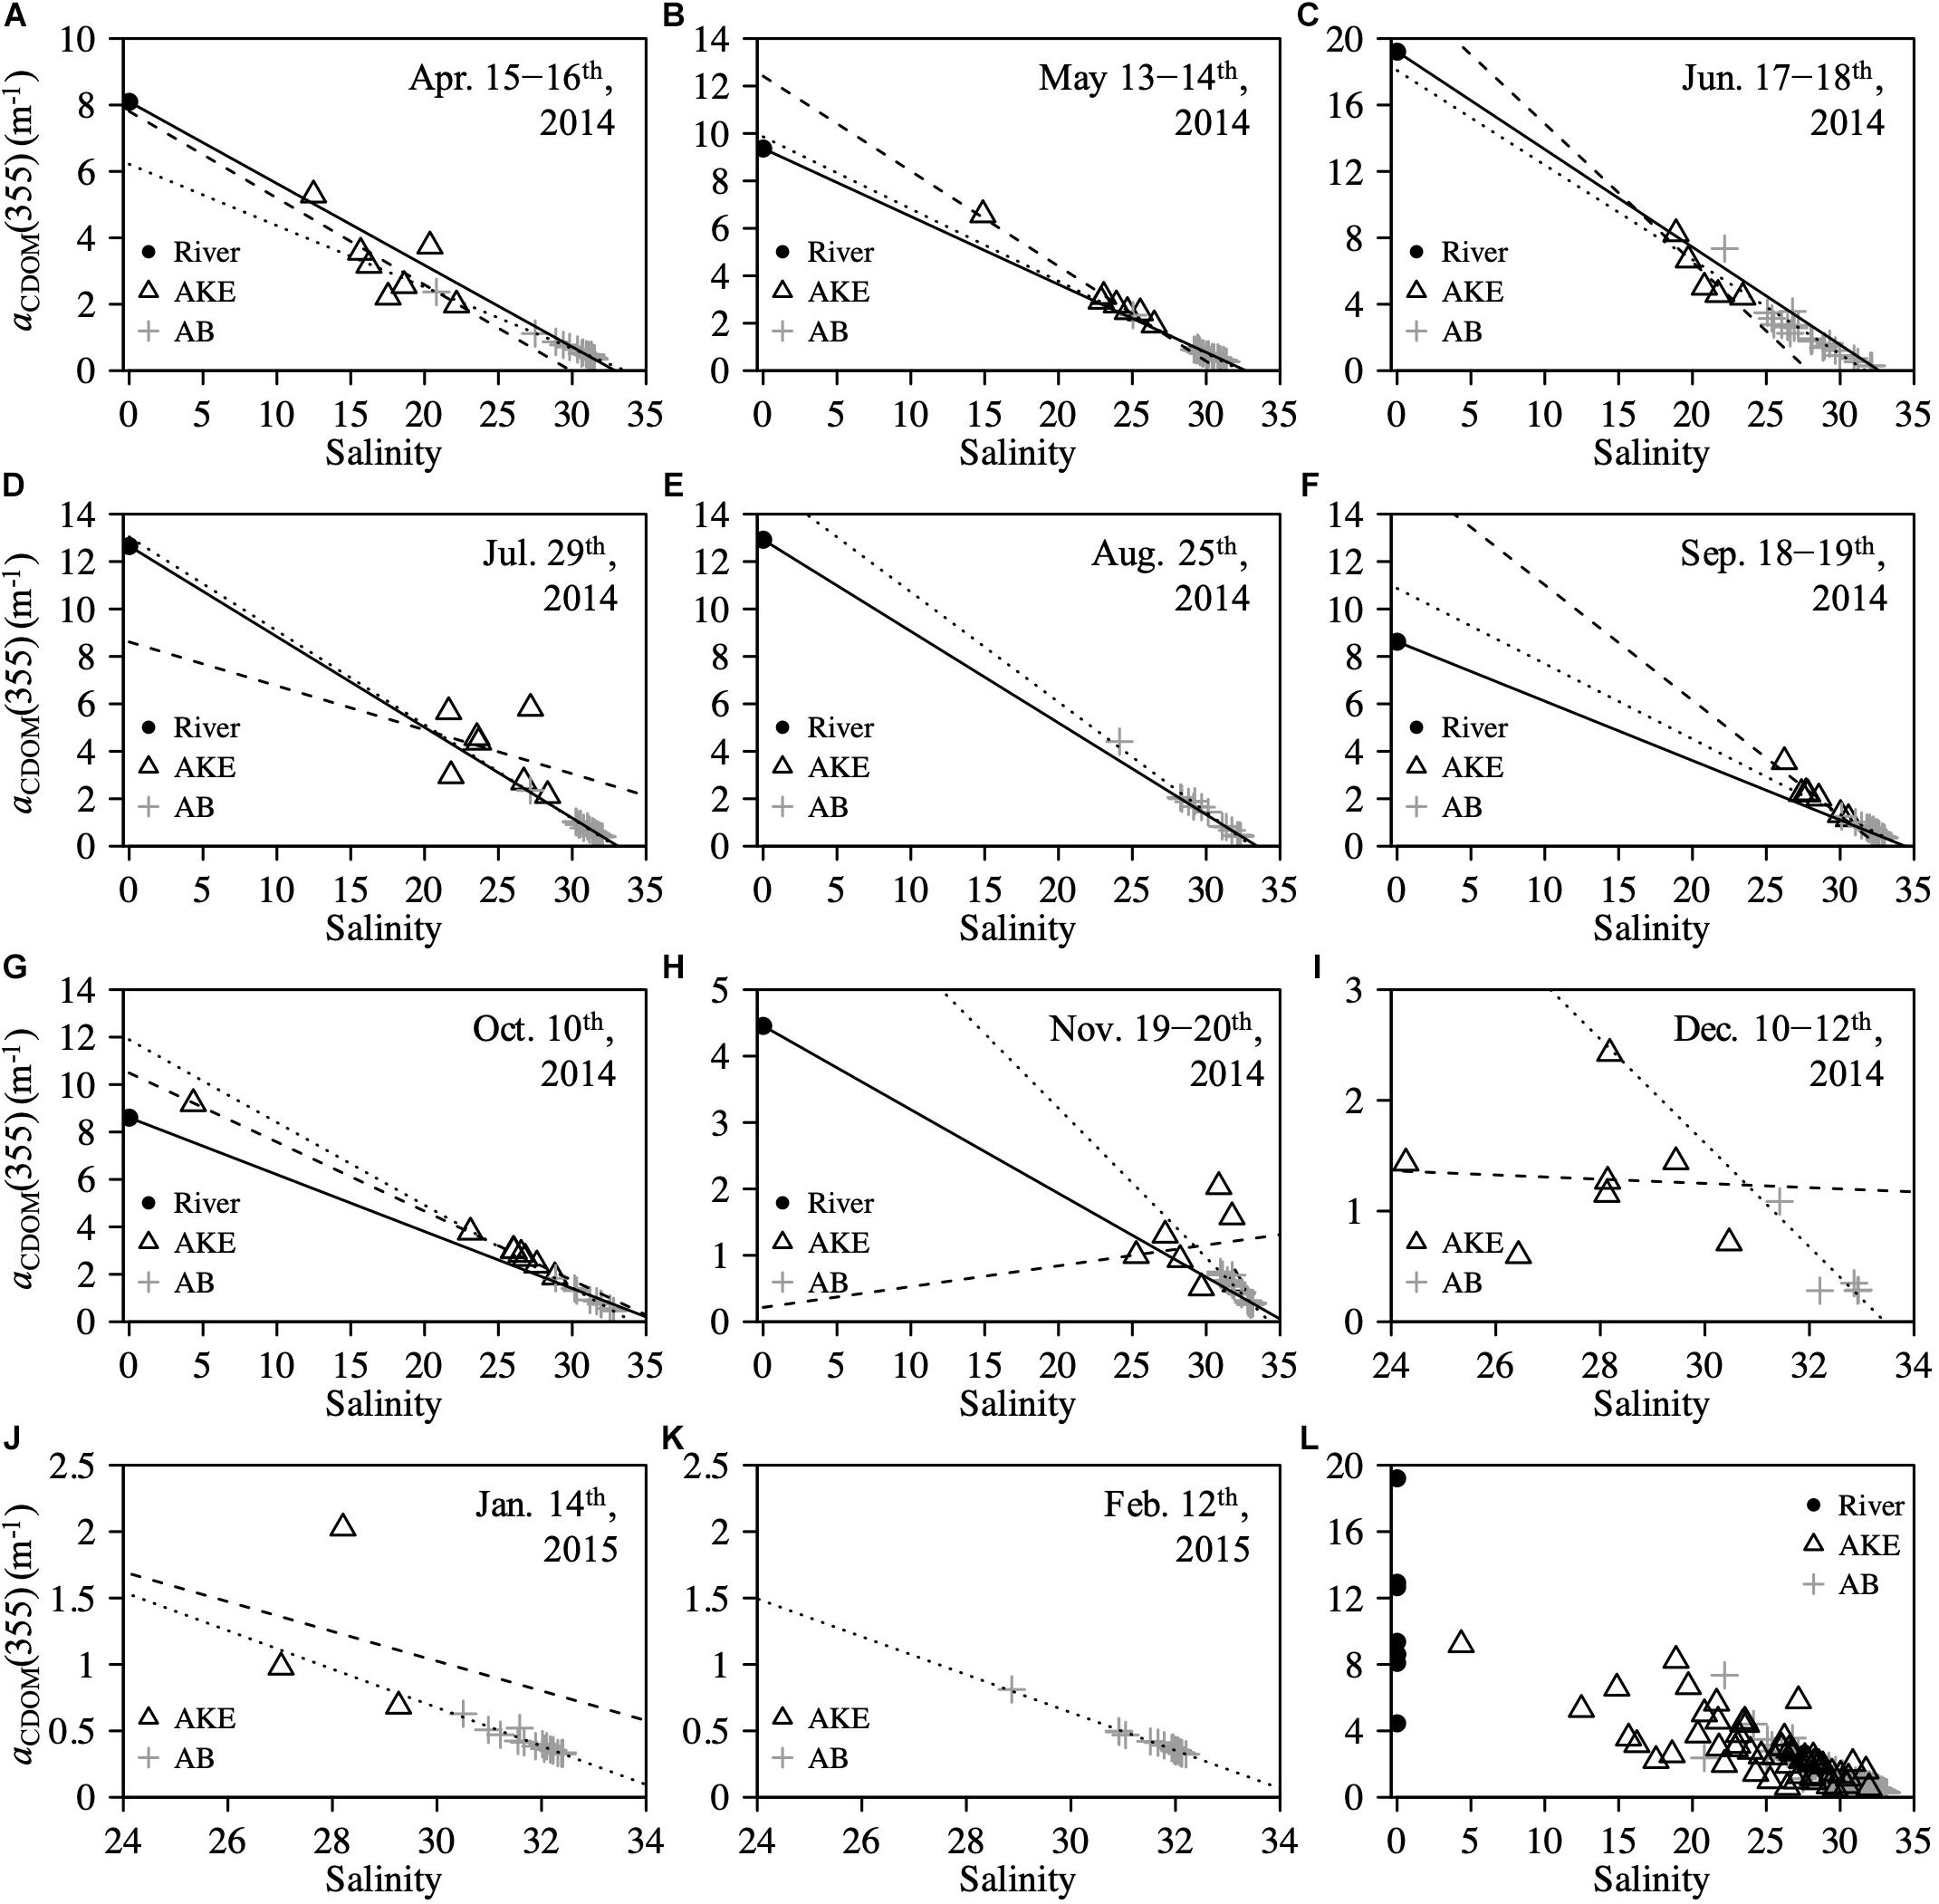
Figure 5. Relationships between salinity and aCDOM(355) at the surface (A–K) from April 2014 to February 2015 and (L) throughout the study period. Solid line in each figure represents the conservative mixing line of two-end-members between freshwater (RB) and coastal water based on salinity. Sample taken in RO was used as the freshwater end-member in (E) August 2014. Dashed and dotted lines represent the regression lines estimated from AKE and AB samples, respectively.
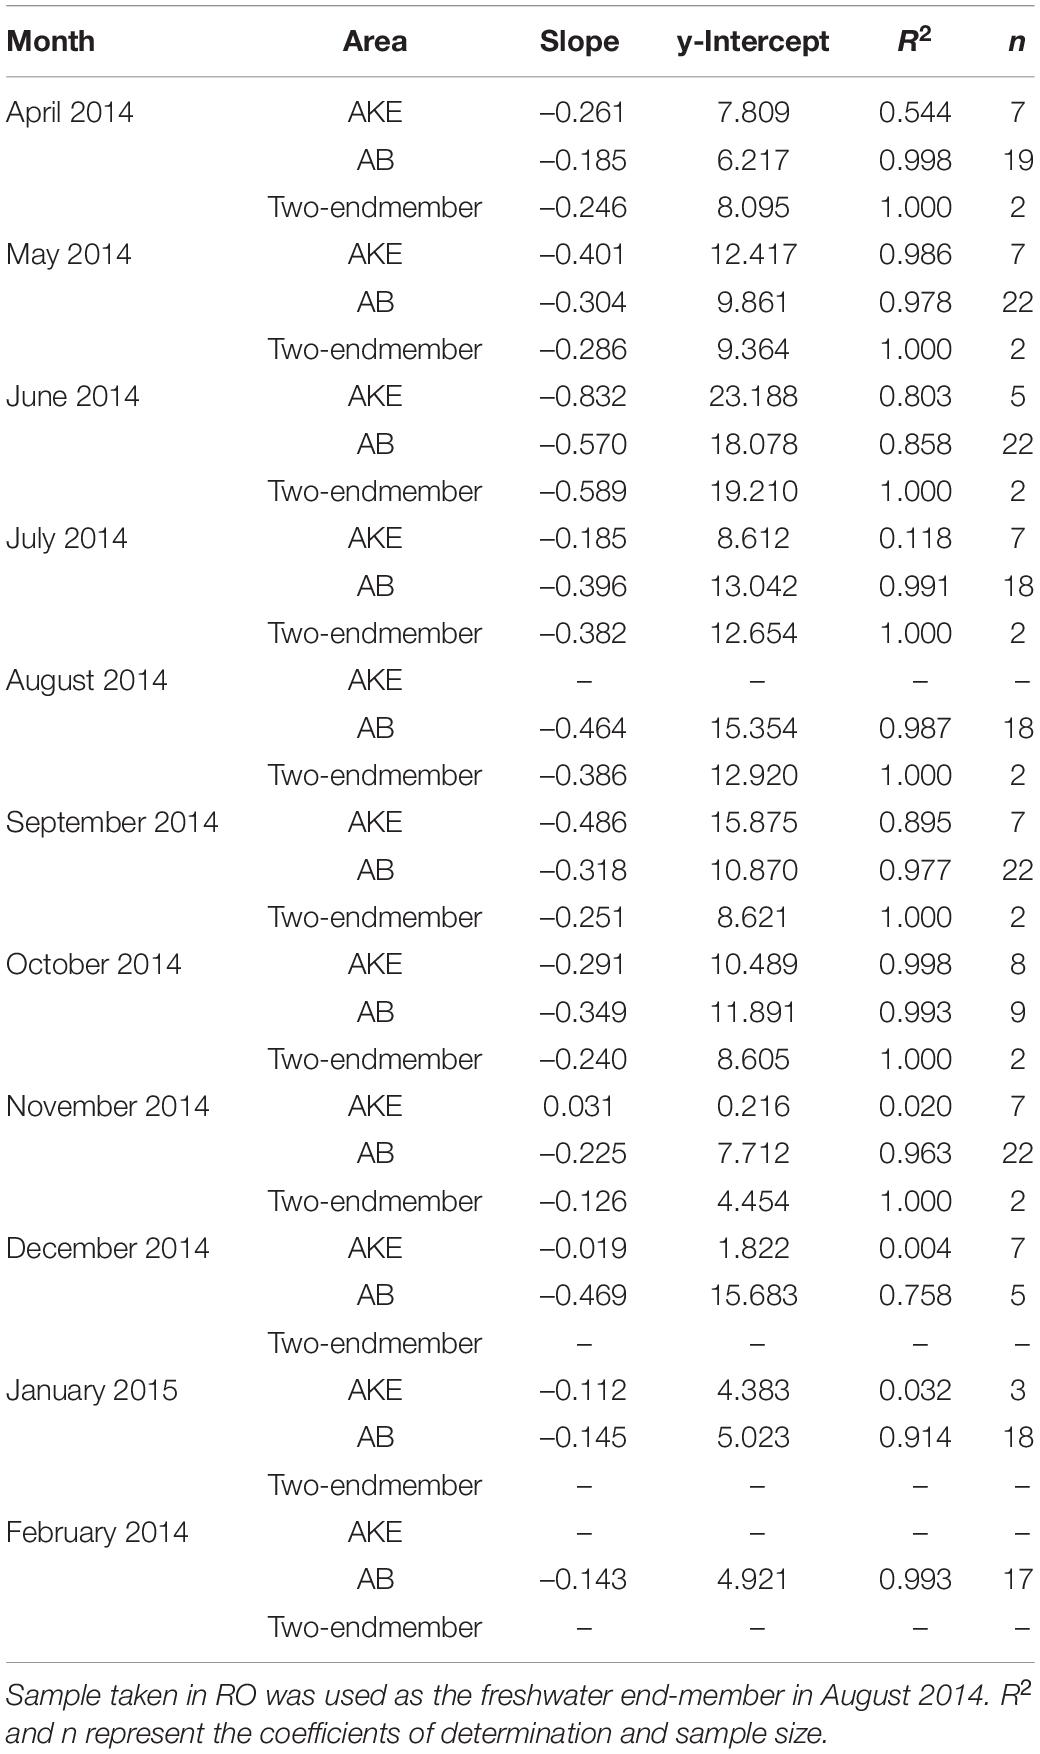
Table 2. Results of linear regression analysis between salinity and aCDOM(355) in AKE and AB and for two-end-members between freshwater (RB) and coastal water based on salinity.
The relationships between nutrients, environmental variables, and light absorption properties in AKE were distinct from those in AB (Tables 3, 4). The significant relationships between silicate concentrations and both salinity and aCDOM(355) were found in June 2014 only. No significant relationships between nitrates and phosphate concentrations and any valuables in AKE except for April and November 2014 (Table 3). In contrast, silicate concentrations were negatively correlated with salinity and positively correlated with aCDOM(355) and aCDOM(443) in AB during each month except for December 2014 when the sample size was small (Table 4). Significant relationships between silicate concentration and temperature in AB were found in April, May, June, August, September, November 2014 and February 2015. Therefore, in addition to the regression analysis between salinity and aCDOM(355) as described above (See section “Characteristics of CDOM Absorption Coefficient and Spectral Slope”), these results indicated conservative mixing between salinity and silicate concentration from the river to the coastal waters at the surface in AB and non-conservative mixing between them in AKE.
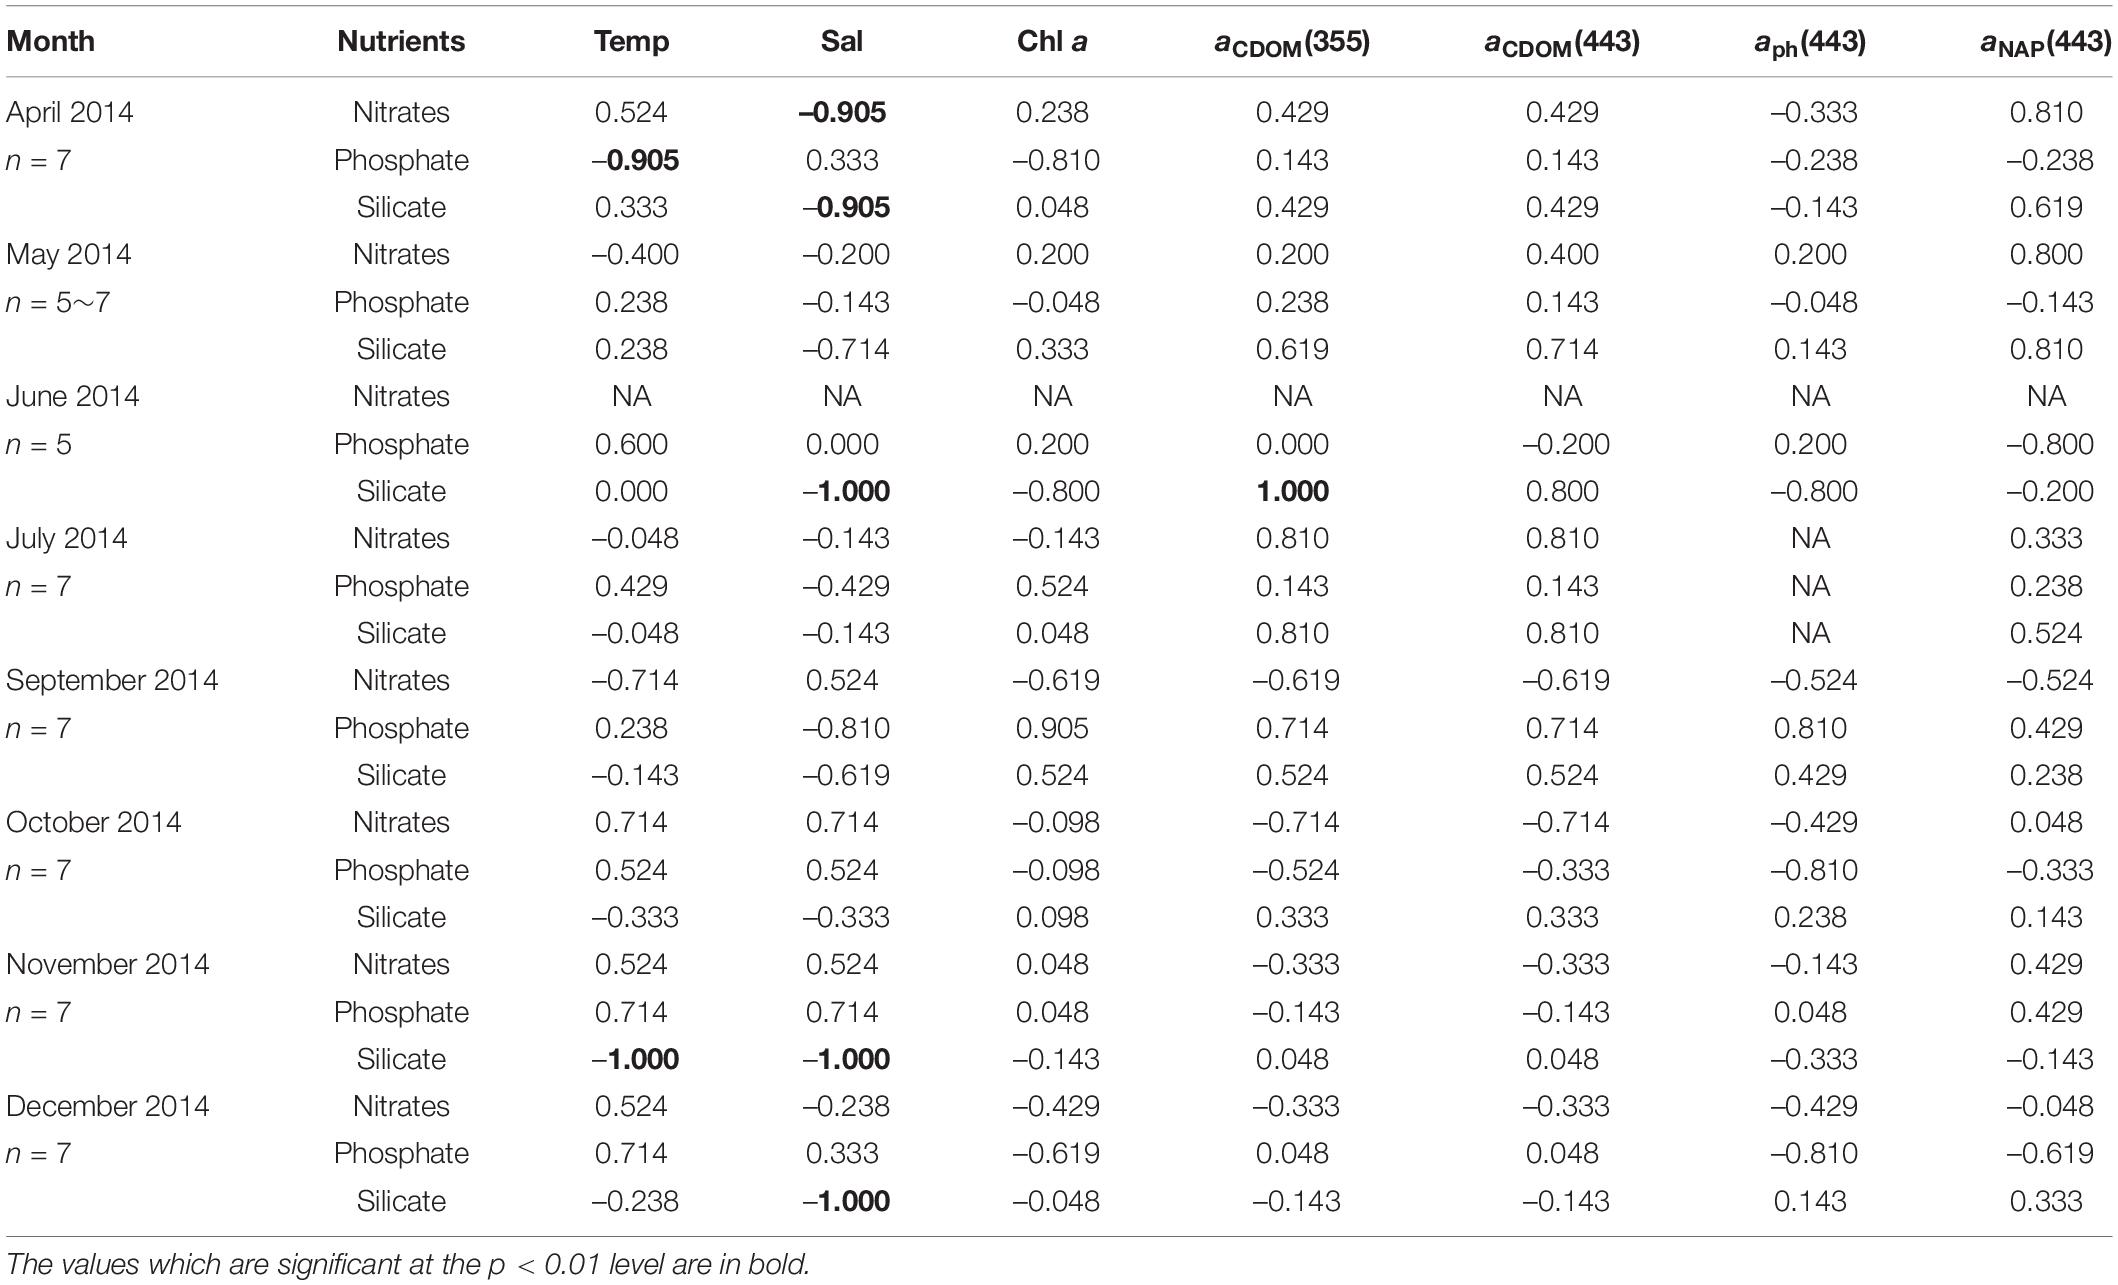
Table 3. Kendall rank correlations coefficient (τ) between nutrient concentrations, environmental variables (temperature, salinity, Chl a concentration), and light absorption properties at the surface in AKE during sampling cruises.
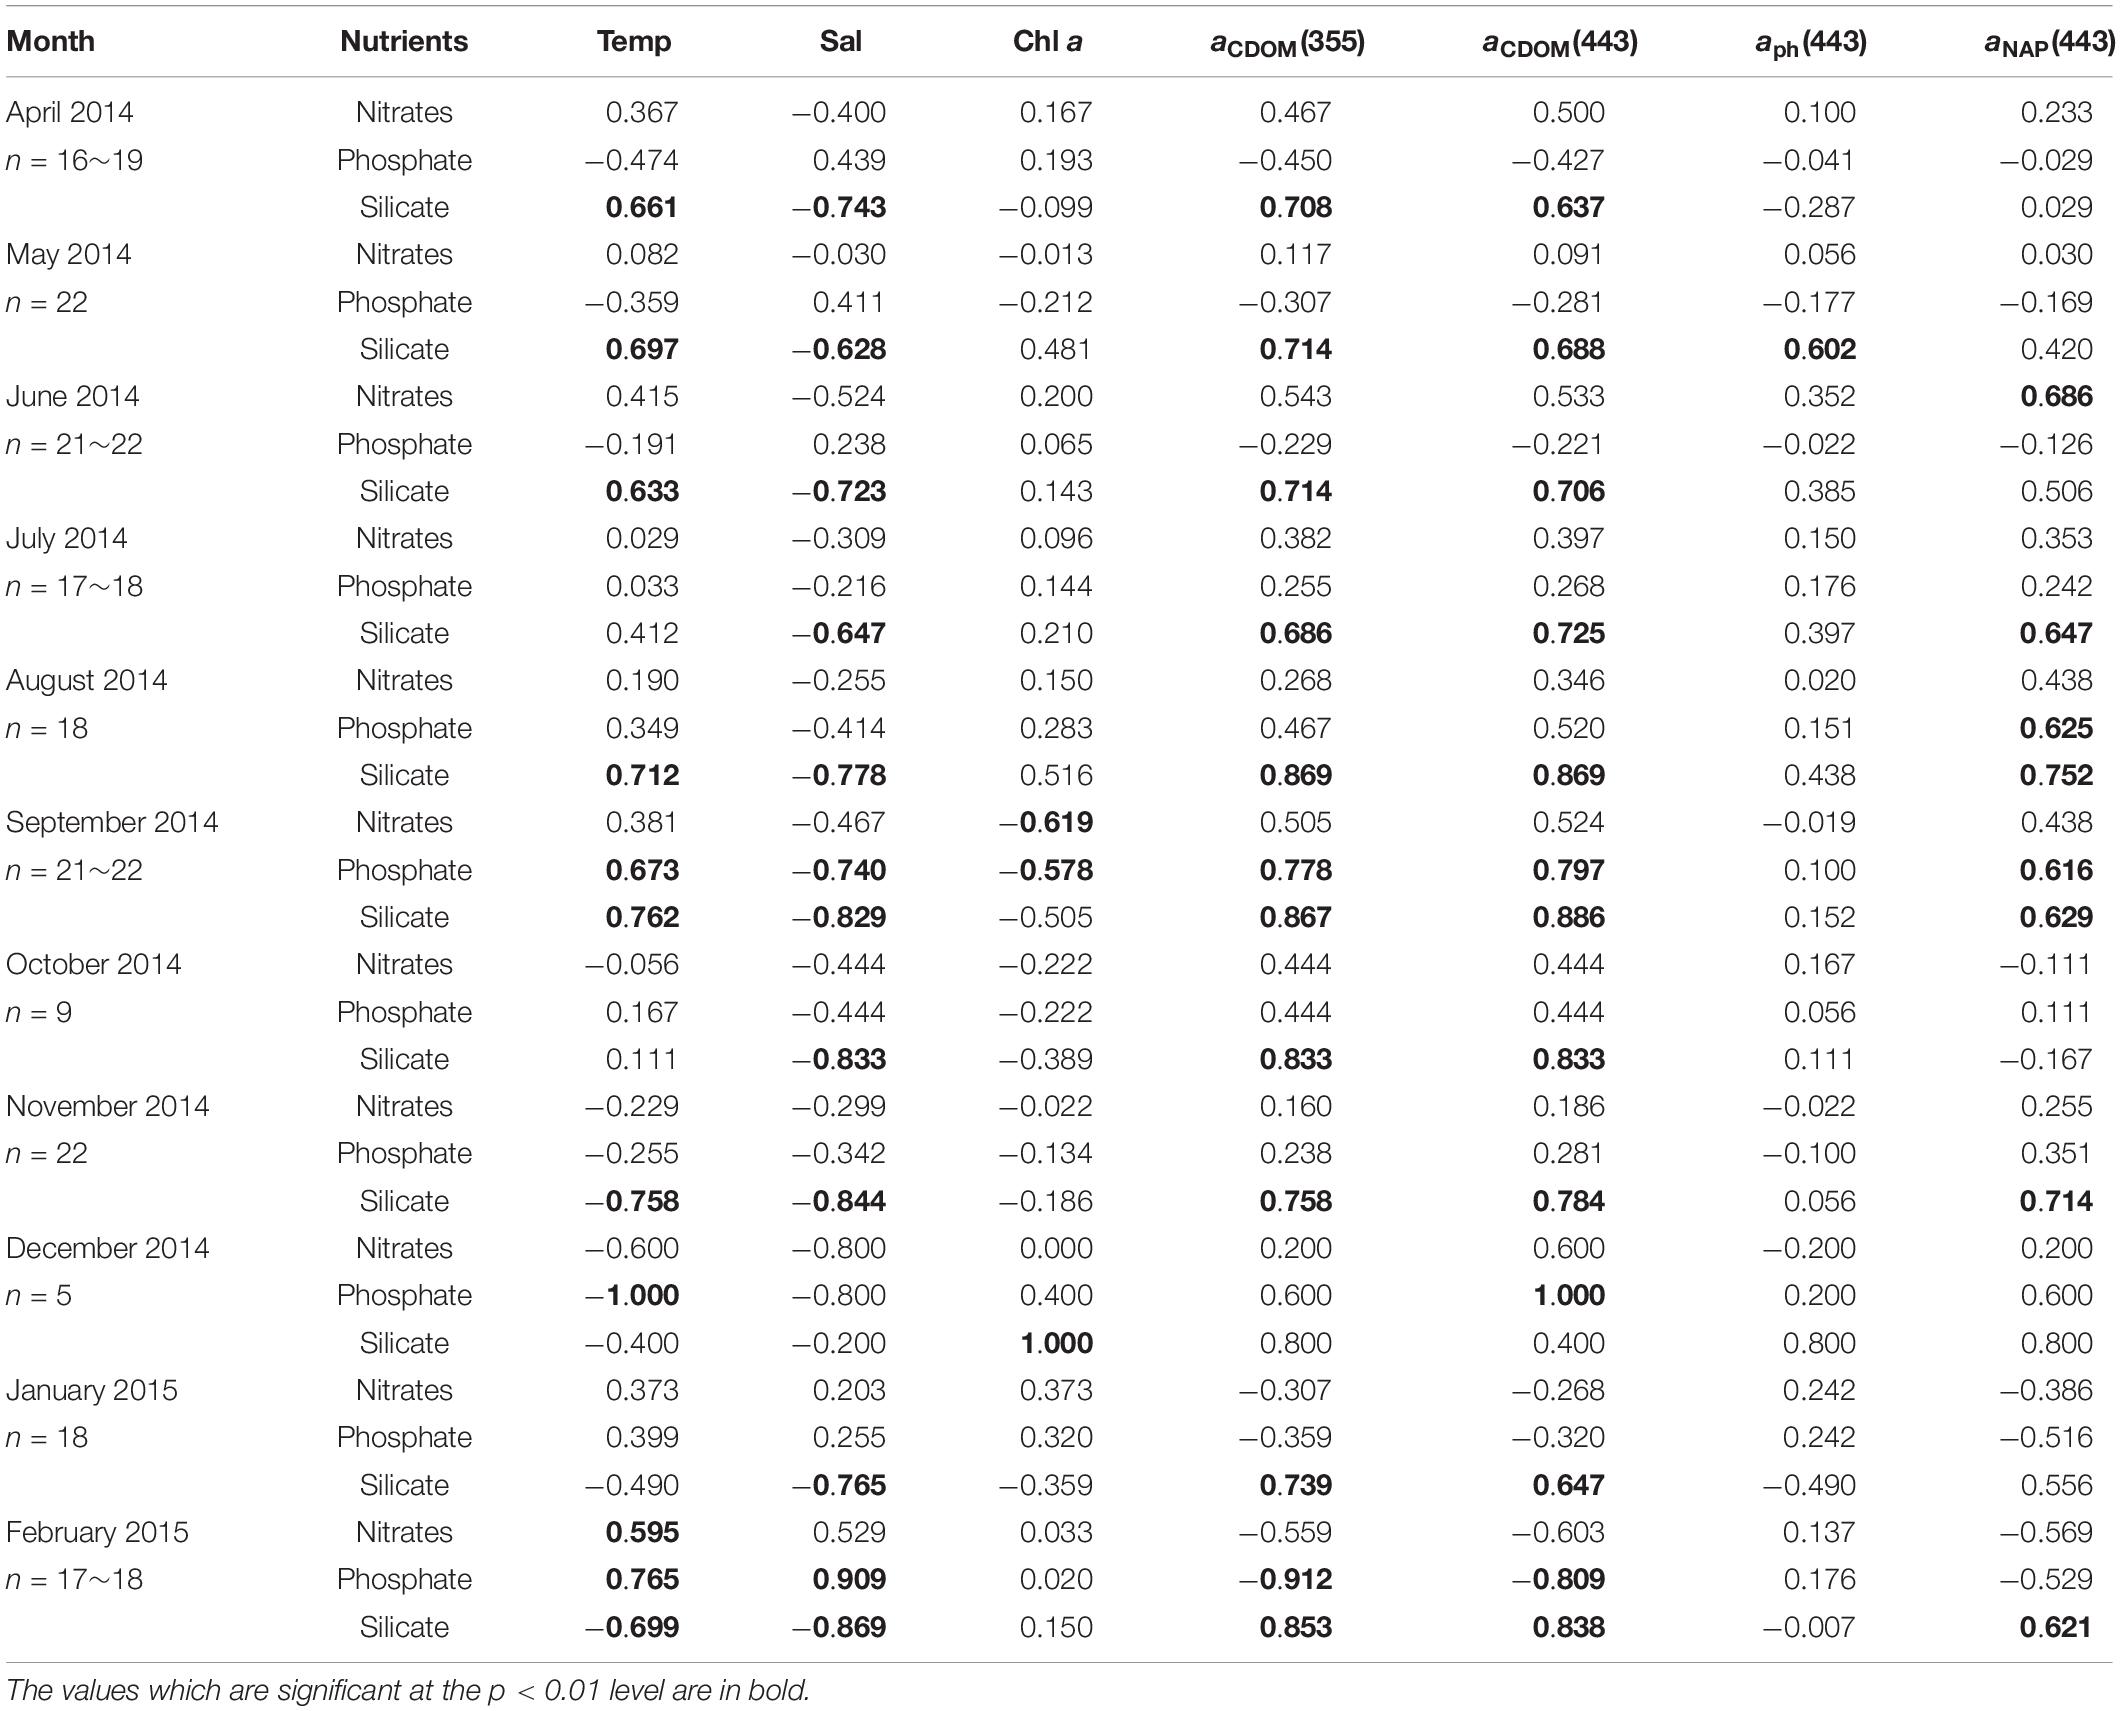
Table 4. Kendall rank correlations coefficient (τ) between nutrient concentrations, environmental variables (temperature, salinity, Chl a concentration), and light absorption properties at the surface in AB during sampling cruises.
To characterize the dominant absorption component, the relative contributions of each absorption parameter to total non-water absorption at 443 nm [at–w(443) = aNAP(443) + aph(443) + aCDOM(443)] were examined (Figure 7). Although aCDOM(443) was the dominant light-absorbing component in AKE, except in December 2014, the relative proportion of each absorption component in AB was highly complex. Phytoplankton [aph(443)] was the main factor affecting light absorption during spring blooms in April 2014. Subsequently, aCDOM(443) dominated the absorption components in May and June 2014. Then, the relative proportion of each absorption component mainly lay within the mixed range of the ternary plot from July 2014 to January 2015; however, [aph(443)] was dominant again at some stations during the autumn blooms in September 2014 (Figure 7F). In February 2015, the majority of aNAP(443) values in AB were greater than 50% due to ice cover.
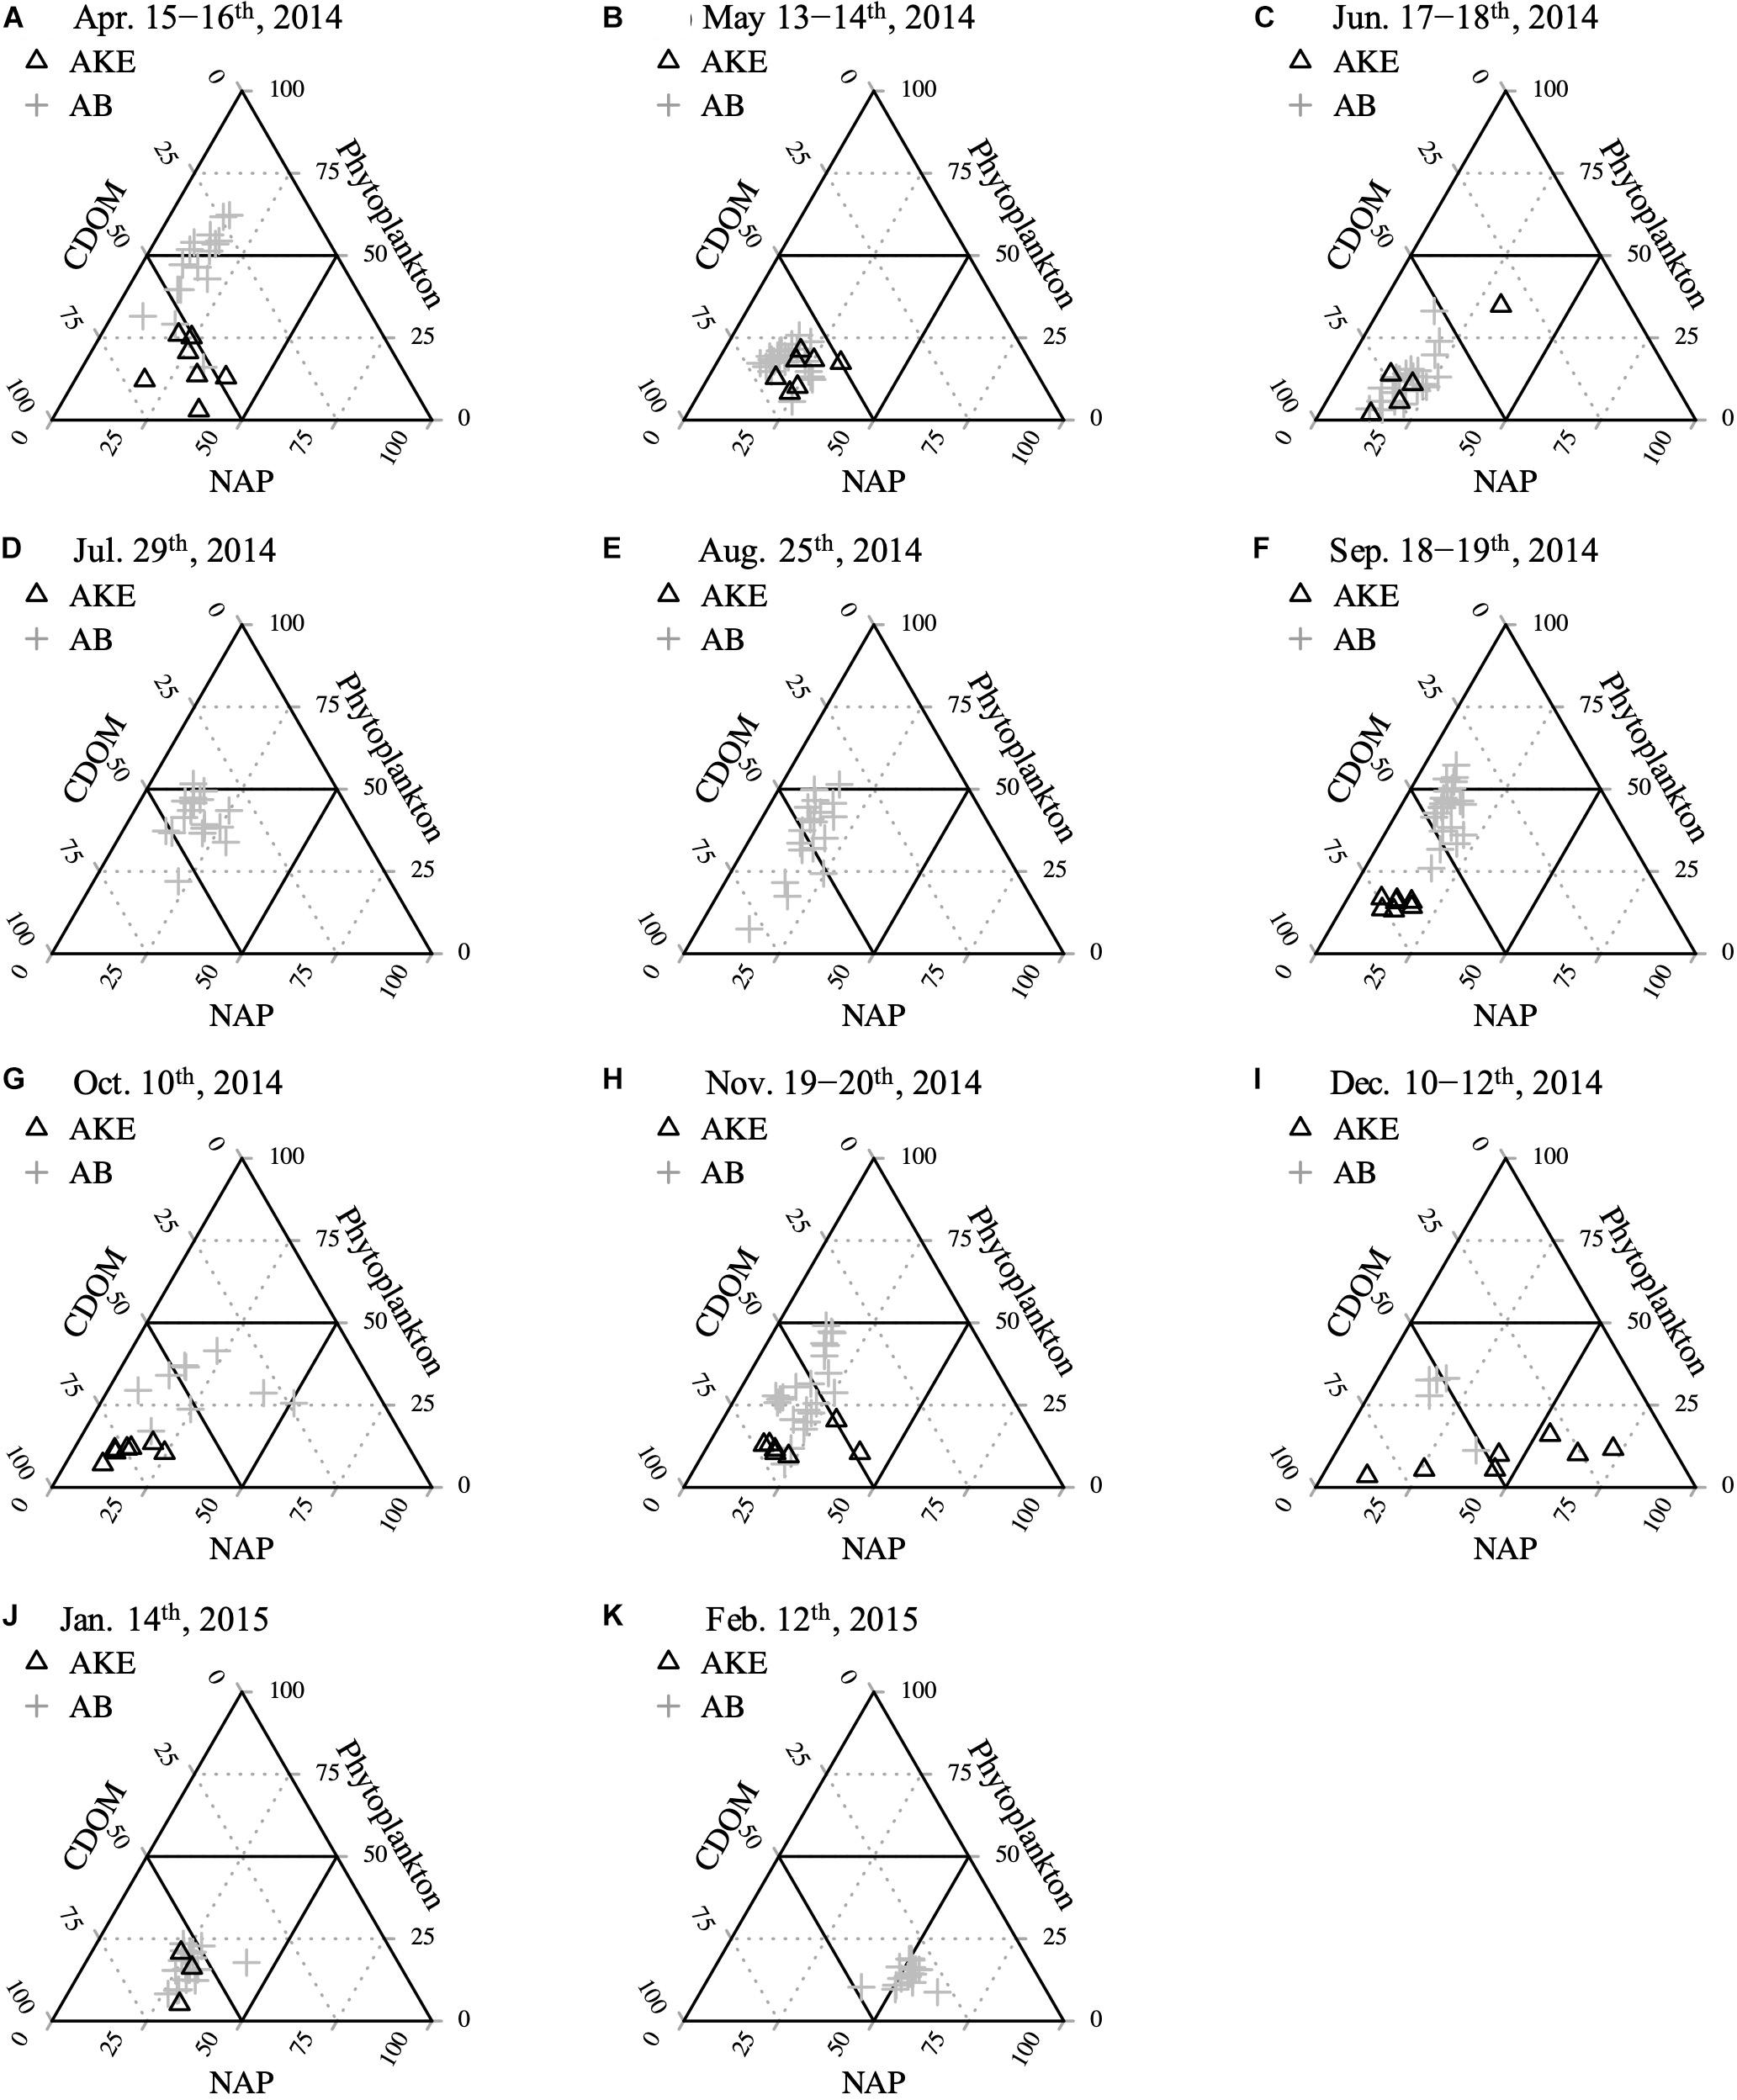
Figure 7. Relative contributions of CDOM, NAP, and the phytoplankton absorption component to total non-water absorption at 443 nm (A–K) from April 2014 to February 2015.
The relationships among water transparency (ZSD), Chl a concentrations, and optical absorption properties in AB throughout the study period are shown in Figure 8. Although the values of ZSD were not correlated with Chl a levels or aph(443) (Figures 8A,B), ZSD was correlated with aNAP(443), aCDOM(443), and aTotal (443) (Figures 8D–F). No significant relationships were observed between aCDOM(355) and Chl a concentration (Pearson’s product-moment correlation; r = 0.05, p = 0.47, n = 192) or between aCDOM(443) and aph(443) (Pearson’s product-moment correlation; r = 0.12, p = 0.11, n = 189) in AB.
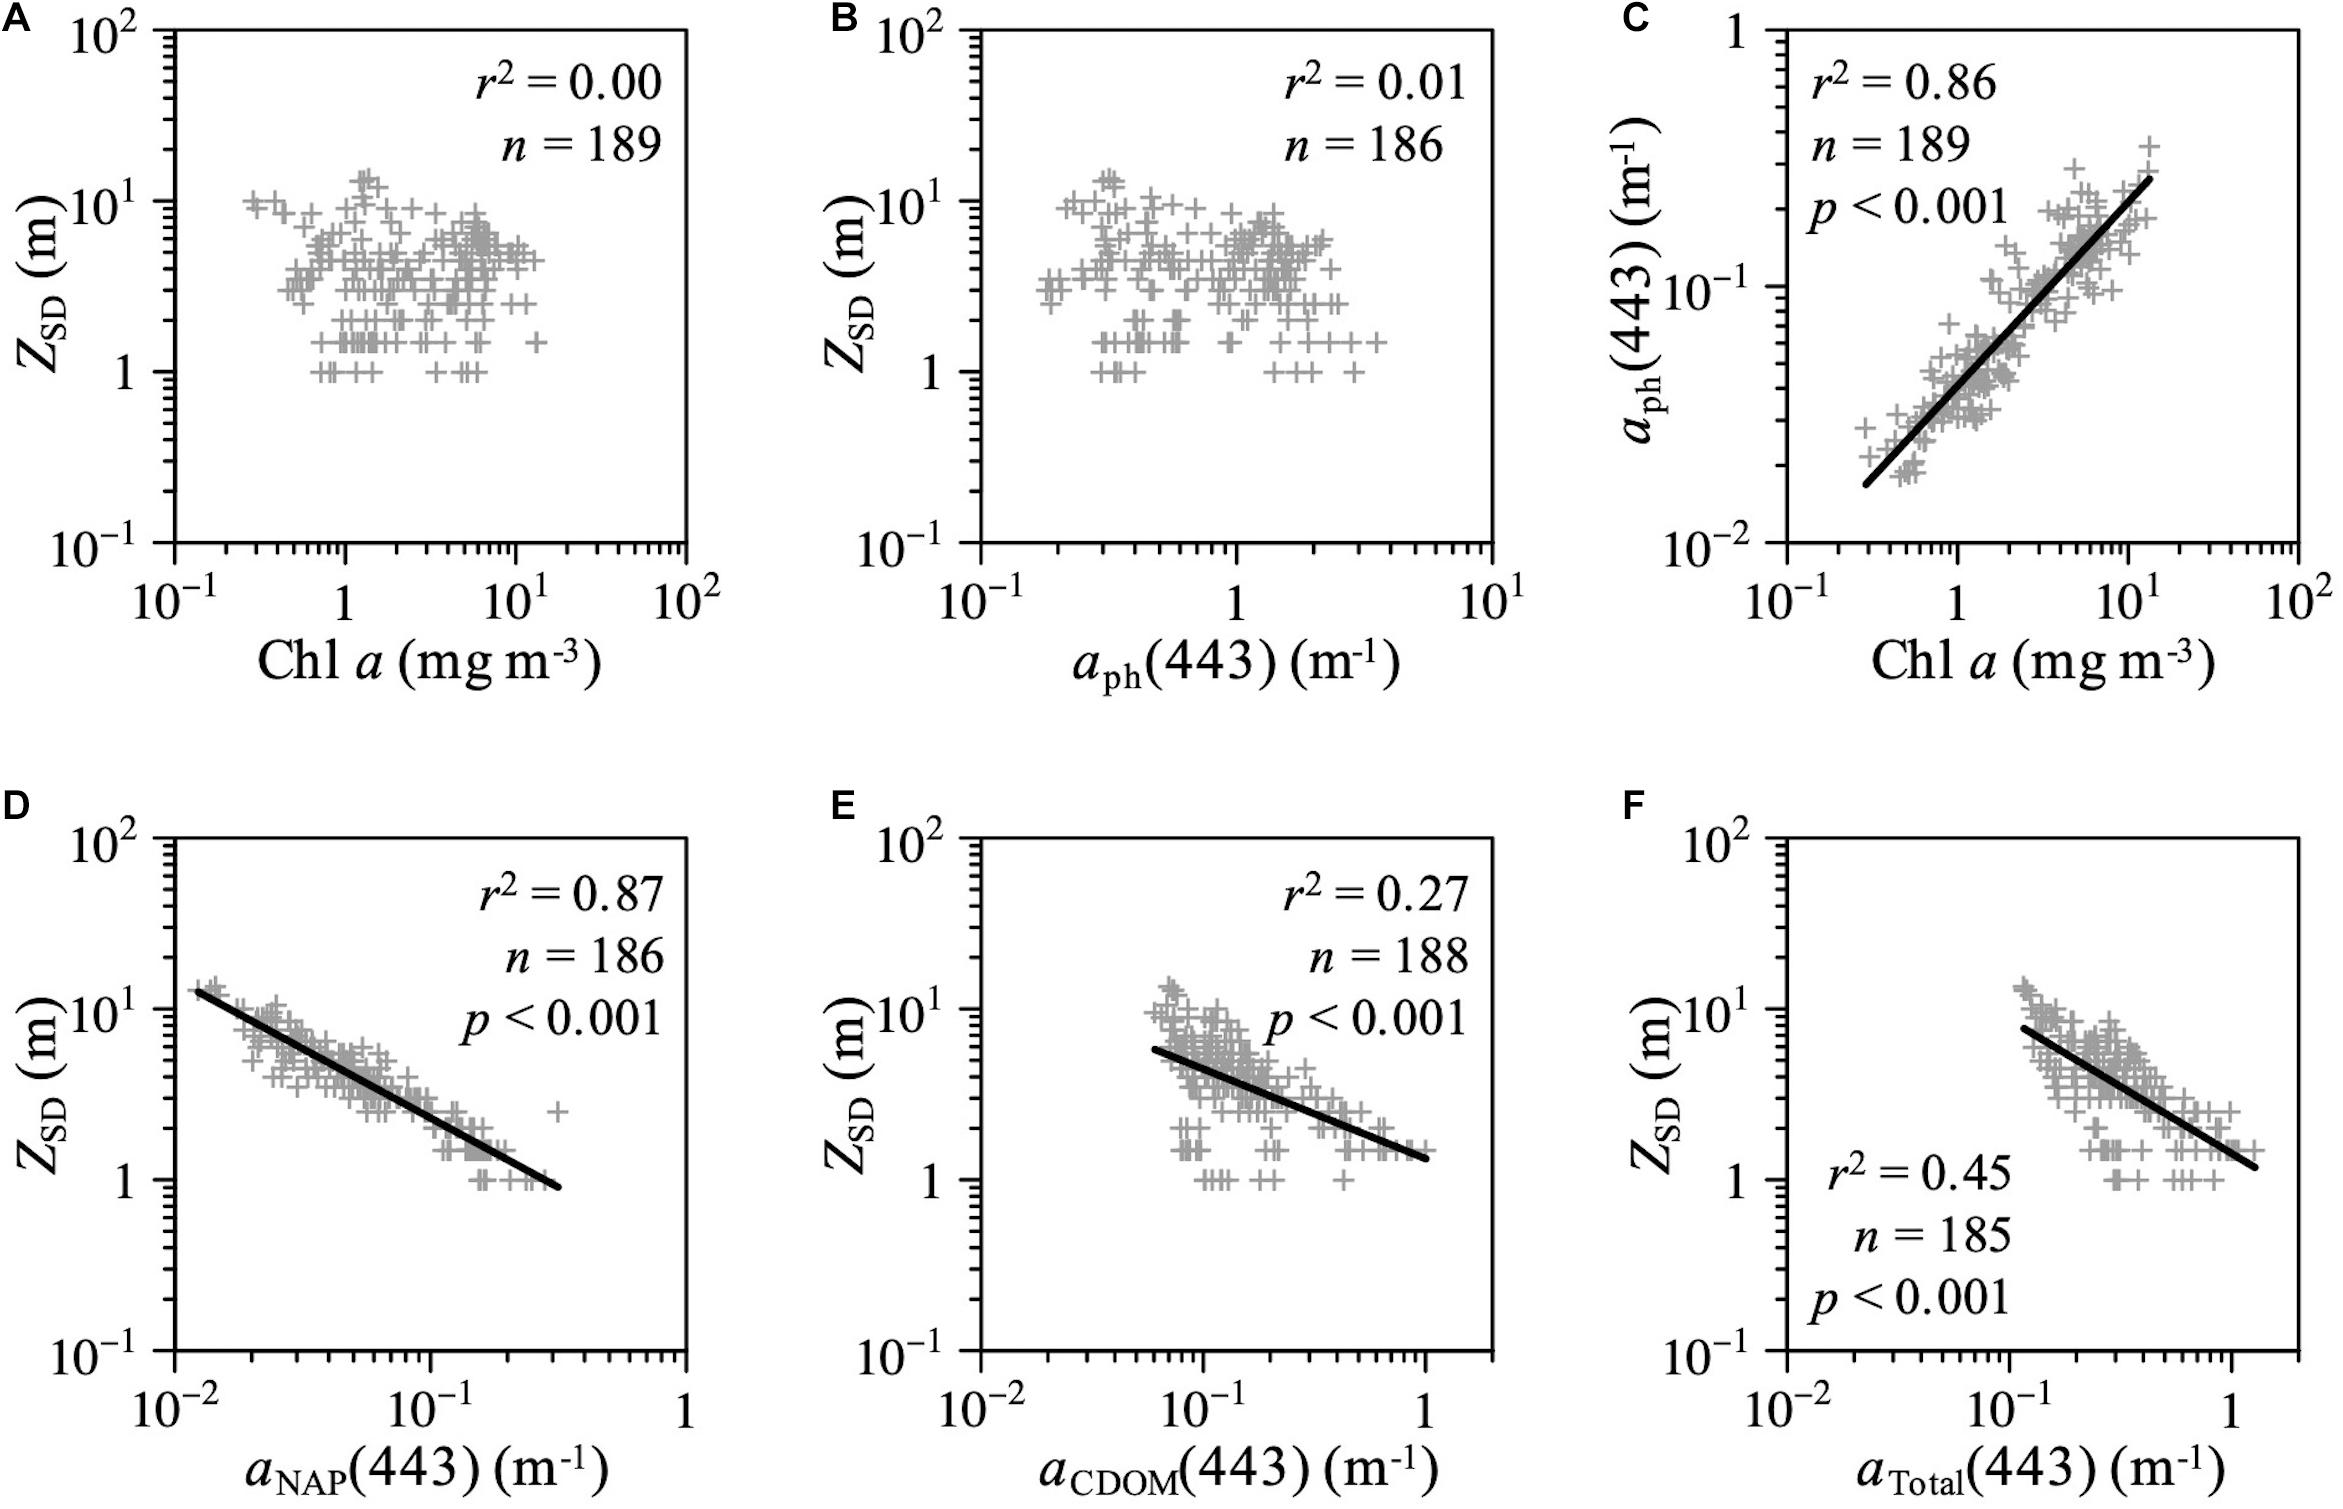
Figure 8. Scatterplots of ZSD as a function of (A) Chl a concentration, (B) aph(443), (D) aNAP(443), (E) aCDOM(443), and (F) total absorption coefficient at 443 nm in AB. (C) Scatterplots of Chl a concentration versus aph(443) in AB.
We conducted monthly observations with high spatial resolution in AKE (a Ramsar protected site) and AB in Japan, both of which are affected by river discharge influenced by the second largest wetland (the Bekanbeushi wetland) in Japan. The SST in AKE was higher than that in AB from April to September 2014 because river temperatures increase before sea temperatures in the study region (Nagao et al., 2016). The SST in AB was below 20°C, even in summer, which is consistent with the findings of previous studies (Hasegawa et al., 2015; Momota and Nakaoka, 2018). Nutrient concentrations in most of the rivers samples showed higher N:P and Si:N ratios than the Redfield ratio due to excess nitrate originating from river inputs and the adsorption of phosphate by the soil (Howard-Williams, 1985; Reddy et al., 1999). As a result, the river samples in our study fell into the P-limited region (Figure 3H). However, lower N:P ratios than the Redfield ratio were widespread in both AKE and AB, indicating that nitrate is the main factor limiting the growth and photosynthesis of primary producers. Moreover, the phosphate concentrations in AKE were significantly higher than those in AB in July, September, and October 2014 (Figures 3C,D and see section “Hydrographic Conditions of the Akkeshi Watershed”). The elevated phosphate concentrations from late spring to summer in AKE (Figure 3C) suggested other sources of phosphate, such as phosphate release from the sediment, excretions from mariculture, and different flows of river discharge. Iizumi et al. (1995) also reported a higher phosphate concentration in AKE during the summer. The release of nutrients from sediments to the water column has also been reported in estuaries and seagrass-dominated regions (Iizumi et al., 1982; Cowan et al., 1996; Ziegler and Benner, 1999b). In AKE, eelgrass beds are most abundant from June to August (Hasegawa et al., 2007; Momota and Nakaoka, 2018). Subsequently, the ammonium flux from the sediments to the water column increases during this time (Hasegawa et al., 2008). Nakagawa et al. (2019) used quantitative PCR to investigate the abundance of nitrous oxide (N2O)-reducing microorganisms in both in situ and cultivated sediments in the non-eelgrass and eelgrass zones of AKE, and showed that the microbiomes in eelgrass meadow sediments contributed to the N2O sink. Additionally, mariculture of Manila clams and Pacific oysters is well developed in AKE (Hasegawa et al., 2014, 2015). Previous studies on the metabolic activities of clams and oysters have shown that they increase ammonium and phosphorous concentrations in the sediment and water column of mariculture regions (Dame et al., 1989; Bartoli et al., 2001; Nelson et al., 2004; Nizzoli et al., 2006; Welsch et al., 2015). Because the development of the eelgrass canopy contributes to a reduction in current velocity in the shallow areas of AKE (Hasegawa et al., 2008), which in turn led to the decreases in water masses exchange between AKE and AB as well as freshwater, sediments in eelgrass meadows and mariculture could contribute to the increase in phosphate concentration of the water column in the semi-enclosed coastal area of AKE during summer. This could produce the lower N:P ratios in AKE.
Nitrate in AB was almost depleted from spring to summer. Diatom blooms occur every spring in the coastal Oyashio water, leading to decreased nutrient concentrations (Kasai et al., 1997; Saito et al., 2002; Isada et al., 2019). Therefore, water masses with high Chl a concentrations and low nutrient concentrations observed in AB in April 2014 (Figure 4A) indicate nitrate depletion by spring diatom blooms in the bay. Nutrient concentrations in AB from August 2014 to February 2015 gradually increase through strong vertical mixing and remineralization of organic matter (Kasai et al., 1997; Taguchi et al., 1977; Saito et al., 2002), which is consistent with the results obtained in our study.
Conservative mixing between aCDOM(355) and salinity (Figure 5) and the strong salinity – silicate concentration – aCDOM(λ) relationships in AB (Table 4) indicated that silicate and CDOM in AB are primarily terrestrial in origin from wetland-influenced river discharge. Salt marsh and wetlands are the largest source of silicate to coastal area through rivers (Struyf et al., 2006; Struyf and Conley, 2009; Carey and Fulweiler, 2014). Previous studies have shown the significant relationship between salinity and silicate concentration in river estuaries (e.g., Carbonnel et al., 2013; Tedetti et al., 2020; Zhang et al., 2020). In addition, many previous studies have shown strong high to low spatial gradients of CDOM with the increases in salinity in coastal waters (e.g., Ferrari and Dowell, 1998; Rochello-Newall and Fisher, 2002; Del Vecchio and Blough, 2004; Guo et al., 2007) and wetland-influenced estuaries (e.g., Helms et al., 2008; Tzortziou et al., 2011). No significant relationships between aCDOM(355) and Chl a concentration or between aCDOM(443) and aph(443) in AB suggested that (1) the release of CDOM from phytoplankton is small even during spring and autumn phytoplankton blooms in AB and (2) there are no large in situ sources or sinks of CDOM within the bay. The exponential dependence of S275–295 and SR on salinity and the constant values of S350–400 (Figure 6) showed that photobleaching also plays a major role in the regulation of S275–295 during transport and mixing from the river to the coastal waters in AB. S275–295 is sensitive to photobleaching in comparison to S350–400 and thus, the values of S275–295 with increase with photobleaching (Helms et al., 2008; Fichot and Benner, 2012; Danhiez et al., 2017). Fichot and Benner (2012) also showed that the values of S275–295 is closely related to the average molecular weight of CDOM and lignin. Accordingly, terrestrial CDOM-rich river waters have higher aCDOM(λ) and lower values of S275–295, which is consistent with our results (Figure 6A).
In contrast, non-conservative mixing in aCDOM(355) with salinity was observed in AKE (Table 2 and Figure 5). No significant relationships between silicate concentration and aCDOM(355) were found except for June 2014 (Table 3). Changes in the slope parameters of CDOM in AKE were also distinct from those in AB (Figure 6), suggesting different mixing processes inside and outside AKE, as well as other potential inputs from mariculture and eelgrass meadows within AKE. Some studies have shown the importance of seagrass meadows as a DOM and CDOM source in water columns (Ziegler and Benner, 1999a; Stabenau et al., 2004; Tanaka et al., 2019). Based on the analysis of DOC-specific UV absorbance at 254 nm (SUVA254) and the fluorescence excitation-emission matrix spectroscopy coupled with parallel factor analysis (EEM-PARAFAC) of DOM, Maie et al. (2014) showed the conservative behavior of SUVA254 in a salinity range of less than 10 in the mouth of the Bekanbeushi River. They also showed seven EEM-PARAFAC components and suggested diverse DOC sources, including terrestrial origin, seagrass, and epiphytic algae. More recently, Zhang et al. (2018) revealed that aquaculture organisms have a significant impact on CDOM production in the mariculture area of the Northern Yellow Sea. Therefore, our results suggest that the contribution of mariculture followed by the eelgrass ecosystem significantly to the nutrients cycles and CDOM absorption in AKE and to the distinct water-mass systems inside and outside AKE. However, the role of mariculture and eelgrass meadows as a source of DOM and CDOM (i.e., the Blue Carbon aspect of seagrass) has yet to be fully investigated in AKE. Additionally, little is known about the role of the microbial carbon pump (Azam et al., 1983; Jiao et al., 2011) in the transfer of DOM and CDOM to higher trophic levels through bacteria, flagellates, and ciliates in the Akkeshi watershed as a whole. Further studies using SUVA254 and EEM-PARAFAC analyses are required to clarify the contribution of wetlands, salt marshes, eelgrass meadows, and mariculture to DOM and CDOM in AKE and AB.
Ternary plots of absorption components showed that CDOM absorption was the main factor affecting light distribution at the surface of AKE across all seasons (Figure 7). These results suggest that the water mass in AKE was affected by CDOM-rich wetland river discharge and the release of CDOM from eelgrass meadows and mariculture. aNAP(443), which reflects the presence of suspended particles, had a small impact on the light absorption budget in AKE, except in December 2014 because development of the eelgrass canopy contributed to a reduction in current velocity and a corresponding decrease in sediment resuspension in eelgrass meadows (Hasegawa et al., 2008). On the other hand, our monthly observations with high spatial resolution revealed that the main light-absorbing component in AB varied widely among seasons. Absorption by phytoplankton assemblages accounted for more than half of the total absorption budget at some stations during the spring and autumn blooms in April and September 2014 (Figures 7A,F). The contribution of NAP to the total absorption budget increased in February because particles resuspension is enhanced by strong vertical mixing and the river waters and water mass in AKE are frozen solid during the winter (Figure 7K). Therefore, our results suggest that the dominant absorption property varies seasonally, even in the wetland-influenced coastal region.
Moreover, we found significant relationships between ZSD and aNAP(443) and aCDOM(443) in AB for all samples across all seasons (Figures 8D–F). Chl a concentrations and aph(443) were not correlated with ZSD in the study area (Figures 8A,B). Accordingly, our results highlighted that the inherent optical properties (IOPs), including NAP and CDOM, are crucial for estimating water transparency in optically complex coastal waters. Because the parameters of Chl a concentration and ZSD are often used as indicators of eutrophication and turbidity in inland, coastal, and oceanic waters, many previous studies (e.g., Lewis et al., 1988; Falkowski and Wilson, 1992; Morel et al., 2007; Boyce et al., 2010, 2012; Doron et al., 2011) have used the empirical relationship between ZSD and Chl a concentrations to investigate phytoplankton productivity and develop algorithms for satellite ocean color remote sensing, especially in open oceans with optically simple Case I water, where phytoplankton is the primary factor affecting the IOPs of a water body (Morel and Prieur, 1977; Prieur and Sathyendranath, 1981; IOCCG, 2000). However, the variations of IOPs in optically complex coastal waters (Case II water) interacting with terrestrial waters are determined by phytoplankton, NAP, and CDOM (IOCCG, 2000; Hooker et al., 2020, 2021). Although many empirical conversion factors have been reported for predicting the diffuse attenuation coefficient of the photosynthetically available radiation (PAR) (KPAR, m–1), which is an apparent optical property (AOP) that varies with the sun angle (Preisendorfer, 1986), there is no universal conversion factor because ZSD is affected by the bulk optical properties, especially in Case II waters (Lee et al., 2018 and references therein).
Colored dissolved organic matter also exhibits strong absorption in the UV range (Bricaud et al., 1981; Coble, 2007; Nelson and Seigel, 2013) and plays an important role in shading aquatic organisms from harmful UV radiation (Walsh et al., 2003; Tedetti and Sempéré, 2006). In fact, Taguchi et al. (1994) investigated the influence of UV radiation on the natural assemblage of phytoplankton during spring and autumn diatom blooms in AB and showed an enhanced photosynthetic rate in the absence of UV-B radiation. CDOM could protect primary producers in AKE and AB and contribute to the enhanced growth and photosynthesis of primary producers. Additionally, in AKE, the changes in the intensity and spectral distribution of light associated with the changes in CDOM and NAP absorption could influence below-ground organic carbon storage in seagrass soils, which constitute the majority of the total carbon stocks of seagrasses (Fourqurean et al., 2012).
In the Akkeshi watershed, some three-dimensional physical–biological coupled models including eelgrass and aquaculture components have been developed for the environmental conservation and sustainable management of aquaculture and fisheries (Oshima et al., 1999, 2006; Akabane et al., 2003; Yoon et al., 2013; Abe et al., 2015). These ecosystem models employ a simple formulation to describe light distribution in the water column. However, previous studies have emphasized the importance of considering the spectral light field using the bio-optical and/or radiative transfer model in ecosystem models (Fujii et al., 2007; Kettle and Merchant, 2008; Dutkiewicz et al., 2015; Bengil et al., 2016). For example, Urtizberea et al. (2013) conducted a sensitivity analysis of the influence of CDOM on the euphotic zone using marine ecosystem models, and showed that the simulated euphotic zone properties are strongly influenced by variations in CDOM attenuation. They therefore suggested that CDOM variations are useful for constraining uncertainties in water column predictions in marine ecosystem models. Adams et al. (2016) proposed the seagrass-sediment-light (SSL) feedback for ecosystem models to help with the spatial prioritization of conservation and restoration efforts in the seagrass meadows of coastal environments. Furthermore, Clark et al. (2019) proposed a mechanistic photochemical model of CDOM for the carbon cycle model, especially in regions with strong gradients of CDOM along salinity. The results presented herein indicate that IOPs, including CDOM released from the mariculture and eelgrass meadows, could improve ecosystem model predictions of light distribution and spectral quality in the water column, as well as evaluations of the carbon budget in coastal waters, which are highly productive and important for sustainable management and the livelihood of coastal communities.
This study is the first to investigate the seasonal and spatial distribution of the absorption properties of CDOM, NAP, and phytoplankton as a function of temperature, salinity, nutrients, and water transparency along the river–eelgrass meadows–coastal waters continuum in the semi-enclosed coastal sea of Akkeshi-ko estuary and Akkeshi Bay, Japan, which includes the second largest Ramsar protected wetland (the Bekanbeushi wetland) in Japan. Although silicate concentrations and CDOM absorption in the Akkeshi watershed is primarily influenced by wetland-influenced river discharge from the Bekanbeushi River, our study suggests that mariculture and eelgrass meadows contribute to nutrient cycle and CDOM absorption, even in wetland-influenced coastal waters. Our study also shows that the absorption spectra of NAP and CDOM, rather than Chl a concentration, have a significant impact on water transparency in the coastal waters of Akkeshi Bay. The results of this research indicate that IOP components as well as CDOM derived from the metabolic activities of mariculture and eelgrass meadows could improve the prediction of light intensity and quality in the water column in ecosystem models of the freshwater–eelgrass–coastal waters continuum with optically complex coastal waters. However, further studies on the contribution of multiple sources to nutrients and CDOM are required to better understand Blue Carbon in coastal regions.
The original contributions presented in the study are included in the article/supplementary material, further inquiries can be directed to the corresponding author/s.
TI conceived and designed this research. TI and HA conducted the fieldwork. TI, HA, and HK did the experiment and analyses. TI drafted the manuscript. TI, HA, HK, and MN contributed to improving the final manuscript. All the authors contributed to the article and approved the submitted version.
This work was partially supported by the JSPS KAKENHI (Grant Number 19K06181) and the Joint Research Program of the Institute of Low Temperature Science, Hokkaido University (17K004 and 20S013).
The authors declare that the research was conducted in the absence of any commercial or financial relationships that could be construed as a potential conflict of interest.
The handling editor declared a past co-authorship with one of the authors TI.
All claims expressed in this article are solely those of the authors and do not necessarily represent those of their affiliated organizations, or those of the publisher, the editors and the reviewers. Any product that may be evaluated in this article, or claim that may be made by its manufacturer, is not guaranteed or endorsed by the publisher.
We thank S. Hamano and H. Katsuragawa for their helpful assistance and sampling during field expedition. We are grateful to T. Yoshioka for helpful discussions.
Abe, H., Hasegawa, N., Yoon, S., and Kishi, M. J. (2015). Evaluation of Manila clam (Ruditapes philippinarum) growth and microphytobenthos resuspension in a subarctic lagoon in Japan. Hydrobiologia 758, 87–98. doi: 10.1007/s10750-015-2275-4
Adams, M. P., Hovey, R. K., Hipsey, M. R., Bruce, L. C., Ghisalberti, M., and Lowe, R. J. (2016). Feedback between sediment and light for seagrass: where is it important? Limnol. Oceanogr. 61, 1937–1955. doi: 10.1002/lno.10319
Akabane, H., Kishi, M. J., Mukai, H., and Iizumi, H. (2003). The response of the ecosystem of Akkeshi Lake, an estuary in northern Japan, to nutrients input from terrestrial area. Bull. Coast. Oceanogr. 40, 171–179.
Aoyama, M., Ota, H., Kimura, M., Kitao, T., Mitsuda, H., Murata, A., et al. (2012). Current status of homogeneity and stability of the reference materials for nutrients in seawater. Anal. Sci. 28, 911–916.
Azam, F., Fenchel, T., Field, J. G., Gray, J. S., Meyer-Reil, L. A., and Thingstad, F. (1983). The ecological role of water-column microbes in the sea. Mar. Ecol. Prog. Ser. 10, 257–263.
Babin, M., Stramski, D., Ferrari, G. M., Claustre, H., Bricaud, A., Obolensky, G., et al. (2003). Variations in the light absorption coefficient of phytoplankton, nonalgal particles, and dissolved organic matter in coastal waters around Europe. J. Geophys. Res. 108:3211. doi: 10.1029/2001JC000882
Bartoli, M., Nizzoli, D., Viaroli, P., Turolla, E., Castaldelli, G., Fano, E. A., et al. (2001). Impact of Tapes philippinarum farming on nutrient dynamics and benthic respiration in the Sacca di Goro. Hydrobiologia 455, 203–212.
Bauer, J. E., Cai, W. J., Raymond, P. A., Bianchi, T. S., Hopkinson, C. S., and Regnier, P. A. G. (2013). The changing carbon cycle of the coastal ocean. Nature 504, 61–70. doi: 10.1038/nature12857
Bengil, F., McKee, D., Beşiktepe, S. T., Calzado, V. S., and Tree, C. (2016). A bio-optical model for integration into ecosystem models for the Ligurian Sea. Prog. Oceanogr. 149, 1–15. doi: 10.1016/j.pocean.2016.10.007
Bertelli, C. M., and Unsworth, R. K. F. (2014). Protecting the hand that feeds us: seagrass (Zostera marina) serves as commercial juvenile fish habitat. Mar. Pollut. Bull. 83, 425–429. doi: 10.1016/j.marpolbul.2013.08.011
Blough, N. V., Zafiriou, O. C., and Bonilla, J. (1993). Optical absorption spectra of waters from the Orinoco River outflow: terrestrial input of colored organic matter to the Caribbean. J. Geophys. Res. 98, 2271–2278. doi: 10.1029/92JC02763
Borges, A. V. (2005). Do we have enough pieces of the jigsaw to integrate CO2 fluxes in the coastal ocean? Estuaries 28, 3–27.
Boyce, D. G., Lewis, M., and Worm, B. (2012). Integrating global chlorophyll data from 1890 to 2010. Limnol. Oceanogr. Methods 10, 840–852. doi: 10.4319/lom.2012.10.840
Boyce, D. G., Lewis, M. R., and Worm, B. (2010). Global phytoplankton decline over the past century. Nature 466, 591–596. doi: 10.1038/nature09268
Bricaud, A., Morel, A., and Prieur, L. (1981). Absorption by dissolved organic matter of the sea (yellow substance) in the UV and visible domains. Limnol. Oceanogr. 26, 43–53.
Canuel, E. A., and Hardison, A. K. (2016). Sources, ages, and alteration of organic matter in estuaries. Annu. Rev. Mar. Sci. 8, 409–434. doi: 10.1146/annurev-marine-122414-034058
Carbonnel, V., Vanderborght, J. P., Lionard, M., and Chou, L. (2013). Diatoms, silicic acid and biogenic silica dynamics along the salinity gradient of the Scheldt estuary (Belgium/The Netherlands). Biogeochemistry 113, 657–682. doi: 10.1007/s10533-012-9796-y
Carey, J. C., and Fulweiler, R. W. (2014). Salt marsh tidal exchange increases residence time of silica in estuaries. Limnol. Oceanogr. 59, 1203–1212. doi: 10.4319/lo.2014.59.4.1203
Clark, J. B., Neale, P., Tzortziou, M., Cao, F., and Hood, R. R. (2019). A mechanistic model of photochemical transformation and degradation of colored dissolved organic matter. Mar. Chem. 214:103666. doi: 10.1016/j.marchem.2019.103666
Coble, P. G. (2007). Marine optical biogeochemistry: the chemistry of ocean color. Chem. Rev. 107, 402–418.
Cowan, J. L. W., Pennock, J. R., and Boynton, W. R. (1996). Seasonal and interannual patterns of sediment-water nutrient and oxygen fluxes in Mobile Bay, Alabama (USA):regulating factors and ecological significance. Mar. Ecol. Prog. Ser. 141, 229–245.
Dame, R. F., Spurrier, J. D., and Wolaver, T. G. (1989). Carbon, nitrogen and phosphorus processing by an oyster reef. Mar. Ecol. Prog. Ser. 54, 249–256.
Danhiez, F. P., Vantrepotte, V., Cauvin, A., Lebourg, E., and Loisel, H. (2017). Optical properties of chromophoric dissolved organic matter during a phytoplankton bloom. Implication for DOC estimates from CDOM absorption. Limnol. Oceanogr. 62, 1409–1425. doi: 10.1002/lno.10507
Del Vecchio, R., and Blough, N. V. (2004). Spatial and seasonal distribution of chromophoric dissolved organic matter and dissolved organic carbon in the Middle Atlantic Bight. Mar. Chem. 89, 169–187. doi: 10.1016/j.marchem.2004.02.027
Doron, M., Babin, M., Hembise, O., Mangin, A., and Garnesson, P. (2011). Ocean transparency from space: validation of algorithms estimating Secchi depth using MERIS, MODIS and SeaWiFS data. Remote Sens. Environ. 115, 2986–3001. doi: 10.1016/j.rse.2011.05.019
Duarte, C. M., Middelburg, J. J., and Caraco, N. (2005). Major role of marine vegetation on the oceanic carbon cycle. Biogeosciences 2, 1–8. doi: 10.5194/bg-2-1-2005
Dutkiewicz, S., Hickman, A. E., Jahn, O., Gregg, W. W., Mouw, C. B., and Follows, M. J. (2015). Capturing optically important constituents and properties in a marine biogeochemical and ecosystem model. Biogeosciences 12, 4447–4481. doi: 10.5194/bg-12-4447-2015
Falkowski, P. G., and Wilson, C. (1992). Phytoplankton productivity in the North Pacific Ocean since 1900 and implications for absorption of anthropogenic CO2. Nature 358, 741–743. doi: 10.1038/358741a0
Ferrari, G. M., and Dowell, M. D. (1998). CDOM absorption characteristics with relation to fluorescence and salinity in coastal areas of the Southern Baltic Sea. Estuar. Coast. Shelf Sci. 47, 91–105. doi: 10.1006/ecss.1997.0309
Fichot, C. G., and Benner, R. (2012). The spectral slope coefficient of chromophoric dissolved organic matter (S275–295) as a tracer of terrigenous dissolved organic carbon in river-influenced ocean margins. Limnol. Oceanogr. 57, 1453–1466. doi: 10.4319/lo.2012.57.5.1453
Fletcher, S., Kawabe, M., and Rewhorn, S. (2011). Wetland conservation and sustainable coastal governance in Japan and England. Mar. Pollut. Bull. 62, 956–962. doi: 10.1016/j.marpolbul.2011.02.048
Fourqurean, J. W., Duarte, C. M., Kennedy, H., Marbà, N., Holmer, M., Mateo, M. A., et al. (2012). Seagrass ecosystems as a globally significant carbon stock. Nat. Geosci. 5, 505–509. doi: 10.1038/NGEO1477
Fujii, M., Boss, E., and Chai, F. (2007). The value of adding optics to ecosystem models: a case study. Biogeosciences 4, 817–835. doi: 10.5194/bg-4-817-2007
Guo, W., Stedmon, C. A., Han, Y., Wu, F., Yu, X., and Hu, M. (2007). The conservative and non-conservative behavior of chromophoric dissolved organic matter in Chinese estuarine waters. Mar. Chem. 107, 357–366. doi: 10.1016/j.marchem.2007.03.006
Hansell, D. A., and Carlson, C. (2014). Biogeochemistry of Marine Dissolved Organic matter (2nd). Cambrdige: Academic press.
Hasegawa, N., Hori, M., and Mukai, H. (2007). Seasonal shifts in seagrass bed primary producers in a cold-temperate estuary: dynamics of eelgrass Zostera marina and associated epiphytic algae. Aquat. Bot. 86, 337–345. doi: 10.1016/j.aquabot.2006.12.002
Hasegawa, N., Hori, M., and Mukai, H. (2008). Seasonal changes in eelgrass functions: current velocity reduction, prevention of sediment resuspension, and control of sediment–water column nutrient flux in relation to eelgrass dynamics. Hydrobiologia 596, 387–399. doi: 10.1007/s10750-007-9111-4
Hasegawa, N., Onitsuka, T., Takeyama, S., and Maekawa, K. (2015). Oyster Culture in Hokkaido, Japan. Bull. Fish. Res. Agen. 40, 173–177.
Hasegawa, N., Sawaguchi, S., Unuma, T., Onitsuka, T., and Hamaguchi, M. (2014). Variation in Manila clam (Ruditapes philippinarum) fecundity in eastern Hokkaido. Japan. J. Shellfish Res. 33, 739–746. doi: 10.2983/035.033.0308
Hedges, J. I., Keil, R. G., and Benner, R. (1997). What happens to terrestrial organic matter in the ocean? Org. Geochem. 27, 195–212. doi: 10.1016/S0146-6380(97)00066-1
Helms, J. R., Stubbins, A., Ritchie, J. D., Minor, E. C., Kieber, D. J., and Mopper, K. (2008). Absorption spectral slopes and slope ratios as indicators of molecular weight, source, and photobleaching of chromophoric dissolved organic matter. Limnol. Oceanogr. 53, 955–969. doi: 10.4319/lo.2008.53.3.0955
Hooker, S. B., Houskeeper, H. F., Kudela, R. M., Matsuoka, A., Suzuki, K., and Isada, T. (2021). Spectral modes of radiometric measurements in optically complex waters. Cont. Shelf Res. 219:104357. doi: 10.1016/j.csr.2021.104357
Hooker, S. B., Matsuoka, A., Kudela, R. M., Yamashita, Y., Suzuki, K., and Houskeeper, H. F. (2020). A global end-member approach to derive aCDOM(440) from near-surface optical measurements. Biogeosciences 17, 475–497. doi: 10.5194/bg-17-475-2020
Hothorn, T., and Hornik, K. (2021). exactRankTests: Exact Distributions for Rank and Permutation Tests. R Package Version 0.8-32.
Howard-Williams, C. (1985). Cycling and retention of nitrogen and phosphorus in wetlands: a theoretical and applied perspective. Freshw. Biol. 15, 391–431. doi: 10.1111/j.1365-2427.1985.tb00212.x
Hu, S., Niu, Z., and Chen, Y. (2017a). Global Wetland Datasets: a Review. Wetland 37, 807–817. doi: 10.1007/s13157-017-0927-z
Hu, S., Niu, Z., Chen, Y., Li, L., and Zhang, H. (2017b). Global wetlands: potential distribution, wetland loss, and status. Sci. Total Environ. 586, 319–327. doi: 10.1016/j.scitotenv.2017.02.001
Iizumi, H., Hattori, A., and McRoy, C. P. (1982). Ammonium regeneration and assimilation in eelgrass (Zostera marina) beds. Mar. Biol. 66, 59–65. doi: 10.1017/BF00397255
Iizumi, H., Taguchi, S., Minami, T., and Maekawa, S. (1995). Distribution and variability of nutrients, chlorophyll a, particulate organic matters, and their carbon and nitrogen contents, in Akkeshi-ko, an estuary in northern Japan. Bull. Hokkaido Natl. Fish. Res. Inst. 59, 43–67.
Inukai, T., and Nishio, S. (1937). A limnological study of Akkeshi Lake with special reference to the propagation of the oyster. J. Fac. Agric. Hokkaido Imp. Univ. 40, 1–33.
IOCCG (2000). “Remote sensing of ocean colour in coastal, and other optically-Complex, Waters,” in Reports of the International Ocean-Colour Coordinating Group, No. 3, ed. S. Sathyendranath (Dartmouth: IOCCG).
Isada, T., Hattori-Saito, A., Saito, H., Kondo, Y., Nishioka, J., Kuma, K., et al. (2019). Responses of phytoplankton assemblages to iron availability and mixing water masses during the spring bloom in the Oyashio region, NW Pacific. Limnol. Oceanogr. 64, 197–216. doi: 10.1002/lno.11031
Isada, T., Iida, T., Liu, H., Saitoh, S.-I., Nishioka, J., Nakatsuka, T., et al. (2013). Influence of Amur River discharge on phytoplankton photophysiology in the Sea of Okhotsk during late summer. J. Geophys. Res. 118, 1995–2013. doi: 10.1002/jgrc.20159
Jiao, N., Herndl, G. J., Hansell, D. A., Benner, R., Kattner, G., Wilhelm, S. W., et al. (2011). The microbial carbon pump and the oceanic recalcitrant dissolved organic matter pool. Nat. Rev. Microbiol. 9:555. doi: 10.1038/nrmicro2386-c5
Kasai, H., Saito, H., Yoshimori, A., and Taguchi, S. (1997). Variability in timing and magnitude of spring bloom in the Oyashio region, the western subarctic Pacific off Hokkaido, Japan. Fish. Oceanogr. 6, 118–129.
Kettle, H., and Merchant, C. J. (2008). Modeling ocean primary production: sensitivity to spectral resolution of attenuation and absorption of light. Prog. Oceanogr. 78, 135–146. doi: 10.1016/j.pocean.2008.04.002
Kishino, M., Takahashi, M., Okami, N., and Ichimura, S. (1985). Estimation of the spectral absorption coefficients of phytoplankton in the sea. Bull. Mar. Sci. 37, 634–642.
Lee, Z., Shang, D., Du, K., and Wei, J. (2018). Resolving the long-standing puzzles about the observed Secchi depth relationships. Limnol. Oceangr. 63, 2321–2336. doi: 10.1002/lno.10940
Lewis, M. R., Kuring, N., and Yentsch, C. (1988). Global patterns of ocean transparency: implications for the new production of the open ocean. J. Geophys. Res. 93, 6847–6856. doi: 10.1029/JC093iC06p06847
Macreadie, P. I., Anton, A., Raven, J. A., Beaumont, N., Connolly, R. M., Friess, D. A., et al. (2019). The future of Blue Carbon science. Nat. Commun. 10:3998. doi: 10.1038/s41467-019-11693-w
Maie, N., Sekiguchi, S., Watanabe, A., Tsutsuki, K., Yamashita, Y., Melling, L., et al. (2014). Dissolved organic matter dynamics in the oligo/meso-haline zone of wetland-influenced coastal rivers. J. Sea Res. 91, 58–69. doi: 10.1016/j.seares.2014.02.016
Momota, K., and Nakaoka, M. (2018). Seasonal change in spatial variability of eelgrass epifaunal community in relation to gradients of abiotic and biotic factors. Mar. Ecol. 39:e12522. doi: 10.1111/maec.12522
Morel, A., Huot, Y., Gentili, B., Werdell, P. J., Hooker, S. B., and Franz, B. A. (2007). Examining the consistency of products derived from various ocean color sensors in open ocean (Case 1) waters in the perspective of a multi-sensor approach. Remote Sens. Environ. 111, 69–88. doi: 10.1016/j.rse.2007.03.012
Morel, A., and Prieur, L. (1977). Analysis of variations in ocean color. Limnol. Oceanogr. 22, 709–722. doi: 10.4319/lo.1977.22.4.0709
Muller-Karger, F. E., Varela, R., Thunell, R., Luerssen, R., Hu, C., and Walsh, J. J. (2005). The importance of continental margins in the global carbon cycle. Geophys. Res. Lett. 32:L01602. doi: 10.1029/2004GL021346
Nagao, S., Kumegawa, M., Kodama, H., and Terashima, M. (2016). Transport behavior of dissolved organic matter and iron in river waters from the Bekanbeushi River System in eastern Hokkaido, Japan. Low Temperature Sci. 74, 1–12.
Najjar, R. G., Herrmann, M., Alexander, R., Boyer, E. W., Burdige, D. J., Butman, D., et al. (2018). Carbon budget of tidal wetlands, estuaries, and shelf waters of eastern North America. Global Biogeochem. Cyc. 32, 389–416. doi: 10.1002/2017GB005790
Nakagawa, T., Tsuchiya, Y., Ueda, S., Fukui, M., and Takahashi, R. (2019). Eelgrass Sediment microbiome as a Nitrous Oxide Sink in Brackish Lake Akkeshi, Japan. Microbes Environ. 34, 13–22. doi: 10.1264/jsme2.ME18103
Nelson, K. A., Leonard, L. A., Posey, M. H., Alphin, T. D., and Mallin, M. A. (2004). Using transplanted oyster (Crassostrea virginica) beds to improve water quality in small tidal creeks: a pilot study. J. Exp. Mar. Biol. Ecol. 298, 347–368. doi: 10.1016/S0022-0981(03)00367-8
Nelson, N. B., and Seigel, D. (2013). The global distribution and dynamics of chromophoric dissolved organic matter. Annu. Rev. Mar. Sci. 5, 447–476. doi: 10.1146/annurev-marine-120710-100751
Nizzoli, D., Bartoli, M., and Viaroli, P. (2006). Nitrogen and phosphorous budgets during a farming cycle of the Manila clam Ruditapes philippinarum: an in situ experiment. Aquaculture 261, 98–108. doi: 10.1016/j.aquaculture.2006.06.042
Ogawa, H., and Tanoue, E. (2003). Dissolved organic matter in oceanic waters. J. Oceanogr. 59, 129–147. doi: 10.1023/A:1025528919771
Oshima, Y., Kishi, M. J., and Mukai, H. (2006). Numerical study on nutrient cycle in Akkeshi estuary focused on the influence of bivalve. Japan. J. Benthol. 61, 66–76. doi: 10.5179/benthos.61.66
Oshima, Y., Kishi, M. J., and Sugimoto, T. (1999). Evaluation of the nutrient budget in a seagrass bed. Ecol. Model. 115, 19–33. doi: 10.1016/S0304-3800(98)00155-0
Park, S. R., Moon, K., Kim, S. H., and Lee, K.-S. (2021). Growth and photoacclimation strategies of three Zostera species along a vertical gradient: implications for seagrass zonation patterns. Front. Mar. Sci. 8:594779. doi: 10.3389/fmars.2021.594779
Preisendorfer, R. W. (1986). Secchi disk science: visual optics of natural waters. Limnol. Oceangr. 31, 909–926. doi: 10.4319/lo.1986.31.5.0909
Prieur, L., and Sathyendranath, S. (1981). An optical classification of coastal and oceanic waters based on the specific spectral absorption curves of phytoplankton pigments, dissolved organic matter, and other particulate materials. Limnol. Oceanogr. 16, 671–689. doi: 10.4319/lo.1981.26.4.0671
R Core Team (2021). R: A Language and Environment for Statistical Computing. Vienna: R Foundation for Statistical Computing.
Ramsar Information Sheet [RIS] (2005). Information Sheet on Ramsar Wetlands: Akkeshi-ko and Bekambeushi-shitsugen. Rmasar Bureau. Available Online at: https://rsis.ramsar.org/ris/614 (accessed September 28, 2021).
Reddy, K. R., Kadlec, R. H., Flaig, E., and Gale, P. M. (1999). Phosphorus retention in streams and wetlands: a review. Crit Rev. Env. Sci. Technol. 29, 83–146. doi: 10.1080/10643389991259182
Redfield, A. C. (1958). The biological control of chemical factors in the environment. Am. Sci. 46, 205–221.
Revelle, W. (2021). Psych: Procedures for Personality and Psychological Research. Evanston: Northwestern University.
Rochello-Newall, E. J., and Fisher, T. R. (2002). Chromophoric dissolved organic matter and dissolved organic carbon in Chesapeake Bay. Mar. Chem. 77, 23–41. doi: 10.1016/S0304-4203(01)00073-1
Saito, H., Tsuda, A., and Kasai, H. (2002). Nutrient and plankton dynamics in the Oyashio region of the western subarctic Pacific Ocean. Deep-Sea Res. II 49, 5463–5486. doi: 10.1016/S0967-0645(02)00204-7
Stabenau, E. R., Zepp, R. G., Bartels, E., and Zika, R. G. (2004). Role of the seagrass Thalassia testudinum as a source of chromophoric dissolved organic matter in coastal south Florida. Mar. Ecol. Prog. Ser. 282, 59–72. doi: 10.3354/meps282059
Stedmon, C. A., and Nelson, N. B. (2014). “The optical properties of DOM in the Ocean,” in Biogeochemistry of Marine Dissolved Organic Matter (2nd), eds D. A. Hansell and C. A. Carlson (San Diego: Academic press), 481–508.
Stramski, D., Reynolds, R. A., Kaczmarek, S., Uitz, J., and Zheng, G. (2015). Correction of pathlength amplification in the filter-pad technique for measurements of particulate absorption coefficient in the visible spectral region. Appl. Opt. 54, 6763–6782. doi: 10.1364/AO.54.006763
Struyf, E., and Conley, D. J. (2009). Silica: an essential nutrient in wetland biogeochemistry. Front. Ecol. Environ. 7, 88–94. doi: 10.1890/070126
Struyf, E., Dausse, A., Van Damme, S., Bal, K., Gribsholt, B., Boschker, H. T. S., et al. (2006). Tidal marshes and biogenic silica recycling at the land–sea interface. Limnol. Oceanogr. 51, 838–846. doi: 10.4319/lo.2006.51.2.0838
Suzuki, R., and Ishimaru, T. (1990). An improved method for the determination of phytoplankton chlorophyll using N, N-dimethylformamide. J. Oceanogr. 46, 190–194. doi: 10.1007/BF02125580
Taguchi, S., Iseki, K., and Kawamura, T. (1977). The estimation of annual production by phytoplankton in Akkeshi Bay, Japan. J. Oceanogr. Soc. Japan 33, 97–102. doi: 10.1007/BF02110015
Taguchi, S., Saito, H., and Kasai, H. (1994). Enhanced photosynthetic rate of natural phytoplankton assemblages in the absence of ultraviolet radiation in Akkeshi Bay, Japan. Bull. Plankton Soc. Japan 41, 143–159.
Tanaka, Y., Bahrin, A., and Lamit, N. (2019). Production of chromophoric dissolved organic matter by seagrasses in brackish aquaculture water. Aquac. Res. 50, 1731–1734. doi: 10.1111/are.14033
Tanaka, Y., and Nakaoka, M. (2007). Interspecific variation in photosynthesis and respiration balance of three seagrasses in relation to light availability. Mar. Ecol. Prog. Ser. 350, 63–70. doi: 10.3354/meps07103
Tedetti, M., Bigot, L., Turquet, J., Guigue, C., Ferretto, N., Goutx, M., et al. (2020). Influence of Freshwater Discharges on Biogeochemistry and Benthic Communities of a Coral Reef Ecosystem (La Réunion Island, Indian Ocean). Front. Mar. Sci. 7:596165. doi: 10.3389/fmars.2020.596165
Tedetti, M., and Sempéré, R. (2006). Penetration of ultraviolet radiation in the marine environment. A Review. Photochem. Photobiol. 82, 389–397. doi: 10.1562/2005-11-09-IR-733
Tréguer, P., and De La Rocha, C. L. (2013). The world ocean silica cycle. Annu. Rev. Mar. Sci. 5, 477–501. doi: 10.1146/annurev-marine-121211-172346
Tréguer, P., Nelson, D. M., van Bennekom, A. J., DeMaster, D. J., Leynaert, A., and Quéguiner, B. (1995). The balance of silica in the world ocean: a re-estimate. Science 268, 375–379. doi: 10.1126/science.268.5209.375
Tzortziou, M., Neale, P. J., Megonigal, J. P., Pow, C. L., and Butterworth, M. (2011). Spatial gradients in dissolved carbon due to tidal marsh outwelling into a Chesapeake Bay estuary. Mar. Ecol. Prog. Ser. 426, 41–56. doi: 10.3354/meps09017
Tzortziou, M., Zeri, C., Dimitriou, E., Ding, Y., Jaffé, R., Anagnostou, E., et al. (2015). Colored dissolved organic matter dynamics and anthropogenic influences in a major transboundary river and its coastal wetland. Limnol. Oceanogr. 60, 1222–1240. doi: 10.1002/lno.10092
Urtizberea, A., Dupont, N., Rosland, R., and Aksnes, D. L. (2013). Sensitivity of euphotic zone properties to CDOM variations in marine ecosystem models. Ecol. Model. 256, 16–22. doi: 10.1016/j.ecolmodel.2013.02.010
Wagner, S., Jaffé, R., Cawley, K., Dittmar, T., and Stubbins, A. (2015). Associations between the molecular and optical properties of dissolved organic matter in the Florida Everglades, a model coastal wetland system. Front. Chem. 3:66. doi: 10.3389/fchem.2015.00066
Walsh, J. J. (1991). Importance of continental margins in the marine biogeochemical cycling of carbon and nitrogen. Nature 350, 53–55. doi: 10.1038/350053a0
Walsh, J. J., Weisberg, R. H., Dieterle, D. A., He, R., Darrow, B. P., Jolliff, J. P., et al. (2003). Phytoplankton response to intrusions of slope water on the West Florida Shelf: models and observations. J. Geophys. Res. 108:3190. doi: 10.1029/2002JC001406
Waycott, M., Duarte, C. M., Carruthers, T. J. B., Orth, R. J., Dennison, W. C., Olyarnik, S., et al. (2009). Accelerating loss of seagrasses across the globe threatens coastal ecosystems. Proc. Natl. Acad. Sci. U. S. A. 106, 12377–12381. doi: 10.1073/pnas.0905620106
Waycott, M., Longstaff, B. J., and Mellors, J. (2005). Seagrass population dynamics and water quality in the Great Barrier Reef region: a review and future research directions. Mar. Pollut. Bull. 51, 343–350. doi: 10.1016/j.marpolbul.2005.01.017
Welsch, D. T., Nizzoli, D., Fano, E. A., and Viaroli, P. (2015). Direct contribution of clams (Ruditapes philippinarum) to benthic fluxes, nitrification, denitrification and nitrous oxide emission in a farmed sediment. Estuar. Coast. Shelf Sci. 154, 84–93. doi: 10.1016/j.ecss.2014.12.021
Welschmeyer, N. A. (1994). Fluorometric analysis of chlorophyll-a in the presence of chlorophyll-b and phaeopigments. Limnol. Oceanogr. 39, 1985–1992.
Yamashita, Y., Scinto, L. J., Maie, N., and Jaffé, R. (2010). Dissolved organic matter characteristics across a Subtropical Wetland’s landscape: application of optical properties in the assessment of environmental dynamics. Ecosystems 13, 1006–1019. doi: 10.1007/s10021-010-9370-1
Yasuda, I. (2003). Hydrographic structure and variability in the Kuroshio-Oyashio transition area. J. Oceanogr. 59, 389–402. doi: 10.1023/A:1025580313836
Yoon, S., Abe, H., and Kishi, M. J. (2013). Responses of Manila clam growth and its food sources to global warming in a subarctic lagoon in Japan. Prog. Oceanogr. 119, 48–58. doi: 10.1016/j.pocean.2013.06.005
Zedler, J. B., and Kercher, S. (2005). WETLAND RESOURCES: status, trends, ecosystem services, and restorability. Annu. Rev. Environ. Res. 30, 39–74. doi: 10.1146/annurev.energy.30.050504.144248
Zhang, Y., Gao, X., Guo, W., Zhao, J., and Li, Y. (2018). Origin and dynamics of dissolved organic matter in a mariculture area suffering from summertime hypoxia and acidification. Front. Mar. Sci. 5:325. doi: 10.3389/fmars.2018.00325
Zhang, Z., Cao, Z., Grasse, P., Dai, M., Gao, L., Kuhnert, H., et al. (2020). Dissolved silicon isotope dynamics in large river estuaries. Geochim. Cosmochim. Acta 273, 367–382. doi: 10.1016/j.gca.2020.01.028
Ziegler, S., and Benner, R. (1999b). Nutrient cycling in the water column of a subtropical seagrass meadow. Mar. Ecol. Prog. Ser. 188, 51–62. doi: 10.3354/meps188051
Keywords: colored dissolved organic matter (CDOM), inherent optical properties (IOPs), Secchi disk, wetland, seagrass, mariculture, blue carbon, optically complex coastal waters
Citation: Isada T, Abe H, Kasai H and Nakaoka M (2021) Dynamics of Nutrients and Colored Dissolved Organic Matter Absorption in a Wetland-Influenced Subarctic Coastal Region of Northeastern Japan: Contributions From Mariculture and Eelgrass Meadows. Front. Mar. Sci. 8:711832. doi: 10.3389/fmars.2021.711832
Received: 19 May 2021; Accepted: 16 September 2021;
Published: 11 October 2021.
Edited by:
Hiroaki Saito, The University of Tokyo, JapanReviewed by:
Dimosthenis Traganos, German Aerospace Center, Helmholtz Association of German Research Centres (HZ), GermanyCopyright © 2021 Isada, Abe, Kasai and Nakaoka. This is an open-access article distributed under the terms of the Creative Commons Attribution License (CC BY). The use, distribution or reproduction in other forums is permitted, provided the original author(s) and the copyright owner(s) are credited and that the original publication in this journal is cited, in accordance with accepted academic practice. No use, distribution or reproduction is permitted which does not comply with these terms.
*Correspondence: Tomonori Isada, dC1pc2FkYUBmc2MuaG9rdWRhaS5hYy5qcA==
Disclaimer: All claims expressed in this article are solely those of the authors and do not necessarily represent those of their affiliated organizations, or those of the publisher, the editors and the reviewers. Any product that may be evaluated in this article or claim that may be made by its manufacturer is not guaranteed or endorsed by the publisher.
Research integrity at Frontiers

Learn more about the work of our research integrity team to safeguard the quality of each article we publish.