 Kangshun Zhao
 Min Zhang
 Kang Wang1,2
 Jun Xu
- 1Donghu Experimental Station of Lake Ecosystems, State Key Laboratory of Freshwater Ecology and Biotechnology of China, Institute of Hydrobiology, Chinese Academy of Sciences, Wuhan, China
- 2University of Chinese Academy of Sciences, Beijing, China
- 3Hubei Provincial Engineering Laboratory for Pond Aquaculture, College of Fisheries, Freshwater Aquaculture Collaborative Innovation Center of Hubei Province, Huazhong Agricultural University, Wuhan, China
- 4State Key Laboratory of Marine Resource Utilization in South China Sea, Hainan University, Haikou, China
- 5Laboratory for Marine Fisheries Science and Food Production Processes, Qingdao National Laboratory for Marine Science and Technology, Qingdao, China
China is the world’s largest producer of aquaculture and capture fisheries. How this country develops its aquaculture sector and whether such development can relieve pressure on wild fisheries remain a contentious issue in the past and for the future. This study aims to provide a broad assessment on the impact of aquaculture development in different periods on marine wild fisheries on the basis of aquaculture and marine wild fish catch data from all the coastal provinces of China. China’s aquaculture and capture fisheries have undergone substantial changes. From 1989 to 2002, China’s aquaculture, especially mariculture, had a strong relationship with marine wild fisheries. However, from 2003 to 2018, the impact of mariculture was weakened, whereas that of freshwater aquaculture had increased. Although aquaculture still puts pressure on marine wild fisheries, China’s aquaculture is currently moving toward sustainable development pattern with low input and high output. These results provide the first statistical evidence on the effects of aquaculture development on marine wild fisheries and contribute to the sustainable management of China’s aquaculture and marine capture fisheries.
Introduction
China has the largest capture fisheries and aquaculture production worldwide and accounted for 19.2% of global marine capture fishery production and 61.5% of global aquaculture production in 2016 (FAO, 2018). Aquaculture in China has developed rapidly in the past few decades, leading to country being the predominant aquaculture producer in the world since the 1990s. China’s aquaculture industry has recently received many critiques on the grounds of the environment (Biao and Kaijin, 2007; Herbeck et al., 2013; Zeng et al., 2013) and the excessive usage of marine wild fisheries resources (Cao et al., 2015). For example, Cao et al. (2015) expressed that China consumes a mass of fishmeal and forage fish (e.g., anchovy, sardine, and herring) due to its huge aquaculture industry and thus consequently diminishes the world’s wild fish resources. However, many peer experts such as Tang et al. (2016) and Han et al. (2018) disagreed with their negative views. These scholars have described the structure of China’s aquaculture in recent decades, the trends of fishmeal usage, and the efforts made by the Chinese government in protecting wild fisheries and sustainable development of fisheries. Their findings supported that the future world aquatic food would mostly be supplied from aquaculture (Cressey, 2009), which is destined to reduce the demand on wild fisheries (Han et al., 2018). Their standpoints are not without reasons. China contributes more than 60% to the global aquaculture output and will account for 38% of the fish supply for world’s human consumption by 2030 (FAO, 2014); however, the expenses would constitute only 25–30% of the world fishmeal (Han et al., 2018). Hambrey (2017) also reported the importance of aquaculture development for the Global Sustainable Development Goals.
How China develops its aquaculture sector and whether such development can relieve pressure on wild fisheries remain a contentious issue in the past and for the future (Chiu et al., 2013; Cao et al., 2015). Both sides have their own views, and neither side has directly explored the statistical relationship between China’s aquaculture and marine wild fisheries resources. No dispute arises on the existence of an inevitable link, positive or negative, between China’s aquaculture and wild fish resources in the past decades. Whether China’s efforts to aquaculture industries (such as alternative protein sources, improved feed manufacturing techniques, and decreased inclusion of fishmeal in aquafeeds) has relieved pressure on wild fisheries in recent decades must be analyzed. The relationships between the development of China’s aquaculture and the demand of marine wild fisheries resources are poorly understood. In this study, all the coastal provinces of China (accounts for 68.9% of the total aquaculture production in China) (Ministry of Agriculture and Rural Affairs of the People’s Republic of China, 1990–2019) were selected as the research object to explore the impact of aquaculture development in different periods on marine wild fisheries resources under the background of the rapid development of China’s fishery industry over the past 30 years.
On the basis of literatures and prior knowledge, a conceptual meta-model (Figure 1) was designed and used as the basis for testing the relationship between aquaculture and marine wild fisheries. Fishery gross product (FGP) was predicted to drive mariculture production (MAP), freshwater aquaculture production (FAP), and marine edible economic fish production (EFP) (De Silva and Turchini, 2009; Zhao et al., 2018). MAP and FAP were predicted to drive EFP and marine forage fish production (FFP) (Funge-Smith et al., 2005; De Silva and Turchini, 2009; Li et al., 2011; Chiu et al., 2013; Cao et al., 2015; Szuwalski et al., 2017; Han et al., 2018). MAP and FAP were predicted to accelerate each other (Funge-Smith et al., 2005; Li et al., 2011). Finally, EFP was predicted to drive FFP (Szuwalski et al., 2017; Zhang et al., 2020). This research is classified as a broad assessment, because the complex relationship between aquaculture structure, fisheries resource utilization and the unidentified “nei” species (not elsewhere included or unidentified species)/trash fish are not considered.
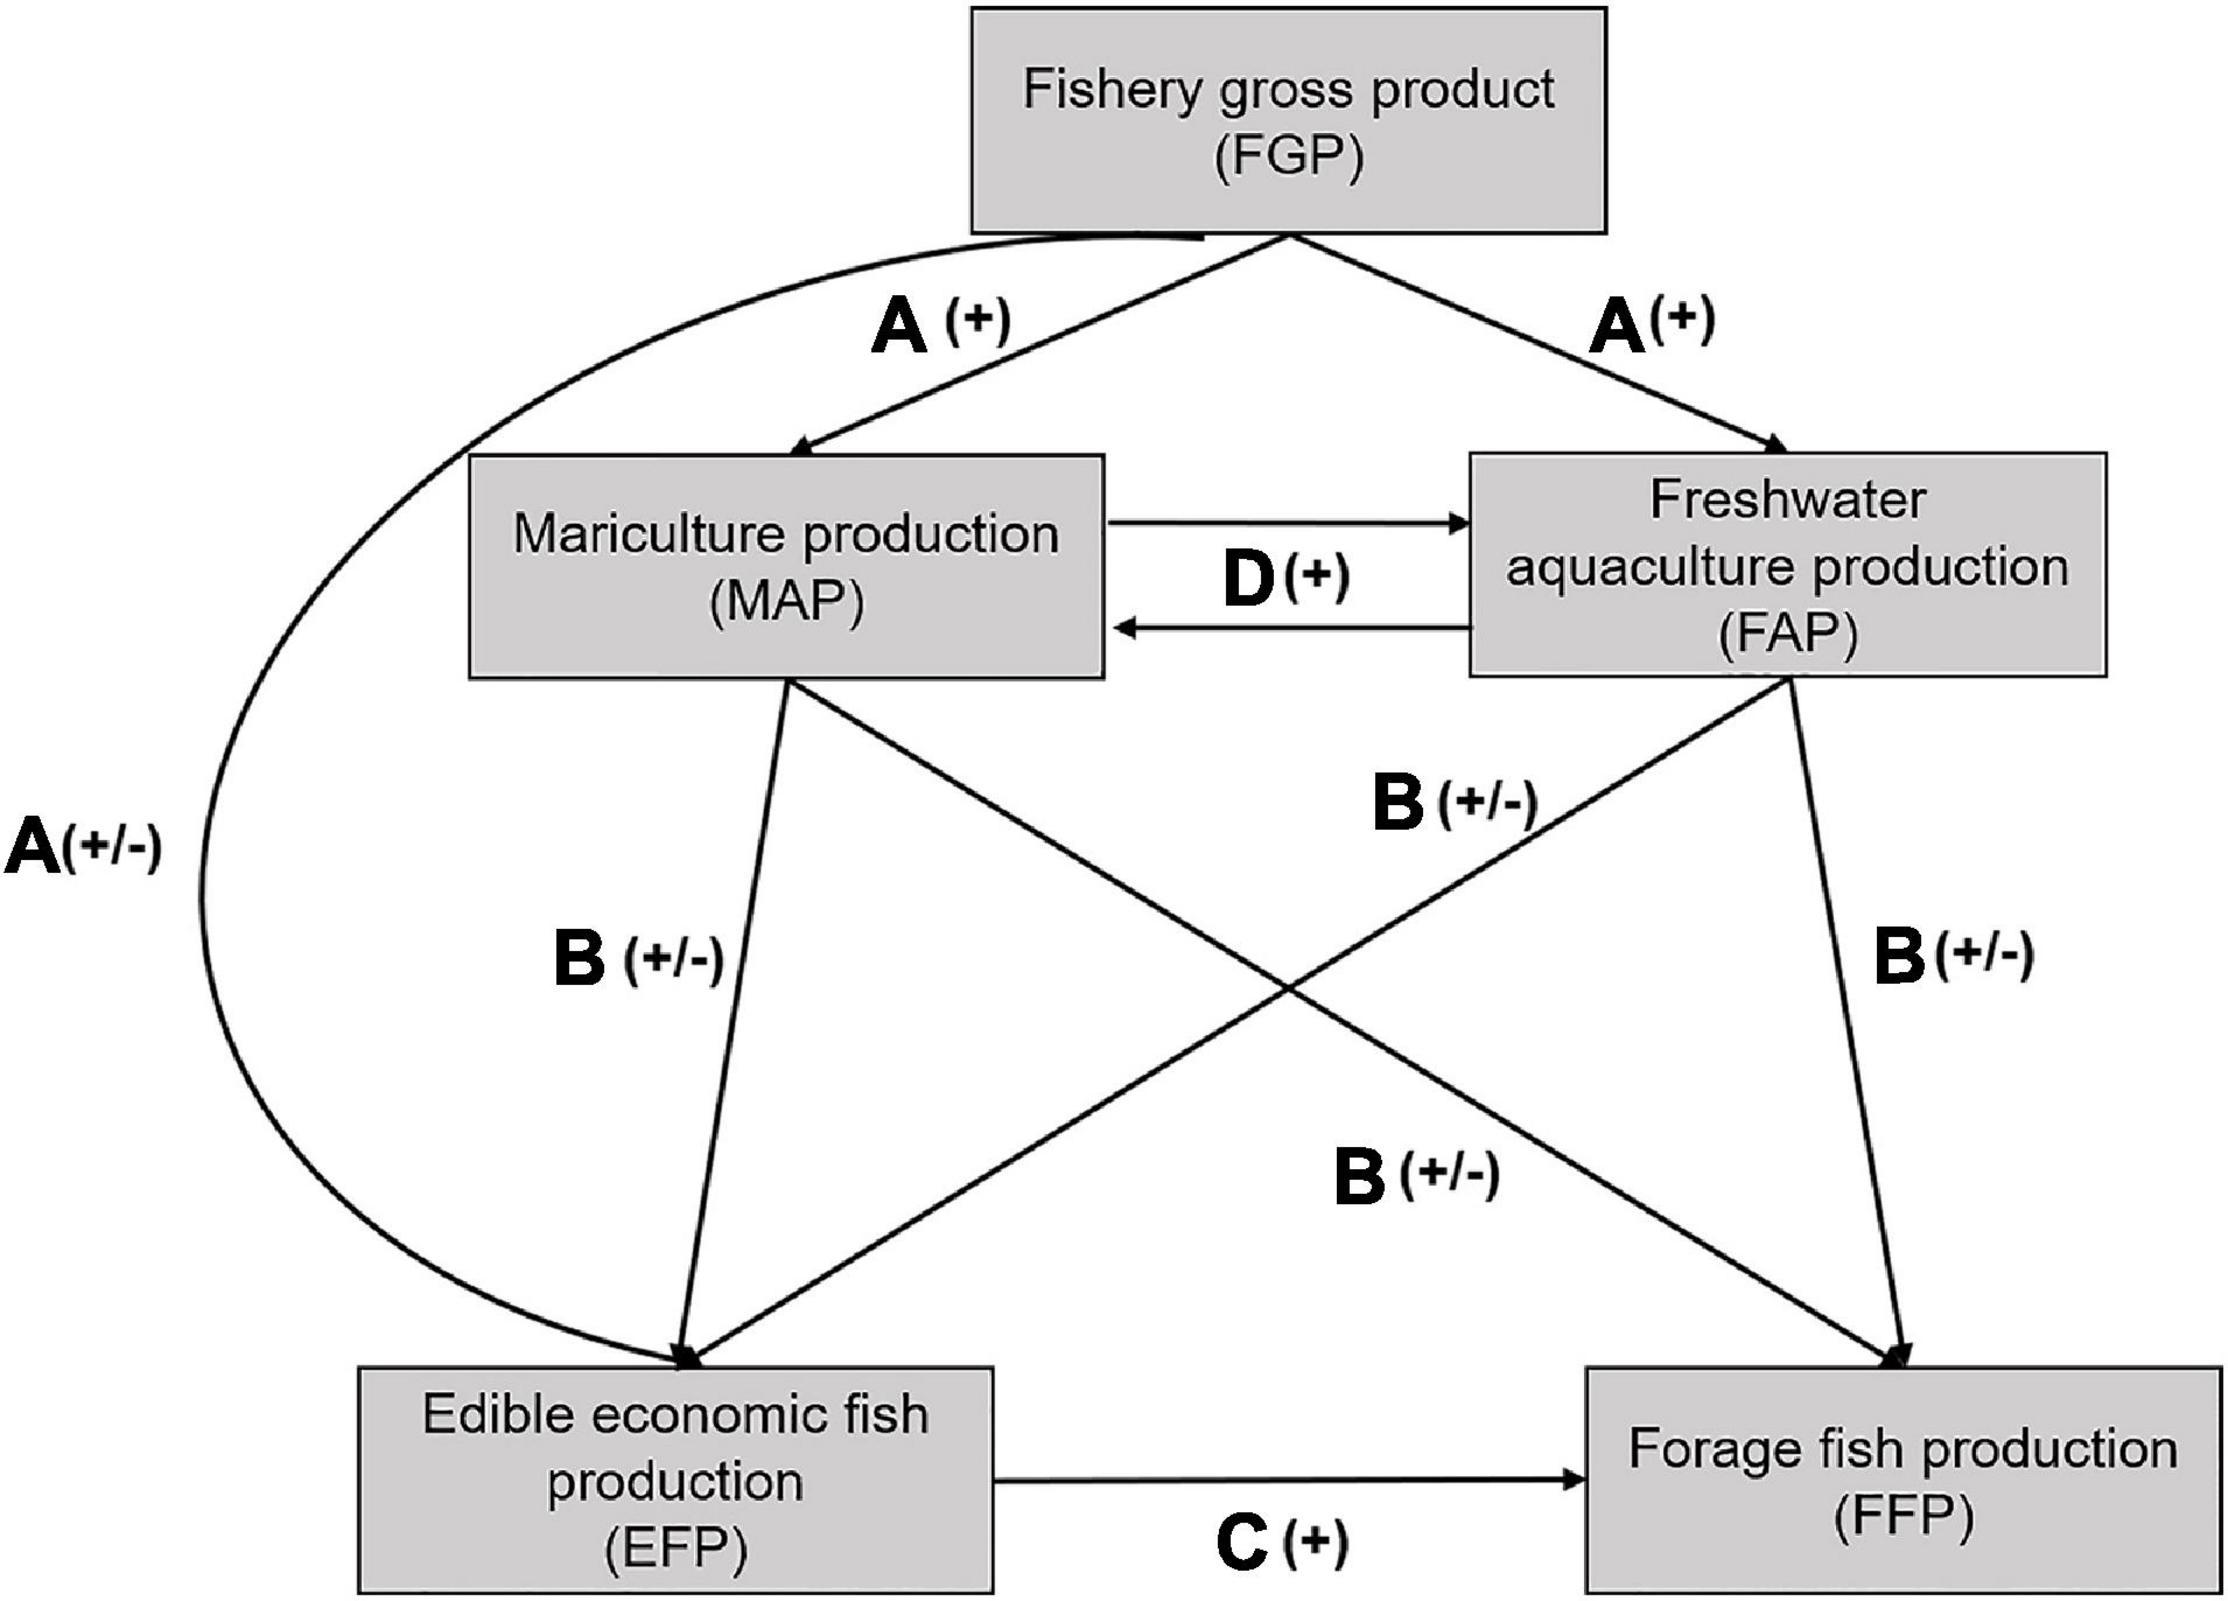
Figure 1. Conceptual diagram or metamodel of hypothesized influences on marine wild fisheries. Solid black arrows depict known causal effects among variates. Arrow labels correspond to exemplar references (A) De Silva and Turchini (2009) and Zhao et al. (2018), (B) Cao et al. (2015), Chiu et al. (2013), De Silva and Turchini (2009); Han et al. (2018), Li et al. (2011), Funge-Smith et al. (2005) and Szuwalski et al. (2017), (C) Szuwalski et al. (2017), and Zhang et al. (2020), (D) Li et al. (2011) and Funge-Smith et al. (2005). Parenthetic signs next to black arrow labels indicate that the relationship is expected to be positive (+), negative (–), or variable (±).
Materials and Methods
Data Set
Marine wild fish catch data were collected from the Ministry of Agriculture and Rural Affairs of the People’s Republic of China (1990–2019). Twenty-eight marine fish species or groups in the China Seas were reported according to province in the Chinese National Fishery Statistics Yearbook. Since 1989, 16 species or species groups have been reported continuously (Supplementary Table 1), accounting for over 84% of the reported fish species catch over the past three decades and indicating more comprehensive species recorded than those before 1988. Thus, the catch data of 16 marine wild fish species or species groups were collected in 11 coastal province administrative regions (Tianjin, Hebei, Liaoning, Shanghai, Jiangsu, Zhejiang, Fujian, Shandong, Guangdong, Guangxi, and Hainan) to reflect the demand of marine wild fish resources from 1989 to 2018 (Supplementary Figure 1). According to human uses, 16 marine wild fish species or species groups were divided into two categories: high-valued edible economic fish (i.e., Japanese scad, large yellow croaker, small yellow croaker, so-iny mullet, pike conger, ilisha, grouper, snapper, hairtail, golden threadfin bream, mackerel, pomfret, and black scraper) and low-valued forage fish (i.e., anchovy, sardine, and herring). These three forage fish species are the most typical and mainly used as the raw material to process fishmeal in China, and a small amount is used for direct feeding (Yu et al., 2020). Although these species cannot represent all the utilized wild fisheries resources, the fishing practices in China are largely indiscriminate (∼50% trawl fisheries) and there is little discard because a market exists for a wider range of species and sizes than are typically salable in other locales (Costello et al., 2016; Costello, 2017; Szuwalski et al., 2017). Thus, these 16 recorded fish species were chosen as indicator species for the demand of marine wild fisheries resources.
Mariculture production and FAP variables were selected to represent aquaculture development in China. These values were obtained for each province from Ministry of Agriculture and Rural Affairs of the People’s Republic of China (1990–2019). FGP measures the size of the fishery economy and represents the development of China’s fishery industry, and its data were extracted from National Bureau of Statistics of China (1990–2019).
Statistical Analysis
Stratigraphically constrained hierarchical clustering (SCHC) (Grimm, 1987) offers a suitable alternative for the detection of shifts in multivariate space and was used in this study to detect significant compositional shifts at the province-level of marine wild fish catches. According to the shifts, the impact of aquaculture on marine wild fisheries resources was analyzed in different periods. The method used is based on cluster analysis with the constraint that clusters are formed from the hierarchical agglomeration of annually adjacent assemblages. This clustering technique aims to assign cases to homogeneous groups (i.e., clusters) in which the constraint that encompasses each group is contiguous in time. Such hierarchical agglomeration depends on the local, not the entire, sequences; hence, the positions of splits will not change even when the sequence of data is truncated. This analysis method can be used to break the time series into contiguous blocks of time with similar assemblages (Legendre and Legendre, 2012). R packages “rioja” (Juggins, 2014) and “vegan” (Oksanen et al., 2013) were applied to conduct SCHC and broken-stick test, respectively.
Structural equation modeling (SEM) was used to determine the pathways underlying the effects of aquacultural predictors on marine wild fish catches in the context of fishery industry development. SEMs can be used to evaluate cause-and-effect relationships among discrete variable (Grace et al., 2012) and can simultaneously test system-level hypotheses that are expressed as complex networks of interrelationships among variables (Grace, 2006). Before the models were built, all variables were rescaled to 0–1 to cope with their large differences in scales. All continuous variables were tested for normality, and non-normal variables were root transformed to approach normal distribution (Birk et al., 2020). In reality, sites that are proximate are likely to share similar characteristic. Within a site, observations closer in time are likely to be more similar than those that are farther apart. Given that all the related data were non-independent in time (i.e., year) and site (i.e., province), piecewise SEM was used and specified using a list of structured equations, which can be built using most common linear modeling approaches in R. Each response was fitted to a generalized linear mixed model (GLMM) with Gaussian distribution. For each component model, year and province indicated the random effects to account for temporal autocorrelation and spatial autocorrelation (Birk et al., 2020; Liu et al., 2020). SEM was conducted using “piecewise SEM” (Lefcheck, 2016), “nlme,” and “lme4” packages. Fisher’s C test (0 ≤ Fisher’s C/df ≤ 2 and p > 0.05) was employed to confirm the goodness of the modeling results. All statistical analyses were performed in R version 3.6.3 for Windows (R Core Development Team, 2020).
Results
Shift Dynamics of Marine Wild Fish Catch
Shifts detected using the shift detection algorithm were partially supported by the SCHC analysis. According to the total sum of shift counts per province, seven statistically significant assemblage breaks occurred from 1996 to 2013, and the major break was 2003 (Figure 2). Hence, 2003 was selected as the node, and the marine wild fish catches were divided into two period over the past 30 years (Figure 3). In the first period (i.e., from 1989 to 2002), all species or species groups fluctuated and increased, except for the catch of black scraper that was decreased. During the second period (i.e., from 2003 to 2018), the catch of all three forage species or species groups all declined. Other edible economic fish also showed a downward trend, such as ilisha, Japanese scad, hairtail, pomfret, and black scraper. The catch of large yellow croaker, golden threadfin bream, So-iny mullet and mackerel greatly fluctuates. For all fish species or species groups, the catch continued to decline from 2017 to 2018 (Figure 3).
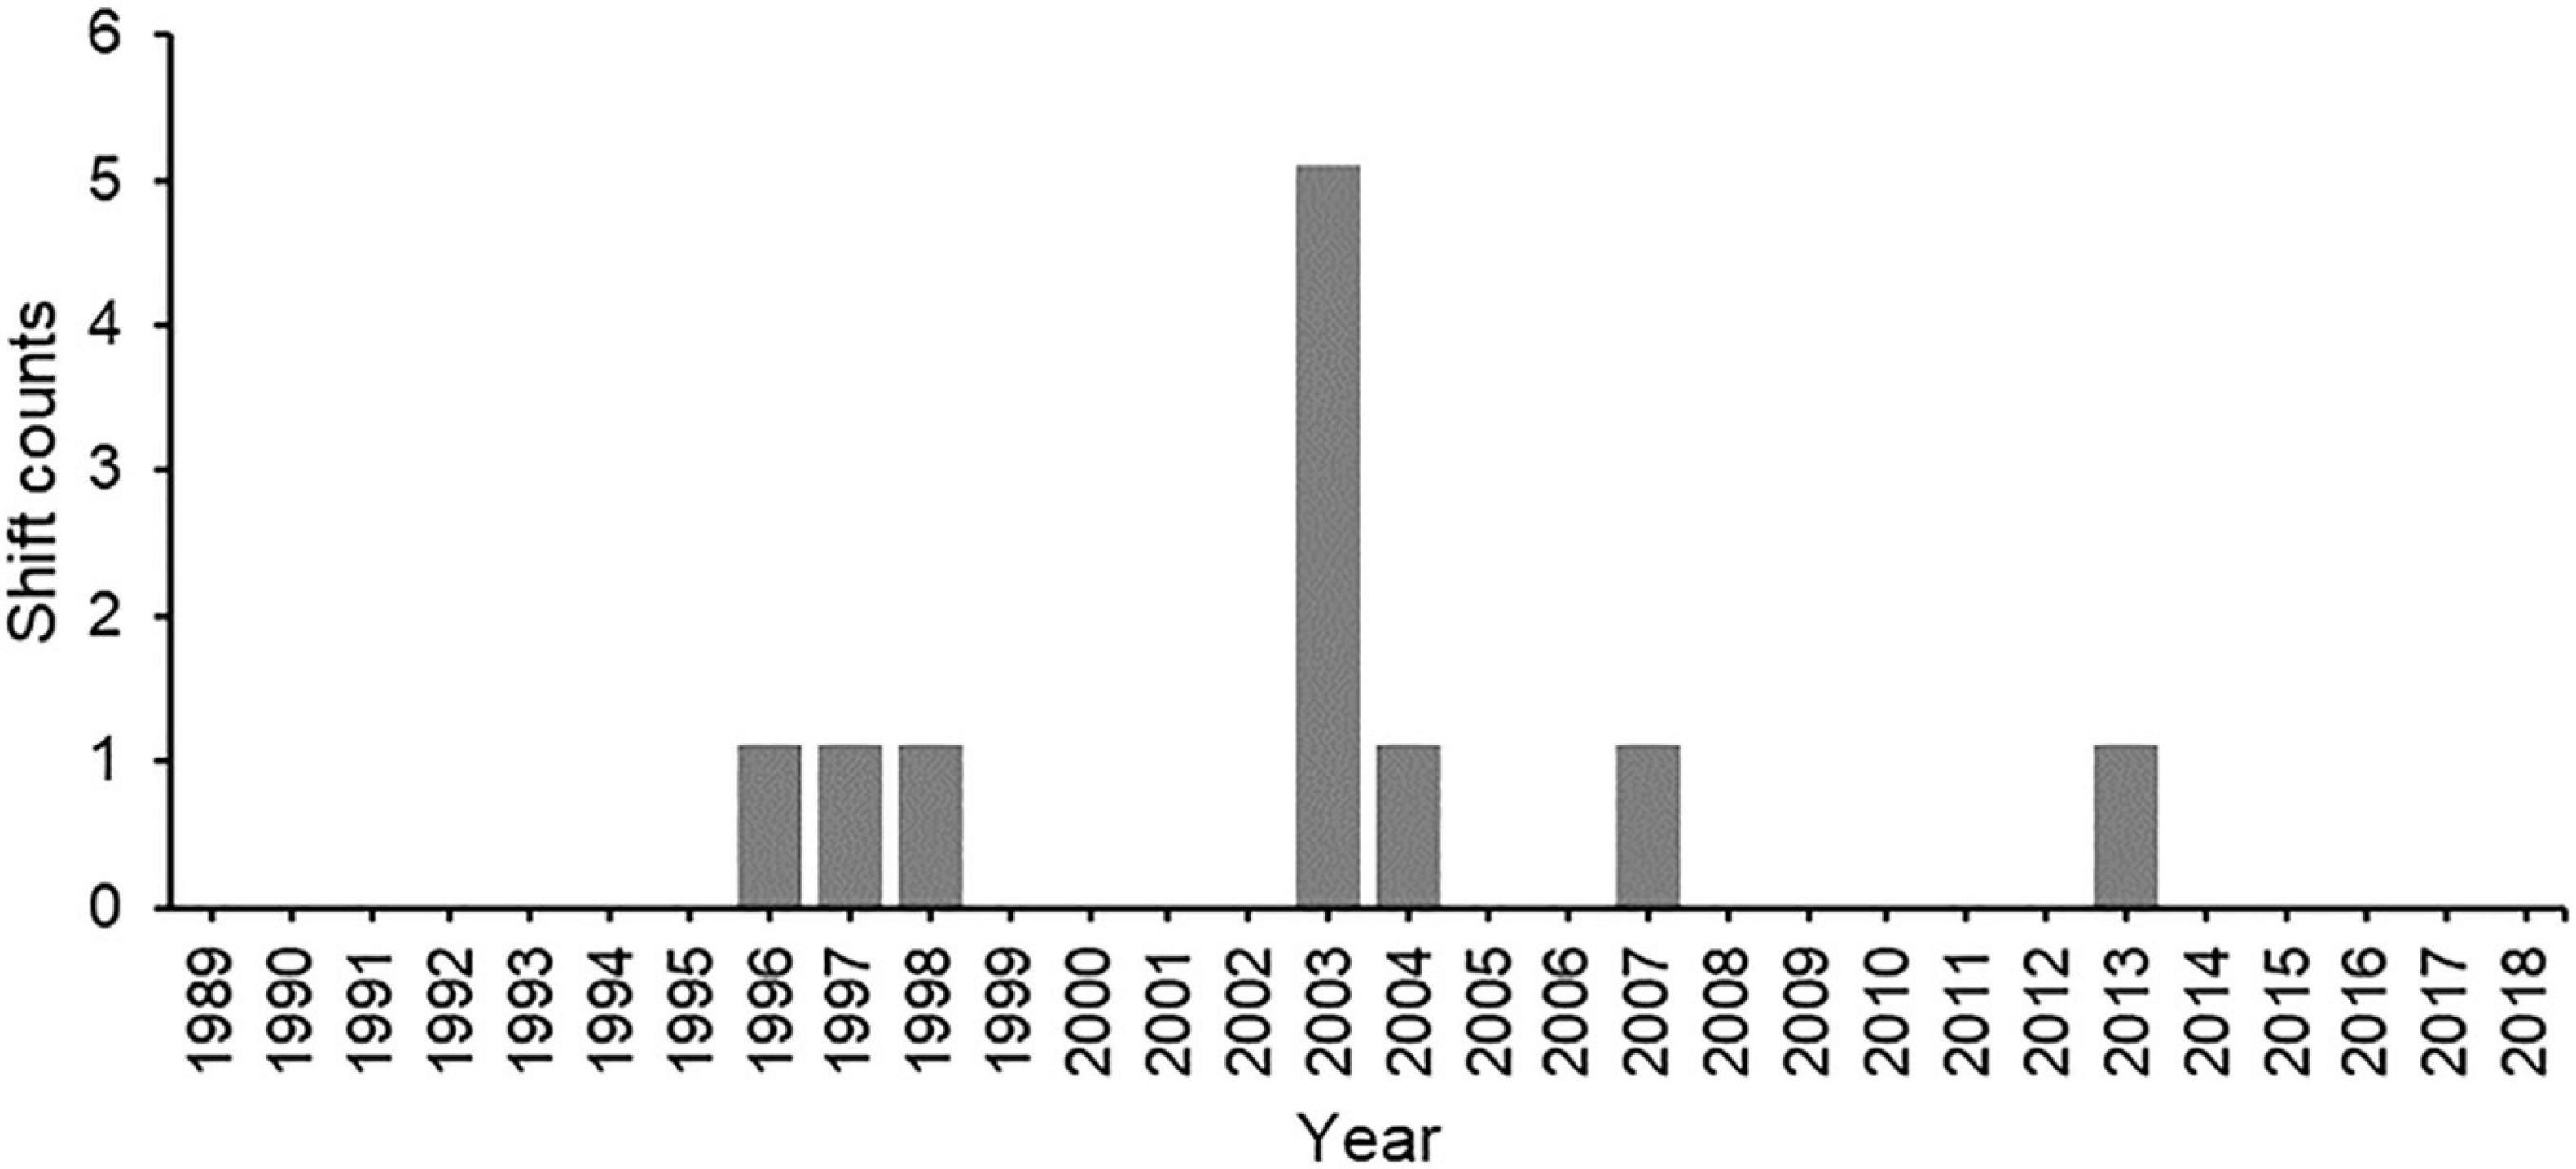
Figure 2. Summary of significant compositional shifts at province-level detected by stratigraphically constrained hierarchical clustering. The histogram shows significant shifts counts for each year from 1989 to 2018.
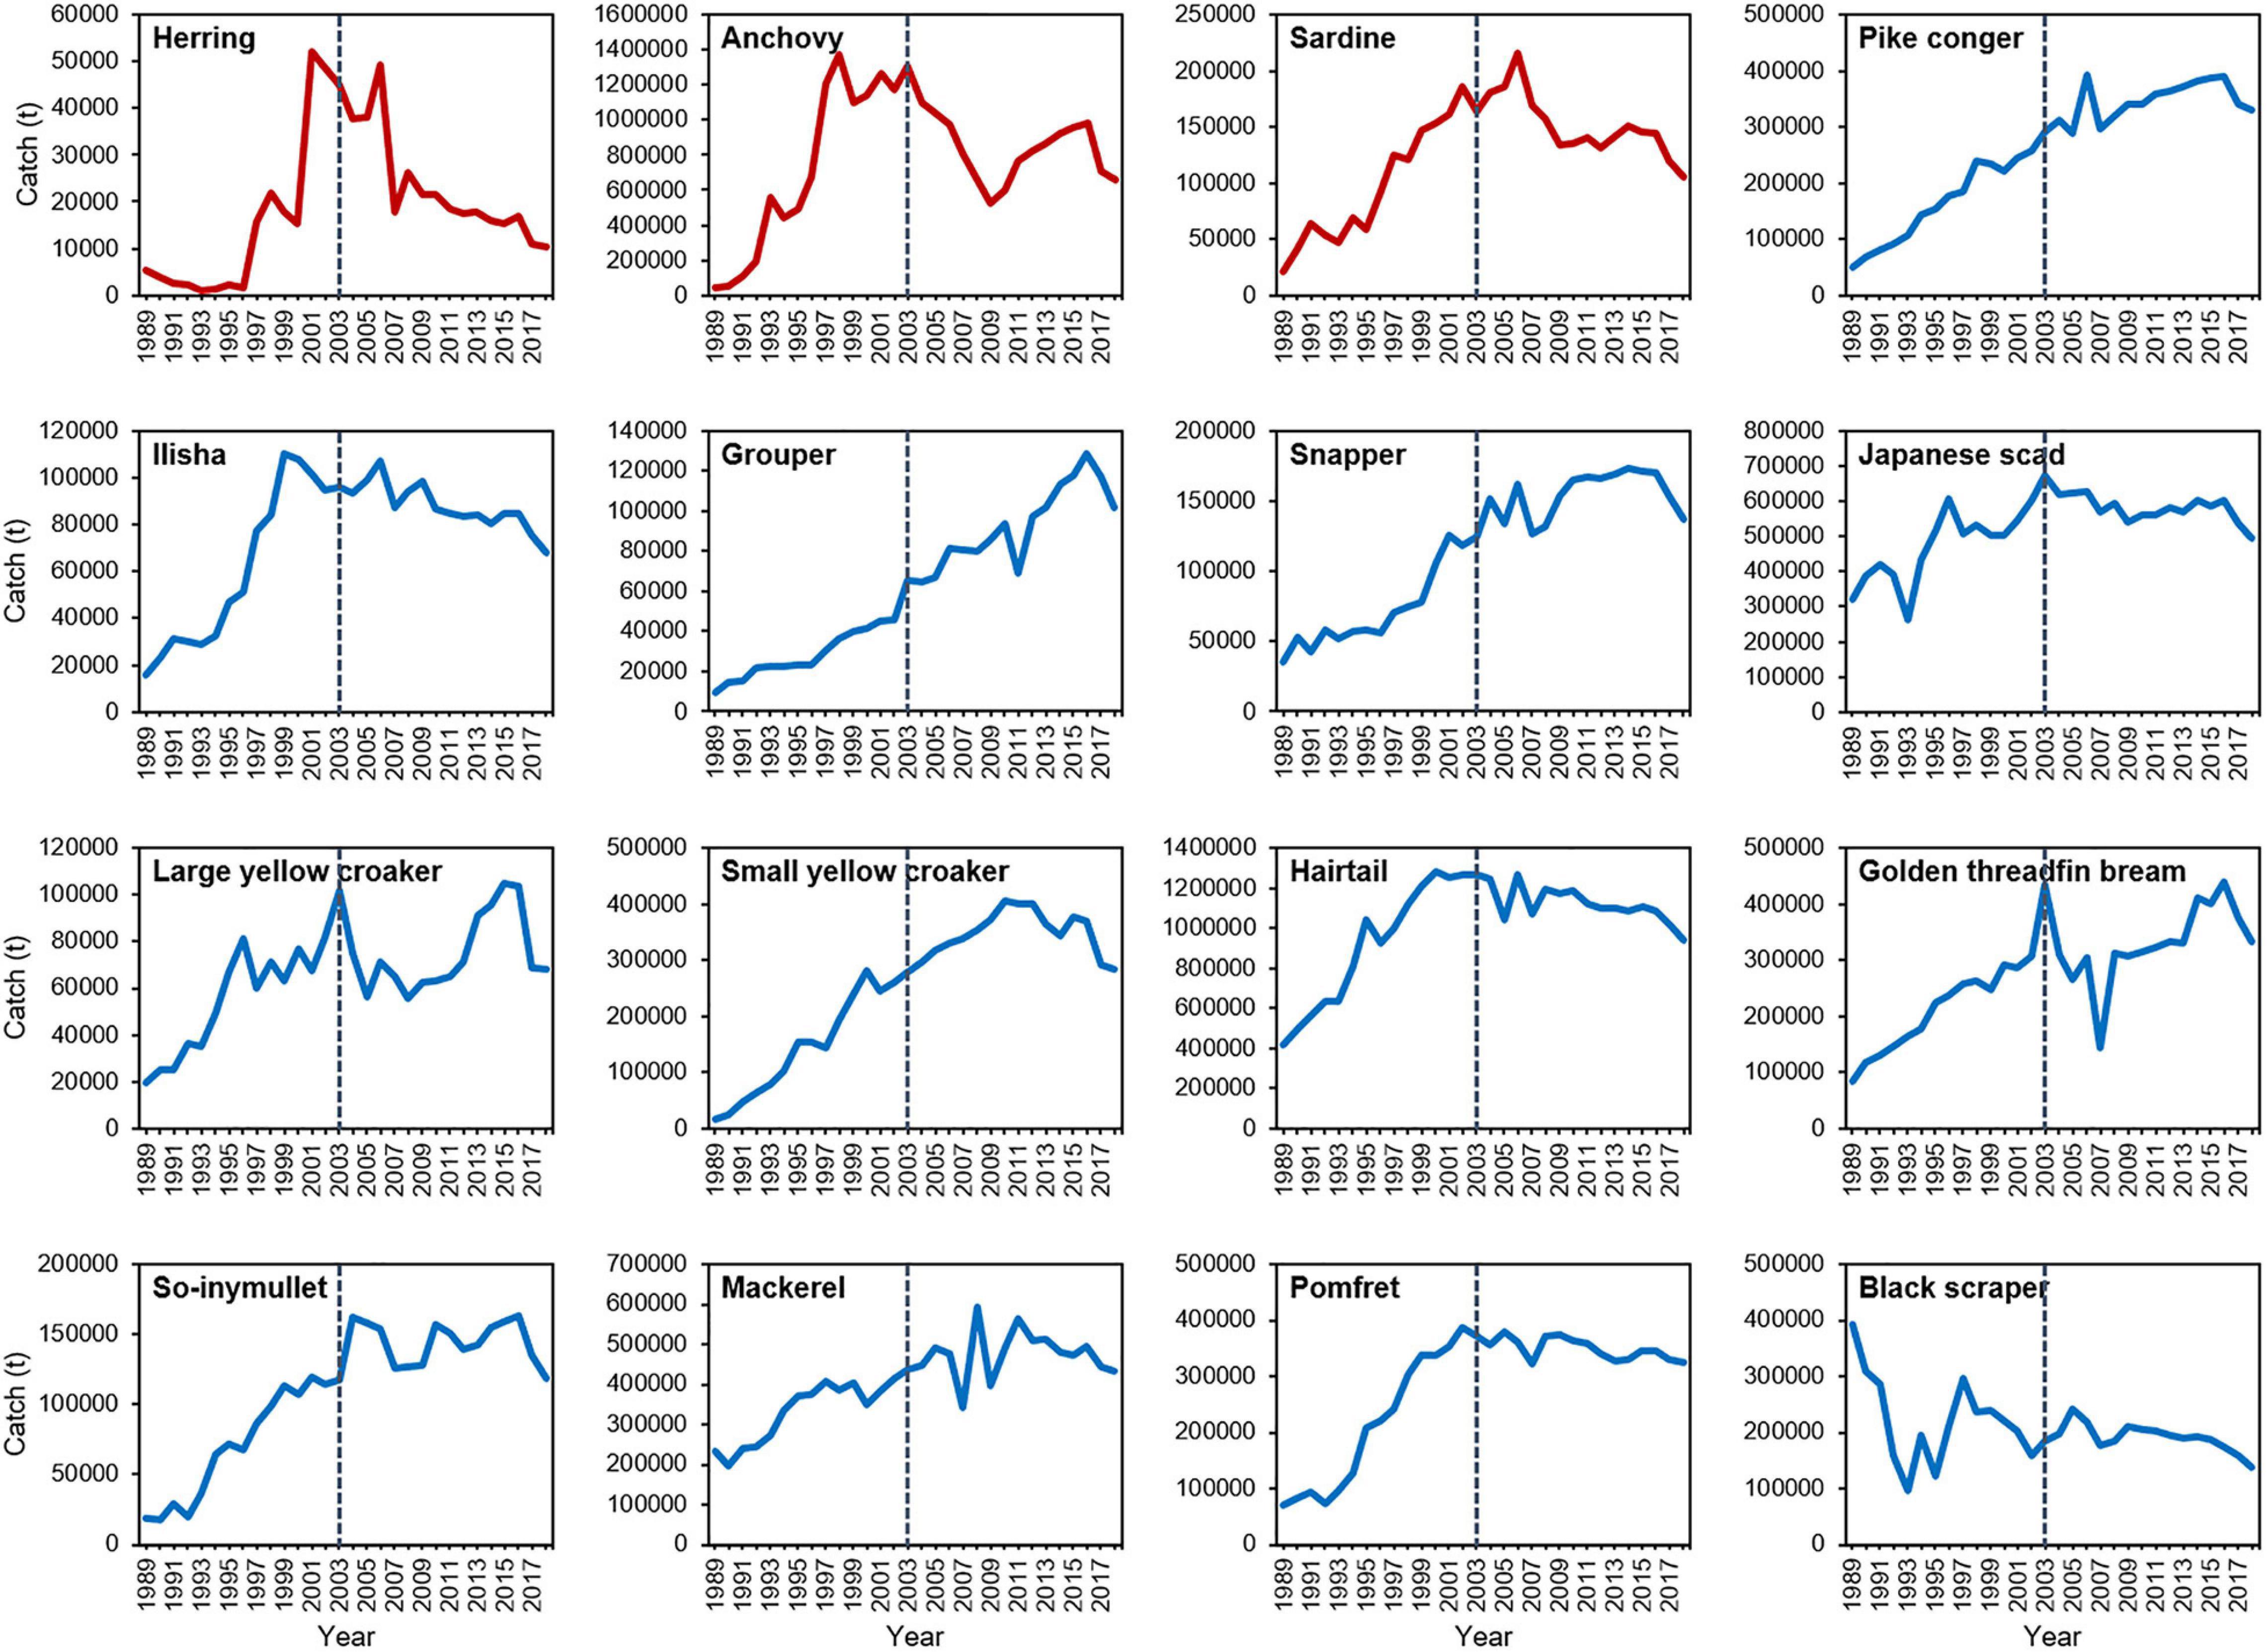
Figure 3. Trends in catch of 16 species or species groups over the past 30 years in China. The trend line is red for forage fish and blue line for edible economic fish. The dotted black line is the dividing line between the two periods, located at 2003.
Impact of Aquaculture Development on Marine Wild Fisheries
From 1989 to 2002, the relationship between all variables was significantly positive, except for FGP to EFP, FAP to EFP, and EFP to FFP (Figures 4A,C). In the second period, the development of fishery economy negatively affected the EFP and still positively affected the output of aquaculture (Figures 4B,D). Different from that in the first period, the MAP in the second period was not significantly correlated with the EFP and FFP. Furthermore, the FAP positively affected the EFP, but the effect on the FFP was changed to negative. The EFP had a positive influence on the FFP from 2003 to 2018 and had been strengthened over the past three decades. A significant positive relationship was found between the MAP and FAP, except for the effect of FAP on the MAP from 2003 to 2018 (Figures 4A–D).
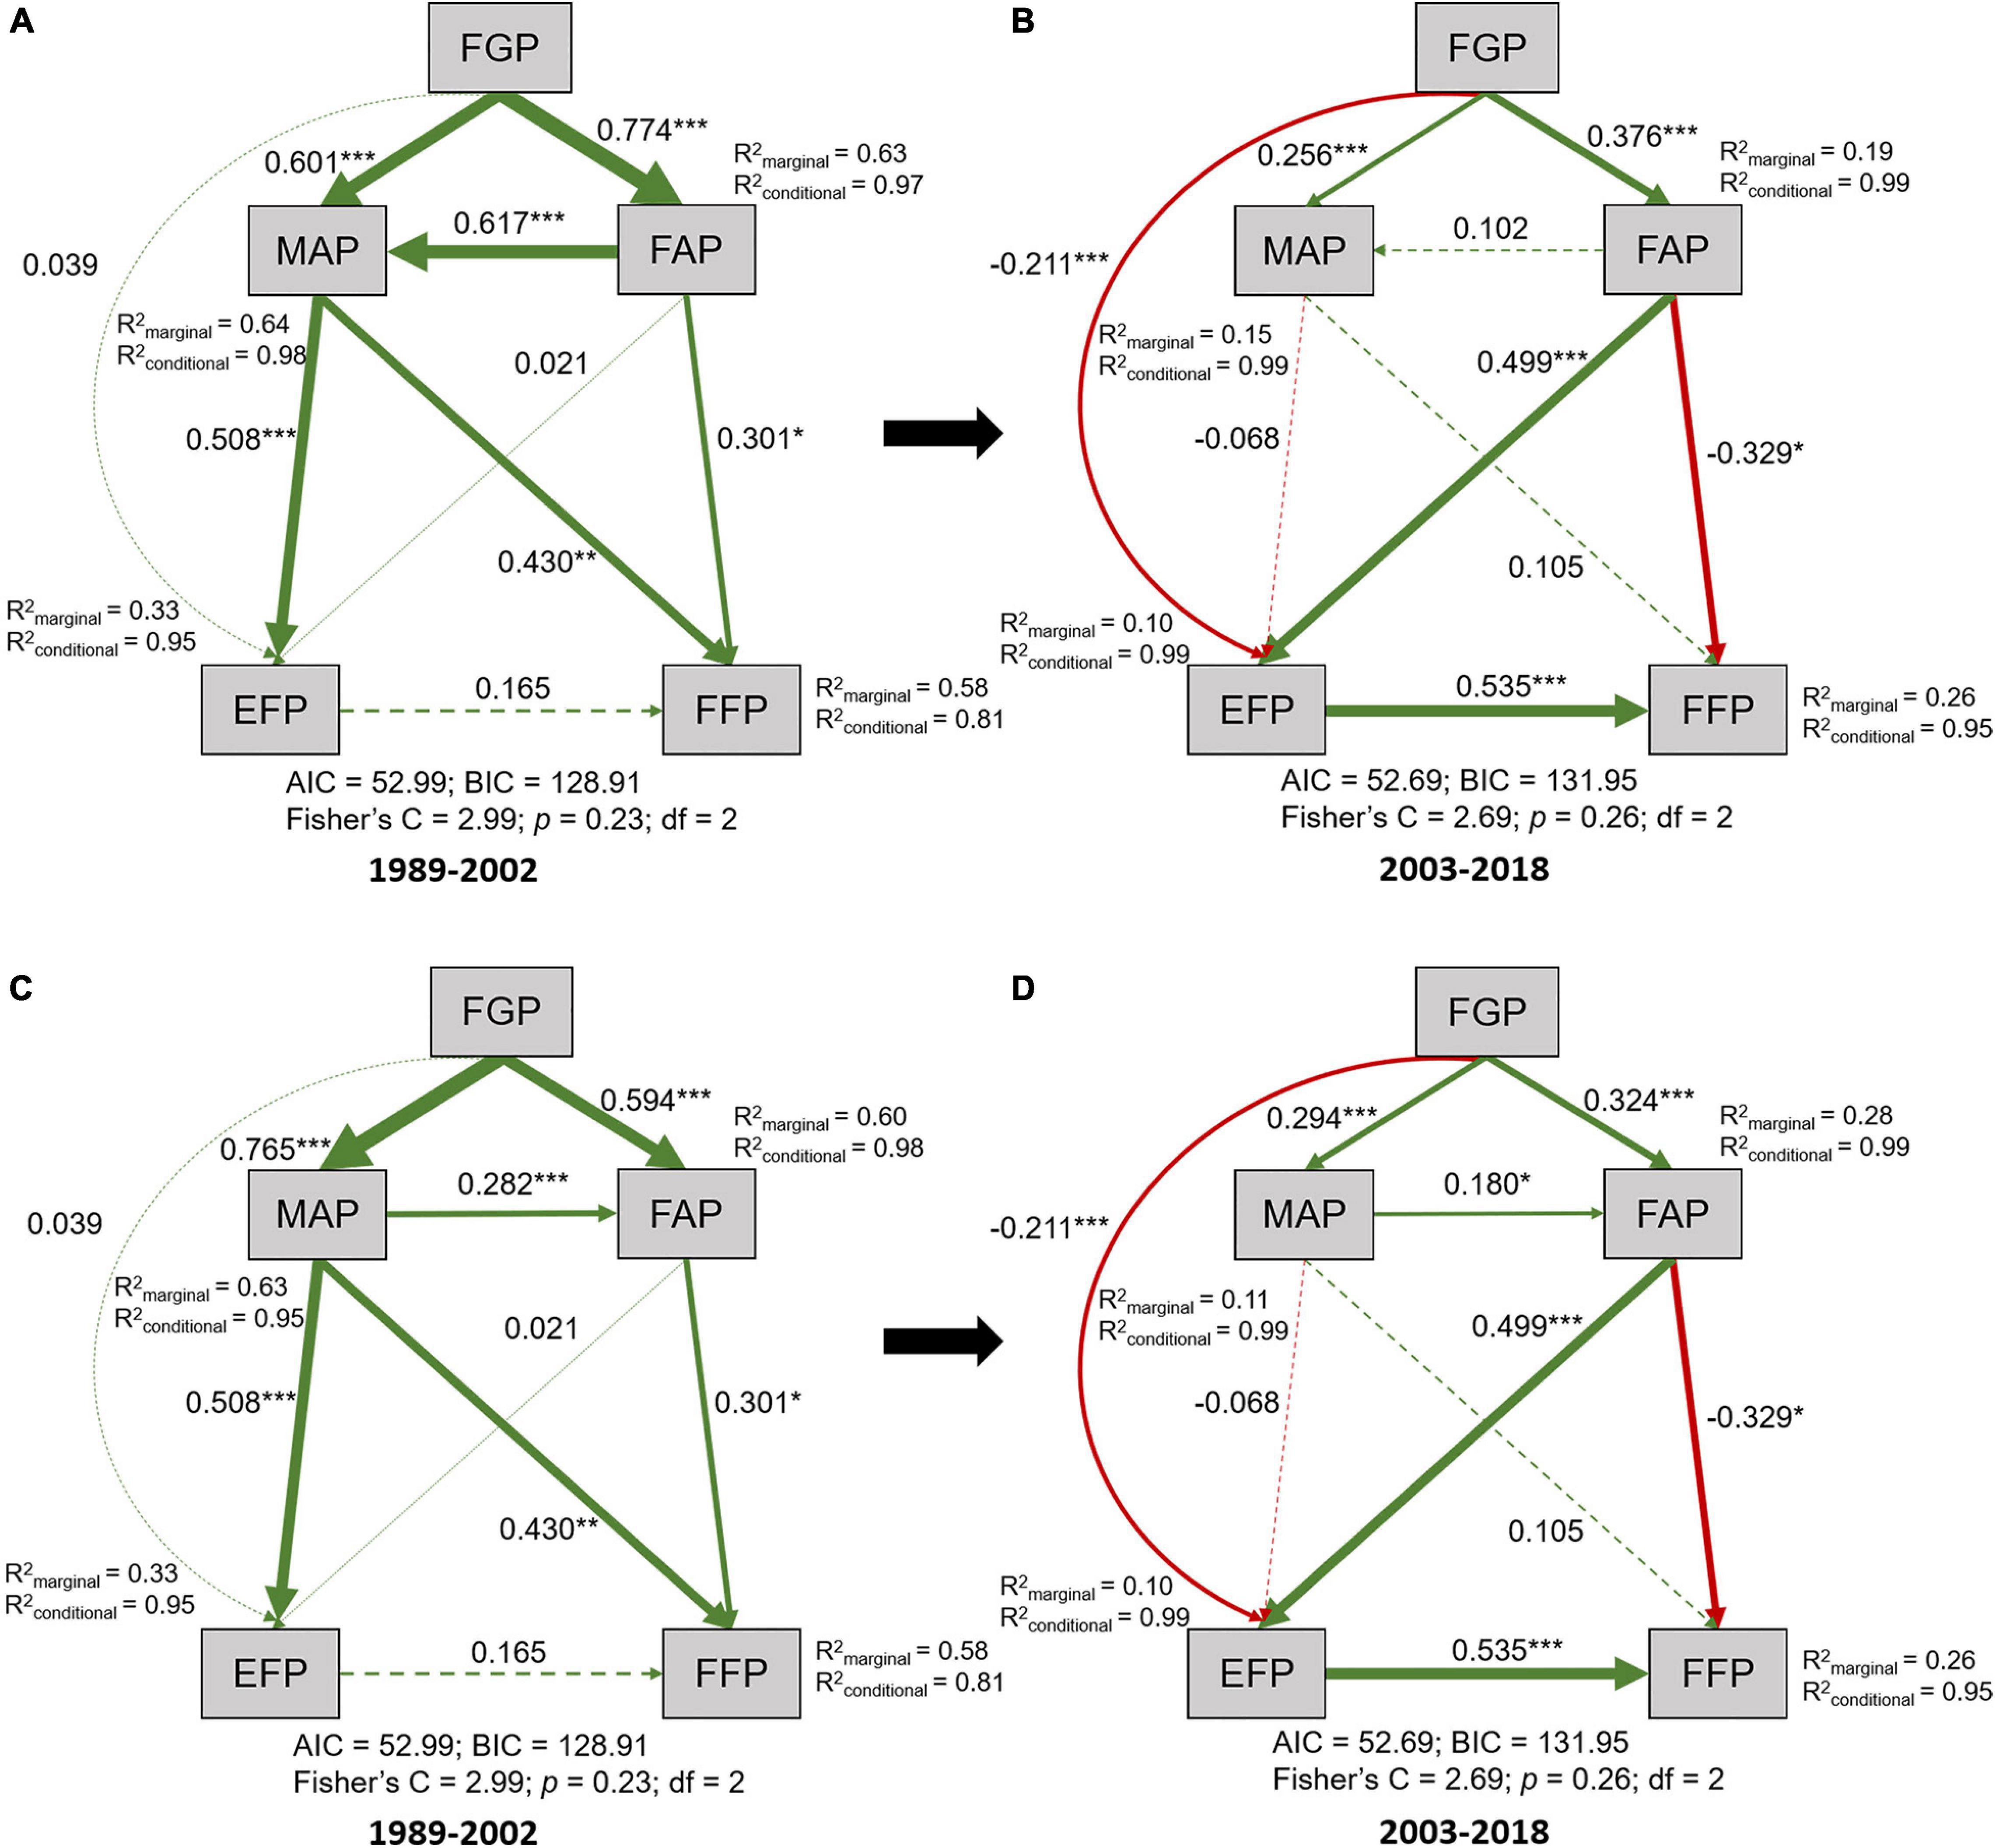
Figure 4. Piecewise structural equation modeling (SEM) describing the effects of aquaculture development on marine wild fisheries in two periods. The first period was from 1989 to 2002 (A,C) and the second period was from 2003 to 2018 (B,D). Path thicknesses have been scaled based on the magnitude of the standardized regression coefficient, which adjacent to arrows are indicative of the effect size of the relationship. Positive and negative effects among variables are depicted by green and red arrows, respectively, the dashed arrow indicate a not significant (p > 0.05) effect. Conditional R2 denote the proportion of variance explained by the included predictors without accounting for random effects. Marginal R2 denotes the proportion of variance explained by the included predictors by accounting for random effects. Significance levels of each predictor are *p < 0.05; **p < 0.01; ***p < 0.001. FGP, fishery gross product; MAP, mariculture production; FAP, freshwater aquaculture production; EFP, edible economic fish production; FFP, forage fish production.
China’s Aquafeeds and Aquaculture Production and Fishmeal Usage From 1989 to 2018
From 1989 to 2005, the volume of imported fishmeal showed a fluctuating upward trend, but tended to be stable from 2006 to 2018. The trend of domestic fishmeal is similar to that of imported fishmeal, which increased first and then slightly decreased, but the transition year has been advanced to around 2000 (Figure 5A). However, China’s aquafeeds and aquaculture production have continued to grow rapidly from 1989 to 2018 (Figures 5A,B).
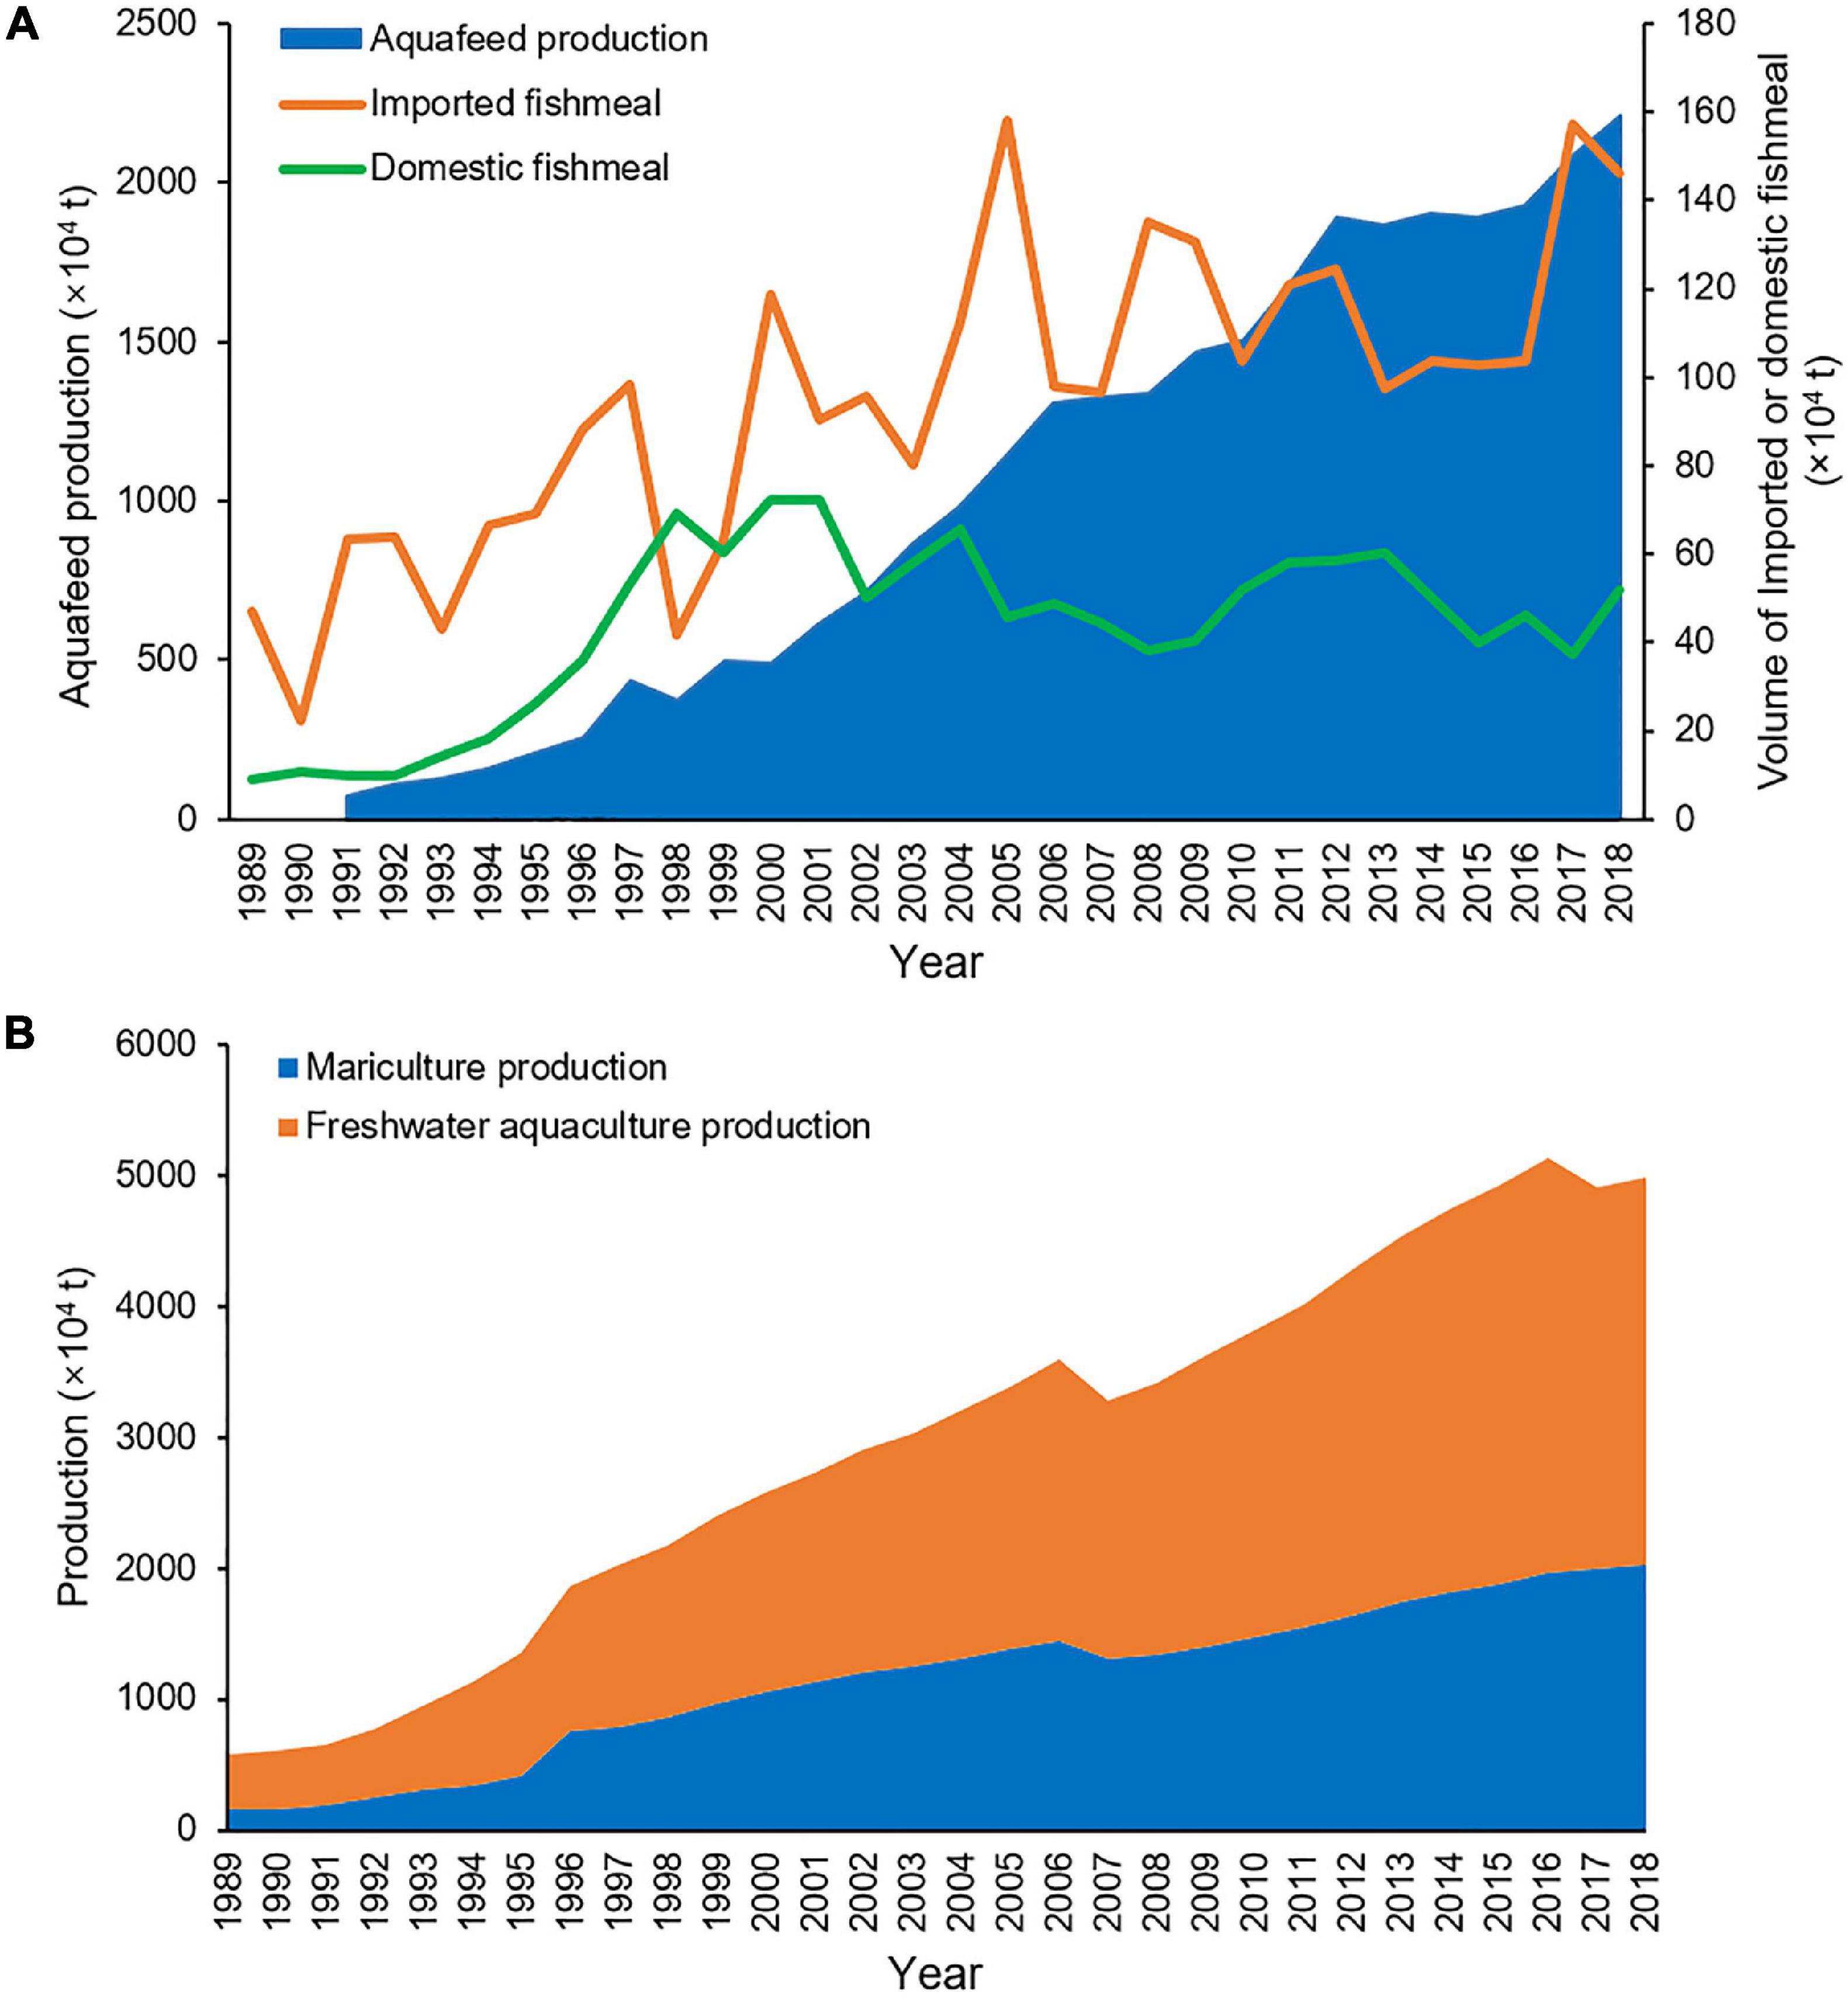
Figure 5. The production of aquafeeds, aquaculture and fishmeal usage over the past 30 years in China. Based on data from China Feed Industry Yearbook (1991–2019), Fishery Statistics Yearbook (1990–2019a) and FAO (2021). Trends in production of aquafeeds, and volume of imported and domestic fishmeal (A); Trends in production of mariculture and freshwater aquaculture (B).
Discussion
Farming has become the predominant form of food fish supply, which is similar to all other staples (De Silva, 2012). China, currently the major producer of farmed food fish, has produced this product more than the rest of the world combined every year since 1991 and contributed the most to the growth in the world’s per capita availability of food fish (FAO, 2018). The ensuing debate is whether China’s aquaculture is relieving the pressure on marine wild fisheries resources or is continuously inducing damages. This study aims to evaluate the impact of China’s aquaculture development on marine wild fisheries resources and provides reference for the sustainable development of marine capture fisheries and aquaculture industries.
In the first study period, the development of the fishery economy has promoted the increase in aquaculture production, which further enhanced the increase in the FFP (Figures 4A,C). Fish farming is influenced by various human demands, socioeconomic development, and policies (Cao et al., 2015; Zhao et al., 2018). Zhao et al. (2018) reported that the rapid economic growth in China and the increasing food demand have promoted aquaculture development. In 1986, the Fishery Law of the People’s Republic of China formally established the principle of “giving priority to aquaculture with simultaneous efforts in aquaculture, fishing and processing, taking measures in accordance with local conditions, with respective priorities,” thereby marking the official determination of China’s “giving priority to aquaculture” policy in fishery (Standing Committee of the National People’s Congress, 1986). This policy promoted the rapid growth of China’s aquaculture industry (Li et al., 2011). In 1988, China became the only country in the world where aquaculture production exceeds the marine wild catch and thus has replaced capture fisheries as the major fishery activity.
In the meantime, the consequent high demand for high-quality feed stimulates the development of fishmeal manufacturing and feed industry (Funge-Smith et al., 2005; Li et al., 2011). The product processing, logistics, and market expansion in aquaculture have also been accelerated (Li et al., 2011). Therefore, freshwater aquaculture and mariculture have mutual promotion effects (Figures 4A,C,D). The development of the feed industry further induced the private sector to engage in the farming of high-valued species (e.g., shrimp, large yellow croaker, and perch) in the late 1980s and early 1990s. Domestic fishmeal production was increased fourfold from 100,000 tons in 1992 to 400,000 tons in 2002, with production peaking in 1999 at 755,000 tons (Funge-Smith et al., 2005). A mass of low-valued fish/trash fish was captured and used for direct feeding and fishmeal processing, and the marine finfish culture had the highest usage of low-valued fish/trash fish (Funge-Smith et al., 2005; De Silva and Turchini, 2009). Fishing practices in China are largely indiscriminate (Szuwalski et al., 2017), and many forage fish fishing fleets also catch plenty of edible economic species. Therefore, the MAP can also have a substantial positive effect on the EFP (Figures 4A,C).
In the second period, the relationship among fishery economy, aquaculture production, and the catch of marine wild fish was changed. No substantial correlation with the MAP was found for the EFP and FFP (Figures 4B,D), which does not indicate that the mariculture did not depend on any marine wild fisheries resources because many of the trash fish and “nei” species used for direct feeding and fishmeal processing were not considered here (Cao et al., 2015). Trash fish are generally a mix of species of varying sizes and minimum commercial value and therefore often not suitable for human consumption. Funge-Smith et al. (2005) and De Silva and Turchini (2009) estimated China’s high-valued mariculture uses to approximately 3 million tons of trash fish each year for direct feeding. But the weakening of the relationship between mariculture and marine wild fish catches is a clear sign that mariculture is becoming less dependent on forage fisheries, which has been proved by many facts. China’s mariculture is mainly composed of mollusk and algae that require no external feed inputs. The main fishmeal fed species in mariculture are crustaceans, sea bass, flatfish, large yellow croaker, grouper, and other marine fish, which only account for approximately 5.5% of the total aquaculture production (Tang et al., 2016; Han et al., 2018). In recent decades, the trophic level of crustaceans has decreased from 3.5 in 1985 to 2.89 in 2014 due to the increase in the proportion of compound aquafeeds and the decrease in trash fish feeding. The trophic level of fish also decreased from 4.5 in 1985 to 3.77 in 2014, and that of other species also decreased from 3.00 in 1985 to 2.31 in 2014 (Tang et al., 2016). Increased knowledge on the digestive processes and nutritional requirements of farmed species and on the processing of raw material combined with the use of alternative proteins has led to impressive reductions in fishmeal inclusions in aquafeeds and rise in feed conversion ratios in cultured species in China (Zhou et al., 2015; Han et al., 2018). Moreover, the cultured species that previously only feed on low-valued fish/trash fish, for example, large yellow croaker, can also feed on compound aquafeeds, and the proportion of aquafeeds is continuously increasing (Li et al., 2013, 2021; Zhang et al., 2016). These findings explain that aquaculture production in China continues to grow, whereas the usage of imported and domestic fishmeal has remained relatively stable (Figures 5A,B; Han et al., 2018).
Owing to the use of compound aquafeeds, the trophic level of freshwater aquaculture also decreased (Tang et al., 2016). In 2014, 35.2% of China’s FAP was obtained from non-fed species (fish, mollusk, and algae). More than 82% of finfish in freshwater aquaculture are filter feeding, herbivorous, and omnivorous and thus do not depend on fishmeal to any significant extent (Han et al., 2018). However, Chiu et al. (2013) believed that these fish are cultured in large volumes, and even low inclusion rates add up to a substantial portion of fishmeal demand. The results indicate that FAP had a significant negative effect on the FFP and a significant positive effect on the EFP (Figures 4B,D), thus suggesting that the demand for marine fisheries resources has not been reduced so far due to the large volume of freshwater aquaculture (Figure 5B). With aquaculture development, the feed value of forage fish (e.g., anchovy) has been recognized since the 1990s. From the 1990s to the beginning of 2000s, in order to supply a large part of the fish used for livestock/fish feed, and the FFP has increased dramatically (Figure 3; Yu et al., 2020). However, since the early 2000s, forage fish stocks have declined remarkably due to long-term overfishing (Zheng et al., 2014; Zhang et al., 2020), and the production has been seriously reduced as a result (Figure 3). Similarly, the negative effect of FGP on EFP suggests that the economic upsurge in China has increased the living standards and consumption of high-valued seafood species (De Silva and Turchini, 2009) and caused most edible economic fish species or species groups resources to be unstable and thus decline in this period. Besides, the positive effect of the EFP on FFP changed from non-significant to significant, implying that the forage fish bycatch increased substantially. This finding was consistent with the changes in the domestic marine catch composition from a predominance of relatively large-sized, high-valued, high trophic level, demersal species to multiple small, low-valued, short-lived, and low trophic level (Liu and De Mitcheson, 2008; Shen and Heino, 2014; Cao et al., 2017; Zhang et al., 2020).
However, China is a world leader in low trophic level aquaculture production, and its aquafeeds and aquaculture production have continued to grow without the need to increase the imported and domestic fishmeal usage from around 2000 to 2018 (Figures 5A,B; Shepherd and Jackson, 2013; Han et al., 2018). Since 2000, only 50–60% of the fishmeal consumed annually in China was used for aquaculture, and 35–38% for pig and poultry. Moreover, aquatic products processing wastes have accounted for 25–35% of the raw materials in the fishmeal and fish oil manufacturing, and freshwater fishmeal showed an increasing trend with freshwater fish production (Yu et al., 2020). Cao et al. (2015) estimated that fish processing wastes could meet almost half, and potentially two-thirds, of China’s current demand for fishmeal in aquafeeds. Given that Asian fishmeal manufacturing increasingly tends to use byproducts from the fish food industry, the dependence on low-valued fish/trash fish for fishmeal production could be further decreased (De Silva and Turchini, 2009). Furthermore, our results also demonstrate a shift in dependence on marine wild fisheries from mariculture to freshwater aquaculture over the past 30 years (Figure 4). Although our results indicated that there is still a great demand for marine fisheries resources due to the large quantity of freshwater aquaculture (Figures 4B,D, 5B), but low trophic level fish are the main species in freshwater aquaculture, with trophic level from 2.0 (around 65%) to 3.5 (around 35%) accounting for around 100%. In China, aquaculture production is dominated by plants, non-fed mollusks and fish, herbivores and omnivores, which have a very low Fish In, Fish Out ratio and showed an overall downward trend, particularly for freshwater aquaculture (Tacon and Metian, 2008; Byelashov and Griffin, 2014; Tang et al., 2016; Han et al., 2018; FAO, 2021). Consequently, China’s aquaculture is transforming to a sustainable development pattern with low input and high output.
From the early 2000s to the present, fishery development policies have undergone great changes in fishing and aquaculture industries. The fishery-related policies aim to control the fishing capacity and resource utilization intensity, and the aquaculture policies have shifted from focusing on quantity growth to quality improvement. China has seriously considered a ban on the direct use of low-valued fish in aquaculture and has promulgated “Outline of China Aquatic Organism Resources Conservation Action” in 2006 and “Several Opinions on Promoting the Sustainable and Healthy Development of Marine Fishery” in 2013 (Han et al., 2018). The 13th Five-Year Plan (FYP) echoes the call for “prioritizing ecosystem and promoting green development,” which breaks from the earlier balancing act of “paying equal attention to the development of production and ecological conservation” stated in the 12FYP. A series of initiatives has been taken since 2016 to improve the mechanisms and methods for marine fishery management. The 13FYP introduced concrete objectives: by 2020, China will decommission 20,000 motorized marine fishing vessels accounting for at least 1.5 million kilowatts of main engine power (double-control target) and reduce the total domestic fishing production to <10 million tons (from ∼13 million tons in 2015) (Ministry of Agriculture, 2016). After 13FYP proposed the updated double-control targets and the first total yield limit, the Ministry of Agriculture issued the Notice on Further Strengthening the Management of Domestic Fishing Vessels and Implementing the System for Managing Total Marine Fisheries Resources in February 2017, which outlined China’s central agenda for fisheries reforms. To meet these targets, the Chinese government has invested extensive efforts into reviewing and reforming its legislation, institutional arrangements, and governance of marine capture fisheries (Su et al., 2020). These measures have resulted in a sustained and substantial decline in total domestic fishing production from 2017 to 2018 (Figure 3). Obviously, China’s national development philosophy has gradually shifted from emphasizing economic growth to highlighting ecological protection, and the fisheries resource conservation has become a top priority of marine fishery management in China.
Conclusion
This study provides the first large-scale statistic evidence on the links between China’s aquaculture and marine wild fish catches changes over the past 30 years. Although aquaculture still puts pressure on marine wild fisheries resources, this practice provides food for China and the world and reduces the huge demand for marine capture fisheries. Results revealed that China’s aquaculture is transforming to a sustainable development pattern with low input and high output, and this shift has started to exhibit positive effects. Such evidence is important for evaluating the impact of China’s aquaculture on marine wild fisheries resources and contributes to the sustainable management of China’s aquaculture and marine capture fisheries.
Data Availability Statement
The original contributions presented in the study are included in the article/Supplementary Material, further inquiries can be directed to the corresponding author/s.
Author Contributions
JX and KSZ conceived the study. JX, MZ, KW, KHZ, CJX, JYX, and KSZ collected the data and analyzed the data. KSZ, KW, KHZ, CJX, JYX and MZ drafted the manuscript. All authors contributed to the article and approved the submitted version.
Funding
This research was supported by the National Key R&D Program of China (Grant No. 2018YFD0900904) and the Water Pollution Control and Management Project of China (Grant No. 2018ZX07208005). JX acknowledges the support received from the International Cooperation Project of the Chinese Academy of Sciences (Grant No. 152342KYSB20190025) and the National Natural Science Foundations of China (Grant No. 31872687).
Conflict of Interest
The authors declare that the research was conducted in the absence of any commercial or financial relationships that could be construed as a potential conflict of interest.
Publisher’s Note
All claims expressed in this article are solely those of the authors and do not necessarily represent those of their affiliated organizations, or those of the publisher, the editors and the reviewers. Any product that may be evaluated in this article, or claim that may be made by its manufacturer, is not guaranteed or endorsed by the publisher.
Acknowledgments
We are thankful to Xiulin Wang for data collection. Special thanks to Yuhan He for improving earlier versions of this manuscript.
Supplementary Material
The Supplementary Material for this article can be found online at: https://www.frontiersin.org/articles/10.3389/fmars.2021.710124/full#supplementary-material
References
Biao, X., and Kaijin, Y. (2007). Shrimp farming in China: operating characteristics, environmental impact and perspectives. Ocean Coas. Manag. 50, 538–550. doi: 10.1016/j.ocecoaman.2007.02.006
Birk, S., Chapman, D., Carvalho, L., Spears, B. M., Andersen, H. E., Argillier, C., et al. (2020). Impacts of multiple stressors on freshwater biota across spatial scales and ecosystems. Nat. Ecol. Evol. 4, 1060–1068.
Byelashov, O. A., and Griffin, M. E. (2014). Fish in, fish out: perception of sustainability and contribution to public health. Fisheries 39, 531–535. doi: 10.1080/03632415.2014.967765
Cao, L., Chen, Y., Dong, S., Hanson, A., Huang, B., Leadbitter, D., et al. (2017). Opportunity for marine fisheries reform in China. Proc. Natl. Acad. Sci. U.S.A. 114, 435–442.
Cao, L., Naylor, R., Henriksson, P., Leadbitter, D., Metian, M., Troell, M., et al. (2015). China’s aquaculture and the world’s wild fisheries. Science 347, 133–135.
China Feed Industry Association (1991-2019). Chinese Feed Industry Yearbook. Beijing: China Commercial Publishing House.
Chiu, A., Li, L., Guo, S., Bai, J., Fedor, C., and Naylor, R. L. (2013). Feed and fishmeal use in the production of carp and tilapia in China. Aquaculture 414, 127–134.
Costello, C. (2017). Fish harder; catch more? Proc. Natl. Acad. Sci. U. S.A. 114, 1442–1444. doi: 10.1073/pnas.1620731114
Costello, C., Ovando, D., Clavelle, T., Strauss, C. K., Hilborn, R., Melnychuk, M. C., et al. (2016). Global fishery prospects under contrasting management regimes. Proc. Natl. Acad. Sci. U.S.A. 113, 5125–5129. doi: 10.1073/pnas.1520420113
De Silva, S. S. (2012). Aquaculture: a newly emergent food production sector—and perspectives of its impacts on biodiversity and conservation. Biodivers. Conserv. 21, 3187–3220. doi: 10.1007/s10531-012-0360-9
De Silva, S. S., and Turchini, G. M. (2009). “Use of wild fish and other aquatic organisms as feed in aquaculture–a review of practices and implications in the Asia-Pacific,” in Fish as Feed Inputs for Aquaculture: Practices, Sustainability and Implications, eds M. R. Hasan and M. Halwart (Rome: FAO), 63–127. FAO Fisheries and Aquaculture Technical Paper. No. 518.
FAO (2021). Fisheries and Aquaculture Software: FishStatJ-Software for Fishery Statistical Time Series. Rome: FAO Fisheries and Aquaculture Department Rome.
Funge-Smith, S., Lindebo, E., and Staples, D. (2005). Asian Fisheries Today: The Production and use of Low Value/Trash fish from Marine Fisheries in the Asia-Pacific Region. Rome: Food and Agriculture Organization of the United Nations.
Grace, J. B. (2006). Structural Equation Modeling and Natural Systems. Cambridge: Cambridge University Press.
Grace, J. B., Schoolmaster, D. R. Jr., Guntenspergen, G. R., Little, A. M., Mitchell, B. R., Miller, K. M., et al. (2012). Guidelines for a graph-theoretic implementation of structural equation modeling. Ecosphere 3, 1–44. doi: 10.1002/9781119579038.ch1
Grimm, E. C. (1987). CONISS: a FORTRAN 77 program for stratigraphically constrained cluster analysis by the method of incremental sum of squares. Comput. Geosci. 13, 13–35. doi: 10.1016/0098-3004(87)90022-7
Hambrey, J. (2017). The 2030 Agenda and the Sustainable Development Goals: the Challenge for Aquaculture Development and Management. Rome: FAO. FAO Fisheries and Aquaculture Circular No. 1141.
Han, D., Shan, X. J., Zhang, W. B., Chen, Y. S., Wang, Q. Y., Li, Z. J., et al. (2018). A revisit to fishmeal usage and associated consequences in Chinese aquaculture. Rev. Aquac. 10, 493–507. doi: 10.1111/raq.12183
Herbeck, L. S., Unger, D., Wu, Y., and Jennerjahn, T. C. (2013). Effluent, nutrient and organic matter export from shrimp and fish ponds causing eutrophication in coastal and back-reef waters of NE Hainan, tropical China. Cont. Shelf Res. 57, 92–104. doi: 10.1016/j.csr.2012.05.006
Juggins, S. (2014). rioja: Analysis of Quaternary Science Data. Available online at: http://cran.r-project.org/package=rioja
Lefcheck, J. S. (2016). piecewiseSEM: Piecewise structural equation modelling in r for ecology, evolution, and systematics. Methods Ecol. Evol. 7, 573–579. doi: 10.1111/2041-210x.12512
Li, J., Xu, W., Lai, W., Kong, A., Zhang, Z., Pang, Y., et al. (2021). Effect of dietary methionine on growth performance, lipid metabolism and antioxidant capacity of large yellow croaker (Larimichthys crocea) fed with high lipid diets. Aquaculture 536:736388. doi: 10.1016/j.aquaculture.2021.736388
Li, W., Ai, Q., Mai, K., Xu, W., Luo, Y., and Zhang, Y. (2013). Effects of dietary amino acid patterns on growth and protein metabolism of large yellow croaker (Larimichthys crocea) larvae. Aquaculture 406, 1–8. doi: 10.1016/j.aquaculture.2013.04.029
Li, X., Li, J., Wang, Y., Fu, L., Fu, Y., Li, B., et al. (2011). Aquaculture industry in China: current state, challenges, and outlook. Rev. Fish. Sci. 19, 187–200. doi: 10.1080/10641262.2011.573597
Liu, M., and De Mitcheson, Y. S. (2008). Profile of a fishery collapse: why mariculture failed to save the large yellow croaker. Fish Fish. 9, 219–242. doi: 10.1111/j.1467-2979.2008.00278.x
Liu, S., Wang, H., Tian, P., Yao, X., Sun, H., Wang, Q., et al. (2020). Decoupled diversity patterns in bacteria and fungi across continental forest ecosystems. Soil Biol. Biochem. 144, 107763. doi: 10.1016/j.soilbio.2020.107763
Ministry of Agriculture (2016). The 13th Five-Year Plan (2016–2020) for National Fisheries Development of China. Available online at: http://www.moa.gov.cn/nybgb/2017/derq/201712/t20171227_6131208.htm
Ministry of Agriculture and Rural Affairs of the People’s Republic of China (1990-2019). Chinese National Fishery Statistics Yearbook. Beijing: China Agriculture Press.
National Bureau of Statistics of China (1990-2019). China Statistical Yearbook. Beijing: China Statistics Press.
Oksanen, J., Blanchet, F. G., Kindt, R., Legendre, P., Minchin, P. R., O’Hara, R. B., et al. (2013). vegan: Community Ecology Package. R Package Version 2.0-10.
R Core Development Team (2020). R: A Language and Environment for Statistical Computing, 3.6.3 ed. R Foundation for Statistical Computing. Vienna: R Core Development Team.
Shen, G., and Heino, M. (2014). An overview of marine fisheries management in China. Mar. Policy 44, 265–272. doi: 10.1016/j.marpol.2013.09.012
Shepherd, C., and Jackson, A. (2013). Global fishmeal and fish-oil supply: inputs, outputs and marketsa. J. Fish Biol. 83, 1046–1066. doi: 10.1111/jfb.12224
Standing Committee of the National People’s Congress (1986). Fisheries Law of the People’s Republic of China. China: Ministry of Ecology and Environment the People’s Repulic of China.
Su, S., Tang, Y., Chang, B., Zhu, W., and Chen, Y. (2020). Evolution of marine fisheries management in China from 1949 to 2019: How did China get here and where does China go next? Fish Fish. 21, 435–452. doi: 10.1111/faf.12439
Szuwalski, C. S., Burgess, M. G., Costello, C., and Gaines, S. D. (2017). High fishery catches through trophic cascades in China. Proc. Natl. Acad. Sci. U.S.A. 114, 717–721. doi: 10.1073/pnas.1612722114
Tacon, A. G., and Metian, M. (2008). Global overview on the use of fish meal and fish oil in industrially compounded aquafeeds: Trends and future prospects. Aquaculture 285, 146–158. doi: 10.1016/j.aquaculture.2008.08.015
Tang, Q., Han, D., Mao, Y., Zhang, W., and Shan, X. (2016). Species composition, non-fed rate and trophic level of Chinese aquaculture. J. Fish. Sci. China 23, 729–758.
Yu, Q., Keji, J., Xiting, W., and Ma, Z. (2020). Sources and utilization of fish meal and fish oil in China. Fish. Inf. Strategy 35, 91–98.
Zeng, Q., Gu, X., Chen, X., and Mao, Z. (2013). The impact of Chinese mitten crab culture on water quality, sediment and the pelagic and macrobenthic community in the reclamation area of Guchenghu Lake. Fish. Sci. 79, 689–697. doi: 10.1007/s12562-013-0638-1
Zhang, H., Yi, L., Sun, R., Zhou, H., Xu, W., Zhang, W., et al. (2016). Effects of dietary citric acid on growth performance, mineral status and intestinal digestive enzyme activities of large yellow croaker Larimichthys crocea (Richardson, 1846) fed high plant protein diets. Aquaculture 453, 147–153. doi: 10.1016/j.aquaculture.2015.11.032
Zhang, W. B., Liu, M., de Mitcheson, Y. S., Cao, L., Leadbitter, D., Newton, R., et al. (2020). Fishing for feed in China: facts, impacts and implications. Fish Fish. 21, 47–62. doi: 10.1111/faf.12414
Zhao, K., Molinos, J. G., Zhang, H., Jun, M., and Xu, J. (2018). Contemporary changes in structural dynamics and socioeconomic drivers of inland fishery in China. Sci. Total Environ. 648, 1527–1535. doi: 10.1016/j.scitotenv.2018.08.196
Zheng, Y., Li, J., Zhang, Q., and Hong, W. (2014). Research progresses of resource biology of important marine pelagic food fishes in China. J. Fish. China 38, 149–160.
Zhou, F., Wang, Y., Tang, L., Huang, Y., Ding, X., and He, Z. (2015). Effects of dietary soy protein concentrate on growth, digestive enzymes activities and target of rapamycin signaling pathway regulation in juvenile soft-shelled turtle, Pelodiscus sinensis. Agric. Sci. 6:335. doi: 10.4236/as.2015.63034
Keywords: aquaculture, marine wild fisheries, forage fish, fishery management, sustainable development
Citation: Zhao K, Zhang M, Wang K, Zhu K, Xu C, Xie J and Xu J (2021) Aquaculture Impacts on China’s Marine Wild Fisheries Over the Past 30 Years. Front. Mar. Sci. 8:710124. doi: 10.3389/fmars.2021.710124
Received: 15 May 2021; Accepted: 16 June 2021;
Published: 26 July 2021.
Edited by:
Kit Yue Kwan, Beibu Gulf University, ChinaReviewed by:
Yang Gao, Zhejiang Ocean University, ChinaYing Xiong, Marine Fisheries Research Institute of Jiangsu Province, China
Copyright © 2021 Zhao, Zhang, Wang, Zhu, Xu, Xie and Xu. This is an open-access article distributed under the terms of the Creative Commons Attribution License (CC BY). The use, distribution or reproduction in other forums is permitted, provided the original author(s) and the copyright owner(s) are credited and that the original publication in this journal is cited, in accordance with accepted academic practice. No use, distribution or reproduction is permitted which does not comply with these terms.
*Correspondence: Jun Xu, eHVqdW5AaWhiLmFjLmNu; Min Zhang, emhtNzg3NUBtYWlsLmh6YXUuZWR1LmNu