 Han Wang
 Qiwen Zheng
 Shuang Li
- 1School of Public Policy and Management, Guangxi University, Nanning, China
- 2School of Public Policy and Management, University of North Carolina at Chapel Hill, Chapel Hill, NC, United States
- 3School of Economics and Trade, Hubei University of Economics, Wuhan, China
As an important part of ecological externalities, the spatial spillover effect has attracted the attention of researchers in the field of environmental economics. However, the traditional view that the spillover mechanism of ecological externalities generally decreases in line with increases in distance remains to be thoroughly proven. Effective ecological management requires an understanding of the relationship between the natural environment and human communities. In this study, the concept of geographical accessibility and a two-step mobile search model are introduced in order to connect ecosystems and humans by a spatial distance. This model can fully demonstrate the external spatial spillover effect of ecology. Based on research from the Beihai Wetland Reserve, Guangxi, China, this study found that the change in the ecological externality spillover mechanism is not only affected by spatial distance but is also affected by the pro-environmental attributes of individual residents around the region. Under the same conditions, residents with a high degree of interaction with ecological protection zones can display a stronger spatial spillover effect. The conclusion of this study provides a more accurate understanding of the changes in the spillover effect of ecological externalities, which in turn can help managers to formulate more adequate ecological protection policies that are based on the specific conditions of different residents. This is crucial for the successful management of protected ecological areas that are highly linked to human communities.
Introduction
Policymakers often wish to both preserve natural habitats and maintain traditional economic activities (Richaume et al., 2021). This is undoubtedly a challenge, particularly with regard to the protection of ecological areas located close to human settlements. Because of the existence of ecological externalities, one must consider the negative or positive impact of economic activities (such as production and consumption) on third parties (Schmidt et al., 2016; Ciftcioglu, 2017). Being attentive to the ecological spillover effect can effectively internalize external problems and help in the effort to find effective ways to solve complex environmental problems.
The spillover effect is one of the focuses of ecological externality research. In previous studies, researchers have elaborated on the specific manifestations of the spillover effects of ecological externalities in spatial distance, particularly in terms of greenhouse gas emissions (Ansuategi and Escapa, 2002; Bosetti et al., 2008; Su and Ang, 2014; Balado-Naves et al., 2018; Song et al., 2020), pollution, and the destruction of biodiversity (Jaffe et al., 2005; Defeo et al., 2009; Liu et al., 2015; Feng et al., 2020). Previous research has supported the view that spatial distance is indispensable as a carrier that reflects changes in spillover effects. In general, the spatial spillover effects of ecological externalities are reflected in the attenuation of spatial distance. Reflecting real spatial interactions, the distance-decay effect is a form of spatial heterogeneity that has often been evaluated (Rossi et al., 1992). However, some individuals doubt that the distance decay effect may be a universal standard, and as such, the experiment and model design should be conducted in specific situations (Bockstael, 1996; Bulte et al., 2005). On this basis, a large number of studies have begun to discuss influencing factors and the verification of distance-decay effects at different scales of application (Whitehead et al., 1995; Bateman et al., 2005; Klaiber and Phaneuf, 2009). For example, Pate and Loomis (1997) explored the negative correlation between distance variables and the willingness to pay. By distinguishing between users and non-users, another study built on this research to show that non-resource users will show a stronger distance attenuation effect (Croson and Gneezy, 2009). Jørgensen et al. (2013) also delineated that the relationship between the spatial location of respondents, their use of resources, and their willingness to pay were all considered relevant. This clearly shows that focusing solely on ecosystem services or users cannot fully reflect the spillover effect. Only when the ecosystem and users are coupled in space will the spillover effect fully reflect the influence and characteristics of the two (Liu et al., 2016). In traditional measurements of ecological externalities, researchers have focused on a single subject in the ecosystem or surrounding users (Van Hecken and Bastiaensen, 2010; Bithas, 2011; Christie et al., 2012; Hanauer and Reid, 2017). However, as the coupling between humans and nature is strengthened while conflicts continue, ecological externalities should be expressed in a manner that emphasizes the harmonious symbiosis of the two (Kareiva et al., 2007). This means that attention must be given not only to ecological systems but also to the human elements. Even more essential is fully integrating both factors, in order to improve the cognitive system of the spatial spillover effects of ecological externalities. In the current research, measurements of the spillover effects of these factors have clearly reflected the changes in distance (Incera et al., 2017; Li et al., 2018). However, ecosystems and users in the surrounding areas are closely connected, whereas the spillover effects caused by mutual influences are affected by the diverse behavioral intentions of the users.
To concretize spillover effects, researchers should use the concept of accessibility to analyze the characteristics and relationships of both supply and demand in space. Accessibility is a concept that covers the three dimensions of time, space, and society. Geographic information systems (GISs) are used to represent the relationships between facilities and users (Naidoo et al., 2008; Luck et al., 2009; Lautenbach et al., 2011; Lavorel and Grigulis, 2012; Ghermandi et al., 2013). Hansen (1959) first described accessibility as “the interaction of opportunity and potential.” Some studies have emphasized the social significance of accessibility (Dalvi and Martin, 1976; Khan, 1992; Geurs and Van Wee, 2004; Cheng et al., 2012). In brief, accessibility reflects the amount of resistance that users must overcome to reach the locations of established facility resources from their own locations. In fact, not only can accessibility reflect the characteristics and quality of facilities (as well as measure the degree of accessibility between points), accessibility can also reveal the subjective priority of facility selection determined by the will and ability of an individual. Therefore, accessibility controls the direction of decision-making and the distribution of facility resources, so that social resources can be used efficiently and rationally. Measures of accessibility include minimum proximity analysis, a network analysis, and the potential model and two-step mobile search methods. The calculation of minimum approach distance and buffer analyses is relatively simple and clear, but the lack of consideration of obstacles renders the results quite different from the actual situation. Network analysis can solve common network problems, such as finding the best path between two points, but this approach lacks supplier factors. The potential model method is suitable for the study of spatial interaction, but it only considers the service ability and resistance factors of facilities and lacks the requisite demand-side characteristics. The two-step mobile search (2SFCA) method can connect ecosystems and humans by spatial distance and fully demonstrate the spatial spillover effect of ecology.
Can the exploration of the differences in the impact of ecosystem externalities on different groups provide new ideas to formulate ecological protection policies? In short, this study attempts to test the hypothesis that the spatial distribution change of the spillover effect of ecological externalities is not only affected by the service value and spatial distance of the ecosystem itself; rather, the spatial distribution change can also be affected by the comprehensive influence of the personal characteristics of the residents living near protected areas. The goal of this study is to construct a framework of the interactions between residents and ecosystems, based on spatial distances. The intensity of the external spatial spillover effect and spatial differential pattern of coastal ecology are measured using the data of individual characteristics, the coordinates of residences, and the regional carrier of residents around a coastal wetland reserve. By introducing the 2SFCA model into the ecological field, this study innovates the method of calculating the spatial distribution of the externality spillover mechanism of the ecological reserve. We refine the classification of surrounding residents, rather than simply dividing them into users and non-users. The degree of accessibility of residents to protected areas reflects the impact of ecological externalities. As such, this study can display the spillover mechanism of ecological externalities in a visual form. The conclusion of this study is helpful for managers who are attempting to rationally develop and utilize ecosystems according to the specific situation of different residents and introduce more reasonable protection policies in order to realize the sustainable development of man and nature.
Materials and Methods
Research Framework of Spillover Effect in a Wetland Reserve
Currently, the methods of evaluating the ecological external spatial spillover effect remain an unsolved problem. This study uses the 2SFCA model to reflect the spatial change of ecological externalities by using the accessibility of different types of residents to mangroves. To present a clear logical process, Figure 1 shows the research framework.
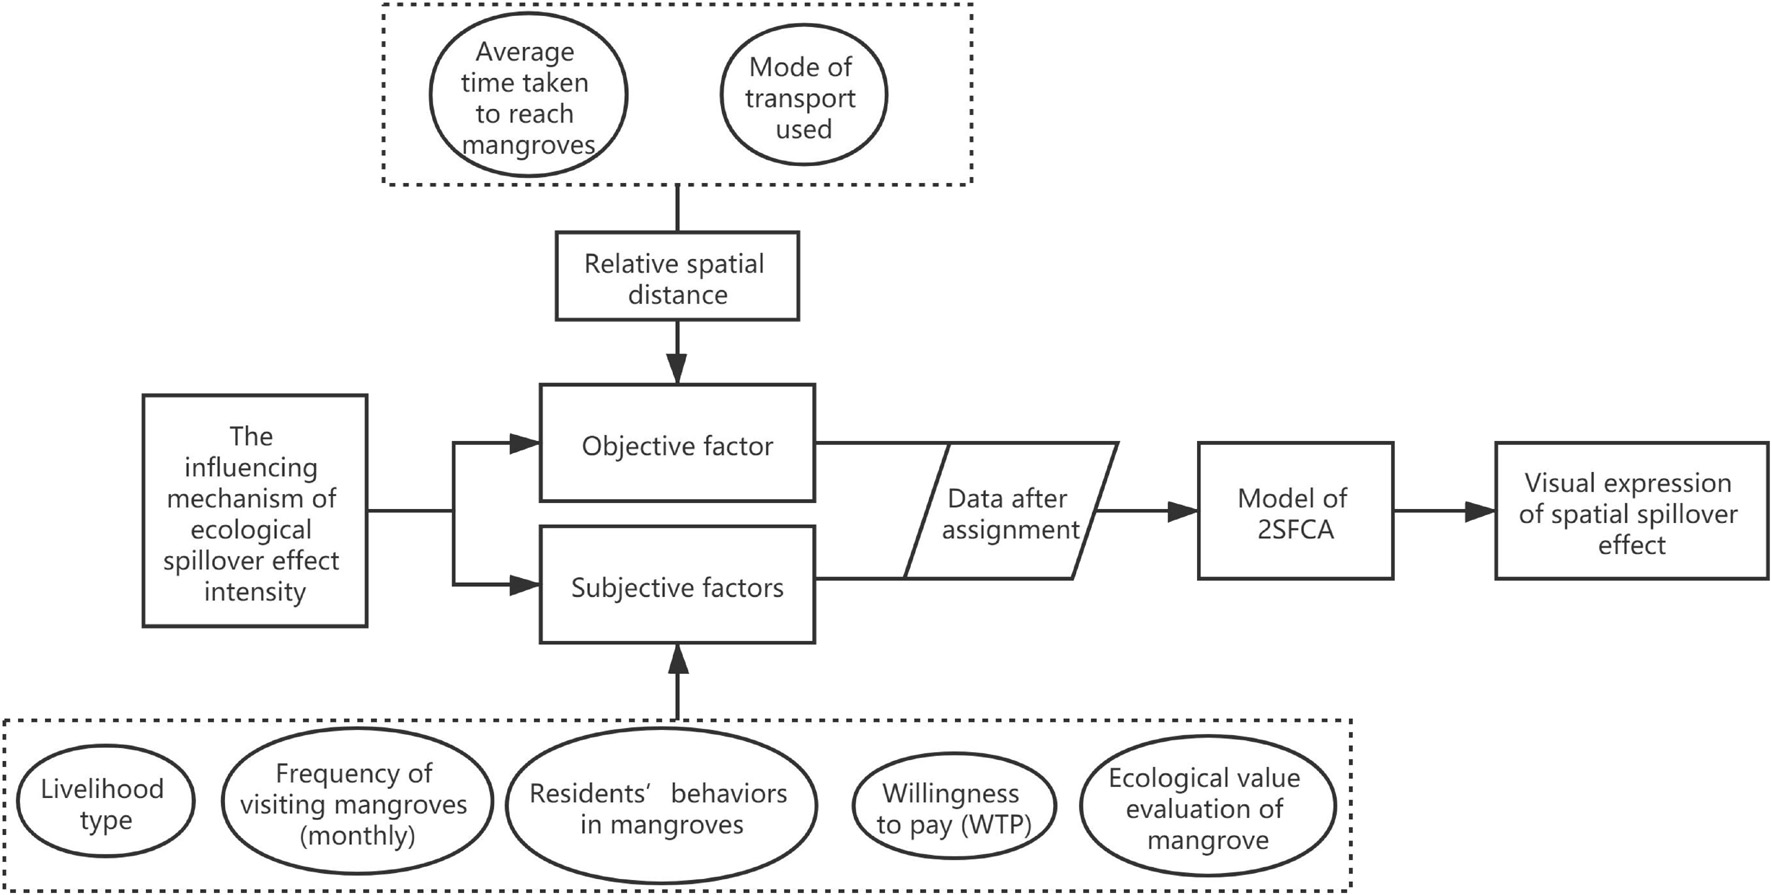
Figure 1. The research framework.
Objective Factor
To explore the spillover effect of mangroves, we must clarify the influencing factors that are most likely to promote the connection between residents and ecologically protected areas.
Based on the findings of Rossi et al. (1992), this study follows the distance attenuation effect and chose the spatial distance between residents and mangroves as a relatively constant objective factor. This is measured by the average time taken by residents to reach mangroves and the method of transportation.
Spatial Distance
Average time taken to reach mangroves
The time taken to reach the mangrove forest is the most intuitive variable that can be used to observe the accessibility of residents to this forest. It is obvious that a lesser travel time indicates higher accessibility, while a longer travel time indicates lower accessibility. Theoretically, the distance from the mangrove forest is too long; the accessibility of the mangrove forest to users is infinitely close to 0. Therefore, it is crucial to select a reasonable threshold for spatial distance. When walking is used as an example, the speed of pedestrians is typically 5 km/h, and the maximum psychological endurance time of pedestrians will not exceed 30 min.
Mode of transport used
The manner of transportation used to travel to the mangroves indirectly indicates the accessibility of the mangroves to residents. We evaluated the relative hourly speeds of walking, cycling, and driving motorcycles and cars as the means to assign the speed at which residents travel to reach the mangroves in this model.
Subjective Factors
We simultaneously took the data of residents’ individual characteristics, such as their livelihood, their behaviors in mangroves, and the frequency of going to mangroves, their evaluation of the ecological value of mangroves, and their willingness to pay and/or receive compensation as subjective factors. The explanations of each factor are laid out below.
Residents’ Individual Characteristics
Livelihood type
Human livelihood is generally described as the combination of capital, which includes social, human, physical, economic, and natural capital (Scoones, 2009). Robinson et al. (2019) decomposed the family level value of ecosystem services across locations and benefit groups, demonstrating a differential dependence on different types of services. Thus, we suggest that the extent of the contribution of ecosystems to the goods sold or consumed by residents depends on their livelihood dependence.
Frequency of visiting mangroves (monthly)
The frequency of visits to mangroves will affect accessibility to a considerable extent. We investigated the number of residents that travel to mangroves every month. The fluctuation of frequency reflects the stability of the connection between residents and mangroves; the frequency also reflects the strength of this connection.
Behaviors of residents in mangroves
The behavior of individuals’ traveling to mangroves is related to the motivation of those individuals. Groups with strong links to mangroves, such as fishermen and residents that rely on coastal mangroves for business services, may have relatively higher access to mangroves than other residents. With the enhancement of tourism in protected zones, the possibility of residents traveling to mangroves for entertainment is also considered.
Willingness to pay
WTP belongs to the category of ecological compensation. The mangroves in the wetland reserve can be considered public goods. The willingness of the surrounding residents, as ecological beneficiaries, to invest in environmental protection and the cost of development opportunities in a monetized way directly reflects the value of the ecological function of mangroves in the minds of residents and then indicates the ecological spillover effect of mangroves.
Ecological evaluation of mangroves
Ecosystem services are seen as a communication bridge between human and natural systems. To combine the ecological function of mangroves with the situation of residents, this study included the awareness of residents to the importance of various ecological services provided by mangroves into the model. The recognition of the value of mangrove ecosystem services to residents is positively correlated with their willingness to protect mangroves, which indirectly reflects the ecological spillover effect of mangroves on residents.
In this study, first-hand data were obtained from the field survey. After data processing, the data were entered into the 2SFCA model (Section “Model of Ecological Spatial Spillover Effect, Based on the Two-Step Mobile Search”). The spatial spillover effect of ecological externalities between different groups of residents is reflected by the change in accessibility. Finally, based on the spatial spillover mechanism of this measurement, this study explores the intensity and scope of the impact of wetland protection policies, as well as the change in the value of ecosystem services of a mangrove wetland reserve. Issues pertaining to ecological compensation are also explored.
Data Collection
For this study, Shankou Town, Hepu County, Beihai City, Guangxi Zhuang Autonomous Region, China, was selected as the research object (Figure 2). Shankou Town (109.73°E, 21.61°N) has 15 villages and one community under its jurisdiction, with a total population of 85,160 people. The area covers 130 square kilometers; including 4,446 hectares of forest area and 733 hectares of beach area. This region also has a national natural ecological reserve, known as Shankou Mangrove Natural Ecological Reserve. Mangroves are one of the typical wetland types in the coastal zone of this area. Shankou mangroves were included in the list of major international wetlands in 2002. They are the largest, most representative, and the best-preserved coastal mangrove forests in mainland China. The uniquely strong interactions, complexities, and vulnerabilities of the local mangroves, as well as the peninsular terrain, eliminated some disturbances and provided excellent conditions for the calculation of the spatial spillover effects of ecological externalities.
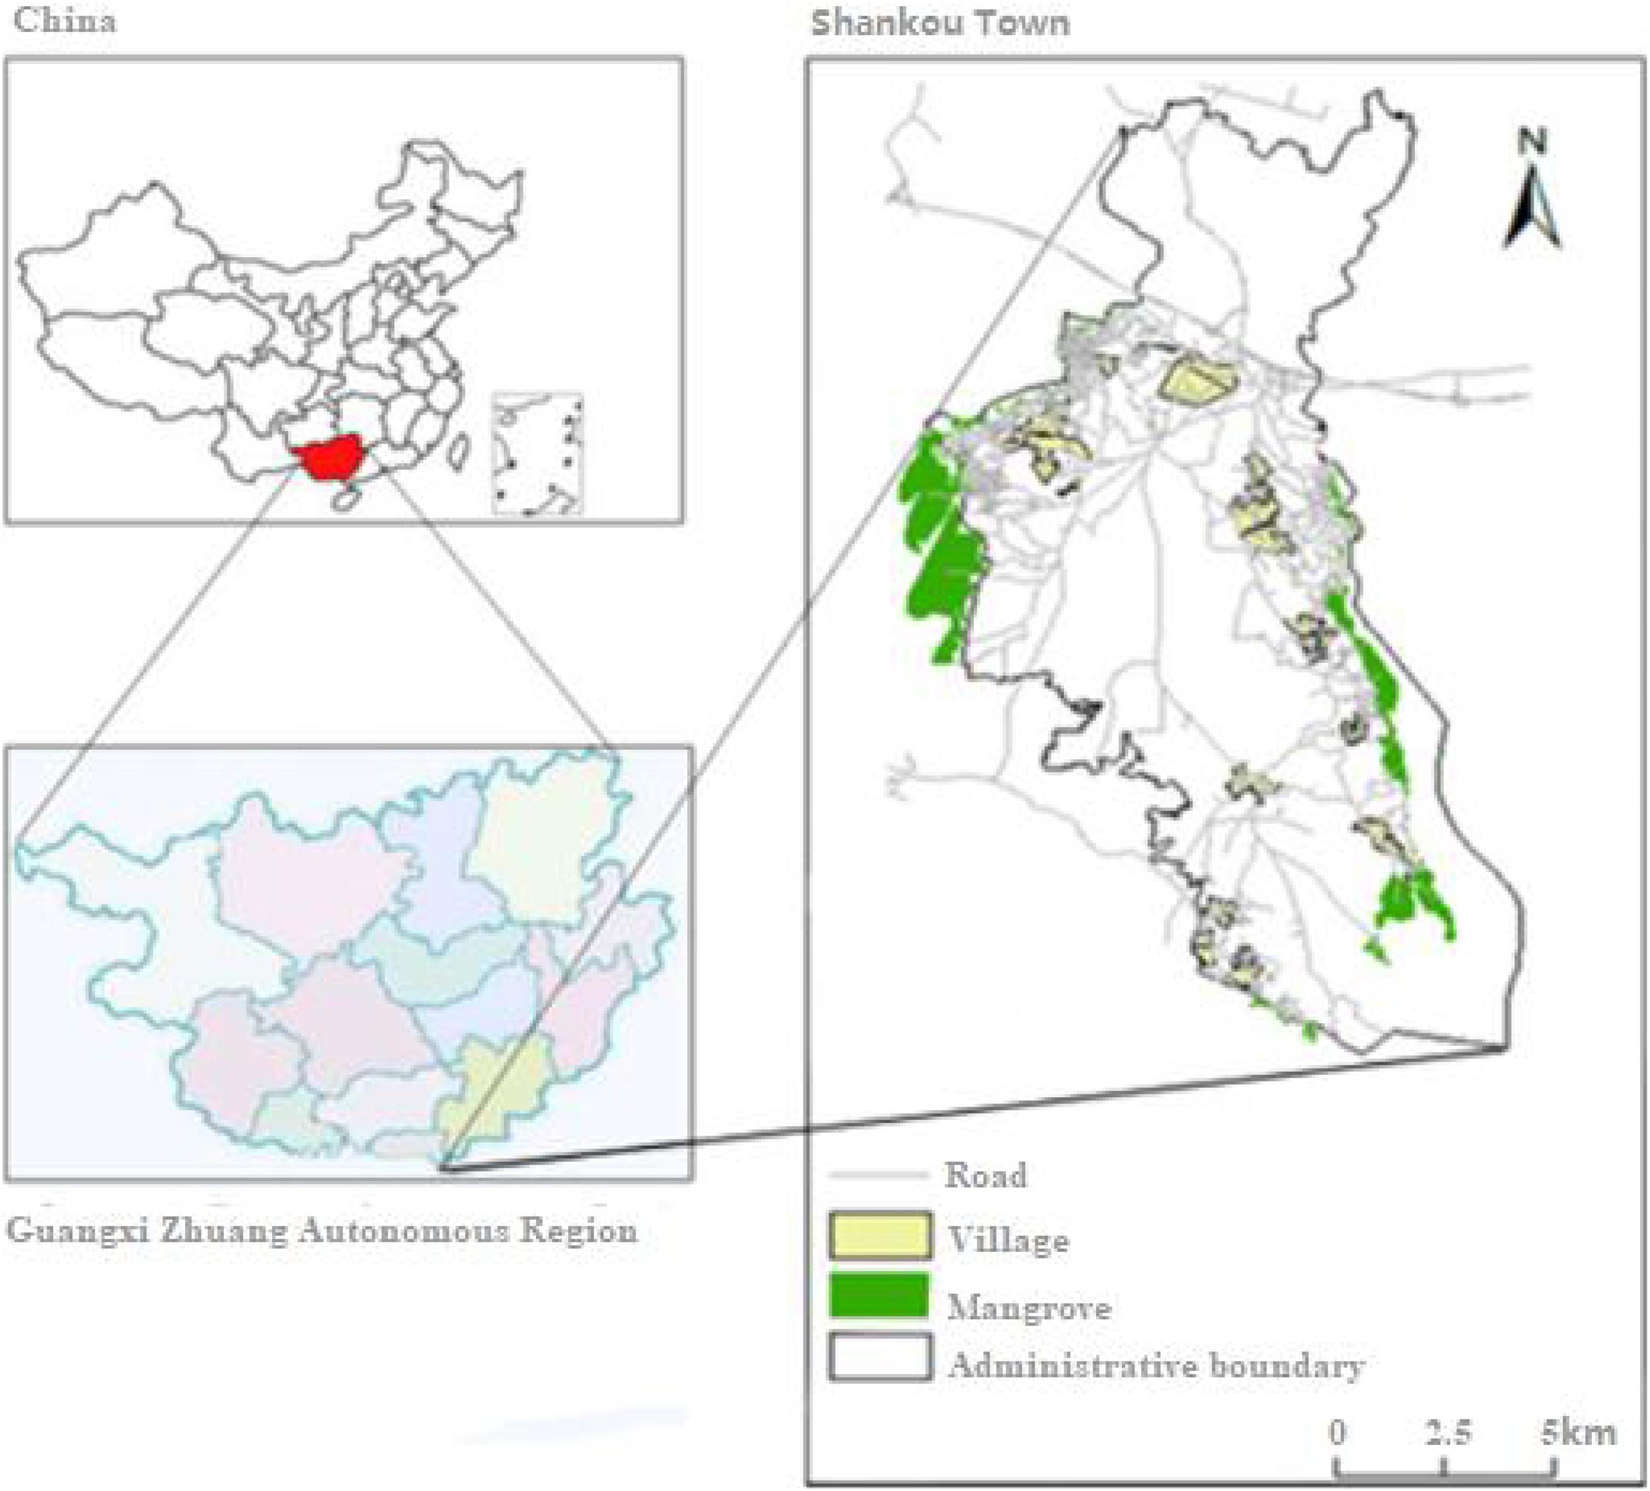
Figure 2. Sketch map of the survey area.
Two surveys were conducted for this study. The first was a semi-structured interview. We conducted informal interviews with local government staff and permanent residents in order to understand the planning and implementation of scenic spots of mangroves in the wetland reserve in Shankou Town, as well as to learn the main sources of income and the residential distribution of residents. In the first survey, we collected basic data (geographic coordinates, area scope, etc.) pertaining to mangrove distribution areas and surrounding villages; the formal survey sites were also determined, namely the villages of Neishanjiao, Shandong, Xinzhou, Luotang, Shanxi, Xitang, Zhongtang, Xinwei, Haitang, Dacun, Zonglukou, Beijie, Datang, Anzhi, and Gaopo in Shankou Town. Understanding the group characteristics, behaviors, and attitudes of village residents helped to design a more targeted questionnaire, which was used in the second survey, thereby reducing possible defects in the questionnaire design. Since residents were more likely to visit facilities near them than the average possibility of visiting them from any distance, surveying the distribution of mangroves in Shankou Town enabled this study to combine the geographical location of surrounding villages. For this study, ArcGIS10.6 tools were used to divide the mangroves into 36 blocks, as shown in Figure 3; the limited activity space of residents was regarded as the basis to reduce the interference caused by regional competition in subsequent calculations.
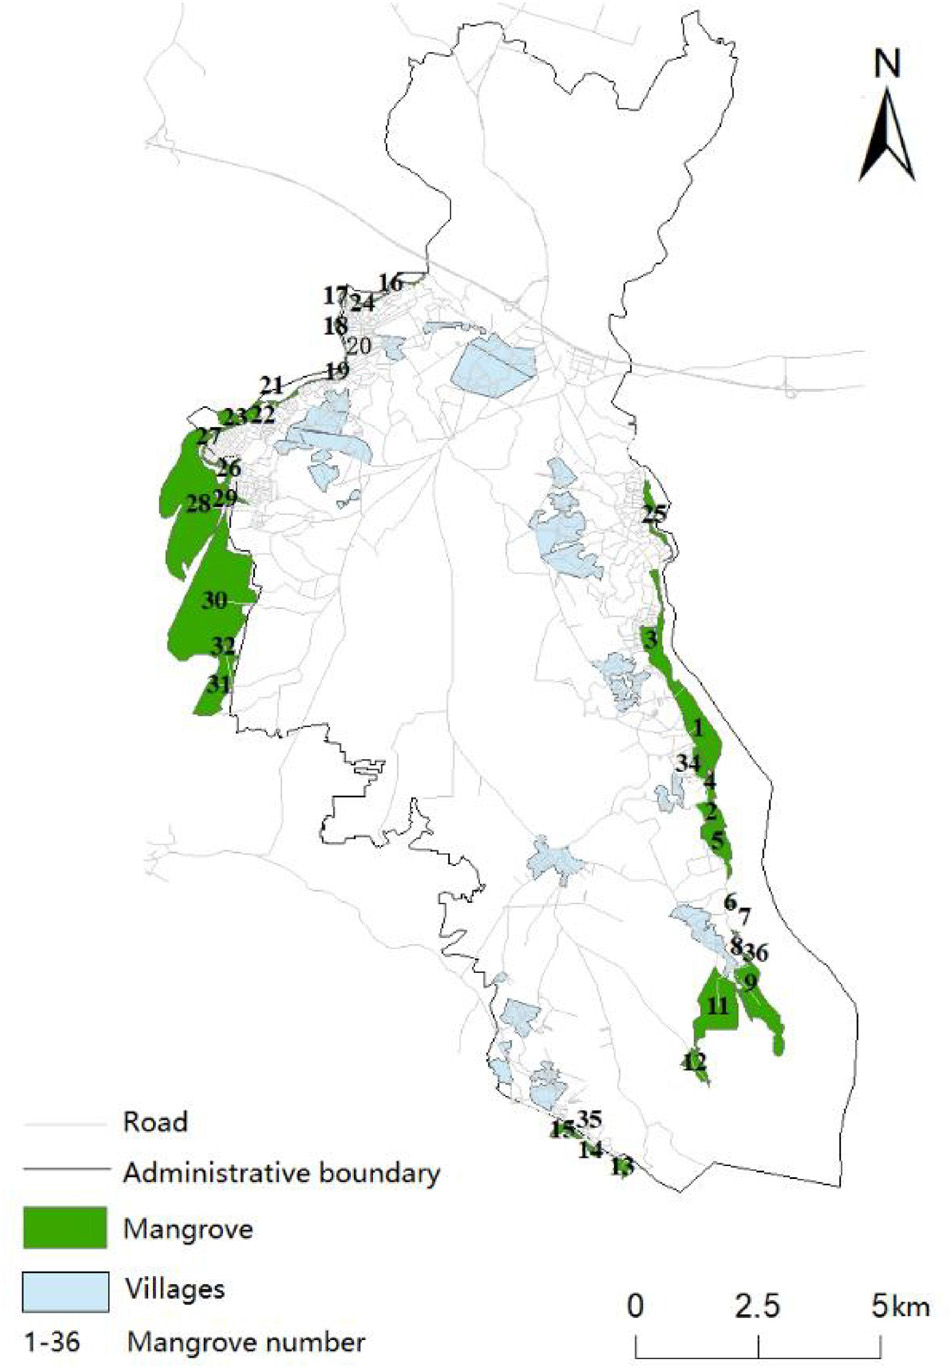
Figure 3. Schematic diagram of mangrove blocks.
The second survey obtained first-hand data by issuing structured questionnaires. A total of 573 questionnaires were distributed; 567 questionnaires were recovered, and so the effective rate was 98.95%. The questionnaire included personal characteristics data, such as the willingness of the residents to pay and the calculation of the comprehensive values of the mangroves.
Personal Characteristics Data
In this section, we conducted systematic surveys of the willingness to protect the environment, the behavior of residents in mangroves, the frequency of visiting mangroves, and the different types of livelihoods.
The willingness of residents to protect the environment was divided into “Willing,” “Unwilling,” and “Indifferent” categories, and assigned from high to low, based on the intensity of willingness.
The livelihood categories of residents were divided into “Labor services,” “Full-time farming,” “Half-farming and half-livestock breeding,” “Half working and half farming,” “Full-time fishing,” “Management services,” “Full-time livestock breeding,” and “Half-farming and half-fishing.” This study postulates that fishing, aquaculture, and a reliance on the coastal mangrove forest for some residents’ business services are significantly affected by the presence of mangroves, simply because this mangrove is their livelihood. The relative impact of semi-agricultural and semi-fishing, semi-agricultural and semi-livestock breeding residents is not as large; the willingness to reach mangroves is also not as high in these groups as in the former. Residents of traditional, semi-industrial, and semi-industrial agricultural types have a relatively smaller degree of direct connection to mangroves. The connection of the livelihood of migrant workers to the mangroves is low, owing to their types of jobs. We assigned mangroves from high to low, according to the dependence of livelihoods, based on these ideas.
To fully consider the diversity of contact with mangroves, this study investigated the behavior of residents towards mangroves. Based on the characteristics of mangroves, we summarized the behavior of residents as “Collection,” “Cultivation,” “Entertainment,” and “Management.” Moreover, this study investigated the frequency with which residents travel to the mangroves. In general, more frequent travel was deemed to indicate a close connection between the residents and the mangroves.
Statistics of the Willingness to Pay of the Residents
The willingness to pay (WTP) is often used to assess the analysis of the degree of pro-environmental views. This study investigated the awareness of residents to environmental protection policies and their willingness to participate in the protection of the mangroves, as well as the impact the extinction of the mangroves would have on the residents.
On the basis of knowing the degree of the residents’ environmental perception, we chose a payment card method that gives consumers a variety of price choices; the consumers could thus choose the most suitable option (Field and Field, 2009). In the hypothetical market, we asked residents about the amount of money they would be willing to pay for the use or protection of mangrove ecosystem services. They were also asked to disclose the maximum amount of money they would be willing to accept in compensation if they were to lose the mangrove ecosystem services. The residents were assigned different scores, depending on the intensity of their WTP and the level of its amount.
Comprehensive Calculations of the Service Values of Mangrove Ecosystems
An ecosystem service (ES) value assessment is a method of quantitatively evaluating the externalities of ecosystems. Such evaluations play an important role in issues pertaining to environmental protection. Since the evaluation of ecosystem externalities has a significant effect on protection policies, a series of social, ecological, and economic assessments are required (Daily, 1997; Schmidt et al., 2016; Ciftcioglu, 2017). The construction of a framework for ecosystem service values helps us to understand user preferences and to quantify the values of ecosystem services (De Groot et al., 2012). However, the traditional indicators used to measure an ES usually only consider the area to be processed; this approach does not adequately address our research goals. To combine the ecological functions of mangroves with the actual perceptions of residents, this study incorporates the perceptions of the importance to residents of multiple ecological services of mangroves into the model.
Based on the previous experience of weighted processing of facility characteristics (Dony et al., 2015), this study screened the ecological service attributes that best reflected the value of mangrove forests and selected nine projects that were of greatest concern to the residents. The formal survey was based on “Specification for wetland ecosystem services assessment,” and weighted processing was based on the size of the proportion, thus forming a comprehensive calculation value (Table 1).
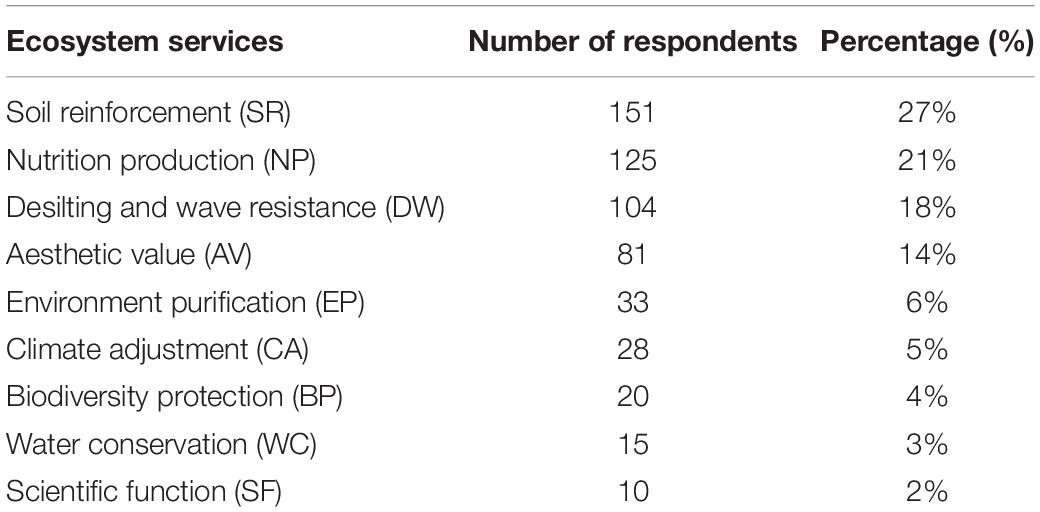
Table 1. Residents’ views on the most important mangrove ecosystem services.
Combined with the evaluation specifications, the comprehensive weighted formula (Eq. 1) is used to calculate the value of a mangrove ecosystem’s services, and can be represented as follows:
In Eq. (1), Eess is the value of a mangrove ecosystem’s services; ESR is the annual price for soil consolidation by the wetlands; ENP is the price per unit area of mangrove wetland that provides nutrients; EDW is the annual price for the elimination of silt and waves by the mangrove wetlands; EAV is the value of China’s wetland ecosystem for users to enjoy the per unit area; EEP is the sum of the value of absorbing pollutants, trapping dust, and producing negative ions; ECA is the total climate adjustment price, which includes the price of plant transpiration (EV) and the water surface evaporation price (EW); EBP is the value of biodiversity protection calculated, and EWC is the value of water conservation, which includes two functions, namely adjusting the amount of water (AW) and purifying the water quality (PW). Finally, ESF is the value of providing opportunities for scientific research. Specific accounting formulas for each value are shown below.
Soil reinforcement
The value of wetland ecosystems in reducing soil loss can be represented by Eq (2):
In Eq. (2), ESR is the annual price for soil consolidation by the wetlands [USD/(hm2)]; X1 is the woodland soil erosion modulus [t/(hm2)]; X2 is the soil erosion modulus without forest land [t/(hm2)]; CSR is the cost of excavating and transporting a unit volume of earthworks (USD/m3); K is the area of the mangrove (hm2), and ρ is forest soil capacity (t/m3).
Nutrition production
The organic litter of mangroves, such as leaves and bark, serves as nutrients for aquatic organisms, such as fish, shrimps, crabs, birds, and other animals in the wetlands. The alternative market method was used to construct the formula (Eq. 3) to calculate the price:
In Eq. (3), ENP is the price per unit area of mangrove wetland that provides nutrients [USD/(hm2)]; CNP is the average price per ton of bait [(USD/t)]; K is the area of the mangrove (hm2), and MLitter is the mangrove litter per unit area (t/hm2).
Desilting and wave resistance
Wetlands eliminate waves and protect seacoasts. Its value can be represented by Eq. (4):
In Eq. (4), EDW is the annual price for the elimination of silt and waves by the mangrove wetlands [USD/(hm2)]; Lseacoast is the coastline length of the mangrove wetlands (km); Crepair is the maintenance and repair costs of seawall projects [USD/(km)], and K is the area of the mangrove (hm2).
Aesthetic value
Wetland landscape belts are rich in ornamental and entertainment value. The value can be represented by Eq. (5):
In Eq. (5), K is the area of the mangrove (hm2), and CAV is determined by the average landscape value of China’s wetland ecosystem per unit area (USD/hm2).
Environment purification
The value of wetlands, owing to their absorption of pollutants, trapping dust, and production of negative ions, can be represented by Eq. (6):
The value of absorbing pollutants (ES) can be represented by Eq. (7):
In Eq. (7), ES is the price of the wetland’s function of absorbing atmospheric pollutants [USD/(hm2)]; Cs is the investment cost of decomposing air pollutants [(USD/kg)], and K is the area of the mangrove (hm2).
The value of trapping dust (Ed) can be represented by Eq. (8):
In Eq. (8), Ed is the price of the wetland dust retention function per unit area [USD/(hm2)]; Cd is the cost of cleaning dust (USD/kg); K is the area of the mangrove (hm2), and Qd is the annual retention of dust per unit area of wetland [kg/(hm2)].
The value of the production of negative ions (NI = negative ions) is calculated by Eq. (9):
In Eq. (9), ENI is the price of the negative ion production of the wetland forest resources [USD/(hm2)]; H is the forest height (m); L is the anion life (min); K is the area of the mangrove (hm2), and QNI is the concentration of negative ions produced by the forest [(numbers/hm3)].
Climate adjustment
Wetlands absorb heat and cool their surroundings by evaporating water from the surface and transpiring, which is specifically expressed by Eq. (10):
In Eq. (10), ECA is the total climate adjustment price [USD/(hm2)]; Ev is the price of plant transpiration [USD/(hm2)], and Ew is the water surface evaporation price [USD/(hm2)].
EV can be represented by Eq. (11):
In Eq. (11), Ga is the heat absorbed per unit of green area (kJ/km2); K is the area of the mangrove (hm2), and Pe is the price of electricity [(USD/kW⋅h)].
Ew can be represented by Eq. (12):
In Eq. (12), Ep is the annual evaporation (mm), disassembled into the product of evaporation per unit area, and β is the energy consumed to evaporate one unit volume of water (kJ/m3).
Biodiversity protection
Biodiversity protection can be expressed as the conservation value of species by Eq. (13):
In addition to the Wetland Ecosystem Service Function Evaluation Specification, the Shannon-Wiener index was used to calculate SBiodiversity; K is the area of the mangrove (hm2).
Water conservation
Water conservation includes two functions: adjusting the amount of water (AW) and purifying water quality (PW). The value of water conservation is shown by Eq. (14):
The value of the adjustment of the amount of water (AW) is calculated by Eq. (15):
In Eq. (15), EAW is the value of the volume of water adjusted per unit area of wetland resources [USD/(hm2)]; CReservoir is the unit of storage cost (USD/m3); K is the area of the mangrove (hm2); P is the annual precipitation (mm); E is the annual wetland evapotranspiration (mm); and C is the surface runoff (mm). Since it is difficult to calculate (P-E-C), the product of the annual water storage ratio and the area of the mangrove wetlands was uniformly adopted.
The value of purified water quality (PW) was calculated by Eq. (16):
In Eq. (16), EPW is the value of the adjusted water quantity per unit area of wetland resources [USD/hm2]; Cwater is the water purification cost [(USD/t)]; K is the area of the mangrove (hm2); P is the annual precipitation (mm); E is the annual wetland evapotranspiration (mm); and C is the surface runoff (mm). Since it is difficult to calculate (P-E-C), the product of the annual water storage ratio and the area of the mangrove wetlands was uniformly adopted.
Scientific function
Wetlands provide opportunities for scientific research. This value can be represented by Eq. (17):
In Eq. (17), ESF is the value of wetland culture research per unit area [USD/(hm2)]; CSF is the average cultural research value per wetland area [(USD/hm2)]; and K is the area of the mangrove (hm2).
Model of Ecological Spatial Spillover Effect, Based on the Two-Step Mobile Search
The 2SFCA is a model based on supply and demand points; the search is moved twice within a certain range of the distance threshold, and finally, all of the supply and demand ratios are added to obtain the accessibility of the demand point. The 2SFCA originated from the gravity model (Joseph and Bantock, 1982). Based on the spatial decomposition method (Radke and Mu, 2000), the model’s genesis originates from research into the interaction between spatial supply and demand (Luo and Wang, 2003). The expanded form of this method can be divided into four types: expansion of the distance attenuation function, search radius, demand or supply, and travel mode. The 2SFCA assumes that the benefits of spatial interaction must be greater than the costs. Therefore, the search region size in the 2SFCA method represents the threshold distance, and the interaction cannot be established beyond the threshold distance. In the original 2SFCA model, the search process in the first and second steps is based on any defined search area size. In fact, the size of the search area is beyond the simple division of the service area and depends primarily on the manner in which the service is used, as well as the activity space of the consumer (Wang, 2012; Lin et al., 2020). The improved model considers the regional competition among comparable service providers since consumers, on average, are more likely to visit their nearby facilities than to visit other facilities within any distance. Therefore, the 3SFCA method was developed by introducing the selection weight, which represents the probability of the demand point visiting its nearby supply point (Wan et al., 2012). The difference between the 3SFCA and other spatial interaction methods is that it uses a simple, travel-time-based weight to describe the competition effect. However, it cannot reflect the complex interactions between populations and service sites. After that, researchers consider the form of distance attenuation in the interaction between supply and demand. During the process of research, the 2SFCA prototypical model has been developed in more detail to capture the complexity of travel environments, travel behaviors, and various service requirements in the real world.
In this study, the expansion forms of 2SFCA are summarized into four types: expansion for the distance attenuation function, the expansion for the search radius, expansion for demand or supply, and expansion based on travel mode. The distance decay function is the basis for measuring the spillover mechanism of ecological externalities in this study (G2SFCA) (McGrail, 2012). The common distance attenuation functions were enhanced (E2SFCA) (Luo and Qi, 2009) to factor in gravity (G2SFCA) (Amiri et al., 2019), kernel density (Kernel Density 2SFCA) (Dai and Wang, 2011), and Gaussian 2SFCA (Ga2SFCA) (Dai, 2011). These models are not restricted by administrative boundaries and are easily calculated. In application, different distance attenuation functions have been incorporated into the thread of model development, but their applicability and limitations have not been thoroughly tested. In practice, E2SFCA still has some subjective components in the division of distance segments and the determination of weight. The reachability decay rate of G2SFCA and the KD2SFCA distance decay function increases or decreases in line with the increase in distance. The rate of attenuation of Gaussian 2SFCA (Ga2SFCA) first increases and then decreases in line with the increase in distance, which is more consistent with the actual investigation.
Most studies on accessibility effectively measure the degree of equality of residents that enter the supply side area (Boone et al., 2009), but only a few studies have focused on exploring the impact of spatial differences in accessibility and the characteristics of different groups on differences in supply and demand (Vaz et al., 2017). In addition, more research has been conducted to calculate the population demand based on the capacity/attractiveness of the facility area, without considering the impact of the area, quality, and population demand of public facilities. In this study, the 2SFCA model fully considers the characteristics of facilities and users and successfully couples them. This study uses Gaussian 2SFCA, which covers the three elements of ecosystems, spatial distances, and humans. The model also considers the law of attenuation of spatial distance, in order to reflect the external spatial spillover effect caused by spatial accessibility.
Gaussian 2SFCA uses Gaussian functions, such as the distance decay function g (dij) in the search radius of 2SFCA, which can be represented by Eq. (18):
The specific operational method is as follows:
The first step is to search for each survey object point j (demand point) distance threshold d0 in the search area for mangrove point k (supply point) and calculate its supply demand ratio Rj:
In Eq. (19), dkj is the distance between the research object point j and the mangrove point k; Dk is the demand of mangrove point k in the search area, and Sj is the supply of supply point j.
Then, G (dkj, d0) is the distance friction, using Eq. (20):
Based on the research situation, d0 was set to 60 min; ArcGIS has a built-in selection function by attribute, which can simplify this step.
The second step is to calculate the spatial accessibility index Ai of each demand point:
In Eq. (21), dij represents the distance between the mangrove point i and the research object j; G (dkj, d0) is the distance friction; and Rj is the supply demand ratio in the search area of point j. Next, Ai is the sum of the supply demand ratio Rj weighted by the distance friction in the search area from the distance threshold d0 of each demand point i. Greater values of Ai clearly indicate better mean spatial accessibility and lower space-time barriers. A smaller difference in the spatial accessibility index of different regions results in a more balanced distribution of suppliers. The final result calculated by the 2SFCA model was the number of surrounding residents that could be attracted per unit of mangrove, which refers to the degree of influence of mangrove externalities on the surrounding residents. The results are displayed on the map as 0 or 1. Larger numbers indicate that the surrounding residents are more attracted to the mangrove forest in the block, resulting in a stronger spillover effect. Each piece of mangrove has a different degree of attraction to the residents, so this can reflect the changes in the spatial spillover effects of ecological externalities.
Results
In this section, a schematic diagram that shows the change in accessibility reflects the spatial spillover mechanism of ecological externality among different groups. Higher accessibility indicates that the mangrove has a stronger attraction to the residents, which in turn results in a stronger spillover effect. Since the 2SFCA model is effectively an analysis of a particular class of residents, the numerical intervals of accessibility in different graphs differ slightly. In this study, five color blocks are used to distinguish the accessibility and describe the ecological spillover effect in the form of spatial variation trends.
In this study, the relative spatial distance between residents and mangroves is regarded as a basically unchanged objective factor. On the basis of following the distance attenuation effect, we obtained the individual characteristics of the residents, such as livelihood categories, travel frequency, different behaviors in mangroves, and environmental protection willingness (Section “Accessibility Measured by the Individual Characteristics”), as well as ecological compensation/WTP (Section “Accessibility Measured by Willingness to Pay”), and mangrove ecosystem service values (Section “Accessibility Measured by Mangrove Ecosystem Service Values”). Each part uniquely impacts the spatial spillover effects.
Accessibility Measured by the Individual Characteristics
The descriptive statistics of the questionnaire related to the individual characteristics of residents are shown in Table 2. Since the proportion of men to women in the region is 1.625, the proportion of women is relatively small, and most of them are migrant workers. Women comprised only 38.1% of the participants in this study. Since the labor force is the main cause of ecological spillover, the proportion of labor force in the respondents was as high as 73%, while the proportions of young people under 18 and the elderly over 60 were relatively small. Coastal residents live by the sea, so they have a high awareness of wetland protection; up to 75.8% of these residents are willing to protect the coastal wetland. Some residents are unlikely to protect the mangroves, because of their low level of education or long-term migration. When asked about the number of visits to mangroves per month, 44.6% of the respondents visited mangroves less than seven times per month. On the one hand, the visits were for entertainment (54%); alternatively, the visits were related to the residents’ livelihoods. Residents who specialized in fishing and harvesting seafood (32.8%) could visit the mangroves as many as 30 times per month or almost once a day. In this study, 45.9% of the residents were engaged in agricultural production.
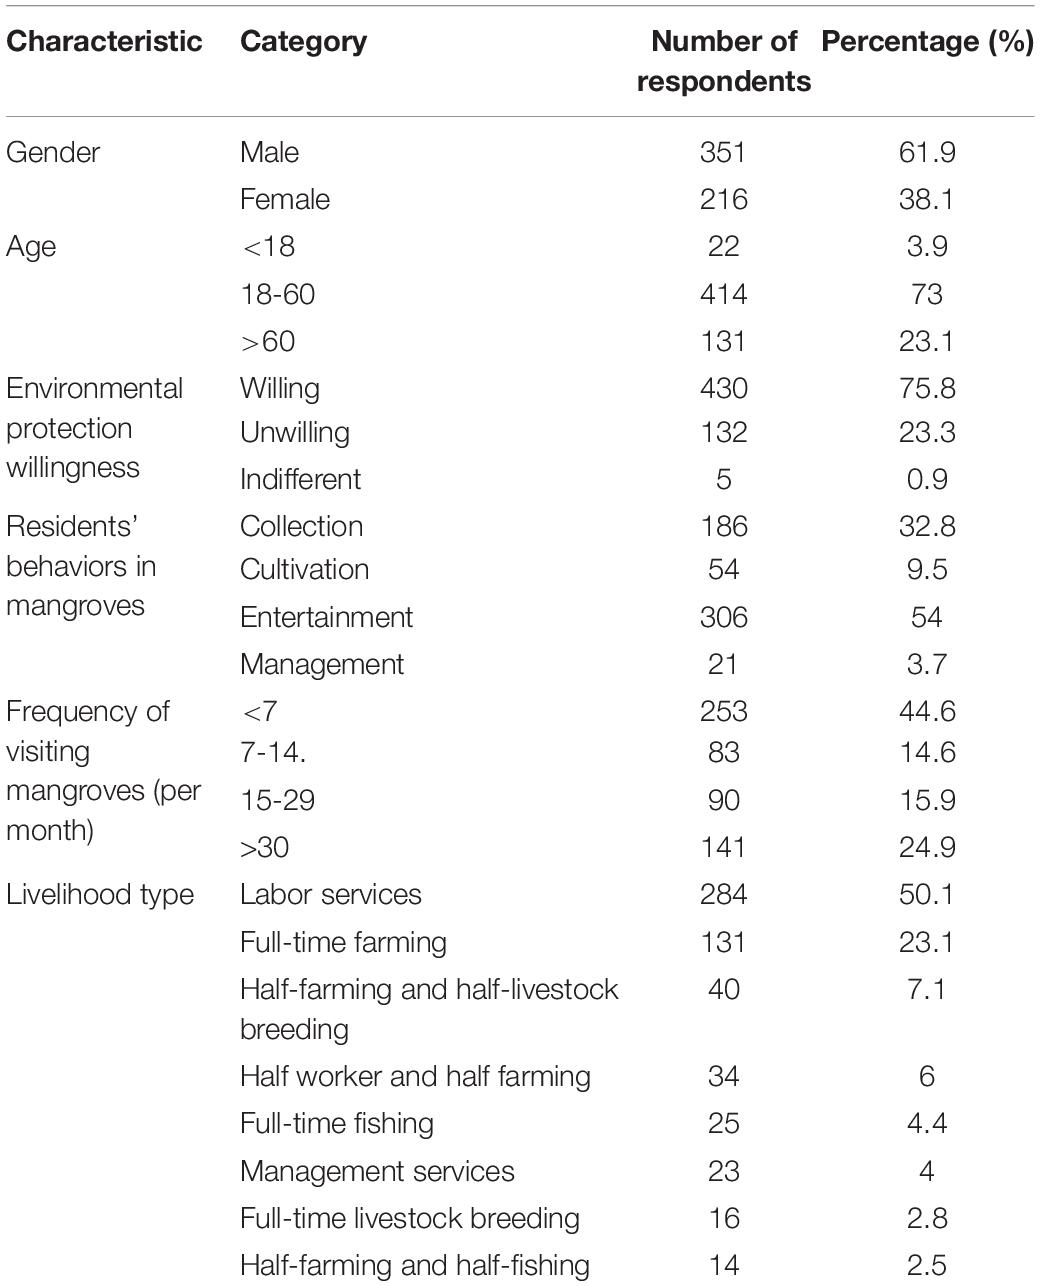
Table 2. A descriptive analysis of the basic characteristics of residents.
A schematic diagram based on the data of the personal characteristics of the residents is shown in Figures 4-7. The accessibility intervals of different blocks are shown in detail so that readers can compare the data with the illustrations.
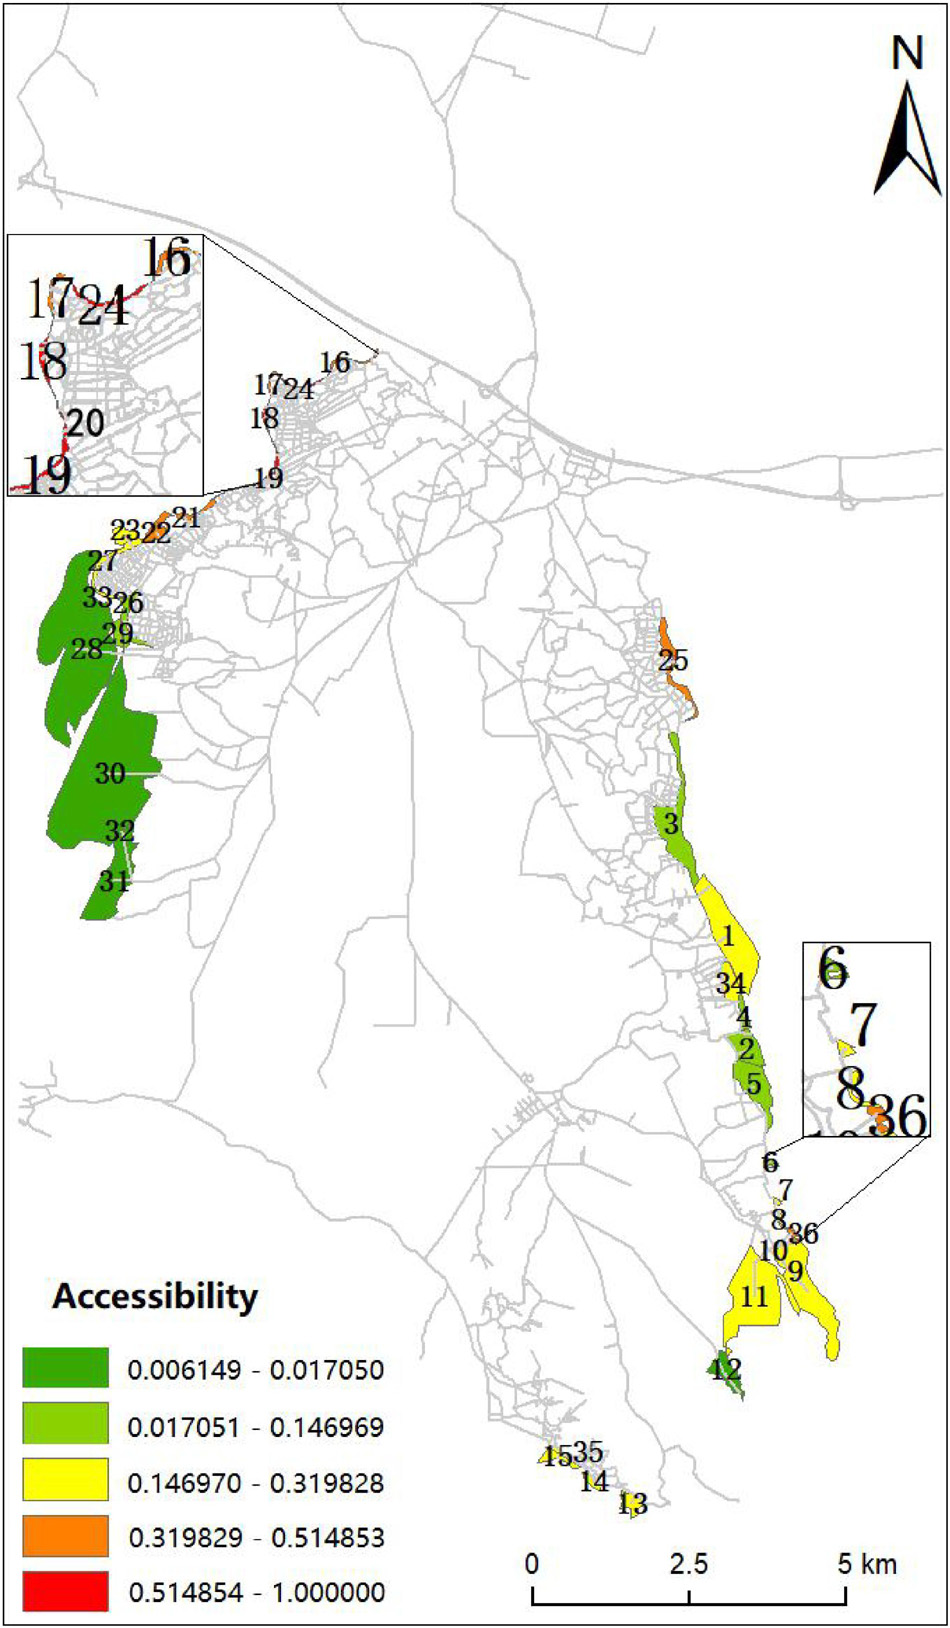
Figure 4. Accessibility of the mangroves calculated by livelihood category.
Figure 4 shows the degree of accessibility that was calculated based on the livelihood categories, while Figure 5 displays the accessibility calculated based on travel frequency. Figure 6 shows the accessibility calculated according to travel behavior, and Figure 7 shows the accessibility calculated according to the willingness to protect mangroves. It is apparent that the distribution of accessibility presents an overall trend of high in the south and low in the north. After overlaying and comparing the four maps, we analyzed the local blocks that clearly differed from the others. Based on the geographical characteristics, we classified the northwest region, the eastern region, and the southern region.
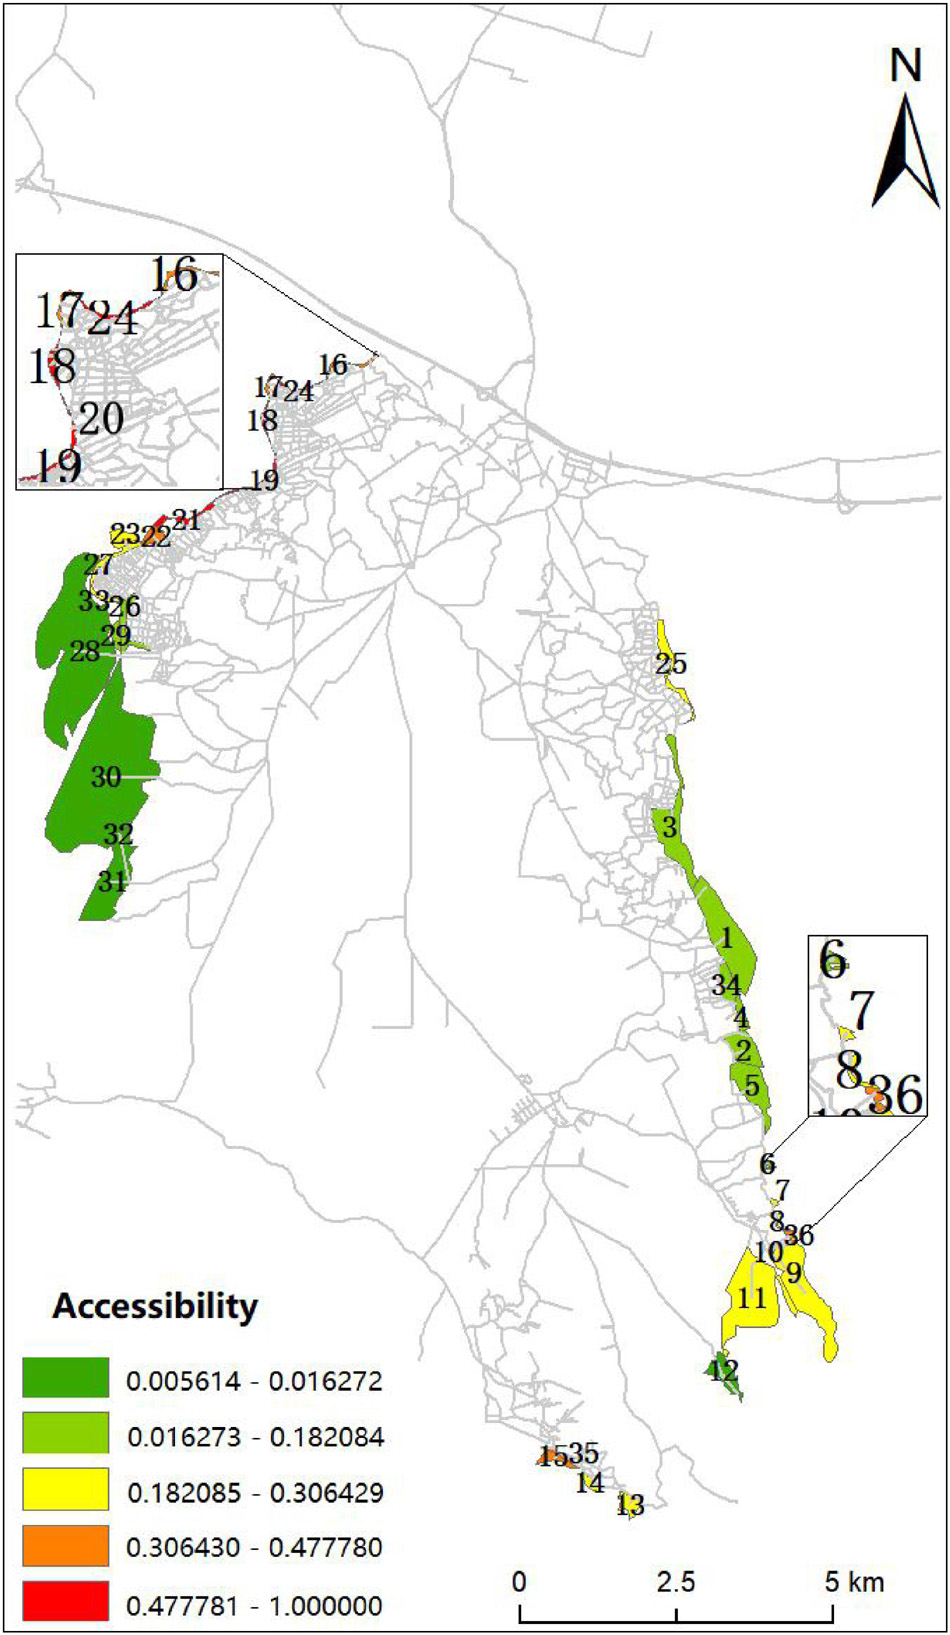
Figure 5. Accessibility calculated by the frequency of visits.
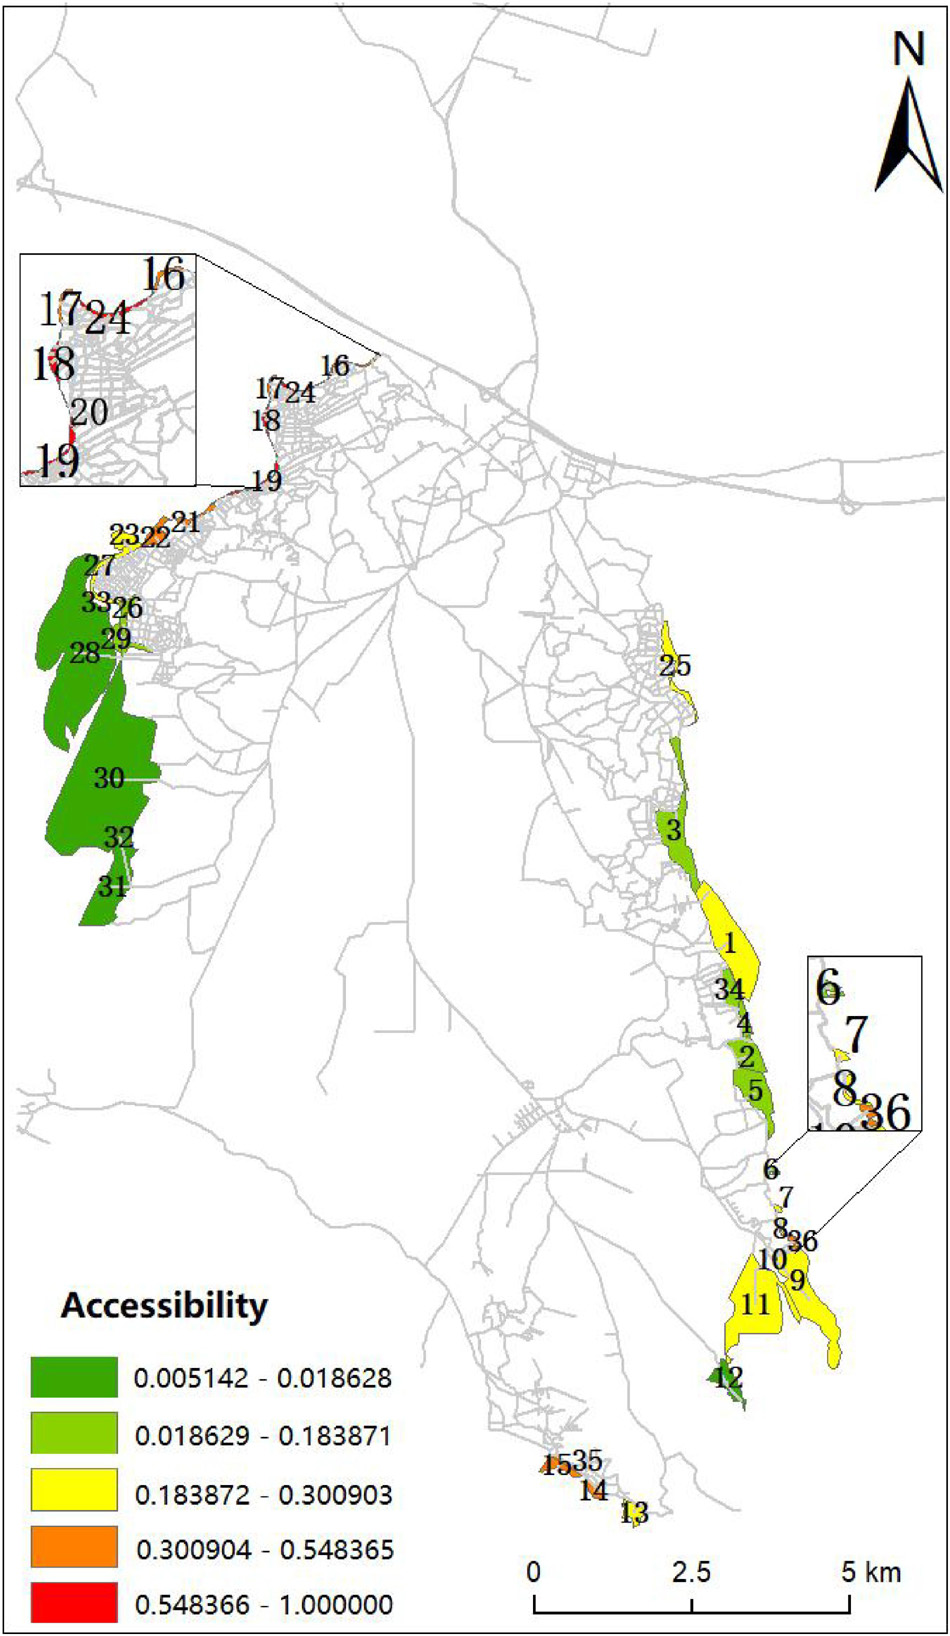
Figure 6. Accessibility of different behaviors of visits to mangroves.
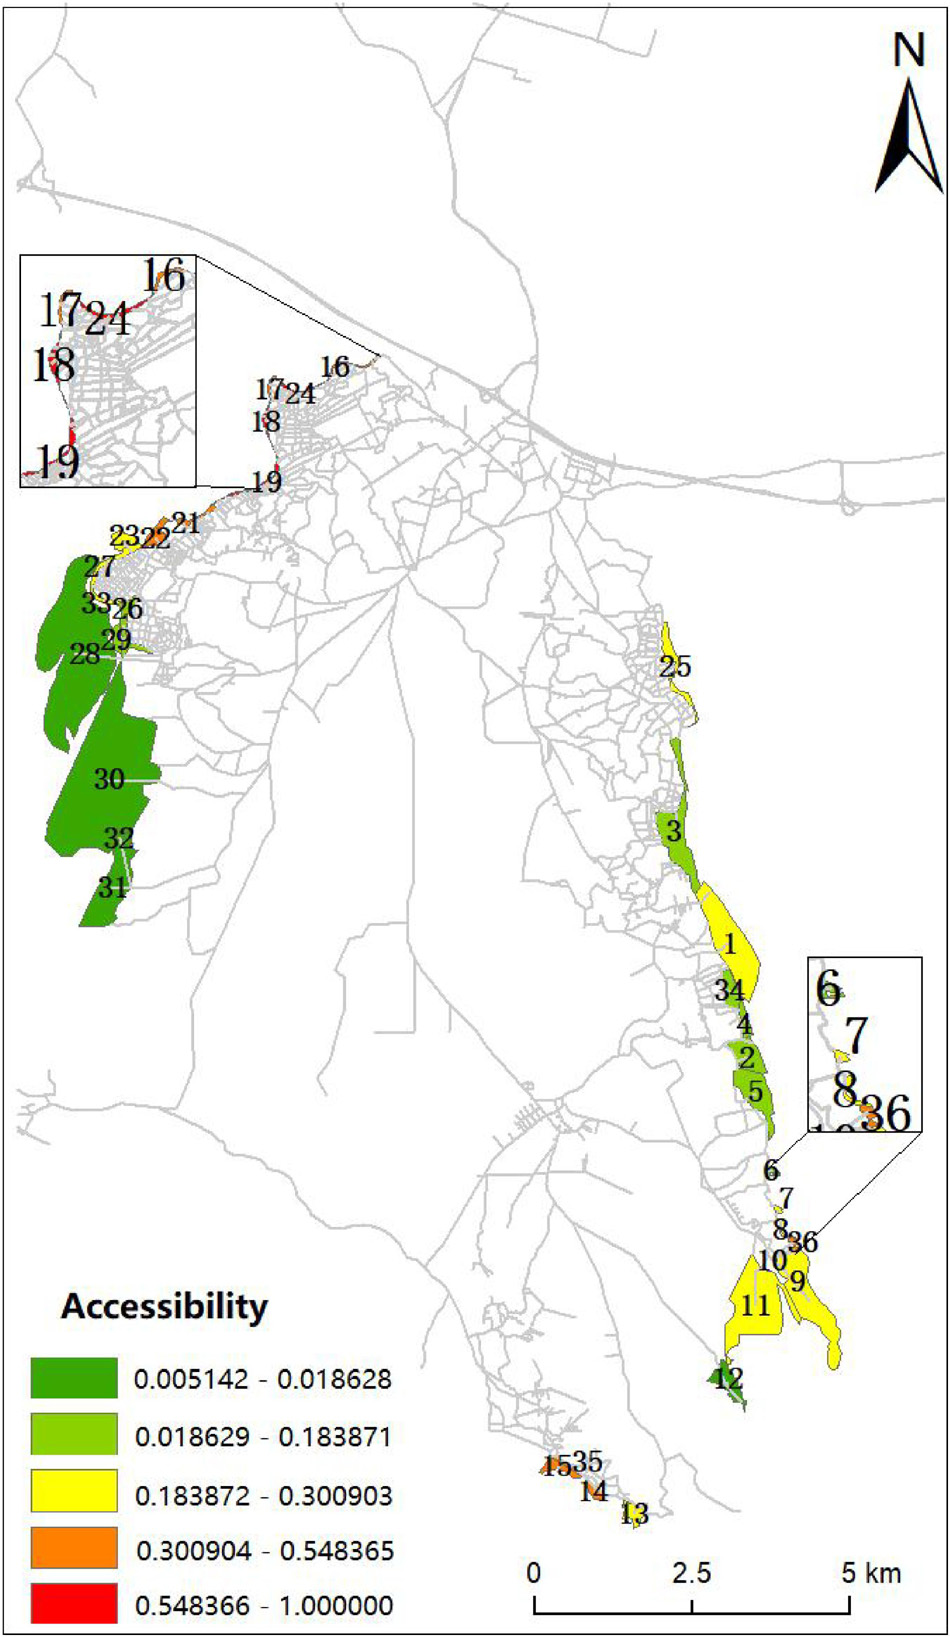
Figure 7. Accessibility of willingness to protect mangroves and visits to mangroves.
In the northwest region, the accessibility of mangroves in the four maps is basically the same. Access to Block 27-28 is low, owing to poor conditions and the low number of nearby residents. Block 16-23 is located in the dense water network area; the surrounding residents are mostly fishermen that demonstrate strong accessibility. The high dependence on mangroves results in local residents having a high willingness to protect them, demonstrating a strong ecological spillover effect.
In the eastern region, Figure 4 shows significant differences when compared with the other three figures in Block 25 (Block 25 only shows the accessibility level of degree 4 in Figure 4). This is because the main livelihood of some residents depends on mangroves. However, owing to weather and policy reasons, these residents do not often go to the mangroves. Rather, they regard mangroves as an available means of production, while ignoring their ecological value. Figure 5 shows a significant difference in Block 1, which is due to the local public sector focusing on planning and unified management. Local residents are engaged in mangrove-related livelihood activities and are willing to protect the ecological zone, but the daily operation has been entrusted to the public sector; few of the residents travel to Block 1.
In the southern region, the accessibility of Block 15 in Figure 4 is significantly lower than that in the other three figures (Block 15 only shows the accessibility level of degree 3 in Figure 4). This finding indicates a mismatch between the livelihoods of local residents and their travel frequency, behavior, and willingness to protect the mangroves. This is because the main livelihoods of the local residents are unrelated to the mangroves. However, the degree of local mangrove landscape tourism development is high. The residents often travel to the mangroves for entertainment; they typically have a high understanding of the ecological value of mangroves. These factors explain the reasons for the observed difference.
The results show that the spatial spillover effects of ecological externalities in the coastal zone of the region were strong in the north but weak in the south. For mangroves around the areas in which the residents were engaged in aquaculture, fishing, and collection, or where related service industries were densely distributed, the accessibility was much higher than for groups of residents engaged in farming and working in other areas. As the residents relied more heavily on mangroves, their accessibility was higher. An increase in the frequency of visits indicates higher accessibility. The residents who approve of protection have higher accessibility to mangroves, and the spillover effects are more apparent. The types of livelihood, behavior, and frequency of visits to the mangrove forests, and the willingness to protect them, all have effects on accessibility. It can be hypothesized that the differences in the results of these calculations are primarily owing to the large differences in the cognitive behaviors of the individual residents and may also have been affected by other factors, such as the level of income.
Accessibility Measured by Willingness to Pay
The WTP of the residents is shown in detail in Table 3. The survey indicated that 76% of the residents knew half (or even completely lacked any understanding) of the mangrove protection policy, clearly indicating that the mangrove protection policy should receive more publicity. However, 99% of the residents stated that they are willing to protect mangroves, suggesting that they have at least some environmental awareness. The number of residents who have not participated in mangrove protection was as high as 78%, indicating that mangrove protection is not adequately publicized, but also that few residents participate in mangrove protection. The number of people who said they would participate in mangrove protection in the future stood at 76%, indicating that they want protection but have thus far lacked an opportunity to engage in mangrove protection. Whether the disappearance of mangroves will affect their lives or not, the distribution of residents who feel either affected or not affected was relatively equal. A total of 74% of the residents still opted for cash when they chose the compensation method for the prohibition of mangrove development. When choosing the amount of compensation, more than half of the residents chose more than 500 USD as an appropriate amount. Another 11% of the residents indicated that they did not require compensation. When asked whether they would be willing to pay to protect the mangroves, only 53% of the residents chose this option. The residents were more willing to accept compensation than pay money. More than half of the residents chose to pay less than 100 USD, perhaps because they did not want to pay too much. When asked whether they were willing to participate in mangrove protection by means of labor, 66% of the residents chose this option. Therefore, although they did not want to protect the mangroves by payment, labor was still an acceptable option.
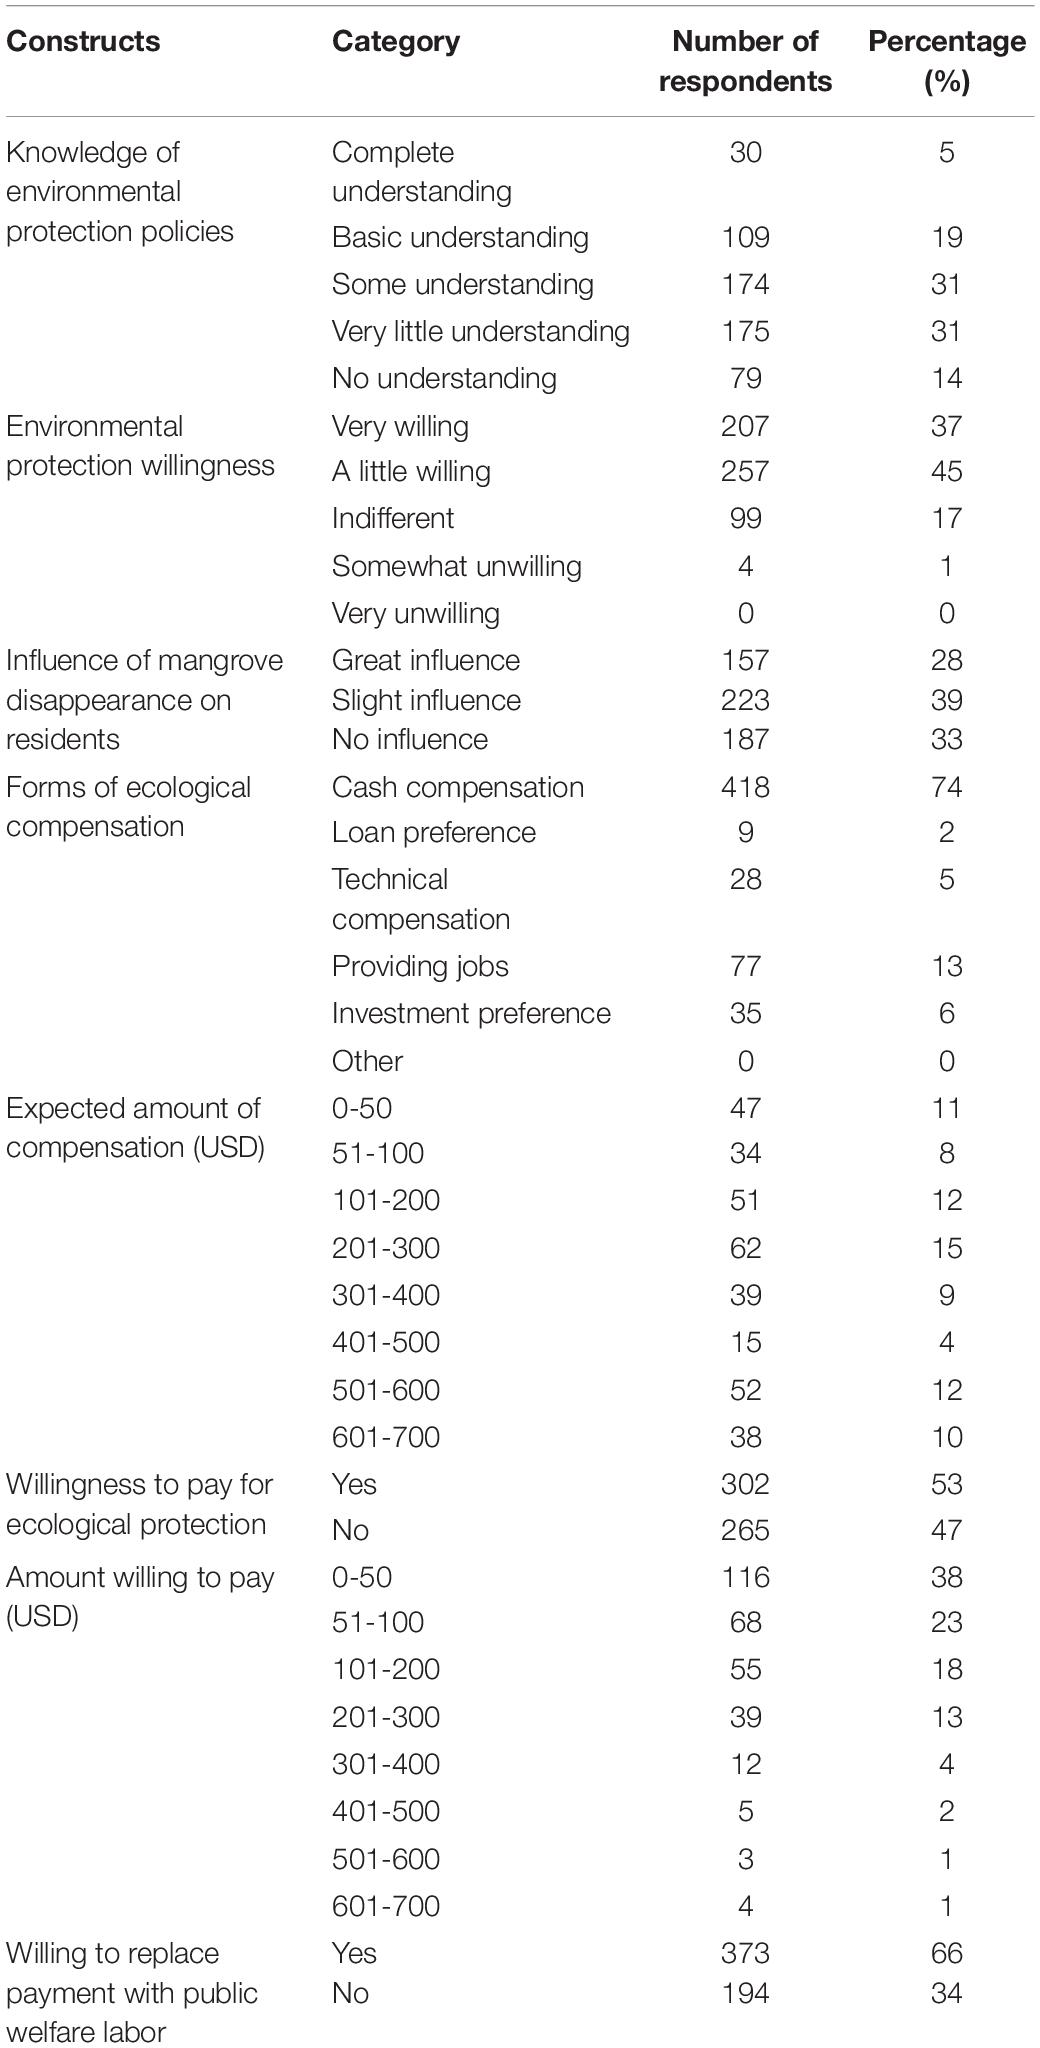
Table 3. Residents’ environmental protection and willingness to pay.
The distribution of accessibility based on “willingness to pay governance costs for the protection of mangroves” and “willingness to be compensated for the prohibition of development for the protection of mangroves” is shown in Figures 8, 9. This reflects the intensity of the ecological spillover effect of mangroves.
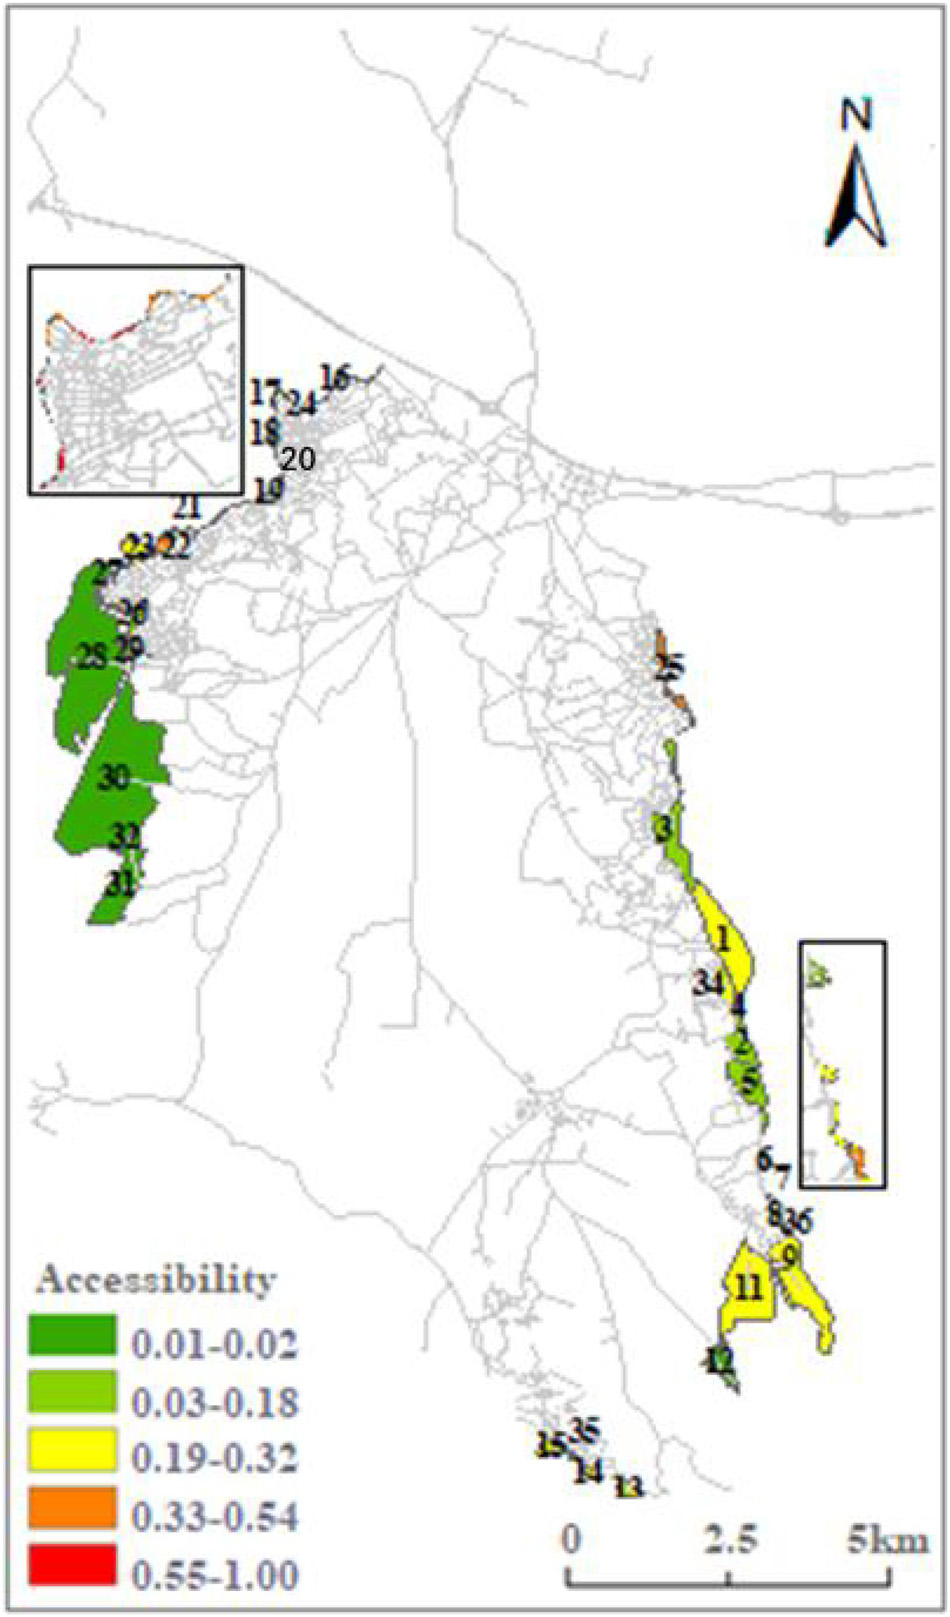
Figure 8. Accessibility of the willingness of residents to pay.
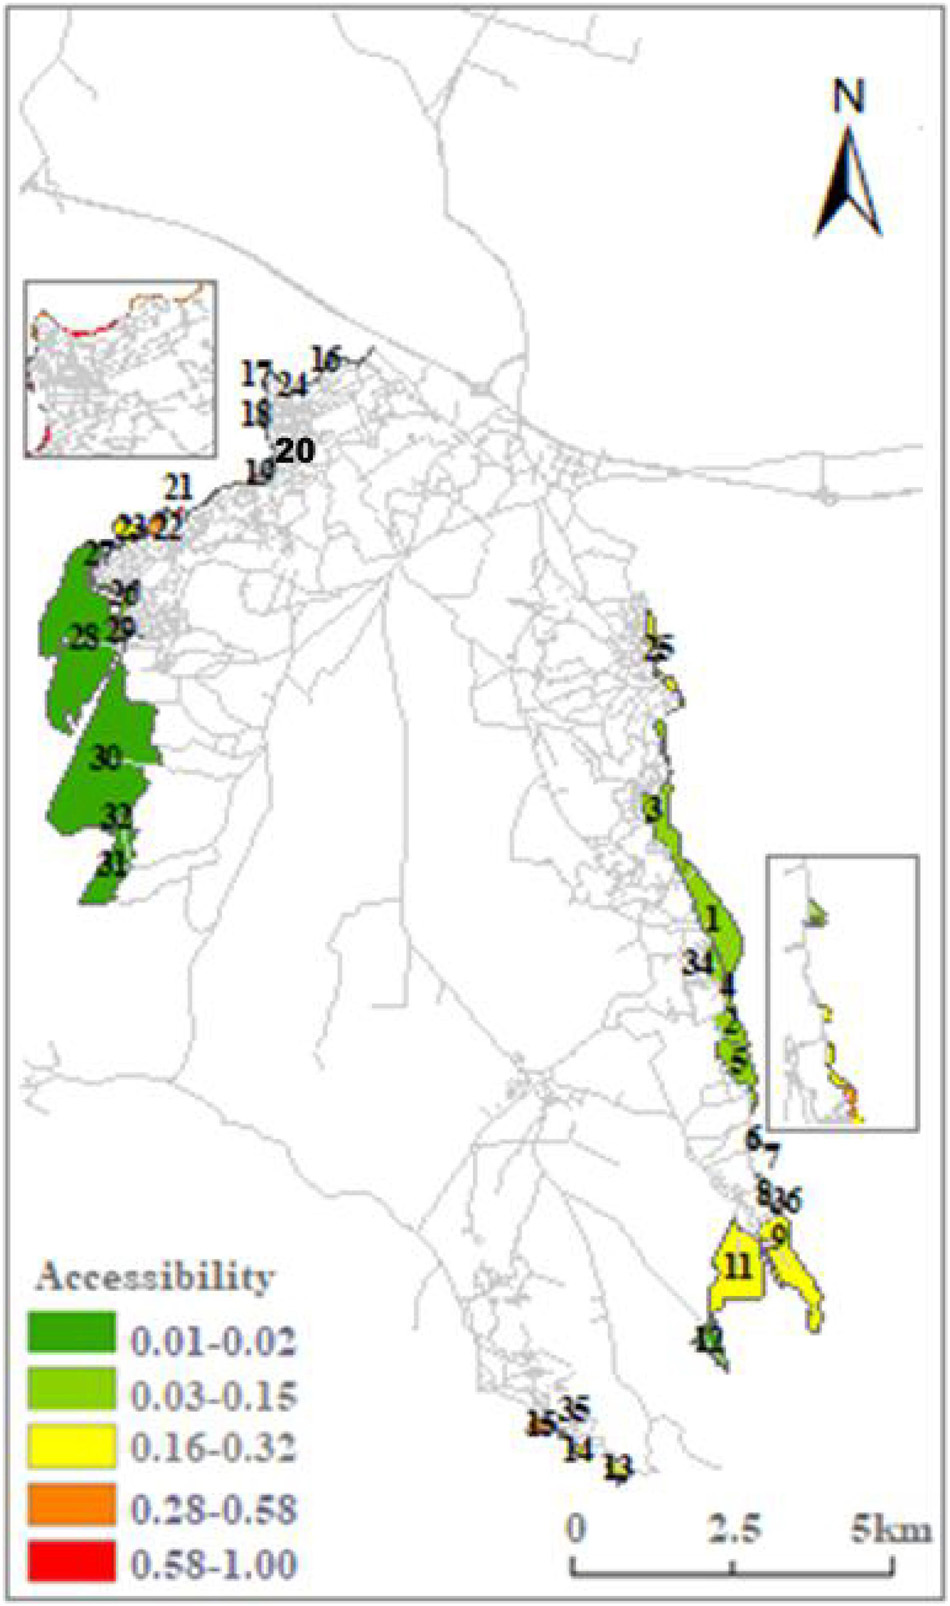
Figure 9. Accessibility of the willingness of residents to receive compensation.
Residents who agree with mangrove protection and are willing to pay more fees have higher accessibility to mangroves in the region. The spillover mechanism of ecological externalities was also more apparent. It is obvious that the situation in Figure 9 is more similar to the accessibility calculated by the livelihood category of residents, while the situation in Figure 8 is more similar to the accessibility of the willingness of residents to protect mangrove forests, as shown in Figure 7. This could be because the residents’ WTP is basically based on their annual income or on their living conditions. The residents that were willing to pay high compensation had higher accessibility to mangroves, while the residents choosing a low compensation price had lower accessibility to mangroves. The WTP more reflected the subjective willingness of residents. Even if their livelihood does not rely on mangroves, if the residents’ entertainment is highly related to mangroves, this will also lead to increased accessibility.
Accessibility Measured by Mangrove Ecosystem Service Values
Based on the composition of each part in the calculation formula of wetland comprehensive value, the size of the area of mangroves substantially affects the comprehensive ecological value of the region. However, the perception of wetland ecological service attributes based on the experience of residents will cause the actual ecological spillover effect distribution to vary in different situations. To reflect the necessity to comprehensively weigh the mangrove ecological services, this study should show the difference in accessibility measured by area and comprehensive value. First, the area size of different blocks is shown in Table 4. Next, based on the measurement method of Section “Comprehensive Calculations of the Service Values of Mangrove Ecosystems,” the ecological service value of different blocks after empowerment is shown in Table 5.
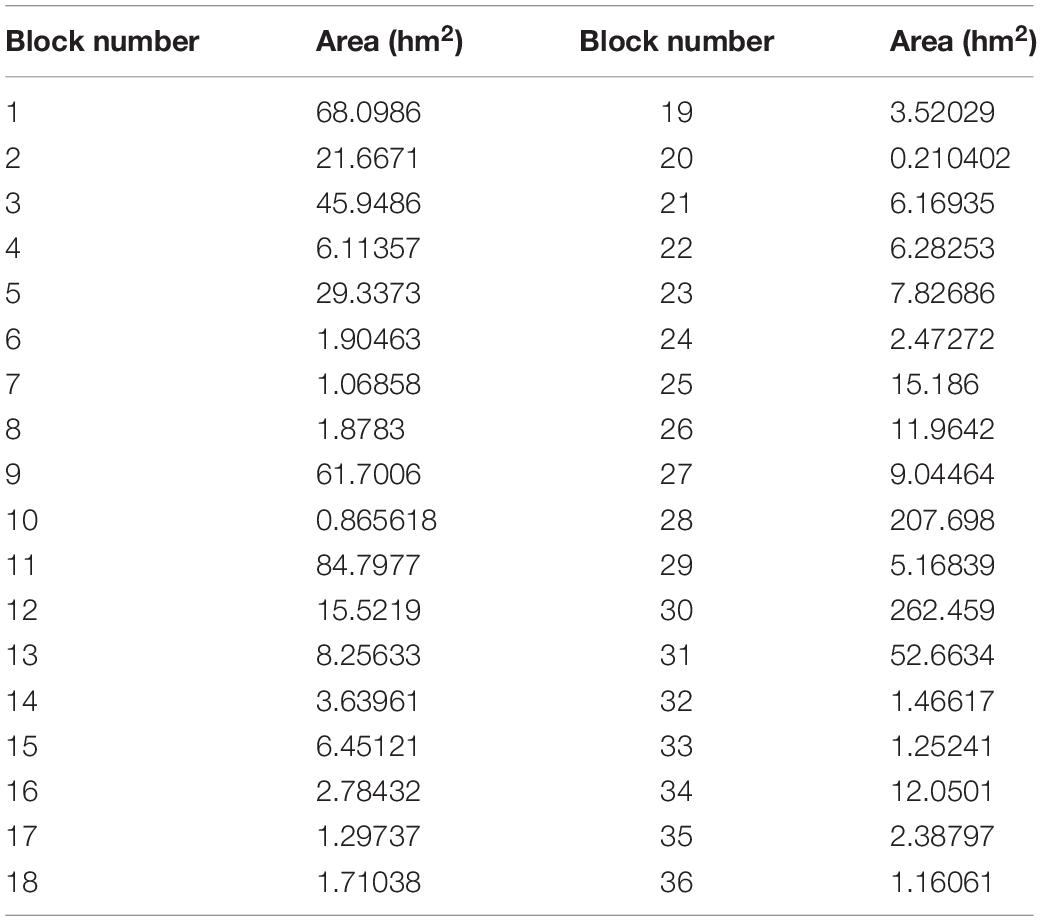
Table 4. The area of different blocks.
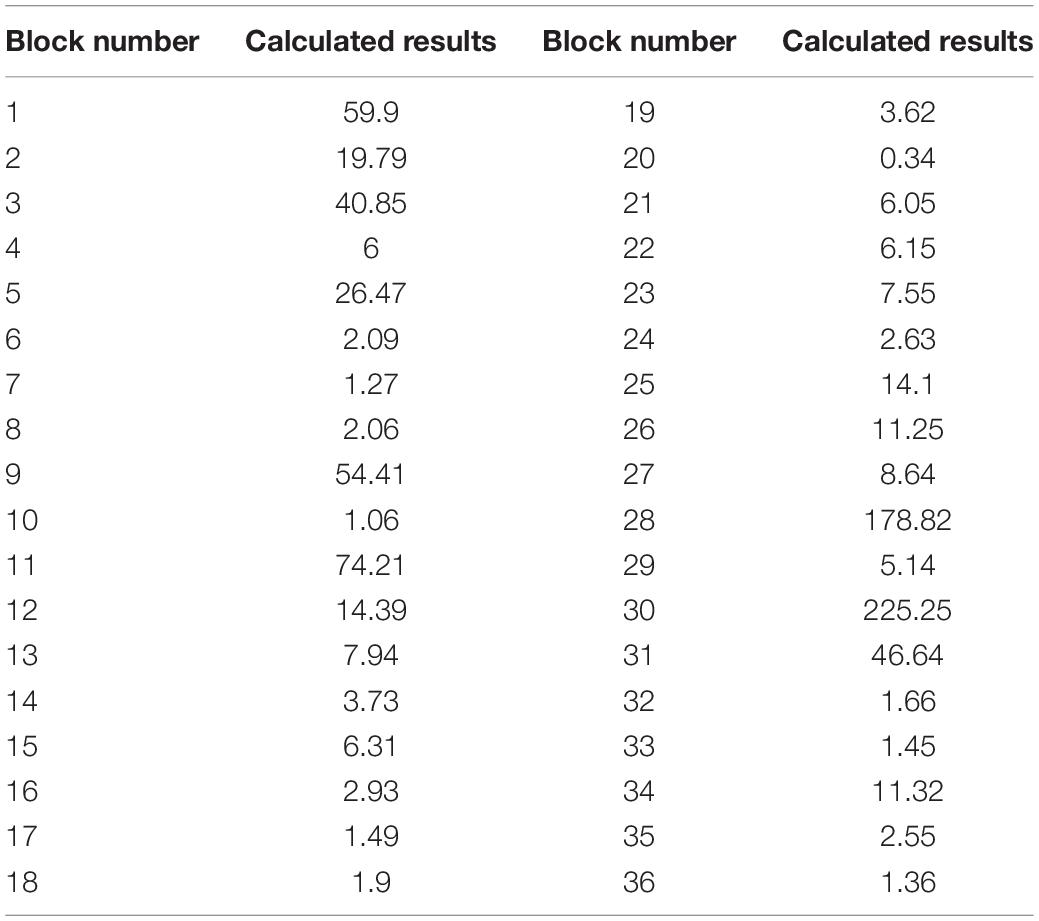
Table 5. Comprehensive calculation results of mangrove ecosystem service functions.
The accessibility distribution calculated by area is shown in Figure 10. The accessibility distribution calculated by the comprehensive weighted value of mangrove forests is shown in Figure 11.
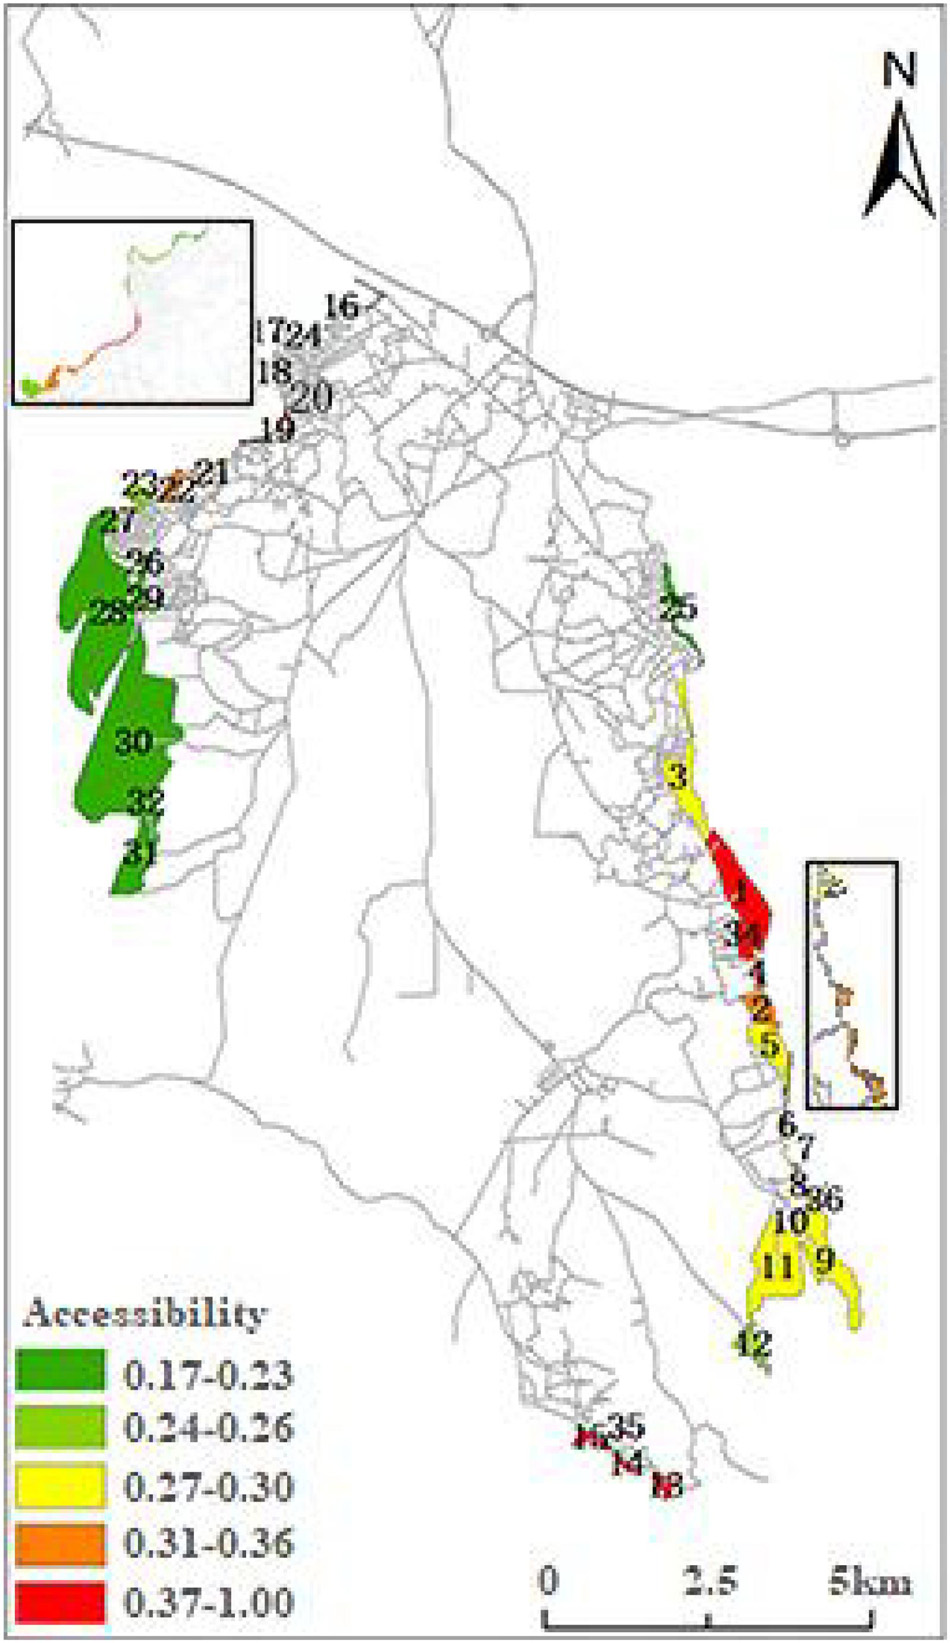
Figure 10. Accessibility calculated by area.
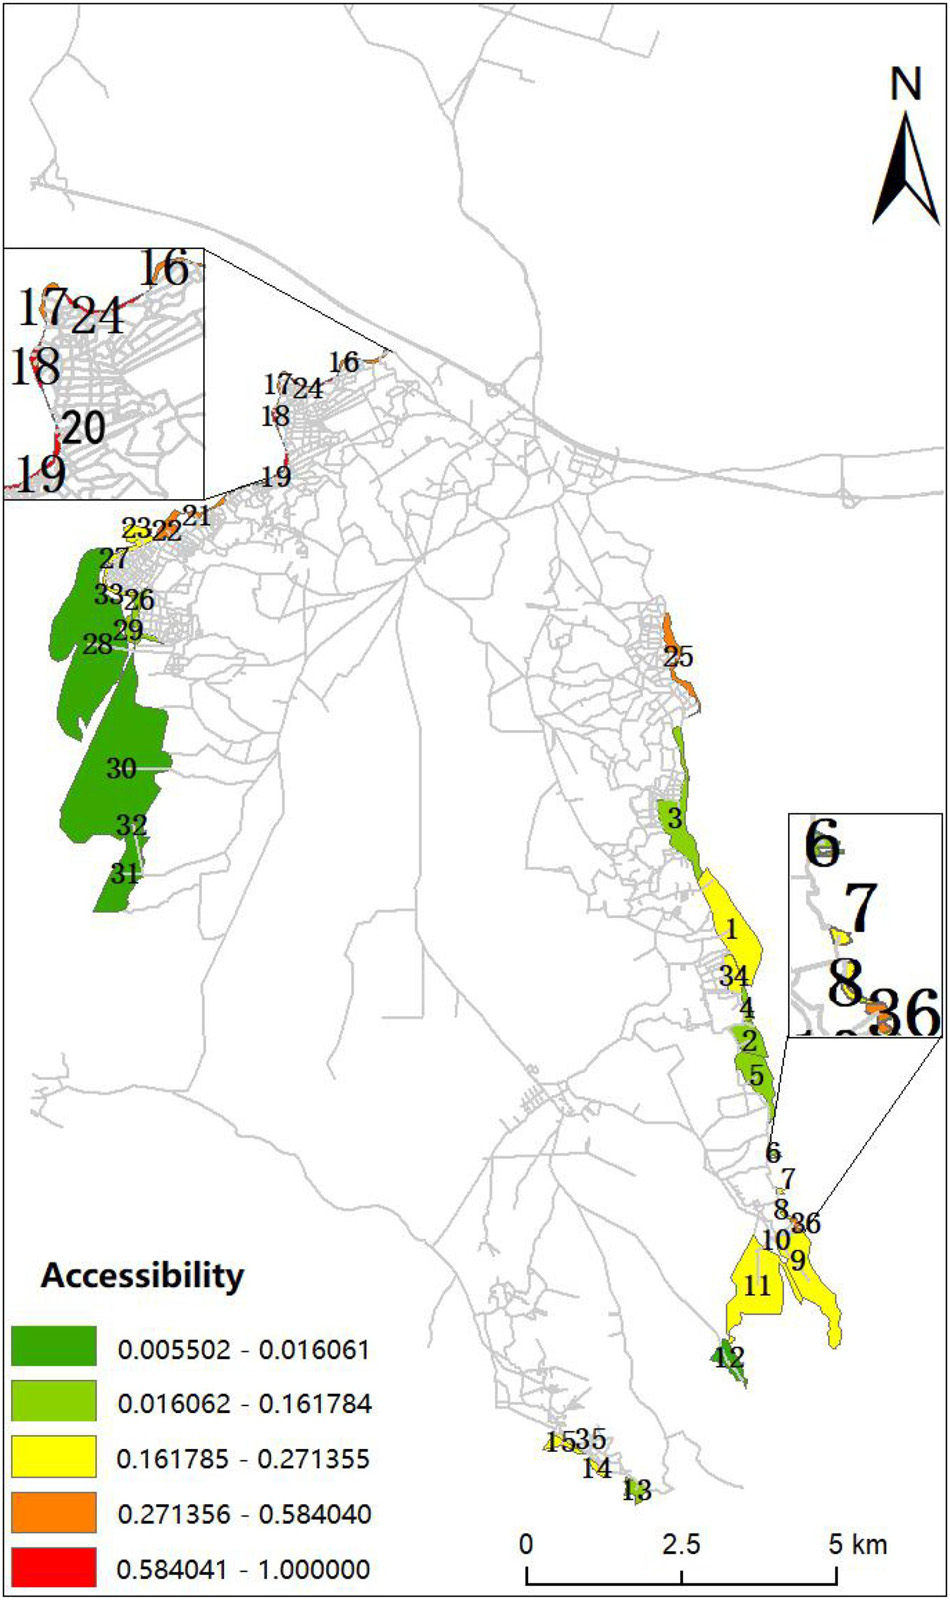
Figure 11. Accessibility calculated by the comprehensive weighted value of mangroves.
When the other conditions are the same, Figure 10 is the result of the use of the area as the measurement value, while Figure 11 is the result of using a comprehensive value. The results show that the accessibility of mangrove forests in eastern, southern, and northwestern regions differed significantly. In the east, the mangrove forests in Blocks 1, 2, 3, 4, 5, and 34 in Figure 10 were more accessible. However, Block 25 is more accessible in Figure 11 than in Figure 10. Owing to their small areas, the accessibility of Blocks 16, 17, 18, and 24 in the northwest region and Blocks 6, 7, 8, and 36 in the eastern region can be ignored. In the southern region, the accessibility in Figure 10 is significantly higher than in Figure 11. The opposite is true in the northwestern region. In Figure 11, the accessibility of mangrove forests in the northwest region is high. In Figure 10, with the exception of Blocks 19, 21, and 22, the remaining blocks are low. Since Figure 10 only examines by area, the larger mangroves are necessarily dominant, with the exception of some special mangroves. However, Figure 11 uses the comprehensive value. After considering the cognition of residents, mangroves with smaller relative areas have higher accessibility. This reflects the residents’ different core needs for mangroves.
In summary, hard-to-reach mangroves, such as those that are far away and have low network density, will only produce a weak ecological spillover effect, even if the area is large. Mangroves that are close by and can be easily reached can more effectively attract surrounding residents and produce a strong ecological spillover effect.
Discussion
The Impact of Residents’ Personal Characteristics on the Ecological Spillover Effect
This study discusses ecological externalities from a new perspective. Based on environmental economics, a supply demand relationship exists between an ecosystem and residents. As the concept of the payments for ecosystem services (PES) approach points out, we should not treat near-ecological residents as “polluters” or “environmental spoilers” but as potential or unrecognized ES providers (Van Hecken and Bastiaensen, 2010). The results of this study show that the ecological externality effect depends on practical activities specific to humans. These findings indicate that previous studies have regarded the supply and demand sides as points without characteristics; the perspective of only focusing on the improvement of the unilateral characteristics of the supply and demand sides is also one-sided. As such, it is imperative to consider the relevance of the social behavior of residents with regard to the surrounding ecosystems.
Our findings also suggest that the spillover mechanism of coastal ecological externalities represented by mangroves follows the principle of distance attenuation to some extent, but is more affected by the willingness of residents. This study further expands the research of Croson and Gneezy (2009) by subdividing residents. Even non-direct users of natural resources are affected by the ecological spillover effect under the influence of the social atmosphere and local policy propaganda. In implementing ecological protection efforts, this study supports the efforts of policymakers to consider the interests and individual will of the inhabitants of different regions.
The Association Between Willingness to Pay/Compensation of the Residents and Ecological Spillover Effect
The ecological compensation theory proposed by Pigou (1950) is flawed, owing to its low flexibility and low operational efficiency. Most human activities related to ecosystem protection have positive externalities. Simultaneously, destruction, pollution, and a reduction in the size of the area will be produced. However, the externality generated by the ecosystem itself is often ignored when addressing economic decisions from an individual perspective. In the absence of compensation measures, people who benefit from the destruction of the environment will not stop their behavior, and people who were originally a party to protection will also give up because they will not achieve their goals.
As Bithas and Nijkamp (2006) proposed, the individual evaluation of environmental externalities is constrained by the inevitable “time span effect” and “spatial range effect.” The inherent cognition of environmental impact and the externality of individuals is limited. The understanding of the monetary valuation of environmental value merits comprehensive consideration, along with the duration of environmental impacts on ecological function services. Simultaneously, the space of ecological welfare perceived by individuals is closely related to the expansion environment of social and economic activities.
The results of this study verify the mutual influence between the WTP/receive and mangrove ecological spillover benefits. In fact, owing to the varying characteristics of different ecosystems, the use of uniform standards cannot help to improve the efficiency of ecological protection, but the heterogeneous diversified payment standards based on reality can help to improve the efficiency of capital use (Claassen et al., 2008). The differences in the living environment and socio-economic development will result in spatial heterogeneity of residents’ preferences (Khan et al., 2018; Šebo et al., 2019), resulting in large spatial differences in the residents’ WTP for improved eco-environmental services. Based on the findings of this survey, the amount of environmental protection that residents are willing to pay cannot fully reflect the impact of the ecological spillover effect on residents. In economically underdeveloped regions, residents are still willing to maintain the ecological environment through voluntary labor. When defining the scope of wetland protection and formulating ecological compensation/payment policies, policymakers should not only take the value and distance of ecosystem services as the basis, but they should also consider the specific economic conditions and willingness of local residents to formulate more perfect schemes and solutions.
The Relationship Between Ecosystem Value Evaluation With Selective Preference and the Ecological Spillover Effect
The promise and potential of the ecosystem services (ES) paradigm are that it provides a theoretical and conceptual framing that directly links the natural environment and human well-being (Daily, 1997). Most ES studies almost completely calculate the total social value of ES, which causes that value to converge to a high level in some regions (Nelson et al., 2009; Polasky et al., 2011). Although these studies provide an important reference for the evaluation of environmental policies, it is difficult to design more reasonable protective measures for ecosystem service plans in the overall scale, including targeted payments (Reed et al., 2014) and the assessment of sustainable development goals at the forefront of sustainable development (Schröter et al., 2017). It is also difficult to address the role of access and property rights in gaining landscape benefits (Wieland et al., 2016; Robinson et al., 2018).
This study attempts to respond to a core challenge, namely to determine whether the contribution of multiple ESs to human beings can be measured on a fine scale to allow the subdivision of the interests of space or population groups of interest (Rieb et al., 2017). Robinson et al. (2019) explored the dependence of population groups at the family level by location and major livelihood types on the different types of ES. Based on previous experience, this study calculated the proportion of the importance of ecological services by the choices of residents and weighted the data to form a comprehensive value. This study provided residents with the opportunity to measure the contribution of different ESs to society. In contrast to previous studies regarding the ES value, which are based only on the overall size of the area, this study enriches the mode of application and scope of the model. After comparing the comprehensive results with the accessibility calculated by area, when only the area was considered, the accessibility of mangrove forests was higher when they were close and had a large area. The overall trend was also higher in the southeast, compared to the northwest. However, after incorporating the evaluation of residents, mangrove forests that are close, have a small area, and are easily reached are more accessible. In this case, the overall trend is high in the north and low in the south. Since large mangroves are basically located far away from villages, although they have high scores in the comprehensive evaluation of mangrove value, they have poor accessibility, because they have little impact on farmers and are difficult to reach. In fact, the evaluation of ES is also affected by the cognitive level and livelihood dependence of the residents. It is apparent from the results that, even in the same ecological region, significant differences will exist in the ES assessment in dispersed human communities. This also confirms the need to use and evaluate a more sophisticated perspective of ES, in order to improve efficiency and incorporate fairness into these policies.
However, several limitations of this study should be noted. First, there are some problems in the vector data of the study area in this article. Different from general research data that source official websites, is easily obtained and authoritative, in this study, the main research area was underdeveloped rural areas, mangroves, villages, and road networks. Data for these areas could not be directly obtained. As such, the obtained data could only be compared with previous data by using hand-generated remote sensing maps, which are not accurate. Secondly, since the 2SFCA model cannot fit two or more variables in one party, it can only obtain the accessibility of some types of residents to mangroves. The model can only be calculated by a single variable in the characteristics of residents and the comprehensive value of mangrove forests. However, the model cannot integrate different characteristics of the residents and can only be compared horizontally, based on chart superpositions. Third, when calculating the relative spatial distance between residents and mangroves, this article only uses tools that calculate the relative speed of traffic and the length of the road without considering the actual situation, including such factors as traffic conditions.
Conclusion
This study utilizes mangroves in Shankou Town as an example and combines this data with field surveys and geographical databases to generate an improved 2SFCA model in the field of ecology. The goal was to prove the possibility of using accessibility to represent the spatial spillover effect of ecological externalities. In this study, the mangrove ecosystem services and the characteristic data of surrounding residents are combined in space, and the degree of accessibility is used to represent the attraction of different types of residents to mangrove forests in different blocks. The findings show the spatial spillover mechanism of ecological externalities in coastal zones. The empirical results show that the spatial spillover mechanism is not only related to distance and accessibility but is also affected by the behavioral intention of the residents.
The surface 2SFCA model in this article can successfully combine the three elements of the human, ecosystem, and spatial distance. Simultaneously, the model emphasizes the behavioral intention of residents as a bridge for mangroves, to reflect the spatial spillover effect. This makes it possible to measure the intensity of the accessibility of different types of residents to mangroves. Based on the results of Section “Accessibility Measured by the Individual Characteristics,” this study verifies the hypothesis that the residents who have a close connection between their livelihoods and ecological protection areas, with more links to ecological protection areas and strong willingness to protect, are more likely to be affected by the ecological spillover effect of ecological protection areas. Based on the results in Section “Accessibility Measured by Willingness to Pay,” this study postulates that the willingness of residents to pay and the spillover effect of the ecological protection zone affect each other, and the intensity of this effect can be used as the basis upon which to judge compensation or payment for residents in different situations. For example, it is necessary to increase compensation for groups whose main income sources are extremely dependent on the ecological environment. Conversely, residents whose main business is to work in the field can have their compensation standard reduced. Based on the results of Section “Accessibility Measured by Mangrove Ecosystem Service Values,” this study improves on previous studies that based the method of calculating ecological value on the facility area as an indicator. Our approach enriches the mode of application and scope of the model. The method of calculating the ecological spillover effect represented by the intensity of accessibility can also be applied to other ecological protected areas. Different types of ecological protected areas have their own unique geographical characteristics, but the idea of establishing links between residents and ecological protected areas through work and life is common.
The research methods of this study provide an available tool that can be used to clarify the relationship and impact between ecosystems and residents. The methods also provide targeted protection compensation policies that are based on data, and they promote the reasonable setting of protection funds. The results will provide relevant information for local decision makers to manage protected areas. In the follow-up study, we will further improve the practicability of the 2SFCA model and explore ways to improve the fitting degree between variables, to more effectively explain the relationship between the internal factors of the ecological spillover effect.
Data Availability Statement
The original contributions presented in the study are included in the article/supplementary material, further inquiries can be directed to the corresponding author/s.
Ethics Statement
The studies involving human participants were reviewed and approved by the Medical Ethics Committee of Guangxi University. The participants provided their informed consent to participate in this study.
Author Contributions
HW: supervision, writing–reviewing and editing. QZ: data curation, writing–original draft preparation, visualization. SL: software, validation. XY: revision, writing–reply comments. All authors read and approved the final version of the manuscript.
Funding
This study was supported by the National Social Sciences Fund of China (19BGL008).
Conflict of Interest
The authors declare that the research was conducted in the absence of any commercial or financial relationships that could be construed as a potential conflict of interest.
Publisher’s Note
All claims expressed in this article are solely those of the authors and do not necessarily represent those of their affiliated organizations, or those of the publisher, the editors and the reviewers. Any product that may be evaluated in this article, or claim that may be made by its manufacturer, is not guaranteed or endorsed by the publisher.
References
Amiri, S., Espenschied, J. R., Roll, J. M., and Amram, O. (2019). Access to primary care physicians and mortality in Washington State: application of a 2logtep floating catchment area. J. Rural Health 36, 292–299. doi: 10.1111/jrh.12402
Ansuategi, A., and Escapa, M. (2002). Economic growth and greenhouse gas emissions. Ecol. Econ. 40, 23–37. doi: 10.1016/S0921-8009(01)00272-5
Balado-Naves, R., Baños-Pino, J. F., and Mayor, M. (2018). Do countries influence neighbouring pollution? A spatial analysis of the EKC for CO2 emissions. Energy Policy 123, 255–279. doi: 10.1016/j.enpol.2018.08.059
Bateman, I. J., Day, B. H., Georgiou, S., and Lake, I. (2005). The aggregation of environmental benefit values: welfare measures, distance decay and total WTP. Ecol. Econ. 50, 450–450. doi: 10.1016/j.ecolecon.2006.04.003
Bithas, K. (2011). Sustainability and externalities: are the internalization of externalities a sufficient condition for sustainability? Ecol. Econ. 70, 1703–1705. doi: 10.1016/j.ecolecon.2011.05.014
Bithas, K., and Nijkamp, P. (2006). Operationalising ecologically sustainable development at the micro level: pareto optimality and the preservation of biologically crucial levels. Int. J. Environ. Sustain. Dev. 5, 126–146. doi: 10.1504/IJESD.2006.009377
Bockstael, N. E. (1996). Modeling economics and ecology: the importance of a spatial perspective. Am. J. Agric. Econ. 78, 1158–1180. doi: 10.2307/1243487
Boone, C. G., Buckley, G. L., Grove, J. M., and Sister, C. (2009). Parks and people: an environmental justice inquiry in Baltimore, Maryland. Ann. Assoc. Am. Geogr. 99, 757–787. doi: 10.1080/00045600903102949
Bosetti, V., Carraro, C., Massetti, E., and Tavoni, M. (2008). International energy R&D spillovers and the economics of greenhouse gas atmospheric stabilization. Energy Econ. 30, 2912–2929. doi: 10.1016/j.eneco.2008.04.008
Bulte, E. H., Damania, R., and Deacon, R. T. (2005). Resource intensity, institutions, and development. World Dev. 33, 1029–1044. doi: 10.1016/j.worlddev.2005.04.004
Cheng, Y., Wang, J., and Rosenberg, M. W. (2012). Spatial access to residential care resources in Beijing, China. Int. J. Health Geogr. 11:32. doi: 10.1186/1476-072X-11-32
Christie, M., Fazey, I., Cooper, R., Hyde, T., and Kenter, J. O. (2012). An evaluation of monetary and non-monetary techniques for assessing the importance of biodiversity and ecosystem services to people in countries with developing economies. Ecol. Econo. 83, 57–78. doi: 10.1016/j.ecolecon.2012.08.012
Ciftcioglu, G. C. (2017). Assessment of the relationship between ecosystem services and human wellbeing in the social-ecological landscapes of Lefke Region in North Cyprus. Landsc. Ecol. 32, 897–913. doi: 10.1007/s10980-017-0494-y
Claassen, R., Cattaneo, A., and Johansson, R. (2008). Cost-effective design of agri-environmental payment programs: us experience in theory and practice. Ecol. Econo. 65, 737752. doi: 10.1016/j.ecolecon.2007.07.032
Croson, R., and Gneezy, U. (2009). Gender differences in preferences. J. Econ. Lit. 47, 448–474. doi: 10.1257/jel.47.2.448
Dai, D. (2011). Racial/ethnic and socioeconomic disparities in urban green space accessibility: where to intervene? Landsc. Urban Plan. 102, 234–244. doi: 10.1016/j.landurbplan.2011.05.002
Dai, D., and Wang, F. (2011). Geographic disparities in accessibility to food stores in southwest Mississippi. Environ. Plann. B Plann. Des. 38, 559–577. doi: 10.1068/b36149
Daily, G.C.(ed) (1997). “Introduction: what are ecosystem services,” in Nature’s Services: Societal Dependence on Natural Ecosystems, (Washington, DC: Island Press).
Dalvi, M. Q., and Martin, K. M. (1976). The measurement of accessibility: some preliminary results. Transportation 5, 17–42. doi: 10.1007/BF00165245
De Groot, R., Brander, L., Van Der Ploeg, S., Costanza, R., Bernard, F., Braat, L., et al. (2012). Global estimates of the value of ecosystems and their services in monetary units. Ecosyst. Serv. 1, 50–51. doi: 10.1016/j.ecoser.2012.07.005
Defeo, O., McLachlan, A., Schoeman, D. S., Schlacher, T. A., Dugan, J., Jones, A., et al. (2009). Threats to sandy beach ecosystems: a review. Estuar. Coast. Shelf Sci. 81, 1–12. doi: 10.1016/j.ecss.2008.09.022
Dony, C. C., Delmelle, E. M., and Delmelle, E. C. (2015). Re-conceptualizing accessibility to parks in multi-modal cities: a Variable-width Floating Catchment Area (VFCA) method. Landsc. Urban Plann. 143, 90–99. doi: 10.1016/j.landurbplan.2015.06.011
Feng, T., Du, H., Lin, Z., and Zuo, J. (2020). Spatial spillover effects of environmental regulations on air pollution: evidence from urban agglomerations in China. J. Environ. Manag. 272:110998. doi: 10.1016/j.jenvman.2020.110998
Field, B. C., and Field, M. K. (2009). Environmental Economics an Introduction, 5edn Edn. New York, NY: McGraw Hill.
Geurs, K. T., and Van Wee, B. (2004). Accessibility evaluation of land-use and transport strategies: review and research directions. J. Transp. Geogr. 12, 127–140. doi: 10.1016/j.jtrangeo.2003.10.005
Ghermandi, A., Ding, H., and Nunes, P. A. (2013). The social dimension of biodiversity policy in the European Union: valuing the benefits to vulnerable communities. Environ. Sci. Policy 33, 195–208. doi: 10.1016/j.envsci.2013.06.004
Hanauer, M. M., and Reid, J. (2017). Valuing urban open space using the travel-cost method and the implications of measurement error. J. Environ. Manag. 198, 50–55. doi: 10.1016/j.jenvman.2017.05.005
Hansen, W. G. (1959). How accessibility shapes land use. J. Am. Inst. Plann. 25, 73–75. doi: 10.1080/01944365908978307
Incera, A. C., Avelino, A. F., and Solís, A. F. (2017). Gray water and environmental externalities: international patterns of water pollution through a structural decomposition analysis. J. Clean. Prod. 155, 1174–1187. doi: 10.1016/j.jclepro.2017.07.200
Jaffe, A. B., Newell, R. G., and Stavins, R. N. (2005). A tale of two market failures: technology and environmental policy. Ecol. Econ. 54, 154–174. doi: 10.1016/j.ecolecon.2004.12.027
Jørgensen, S. L., Olsen, S. B., Ladenburg, J., Martinsen, L., Svenningsen, S. R., and Hasler, B. (2013). Spatially induced disparities in users’ and non-users’ WTP for water quality improvements—Testing the effect of multiple substitutes and distance decay. Ecol. Econ. 92, 58–66. doi: 10.1016/j.ecolecon.2012.07.015
Joseph, A. E., and Bantock, P. R. (1982). Measuring potential physical accessibility to general practitioners in rural areas: a method and case study. Soc. Sci. Med. 15, 85–90. doi: 10.1016/0277-9536(82)90428-2
Kareiva, P., Watts, S., McDonald, R., and Boucher, T. (2007). Domesticated nature: shaping landscapes and ecosystems for human welfare. Science 315, 1855–1859. doi: 10.1126/science.1140170
Khan, A. A. (1992). An integrated approach to measuring potential spatial access to health care services. Socioeconomic Plann. Sci. 25, 275–287. doi: 10.1016/0038-0121(92)90004-O
Khan, I., Zhao, M., Ullah Khan, S., Yao, L., Ullah, A., and Xu, T. (2018). Spatial heterogeneity of preferences for improvements in river basin ecosystem services and its validity for benefit transfer. Ecol. Indic. 93, 627–637. doi: 10.1016/j.ecolind.2018.05.018
Klaiber, H. A., and Phaneuf, D. J. (2009). Do sorting and heterogeneity matter for open space policy analysis? An empirical comparison of hedonic and sorting models. Am. J. Agric. Econ. 91, 1312–1318. doi: 10.1111/j.1467-8276.2009.01303.x
Lautenbach, S., Kugel, C., Lausch, A., and Seppelt, R. (2011). Analysis of historic changes in regional ecosystem service provisioning using land use data. Ecol. Indic. 11, 575–587. doi: 10.1016/j.ecolind.2010.09.007
Lavorel, S., and Grigulis, K. (2012). How fundamental plant functional trait relationships scale-up to trade-offs and synergies in ecosystem services. J. Ecol. 100, 128–140. doi: 10.1111/j.1365-2745.2011.01914.x
Li, M., Li, C., and Zhang, M. (2018). Exploring the spatial spillover effects of industrialization and urbanization factors on pollutants emissions in China’s Huang-Huai-Hai region. J. Clean. Prod. 195, 154–162. doi: 10.1016/j.jclepro.2018.05.186
Lin, Z., Wang, S., and Yang, L. (2020). Motivating innovation alliance’s environmental performance through eco-innovation investment in a supply chain. J. Clean. Prod. 269, 122361. doi: 10.1016/j.jclepro.2020.122361
Liu, J., Mooney, H., Hull, V., Davis, S. J., Gaskell, J., Hertel, T., et al. (2015). Systems integration for global sustainability. Science 347:1258832. doi: 10.1126/science.1258832
Liu, Y., He, Q., Tan, R., Zhou, K., Liu, G., and Tang, S. (2016). Urban growth modeling based on a game between Residents and governments: case study of urban fringe in Wuhan, Hubei Province in China. J. Urban Plann. Dev. 142:04015018. doi: 10.1061/(ASCE)UP.1943-5444.0000304
Luck, G. W., Chan, K. M., and Fay, J. P. (2009). Protecting ecosystem services and biodiversity in the world’s watersheds. Conserv. Lett. 2, 179–188. doi: 10.1111/j.1755-263X.2009.00064.x
Luo, W., and Qi, Y. (2009). An enhanced two-step floating catchment area (E2SFCA) method for measuring spatial accessibility to primary care physicians. Health Place 15, 1100–1107. doi: 10.1016/j.healthplace.2009.06.002
Luo, W., and Wang, F. (2003). Measures of spatial accessibility to health care in a GIS environment: synthesis and a case study in the Chicago region. Environ. Plann. B Plann. Des. 30, 855–884. doi: 10.1068/b29120
McGrail, M. R. (2012). Spatial accessibility of primary health care utilising the two step floating catchment area method: an assessment of recent improvements. Int. J. Health Geogr. 11:50. doi: 10.1186/1476-072X-11-50
Naidoo, R., Balmford, A., Costanza, R., Fisher, B., Green, R. E., Lehner, B., et al. (2008). Global mapping of ecosystem services and conservation priorities. Proc. Natl. Acad. Sci. U.S.A. 105, 9495–9500. doi: 10.1073/pnas.0707823105
Nelson, E., Mendoza, G., Regetz, J., Polasky, S., Tallis, H., Cameron, D. R., et al. (2009). Shaw Modeling multiple ecosystem services, biodiversity conservation, commodity production, and tradeoffs at landscape scales. Front. Ecol. Environ. 7:4–11. doi: 10.1890/080023
Pate, J., and Loomis, J. (1997). The effect of distance on willingness to pay values: a case study of wetlands and salmon in California. Ecol. Econ. 20, 199–207. doi: 10.1016/S0921-8009(96)00080-8
Polasky, S., Nelson, E., Pennington, D., and Johnson, K. A. (2011). The impact of land-use change on ecosystem services, biodiversity and returns to landowners: a case study in the state of Minnesota. Environ. Resour. Econ. 48, 219–242. doi: 10.1007/s10640-010-9407-0
Radke, J., and Mu, L. (2000). Spatial decompositions, modeling and mapping service regions to predict access to social programs. Geogr. Inform. Sci. 5, 105–112. doi: 10.1080/10824000009480538
Reed, M. S., Moxey, A., Prager, K., Hanley, N., Skates, J., Bonn, A., et al. (2014). Improving the link between payments and the provision of ecosystem services in agri-environment schemes. Ecosyst. Serv. 9, 44–53. doi: 10.1016/j.ecoser.2014.06.008
Richaume, J., Cheminée, A., Drap, P., Bonhomme, P., Cadene, F., Ferrari, B., et al. (2021). 3D photogrammetry modeling highlights efficient reserve effect apparition after 5 years and stillness after 40 for red coral (Corallium rubrum) conservation in french MPAs. Front. Mar. Sci. 8:639334. doi: 10.3389/fmars.2021.639334
Rieb, J. T., Chaplin-Kramer, R., Daily, G. C., Armsworth, P. R., Böhning-Gaese, K., Bonn, A., et al. (2017). When, where, and how nature matters for ecosystem services: challenges for the next generation of ecosystem service models. Bioscience 67, 820–833. doi: 10.1093/biosci/bix075
Robinson, B. E., Masuda, Y. J., Kelly, A., Holland, M. B., Bedford, C., Childress, M., et al. (2018). Incorporating land tenure security into conservation. Conserv. Lett. 11:e12383. doi: 10.1111/conl.12383
Robinson, B. E., Zheng, H., and Peng, W. (2019). Disaggregating livelihood dependence on ecosystem services to inform land management. Ecosyst. Serv. 36:100902. doi: 10.1016/j.ecoser.2019.100902
Rossi, R. E., Mulla, D. J., Journel, A. G., and Franz, E. H. (1992). Geostatistical tools for modeling and interpreting ecological spatial dependence. Ecol. Monogr. 52, 277–314. doi: 10.2307/2937096
Schmidt, K., Sachse, R., and Walz, A. (2016). Current role of social benefits in ecosystem service assessments. Landsc. Urban Plann. 149, 49–54. doi: 10.1016/j.landurbplan.2016.01.005
Schröter, M., Stumpf, K. H., Loos, J., van Oudenhoven, A. P. E., Böhnke-Henrichs, A., and Abson, D. J. (2017). Refocusing ecosystem services towards sustainability. Ecosyst. Serv. 25, 35–43. doi: 10.1016/j.ecoser.2017.03.019
Scoones, I. (2009). Livelihoods perspectives and rural development. J. Peasant Stud. 36, 171–196. doi: 10.1080/03066150902820503
Šebo, J., Gróf, M., and Šebová, M. (2019). A contingent valuation study of a polluted urban lake in Košice, Slovakia: the case of the positive distance effect. J. Environ. Manage. 243, 331–339. doi: 10.1016/j.jenvman.2019.05.051
Song, M., Wu, J., Song, M., Zhang, L., and Zhu, Y. (2020). Spatiotemporal regularity and spillover effects of carbon emission intensity in China’s Bohai Economic Rim. Sci. Total Environ. 740:140184. doi: 10.1016/j.scitotenv.2020.140184
Su, B., and Ang, B. W. (2014). Input–output analysis of CO2 emissions embodied in trade: a multi-region model for China. Appl. Energy 1, 377–384. doi: 10.1016/j.apenergy.2013.09.036
Van Hecken, G., and Bastiaensen, J. (2010). Payments for ecosystem services: justified or not? A political view. Environ. Sci. Policy 13, 785–792. doi: 10.1016/j.envsci.2010.09.006
Vaz, E., Anthony, A., and McHenry, M. (2017). The geography of environmental injustice. Habitat Int. 59, 118–125. doi: 10.1016/j.habitatint.2016.12.001
Wan, N., Zou, B., and Sternberg, T. (2012). A three-step floating catchment area method for analyzing spatial access to health services. Int. J. Geogr. Inform. Sci. 25, 1073–1089. doi: 10.1080/13658816.2011.624987
Wang, F. (2012). Measurement, optimization, and effect of health care accessibility: a methodological review. Ann. Assoc. Am. Geogr. 102, 1104–1112. doi: 10.1080/00045608.2012.657146
Whitehead, J. C., Blomquist, G. C., Hoban, T. J., and Clifford, W. B. (1995). Assessing the validity and reliability of contingent values: a comparison of on-site users, off-site users, and non-users. J. Environ. Econ. Manag. 29, 238–251. doi: 10.1006/jeem.1995.1044
Keywords: spatial spillover effect, distance-decay effect, ecosystem, farmers, 2SFCA
Citation: Wang H, Zheng Q, Li S and Yang X (2021) The Closer the Better? Modeling Spatial Spillover Effects of Ecological Externalities in Coastal Mangroves. Front. Mar. Sci. 8:708772. doi: 10.3389/fmars.2021.708772
Received: 12 May 2021; Accepted: 27 September 2021;
Published: 18 October 2021.
Edited by:
Alberto Basset, University of Salento, ItalyReviewed by:
José Lino Vieira De Oliveira Costa, University of Lisbon, PortugalAlexandra Marçal Correia, University of Lisbon, Portugal
Copyright © 2021 Wang, Zheng, Li and Yang. This is an open-access article distributed under the terms of the Creative Commons Attribution License (CC BY). The use, distribution or reproduction in other forums is permitted, provided the original author(s) and the copyright owner(s) are credited and that the original publication in this journal is cited, in accordance with accepted academic practice. No use, distribution or reproduction is permitted which does not comply with these terms.
*Correspondence: Shuang Li, bGlzaHVhbmdfaGJ1ZUBzaW5hLmNvbQ==; Xiaoyu Yang, c3VwZXJfeXh5ODg4QDE2My5jb20=