 Chao-Chen Lai1
 Chau-Ron Wu2
 Chia-Ying Chuang1
 Jen-Hua Tai1
 Kuo-Yuan Lee1Hsiang-Yi Kuo1
 Fuh-Kwo Shiah1,3,4*
- 1Research Center for Environmental Changes, Academia Sinica, Taipei, Taiwan
- 2Department of Earth Sciences, National Taiwan Normal University, Taipei, Taiwan
- 3Institute of Oceanography, National Taiwan University, Taipei, Taiwan
- 4Institute of Marine Environment and Ecology, National Taiwan Ocean University, Keelung, Taiwan
Biogeochemical responses to mixing were examined in two cruise surveys along a transect across the Kuroshio Current (KC) in May and July 2020. Two stations located at the South China Sea (SCS)–KC mixing and the KC waters were chosen for the diel study. In the euphotic zone (~100 m depth), the average values of nitrate (0.97–1.62 μM), chlorophyll-a (Chl-a, 0.36–0.40 mg/m3), and primary production (PP; 3.46 ± 1.37 mgC/m3/day) of the mixing water station (MWS) of the two cruises were several folds higher than those of the KC station (KCS; nitrate, 0.03–0.10 μM; Chl-a, 0.14–0.24 mg/m3; and PP, 0.91 ± 0.47 mgC/m3/day). In the July cruise, the maximal bacterial production (BP) at the MWS (3.31 mgC/m3/day) was 82% higher in comparison with that of the KCS (1.82 mgC/m3/day); and the readings of Chl-a showed no trend with BP in the oligotrophic KCS, but a positive relationship was found among these measurements at the mesotrophic MWS. This implies that the trophic status of the system might affect phytoplankton–bacteria interactions. The backward-trajectory analyses conducted by an observation-validated three-dimensional model identified that the prevailing southwest monsoon drove a northeastward “intrusion” of the SCS waters in July 2020, resulted in mixing between SCS and Kuroshio (KC) waters off the east coast of southern Taiwan. For the first time, this study demonstrates that the high biological biomass and activities that occur in the KC are induced by the northward intrusion of the SCS waters.
Introduction
Planktons play a significant role in affecting the transformation and distribution of materials in aquatic ecosystems. Biological activities can be categorized into autotrophic (i.e., the formation of organic from inorganic) and heterotrophic (i.e., the consumption of organic to form inorganic) processes. For autotrophic processes, primary production (PP) is the formation rate of biogenic organic materials performed by phytoplankton in the ocean. In terms of C-cycling, the “biological pump” extracts carbon (through photosynthesis) from the “surface skin” of the ocean that interacts with the atmosphere, presenting a lower partial pressure of CO2 to the atmosphere and thus lowering its CO2 content (Sigman and Haug, 2006). This sequestration of CO2 from the atmosphere to the ocean interior highlights the importance of studying PP.
The dissolved organic carbon (DOC) inventory (~660 Giga-ton C) of the ocean roughly equals that of CO2 in the atmosphere (Hansell et al., 2009; Lønborg et al., 2020, and citations therein). Most oceanic DOC results from autochthonous food-web processes such as phytoplankton exudation, zooplankton/metazoans excretions, bacteriovory, and viral lysis. Prokaryotic heterotrophic bacteria (i.e., bacteria) are the key microorganisms responsible for the decomposition of DOC (Cho and Azam, 1988). This makes bacteria act as an “anti-biological pump” in the ocean (Azam, 1998; Azam and Malfatti, 2007).
The Kuroshio Current (KC), originating from the North Equatorial Current, is a western boundary current in the North Pacific Ocean. After bifurcating east of Mindanao, the north branch of the North Equatorial Current forms the KC, which flows along the east coasts of Luzon and Taiwan and trends northward along the continental slope of the East China Sea. The KC makes an important contribution to the thermohaline and momentum budgets of the North Pacific Ocean. At an annual scale, the KC frequently intrudes into the northern SCS (NSCS) through the Luzon Strait (Wu et al., 2017, and citations therein). The vertical distribution of the KC through the Strait mimics a sandwich structure: Water of KC enters the northern SCS at depths of 0–400 and ~1,500–3,000 m, and it returns to the western Pacific Ocean at intermediate depths of ~500–1,500 m (Nan et al., 2015). The annually averaged net volume flux through the Luzon Strait is ~2 Sv into the northern south china sea (NSCS) from May to January of the next year. From February to April, the net transport reverses from the NSCS to the Pacific (Xue et al., 2004). It is noted that the SCS–KC intrusion in the east–west direction has been addressed by many studies (Chou et al., 2007; Sheu et al., 2009), while the northward intrusion of SCS into KC has rarely been mentioned if it can be done.
From chemical and biological perspectives, the warm KC flow along the east coast of Taiwan had been viewed as an oligotrophic biome due to the limited supply of inorganic nutrients and low biological production in the euphotic zone (Shiah, 1999; Shiah et al., 2000; Tseng et al., 2005). Recent studies revealed satellite images showing high chlorophyll-a (Chl-a) concentration in this area (Cheng et al., 2020). However, the availability of primary and bacterial production (PP and BP) data in this area has been limited. Our two surveys were a biogeochemistry-oriented pilot study for designing a long-term project, which intends to study the potential contribution of the high chlorophyll areas to biogenic carbon production/export, local fishery (e.g., larvae and flying fishes), and dolphin sightseeing business. In addition, conducting surveys across KC enables us to compare phytoplankton–bacteria interactions under mesotrophic and oligotrophic conditions. It is noted that organic carbon export (or the biological pump) on the east coast of Taiwan could be unique since it has a very narrow shelf and steep slope, which might quicken the export into the deep sea. The Chl-a and PP data measured during cruise surveys can further be used for the ground truth of the satellite ocean color data.
Our previous temperature–salinity diagrams (Shiah, data not shown) indicated a mixing of the SCS and KC waters occurred around this area, and we suspected that the vertical shear/mixing between the two abovementioned water masses could generate the changes of physical, chemical, and thus biological properties in this area.
Materials and Methods
Stations and Sampling
Two surveys (May 12–16, 2020 and July 21–25, 2020) were performed at a transect across the KC east of Taiwan (Figure 1). The sampling schedule in the May cruise was impeded by an unexpected artillery fire drill. Therefore, water samples were repeatedly sampled every 12 h at stations 2 (4 hydrocasts) and 6 (3 hydrocasts), which represented the mixing water and KC water stations, respectively. In the July cruise, hydrocasts were deployed two times from stations 1–8 at the beginning and end of the cruise. Repeated sampling with ≥7 hydrocasts every 12 h for each station was conducted at these two diel stations. Water samples were taken within the upper 200 m by 20-L Go-Flo bottles from eight depths (10, 20, 30, 50, 80, 100, 150, and 200 m). The profiles of temperature (T), salinity (S), fluorescence, and underwater photosynthetic available radiance (PAR) were recorded by sensors attached to a CTD Rosette (General Oceanic Model 1015; General Oceanics, Miami, FL, USA). The typical T–S diagrams of the SCS and KC waters were derived from the averages of more than 200 historical hydrocasts in these two areas (data source, the Ocean Data Bank, Taiwan; http://www.odb.ntu.edu.tw/).
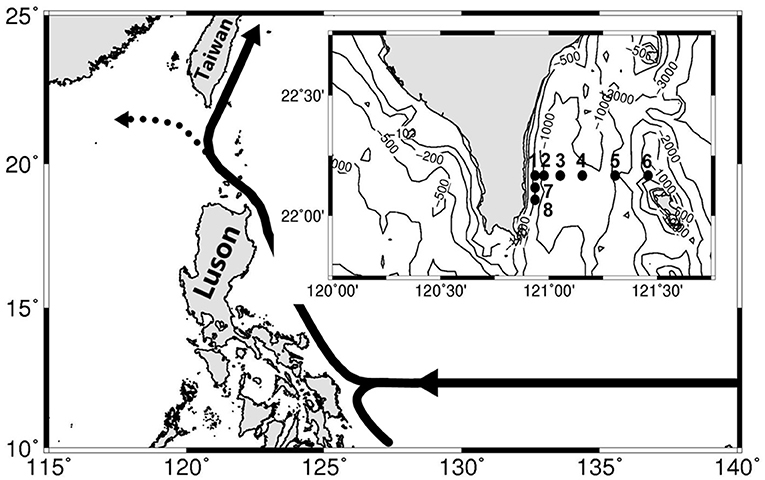
Figure 1. Map of southern Taiwan shows the sampling stations across the mainstream of the Kuroshio. The isovalue lines of bottom depth are also shown. Diel sampling was conducted at stations 2 and 6. The solid and dashed lines with arrows in the upper-left corner indicate the axes of the Kuroshio mean flow.
Numerical Modeling on Backward-Trajectory and Flow Pattern Analyses
The shipboard acoustic Doppler current profiler (ADCP; to measure current speed and direction) was out of order during both cruises. We used the numerical modeling method to simulate the most likely current flow pattern for this area when the July survey was conducted. A 14-day backward-trajectory floater simulation based on the current field at 15 m depth was obtained by the Hybrid Coordinate Ocean Model (HYCOM; GLBv0.08/expt_93.0). The release period was set as July 21–31, 2020, and releases were staggered at 3-h intervals. The velocity data are based on the HYCOM analysis. Furthermore, an observation-validated, three-dimensional model [Global Ocean Flux Study (GOFS) 3.1: 41-layer HYCOM + Navy Coupled Ocean Data Assimilation Global 1/12° Analysis; https://hycom.org] was used to simulate the flow pattern on July 22, 2020, in the vicinity of the study area. Temporal and spatial resolutions were 3-h and 1/10°, respectively. The data assimilation schemes such as the three-dimensional variation scheme and the improved synthetic ocean profiles were applied. Simulation plots were generated with MATLAB (R2019b, https://www.mathworks.com/).
Inorganic Nutrients, Chlorophyll-a, and Total Organic Carbon Concentrations
Inorganic nutrients (i.e., nitrate, phosphate, and silicate) and Chl-a concentrations were determined according to the methods of Parsons et al. (1984). Total organic carbon (TOC) was derived from the sum of particulate and dissolved organic carbon (POC and DOC). For POC, water samples (1–2 L) were filtered through a 200-μm mesh to remove zooplankton and then through 25-mm GF/F filters. POC concentrations were measured by a CHN analyzer (Fisons; NA1500). Samples for DOC were filtered through a GF/F filter. Filtrates were filled into precombusted 40-mL glass vials (Kimble). Samples were analyzed by a high-temperature catalytic oxidation method using a Shimadzu TOC 5000. The details of DOC measurement can be found in the study of Austria et al. (2018).
Bacterial Abundance, Production, and Growth Rate
The procedures of Gaso and Giorgio (2000) and Brussaard (2004) were followed for heterotrophic bacteria and other picophytoplankton counts. Water samples were fixed with the final concentrations of 1% paraformaldehyde (for viruses) and 0.1% glutaraldehyde (for bacteria) and then frozen with liquid nitrogen and stored at −80°C. Samples were stained with SYBR Green I and then incubated for 15 min at room temperature in the dark. The samples were run in a flow cytometer of CyFlow® Space (PARTEC) at a rate allowing <1,000 events per second to avoid particle coincidence. The bacterial activity was determined by 3H-thymidine incorporation (Fuhrman and Azam, 1982). After the injection of 3H-thymidine, water samples were incubated at in situ temperature for 2 h. Bacterial biomass (BB) and BP in C units were derived with thymidine and carbon conversion factors of 1.18 × 10¹⁸ cell/mole and 2 × 10¹⁴ gC/cell (Ducklow and Carlson, 1992), respectively. Bacterial (per cell) growth rate (Bμ) was calculated by diving production with biomass. The details of bacterial parameters can be found in the study of Austria et al. (2018).
Primary Production
Primary production (PP) was measured by the 14C assimilation method (Parsons et al., 1984) on board with seawater samples taken during the dawn. In brief, the 2:1 light/dark 250-mL clean polycarbonate bottles were filled with water samples. After H14 (final concentration, 10 μCi or 370 kBq/ml) inoculation, samples were wrapped with 10 neutral density LEE filters and incubated in a self-designed tank with an artificial light source (~2,000 μE/m2/s). Following retrieval, samples were filtered through GF/F filters, and the radioactivity was counted in a liquid scintillation counter (Packard 2000). The details of PP calculation can be found in the study of Austria et al. (2018). Three and two sets of PP measurements were conducted in the dawn at only stations 2 and 6, respectively. This was based on the protocols of the Joint Global Ocean Flux Study (JGOFS) (Knap et al., 1996) which recommend that PP should be measured using a water sample taken at dawn. The euphotic zone was defined as the depth to which 1% of surface light reaches.
Data Management and Statistical Analysis
For the May cruise, only the data of inorganic nutrients, Chl-a, and BB, were available. The bulk properties of measured variables were compared in terms of tempo-spatial (horizontal) variation by deriving depth-integrated (i.e., trapezoidal method) averaged values. The statistical analysis was performed using SPSSVR software version 12.0 (IBM, Armonk, NY, USA).
Results
Backward-Trajectory and Flow Pattern Analyses
Figure 2A shows the major current paths arriving at the south end of Taiwan in July. In the central path, floaters passed through the study area with a high percentage (i.e., >50%), which could be traced back to their source upstream in the Luzon Strait. The numerically simulated flow pattern (Figure 2B) presented a typical summer circulation regime when the southwest monsoon prevailed over the study area. After leaving the northern tip of Luzon Island, the northward-flowing Kuroshio (i.e., KC) mainstream followed a relatively straight pathway bypassing the Luzon Strait with less westward intrusion into the South China Sea (SCS). That is, most of the KC water returned to the east and continued its northward flow along the east coast of Taiwan (blue arrow). Meanwhile, a northeastward-flowing branch originating from the SCS (red arrow) joined the western flank of the KC off southeast Taiwan.
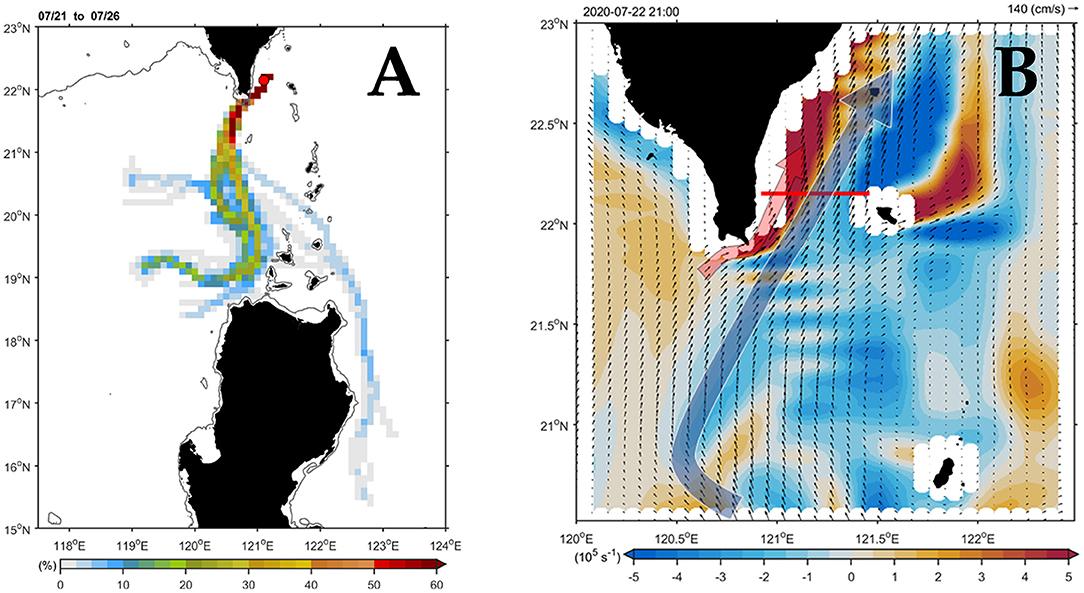
Figure 2. Three-dimensional numerical simulation of flow patterns in the study area. (A) Paths of the currents based on the backward-trajectory analyses. The horizontal color bar indicates the percentage for the arrival of the floater. The percentage is 100% in the releasing position (station 2; red dot; 22.15°N, 121.1°E). (B) Simulated flow patterns of the 15-m depth velocity (vector) and vorticity (shading) on July 22, 2020. The red line in (B) indicates the sampling transect.
Physical and Chemical Hydrography
In May, the temperature–salinity (T–S) diagrams of St. 2 indicated that the water mass was a mixture of the SCS and KC waters (Figures 3A–D). In contrast, the water properties of St. 6 were imaged with those of KC (Figures 3E–G). In the July cruise, similar to the findings recorded in May, the T–S diagrams of Sts. 8, 7, 1, and 2 were closest to the east coast of Taiwan, indicating that at the beginning of the sampling period, the water masses were a mixture of the SCS–KC waters (Figures 4A–D). Additionally, the signal of the SCS–KC mixing extended to Sts. 3 and 4 (Figures 4E,F). Stations 5 and 6 at the easternmost side were typical KC water (Figures 4G,H). For the ending-cast, the T–S properties of Sts. 7, 8, 1, 2, and 3 (Figures 4I–M) retained the SCS–KC mixing characteristics, while that of St. 6 (Figure 4P) was comparable to that of KC. The water masses of Sts. 4 and 5 (Figures 4N,O) tended to be more like KC water but still possessed some of the SCS–KC mixing signals in the deep water. Overall, the T–S results indicated that St. 4 (~33 km off the east coast) could be viewed as the east boundary of the SCS–KC mixing zone. Temperature profiles in May showed that the 25°C isotherm at St. 6 (Figure 5A) was located at depths of 80–100 m, while that of St. 2 (Figure 5E) fluctuated at depths of 50–60 m. Nitrate concentrations (NO3) at St. 6 (Figure 5B) and St. 2 (Figure 5F) ranged from <0.1 to 4.8 μM and from <0.1 to 10.6 μM, respectively. The area of the NO3-depletion zone at St. 6 (>120 m deep) was two times deeper than that of St. 2, which was ~50–60 m deep. In July, temperature profiles showed that the 25°C isotherm at St. 6 (Figure 6A) was located at depths of ~100 m, while that of St. 2 (Figure 7A) was positioned at depths of 40–60 m. NO3 concentrations at St. 6 (Figure 6B) and St. 2 (Figure 7B) ranged from <0.1 to 4.1 μM and from <0.1 to 14.0 μM, respectively. The area of the NO3-depletion zone at St. 6 (~100 m deep) was two times deeper than that of St. 2, which was ~50 m deep. It is noted that NO3 dropped to low values at the sixth sampling point at St. 2. Therefore, NO3 at 200 m depth was 0.78 μM, which was ~10 times lower than the 200-m readings (8.6–14.0 μM) of the other sampling points. Phosphate concentrations (i.e., SRP) collected from these two stations changed proportionally with NO3 with a relationship of NO3 = −0.24 + 13.45 × SRP, R2 = 0.99, n = 111, where R2 and n are the coefficients of determination and sampling size, respectively.
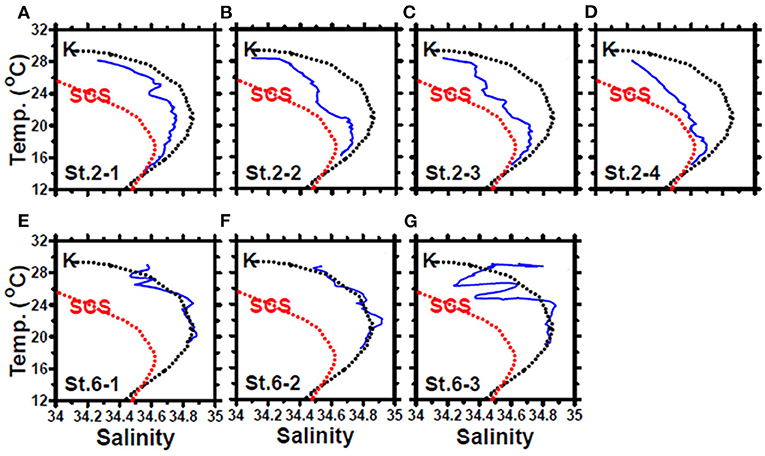
Figure 3. The temperature–salinity diagrams of the casts deployed at stations 2 (A–D) and 6 (E–G) of the May cruise. The black and red dashed lines represent the typical Kuroshio Current (KC) and South China Sea (SCS) waters, respectively. The data were collected from the Ocean Data Bank, Taiwan (http://www.odb.ntu.edu.tw/). The first and second numbers of the abbreviation St. x–x in each panel indicate the sampling station and the hydrocast deployed at that station, respectively.
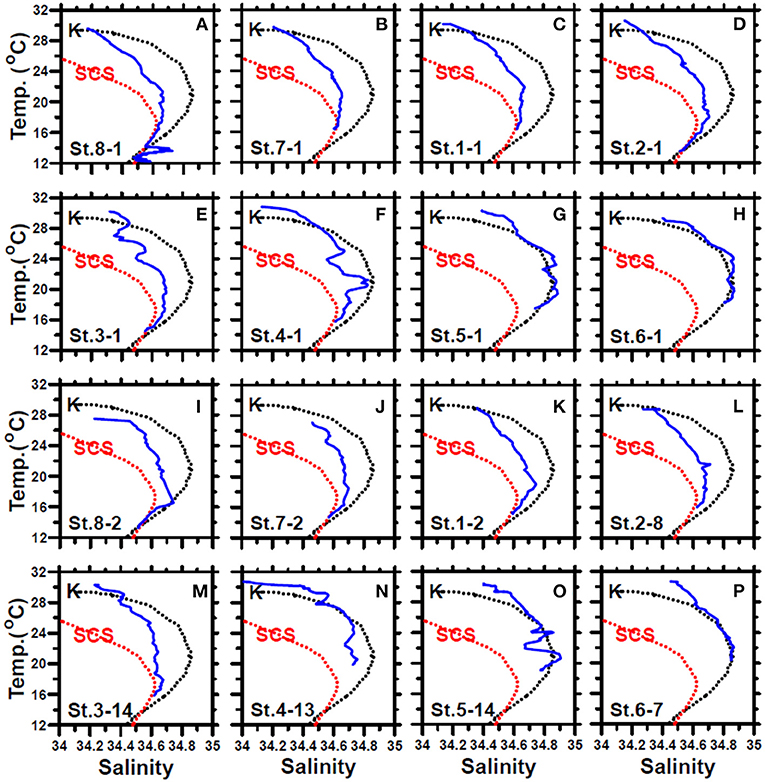
Figure 4. The temperature–salinity diagrams of the first-cast (blue lines) (A–H) and last-cast (I–P) deployed at stations 8, 7, and 1–6 of the July cruise. The black and red dashed lines represent the typical KC and SCS waters, respectively. The data were collected from the Ocean Data Bank, Taiwan (http://www.odb.ntu.edu.tw/). The first and second numbers of the abbreviation St. x–x in each panel indicate the sampling station and the hydrocast deployed at that station, respectively.
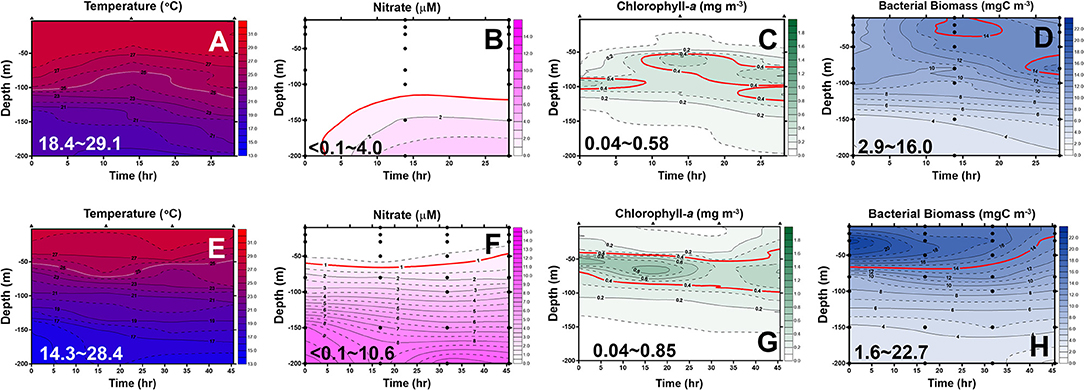
Figure 5. Diel changes of the contour plots of the measurements in the upper 200 m of station 6 (A–D) and station 2 (E–H) of the May cruise. The ranges for each measurement are shown in each panel. The lines represent an isotherm of 25°C (A,E), isovalue lines of 1.0 μM nitrate (B,F), 0.4 mg/m3 chlorophyll-a (Chl-a) (C,G), and 14 mgC/m3 bacterial biomass (BB) (D,H), respectively.
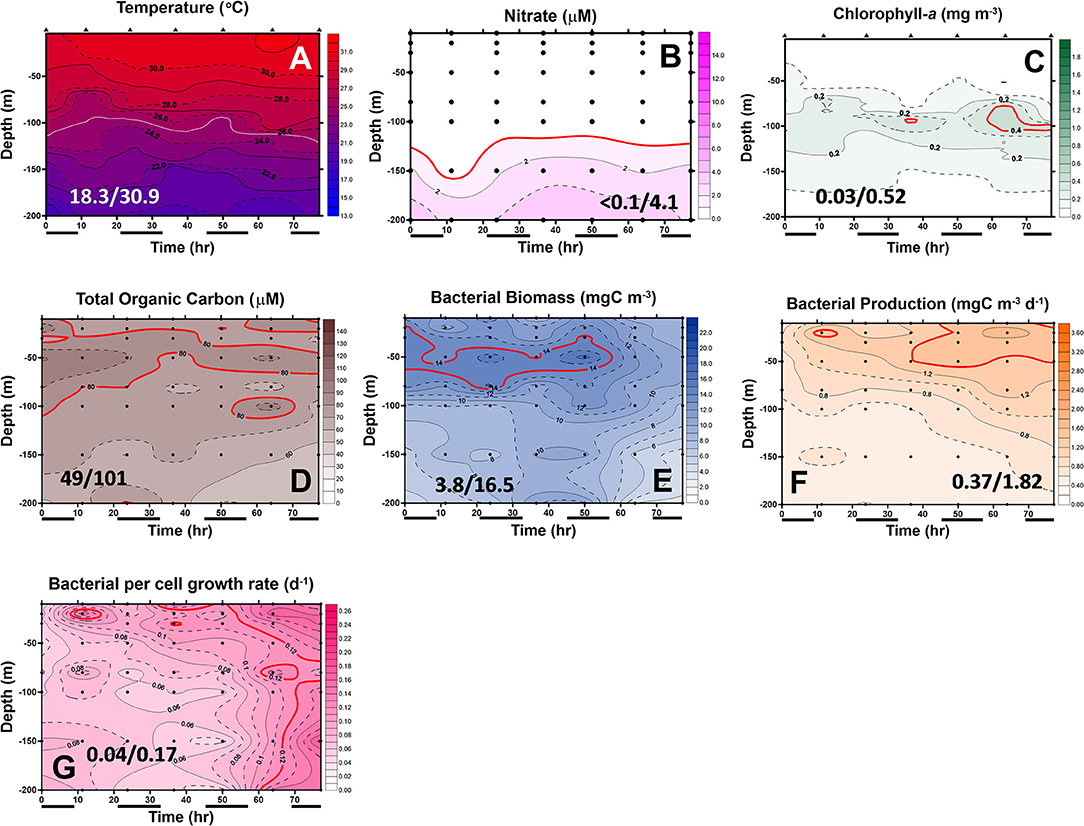
Figure 6. Diel changes of the contour plots of the measurements in the upper 200 m of station 6 of the July cruise. The values in slash indicate the minimum and maximum in each panel. The lines in (D–G) represent the isovalue lines of 80 μMC total organic carbon (TOC), 14 mgC/m3 BB, 1.4 mgC/m3/day bacterial production (BP), and 0.12 bacterial growth rate (Bμ) per day, respectively. The isovalue lines for (A–C) are the same as mentioned in Figure 5. Black bars below the X-axis denote nighttime.
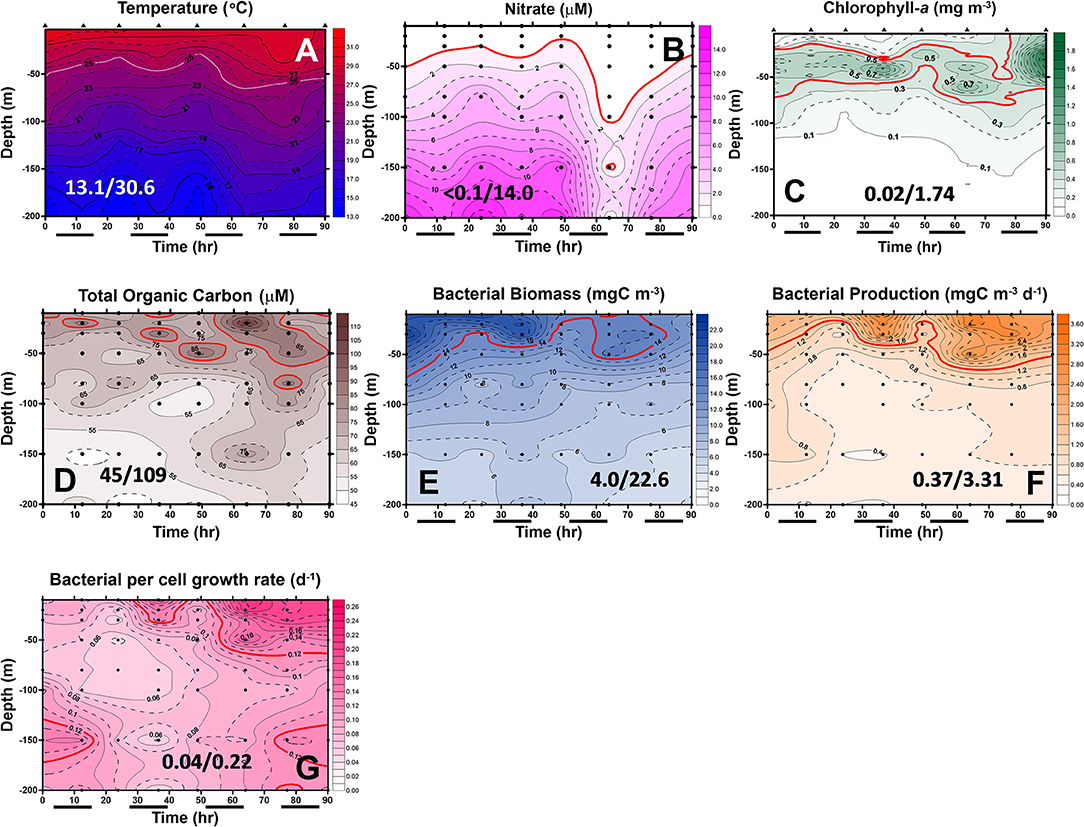
Figure 7. Diel changes of the contour plots of the measurements in the upper 200 m of station 2 of the July cruise. The values in slash indicate the minimum and maximum in each panel. The lines in (D–G) represent the isovalue lines of 80 μMC TOC, 14 mgC/m3 BB, 1.4 mgC/m3/day BP, and 0.12 Bμ per day, respectively. The isovalue lines for (A–C) are the same as mentioned in Figure 5. Black bars below the X-axis denote nighttime.
Spatial and Temporal Variation of Phytoplankton Biomass and Production
The satellite-derived data (Figure 8) of the July cruise indicated the daily evolution of the sea-surface Chl-a concentrations during the sampling period. Sts. 1, 2, 7, and 8 were occupied by high Chl-a while Sts. 4, 5, and 6 were continuously typified by a low Chl-a condition. Spatially (i.e., vertically and horizontally), we found that the distribution of high surface Chl-a values with shallow subsurface Chl-a maximum (SCM; ~50 m depth; Figure 9A) echoed the area (e.g., Sts. 7, 8, 1, 2, and 3) with the SCS–KC mixing signals (Figures 4A–E,I–M). In contrast, much lower Chl-a values and deep SCM at ~100 m were found at KC stations (e.g., Sts. 5 and 6). The spatial variation of Chl-a and SCM of the ending-cast (Figure 9B) generally followed those of the beginning-cast with one modification. The SCM concentrations recorded at Sts. 1–3 increased at least 3-fold in the ending-cast.
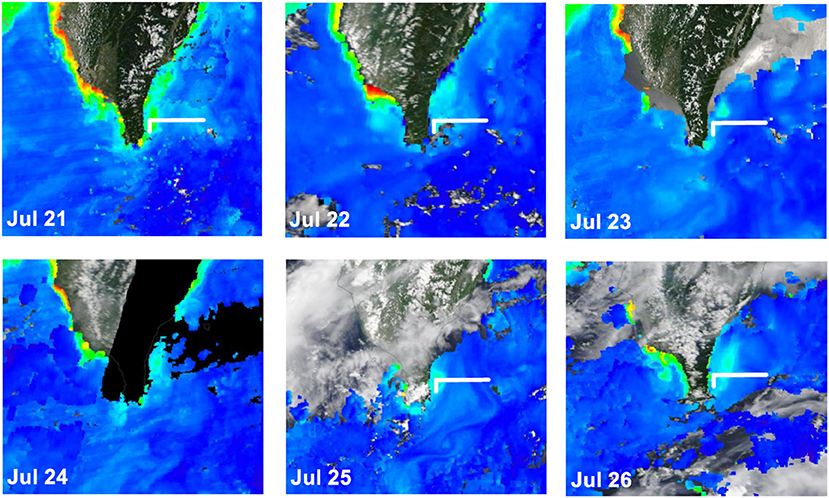
Figure 8. Sequential changes of satellite-derived sea-surface Chl-a concentrations of the investigation period of July 21–25, 2020 (https://oceancolor.gsfc.nasa.gov/). The white line indicates the sampling transect.
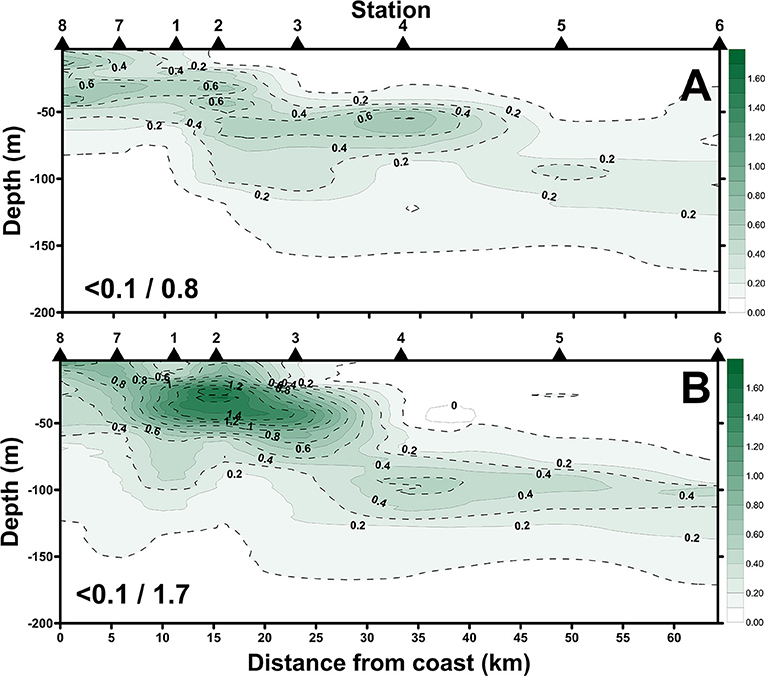
Figure 9. Spatial changes of Chl-a concentrations along the sampling transect of the beginning-cast (A) and ending-cast (B) of the July cruise. Values in slash indicate the minimum and maximum in each panel.
In May, low-surface Chl-a values (0.04–0.58 mgChl-a/m3) with significant SCM mostly located at ~100 m depth were observed at St. 6 (Figure 5C). In contrast to that, Chl-a at St. 2 (0.04–0.85 mgChl-a/m3, Figure 5G) was much higher and its SCM was located at depths <50 m. In July, low-surface Chl-a values (0.03–0.52 mgChl-a/m3) with significant SCM located at ~100 m depth were observed at St. 6 (Figure 6C). In contrast to that, Chl-a at St. 2 (0.02–1.74 mgChl-a/m3, Figure 7C) was much higher and its SCM was located at depths <50 m. Ranges and depth distributions of TOC recorded at St. 6 (Figure 6D; 49–101 μM) and St. 2 (Figure 7D; 45–109 μM) were similar to each other. The depth-integrated primary productions (PP) recorded at St. 6 were 57 and 124 mgC/m2/day and at St. 2 were 197, 367, and 465 mgC/m2/day.
Temporal Variation of Bacterial Biomass and Productions
Bacterial biomass (BB) at St. 6 (Figure 5D; 2.9–16.0 mgC/m3) and St. 2 (Figure 5H; 1.6–22.7 mgC/m3) in the May cruise showed similar patterns with higher values on the surface and then decreased with depth. In July at St. 6, BB (Figure 6E; 3.8–16.5 mgC/m3) varied 4-fold with higher values on the surface, but with subsurface BB maximum recorded at depths of 40–70 m. In contrast, rate parameters, such as production (BP; Figure 6F; 0.37–1.82 mgC/m3/day) and growth rate (Bμ; Figure 6G; 0.04–0.17 per day), were out of phase with BB. That is, higher BB occurred during the first half of the survey period (e.g., sampling points 1–5), while BB and Bμ elevated during the late phase (i.e., sampling points 5–7).
Spatially, the BP and Bμ data were higher on the surface and then decreased with depth. The only exception was that a subsurface Bμ maximum occurred at the depth of 150 m at the last sampling point. At St. 2, bacterial rate parameters (Figures 7F,G) were almost in phase with each other, with higher readings occurring on the surface and decreasing with depth. Similar to that of St. 6, higher BP (and Bμ) occurred later than those of BB at St. 2 (Figure 7E), and subsurface high Bμ values were recorded for these two stations at the depths of 150 m in the earliest and latest phases (Figure 7G).
Correlation Among Measurements
The correlation analysis (Table 1) of the July cruise data indicated that at St. 6, Chl-a did not correlate with any measurement, while at St. 2, we observed positive correlations for Chl-a on all measurements except NO3, which showed a negative trend. Positive correlations between TOC and BB were significant at both sampling sites. The coupling between bacterial measurements and their substrate source (e.g., Chl-a) was unseen at St. 6 and then became strong at St. 2. Similarly, the correlations for TOC with BP and Bμ at St. 6 were insignificant, but their relationships changed to positive ones at St. 2.
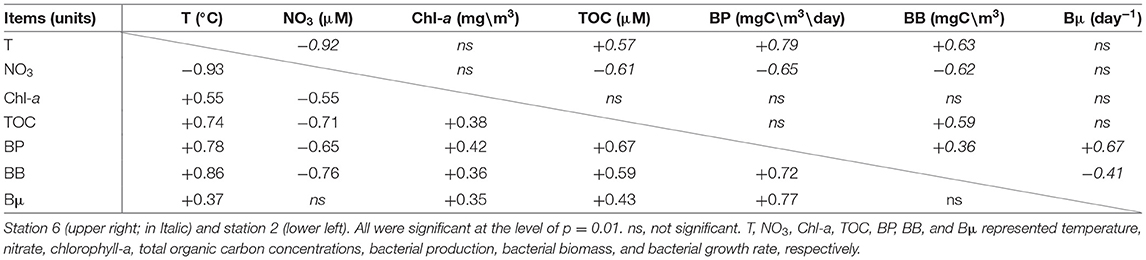
Table 1. Correlation matrix for measurements collected from stations 6 and 2 of the July cruise.
Comparison Between SCS–KC Mixing and KC Waters
In May, chemical (NO3), and biological measurements (Chl-a and BB) at St. 2 were all higher than those recorded at St. 6 (Table 2). In July, NO3 inventories in the euphotic zone (Ze) of St. 2 were 4- to 5-fold higher than those of St. 6 (Table 2). Autotrophic measurements including Chl-a and PP were doubled and tripled, respectively, within the Ze of St. 2. The depth-integrated averages of heterotrophic properties including BB, BP, and Bμ at St. 2 were slightly higher with percentages increasing <20%. Still, it was noted that the individual-depth BP maximum recorded at St. 2 (3.31 mgC/m3/day; Figure 7F) was 82% higher when compared with that of St. 6 (1.82 mgC/m3/day; Figure 6F). The depth-integrated averaged BP within Ze were positively correlated with those of PP with a slope of ~0.39 (±0.12) when the data of both stations were used (Figure 10).
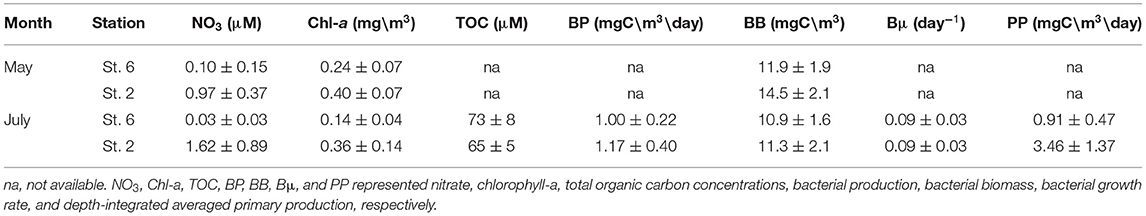
Table 2. The euphotic zone (0–100 m) depth-integrated averages ± SDs of the measurements collected from stations 6 and 2 of the May and July cruises.
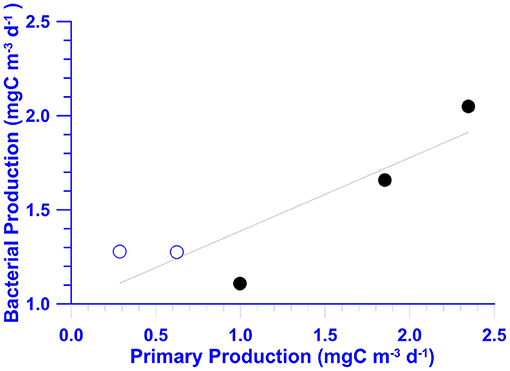
Figure 10. A scatter plot of the euphotic zone (0–100 m) depth-integrated averages of BP vs. PP at stations 2 (solid dots) and 6 (open dots) of the July cruise. The linear regression equation is shown.
Discussion
For convenience, we categorized the KC into three sections, namely, the downstream, midstream, and upstream, which covered the areas north of 25°N, 22–25°N, and south of 22°N, respectively. The physical–chemical–biological coupling has long been a major research issue in the field of biological oceanography. Being the west-boundary current of the Pacific Ocean, the KC has been viewed as an oligotrophic biome. Recent studies have recommended several physical mechanisms that might transport deep-water nutrients to the surface waters and trigger high plankton biomasses and activities in the KC. In the downstream area, the intrusion of nutrient-rich KC subsurface water onto the continental shelf (Liu et al., 2013; Hasegawa et al., 2019), the mesoscale lateral mixing of KC water with Oyashio water (Clayton et al., 2014), and the topographically induced turbulence mixing (Kobari et al., 2020) have been proposed as the mechanisms that might intensify biological biomass and production in the surface water. At the KC upstream area (Tsutsumi et al., 2020), findings have demonstrated that the high minerals fluxes and high surface Chl-a concentrations observed in the Luzon Strait could be ascribed to the strong turbulence mixing induced by the interaction of topography (i.e., steep oceanic ridges) and tidal current.
In fact, some of the sampling stations (i.e., Sts. 1, 2, 7, and 8) are very close to the coast. However, they cannot be categorized as coastal/nearshore stations. The east coast terrain has cliff topography, which gives the area a very steep slope and almost no continental shelf. The bottom depths for the abovementioned stations are all greater than 200 m (Figure 1). In particular, St. 2 has a bottom depth of ~760 m. Therefore, the mixing caused by the wind-blown and/or wave-breaking processes that commonly occur in shallow coastal areas is not applicable in this study. At the east coast of Taiwan (i.e., midstream area), biogenic processes such as the new nutrient (i.e., ammonium) produced via the high-density N2-fixing Trichodesmium have been proposed as a cause for higher phytoplankton and bacterial growth/production in the KC in summer (Tseng et al., 2005). With satellite-derived Chl-a, sea-surface temperature maps, a drifter trajectory, and numerical model simulations, Cheng et al. (2020, see their Figure 11) indicated that at the southernmost end of Taiwan, the formation of submesoscale cyclonic eddies could trap cold and high Chl-a water every day and could form frontal waves between the free-stream and the wake-flow. It was suggested that the inorganic nutrient derived from eddy processes could enhance the growth of phytoplankton, and the high Chl-a could be transported further northward.
In addition to the submesoscale eddy process, we argued that the monsoon-driven mixing of the SCS and KC waters (Figure 2) could be important in explaining the high algal biomass and PP in the nearshore area. The T–S signature (Figures 3A–D, 4D,L) indicated that the water at St. 2 (also at Sts. 7, 8, 1, and 3) was a mixture of the SCS and KC waters. Three points were particularly noted. First, in the panels of Figures 5A–E,I–M, the starting point of the blue line at the bottom of each panel was linked to the red line, which represented the SCS water; the head of the blue line in each panel was bonded with the typical KC water as indicated by the black dashed line. If it were eddy effects, then the abovementioned T–S diagrams could not be generated. Second, shallower (<50 m) SCM with high Chl-a concentrations occurred only at the area west of St. 4 (Figures 9A,B), and all the T–S diagrams of the stations (Sts. 8, 7, 1, 2, and 3) in this area were characterized with SCS–KC mixing sign (Figure 4). The very shallow nitrocline (Figures 5B, 7B; <50 m) implied that St. 2 could be viewed as a mesotrophic system. Finally, the numerical simulation of the backward-trajectory and flow pattern (Figure 2) processes highlighted a plausible physical mechanism for the SCS–KC mixing processes.
Mixing in deep water areas can occur due to shear stress. Shear stress is the pulling force of a fluid moving in one direction as it passes close to a fluid or object moving in another direction. The shear stress–generated pulling force can bring nutrient-rich water from deep water toward the ocean surface, which is usually nutrient-depleted. The nutrient-rich water stimulates the growth and reproduction of primary producers such as phytoplankton. In summer, the prevailing southwest monsoon invites the outflow from the SCS, joining the western flank of the KC off southeast Taiwan. The collision and velocity shear between the SCS and KC induces the mixing between the two water masses, as shown in Figures 3, 4. The phenomenon of annual mean wind from the southwest inviting the outflow from the SCS to the southeastern coast of Taiwan in summer follows both in situ measurements and satellite observation, e.g., the long-term observations from both surface drifter trajectories (Centurioni et al., 2004) and shipboard ADCP velocity composites (Liang et al., 2003) as well as a satellite altimeter-based geostrophic current (Hsin et al., 2013). The high-resolution numerical model simulation of this study further confirmed a northeastward flow originating from the SCS that joined the western flank of the KC off southeast Taiwan in late July 2020 (Figure 2). The T–S diagram of St. 2 exhibited the consequential mixing between the SCS and Kuroshio waters (Figures 3, 4). The flow pattern lent further support, indicating that the water near Sts. 1 and 2 was a mixture of the SCS and KC waters. Furthermore, the velocity–vorticity (shear) off southeast Taiwan was positive, which was favorable for local upwelling, resulting in higher Chl-a concentrations (Figure 8) recorded in our studies.
In addition to the atmospheric force (i.e., the southwest monsoon), the driving force from the ocean interior might also cause SCS water intrusion. By analyzing the moored current velocities in the central Luzon Strait, Tai et al. (2010 and citations therein) revealed a Kuroshio frontal instability wave (KFIW) propagating northward over a 5-day period, and its wave amplitude was increasing northward. Their results of the two-layered model suggested that the flow was stabilized for the long-wave mode but destabilized for the short-wave mode, due to increasing vertical shear in the horizontal velocity. Therefore, the possibility that the eastward skew of the KFIW might also cause the SCS–KC mixing by the east coast of Taiwan cannot be ruled out.
In a cross-system review, Cole et al. (1988) observed strong positive BB–Chl-a and BP–PP relationships, suggesting that bacterial biomass/activity is controlled by the bottom-up (i.e., substrate supply) processes. In several cross-shelf analyses, positive BP–PP relationships were found in the mid- to outer-shelf (i.e., the KC water) areas of the East China Sea (Shiah et al., 2001) and the SCS (Lai et al., 2014; Austria et al., 2018). Our results (Figure 10) also indicated that when the data of two different water masses were pooled together, BP also showed a positive trend with PP.
It is particularly important to note that the positive relationships of BB vs. Chl-a and/or BP vs. PP observed in the cross-system analyses shown above were not necessarily observed in a single water mass, even an oligotrophic one. Our BP data showed no relationship with autotrophic biomass (i.e., Chl-a) in the oligotrophic KC water, but their relationship changed to a positive one in mesotrophic productive water (Table 1). It has been suggested that heterotrophic bacteria could compete with phytoplankton for mineral nutrients such as N, P, or Fe (Currie and Kalff, 1984; Thingstad, 2000; Wambeke et al., 2008; Chen et al., 2016 and citations therein). The mineral uptake by bacteria might place bacteria and phytoplankton in competition for growth-limiting nutrients, rather than in their traditional roles as the respective “source” and “sink” for these nutrients in the plankton (Caron et al., 2000). Additionally, the study of Armengol et al. (2019) denoted the classic paradigm of a shorter food web, and more efficient energy transfer toward upper food-web levels in productive regions, but longer a microbe-dominated food web, which could be more efficient at recycling in oligotrophic regions.
These two abovementioned viewpoints highlight the possibility that bacteria could receive substrate sources from the nonalgal components and result in a noncorrelation situation between autotrophs and heterotrophs in oligotrophic KC (Table 1). In a sense, we deduced that the KC water is a “mature and stable” ecosystem, while that of the mixing water is a “new and unsteady” one. The abundant supplies of new nutrients (from deep-water mixing) and new substrates (from enhanced PP) might facilitate the coupling of phytoplankton and bacteria within the water column over a timescale of days (Table 1).
A certain amount of photosynthetic product could be excreted to the surrounding environment in the dissolved phase by phytoplankton. This process is known as exudation, and its rate is defined as dissolved primary production (DPP). The PP derived from the 14C–assimilation–filtration method was an estimate of particulate PP (PPP) and did not take DPP into account. Chen et al. (2020) showed that DPP in the KC in northern Taiwan could be equivalent to that of PPP. The slope (0.39 ± 0.12) shown in Figure 10 indicated a BP/PP ratio of ~40% in our study, which is within the range that has been reported (Ducklow and Carlson, 1992). Additionally, the BP/PP ratio reported in this study could drop to 20% when DPP was included.
Conclusion
This study proposes a novel physical mechanism of water mass mixing induced by the prevailing southeast monsoon at the cape of southern Taiwan. It appears that there are at least two physical processes that might enhance the biological biomass/production in the study site: One is the eddy process and the other is the mixing process. These two physical processes might be acting additively (on the nutrients supply and biological activities) but at different time scales. The eddy process is operating daily as affected by tidal movement, and the mixing caused by the northeastward intrusion of the SCS waters is approximately at a seasonal scale. However, the relative effectiveness of these two processes in boosting biological biomass/production in the summer season cannot be differentiated at this stage. It is noted that the “new production” probably driven by the new nutrients from mixing/eddy processes in this region is particularly important since there is almost no shelf at the east coast of Taiwan. The sinking particles in the productive areas could be transported to the deep sea very quickly. This study further provides microbial evidence suggesting an uncoupling bacteria–phytoplankton relationship in the oligotrophic Kuroshio water. The heterotrophic and autotrophic planktons then become highly coupled in adjacent productive water resulted from the mixing process.
Data Availability Statement
The raw data supporting the conclusions of this article will be made available by the authors, without undue reservation.
Author Contributions
J-HT, K-YL, and H-YK: data collection and measurements. C-CL, C-RW, and F-KS: discussion in manuscript preparation and writing. F-KS: experiment design. All authors contributed to the article and approved the submitted version.
Funding
This study was supported by the Ministry of Sciences and Technology, Taiwan, Grant No. 107-2611-M-001-005-MY3.
Conflict of Interest
The authors declare that the research was conducted in the absence of any commercial or financial relationships that could be construed as a potential conflict of interest.
Publisher's Note
All claims expressed in this article are solely those of the authors and do not necessarily represent those of their affiliated organizations, or those of the publisher, the editors and the reviewers. Any product that may be evaluated in this article, or claim that may be made by its manufacturer, is not guaranteed or endorsed by the publisher.
Acknowledgments
The cruise assistance from the crew of research vessel OR-III is highly appreciated.
References
Armengol, L., Calbet, A., Franchy, G., Rodríguez-Santos, A., and Hernández-León, S. (2019). Planktonic food web structure and trophic transfer efficiency along a productivity gradient in the tropical and subtropical Atlantic Ocean. Sci. Rep. 9:2044. doi: 10.1038/s41598-019-38507-9
Austria, E. S., Lai, C. C., Ko, C. Y., Lee, K. Y., Kuo, H. Y., Chen, T. Y., et al. (2018). Growth-controlling mechanisms on heterotrophic bacteria in the South China Sea shelf: summer and winter patterns. Terr. Atmos. Ocean Sci. 29, 441–453. doi: 10.3319/TAO.2018.01.19.01
Azam, F. (1998). Microbial control of oceanic carbon flux: the plot thickens. Science 280, 694–696. doi: 10.1126/science.280.5364.694
Azam, F., and Malfatti, F. (2007). Microbial structuring of marine ecosystems. Nat. Rev. 5, 782–792. doi: 10.1038/nrmicro1747
Brussaard, C. P. D. (2004). Optimization of procedures for counting viruses by flow cytometry. Appl. Environ. Microbiol. 70, 1506–1513. doi: 10.1128/AEM.70.3.1506-1513.2004
Caron, D. A., Lim, E. L., Sanders, R. W., Dennett, M. R., and Berninger, U. (2000). Responses of bacterioplankton and phytoplankton to organic carbon and inorganic nutrient additions in contrasting oceanic ecosystems. Aquat. Microb. Ecol. 22, 175–184. doi: 10.3354/ame022175
Centurioni, L. R., Niiler, P. P., and Lee, D. K. (2004). Observation of inflow of Philippine Sea surface water into the South China Sea through the Luzon Strait. J. Phys. Oceanogr. 34, 113–121.2.0.CO;2. doi: 10.1175/1520-0485(2004)034andlt;0113:OOIOPSandgt;2.0.CO;2
Chen, T. Y., Lai, C. C., Shiah, F. K., and Gong, G. C. (2020). Dissolved and particulate primary production and subsequent bacterial C consumption in the Southern East China Sea. Front. Mar. Sci. 7:713. doi: 10.3389/fmars.2020.00713
Chen, T. Y., Ta, J. H., Ko, C. Y., Hsieh, C., Chen, C. C., Jiao, N., et al. (2016). Nutrient pulses driven by internal solitary waves enhance heterotrophic bacterial growth in the South China Sea. Environ. Microbiol. 18, 4312–4323. doi: 10.1111/1462-2920.13273
Cheng, Y. H., Chang, M. H., Ko, D. S., Jan, S., Andres, M., Kirincich, A., et al. (2020). Submesoscale eddy and frontal instabilities in the Kuroshio interacting with a Cape South of Taiwan. J. Geophys. Res. Oceans 125:e2020JC016123. doi: 10.1029/2020JC016123
Cho, B. C., and Azam, F. (1988). Major role of bacteria in biogeochemical fluxes in the ocean's interior. Nature 332, 441–443. doi: 10.1038/332441a0
Chou, W. C., Sheu, D. D., Chen, C. T. A., Wen, L. S., Yang, Y., and Wei, C. L. (2007). Transport of the South China Sea subsurface water outflow and its influence on the carbon chemistry of Kuroshio waters off southeastern Taiwan. J. Geophys. Res. 112:C12008, doi: 10.1029/2007JC004087
Clayton, S., Nagai, T., and Follows, M. J. (2014). Fine scale phytoplankton community structure across the Kuroshio Front. J. Plankton Res. 36, 1017–1030. doi: 10.1093/plankt/fbu020
Cole, J. J., Findlay, S., and Pace, M. L. (1988). Bacterial production in fresh and saltwater ecosystems: a cross-system overview. Mar. Ecol. Prog. Ser. 43, 1–10. doi: 10.3354/meps043001
Currie, D., and Kalff, J. (1984). The relative importance of bacterioplankton and phytoplankton in phosphorus uptake in freshwater. Limnol. Oceanogr. 29, 311–321. doi: 10.4319/lo.1984.29.2.0311
Ducklow, H. W., and Carlson, C. A. (1992). “Oceanic bacterial production,” in Advance in microbial ecology, ed K. C. Marshall (NY: Plenum), 113–181.
Fuhrman, J. A., and Azam, F. (1982). Thymidine incorporation as a measurement of heterotrophic bacterioplankton production in marine surface waters: evaluation and field results. Mar. Biol. 66, 109–120. doi: 10.1007/BF00397184
Gaso, J. M., and Giorgio, P. A. D. (2000). Using flow cytometry for counting natural planktonic bacteria and understanding the structure of planktonic bacterial communities. Sci. Mar. 64, 197–224. doi: 10.3989/scimar.2000.64n2197
Hansell, D. A., Carlson, C. A., Repeta, D. J., and Schlitzer, R. (2009). Dissolved organic matter in the ocean: a controversy stimulates new insights. Oceanography 22, 203–211. doi: 10.5670/oceanog.2009.109
Hasegawa, T., Kitajima, S., and Kiyomoto, Y. (2019). “Phytoplankton distribution in the Kuroshio Region of the Southern East China Sea in early spring,” in Kuroshio Current: Physical, Biogeochemical, and Ecosystem Dynamics, Geophysical Monograph 243, eds T. Nagai, H. Saito, K. Suzuki, and M. Takahashi (New York, NY: Wiley and Sons, Inc.), 191–204.
Hsin, Y. C., Qiu, B., Chiang, T. L., and Wu, C. R. (2013). Seasonal to interannual variations in the intensity and central position of the surface Kuroshio east of Taiwan. J. Geophys. Res. Oceans 118, 4305–4316. doi: 10.1002/jgrc.20323
Knap, A., Michaels, A., Close, A., Ducklow, H., and Dickson, A. (1996). “Protocols for the Joint Global Ocean Flux Study (JGOFS) Core Measurements”, in Intergovernmental Oceanographic Commission Manuals and Guides: 29. JGOFS Report; 19.
Kobari, T., Honma, T., Hasegawa, D., Yoshie, N., Tsutsumi, E., Matsuno, T., et al. (2020). Phytoplankton growth and consumption by microzooplankton stimulated by turbulent nitrate flux suggest rapid trophic transfer in the oligotrophic Kuroshio. Biogeosciences 17, 2441–2452. doi: 10.5194/bg-17-2441-2020
Lai, C. C., Fu, Y. W., Liu, H. B., Kuo, H. Y., Wang, K. W., Lin, C. H., et al. (2014). Distinct bacterial-production–DOC–primary-production relationships and implications for biogenic C cycling in the South China Sea shelf. Biogeosciences 11, 147–156. doi: 10.5194/bg-11-147-2014
Liang, W. D., Tang, T. Y., Yang, Y. J., Ko, M. T., and Chuang, W. S. (2003). Upper-ocean currents around Taiwan. Deep-Sea Res. II 50, 1085–1105. doi: 10.1016/S0967-0645(03)00011-0
Liu, X., Furuya, K., Shiozak, T., Masuda, T., Kodama, T., Sato, M., et al. (2013). Variability in nitrogen sources for new production in the vicinity of the shelf edge of the East China Sea in summer. Cont. Shelf Res. 61–62, 23–30. doi: 10.1016/j.csr.2013.04.014
Lønborg, C., Carreira, C., Jickells, T., and Álvarez-Salgado4, X. A. (2020). Impacts of global change on ocean dissolved organic carbon (DOC) cycling. Front. Mar. Sci. 7:466. doi: 10.3389/fmars.2020.00466
Nan, F., Xue, H., and Yu, F. (2015). Kuroshio intrusion into the South China Sea. Prog. Oceanogr. 137, 314–333. doi: 10.1016/j.pocean.2014.05.012
Parsons, T. R., Maita, Y., and Lalli, C. M. (1984). A Manual of Chemical and Biological Methods for Seawater Analysis. New York, NY: Pergamon.
Sheu, D. D., Chou, W. C., Chen, C. T. A., Wei, C. L., Hsieh, H. L., Hou, W. P., et al. (2009). Riding over the Kuroshio from the South to the East China Sea: mixing and transport of DIC. Geophys. Res. Lett. 36:L07603. doi: 10.1029/2008GL037017
Shiah, F. K. (1999). Diel cycles of heterotrophic bacterioplankton abundance and production in the ocean surface waters. Aquat. Microb. Ecol. 17, 239–246. doi: 10.3354/ame017239
Shiah, F. K., Chen, T. Y., Gong, G. C., Chen, C. C., Chiang, K. P., and Hung, J. J. (2001). Differential coupling of bacterial and primary production in mesotrophic and oligotrophic systems of the East China Sea. Aquat. Microb. Ecol. 23, 273–282. doi: 10.3354/ame023273
Shiah, F. K., Liu, K. K., Kao, S. J., and Gong, G. C. (2000). The coupling of bacterial production and hydrography in the southern East China Sea: spatial patterns in spring and fall. Continent. Shelf Res. 20, 459–477. doi: 10.1016/S0278-4343(99)00081-3
Sigman, D. M., and Haug, G. H. (2006). “The biological pump in the past,” in Treatise on Geochemistry, eds H. Elderfield, H. D. Holland, and K. K. Turekian (Amsterdam: Elsevier), 625.
Tai, J. H., Tang, T. Y., and Gawarkiewicz, G. (2010). Instability of the Kuroshio in Luzon Strait: effects of ridge topography and stratification. J. Oceanogr. 66, 523–538. doi: 10.1007/s10872-010-0044-6
Thingstad, T. F. (2000). Elements of a theory for the mechanisms controlling abundance, diversity, and biogeochemical role of lytic bacterial viruses in aquatic systems. Limnol. Oceanogr. 45, 1320–1328. doi: 10.4319/lo.2000.45.6.1320
Tseng, Y. F. F. J., Lin Chiang, K. P., Kao, S. J., and Shiah, F. K. (2005). Potential impacts of N2-fixing Trichodesmium on heterotrophic bacterioplankton turnover rates and organic carbon transfer efficiency in the subtropical oligotrophic ocean system. Terrest. Atmos. Ocean. Sci. 16, 361–376. doi: 10.3319/TAO.2005.16.2.361(Oc)
Tsutsumi, E., Matsuno, T., Itoh, S., Zhang, J., Senjyu, T., Sakai, A., et al. (2020). Vertical fluxes of nutrients enhanced by strong turbulence and phytoplankton bloom around the ocean ridge in the Luzon Strait. Sci. Rep. 10:17879. doi: 10.1038/s41598-020-74938-5
Wambeke, F. V., Bonnet, S., Moutin, T., Raimbault, P., Alarcoń, G., and Guieu, C. (2008). Factors limiting heterotrophic bacterial production in the southern Pacific Ocean. Biogeosciences 5, 833–845. doi: 10.5194/bg-5-833-2008
Wu, C. R., Wang, Y. L., Lin, Y. F., and Chao, S. Y. (2017). Intrusion of the Kuroshio into the South and East China Seas. Sci. Rep. 7:7895. doi: 10.1038/s41598-017-08206-4
Keywords: NW-Pacific, Kuroshio, southwest monsoon, phytoplankton, primary production, bacterial production
Citation: Lai C-C, Wu C-R, Chuang C-Y, Tai J-H, Lee K-Y, Kuo H-Y and Shiah F-K (2021) Phytoplankton and Bacterial Responses to Monsoon-Driven Water Masses Mixing in the Kuroshio Off the East Coast of Taiwan. Front. Mar. Sci. 8:707807. doi: 10.3389/fmars.2021.707807
Received: 10 May 2021; Accepted: 29 June 2021;
Published: 03 August 2021.
Edited by:
Wen-Chen Chou, National Taiwan Ocean University, TaiwanCopyright © 2021 Lai, Wu, Chuang, Tai, Lee, Kuo and Shiah. This is an open-access article distributed under the terms of the Creative Commons Attribution License (CC BY). The use, distribution or reproduction in other forums is permitted, provided the original author(s) and the copyright owner(s) are credited and that the original publication in this journal is cited, in accordance with accepted academic practice. No use, distribution or reproduction is permitted which does not comply with these terms.
*Correspondence: Fuh-Kwo Shiah, ZmtzaGlhaEByY2VjLnNpbmljYS5lZHUudHc=