
95% of researchers rate our articles as excellent or good
Learn more about the work of our research integrity team to safeguard the quality of each article we publish.
Find out more
ORIGINAL RESEARCH article
Front. Mar. Sci. , 07 September 2021
Sec. Marine Pollution
Volume 8 - 2021 | https://doi.org/10.3389/fmars.2021.705204
This article is part of the Research Topic Before-After Control-Impact (BACI) Studies in the Ocean View all 17 articles
This work utilizes remotely sensed thermal data to understand how the release of thermal pollution from the Brayton Point Power Station (BPPS) affected the temperature behavior of Narragansett Bay. Building upon previous work with Landsat 5, a multi-satellite analysis is conducted that incorporates 582 scenes from Landsat 5, Landsat 7, and Landsat 8 over 1984–2021 to explain seasonal variability in effluent impacts, contrast data after the effluent ceased in 2011, identify patterns in temperature before and after effluent ceased using unsupervised learning, and track how recent warming trends compare to the BPPS impact. Stopping the thermal effluent corresponds to an immediate cooling of 0.26 ± 0.1°C in the surface temperature of Mt. Hope Bay with respect to the rest of Narragansett Bay with greater cooling of 0.62 ± 0.2°C found near Brayton Point; though, cooling since the period of maximal impact (1993–2000) totals 0.53 ± 0.2°C in Mt. Hope Bay and 1.04 ± 0.2°C at Brayton Point. During seasons with lower solar radiation (winter) and lower mean river input (autumn and late summer), the BPPS effluent impact is more prominent. The seasonal differences between the high impact and low impact periods indicate that river input played an important role in the heat balance when emissions were lower, but surface fluxes dominated when emissions were higher. Putting the BPPS effluent in context, Landsat data indicates that Narragansett Bay warmed 0.5–1.2°C over the period of measurement at an average rate of 0.23 ± 0.1°C/decade and that net warming in Mt. Hope Bay is near zero. This trend implies that Narragansett Bay has experienced climatic warming over the past four decades on the scale of the temperature anomaly in Mt. Hope Bay caused by the BBPS effluent.
The Brayton Point Power Station (BPPS) was a coal-fueled power station in Massachusetts that operated from 1963 to 2017. This power station was New England's largest fossil-fuel burning power station as well as a source of thermal pollution into Mt. Hope Bay, a northeastern embayment of Narragansett Bay (see Figure 1). Water from nearby rivers was used as a coolant for the power plant and heated 7–10°C above ambient river temperature before being released back into the environment. The EPA's New England Office and Department of Environmental Protection issued a new water discharge permit in 2003 that required the BPPS to drastically reduce thermal effluent release, though appeals were not resolved until 2007 and thermal effluent release did not stop until October 2011 when two cooling towers became operational. The BPPS later shut down operations completely in May 2017, and the cooling towers were demolished on April 27, 2019. Before regulations were tightened, the BPPS released nearly one billion gallons of water daily—enough to replace the entire volume of Mt. Hope Bay 3.5 times over a year—and released 44 petajoules (12 TWh) of heat annually into Mt. Hope Bay (United States Environmental Protection Agency, 2003). Comparing the heat released to the energy of incoming solar and longwave radiation and the effluent volume flux to the volume of river input contextualizes the scale of this impact. Using forcing data from the Ocean State Ocean Model (OSOM: Sane et al., 2020)—an application of the Regional Ocean Modeling System (ROMS) to Narragansett Bay and Rhode Island Sound—to facilitate this comparison, one billion gallons corresponds to 0.3–3.1% of the upper Taunton River input. The greatest relative volume of effluent occurs from July to October when river transport is the smallest. In terms of heat, the thermal effluent power, when spread across Mt. Hope Bay's surface, is equivalent to 7–16% of the incoming shortwave plus longwave radiation from the sun and atmosphere (the range reflects seasonal solar variability).
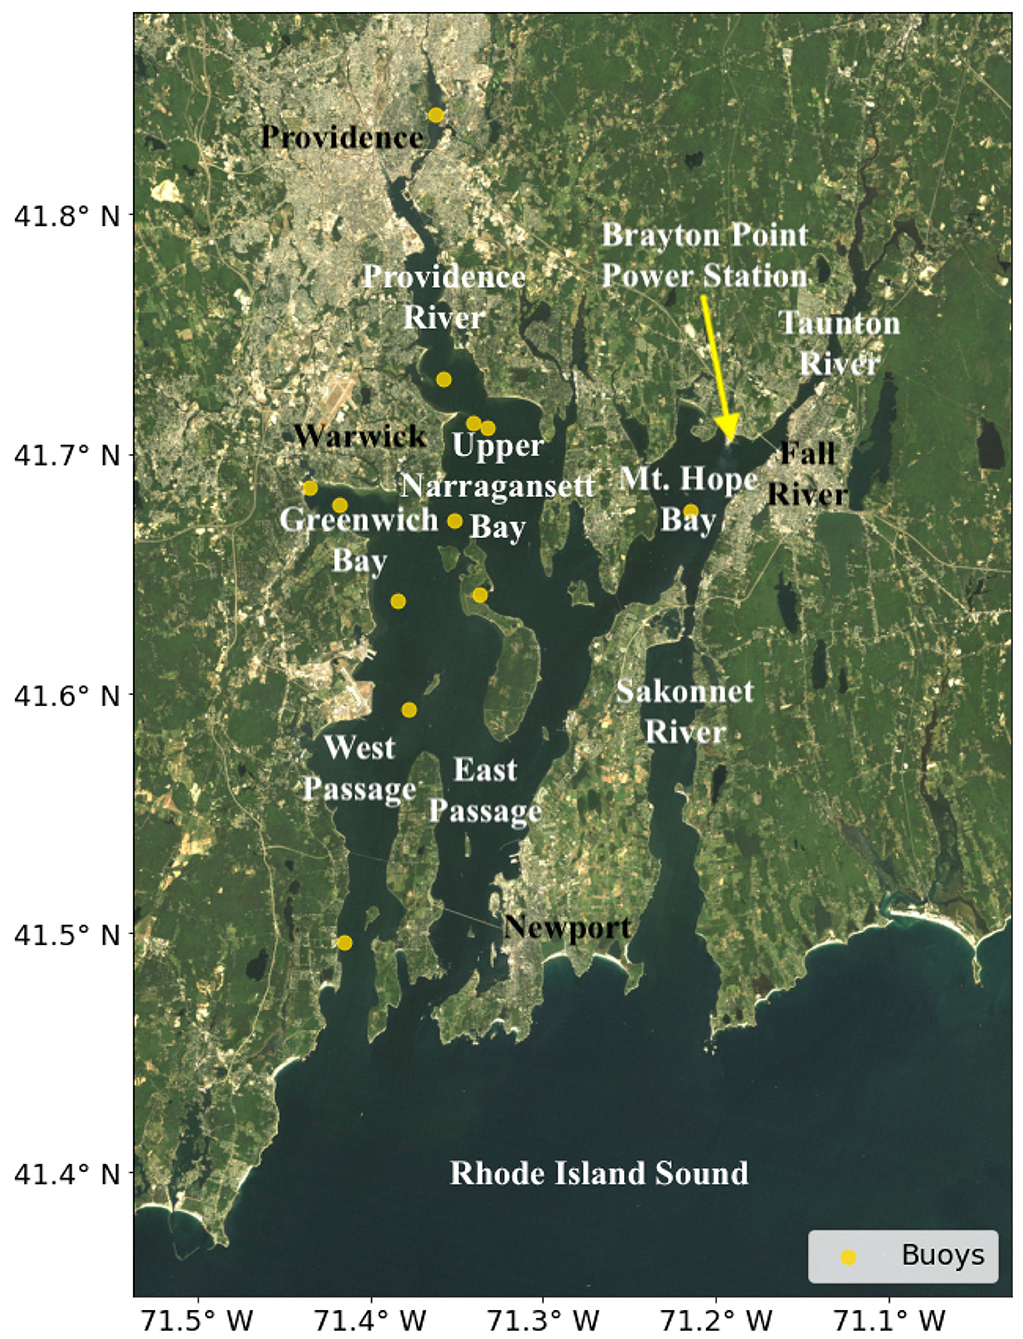
Figure 1. Narragansett Bay shown in true color by a Landsat 5 scene on September 7th, 1984 with labeled regions and buoy locations. A plume of atmospheric discharge is faintly visible traveling southward from the Brayton Point Power Station.
Using 14 Landsat 5 Thematic Mapper (TM) scenes, Mustard et al. (1999) found that Mt. Hope Bay had a heat anomaly of 0.8°C when compared to other upper-estuary regions and had anomalous seasonal temperature behavior characterized by delayed cooling in autumn and late summer. Further work found that the heat budget in Mt. Hope Bay is dominated by air-sea fluxes and that the BPPS effluent accounts for 25% of the total heating during winter and 15% during the summer (Fan and Brown, 2006). This work accounted for seasonal differences in effluent output, which is greater in winter and lower in summer, due to corresponding changes in energy demand and found that river input, in addition to surface exchanges, is a significant source of cooling during summer. Mustard et al. (2001) found that the effect of the thermal effluent on Mt. Hope Bay during the winter and spring are minimal as evidence of the thermal plume in satellite imagery is rarer during these seasons. With ~20 years of in situ and satellite data taken since many of these studies, this work aims to use longitudinal thermal data across the Landsat satellite series to analyze the post-effluent response in Mt. Hope Bay and contextualize the BPPS impact amid temperature trends in Narragansett Bay.
Monitoring of coastal marine ecosystems is critical to appreciate and mitigate the environmental challenges they face. Of particular concern, severe hypoxic events have been observed in Narragansett Bay historically (Deacutis et al., 2006; Melrose et al., 2007). Though nutrient release from rivers and wastewater treatment plants—as well as physical conditions controlling mixing and stratification—play primary roles in Narragansett Bay hypoxia, increases in temperature have been linked to increased susceptibility to hypoxia in coastal marine ecosystems as well (Pörtner et al., 2005; Miller and Harding, 2007; Conley et al., 2009; McBryan et al., 2013; Oviatt et al., 2017). Additionally, temperature plays an important role in biogeochemical cycling and ecosystem functioning by controlling the rates of chemical reactions, the timing of seasonal algal blooms, and spawning behavior (Valiela et al., 1997; Harley et al., 2006). With compounding ecological stressors such as climate change, overfishing, and increased predator prevalence, the effect of the BPPS effluent on declining fish populations has been difficult to isolate, though some studies have found local declines specific to Mt. Hope Bay and distinct rapid evolution in fish living near the BPPS thermal effluent (Gibson, 2002; DeAlteris et al., 2006; Dayan et al., 2019).
Due to the southward flow of the Labrador Current and polar amplification associated with climate warming in the source waters, the coastal shelf near the northeastern United States is particularly vulnerable to ocean warming and has warmed at a rate up to three times faster than the global sea surface temperature trend (MERCINA Working Group et al., 2015; Saba et al., 2016; Dupigny-Giroux et al., 2018; Neto et al., 2021). Near and within Narragansett Bay, long-term instrumental and palaeoceanographic records indicate that the region has warmed at a rate of 0.06–0.26 °C/decade in the past century (Shearman and Lentz, 2010; Smith et al., 2010; Salacup et al., 2019). Records of climatic temperature trends are often taken from few locations or coarse-resolution satellites, limiting the capture of change in spatially varying estuarine dynamics along a heterogeneous coast. The Landsat satellites (United States Geological Survey, 2021) provide decades of temperature data at finer than 120 m resolution, allowing for detailed spatial consideration of recent trends (Ding and Elmore, 2015). The derived temperature measurements taken by Landsat are less precise than on satellites designed specifically to measure sea surface temperature (SST); however, large near-shore and coastal variations in temperature permit Landsat accuracy to capture within-estuary variability. Additionally, estimation of temperature uncertainties by calibration to in situ buoy measurements over the same decades ensures appropriate consideration of uncertainty when using Landsat data in this work (Emery et al., 2001).
To understand effluent and climatic impact on a dynamic estuarine system, the oceanographic processes at play are important to consider as well. In a shallow and well-mixed estuary such as Narragansett Bay, circulation is governed by diurnal tides, salinity-governed stratification, and river input (Geyer and MacCready, 2014). Because the northern embayments of Narragansett Bay are shallow and isolated from tidal mixing with shelf waters, they experience greater seasonal temperature extremes than deeper locations with significant oceanic influence (Mustard et al., 1999). Important for pollutant analysis, flushing timescales represent how long it takes to replace water masses in an estuary with water from rivers. Flushing timescales can be calculated for a body in an estuary by dividing the volume of water in the body by the rate of river input (Monsen et al., 2002). Observational and model-based studies indicate the surface flushing timescale of Narragansett Bay ranges from 14 to 33 days while the local flushing timescale in Mt. Hope Bay ranges from a single tidal cycle to ~30 days depending on mean river input—which varies seasonally—and tidal magnitude—which varies monthly (Abdelrhman, 2005; Rogers, 2008; Sane et al., 2020).
Mt. Hope Bay flushing dynamics are dominated by input from the Taunton River and output into the Sakonnet River and East Passage. Though the extent of the thermal plume from the BPPS at any given time depends on the stage of the tidal cycle, the thermal effluent is dispersed throughout Mt. Hope Bay over the course of a tidal cycle and the temperature anomaly persists between cycles (Mustard et al., 2001). Satellite data is limited in measuring thermal plumes because satellites only measure surface temperature, which may exaggerate the plume's effect if the thermal plume is buoyant and presents as a surface lens of warmer water. However, due to year-round wind-driven and tide-driven mixing, as well as seasonal and diurnal convective mixing, Narragansett Bay is often well-mixed vertically, only having significant (haline) stratification—as evidenced by hypoxia—when river input is high and wind-driven mixing is low during acute periods in the spring and early summer (Torgersen et al., 1997). The most significant effluent effects are found outside of these high stratification periods, so an exaggerated surface plume would have to come primarily from temperature-driven buoyancy, which is unlikely in an estuary where salinity differences are large enough to govern stratification and where persistent stratification is challenged by nighttime convection. Further, this analysis focuses on temperature anomalies over many years, so any detected plume persists in the face of mixing and convection long enough to skew the repeat observations.
Earth-observing satellites measure outgoing electromagnetic radiation at a variety of wavelengths. Tuned to wavelengths longer than the visible range, thermally sensitive sensors on these satellites measure radiation that is strongly affected by surface temperature. By using principles from Planck's Law, the radiation measured by satellites can be converted to brightness temperature assuming that the surface is a black body (Mustard et al., 1999). While this data is useful, long-wavelength light cannot penetrate deeply into bodies of water, so water temperature determined through this method only represents the top 10μm, or skin, of the water's surface, meaning that satellite-derived thermal data can differ from the bulk water temperature when mixing is weak (Emery et al., 2001). A good correlation between satellite-derived temperature and in situ temperatures near the surface is expected, though satellite data is often cooler than in situ temperature because of evaporative cooling and can vary depending on wind conditions (Schneider and Mauser, 1996).
The USGS Landsat Surface Reflectance Tier 1 (United States Geological Survey, 2021) data products for Landsat 5, Landsat 7, and Landsat 8 are used in this analysis and include calculated brightness temperature for the thermal bands of each satellite. These thermal bands are Landsat 5 Thematic Mapper (TM) and Landsat 7 TM band 6, tuned to 10.40–12.50μm at 120 m/pixel and 60 m/pixel resolution, respectively, and Landsat 8 Thermal Infrared Sensor (TIRS) band 10, tuned to 10.60–11.19μm at 100 m/pixel resolution. The combination of these three satellites provides a continuous record from 1984 to the present with Landsat 5 operational from March 1984 to June 2011, Landsat 7 from April 1999 to the present, and Landsat 8 from February 2013 to the present. Each satellite passes over any specific location every 16 days, with an 8 day offset between satellites that operate simultaneously, and their sun-synchronous orbits ensure that all data over Narragansett Bay is taken at ~15:30 GMT. However, the availability of data is much less frequent due to clouds and the scheduling of data processing. All data were resampled to 30 m/pixel resolution using cubic convolution before being accessed through Google Earth Engine.
Narragansett Bay falls within path 12, row 31 of the WRS-2 reference system. Landsat scenes over this location also include much of southeastern New England, Boston Bay, parts of Long Island Sound, and much of the coastal shelf south of Rhode Island. From the available 887 Landsat scenes in this location, all scenes with <50% cloud cover over Narragansett Bay are removed, resulting in 582 usable scenes for this analysis with an average of 23 days between observations. These selected scenes are then land and cloud masked by using a land mask from Hansen et al. (2013) and cloud quality attributes in the data.
One problem faced when using satellite remote sensing to image land and water surfaces is how to account for absorption and emission of radiation from the atmosphere. The approach here is to quantify average satellite bias and uncertainties due to atmospheric and other effects by comparing to in situ surface buoy data. This analysis is done separately for each satellite because the thermal band on Landsat 8 is tuned to different wavelengths than the thermal bands on Landsat 5 and Landsat 7. The mean bias between satellite and buoy measurements is added to all data from the corresponding satellite, and the standard deviation of the mean differences after adding the bias represents the measurement uncertainty at any pixel, which quantifies typical variations that cause the buoy and bias-corrected satellite measurements to disagree. This bias correction calibrates the satellites against a consistent baseline of in situ data by quantifying the accuracy (bias) and precision (measurement uncertainty) of each satellite. After bias correction, the distributions of the differences between satellite and buoy measurements are nearly centered Gaussian distributions, so the use of standard deviation is appropriate. The measurement uncertainty of data using this method decreases with the number of scenes averaged together (assuming they represent different weather and thus are independent, consistent with the 23 day sampling period), though sampling uncertainty proves to be important as well.
To make the satellite comparison to in situ data, surface buoy data taken between 15:00 and 16:00 GMT on the dates of satellite flyby are compared to satellite-derived temperature averaged between non-masked pixels within 200 m of the buoy locations. The in situ data comes from a network of buoys in Narragansett Bay operated by the Rhode Island Department of Environmental Management (Rhode Island Department of Environmental Management, 2015) as shown in Figure 1. Data from 2003 to 2015 were used to conduct this analysis because all three Landsat satellites were operational for a portion of this period and the buoy network was dense at that time. In total, 1,261 buoy measurements were compared to Landsat data from 13 RI DEM buoys with 382 of those measurements compared to Landsat 5, 646 to Landsat 7, and 233 to Landsat 8.
The satellite to buoy comparison is depicted in Figure 2 with the calculated biases and measurement uncertainties given in Table 1. All satellites show a high correlation between remotely sensed and in situ temperature with correlation coefficients >0.96. Satellite-derived temperature is found to be cooler than in situ temperature typically, which is consistent with other studies that used Landsat to quantify surface water temperature (Schneider and Mauser, 1996; Mustard et al., 1999). The Landsat 5 and Landsat 7 biases and uncertainties are similar, while the Landsat 8 bias and uncertainty differ significantly. This result is consistent with the fact that the Landsat 8 TIRS thermal band is tuned to different wavelengths than the Landsat 5 and Landsat 7 TM bands. To confirm the accuracy of this method, mean temperature values over all of Narragansett Bay during the periods the satellites overlap are compared as measured by different satellites (Figure 3). Only considering measurement uncertainty, the mean values fall inside of the margin of error for the comparison between Landsat 7 and Landsat 8 over 2013–2020 but outside the margin or error for Landsat 5 and Landsat 7 over 1999–2013. Considering sampling uncertainty, both cross-satellite comparisons fall within the margins of error, indicating that sampling uncertainty is important for this analysis. The sampling uncertainties are estimated by bootstrapping the mean temperature over all cloud-free pixels in Narragansett Bay.
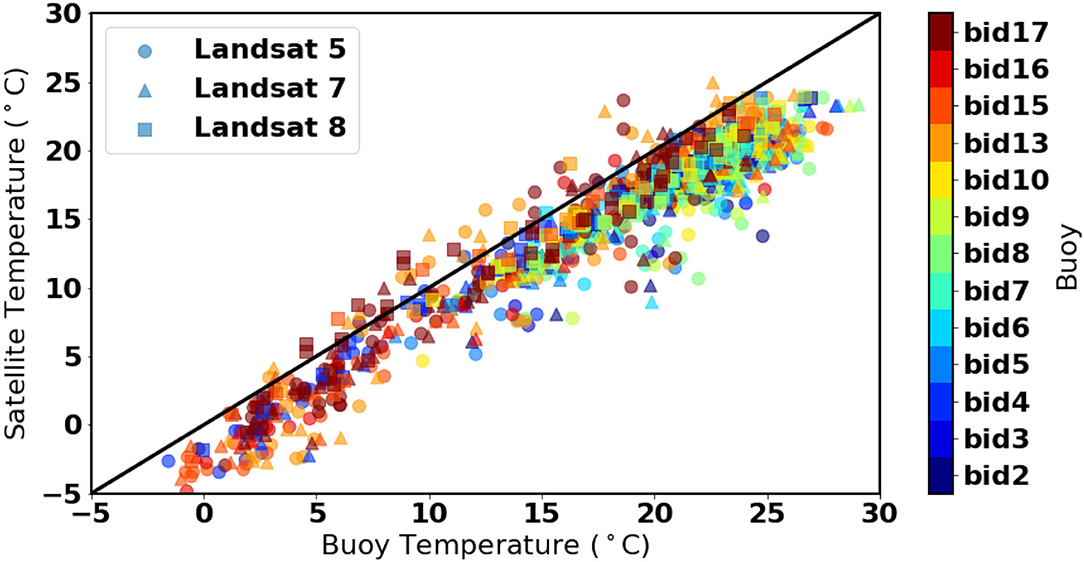
Figure 2. Comparison between Landsat-derived temperature and surface in situ buoy measurements. The black line represents a 1:1 relationship for reference.

Table 1. Calibration terms for Landsat satellites: The bias term represents the mean difference between satellite and buoy surface temperature and the error term represents one standard deviation of this difference.
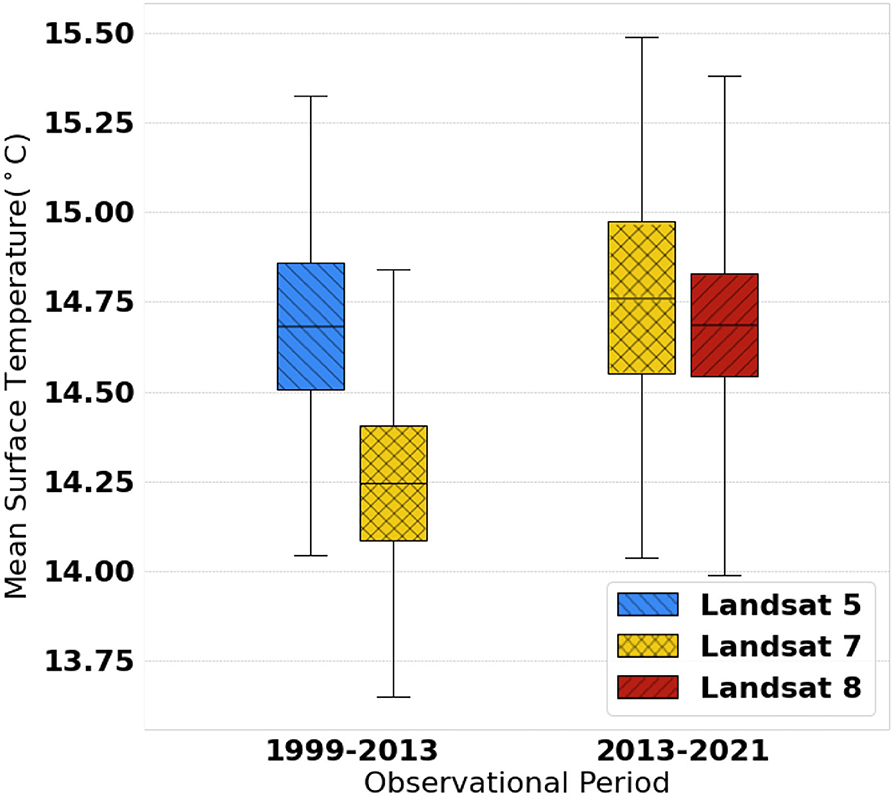
Figure 3. Assessment of inter-satellite calibration by comparing surface temperature averaged over all of Narragansett Bay for overlapping time periods of each satellite. The central bars represent the means while the box edges represent propagated measurement uncertainty (from Table 1) and the whiskers represent sampling uncertainty estimated by bootstrapping.
After correction, satellite data are used in this analysis to determine climatic change and changes due to reduced thermal pollution. The overall warming trend detected in this analysis is unlikely to be an artifact of satellite calibration as the more recent satellites measured cooler temperatures on average and satellites are shown to be consistent within their uncertainties. To ensure a robust consideration of both sampling and measurement uncertainty in these changes, Gaussian noise is added to all data based on measurement uncertainty before bootstrapping is conducted on the trends as described in section 2.4.
Once the scenes are filtered, masked, and bias-corrected, a climatology is created that accounts for the non-uniform temporal spacing of the data following methods similar to Fisher and Mustard (2004): all scenes are arranged by day of year and, on a per-pixel basis, a harmonic curve of the form of Equation (1.1) is fit to the data as visualized in Figure 4. The constant term, α, captures the mean annual temperature while the combination of the cosine and sine coefficients, β and γ, respectively, allow for phase shift and amplitude fitting. The period of the harmonic function is fixed at one year. The harmonic curve fitting method is appropriate because seasonal temperature variability in Narragansett Bay primarily follows a sinusoidal shape (Shearman and Lentz, 2010; Salacup et al., 2019).
After fitting, more readily interpreted coefficients, A and ϕ, describing amplitude and phase shift of a single sine function as shown in Equation (1.2) are calculated from β and γ using Equations (2) and (3). Figure 5 maps the resulting fitted parameters after pixel-wise regression for the 1984–2010 period. Note that the upper bay and rivers tend to have a warmer temperature, larger amplitude seasonal cycle, and precede the seasonal cycle in deeper water by about 15 days. The impact of the BPPS effluent is visible over this period as there is heightened mean temperature and a delayed seasonal cycle near Brayton Point.
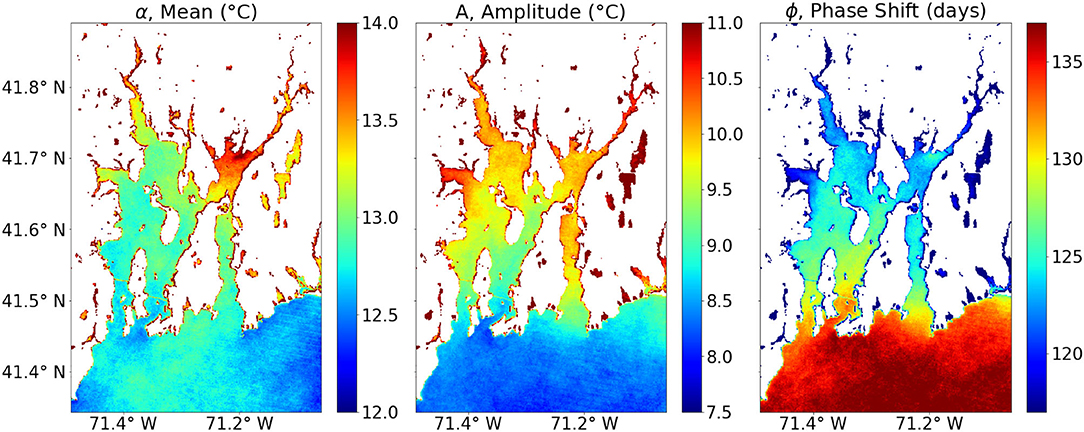
Figure 5. Maps of climatology coefficients as described by Equation (1.2) calculated over 1984–2010. The climatology from the entire observation period (1984–2021) was used to seasonally detrend the data. Here the impact of the BPPS effluent is visible as an increased α term and decreased ϕ term near Brayton Point, representing greater mean temperature by 1°C or more and a delayed seasonal cycle by up to 4 days.
It should be noted that a multi-year linear trend will not affect this climatology calculation and would be present as secular terms after the climatology is removed. After the climatology was calculated for each pixel over the entire observational period, the value of the fitted climatology at the day of year of observation was subtracted to yield the anomaly used to calculate interannual trends independent of seasonal variability.
To determine the immediate impact of stopping the BPPS thermal effluent, the seasonally-corrected anomalies for Narragansett Bay are subtracted from the anomalies for Mt. Hope Bay and a region near Brayton Point. Subtracting the mean estuary anomaly from the Mt. Hope Bay and Brayton Point regions gives an estimate for how large the anomaly near the effluent was independent of larger-scale variability on the specific days of observation. Time series are split up by season and long-term averages during and after effluent release are compared to determine temperature changes in the region due to changes in power plant operation. Here, seasons were divided by month with December, January, and February representing winter; March, April, and May representing spring; June, July, and August representing summer; and September, October, and November representing autumn.
To determine multi-decade trends from the seasonally-adjusted anomalies, linear regression is conducted at each pixel, producing a map of these trends in surface temperature from 1984 to 2021. Of primary importance, this map represents the spatial complexity of the region, allowing for a comparison of the long-term trends inside Mt. Hope Bay, assumed to be cooling with reduced thermal effluent, compared to other Narragansett Bay regions, which have been known to be warming due to climatic change. Categorizing the data by month before linear interpolation yields an analysis of how these trends vary based on the seasons.
Following previous work that conducted unsupervised clustering on Narragansett Bay temperature (Mustard et al., 1999), this work conducts K-means clustering during and after thermal effluent release (Lewis et al., 2008). Unsupervised clustering is a type of machine learning method that determines natural groupings of data based on relationships between predictors from many observations. K-means performs this clustering given k clusters by minimizing within-cluster distances. In this case, the three fitted climatology parameters (α, A, and ϕ from section 2.3), after normalization, serve as the predictors for observations at each pixel. The number of clusters, eight, was chosen by picking the smallest number of clusters that would identify the signal in Mt. Hope Bay while remaining close to the maximum inertia value—a measure of how internally coherent clusters are.
Clear reductions in the temperature anomaly in Mt. Hope Bay are found at the time the effluent stopped in 2011. Greater reductions in temperature are found closest to Brayton Point with plume visibility disappearing at the same time, as indicated by the plume's effects on mean temperature. Figure 6 depicts these results using an 8-year moving average of the temperature anomaly of Mt. Hope Bay and Brayton Point from the mean temperature of Narragansett Bay by season laid over the corresponding changes in map view. The temperature anomalies in these maps are the α fitting terms as described in section 2.3 after subtracting the mean α for the estuary as a whole. The fitting terms were calculated separately for each period using the 8-year intervals shown.
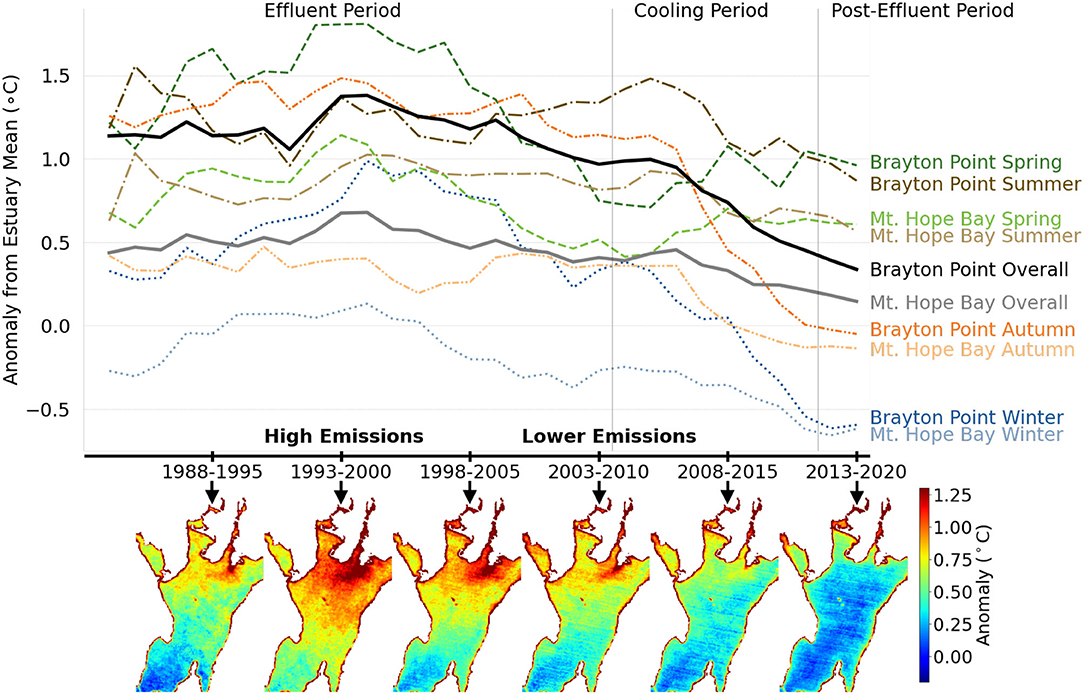
Figure 6. Average Mt. Hope Bay and Brayton Point temperature anomaly minus average Narragansett anomaly for each season using an 8-year moving average. The cooling period includes data from during and after effluent release due to the moving average. Plotted below the x-axis are maps of the mean temperature anomaly in Mt. Hope Bay as determined by subtracting the mean α term from Equation (1.2) from the α values determined at each pixel for the labeled periods.
The maps and time series in Figure 6 indicate that the effluent impact was the greatest during the 1993–2000 period, became weaker leading up to when the effluent was stopped completely in 2011, and rapidly declined afterward. There is no thermal plume in data taken after 2011. To quantify the amount of cooling for Brayton Point and Mt. Hope Bay, the mean temperature anomalies from the 2013 to 2020 period are subtracted from the 2003-2010 period, representing lower emissions, as well as from the 1993 to 2000 period, representing high emissions. Uncertainty in this metric was determined by using bootstrapping and taking the standard deviation of the resampled means. Immediate cooling in Mt. Hope Bay at the time when effluent stops totals −0.26 ± 0.1°C with the greatest cooling of −0.49 ± 0.3°C found in autumn followed by winter cooling of −0.35 ± 0.2°C. Summer cooling totaled −0.25 ± 0.2°C, and differences in spring were not statistically significant with 0.10 ± 0.2°C of warming. Close to Brayton Point, cooling was more intense for all seasons except spring with −0.62 ± 0.2°C cooling overall and a similar pattern of greatest cooling in autumn, then winter, then summer. Differences for the high emissions period are larger for all seasons with overall cooling of −0.53 ± 0.3°C in Mt. Hope Bay and −1.04 ± 0.2°C at Brayton Point. For the higher emissions period, winter cooling is the greatest in Mt. Hope Bay with spring and autumn cooling equal and summer cooling the weakest. The Brayton Point differences for the high emission period are scaled-up versions of the low emissions case for winter and autumn, but spring differences become larger than summer differences. Upper Narragansett Bay, near Warwick, serves as a control region for comparison to Mt. Hope Bay. All values in Upper Narragansett Bay have an uncertainty range that contains zero for both periods. These numeric results are tabulated in Table 2.

Table 2. Temperature change in °C in Mt.0Hope Bay, Brayton Point, and Upper Narragansett Bay (control).
K-means clustering, a form of unsupervised pattern recognition, confirms the distinct nature of the thermal effluent as shown in Figure 7. Clustering using eight clusters allows for a distinct grouping of the region affected by effluent in Mt. Hope Bay and a region in the upper Providence River located downstream of the Manchester St. Power Station, which releases thermal effluent to a much smaller extent than the BPPS. The upper Providence River is much shallower than Mt. Hope Bay, so it is unlikely that these two regions would naturally have similar seasonal temperature behavior. When conducting the same clustering on data without the effluent present, Mt. Hope Bay is clustered with upper Narragansett Bay regions and the Sakonnet River, regions with more comparable depths and widths for comparable exposure to winds and surface fluxes. This result confirms that the seasonal temperature behavior of Mt. Hope Bay was uniquely clustered because of the thermal effluent rather than for any unique characteristics of Mt. Hope Bay.
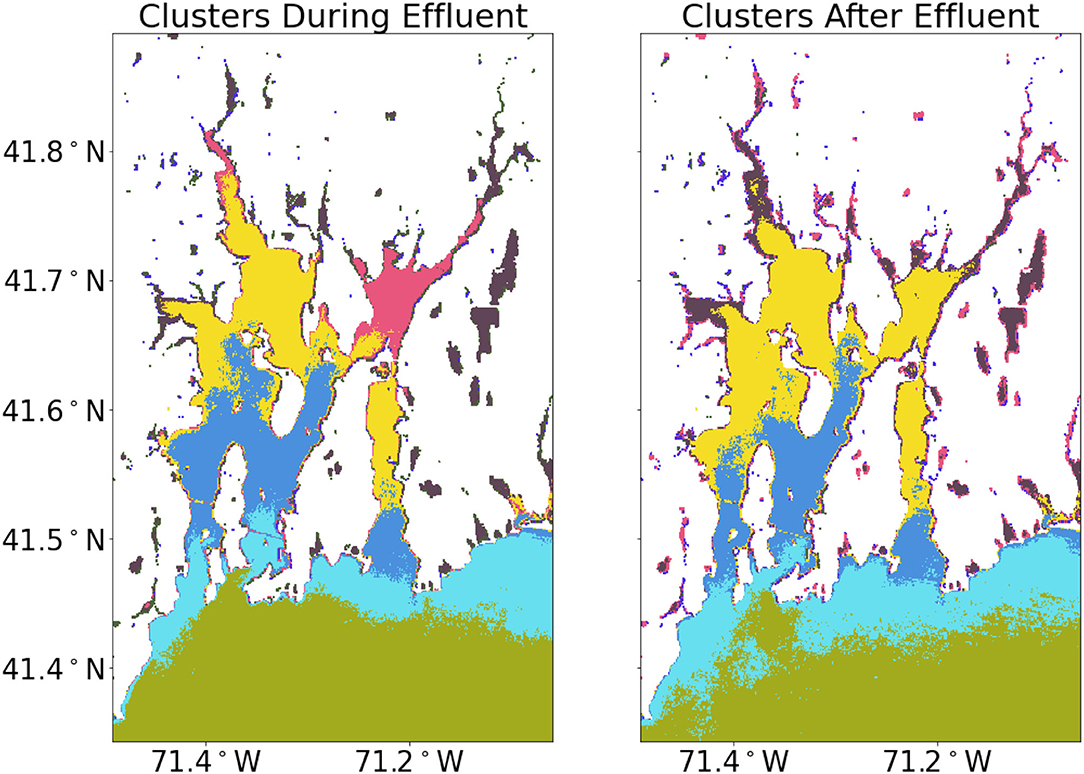
Figure 7. K-means clustering on mean, amplitude, and phase shift coefficients from climatology fitting, as described by Equation (1.2), during and after the BPPS effluent.
To investigate any long-term trends in Narragansett Bay over this period, linear regression analysis was conducted on the seasonally-adjusted anomalies described in section 2.3, depicted in Figure 8 for the Narragansett Bay mean.
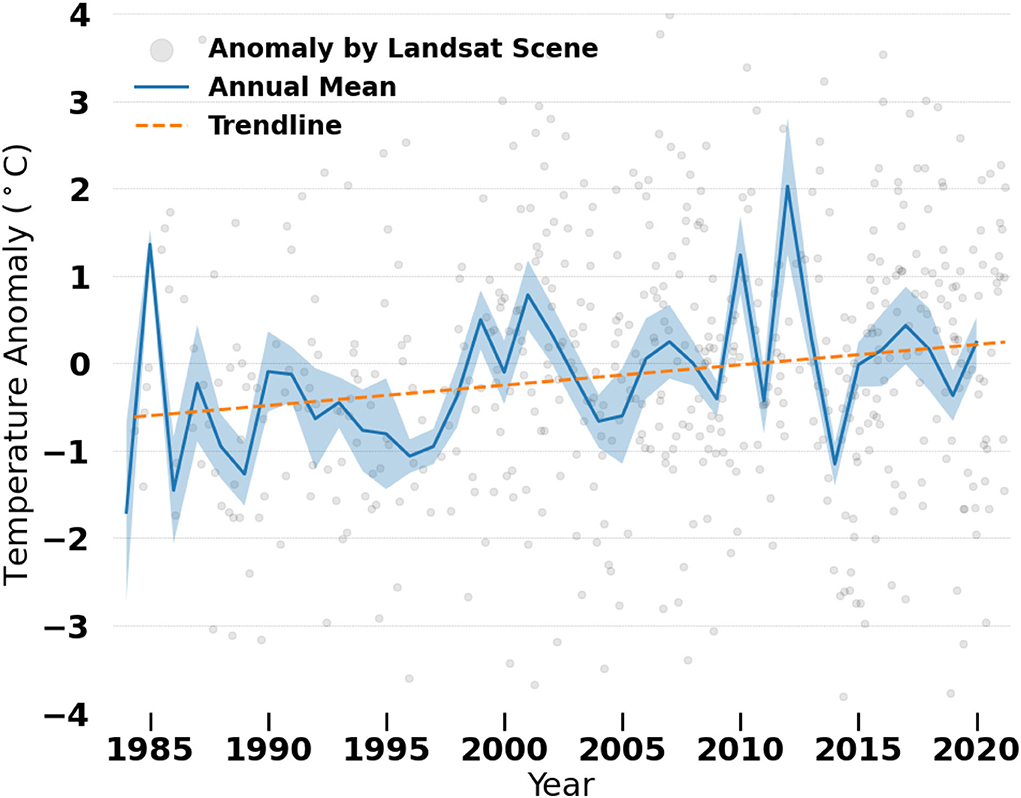
Figure 8. Time series of seasonally-detrended surface temperature anomaly over Narragansett Bay with the annual mean and a linear trendline taken before averaging. The uncertainty around the annual mean represents sampling uncertainty.
Applying this linear regression method to each pixel reveals significant spatial variation in surface temperature trends, particularly between Mt. Hope Bay and the rest of Narragansett Bay (Figure 9). The trends are characterized by overall Narragansett Bay warming of 0.23 ± 0.1°C/decade, significant cooling of −0.38 ± 0.2°C/decade concentrated near Brayton Point, and a near-zero trend of −0.02 ± 0.1°C/decade in Mt. Hope Bay. The Narragansett Bay warming trend is statistically significant for winter, summer, and autumn but not spring. Cooling at Brayton Point is only significant when it is largest in autumn due to large uncertainties from the smaller region of interest and fewer scenes used when split up by season. The Mt. Hope Bay trends for all seasons are indistinguishable from zero when considering uncertainty. The results from this trend analysis are tabulated in Table 3.
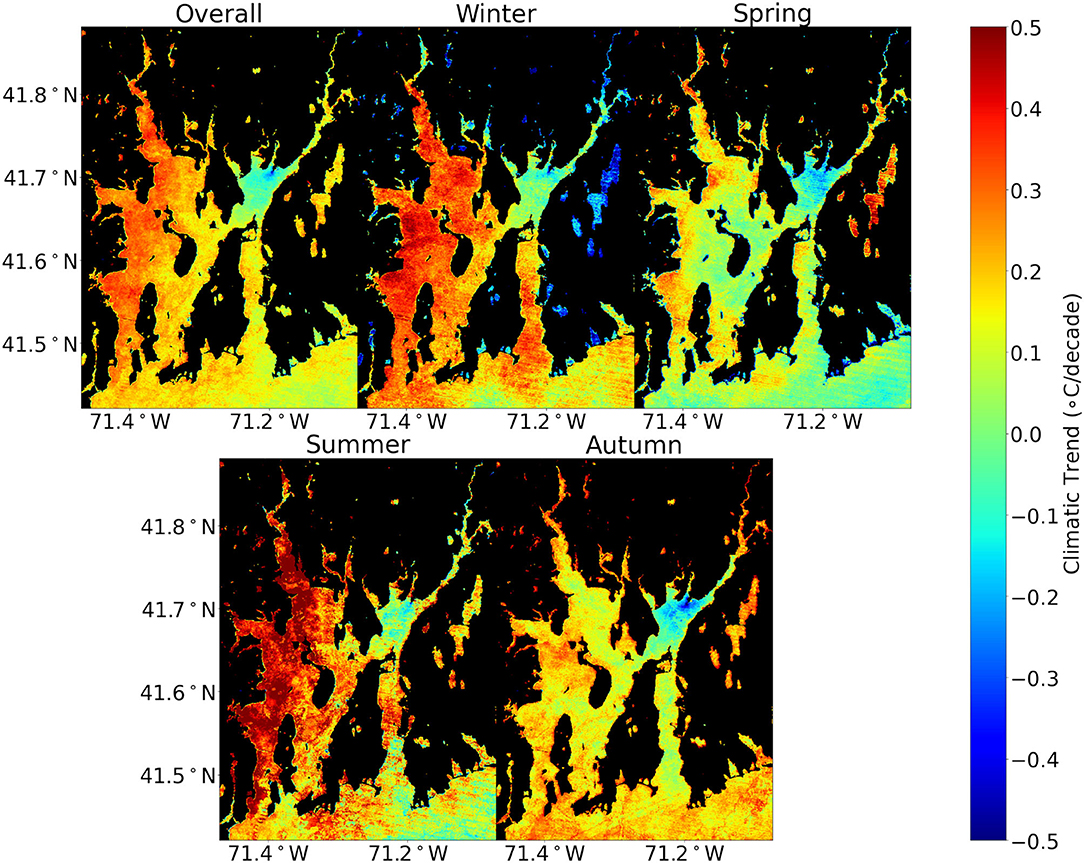
Figure 9. Pixel-wise surface temperature trends for 1984–2021 using linear regression on seasonally-detrended Landsat thermal data. Data were filtered by month before interpolation to divide the trends by season.

Table 3. Interannual surface temperature trends in °C/decade over the observational period for different Narragansett Bay regions over different seasons.
To ensure interannual trends are robust against sampling uncertainty, data were resampled using bootstrapping until the mean over all resampling converged. Further, individual noise was added based on selection from a Gaussian distribution, mimicking the measurement uncertainty as determined in section 2.2. Thus, the uncertainty measurement on the reported trend represents the standard deviation of the bootstrapped means after accounting for both sampling and measurement uncertainties.
Recent cooling in Mt. Hope Bay with respect to the rest of Narragansett Bay corresponds to the stopping and reduction of thermal effluent release, indicating that Mt. Hope Bay had an anomalously warm temperature while effluent was being released that has since been resolved. Maximum cooling at Brayton Point reveals that the greatest heat anomaly was at the location of the BPPS (Figure 6), pointing to the thermal effluent as the cause of the transient heat anomaly. The greater intensity of effluent impacts during the 1993–2000 period followed by decreasing impacts until a sharp drop after 2011 indicates that effluent impacts resolved gradually at first then more rapidly at the time the cooling towers became operational and effluent stopped (2011). As a result, the immediate cooling at 2011 does not equal the full 0.8°C warm anomaly found by Mustard et al. (1999). That study was conducted when effluent impacts were greater than the 2003–2010 period (preceding tightened regulations).
Comparing the Mustard et al. (1999) estimate to the maximal impact period (1993–2000), the 0.8°C falls within the higher end of the uncertainty for winter cooling at 0.70 ± 0.2°C and autumn cooling at 0.54 ± 0.3°C. The cooling measured in this study provides a smaller central estimate for the Mt. Hope Bay heat anomaly than estimated by Mustard et al. (1999)—although in agreement including uncertainties—likely because the impacts here are averaged over 8 years, rather than anomalies over a specific time when effluent and interannual variability might contribute (Figure 6, upper). Though the estimate for mean cooling over Mt. Hope Bay is smaller than previous estimates, there are regions closer to Brayton Point that experienced temperature anomalies of 1–1.5°C (see Figure 6).
Natural cycles in surface heat input from incoming radiation and in the volume of river transport are key to explaining why thermal effluent impacts are seasonally variable. Incoming radiation—including both shortwave radiation from the sun and longwave radiation from the atmosphere—is greatest during the summer and weakest during the winter, with spring and autumn having intermediate amounts. River transport also varies seasonally and is consistently greatest in the spring and winter. The ability of thermal effluent to significantly alter the temperature of Mt. Hope Bay depends on the scale of this impact with respect to these two natural heat and freshwater inputs.
Figure 10 represents the BPPS effluent impact as percent of total radiation on Mt. Hope Bay's surface and percent of upper Taunton river volume over an average seasonal cycle for a constant effluent heat and volume flux. BPPS effluent makes up a larger portion of the Mt. Hope Bay heat budget when compared to natural radiation fluxes in winter than in summer, explaining why the immediate cooling found in winter is large. Additionally, significant reductions in river fluxes in late summer and autumn explain why the low emissions BPPS impact is large (as indicated by post-effluent cooling since this period) in autumn but not spring, two seasons with similar radiation variability. Summer impacts are also regionally significant despite large total radiation because of this decreased river input and thus decreased flushing and dilution. Seasons with lower river input are able to maintain a greater heat anomaly from the effluent because a greater percentage of the river input is heated by the power station and longer flushing times mean less replacement by unheated waters.
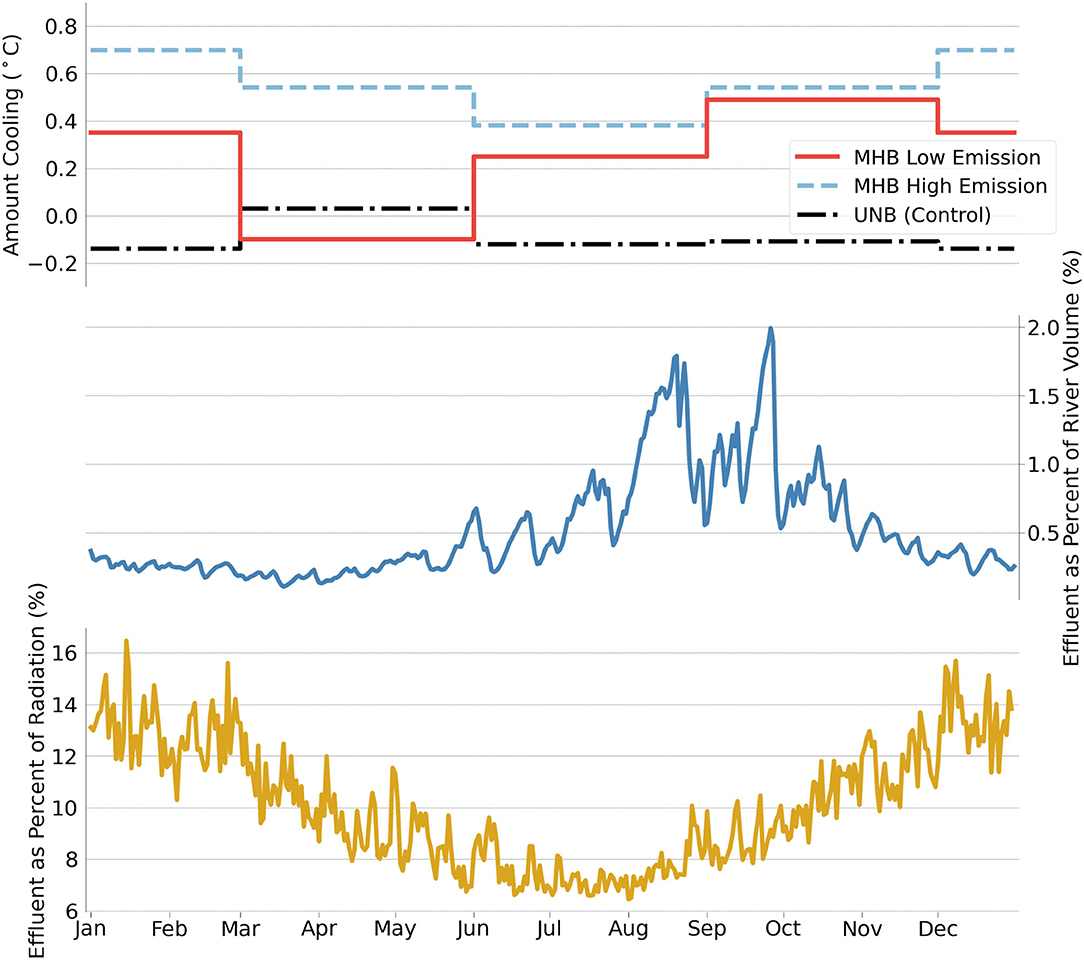
Figure 10. BPPS effluent volume and heat as a percent of river volume and total longwave plus shortwave radiation, respectively, plotted below the seasonal differences in the amount of cooling observed in Mt. Hope Bay (MHB) and Upper Narragansett Bay (UNB) as recorded in Table 2.
While the above explanation is consistent with the low emission case as the BPPS impact correlates with river and solar variability, the BPPS impact tracks radiation input more strictly for the high emissions case as shown in Figure 10, meaning that the winter impact is strongest, the summer impact is weakest, and the spring and autumn impacts are intermediate and similar. Here, the effluent heat input has grown to a point where cooling from river flushing is too slow to reduce the heat anomaly during seasons with even the highest rates of river input. As a result, effluent impacts follow the scale of the radiation budget as the dominant cooling mechanism independent of river input.
Near Brayton Point, the seasonal impacts follow the same pattern as Mt. Hope Bay for low emissions, with autumn having the greatest impact followed by winter, summer, then spring. For high emissions, the winter and autumn impacts both scale up, the summer impact grows only slightly, and the spring impact increases to between summer and winter. In this case, the weakened effect of river flushing and dilution during high emissions is also observed as the imbalance between spring and autumn becomes smaller. The impacts at Brayton Point remain more influenced by river input than in Mt. Hope Bay for high emissions, indicating that river input played a role in distributing effluent heat from its source to the rest of Mt. Hope Bay.
While the anomalous temperature of Mt. Hope Bay from BPPS thermal effluent was significant and has resolved, Narragansett Bay warming has been large enough over the period of observation to cause a similar amount of warming due to climate change as was of concern in Mt. Hope Bay due to effluent. The 0.9 ± 0.4°C of warming from 1984 to 2021 parallels the 0.53 ± 0.2°C of cooling observed in Mt. Hope Bay such that long-term trends in Mt. Hope Bay over this period are near zero, rather than cooling. This result does not discredit the large impact of the BPPS effluent; rather, it shows that the scale of climate warming has been great enough to impact a similarly large scale of warming in Narragansett Bay as a whole to what was previously only seen in Mt. Hope Bay. Stopping thermal effluent still prevented even warmer temperatures in Mt. Hope Bay on top of climatic change. Climatic warming has not yet surpassed the effluent's effect in the most impacted region near Brayton Point as the cooling trend there remains significantly negative.
The warming trend of 0.23 ± 0.1°C/decade for the Narragansett Bay mean is on the warmer side of the long-term in situ and paleoceanographic estimates taken over the past century, which indicate a warming of 0.06–0.26°C/decade (Shearman and Lentz, 2010; Smith et al., 2010; Salacup et al., 2019). This difference may indicate that temperature warming is accelerating in Narragansett Bay; however, a longer-term analysis is needed to confirm this result.
Though many of the threats from climatic warming to organismal behavior and biogeochemical cycling remain the same as threats from thermal effluent, the harms from the high local intensity of thermal effluent and the entrainment of organisms during effluent processing are no longer of concern. However, climatic warming presents its own issues as there are fewer cool refugia to which aquatic organisms can migrate, and large warming offshore comes with rises in sea level (Sweet et al., 2017; Oppenheimer et al., 2019).
This paper provides an explanation of seasonal variability in thermal effluent impacts on temperate estuaries from an observational perspective as well as contextualizes Narragansett Bay's climatic warming in the context of a particularly large thermal effluent. The persistence of temperature anomalies during all seasons and explanation for their variability only became clear in the context of this long-term, post-impact analysis. The results from this work serve as an indicator of how thermal effluent from operational power stations may impact temperate estuaries elsewhere.
Publicly available datasets were analyzed in this study. This data can be found here: Rhode Island Data Discovery Center (https://ridatadiscovery.org/#/) and the United States Geological Survey's Earth Explorer (https://earthexplorer.usgs.gov).
JB and BF-K contributed to the project design and conception, subsequent revisions of the manuscript, and approved the submitted version. JB conducted the primary data analysis as well as wrote the first draft of the manuscript. All authors contributed to the article and approved the submitted version.
This work was partially supported by the National Science Foundation and Brown University through the RI C-AIM program (National Science Foundation EPSCoR Award OIA-1655221) and partially by the Office of Naval Research ONR N00014-17-1-2963.
The authors declare that the research was conducted in the absence of any commercial or financial relationships that could be construed as a potential conflict of interest.
All claims expressed in this article are solely those of the authors and do not necessarily represent those of their affiliated organizations, or those of the publisher, the editors and the reviewers. Any product that may be evaluated in this article, or claim that may be made by its manufacturer, is not guaranteed or endorsed by the publisher.
Conversations with Jack Mustard and Karianne Bergen are gratefully acknowledged as having aided in selecting the scope and tools used in this project.
Abdelrhman, M. (2005). Simplified modeling of flushing and residence times in 42 embayments in New England, USA, with special attention to Greenwich Bay, Rhode Island. Estuar. Coast. Shelf Sci. 62, 339–351. doi: 10.1016/j.ecss.2004.09.021
Conley, D., Carstensen, J., Vaquer-SunyerCarlos, R., and Duarte, C. (2009). Ecosystem thresholds with hypoxia. Eutroph. Coast. Ecosyst. 207, 21–29. doi: 10.1007/s10750-009-9764-2
Dayan, D., Du, X., Baris, T., Wagner, D., Crawford, D., and Oleksaik, M. (2019). Population genomics of rapid evolution in natural populations: polygenic selection in response to power station thermal effluents. BMC Evol. Biol. 19:61. doi: 10.1186/s12862-019-1392-5
Deacutis, C., Murray, D., Prell, W., Saarman, E., and Korhun, L. (2006). Hypoxia in the upper half of Narragansett Bay, RI, during August 2001 and 2002. Northeastern Nat. 13, 173–198. doi: 10.1656/1092-6194(2006)13[173:HITUHO]2.0.CO;2
DeAlteris, J., Englert, T., and Burnett, J. (2006). Trends in fish abundance in Mount Hope Bay: is the Brayton Point Power Station affecting fish stocks? Northeastern Nat. 13, 95–116.
Ding, H., and Elmore, A. (2015). Spatio-temporal patterns in water surface temperature from Landsat time series data in the Chesapeake Bay, U.S.A. Remote Sens. Environ. 168, 335–348. doi: 10.1016/j.rse.2015.07.009
Dupigny-Giroux, L., Mecray, E., Lemcke-Stampone, M., Hodgkins, G., Lentz, E., Mills, K., et al. (2018). “Northeast,” in Impacts, Risks, and Adaptation in the United States, Vol. II, eds J. F. Knott (Washington, DC: Fourth National Climate Assessment), 669–742.
Emery, W., Baldwin, D., Schlussel, P., and Reynolds, R. (2001). Accuracy of in situ sea surface temperatures used to calibrate infrared satellite measurements. J. Geophys. Res. 106, 2387–2405. doi: 10.1029/2000JC000246
Fan, Y., and Brown, W. (2006). On the heat budget for Mount Hope Bay. Northeastern Nat. 13, 47–70. doi: 10.1656/1092-6194(2006)13[47:OTHBFM]2.0.CO;2
Fisher, J., and Mustard, J. (2004). High spatial resolution sea surface climatology from Landsat thermal infrared data. Remote Sens. Environ. 90, 293–307. doi: 10.1016/j.rse.2004.01.008
Geyer, W., and MacCready, P. (2014). The estuarine circulation. Annu. Rev. Fluid Mech. 46, 175–197. doi: 10.1146/annurev-fluid-010313-141302
Gibson, M. (2002). Winter Flounder Abundance Near Brayton Point Station, Mt. Hope Bay Revisited: Separating Local From Regional Impacts Using Long Term Abundance Data. RI Division of Fish and Wildlife Research Reference Document.
Hansen, M., Potapov, P., Moore, R., Hancher, M., Turubanova, S., Tyukavina, A., et al. (2013). High-resolution global maps of 21st-Century forest cover change. Science 342, 850–853. doi: 10.1126/science.1244693
Harley, C., Hughes, A., Hultgren, K., Miner, B., Sorte, C., Thornber, C., et al. (2006). The impacts of climate change in coastal marine systems. Ecol. Lett. 9, 228–241. doi: 10.1111/j.1461-0248.2005.00871.x
Lewis, J., Hull, P., Weinberger, K., and Saul, L. (2008). “Mapping uncharted waters: exploratory analysis, visualization, and clustering of oceanographic data,” in Seventh International Conference on Machine Learning and Applications (San Diego, CA), 388–395. doi: 10.1109/ICMLA.2008.125
McBryan, T., Anttila, K., Healy, T., and Schulte, P. (2013). Responses to temperature and hypoxia as interacting stressors in fish: implications for adaptation to environmental change. Integr. Compar. Biol. 53, 648–659. doi: 10.1093/icb/ict066
Melrose, D., Oviatt, C., and Berman, M. (2007). Hypoxic events in Narragansett Bay, Rhode Island, during the summer of 2001. Estuar. Coasts 30, 47–53. doi: 10.1007/BF02782966
MERCINA Working Group, Pershing, A., Greene, C., Hannah, C., Sameoto, D., Head, E., et al. (2015). Oceanic response to climate in the Northwest Atlantic. Oceanography 14, 76–82. doi: 10.5670/oceanog.2001.25
Miller, W., and Harding, L. Jr. (2007). Climate forcing of the spring bloom in Chesapeake Bay. Mar. Ecol. Prog. Ser. 331, 11–22. doi: 10.3354/meps331011
Monsen, N., Cloern, J., Lucas, L., and Monismith, S. (2002). A comment on the use of flushing time, residence time, and age as transport time scales. Limnol. Oceanogr. 47, 1545–1553. doi: 10.4319/lo.2002.47.5.1545
Mustard, J., Carney, M., and Sen, A. (1999). The use of satellite data to quantify thermal effluent impacts. Estuar. Coast. Shelf Sci. 49, 509–524. doi: 10.1006/ecss.1999.0517
Mustard, J., Swanson, C., and Deacutis, C. (2001). Narragansett Bay From Space: A Perspective for the 21st Century. National Aeronautics and Space Administration.
Neto, A. G., Langan, J. A., and Palter, J. B. (2021). Changes in the Gulf Stream preceded rapid warming of the Northwest Atlantic Shelf. Nat. Commun. Earth Environ. 2:74. doi: 10.1038/s43247-021-00143-5
Oppenheimer, M., Glavovic, B. C., Hinkel, J., van de Wal, R., Magnan, A. K., Abd-Elgawad, A., et al. (2019). IPCC Special Report on the Ocean and Cryosphere in a Changing Climate. Intergovernmental Panel on Climate Change.
Oviatt, C., Smith, L., Krumholz, J., Coupland, C., Stoffel, H., Keller, A., et al. (2017). Managed nutrient reduction impacts on nutrient concentrations, water clarity, primary production, and hypoxia in a north temperate estuary. Estuar. Coast. Shelf Sci. 199, 25–34. doi: 10.1016/j.ecss.2017.09.026
Pörtner, H., Langenbuch, M., and Michaelidis, B. (2005). Synergistic effects of temperature extremes, hypoxia, and increases in co2 on marine animals: from earth history to global change. J. Geophys. Res. 110. doi: 10.1029/2004JC002561
Rhode Island Department of Environmental Management (2015). Historical Buoy Data. Rhode Island Department of Environmental Management.
Rogers, J. (2008). Circulation and transport in upper Narragansett Bay (MS thesis). Graduate School of Oceanography, University of Rhode Island, Kingston, RI, United States.
Saba, V., Griffies, S., Anderson, W., Winton, M., Alexander, M., Delworth, T., et al. (2016). Enhanced warming of the Northwest Atlantic Ocean under climate change. J. Geophys. Res. 121, 118–132. doi: 10.1002/2015JC011346
Salacup, J., Farmer, J., Herbert, T., and Prell, W. (2019). Alkenone paleothermometry in coastal settings: evaluating the potential for highly resolved time series of sea surface temperature. Paleoceanogr. Paleoclimatol. 34, 164–181. doi: 10.1029/2018PA003416
Sane, A., Fox-Kemper, B., Ullman, D., Kincaid, C., and Rothstein, L. (2020). Consistent predictability of the Ocean State Ocean Model (OSOM) using information theory and flushing timescales. JGR: Oceans.
Schneider, K., and Mauser, W. (1996). Processing and accuracy of Landsat Thematic Mapper data for lake surface temperature measurement. Int. J. Remote Sens. 17, 2027–2041. doi: 10.1080/01431169608948757
Shearman, R., and Lentz, S. (2010). Long-term sea surface temperature variability along the U.S. east coast. J. Phys. Oceanogr. 40, 1004–1017. doi: 10.1175/2009JPO4300.1
Smith, L., Whitehouse, S., and Oviatt, C. (2010). Impacts of climate change on Narragansett Bay. Northeastern Nat. 17, 77–90. doi: 10.1656/045.017.0106
Sweet, W. V., Horton, R., Kopp, R. E., LeGrande, A. N., and Romanou, A. (2017). “Sea level rise,” in Climate Science Special Report: Fourth National Climate Assessment, Vol. I, eds D. J. Wuebbles, D. W. Fahey, K. A. Hibbard, and T. K. Maycock (Washington, DC: U.S. Global Change Research Program), 333–363.
Torgersen, T., DeAngelo, E., and O'Donnell, J. (1997). Calculations of horizontal mixing rates using 222rn and the controls on hypoxia in western Long Island Sound, 1991. Estuaries 20, 328–345. doi: 10.2307/1352348
United States Environmental Protection Agency (2003). Clean Water Act NPDES Permitting Determinations for Brayton Point Station's Thermal Discharge and Cooling Water Intake. Somerset, MA: United States Environmental Protection Agency.
United States Geological Survey (2021). Landsat 5, Landsat 7 and Landsat 8 Surface Reflectance Tier 1. United States Geological Survey.
Keywords: Narragansett Bay, Brayton Point Power Station, thermal pollution, remote sensing, Landsat, climate change, surface temperature
Citation: Benoit J and Fox-Kemper B (2021) Contextualizing Thermal Effluent Impacts in Narragansett Bay Using Landsat-Derived Surface Temperature. Front. Mar. Sci. 8:705204. doi: 10.3389/fmars.2021.705204
Received: 04 May 2021; Accepted: 11 August 2021;
Published: 07 September 2021.
Edited by:
Juan Jacobo Schmitter-Soto, The South Border College (ECOSUR), MexicoReviewed by:
Bo Nordell, Luleå University of Technology, SwedenCopyright © 2021 Benoit and Fox-Kemper. This is an open-access article distributed under the terms of the Creative Commons Attribution License (CC BY). The use, distribution or reproduction in other forums is permitted, provided the original author(s) and the copyright owner(s) are credited and that the original publication in this journal is cited, in accordance with accepted academic practice. No use, distribution or reproduction is permitted which does not comply with these terms.
*Correspondence: Jonathan Benoit, am9uYXRoYW5fYmVub2l0QGJyb3duLmVkdQ==
Disclaimer: All claims expressed in this article are solely those of the authors and do not necessarily represent those of their affiliated organizations, or those of the publisher, the editors and the reviewers. Any product that may be evaluated in this article or claim that may be made by its manufacturer is not guaranteed or endorsed by the publisher.
Research integrity at Frontiers

Learn more about the work of our research integrity team to safeguard the quality of each article we publish.