- 1Molecular Invertebrate Systematics and Ecology Laboratory, Graduate School of Engineering and Science, University of the Ryukyus, Nishihara, Japan
- 2Physics and Biology Unit, Okinawa Institute of Science and Technology Graduate University (OIST), Onna-son, Japan
- 3The Oceancy MitteTulundusÜhing, Kuusalu Parish, Estonia
- 4Tropical Biosphere Research Center, University of the Ryukyus, Nishihara, Japan
Substrate surface area and fractal complexity have been reported to influence the abundance and diversity of mobile cryptic animal communities. Surfaces with higher fractal dimensions not only offer additional space for colonization, but bias space availability toward smaller size ranges, increasing the number of available niches. Conversely, smaller surface areas tend to be associated with a decrease in abundances while reduced fractal complexities may support less diversity in the benthic community. In this study, we compared morphological parameters between rubble sampled from rubble mounds accumulated at the seaward side of artificial breakwaters and rubble sampled from a nearby location with no breakwaters (=control site). The purpose of this work was to establish a methodology for comparing the surface area and fractal complexity of coral rubble fragments using easily available equipment that could be efficiently utilized during field work. Rubble fragments were individually weighed and photographed in controlled light conditions. Each photograph was then analyzed using ImageJ software. Rubble pieces from each photograph went through segmentation, the separation of sample outlines from the picture background, before being measured and analyzed for surface area, width, and length (size estimators), and circularity, aspect ratio, roundness, solidity, and Feret properties (shape estimators). Surface fractal complexity was also measured, using the box counting method on segmented rubble surfaces. We observed lowered surface areas, weight, and fractal complexity for rubble fragments sampled at the breakwater. We demonstrate how this method could be used to compare coral rubble from a variety of environmental conditions, thus becoming a useful aid in environmental monitoring, in addition to adding important information to the collection and analyses of biological data.
Introduction
Substrate surface area and fractal complexity have been reported to influence the abundance and diversity of living organisms, both marine and terrestrial (McClanahan, 1994; Kostylev et al., 2005; Soares et al., 2021). In general, more spatially complex substrates can host a higher number of organisms (Fraser and Sedberry, 2008). Habitat complexity can be expressed by the fractal dimension (D) (Mandelbrot, 1967), which Tokeshi and Arakaki (2012) summarized as “the density of a projected profile of solid geometry in a chosen plane.” The same authors pointed out how the fractal dimension of a surface alone might not be adequate to assess the overall habitat complexity. The fractal dimension of a surface represents the complexity of its geometry (Mandelbrot, 1983). Fractal dimension is a good indicator of environment heterogeneity and has been used in previous studies, including at tropical latitudes (Kostylev et al., 2005).
Besides offering additional space for colonization, substrates with higher fractal dimensions seem to provide additional opportunities for colonization of organisms of different size ranges and functional traits, increasing the number of available niches. While the total surface area seems to be more strongly associated with abundance, fractal complexity is more strongly connected with diversity (Kostylev et al., 2005).
The complex three-dimensional skeletal structures of scleractinian corals host a variety of sessile and mobile animals of variable size called cryptofauna (Enochs, 2012). Organisms from the reef cryptofauna are essential for the functionality of coral reef ecosystems, both in terms of biomass (they constitute the largest part of reef’s diversity; Richter et al., 2001) and functionality, since they contribute to the aggregation and recycling of nutrients, providing biomass upwards in the trophic net (Richter et al., 2001; Kramer et al., 2013; Wolfe et al., 2020). Even coral rubble, dead coral skeletal frameworks detached from the substrate, has been shown to host a rich and diverse community and, for this reason, has been used as an indicator of reef diversity and environmental impact (Takada et al., 2014; Wee et al., 2019). When analyzing different reef substrates, Enochs and Manzello (2012b) observed that the highest richness in cryptofauna was surprisingly found within coral rubble, which hosted significantly higher cryptic diversity than healthy corals. Moreover, previous research has suggested that cryptofaunal abundance and diversity are linked with habitat type (Wolfe et al., 2020), and influenced by rubble shapes and complexity (Biondi et al., 2020). Branching rubble fragments appear to support more biodiversity and animal abundance than massive rubble (Biondi et al., 2020).
A variety of human activities (such as coastal armoring, dredging, and land reclamation) have the potential to alter the structure of the benthic substrate components and coastal armoring in particular can lead to the formation of rubble mounds at the seaward side of breakwaters (Masucci et al., 2020). Following our observations in Okinawa Island (southwest Japan) of differences in rubble cryptofauna abundance and diversity between samples from a breakwater and others from nearby control sites (with rubble from control sites characterized by higher abundances and diversity levels, Masucci et al., 2021), and of differences in abundance and diversity based on rubble shape (Biondi et al., 2020), we decided to further investigate the nature of the rubble mounds facing breakwaters. This was done by sampling coral rubble from these mounds and comparing their morphological parameters with those of rubble sampled at natural mounds from a nearby location with no breakwaters (=control site). As no uniform metric exists to measure or quantify rubble, the main purpose of this work was to establish a methodology for comparing the surface area and fractal complexity of coral rubble fragments using easily available equipment that could be efficiently utilized during field work. Because rubble plays a fundamental role in coral reef diversity, but a standardized procedure for measuring rubble is currently missing, this method could be a useful operative tool for practical applications such as impact assessments, habitat restorations, and monitoring.
Materials and Methods
Study Location and Survey Design
An ideal location to analyze the effects of coastal armoring should combine the presence of artificial barriers with low levels of population density and urban development. The north-west coast of Okinawa Main Island (North Kunigami Area, Figure 1) was chosen to conduct fieldwork. Data were collected from the Hentona breakwater (Figure 1C; GPS: 26°45′25.6″N 128°11′15.8″E), which was built in the 1980s, and a neighboring, non-armored region on the shore of Hentona village (Figure 1D; GPS: 26°45′05.4″N 128°11′04.5″E).
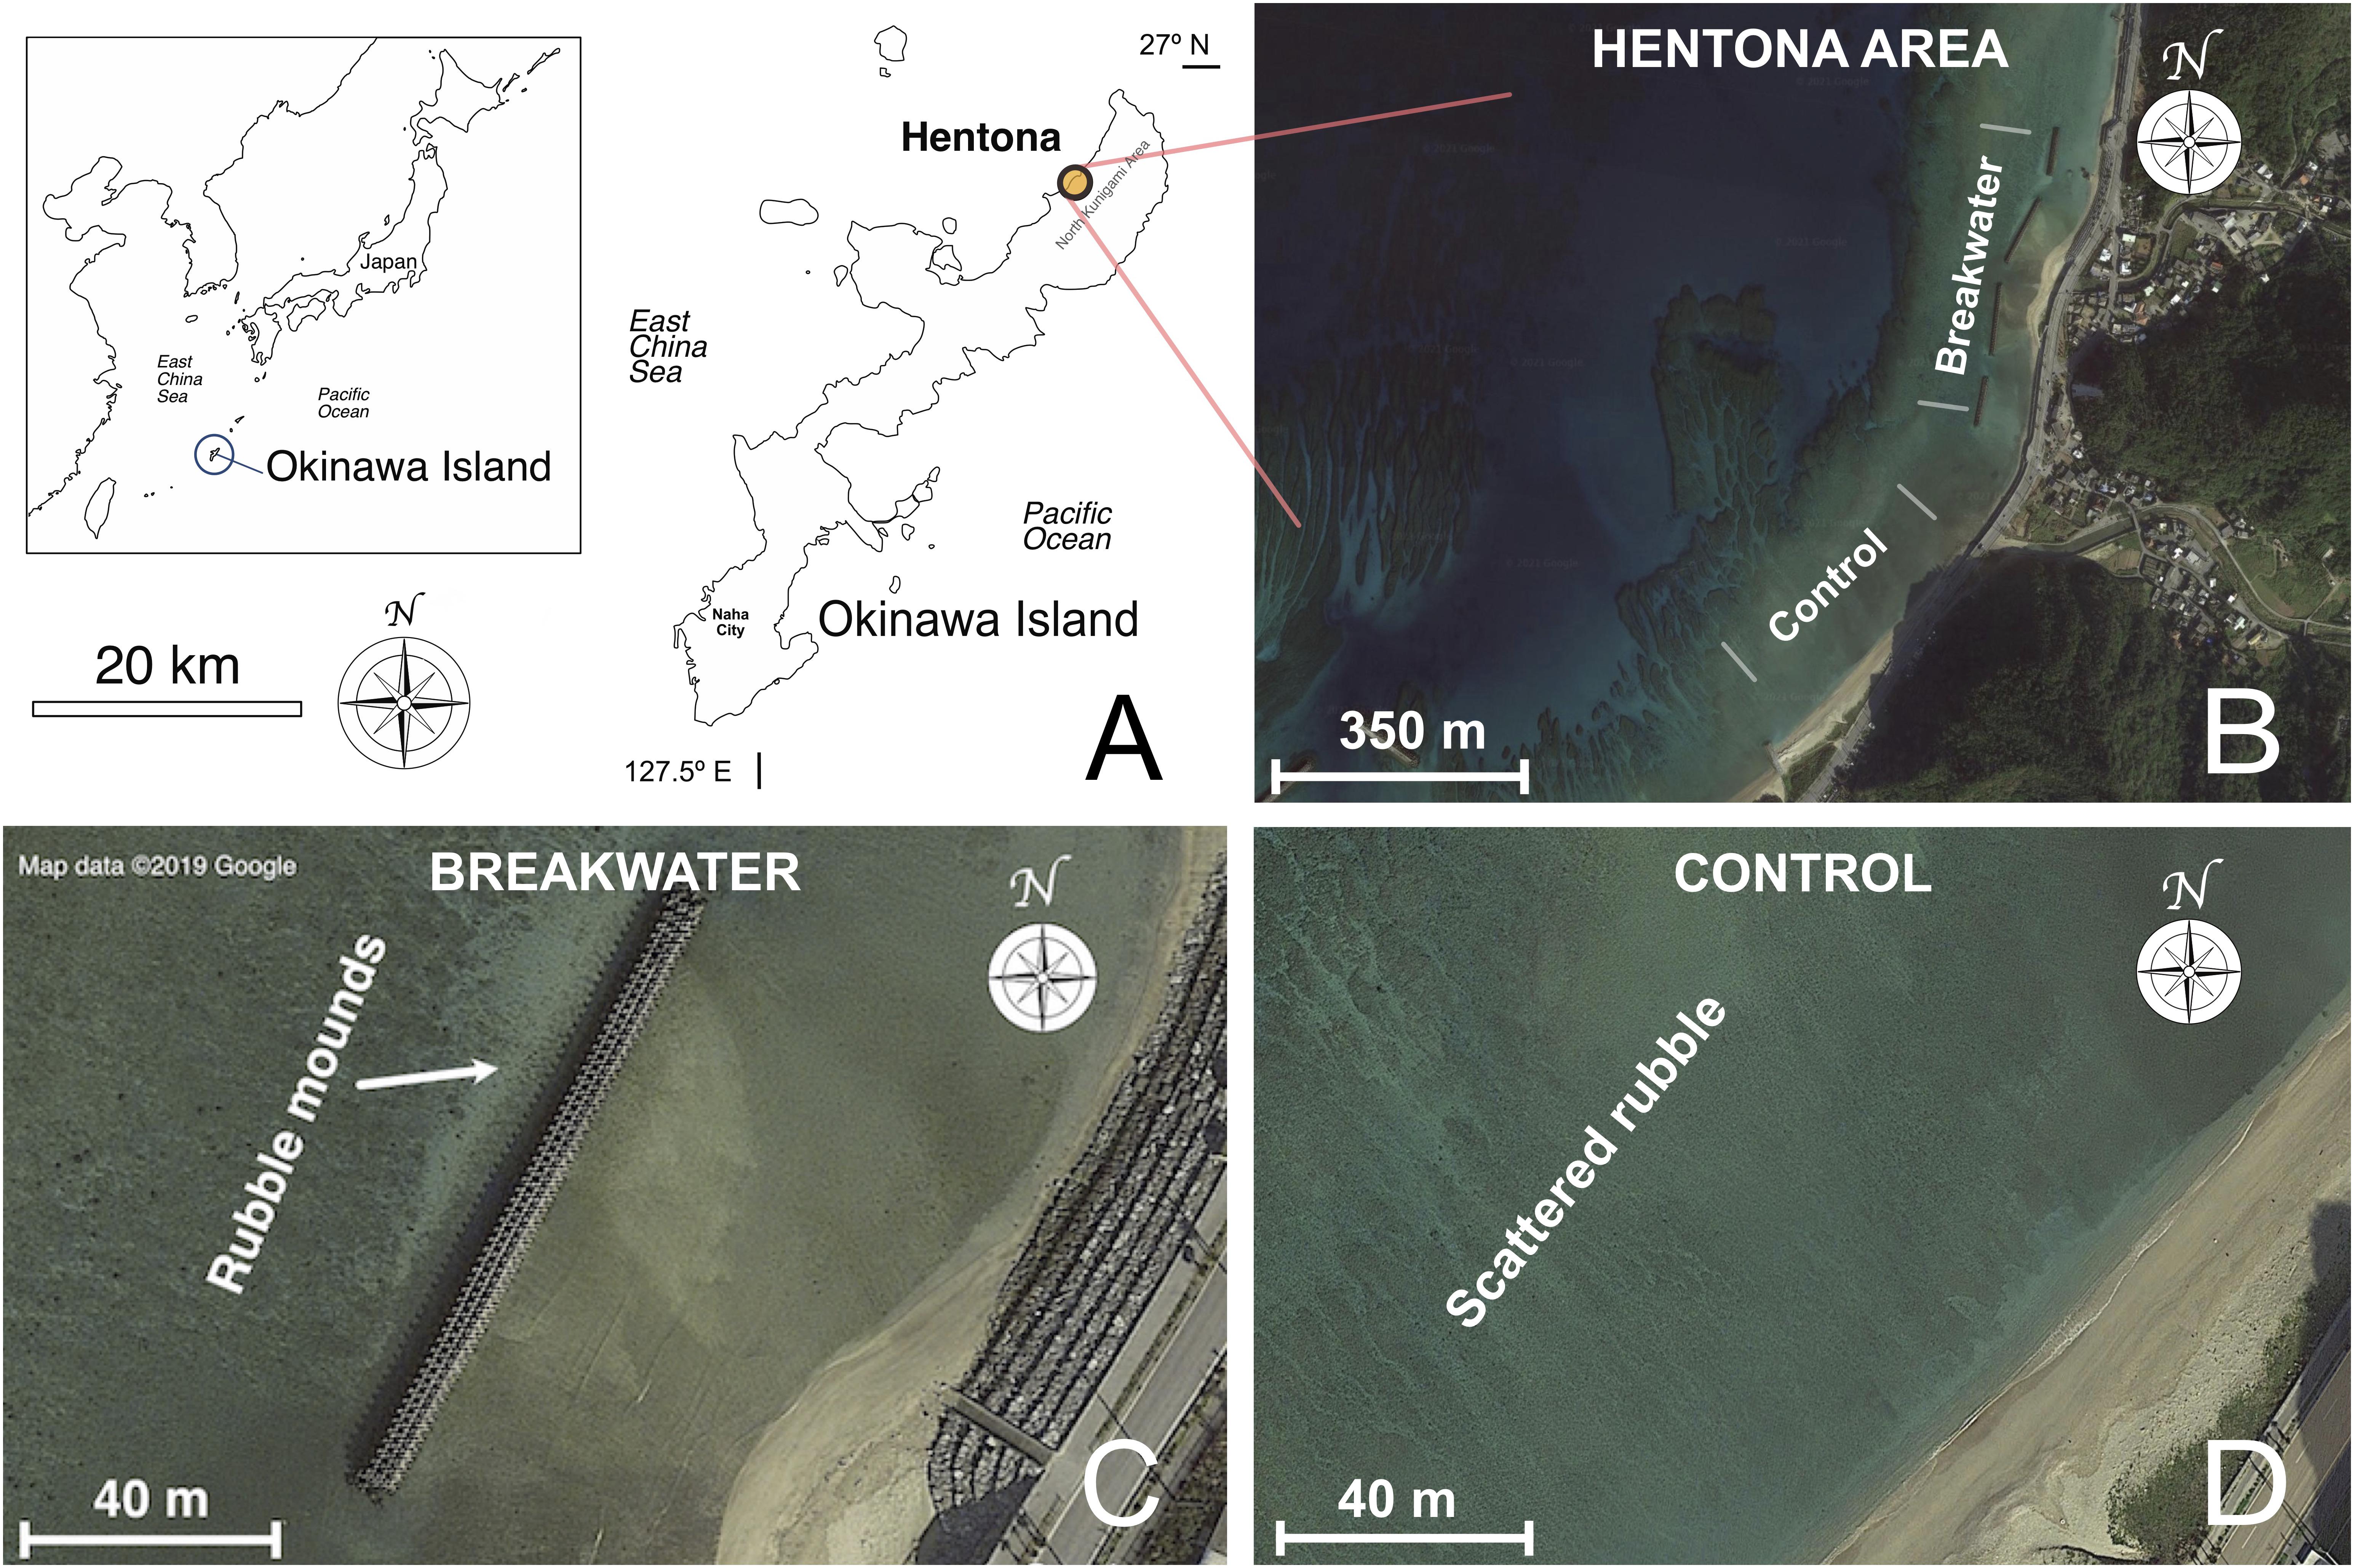
Figure 1. (A) Okinawa Island, southern Japan, north-west Pacific Ocean. The yellow circle highlights the Hentona area (North Kunigami), the geographical location where this study was conducted. (B) Satellite view of the Hentona area. (C) Detail of a portion of the Hentona breakwater. The arrow highlights the rubble mound formation at the seaward side of the barrier. (D) Detail of the Hentona control site. Rubble is scattered, no clear mound formation visible.
Rubble Size, Shape, and Fractal Complexity
Rubble was sampled by hand over 10 m transect lines (1 piece of rubble randomly taken every 3 m, swimming parallel to the coastline; for each site n = 20) and transported back to the shore using hermetically sealed buckets. Sampling was conducted at the surface of the rubble layer, at a depth of about 1.5 m for both sites, at the lowest astronomic tide. Tide normalization was performed using the WXTIDE software (ver. 32 4.7; Flater, 2007), set to the nearby Hentona tide station.
Rubble was transported to the laboratory and dried using an oven at 60°C for 48 h. Each rubble piece was individually measured with a ruler (width × length), weighted, and photographed under artificial light, with controlled and consistent light conditions, using a Sony a6300 24.2 MP APS-C camera and Sony E 30 mm f/3.5 macro lens (shutter speed = 1/160 s, aperture = f/10, ISO 250, manual white balance at 4750k, light provided by a strobe of guide number of 32 m, set at power level = 1/16, camera sensor positioned at a constant distance of 1 m from rubble samples, black background, scale included in each picture).
Rubble photographs (total N = 40) were then analyzed using the software ImageJ (version 1.52p; Schneider et al., 2012). After setting the scale, rubble from each photograph went through segmentation (the separation of sample outlines from picture background). In order to minimize bias from human operators, the segmentation workflow (Figure 2) was standardized, automatized and kept constant for the whole analysis, using the following ImageJ functions, in the reported order: “Process → Noise → DESPECKLE” (reduces digital noise and particles such as sand to avoid false positives in the automatic segmentation process); “Process → FIND EDGES” (automatic tracing or rubble outlines); “Process → Binary → MAKE BINARY”(produces a black and white outline); Finally, a visual check for unclosed lines (with the aid of the “Process → Binary → FILL HOLES” function), and manual fixing if needed. The resulting outlines were selected, saved as ROI files, and overlapped to the original image for measurements. Analyzed parameters (Schneider et al., 2012) included surface area, width, and length as size estimators, and as shape estimators: (a) Circularity, defined as the ratio between the inscribed and the circumscribed circumferences; (b) Roundness, the ratio between the minor and major axes of the object, (c) Aspect Ratio, the ratio between the major and minor axes of the object; (d) Solidity, the area of a particle divided by its convex hull area; (e) Feret properties, which describe the diameter of an elliptical fit for the object. Width and length measurements taken from pictures using ImageJ were compared with measurements of the same parameters taken from each rubble piece using a ruler, to compare the two approaches.
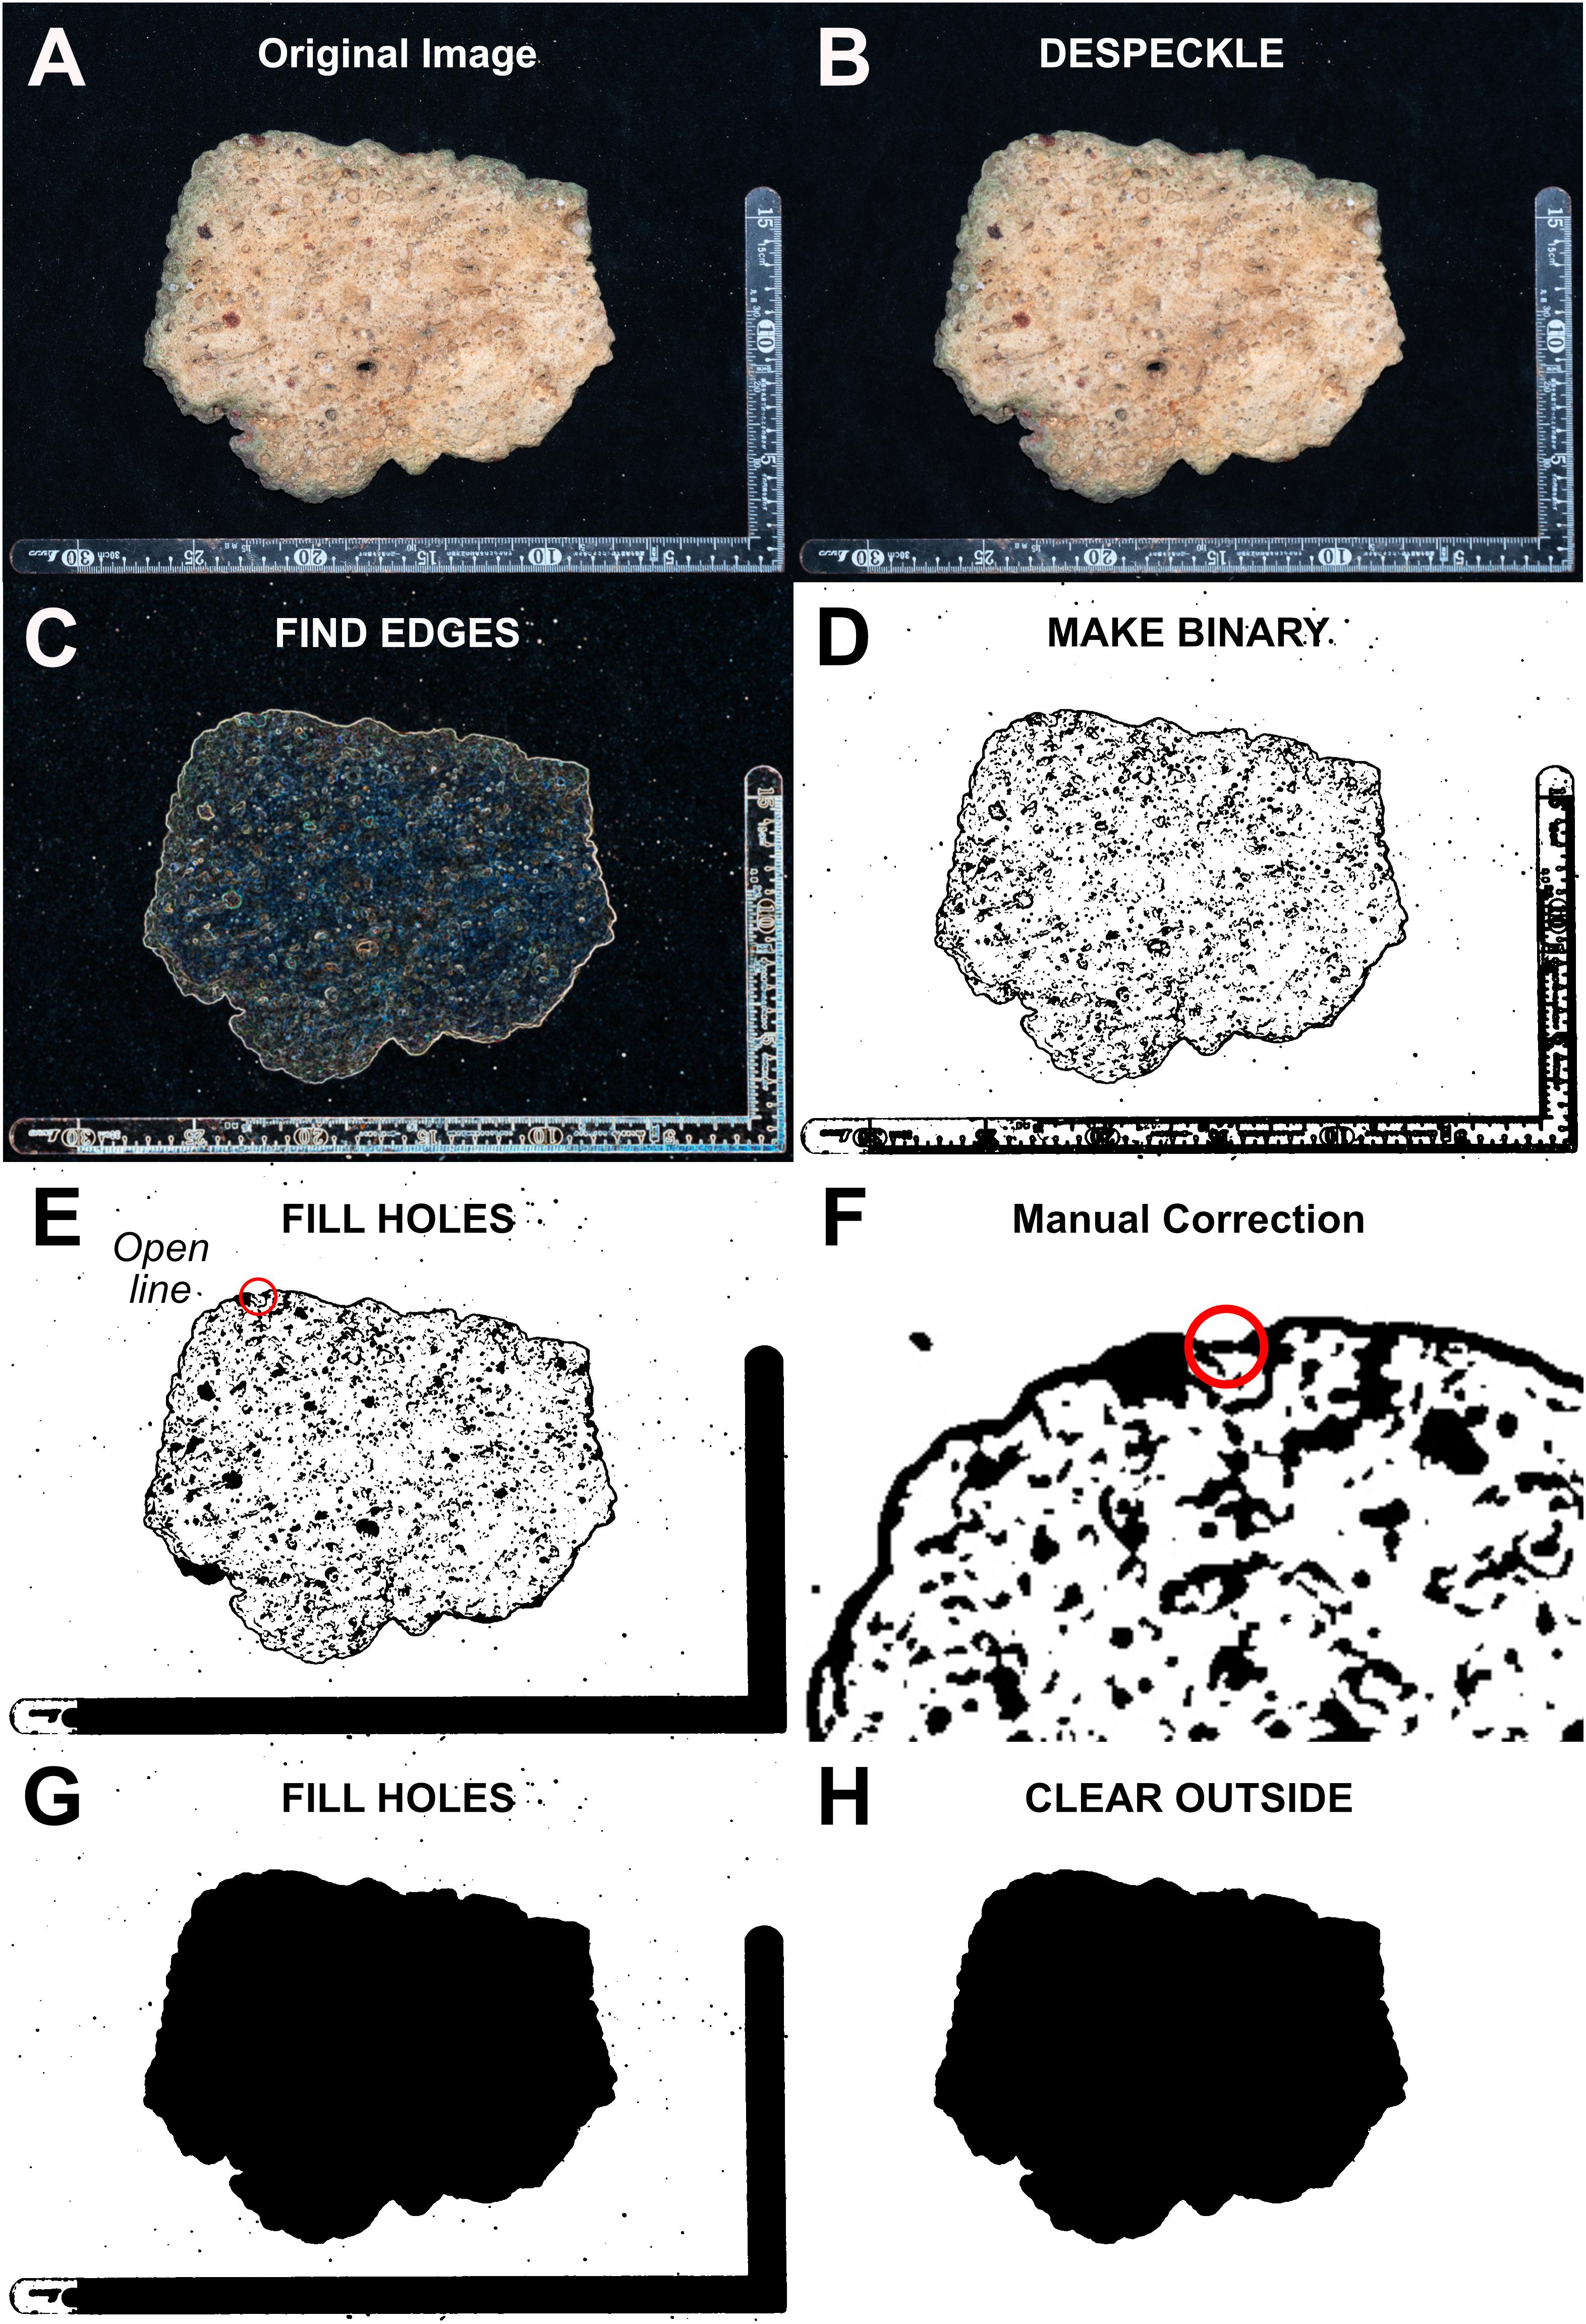
Figure 2. Rubble segmentation workflow from the original image to the final outline. ImageJ function names are written fully capitalized. (A) Original image. (B) DESPECKLE. The presence of digital noise, filaments, and sand particles has been reduced. (C) FIND EDGES. The outline of the rubble piece has been highlighted. (D) MAKE BINARY. Pixels have been converted to black or white values. (E) FILL HOLES. In this example, the outline was not closing perfectly (a red circle is added to this figure to highlight the problematic area). (F) Manual correction. The open spot within the red circle has now been manually fixed (traced). (G) FILL HOLES. The function confirmed that the outline was properly closed. (H) Final outline. If not needed, background elements can optionally be removed using the CLEAR OUTSIDE function.
Surface fractal complexity (Mandelbrot, 1967) was measured, using the box counting method (Liebovitch and Toth, 1989), by selecting segmented rubble surfaces, removing backgrounds with the function “Edit → CLEAR OUTSIDE,” converting the resulting files into binary images, and finally calling the ImageJ function “Analyze → Tools → FRACTAL BOX COUNT,” to calculate the fractal dimension (D) of the surface of each sampled rubble. Supplementary Figure 1 graphically summarizes the aforementioned sampling workflow.
Statistics
Statistical analyses were conducted by using R, v 3.6 (R Development Core Team, 2019). The level of significance for all tests was set at 95%. Normality and Homoscedasticity of variables were verified, respectively, with the Shapiro-Wilk test (Royston, 1982 and with the Bartlett’s test (Bartlett, 1937). Since most variables representing rubble size, shape, and fractal complexity variables were not normally distributed, they were analyzed using the non-parametric Wilcoxon rank-sum test (also known as Mann-Whitney test; Hollander and Wolfe, 1973). For the same reason, medians were used in place of means as descriptive statistics. The two methods for measuring weight and length (ruler measurements vs. photo analyses) were compared using a t-test. The dataset was then log-transformed and the effects of armoring on the overall shape of rubble were tested using 1-way PERMANOVA (Anderson, 2014), by using the “Adonis” function from the Vegan package for R (version 2.5-5; Oksanen et al., 2019), Bray-Curtis distance, and 999 permutations. Correlation patterns between variables were graphically displayed with a Principal Component Analysis (PCA), using the “rda” function from the Vegan package for R. Results were displayed as a biplot (scaling 2; Gabriel, 1971) with shape parameters expressed as labels and observations from different sites as triangular shapes.
Results
Overall, the automated segmentation process worked properly for all the analyzed rubble fragments pictures and was able to generate detailed outlines which required minimal or no manual correction. The manual correction of unclosed spaces between lines, when needed, only required the tracing of a small number of pixels. The “FILL HOLES” function of ImageJ was useful in terms of time savings, allowing to either highlight problematic instances in which automatically traced lines did not meet perfectly (Figure 2E) or providing confirmation of the proper closure of an outline (Figure 2G). In terms of time, the whole procedure could be performed in <5 min per picture.
Rubble Size, Shape, and Fractal Complexity
For the armored site, rubble weight (median) = 360.5 g, area (median) = 135.3 cm2, width (median) = 14.9 cm, and length (median) = 12.9 cm were smaller than those from the control; weight (median) = 2029.0 g, area (median) = 388.0 cm2, width (median) = 26.8 cm, and length (median) = 20.32 cm. Differences in medians were statistically significant for weight (Wilcoxon rank-sum test, W = 36, p < 0.001), area (Wilcoxon rank-sum test, W = 44, p < 0.001), width (Wilcoxon rank-sum test, W = 39, p = 2.4e06), and length (Wilcoxon rank-sum test, W = 71, p = 0.0003) (see Figure 3 for cumulative distributions of rubble weight and area). Width and length, when measured directly on rubble using a ruler, also showed significant results, but with higher p-values than when measuring the same parameters from pictures using ImageJ (width: Wilcoxon rank-sum test, W = 9, p = 0.002; length: Wilcoxon rank-sum test, W = 14.5, p = 0.001). When compared directly, the two methods did not show significant differences (width: t = 0.362, df = 41.438, p = 0.719; length: t = 0.693, df = 41.428, p = 0.492). The Minimum Feret diameters was significantly longer in rubble pieces from the control group (Wilcoxon rank-sum test, W = 68, p < 0.001) and so was the Maximum Feret diameter (Wilcoxon rank-sum test, W = 34, p < 0.001).
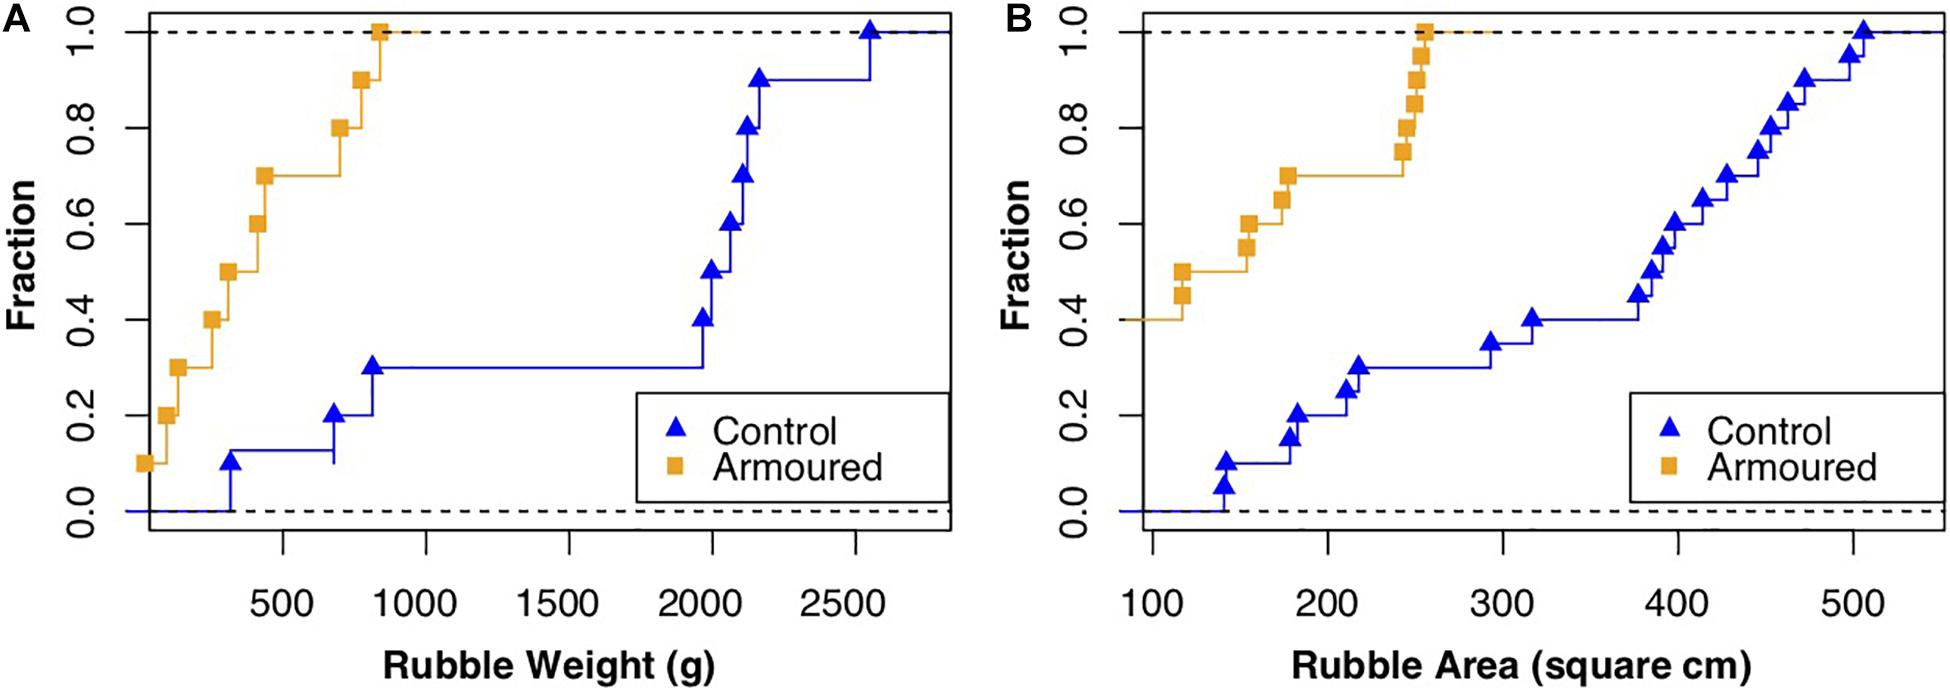
Figure 3. Cumulative curves of rubble (A) weight and (B) surface area for rubble sampled at breakwater and control site.
Although rubble sampled at breakwaters appeared to be slightly less elongated (higher circularity, median = 0.51 at the armored site, 0.40 at the control site), this was not supported by the statistics (Wilcoxon rank-sum test, W = 263, p = 0.081). For all the other variables related to shape, no significant differences were recorded (p > 0.05). Overall, rubble shape appeared to be similar between the armored site and the natural coastline.
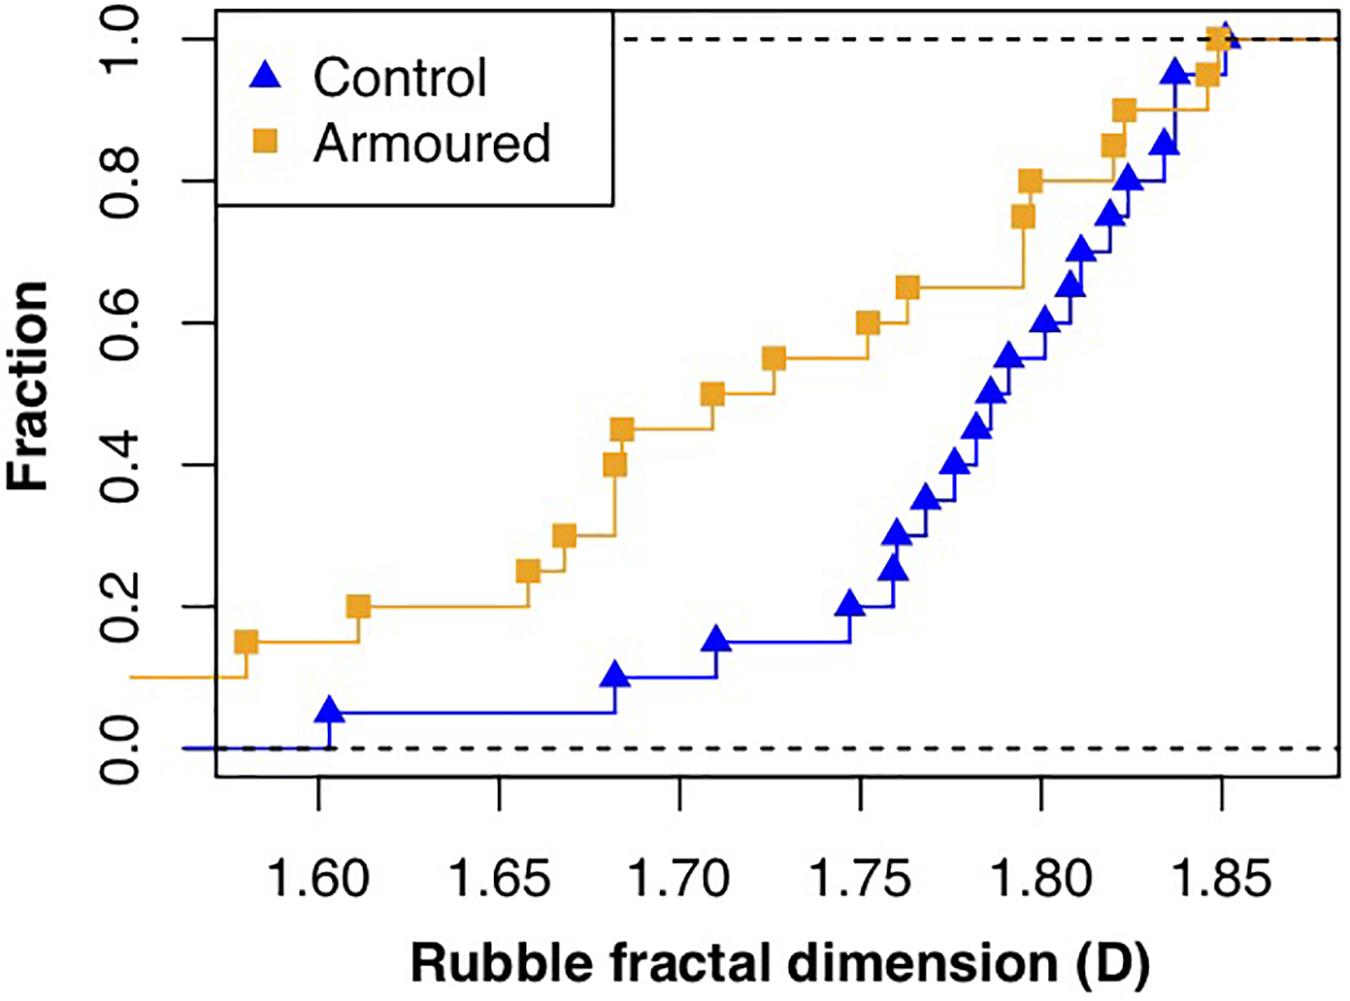
However, rubble sampled at breakwaters showed a lower fractal complexity in their surfaces, reflected by lower fractal dimensions [armored, D (median) = 1.7; control, D (median) = 1.8; Figure 4]. Differences in surface fractal complexity were statistically significant (Wilcoxon rank-sum test, W = 124, p = 0.019).
The PCA (Figure 5) revealed differences between the two sites, confirmed to be significant by PERMANOVA (R2 = 0.533, p < 0.001), mainly driven by area, weight, and Feret parameters, with rubble pieces from the armored site not only being characterized by a smaller area, but also by tighter clustering, indicating a narrower range of variation.
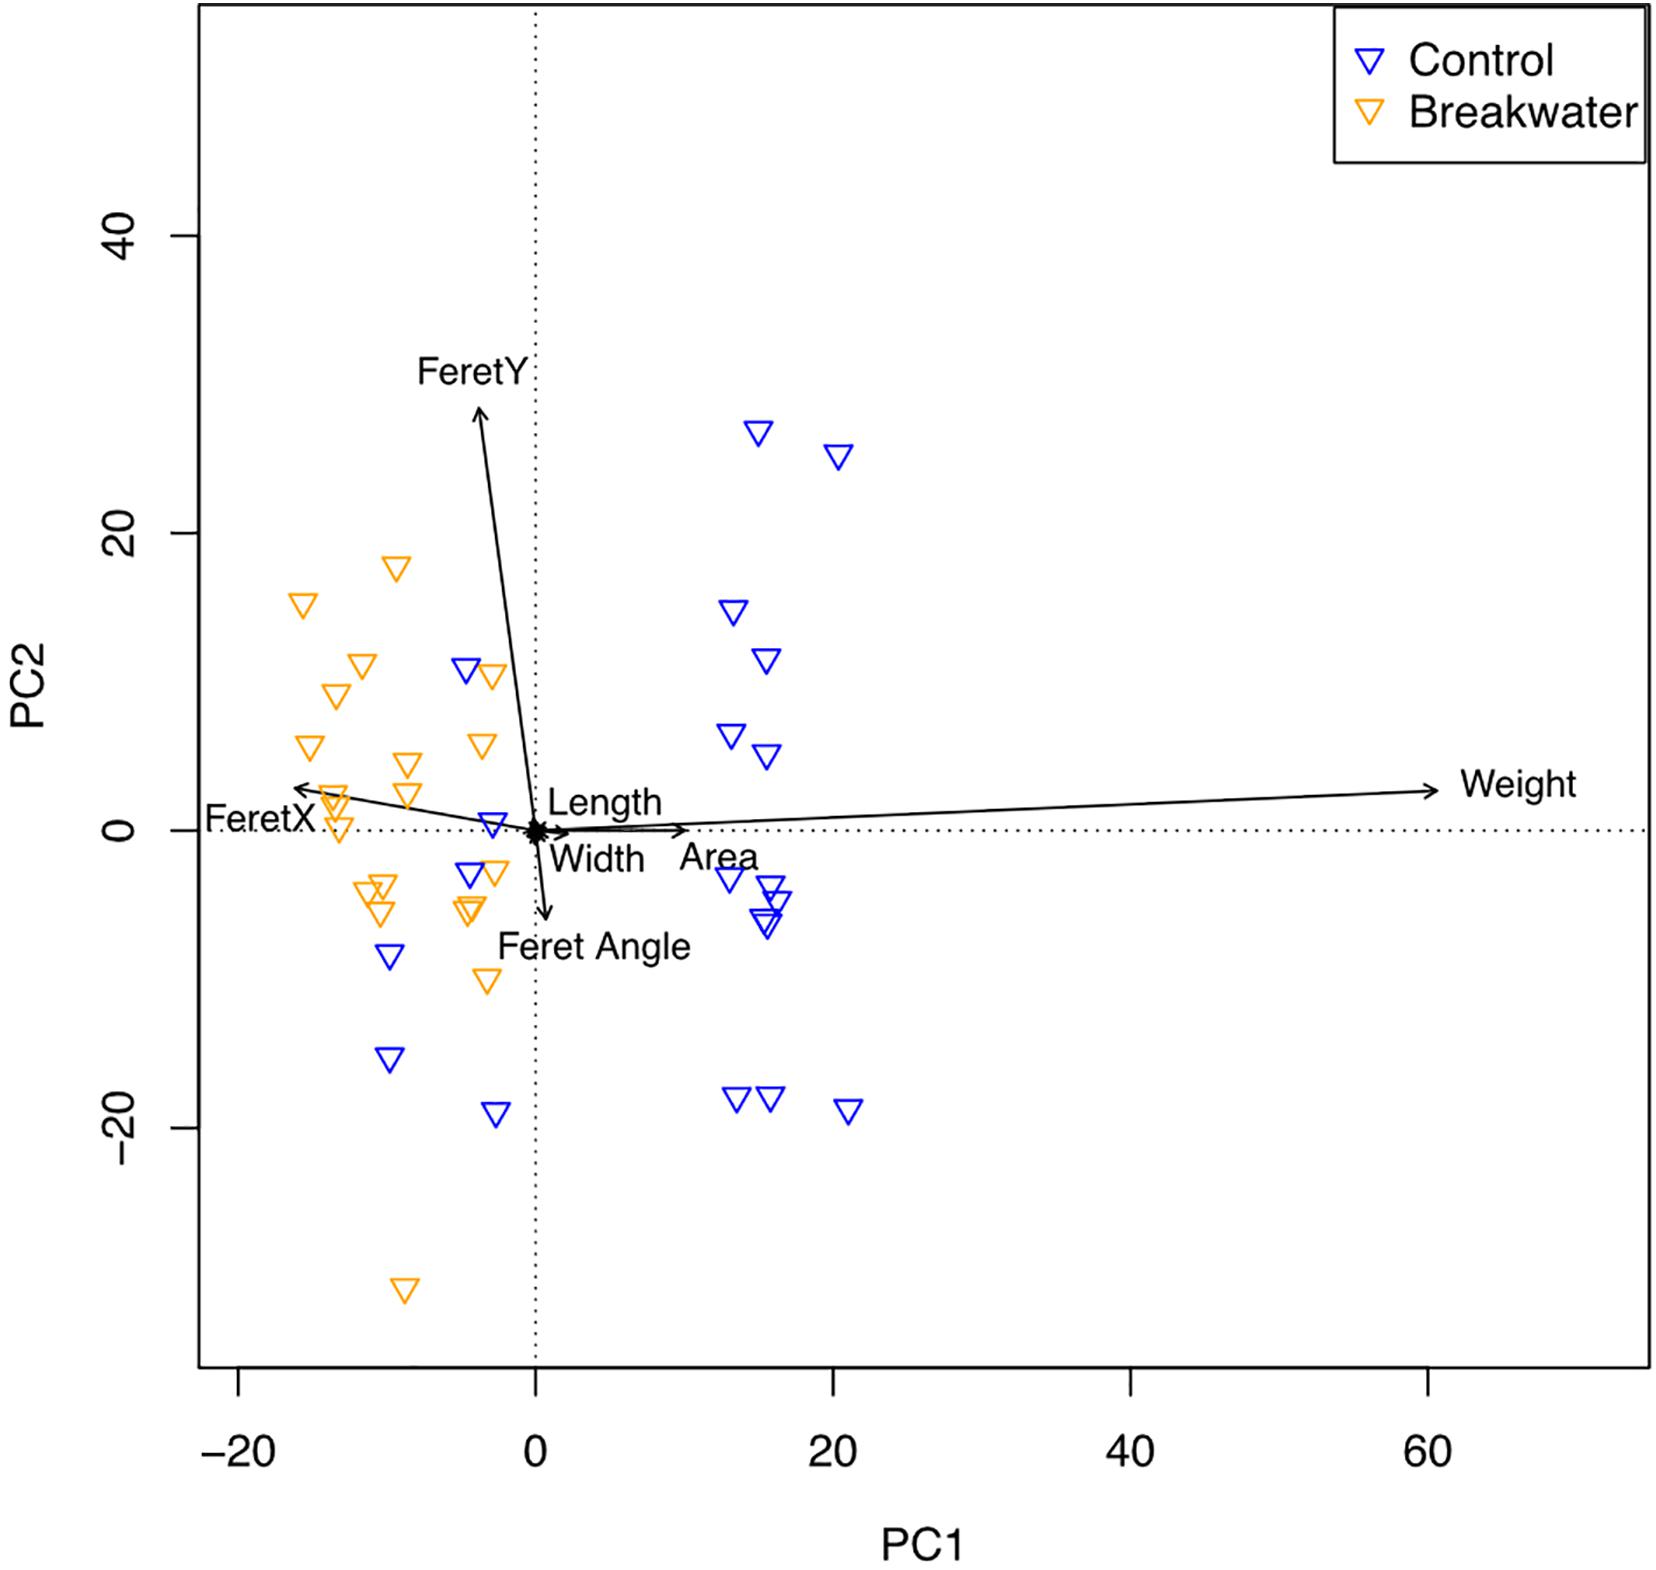
Figure 5. Principal Component Analysis (PCA) biplot of coral rubble spatial complexity at the breakwater and control sites. Arrow directions points toward stronger associations.
Among all variables, weight was the main driver of differences between the two groups.
Discussion
The method described here may provide the first uniform approach to characterizing coral rubble morphometrics. We demonstrate that photo analyses of rubble pieces using ImageJ software are effective in detecting differences among rubble pieces, even at low sample sizes. Rubble morphometrics differed between our control rubble bed (n = 20) and an armored breakwall (n = 20) in Hentona, driven primarily by differences in rubble area, weight and Feret properties. Analyses through ImageJ may provide a more useful indicator of rubble size and complexity than simple length and weight measurements alone, particularly given the importance of rubble complexity and microtopography in coral reefs (Brandl and Bellwood, 2007), meaning that this method shows promise as a uniform approach for broader incorporation in future rubble-based research. Moreover, compared to manual tracing of outlines, the process allows to save time and overcoming operator bias.
In our previous assessment of coral rubble in Hentona (Masucci et al., 2021), rubble cryptofauna was more abundant in locations away from artificial breakwaters (i.e., in control sites). In addition, the seaward side of the armored barrier appeared to be characterized by rubble mound formations, due to the accumulation of small rubble at the base of the blocks.
Control rubble (=natural coastline) was both larger in size and more complex in their surfaces compared to those sampled at breakwaters rubble mounds. Previous research has clarified how, at different scales, diversity, and habitat complexity feature positive relations (Johnson et al., 2003). Kostylev et al. (2005) verified that both surface size and fractal complexity are directly related to abundances and diversity of cryptic animals on rocky shores. Specifically, smaller surface areas were mainly associated with a decrease in total and relative abundances while less fractal complexity, also supporting lower abundances, was strongly associated with reduced taxonomic richness (Kostylev et al., 2005). Surfaces with higher fractal dimensions do not just offer additional spaces for colonization, but bias space availability toward smaller size ranges, increasing the number of available niches (Morse et al., 1985).
Unlike on rocky shores, which present as 2D surfaces, coral rubble pieces together make complex 3D networks. As a result, species diversity in rubble may be influenced from the level of an individual piece through to the entire rubble bed. However, little is known about the influence of fractal and bed complexity in coral rubble communities. Several factors appear to be involved in determining community abundance and composition (Takada et al., 2007), but different studies have clarified that coral and rubble skeletal erosion levels can drive the richness and abundances of their respective communities (Enochs, 2012; Enochs and Manzello, 2012b; Troyer et al., 2018), with dead coral rubble fragments of intermediate degradation levels seemingly able to sustain richer communities (Enochs et al., 2011; Enochs, 2012; Enochs and Manzello, 2012a,b).
The proposed method has limitations that need to be acknowledged: a manual correction, albeit limited to a small number of pixels, can still be needed when the automatic segmentation presents imperfections. In our experience this did not introduce problems in terms of bias and data accuracy. Secondly, light conditions can significantly affect the output of the automatic segmentation procedure. It is therefore important to take pictures in controlled light conditions (artificial light in a dark room). The importance of controlling light can limit the usefulness of this method in situations where light conditions cannot be controlled, which can be the case when working in the field. This can be an issue from a logistical point of view, especially when working with high numbers of replicates. Finally, using this method, the quality of the camera determines the quality and resolution of the final tracing, which by itself presents a potential risk of introducing biases when comparing data from different studies. In the current study, simple measurements of width, length, and weight were enough to reveal significant differences between breakwater and controls. Yet, other parameters would be arduous, time-consuming, or impossible (e.g., fractal complexity) to measure using this approach. We believe that the choice between a simpler field measurement of width and length and more detailed image analyses will depend on the parameters of interest, research questions, sample size, and desired accuracy.
In terms of future research opportunities, one issue that remains to be addressed is the relative amount of outlining of rubble that is needed to generate useful data. It may be that partial outlines (especially if acquired at higher resolutions and thus more accurate) can generate data of comparable quality, allowing researchers to work with incomplete photographs. We hope to explore this issue and the automatized generation of partial outlines in subsequent studies, potentially allowing for greater applicability of the methods described here.
While armoring can exert disturbances on native assemblages through a variety of mechanisms, we believe that a direct reduction in habitat size and spatial complexity constitutes an important link between reductions in abundance and diversity of rubble mobile cryptofauna and the presence of artificial hard blocks in their proximities. Following appropriate replication, this method could be used to compare coral rubble from a variety of environmental conditions or locations, thus becoming a useful aid in environmental monitoring, in addition to adding important information to the collection and analyses of biological data. This line of research is particularly urgent when considering the extension of artificially altered coastlines already present around Okinawa Island (>60%; Masucci and Reimer, 2019).
Data Availability Statement
The raw data supporting the conclusions of this article will be made available by the authors, without undue reservation.
Author Contributions
GM, PB, and JR: conceptualization and first submission and revisions. GM and PB: fieldwork and figures. GM: software workflow and data analysis. GM and JR: first draft preparation. JR: English proofing. All authors listed have made a substantial, direct and intellectual contribution to the work, and approved it for publication.
Funding
This work was supported by the Physics and Biology Unit of the Okinawa Institute of Science and Technology Graduate University (OIST).
Conflict of Interest
The authors declare that the research was conducted in the absence of any commercial or financial relationships that could be construed as a potential conflict of interest.
Publisher’s Note
All claims expressed in this article are solely those of the authors and do not necessarily represent those of their affiliated organizations, or those of the publisher, the editors and the reviewers. Any product that may be evaluated in this article, or claim that may be made by its manufacturer, is not guaranteed or endorsed by the publisher.
Acknowledgments
We would like to thank Hin Boo Wee, Giun Yee Soong, Hiroki Kise, and Yee Wah Lau for their support and advice during the creation and implementation of this study. We thank Maika Reimer and Seira Reimer for their assistance in taking rubble measurements. Comments and suggestions from two reviewers greatly improved the quality of the final manuscript.
Supplementary Material
The Supplementary Material for this article can be found online at: https://www.frontiersin.org/articles/10.3389/fmars.2021.703698/full#supplementary-material
Supplementary Figure 1 | Flow-chart summarizing the methodology proposed in this research.
References
Anderson, M. J. (2014). Permutational multivariate analysis of variance (PERMANOVA). Wiley StatsRef: Statistics Reference Online. Hoboken: Wiley, 1–15. doi: 10.1002/9781118445112.stat07841
Bartlett, M. S. (1937). Properties of sufficiency and statistical tests. Proc. R. Soc. Lond. Ser. A 160, 268–282. doi: 10.1098/rspa.1937.0109
Biondi, P., Masucci, G. D., and Reimer, J. D. (2020). Coral cover and rubble cryptofauna abundance and diversity at outplanted reefs in Okinawa, Japan. PeerJ 8:e9185. doi: 10.7717/peerj.9185
Brandl, S. J., and Bellwood, D. R. (2007). Microtopographic refuges shape consumer-producer dynamics by mediating consumer functional diversity. Oecologia 182, 203–217. doi: 10.1007/s00442-016-3643-0
Enochs, I. C. (2012). Motile cryptofauna associated with live and dead coral substrates: implications for coral mortality and framework erosion. Mar. Biol. 159, 709–722. doi: 10.1007/s00227-011-1848-7
Enochs, I. C., and Manzello, D. P. (2012a). Responses of cryptofaunal species richness and trophic potential to coral reef habitat degradation. Diversity 4, 94–104. doi: 10.3390/d4010094
Enochs, I. C., and Manzello, D. P. (2012b). Species richness of motile cryptofauna across a gradient of reef framework erosion. Coral Reefs 31, 653–661. doi: 10.1007/s00338-012-0886-z
Enochs, I. C., Toth, L. T., Brandtneris, V. W., Afflerbach, J. C., and Manzello, D. P. (2011). Environmental determinants of motile cryptofauna on an eastern Pacific coral reef. Mar. Ecol. Prog. Ser. 438, 105–118. doi: 10.3354/meps09259
Flater, D. (2007). WXTide32—a Free Windows Tide and Current Prediction Program. Tampa. Available online at: http://www.wxtide32.com/
Fraser, S. B., and Sedberry, G. R. (2008). Reef morphology and invertebrate distribution at continental shelf edge reefs in the South Atlantic Bight. Southeast. Nat. 7, 191–206. doi: 10.1656/1528-7092(2008)7[191:RMAIDA]2.0.CO;2
Gabriel, K. R. (1971). The biplot graphical display of matrices with application to principal component analysis. Biometrika 58, 453–467. doi: 10.1093/biomet/58.3.453
Johnson, M. P., Frost, N. J., Mosley, M. W., Roberts, M. F., and Hawkins, S. J. (2003). The area-independent effects of habitat complexity on biodiversity vary between regions. Ecol. Lett. 6, 126–132. doi: 10.1046/j.1461-0248.2003.00404.x
Kostylev, V. E., Erlandsson, J., Mak, Y. M., and Williams, G. A. (2005). The relative importance of habitat complexity and surface area in assessing biodiversity: fractal application on rocky shores. Ecol. Complex. 2, 272–286. doi: 10.1016/j.ecocom.2005.04.002
Kramer, M. J., Bellwood, O., and Bellwood, D. R. (2013). The trophic importance of algal turfs for coral reef fishes: the crustacean link. Coral Reefs 32, 575–583. doi: 10.1007/s00338-013-1009-1
Liebovitch, L. S., and Toth, T. (1989). A fast algorithm to determine fractal dimensions by box counting. Phys. Lett. A 141, 386–390. doi: 10.1016/0375-9601(89)90854-2
Mandelbrot, B. B. (1967). How long is the coast of Britain? Statistical self-similarity and fractional dimension. Science 156, 636–638. doi: 10.1126/science.156.3775.636
Masucci, G. D., Acierno, A., and Reimer, J. D. (2020). Eroding diversity away: impacts of a tetrapod breakwater on a subtropical coral reef. Aquat. Conserv. 30, 290–302. doi: 10.1002/aqc.3249
Masucci, G. D., Biondi, P., and Reimer, J. D. (2021). Impacts of coastal armouring on rubble mobile cryptofauna at shallow coral reefs in Okinawa, Japan. Plankton Benthos Res. (in press)
Masucci, G. D., and Reimer, J. D. (2019). Expanding walls and shrinking beaches: loss of natural coastline in Okinawa Island, Japan. PeerJ 7:e7520. doi: 10.7717/peerj.7520
McClanahan, T. R. (1994). Kenyan coral reef lagoon fish: effects of fishing, substrate complexity, and sea urchins. Coral Reefs 13, 231–241. doi: 10.1007/BF00303637
Morse, D. R., Lawton, J. H., Dodson, M. M., and Williamson, M. H. (1985). Fractal dimension of vegetation and the distribution of arthropod body lengths. Nature 314:731. doi: 10.1038/314731a0
Oksanen, J., Blanchet, F. G., Friendly, M., Kindt, R., Legendre, P., McGlinn, D., et al. (2019). Vegan: Community Ecology Package. Available online at: https://CRAN.R-project.org/package=vegan
R Development Core Team. (2019). R: A Language and Environment for Statistical Computing. Vienna: R Foundation for Statistical Computing. Available online at: https://www.r-project.org/
Richter, C., Wunsch, M., Rasheed, M., Kötter, I., and Badran, M. I. (2001). Endoscopic exploration of Red Sea coral reefs reveals dense populations of cavity-dwelling sponges. Nature 413, 726–730. doi: 10.1038/35099547
Royston, J. P. (1982). Algorithm AS 181: the W test for normality. J. R. Stat. Soc. Ser. C Appl. Stat. 31, 176–180. doi: 10.2307/2347986
Schneider, C. A., Rasband, W. S., and Eliceiri, K. W. (2012). NIH Image to ImageJ: 25 years of image analysis. Nat. Methods 9:671. doi: 10.1038/nmeth.2089
Soares, D. M., Borges, L. R., da Silva, M. F. F., and Dalle Luche, L. (2021). Effect of substrates of native and exotic plant species on the initial period of colonization of benthic macroinvertebrates in the Cerrado biome. Community Ecol. 22, 127–134. doi: 10.1007/s42974-020-00032-5
Takada, Y., Abe, O., and Shibuno, T. (2007). Colonization patterns of mobile cryptic animals into interstices of coral rubble. Mar. Ecol. Prog. Ser. 343, 35–44. doi: 10.3354/meps06935
Takada, Y., Ikeda, H., Hirano, Y., Saigusa, M., Hashimoto, K., Abe, O., et al. (2014). Assemblages of cryptic animals in coral rubble along an estuarine gradient spanning mangrove, seagrass, and coral reef habitats. Bull. Mar. Sci. 90, 723–740. doi: 10.5343/bms.2013.1085
Tokeshi, M., and Arakaki, S. (2012). Habitat complexity in aquatic systems: fractals and beyond. Hydrobiologia 685, 27–47. doi: 10.1007/s10750-011-0832-z
Troyer, E. M., Coker, D. J., and Berumen, M. L. (2018). Comparison of cryptobenthic reef fish communities among microhabitats in the Red Sea. PeerJ 6:e5014. doi: 10.7717/peerj.5014
Wee, S. Y. C., Sam, S. Q., Sim, W. T., Ng, C. S. L., Taira, D., Afiq-Rosli, L., et al. (2019). The role of in situ coral nurseries in supporting mobile invertebrate epifauna. J. Nat. Conserv. 50:125710. doi: 10.1016/j.jnc.2019.125710
Keywords: spatial complexity, fractals, breakwaters, coastal development, Okinawa, Japan
Citation: Masucci GD, Biondi P and Reimer JD (2021) A Comparison of Size, Shape, and Fractal Diversity Between Coral Rubble Sampled From Natural and Artificial Coastlines Around Okinawa Island, Japan. Front. Mar. Sci. 8:703698. doi: 10.3389/fmars.2021.703698
Received: 30 April 2021; Accepted: 18 October 2021;
Published: 08 November 2021.
Edited by:
Charles Alan Jacoby, St. Johns River Water Management District, United StatesReviewed by:
Kennedy Wolfe, The University of Queensland, AustraliaKátia Cristina Cruz Capel, University of São Paulo, Brazil
Copyright © 2021 Masucci, Biondi and Reimer. This is an open-access article distributed under the terms of the Creative Commons Attribution License (CC BY). The use, distribution or reproduction in other forums is permitted, provided the original author(s) and the copyright owner(s) are credited and that the original publication in this journal is cited, in accordance with accepted academic practice. No use, distribution or reproduction is permitted which does not comply with these terms.
*Correspondence: Giovanni D. Masucci, Z2lvdmFubmkubWFzdWNjaUBvaXN0Lmpw
 Giovanni D. Masucci
 Piera Biondi
 James D. Reimer