
94% of researchers rate our articles as excellent or good
Learn more about the work of our research integrity team to safeguard the quality of each article we publish.
Find out more
ORIGINAL RESEARCH article
Front. Mar. Sci. , 08 July 2021
Sec. Marine Conservation and Sustainability
Volume 8 - 2021 | https://doi.org/10.3389/fmars.2021.701332
 Raul Vilela1*
 Claudia Burger1
 Ansgar Diederichs1Fabian E. Bachl1,2Lesley Szostek3Anika Freund3
 Alexander Braasch3Jochen Bellebaum4†Brian Beckers4Werner Piper4Georg Nehls1
The utilization of marine renewable energies such as offshore wind farming leads to globally expanding human activities in marine habitats. While knowledge on the responses to offshore wind farms and associated shipping traffic is accumulating now at a fast pace, it becomes important to assess the population impacts on species affected by those activities. In the North Sea, the protected diver species Red-throated Diver (Gavia stellata) and Black-throated Diver (Gavia arctica) widely avoid offshore wind farms. We used an explicit spatio-temporal Bayesian model to get a robust estimate of the diver population during the spring season between 2001 and 2018, based on a set of aerial surveys from long-term monitoring programs within the German North Sea. Despite the erection of 20 offshore wind farms in the study area and marked responses of divers to wind farms, model results indicated that there was no population decline, and overall numbers fluctuated around 16,600 individuals, with average annual 95% CI ranging between 13,400 and 21,360 individuals. Although, avoidance behavior due to wind farm development led to a more narrowly focused spatial distribution of the birds centered in the persistent high concentration zone in the Eastern German Bight Special Protection Area, the results provide no indication of negative fitness consequences on these long-lived species. However, more research is needed on habitat use and food availability in this regard.
Worldwide, efforts are made to increase the production of renewable energy to reduce the reliance on fossil fuels and nuclear energy. The expansion of offshore wind farms is one of the main pillars to achieve decarbonisation in Europe, and as part of a concerted effort, growing numbers of offshore wind farms are also recorded in the German North Sea (EEG, 2014; BSH, 2019). By 2019, twenty offshore wind farms (OFW) consisting of 1,052 turbines, were operational and with the growing numbers and sizes of wind turbines, concerns have been raised about possible impacts on those bird populations that rely on the North Sea as their permanent or migratory habitat.
Members of the diver family (Gaviidae) are among the seabird species most susceptible to human disturbance in the North Sea (Garthe and Hüppop, 2004; Furness et al., 2013). Divers show avoidance behavior toward vessels at distances of more than one kilometer (Bellebaum et al., 2006; Fliessbach et al., 2019) and show reduced densities in areas of high ship traffic (Schwemmer et al., 2011; Burger et al., 2019). Many studies have been conducted into reactions of divers to offshore wind farms, consistently reporting avoidance behavior toward the wind farm itself and lower sighting rates within a certain buffer zone around the wind farm (Dierschke et al., 2016; Mendel et al., 2019; Allen et al., 2020; Heinänen et al., 2020).
The two diver species that most commonly occur in the study area, Red-throated Diver (Gavia stellata) and Black-throated Diver (Gavia arctica), are arctic breeding, protected seabird species which winter in European coastal waters and are subject to special conservation measures under German and EU law. The North Sea is a very important wintering and staging area, especially during spring, for divers breeding in the Arctic from Greenland to Siberia (Dorsch et al., 2019). Unlike other fish-feeding seabirds, they mainly occur in relatively shallow (<40 m) coastal waters and their natural habitats thus overlap with areas suitable for offshore wind farming. Therefore, it is a concern that the expansion of wind farms will affect population numbers through habitat loss or displacement into suboptimal habitats or knock-on effects on breeding success (Allen et al., 2020).
In the German North Sea, the highest spring densities of divers are found in the Eastern part of the German Bight (Garthe et al., 2015). To protect the species, a Special Protection Area (SPA Eastern German Bight) was established within the European Natura 2000 network in 2004. Furthermore, the German Federal Maritime and Hydrographic Agency (BSH) has stopped the development of new offshore wind farms around the SPA Eastern German Bight and the main concentration area of divers (BMU, 2009), termed MCA hereafter, and is reviewing (and in one case is denying) future repowering of several wind farms in the area, while pursuing the expansion of wind energy generation in areas less relevant to divers (BSH, 2019).
For the licensing of offshore wind farms in the German North Sea Exclusive Economic Zone (EEZ), a standard concept conceived and coordinated by the BSH was developed for monitoring the environmental impacts of offshore wind farms, before, during and after construction, including regular aerial surveys of seabirds (BSH, 2013). In addition, regular monitoring by German research institutions took place. As a result, there is an excellent and homogeneous data base on diver distribution from different areas in the German North Sea, spanning over a period of 18 years (2001–2018) with data available for 16 years during the spring season.
However, as biological systems are always a complex interplay of many factors working on different spatial-temporal levels, population trends are difficult to measure, calculate and predict. Especially in seasonal migrants, it is important to consider the entire migratory life cycle in determining the population dynamics.
In avian populations, consequences of anthropogenic activities could arise from increased mortality during the non-breeding season. Avoidance of suitable habitat could lead to reduced body condition or increased mortality if important foraging habitat is lost (Busch and Garthe, 2016), while for some species, effects during the non-breeding season such as low body condition could also carry over to the breeding season resulting in a lower reproductive output (Masden et al., 2010; Kloskowski et al., 2019).
Thus, an optimal statistical framework is required to get an accurate estimate of the diver population trend during the non-breeding season integrating different data sources. We make use of a Bayesian spatio-temporal hierarchical model, applying latent Gaussian models (LGMs) with a flexible stochastic partial differential equation (SPDE) approach to model spatial structure in density and integrated nested Laplace approximation (INLA; Rue et al., 2009) for Bayesian inference. This approach allows accounting for spatio-temporal interdependence and autocorrelation in the data (Yuan et al., 2017) to perform a reliable estimation of diver abundance uncertainty, even for years and areas with incomplete data coverage.
On this basis, our main objective was to develop a statistical framework to reliably estimate bird populations from a dataset collected using different aerial survey techniques and to assess changes in spatial distribution that might be related to offshore wind farm development. We applied this framework to estimate the diver population size in the German North Sea and the MCA over the 18-year study period and examine whether there are any changes in the population that might be related to the increase in the number of offshore wind farms since 2009.
The study area covers 28,625 km2 of the German North Sea, excluding the western-most region of the German EEZ due to poor data coverage and low diver density in that area (Figure 1). We analyzed aerial survey data for divers from the time period between 2001 and 2018, collected during the spring season [from 1st March until 15th May; Garthe et al. (2007)], when the highest densities in the area can be observed.
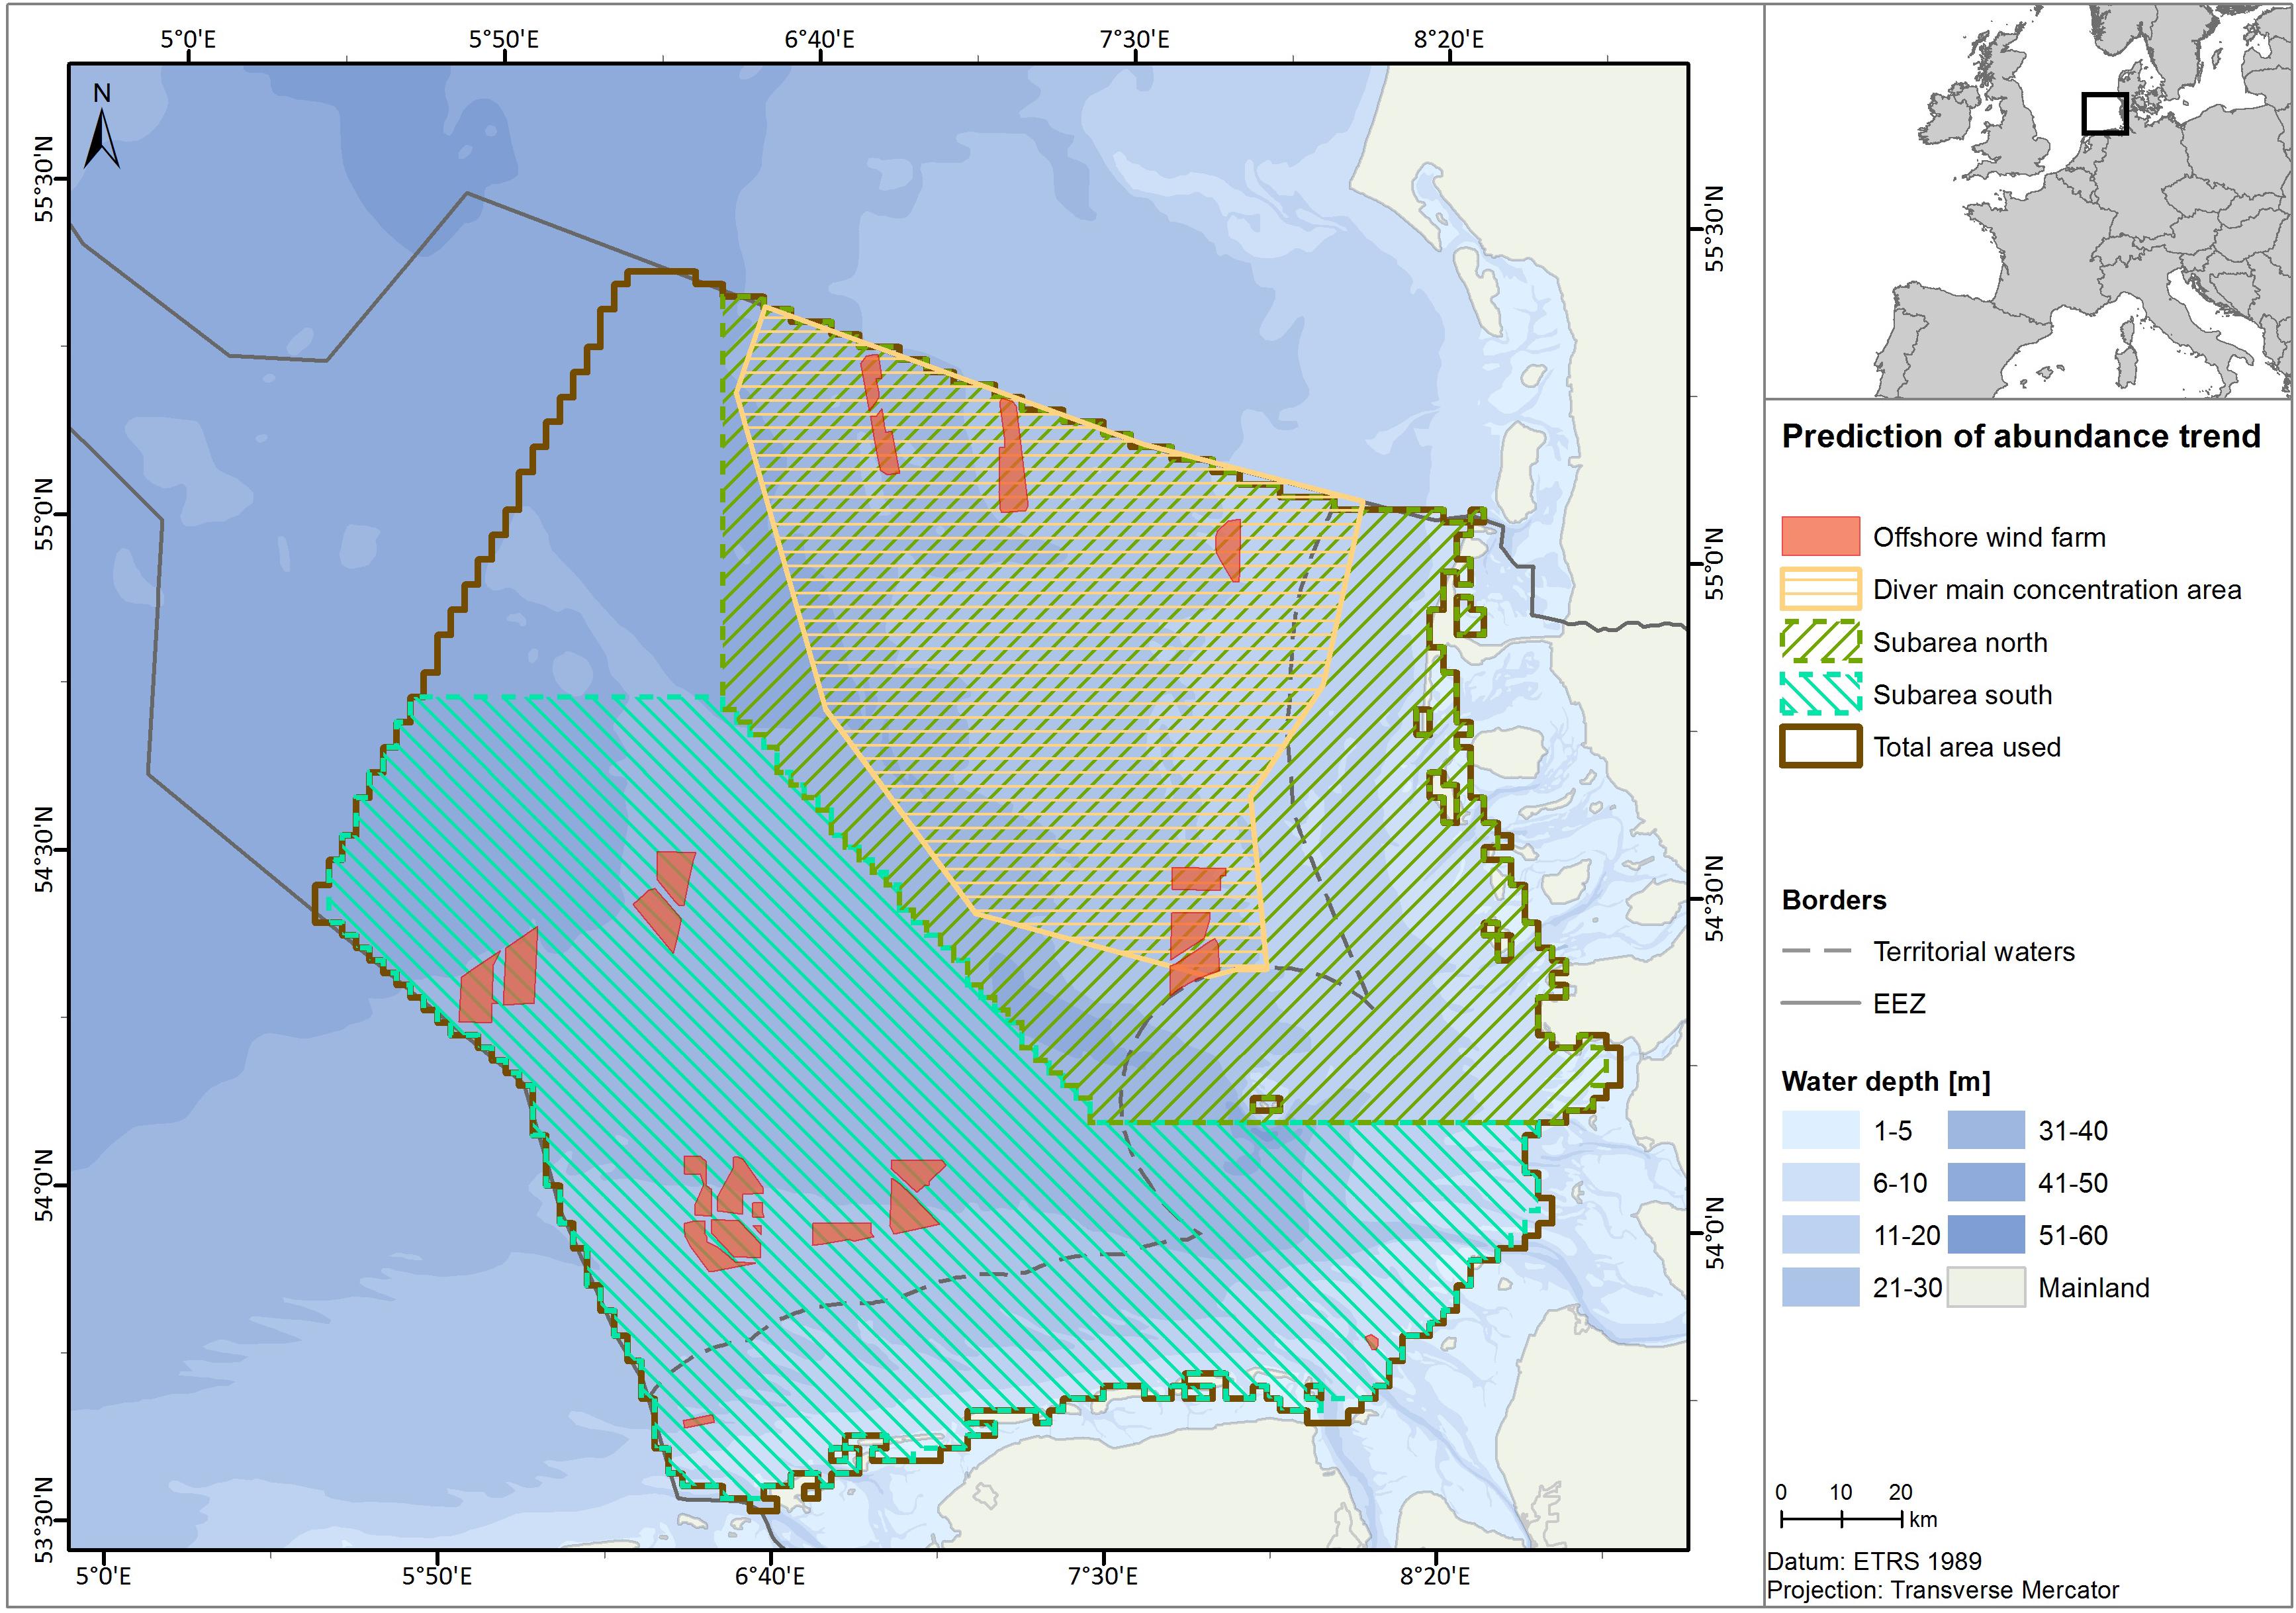
Figure 1. Location map, showing the total prediction area (brown line) regarding the German EEZ border (gray line). The main concentration area of divers (BMU, 2009; dashed in yellow) also used for prediction, is shown. Operational wind farms as of 2018 are shown as red polygons. Northern and southern sub-areas used for predictions, shown in Appendix C, are also depicted in green and clear blue.
Available data from ship transect surveys was not included due to the disturbance effect of ships on divers (Bellebaum et al., 2006; Schwemmer et al., 2011; Burger et al., 2019), causing potential bias in the data analyses.
Over the years, the data collection methodology improved, so there were two main types of aerial surveys available during the studied period: visual observer flight surveys and digital aerial surveys. Since surveys were carried out on different dates each year, there is a varying amount of effort associated with the seasons of each year. All surveys were restricted to favorable weather conditions with a sea state less than 4 (visual surveys) and 5 (digital surveys) and no clouds below flight altitude.
Observer-based visual survey flights were conducted as part of wind farm monitoring from 2001 to 2013, and followed the methods described by Diederichs et al. (2002), implemented in the standards of the German Federal Maritime and Hydrographic Agency (BSH, 2007, 2003). Data sources comprised data from wind farm monitoring, Natura2000 Monitoring and research projects.
Flights were performed at a height of ca. 250 ft (76 m) and a speed of around 180 km/h and observations were divided into distance bands based on their distance to the transect line using an inclinometer.
The detectability of seabirds decreases with increasing distance from the survey platform. In order not to underestimate the density of birds in the most distant transect bands with lower probability of detection, an effective strip width (ESW) was calculated, which is smaller than the total transect width (Buckland et al., 2001). We applied distance sampling to all visual aerial data using the package mrds 2.1.14 (Laake et al., 2015) in R 3.2.3 (R Core Team, 2019). We tested models with different predictors including cluster size, sea state on the Beaufort scale, and glare. Then, we selected the model with the lowest value for Akaike’s Information Criterion (AIC) to estimate the total number of divers for each transect segment.
Digital aerial surveys (Webb and Nehls, 2019) were conducted since 2013 according to the standards set by the German Federal Maritime and Hydrographic Agency (BSH, 2013) and using three different systems: “APEM,” “DAISI,” and “HiDef.”
The APEM system (Busch, 2015) uses four cameras to take simultaneous images of ca. 3 cm resolution (2 cm since January 2017) on the sea surface. Separation between transect lines was designed to allow aggregate data on grid format (ca. 1.6 km spacing). DAISI (Coppack et al., 2015) consists of two medium-format cameras with a resolution of 2 cm on the sea surface. Images were taken at a minimal interval of 1.5 s, which leads to an overlap of ca. 48 % between frames, with 3–4 km spacing between transect lines. The HiDef system (Weiß et al., 2016) uses four independent video cameras with a 2 cm resolution on the sea surface. The position of the cameras can be adjusted to avoid glare on the sea surface and transect lines are spaced 3–4 km apart.
The recorded footage (video or stills) was evaluated by professional ornithologists, with a separate step for random sample quality control. Flight height in digital surveys was greater than in visual survey flights, so survey aircrafts could fly above the wind turbines and disturbance to birds was minimized. Precise geographical positions of each observation were recorded using GPS technology. Although survey flights were generally only conducted during favorable weather conditions, parameters such as sea state, glare, cloud cover, air and water turbidity were recorded, and pictures of insufficient quality were excluded from analysis.
As there were surveys from different digital methods and a visual survey technique performed simultaneously in the same area, it was possible to include the differences in detection rate associated with each technique within the model approach, assuming a perfect detection rate for the HiDef system (Mendel et al., 2019).
For divers, identification to species level is rather difficult using aerial surveys. For both methods (digital and visual) a significant part of all individuals was only identified as diver sp. Analyses were therefore conducted including all individuals observed. However, from previous studies (e.g., Mendel et al., 2008; Garthe et al., 2015) and from the wind farm monitoring projects it is known that the majority of divers (∼90%) in this area are Red-throated Divers.
In total, 56 surveys were performed using conventional (visual) methods, and 84 surveys using digital methods. During the period 2001–2018, 16 years of data were analyzed since no data were available during the spring season for the years 2006 and 2007 (Figure 2).
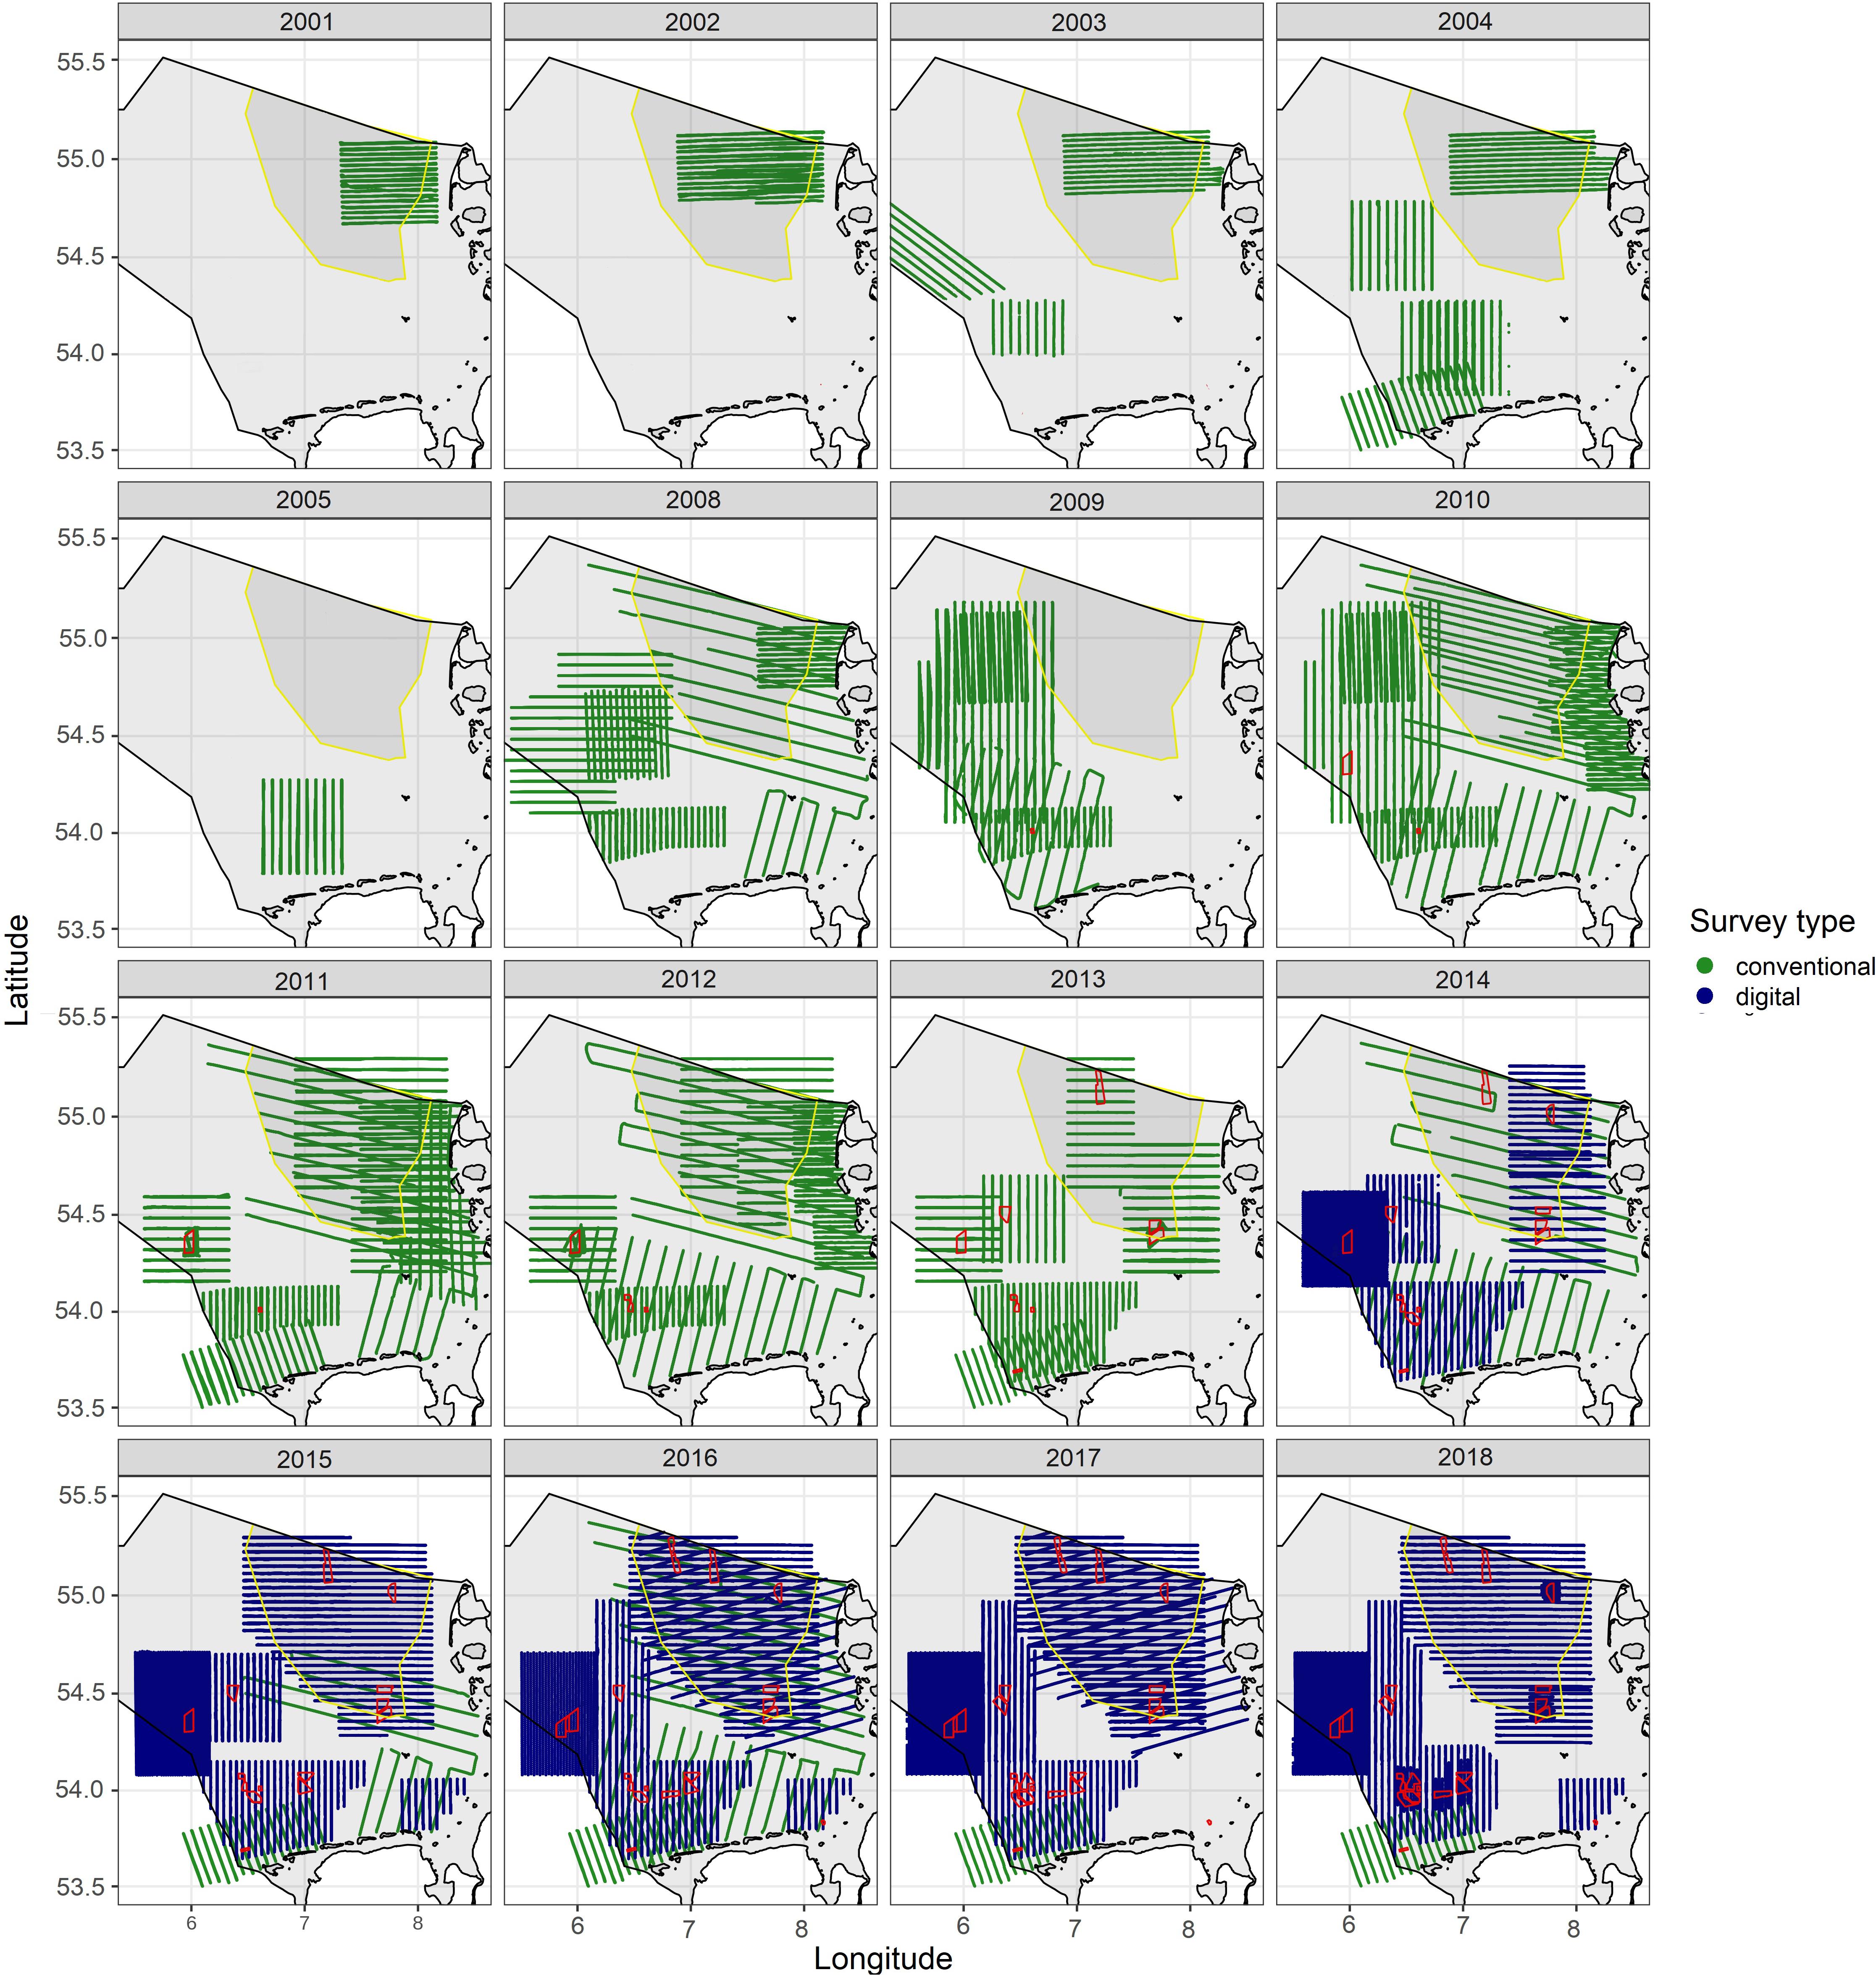
Figure 2. Survey effort by data collection method used for analyses between 2001 and 2018 during the spring season. Conventional and digital flight tracks are shown in green and blue, respectively, offshore wind farms are depicted in red and the main concentration area of divers with yellow border and dark gray background. As reference, the German EEZ contour is shown as a black line.
Data coverage was rather low for the first years (2001–2005), but nevertheless, the north-eastern part with the highest density of divers was covered in all years except 2005 and 2009. From 2008 onward, coverage was high in most years, and in several years the study area was almost completely covered (>90%).
To capture the general population trend and for computational convenience, a constrained refined Delaunay triangulation spatial mesh (Figure 3) was constructed for the entire survey area using a maximum distance between nodes of 5 km. Enough space was added around the prediction area to avoid undesired boundary effects (Lindgren et al., 2011). Then, digital and visual flight data were integrated on the mesh nodes, preserving information regarding data collection method, number of sightings, effort, season and year.
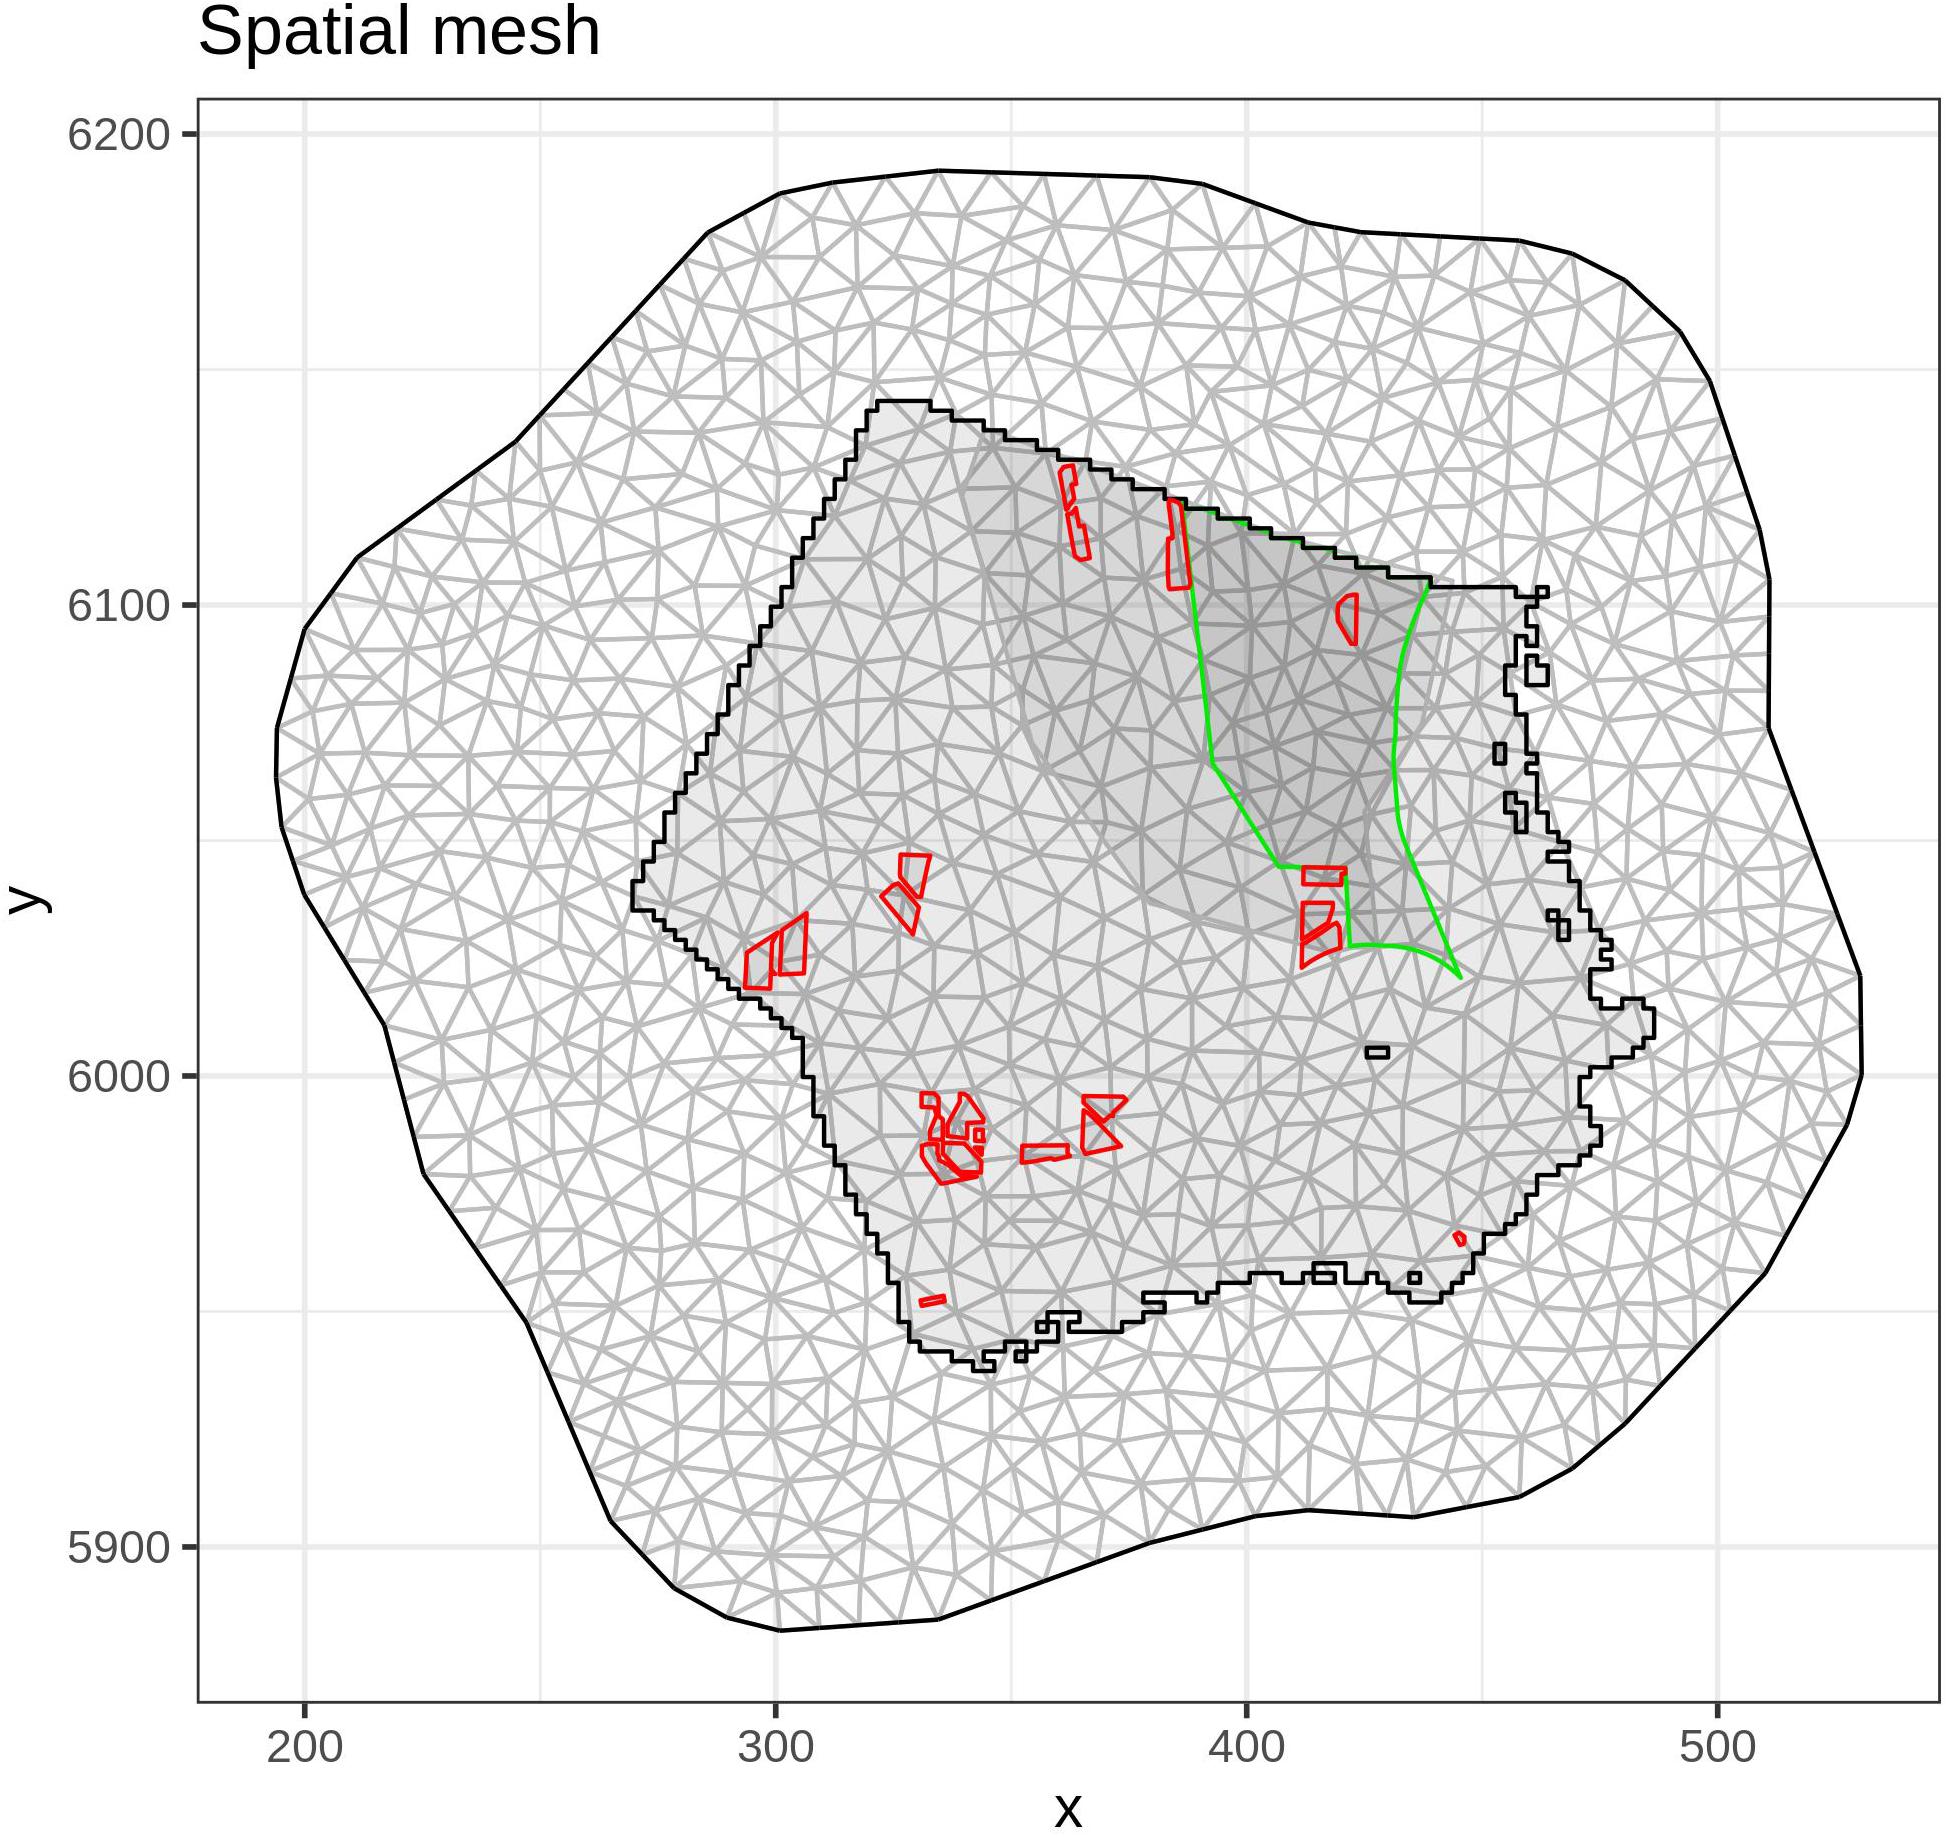
Figure 3. Spatial mesh used for the spatial-temporal model. Main diver concentration area (gray area) and SPA “Eastern German Bight” (green line) are depicted.
An explicit spatio-temporal Bayesian hierarchical model was used to incorporate all these dependencies and to assess changes in bird distribution, where dependences were incorporated as Gaussian Random Markov Fields (GRMF) (Rue and Held, 2005). In particular, the spatial effect was included as a Gaussian Field (GF) with a Matérn covariance, while the temporal effect was incorporated as an autoregressive process of order 1 [AR(1)] and used to describe the temporal dependence. Inference and prediction was done by means of the Integrated Nested Laplace approximation (INLA) approach (Rue et al., 2009). See www.r-inla.org for more details. The spatial effect was included using the approach proposed by Lindgren et al. (2011) to link GMRF and GF with a Matérn covariance structure via a weak solution to a Stochastic Partial Differential Equation (SPDE). Data collection methods were included into the model as categorical covariates, and data was fitted by means of a negative-binomial family distribution with a log link, where the intensity of the observed process was the main driver of the posterior probability:
where t = 1,…., T is the temporal index and s = 1,…, n is the spatial location, potentially
different at each t. xist is the value of an explanatory variable i at a given st, f represents the latent model applied to the covariates and Ust represents the spatio-temporal structure of the model, in this case adopting a progressive spatio-temporal structure (Paradinas et al., 2017), which incorporates both spatial and temporal correlation of the data. In particular,
Where Ust is decomposed in a common spatial realization Wst and an autoregressive temporal term Rst expressing the correlation among neighbors of order K. The spatial effect Wt at each time t is a Gaussian Latent Field with zero mean and the covariance function Q of the spatial effect depends on the parameters, κ and τ, which determine the range of the effect and the total variance.
For the Mátern model, Penalized Complexity priors (PC-priors; Fuglstad et al., 2018) were used to describe prior knowledge of hyperparameters defining the spatial random effect. Thus, the prior probability of the spatial range being smaller than 45 was set at 0.1 and the probability of the spatial variance being larger than 0.1 was set at 0.01. These priors are robust, in the sense that they do not have an impact on outcomes and, in addition, have an ecological interpretation (Simpson et al., 2017).
Finally, prediction points were masked according to the desired prediction area (German EEZ and MCA) and the total estimated abundance was calculated by year and prediction area together with the 95% credible intervals.
Mean abundances and credible intervals within each of the time periods considered (e.g., 2001–2005, 2002–2012, and 2013–2018) were calculated using independent models. For this, effort and observations within each period were aggregated and the temporal component (e.g., year) was removed to obtain reliable mean abundances and margins of error for each period.
To evaluate the model’s predictive performance, mesh nodes were randomly split into two subsets: a training dataset including 80% of the nodes, and a validation dataset containing the remaining 20% of the nodes. The model was run on the training dataset and its predictive accuracy for each year was assessed on the validation dataset. This calibration-validation procedure was repeated 20 times, and for each run the performance of the model was assessed using the Pearson’s correlation coefficient (r) between the observed abundances and predicted posterior means at the testing locations.
All model calculations were performed using the R statistical software (R Core Team, 2019). Modeling calculations were done with the inlabru package (Bachl et al., 2019).
Compared to the reference method HiDef, DAISI showed no significant differences, while visual surveys (after applying distance sampling) showed significantly lower detections, and APEM showed the highest variability (Supplementary Appendix Table A-1).
The overall accuracy of the model (r) was 0.71 (Figure 4). Although years with lower sampling effort and an unusual distribution pattern, such as 2001, 2002, and 2009, scored lower and should be treated with caution, years from 2010 onward scored consistently well, showing a reliable abundance estimate overall.
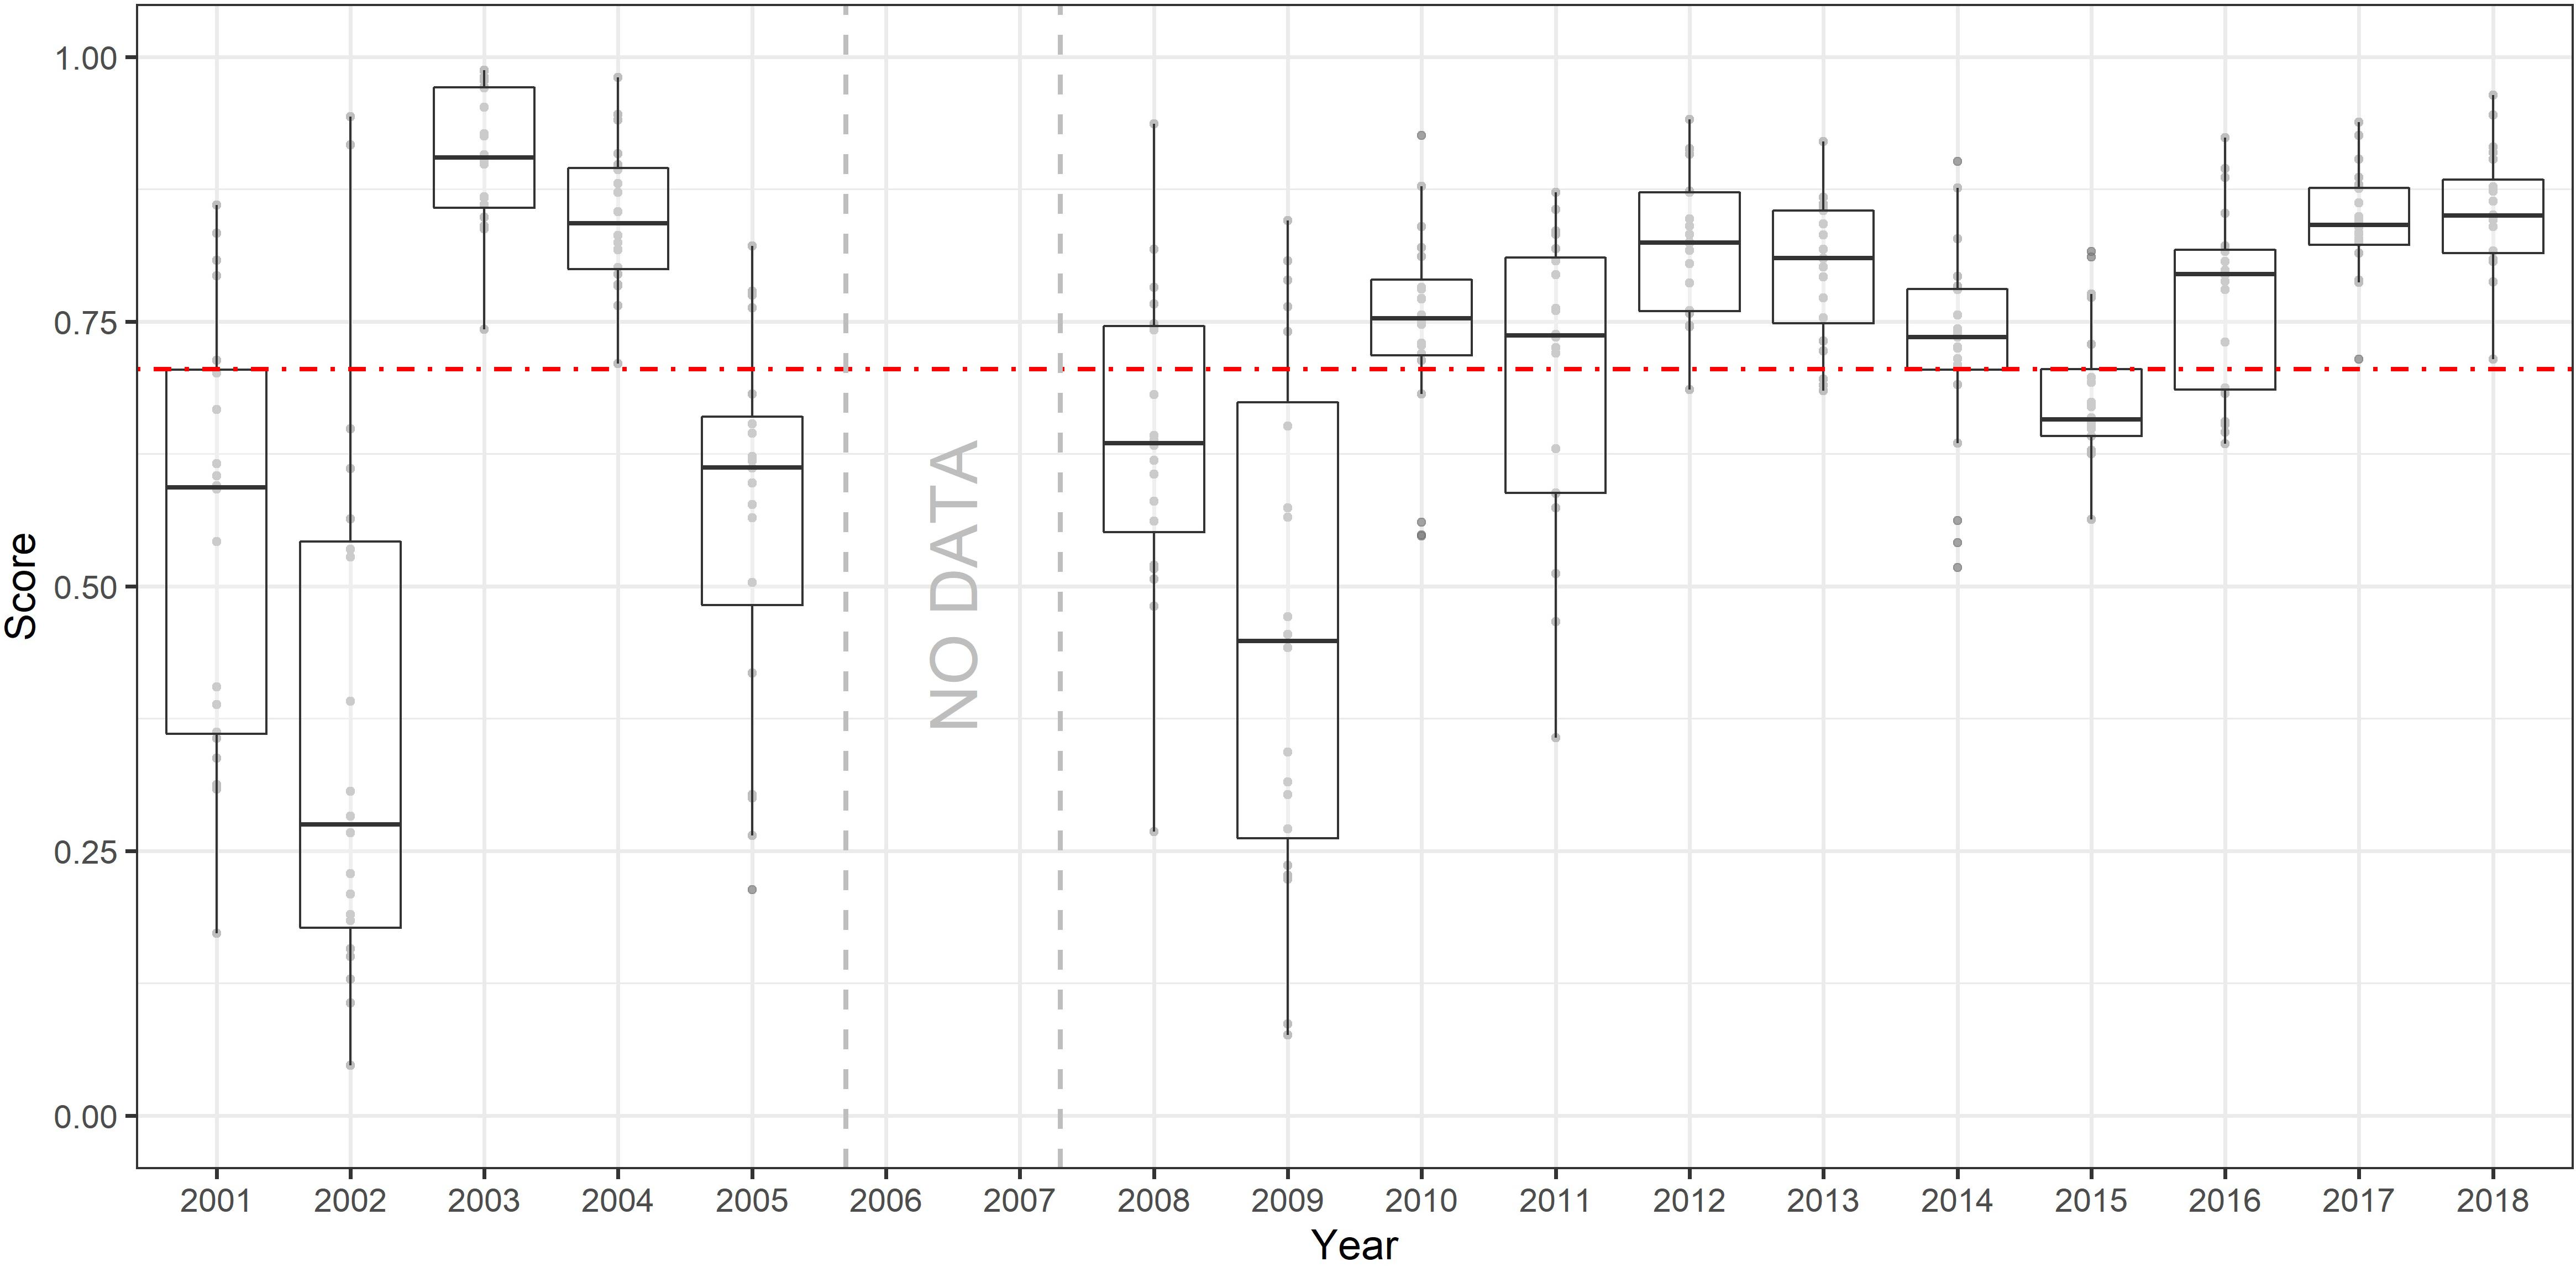
Figure 4. Model cross-validation results. Dashed horizontal red line indicates average Pearson’s correlation coefficient (r) among all years. Gray dots show the r value obtained for each one of the 20 individual runs performed for each year and summarized by the boxplots.
No clear pattern was detected in the posterior estimates of the annual diver abundances for the study area (Figure 5). Higher uncertainty was linked to the period with lower spatial coverage (2001–2005), while the lowest abundances were found in the year 2008 [posterior mean = 8,870 individuals; 95% CI = (7,530–10,369)] and year 2009 [posterior mean = 9,723 individuals; 95% CI = (6,219–14,411)], just before the construction of the first OWF (Figure 5A). On the other hand, the highest abundances, above 20,000 individuals, were found in years 2011 [posterior mean = 21,537 individuals; 95% CI = (19,005–24,740)], 2014 [posterior mean = 21,757 individuals; 95% CI = (19,047–24,157)] and 2012 [posterior mean = 20,547 individuals; 95% CI = (18,066–22,688)]. See Supplementary Appendix Table A-2 for numeric values for other years.
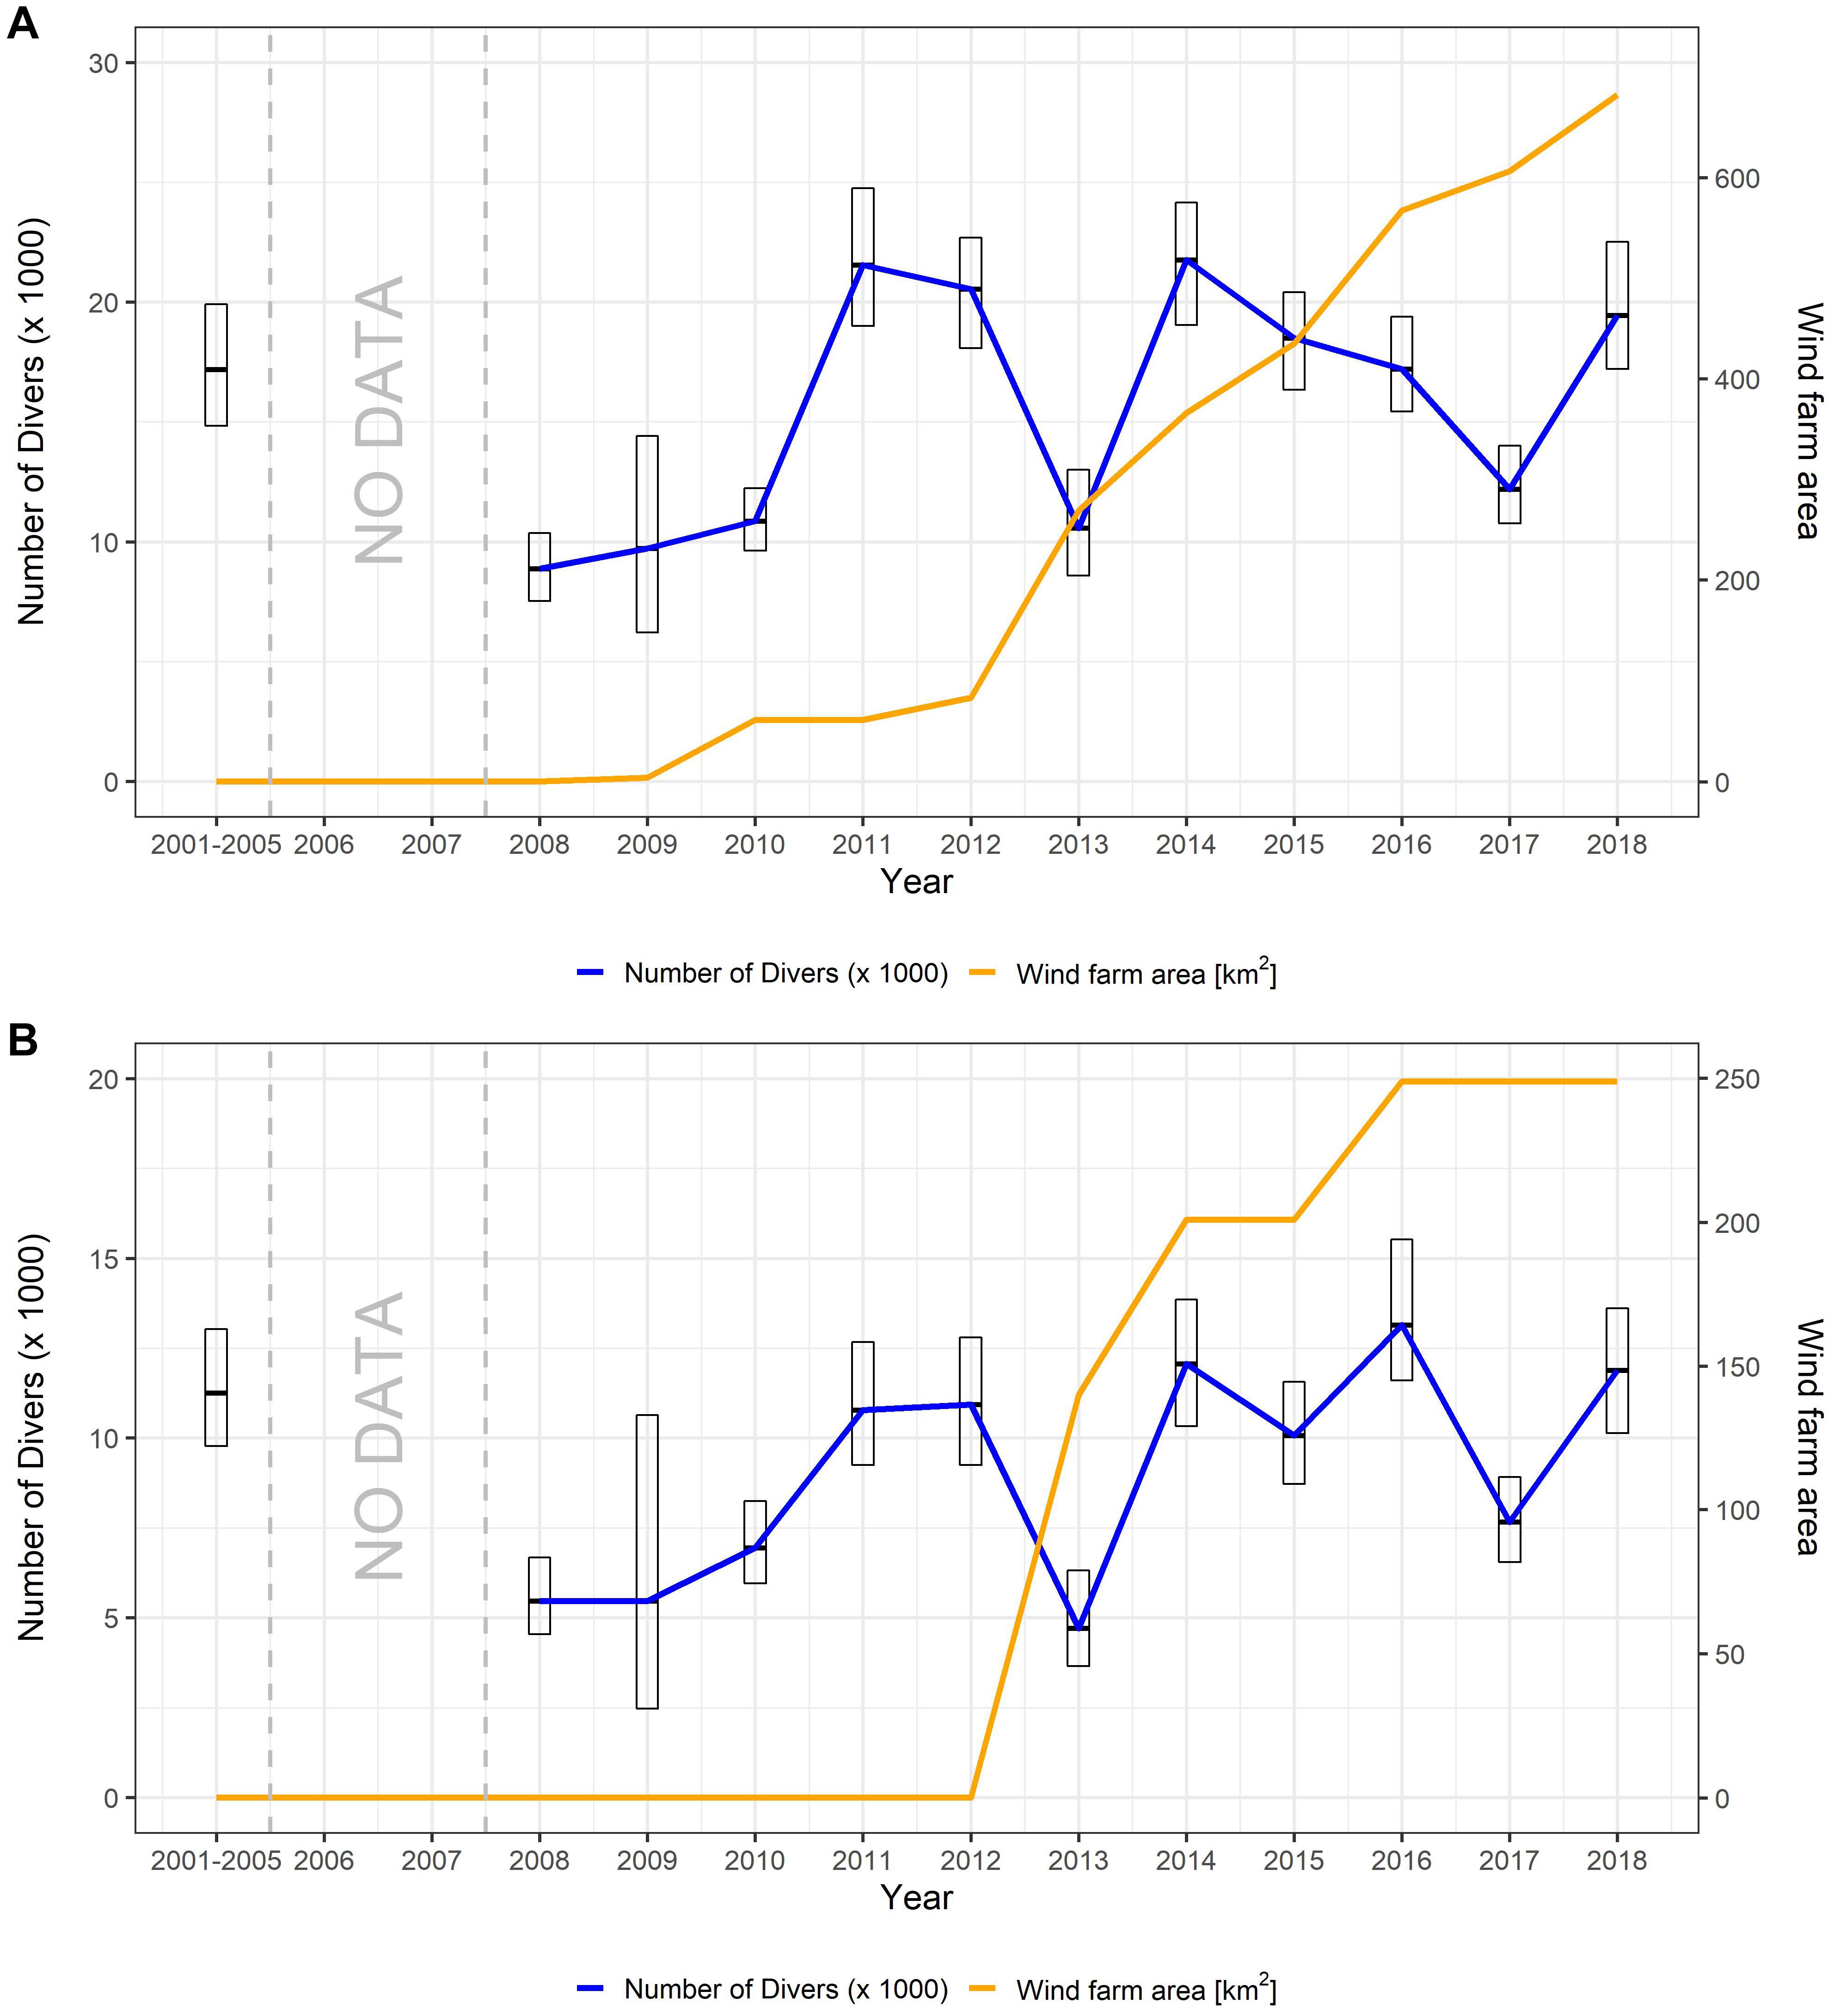
Figure 5. Posterior estimation of annual diver abundance and total number of wind farms built every year during spring: (A) for the whole studied area; and (B) for the diver main concentration area. Error-bars show 95 % credible intervals given by the model. Annual estimates during the period 2001–2005 have been aggregated due to the high uncertainty of the posterior total abundance. The complete dis-aggregated temporal trend can be found in Supplementary Appendix Figure A-1.
The overall pattern of interannual abundance was closely related to the pattern of abundance observed in the MCA (Figure 5B), which, although covering only 24% of the total area, accounted for more than 60% of the estimated diver population in the German North Sea EEZ (Supplementary Appendix Table A-2).
No apparent relationship was found between diver abundance and the number of OWFs constructed in the MCA, although six OWFs had been constructed in this area between 2012 and 2018. Excluding the years prior to 2005, which showed high uncertainty in the posterior abundance estimates given the low spatial coverage sampled, the years with the highest estimated abundances in the MCA were 2016 [posterior mean = 13,149 individuals; 95% CI = (11,594–15,524)], 2014 [posterior mean = 12,068 individuals; 95% CI = (10,330–13,848)] and 2018 [posterior mean = 11,881 individuals; 95% CI = (10,132–13,607)]. See Supplementary Appendix Table A-2 for numeric values for other years.
Densities predicted from the spatio-temporal model (see Figure 6 and Supplementary Appendix Figure B-1) showed that the highest densities consistently occurred in the MCA, where the combined average density for all years was 1.44 Ind./km2, compared to the 0.58 Ind./km2 average observed in the whole studied area. Detailed maps of the northern and southern sub-areas (Figure 1) are presented in Supplementary Appendix Figures C-1, C-2, respectively. Within the MCA, the distribution underwent little change between 2001 and 2012, when wind farms had not yet been built in this area. From 2013 onward, divers began to concentrate predominantly in the central area of the MCA, away from existing wind farms, and consistently reached the highest densities in this location (Figure 6 and Supplementary Appendix Figure B-1).
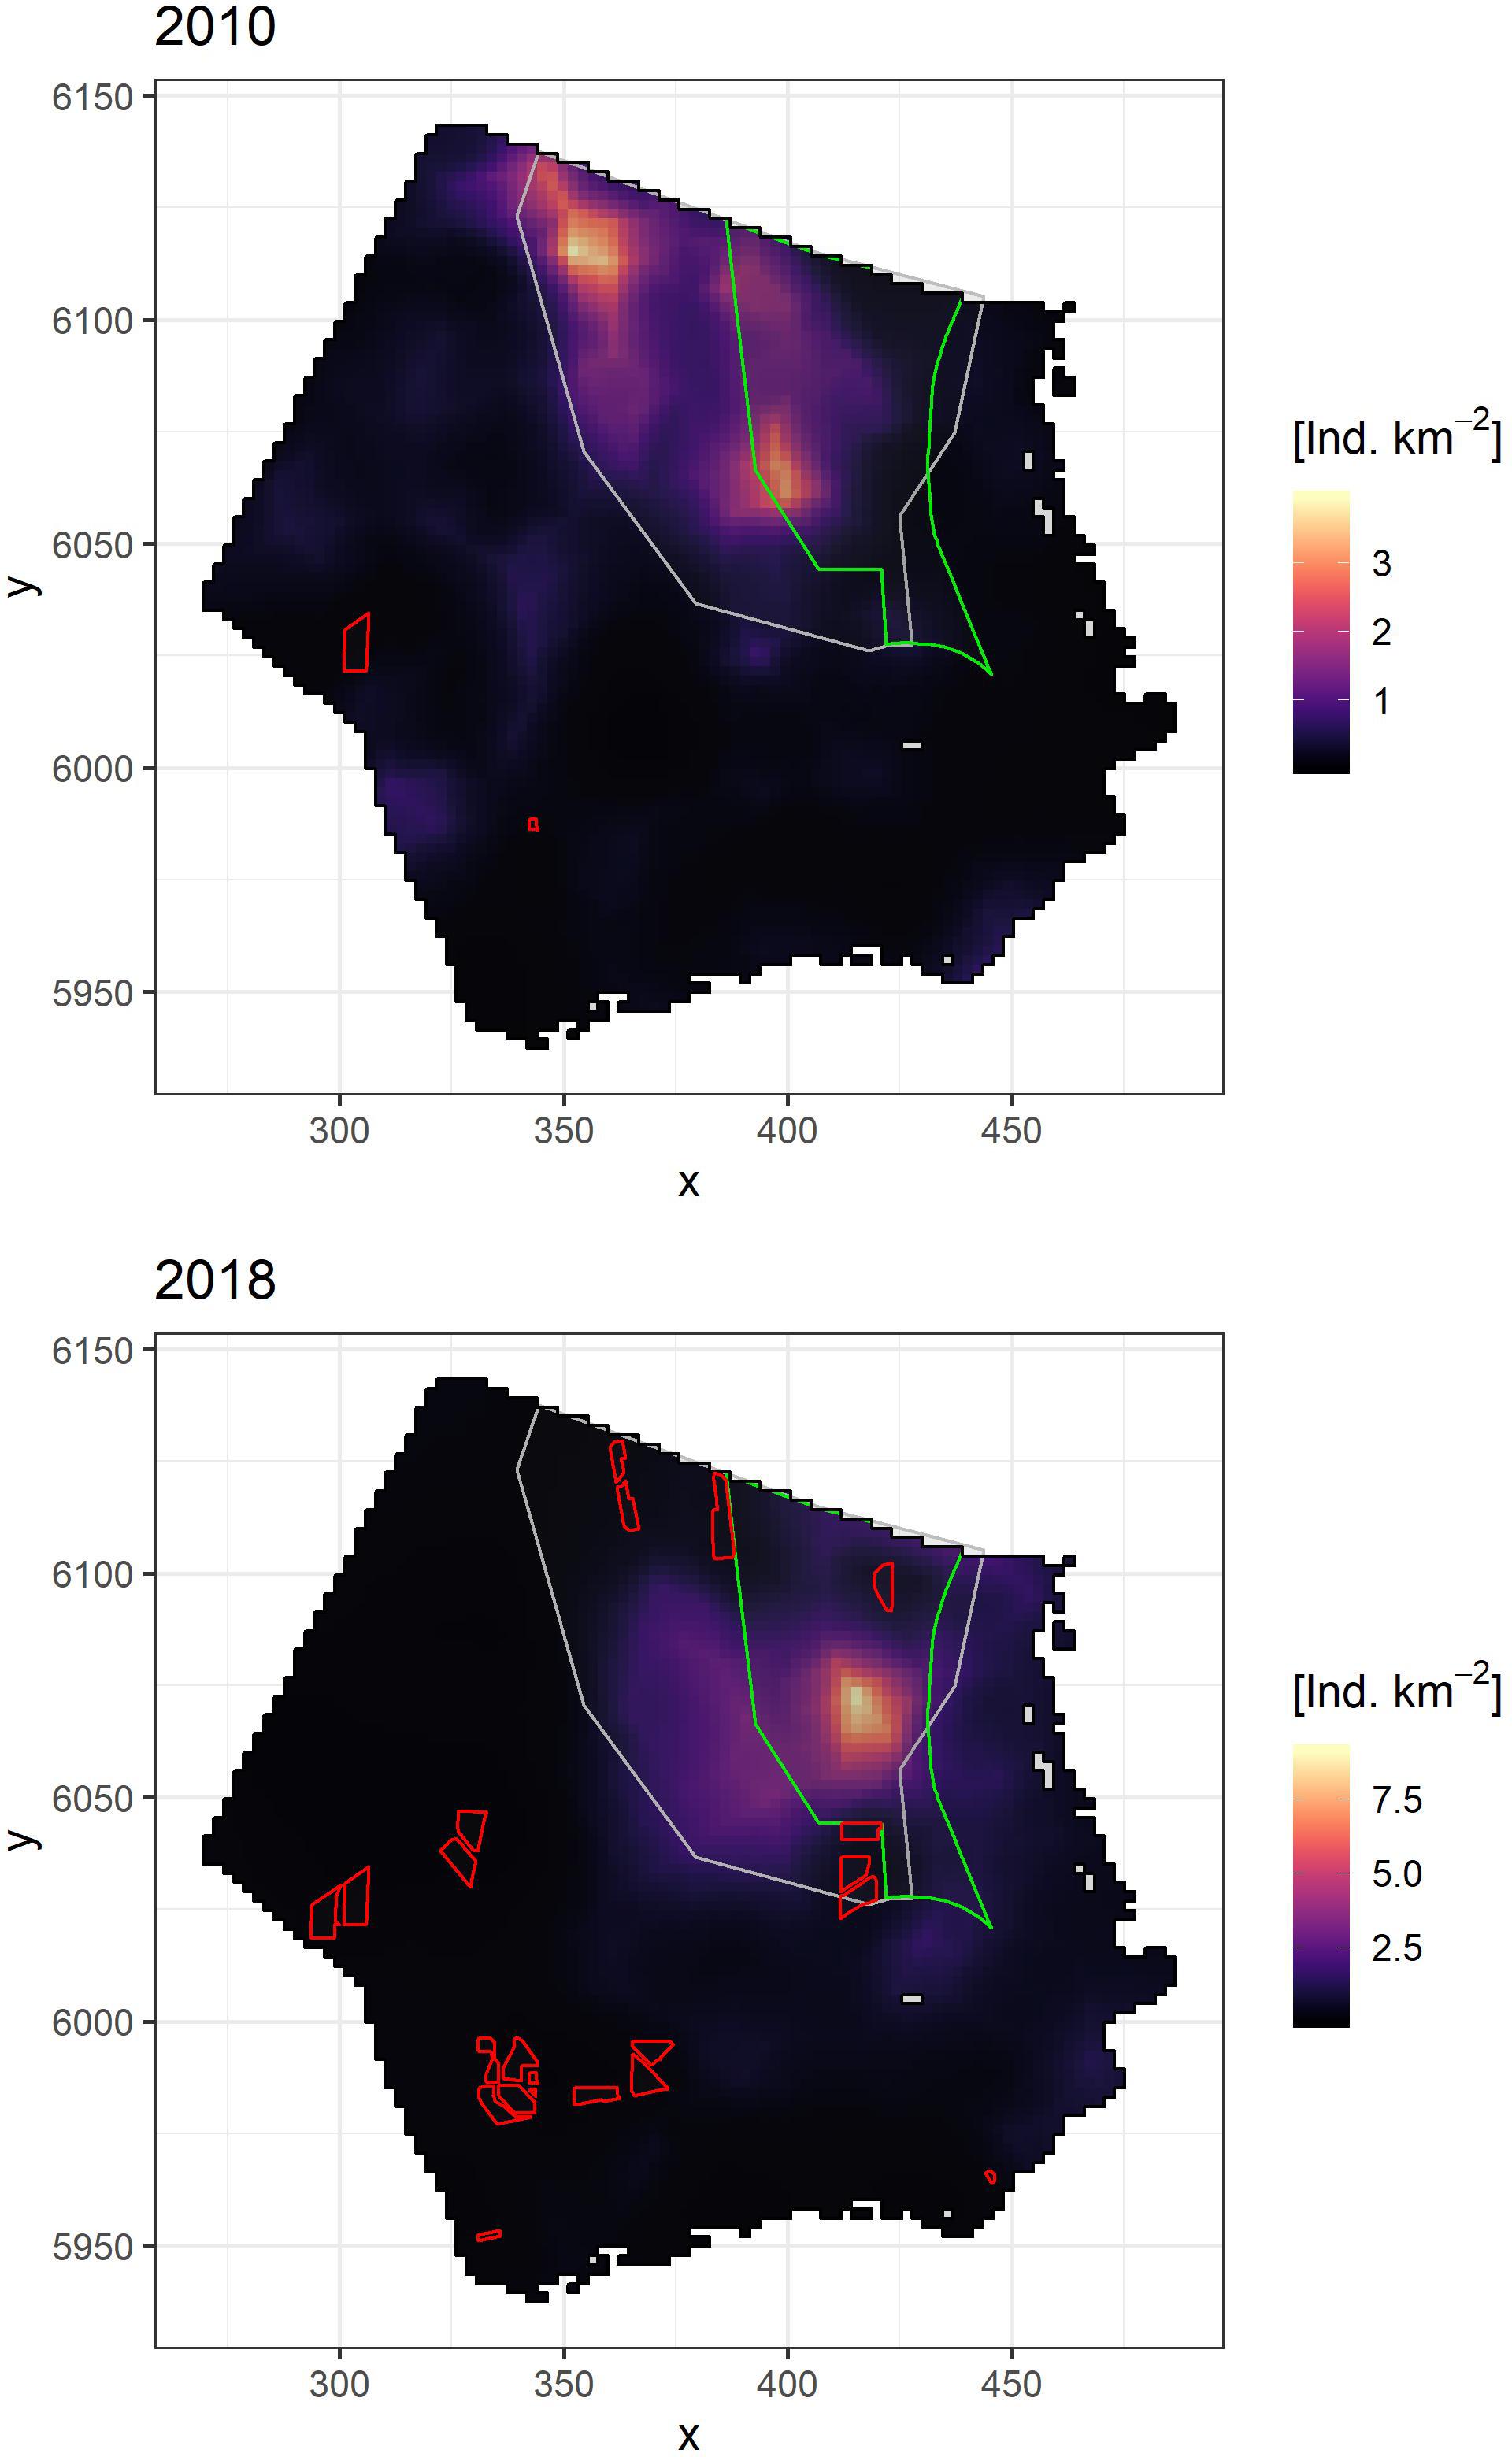
Figure 6. Mean posterior spatial distribution for divers during the spring season for year 2010, before the development of the offshore wind farms in the northern area (upper panel) and year 2018, under the current development of offshore wind farms (lower panel). Red polygons indicate offshore wind farms already constructed at the beginning of each period. Diver main concentration area (BMU, 2009) in gray and SPA Eastern German Bight in green are shown as reference.
Species monitoring programmes that run for years result in point-referenced spatio-temporal datasets that tend to be correlated spatially and temporally, but the subsequent ecological processes are almost never fully explained by the environmental variables collected.
Ignoring these dependencies, as most widely popular generalized linear and additive models (GLMs and GAMs) do, not only reduces their predictive ability, but can also lead to incorrect results (Legendre et al., 2002; Fortin and Dale, 2009).
In this study, we performed a Bayesian spatio-temporal hierarchical model with a progressive spatio-temporal distribution structure (Paradinas et al., 2017), which allowed us to account for these dependencies and predict diver densities at unknown locations using numerical Laplace approximations (Paradinas et al., 2017). Such a model does not necessarily require the use of environmental predictors, as the spatio-temporal structure of potential environmental variables and other unknown sources affecting the species distribution are already captured within the spatio-temporal component of the model.
Other key advantages of this modeling framework are:
• Bayesian models can incorporate our knowledge of the unknown parameters governing species behavior, expressed through probability distributions, rather than just fixed estimates, as in frequentist approaches (Blangiardo and Cameletti, 2015).
• The Delaunay triangulation allows more information to be collected in areas with more observations, which contributes to more accurate predictions. It is also less computationally demanding and takes into account the boundary effect (Lindgren et al., 2011). Since the inference is derived from the domain and not from the observations (which could change from year to year), the corresponding interpolation creates a better prediction surface than a regular grid (Pennino et al., 2013).
• Both, space and time are treated continuously, incorporating intrinsic components to account for spatial and temporal autocorrelation (Lindgren and Rue, 2015). In Bayesian hierarchical spatial models, they are included as multilevel spatial random effect structures representing all spatially explicit processes that can influence the pattern of the diver distribution. In this way, multiple sources of uncertainty associated with both the observed data and the inherent species distribution process, can be included in the analysis, generating more robust statistical inference and realistic predictions (Beguin et al., 2012; Pennino et al., 2017).
The application of this statistical framework to this long-term dataset, offers the opportunity to uncover changes in the diver population that could be related to the offshore wind energy development in these waters over the last ten years, and five years of offshore wind farm expansion within the MCA.
Despite these major changes in the environment, our results showed that the number of divers staging in the German North Sea during spring fluctuated between years but on average remained on the same level throughout the study period.
The NW-European flyway population of Red-throated Divers is estimated at 150,000–450,000 (BirdLife International, 2004) and a significant proportion of birds uses the German Bight during wintering and spring. For the German North Sea, the latest published spring average number for divers was 20,200 for the period 2002–2013 (Garthe et al., 2015).
The mean spring population for the German North Sea was estimated by the present study at 16,330 divers (95% CI: 15,088–17,912) during 2013–2018 when most of the wind farms were built, and 15,942 divers (95% CI: 14,836–17,176) during 2002–2012 (excluding the years 2006 and 2007) with few or no wind farms built. Our estimates for the early years are thus in the range of the study by Garthe et al. (2015), even if numbers from single surveys show that diver abundance fluctuates strongly during spring (Heinänen et al., 2020) and thus, some variability in the population estimates can be expected from different sets of surveys.
Seabird species vary strongly in their sensitivity to OWFs (Furness et al., 2013). For divers, strong avoidance behavior to OWFs has been found in all recent studies (Mendel et al., 2019; Allen et al., 2020; Heinänen et al., 2020).
Assuming a gradual avoidance for divers of about 10 km around wind farms (Vilela et al., 2020), in 2018 the total area impacted by wind farms would account for 12% of the total German North Sea EEZ area, while the total area impacted within the MCA would reach 35%. Therefore, it is remarkable that despite the strong avoidance behavior of divers and impacted proportion of area, no population decline is observed in this study. This result is consistent with a study in another part of the North Sea, in the Outer Thames Estuary SPA, where no decline in diver population numbers have been found after the construction of OWF despite clear avoidance of OWF and ships (Irwin et al., 2019).
It is also noteworthy that diver numbers in the MCA stayed relatively constant during the study period, confirming the importance of the 7,000 km2 area which was identified by Garthe et al. (2007) based on data until 2006 during spring, this zone held around 62% of the divers of the German North Sea throughout the study period (Supplementary Appendix Table A-2). However, in recent years, after the construction of six wind farms distributed over four locations in or around the MCA, the population has become more localized in a central area, while in former years divers were more widely distributed. This effect has also been described by Mendel et al. (2019) using data from before and after OWF construction. In the present study, densities in this central area have increased as compared to most previous years (except for 2003, when very high densities in this area were also found (Supplementary Appendix Figures B-1, C-1). On the other hand, local concentrations up to 3 Ind./km2, found north of the East Frisian Islands (southern side of the studied area) in several years (e.g., 2012), were not very persistent between years and no clear pattern between the location of wind farms and diver distribution was apparent (see Supplementary Appendix Figure C-2).
Even with an optimal statistical framework, the causes of a population change are usually hard to investigate, especially in migratory seabirds, and impacts might occur during wintering, migration or on the breeding grounds (e.g., Newton, 2004). As divers are long-lived birds (Bird et al., 2020), any negative impacts of OWF on their fitness related traits might only become apparent after several years (Sæther and Bakke, 2000; Jenouvrier et al., 2005; Sim et al., 2011). Short-term effects usually only occur if survival is affected directly, e.g., through collisions with OWF structures (Thaxter et al., 2019). However, for species like divers, which show large-scale avoidance of OWF, collisions are presumably extremely rare, while disturbance and habitat loss due to human activities seem to be the main risk.
Since the number of divers has not decreased but is distributed over a smaller area, as they avoid the wind farms and their immediate surroundings, the density within the unaffected areas has increased accordingly. It might be argued that a carrying capacity limit could be reached in future (Goss-Custard et al., 2002; Allen et al., 2020), above which increased competition for food might force divers to shift to other stopover areas (see e.g., Oudman et al., 2020). Thus, declining spring numbers in the German Bight could be one of the likely consequences when the carrying capacity is reached.
Only if alternative staging areas are unavailable, carry-over effects leading to reduced survival or breeding success might be expected (e.g., Szostek and Becker, 2015). Divers seem rather flexible in this respect, as they forage on a broad range of fish species (Kleinschmidt et al., 2019) which are widely available and they use several stopover areas during spring migration (Dorsch et al., 2019). As densities were rarely exceeding 6 Ind./km2 even in the center of distribution, resource depletion and intra-specific competition are unlikely to play a major role for this species. Therefore, at present, we have no indication that the carrying capacity limit has been reached and cannot predict when it will be reached.
In this context, it must be considered that individuals are not stationary, but moving over large distances during winter and spring. Recently, a telemetry study (Dorsch et al., 2019) showed that divers tagged in this area were highly mobile and commuted between Danish and German staging areas and individual home ranges often greatly exceed the size of the MCA, although divers show site fidelity to the general staging area. This high mobility could be an important cause of the fluctuations observed between years. This finding also suggests that there is a high turn-over rate of individuals, so that the total number of individuals using the area during spring is likely higher than what yearly estimates suggest.
This study highlights the advantages of using spatio-temporal approaches to assess population trends and bird distributions and their application on environmental impact studies. Standardized monitoring programmes need to be maintained to assess the long-term trend of avian populations. Ain the case of the diver population in the German North Sea, although the population shows no signs of decline so far, the long-term effects of disturbance by offshore wind farms on divers are still unknown.
To get more insight into the importance of the main concentration area for divers, staging duration and turn-over rates should be included in future analyses. Monitoring data from adjacent areas (e.g., Denmark) could further improve population estimates and the detection of population changes.
The datasets presented in this study can be found in the Marine Data Archive repository at https://doi.org/10.14284/474.
All authors designed the study. LS, AF, AB, JB, BB, and RV processed the visual and digital aerial survey data. FB and RV performed the model analysis. CB, AD, and RV led the writing of the manuscript. All authors contributed substantially to the drafts and gave final approval for publication.
This research work was part of a research project funded by the Federal Association of Wind Farm Operators Offshore (BWO e.V.) (bwo-offshorewind.de/en/). No external funds were received for open access publication fees.
RV, CB, FB, AD, and GN were employed by the company BioConsult SH GmbH & Co., KG. LS, AF, and AB were employed by the company IBL Umweltplanung GmbH. JB, BB, and WP were employed by the company Institut für Angewandte Ökosystemforschung GmbH.
We would like to thank the Federal Agency for Nature Conservation (BfN) at Vilm, Landesbetrieb für Küstenschutz, Nationalpark und Meeresschutz Schleswig-Holstein (LKN.SH), and the Research and Technology Centre, West Coast (FTZ) which also provided survey data for the analysis. Special thanks to the observers and technicians who collected and processed the data.
The Supplementary Material for this article can be found online at: https://www.frontiersin.org/articles/10.3389/fmars.2021.701332/full#supplementary-material
Allen, S., Banks, A. N., Caldow, R. W. G., Frayling, T., Kershaw, M., and Rowell, H. (2020). “Developments in understanding of red-throated diver responses to offshore wind farms in marine special protection areas,” in Marine Protected Areas Elsevier (Amsterdam: Elsevier), 573–586. doi: 10.1016/b978-0-08-102698-4.00029-0
Bachl, F. E., Lindgren, F., Borchers, D. L., and Illian, J. B. (2019). inlabru: an R package for Bayesian spatial modelling from ecological survey data. Methods Ecol. Evol. 10, 760–766. doi: 10.1111/2041-210X.13168
Beguin, J., Martino, S., Rue, H., and Cumming, S. G. (2012). Hierarchical analysis of spatially autocorrelated ecological data using integrated nested Laplace approximation. Methods Ecol. Evol. 3, 921–929. doi: 10.1111/j.2041-210x.2012.00211.x
Bellebaum, J., Diederichs, A., Kube, J., Schulz, A., and Nehls, G. (2006). Flucht- und meidedistanzen überwinternder seetaucher und meeresenten gegenüber schiffen auf See. Ornithol. Rundbr. Meckl.-Vorp, 45. in Proceedings of the German Seabird and Shorebird Colloquium October 22-24, 2004. Reports on Bird Conservation, Rostock, 43, 31–47.
Bird, J. P., Martin, R., Akçakaya, H. R., Gilroy, J., Burfield, I. J., Garnett, S. T., et al. (2020). Generation lengths of the world’s birds and their implications for extinction risk. Conserv. Biol. 34, 1252–1261. doi: 10.1111/cobi.13486
BirdLife International (Ed.) (2004). Birds in Europe: Populations Estimates, Trends and Conservation Status, BirdLife Conservation Series. Cambridge: BirdLife International.
Blangiardo, M., and Cameletti, M. (2015). Spatial and Spatio-Temporal Bayesian Models With R-INLA. Hoboken NJ: John Wiley & Sons.
BMU, (2009). Positionspapier des Geschäftsbereichs des Bundesumweltministeriums zur kumulativen Bewertung des Seetaucherhabitatverlusts durch Offshore-Windparks in der deutschen AWZ der Nord- und Ostsee als Grundlage für eine Übereinkunft des BfN mit dem BSH. Einführung eines neuen fachlich begründeten Bewertungsverfahrens. Berlin: BMU.
BSH, (2003). Standarduntersuchungskonzept (StUK) für die Untersuchung und Überwachung der Auswirkungen von Offshore Windenergieanlagen (WEA) auf die Meeresumwelt. 2. Fortschreibung. Bundesamt für Seeschifffahrt und Hydrographie. Hamburg: BSH.
BSH (2007). Standard - Untersuchung der Auswirkungen von Offshore-Windenergieanlagen auf die Meeresumwelt (StUK3). Bundesamt für Seeschifffahrt und Hydrographie (BSH). Hamburg: BSH.
BSH (2013). Standard - Untersuchung der Auswirkungen von Offshore-Windenergieanlagen auf die Meeresumwelt (StUK4). Bundesamt für Seeschifffahrt und Hydrographie (BSH). Hamburg: BSH.
BSH (2019). Environmental Report for the Site Development Plan 2019 for the German Baltic Sea (No. BSH-No. 7608). Hamburg: BSH.
Buckland, S. T., Anderson, D. R., Burnham, K. P., Laake, J. L., Borchers, D. L., and Thomas, L. (2001). Introduction to Distance Sampling Estimating Abundance of Biological Populations, 1st Edn. Oxford: Oxford University Press.
Burger, C., Schubert, A., Heinänen, S., Dorsch, M., Kleinschmidt, B., Žydelis, R., et al. (2019). A novel approach for assessing effects on distributions and movements of seabirds in relation to shipping traffic. J. Environ. Manag. 251:109511. doi: 10.1016/j.jenvman.2019.109511
Busch, M. (2015). Kurzbeschreibung der Methodenstandards von APEM Digitalflugerfassungen. Caussade: APEM Ltd.
Busch, M., and Garthe, S. (2016). Approaching population thresholds in presence of uncertainty: assessing displacement of seabirds from offshore wind farms. Environ. Impact Assess. Rev. 56, 31–42. doi: 10.1016/j.eiar.2015.08.007
Coppack, T., Weidauer, A., and Kemper, G. (2015). Erfassung von Seevogel-und Meeressäugerbeständen mittels georeferenzierter Digitalfotografie. AGIT J. 1, 358–367.
Diederichs, A., Nehls, G., and Petersen, I. K. (2002). Flugzeugzählungen zur großflächigen erfassung von seevögeln und marinen säugern als grundlage für umweltverträglichkeitsstudien im offshorebereich. Seevögel 23, 38–46.
Dierschke, V., Furness, R. W., and Garthe, S. (2016). Seabirds and offshore wind farms in European waters: avoidance and attraction. Biol. Conserv. 202, 59–68. doi: 10.1016/j.biocon.2016.08.016
Dorsch, M., Burger, C., Heinänen, S., Kleinschmidt, B., Morkunas, J., Nehls, G., et al. (2019). DIVER – German Tracking study of Seabirds in Areas of Planned Offshore Wind Farms at the Example of Divers. Final Report on the Joint Project DIVER, FKZ 0325747 A/B, Funded by the Federal Ministry of Economics and Energy (BMWi) Within the Framework of the 6th Energy Research Programme of the German Federal Government. Husum: BioConsult SH GmbH & Co KG.
EEG, (2014). Erneuerbare-Energien-Gesetz vom 21. Juli 2014 (BGBl. I S. 1066), Das Zuletzt durch Artikel 1 des Gesetzes vom 17. Juli 2017 (BGBl. I S. 2532) Geändert Worden Ist. Bonn: Bundesanzeiger Verlag.
Fliessbach, K. L., Borkenhagen, K., Guse, N., Markones, N., Schwemmer, P., and Garthe, S. (2019). A ship traffic disturbance vulnerability index for northwest european seabirds as a tool for marine Spatial planning. Front. Mar. Sci. 6:192.
Fortin, M.-J., and Dale, M. R. (2009). Spatial autocorrelation in ecological studies: a legacy of solutions and myths. Geogr. Anal. 41, 392–397. doi: 10.1111/j.1538-4632.2009.00766.x
Fuglstad, G. A., Simpson, D., Lindgren, F., and Rue, H. (2018). Constructing priors that penalize the complexity of gaussian random fields. J. Am. Stat. Assoc. 114, 445–452. doi: 10.1080/01621459.2017.1415907
Furness, R. W., Wade, H. M., and Masden, E. A. (2013). Assessing vulnerability of marine bird populations to offshore wind farms. J. Environ. Manag. 119, 56–66. doi: 10.1016/j.jenvman.2013.01.025
Garthe, S., and Hüppop, O. (2004). Scaling possible adverse effects of marine wind farms on seabirds: developing and applying a vulnerability index. J. Appl. Ecol. 41, 724–734. doi: 10.1111/j.0021-8901.2004.00918.x
Garthe, S., Müller, S., Schwemmer, H., and Schwemmer, P. (2015). Verbreitung, jahresdynamik und bestandsentwicklung der seetaucher gavia spec. in der deutschen bucht (Nordsee). Vogelwarte 53, 121–138.
Garthe, S., Sonntag, N., Schwemmer, P., and Dierschke, V. (2007). Estimation of seabird numbers in the German North Sea throughout the annual cycle and their biogeographic importance. Die Vogelwelt 128, 163–178.
Goss-Custard, J. D., Stillman, R. A., West, A. D., Caldow, R. W. G., and McGrorty, S. (2002). Carrying capacity in overwintering migratory birds. Biol. Conserv. 105, 27–41. doi: 10.1016/S0006-3207(01)00175-6
Heinänen, S., Žydelis, R., Kleinschmidt, B., Dorsch, M., Burger, C., Morkūnas, J., et al. (2020). Satellite telemetry and digital aerial surveys show strong displacement of red-throated divers (Gavia stellata) from offshore wind farms. Mar. Environ. Res. 160:104989. doi: 10.1016/j.marenvres.2020.104989
Irwin, C., Scott, M., Humphries, G., and Webb, A. (2019). HiDef Report to Natural England - Digital Video Aerial Surveys of Red-Throated Diver in the Outer Thames Estuary Special Protection Area 2018 (Natural England Commissioned Report No. Number 260). Cleator Moor (GBR): HiDef Aerial Surveying Limited.
Jenouvrier, S., Baurbraud, C., Cazelles, B., and Weimerskirch, H. (2005). Modelling population dynamics of seabirds: importance of the effects of climate fluctuations on breeding proportions. Oikos 108, 511–522. doi: 10.1111/j.0030-1299.2005.13351.x
Kleinschmidt, B., Burger, C., Dorsch, M., Nehls, G., Heinänen, S., Morkūnas, J., et al. (2019). The diet of red-throated divers (Gavia stellata) overwintering in the German Bight (North Sea) analysed using molecular diagnostics. Mar. Biol. 166:77.
Kloskowski, J., Trembaczowski, A., and Filipiuk, M. (2019). Stable isotope tracing of links between marine wintering and freshwater breeding habitats of Red-necked Grebes. J. Ornithol. 160, 593–605. doi: 10.1007/s10336-019-01642-1
Laake, J., Borchers, D., Thomas, L., Miller, D., and Bishop, J. (2015). mrds: Mark-Recapture Distance Sampling. R Package Version 2, 14.
Legendre, P., Dale, M. R., Fortin, M.-J., Gurevitch, J., Hohn, M., and Myers, D. (2002). The consequences of spatial structure for the design and analysis of ecological field surveys. Ecography 25, 601–615. doi: 10.1034/j.1600-0587.2002.250508.x
Lindgren, F., and Rue, H. (2015). Bayesian spatial modelling with R - INLA. J. Stat. Soft. 63, 1–25. doi: 10.18637/jss.v063.i19
Lindgren, F., Rue, H., and Lindström, J. (2011). An explicit link between Gaussian fields and Gaussian Markov random fields: the stochastic partial differential equation approach: link between gaussian fields and gaussian markov random fields. J. R. Stat. Soc. 73, 423–498. doi: 10.1111/j.1467-9868.2011.00777.x
Masden, E. A., Haydon, D. T., Fox, A. D., and Furness, R. W. (2010). Barriers to movement: modelling energetic costs of avoiding marine wind farms amongst breeding seabirds. Mar. Pollut. Bull. 60, 1085–1091. doi: 10.1016/j.marpolbul.2010.01.016
Mendel, B., Schwemmer, P., Peschko, V., Müller, S., Schwemmer, H., Mercker, M., et al. (2019). Operational offshore wind farms and associated ship traffic cause profound changes in distribution patterns of Loons (Gavia spp.). J. Environ. Manag. 231, 429–438. doi: 10.1016/j.jenvman.2018.10.053
Mendel, B., Sonntag, N., Wahl, J., Schwemmer, P., Dries, H., Guse, N., et al. (2008). Artensteckbriefe Von See- Und Wasservögeln Der Deutschen Nord- Und Ostsee: Verbreitung, Ökologie und Empfindlichkeiten gegenüber Eingriffen in Ihrem Marinen Lebensraum, Naturschutz und Biologische Vielfalt. Bonn-Bad Godesberg (DEU): Bundesamt für Naturschutz.
Newton, I. (2004). Population limitation in migrants - Review. IBIS 146, 197–226. doi: 10.1111/j.1474-919x.2004.00293.x
Oudman, T., Laland, K., Ruxton, G., Tombre, I., Shimmings, P., and Prop, J. (2020). Young birds switch but old birds lead: how barnacle geese adjust migratory habits to environmental change. Front. Ecol. Evol. 7:502. doi: 10.3389/fevo.2019.00502
Paradinas, I., Conesa, D., López-Quílez, A., and Bellido, J. M. (2017). Spatio-temporal model structures with shared components for semi-continuous species distribution modelling. Spatial Stat. 22, 434–450. doi: 10.1016/j.spasta.2017.08.001
Pennino, M. G., Muñoz, F., Conesa, D., López-Quílez, A., and Bellido, J. M. (2013). Modeling sensitive elasmobranch habitats. J. Sea Res. 83, 209–218. doi: 10.1016/j.seares.2013.03.005
Pennino, M. G., Vilela, R., Bellido, J. M., and Mendoza, M. (2017). “Comparing methodological approaches to model occurrence patterns of marine species,” in Research Advances in Marine Resources, ed. K. Norton (Nagoya: NOVA).
R Core Team. (2019). A Language and Environment for Statistical Computing. Vienna: R Foundation for Statistical Computing.
Rue, H., and Held, L. (2005). Gaussian Markov Random Fields: Theory and Applications, Monographs on Statistics and Applied Probability. Boca Raton MA: Chapman & Hall/CRC.
Rue, H., Martino, S., and Chopin, N. (2009). Approximate Bayesian inference for latent Gaussian models by using integrated nested Laplace approximations. J. R. Stat. Soc. 71, 319–392. doi: 10.1111/j.1467-9868.2008.00700.x
Sæther, B.-E., and Bakke, Ø (2000). Avian life history variation and contribution of demographic traits to the population growth rate. Ecology 88, 642–653. doi: 10.2307/177366
Schwemmer, P., Mendel, B., Dierschke, V., and Garthe, S. (2011). Effects of ship traffic on seabirds in offshore waters: implications for marine conservation and spatial planning. Ecol. Appl. 21, 1851–1860. doi: 10.2307/23023122
Sim, I. M. W., Rebecca, G. W., Ludwig, C., Grant, M. J., and Reid, J. M. (2011). Characterizing demographic variation and contributions to population growth rate in a declining population. J. Anim. Ecol. 80, 159–170. doi: 10.1111/j.1365-2656.2010.01750.x
Simpson, D. P., Rue, H., Martins, T. G., Riebler, A., and Sørbye, S. H. (2017). Penalising model component complexity: a principled, practical approach to constructing priors (with discussion). Stat. Sci. 32, 1–46. doi: 10.4135/9781452232409.n1
Szostek, K. L., and Becker, P. H. (2015). Survival and local recruitment are driven by environmental carry-over effects from the wintering area in a migratory seabird. Oecologia 178, 643–657. doi: 10.1007/s00442-015-3298-2
Thaxter, C. B., Ross-Smith, V. H., Bouten, W., Clark, N. A., Conway, G. J., Masden, E. A., et al. (2019). Avian vulnerability to wind farm collision through the year: Insights from lesser black-backed gulls (Larus fuscus) tracked from multiple breeding colonies. J. Appl. Ecol. 56, 2410–2422. doi: 10.1111/1365-2664.13488
Vilela, R., Burger, C., Diederichs, A., Nehls, G., Bachl, F., Szostek, L., et al. (2020). Divers (Gavia spp.) in the German North Sea: Changes in Abundance and Effects of Offshore Wind Farms. A Study into Diver Abundance and Distribution Based on Aerial Survey Data in the German North Sea. BioConsult SH, School of Mathematics, University of Edinburgh, IBL Umweltplanung, Institut für angewandte Ökosystemforschung, Husum (DEU). Husum: BioConsult SH GmbH & Co KG.
Webb, A., and Nehls, G. (2019). “Surveying seabirds,” in Wildlife and Wind Farms, Conflicts and Solutions. Offshore: Monitoring and Mitigation, Vol. 4, ed. M. R. Perrow (Exeter (GBR): Pelagic Publishing), 60–95.
Weiß, F., Büttger, H., Baer, J., Welcker, J., and Nehls, G. (2016). Erfassung von seevögeln und meeressäugetieren mit dem hidef kamerasystem aus der luft. Seevögel 37, 14–21.
Keywords: Red-throated loons, Gavia sp., population trend, German North Sea, Bayesian model, INLA, SPDE, latent Gaussian model
Citation: Vilela R, Burger C, Diederichs A, Bachl FE, Szostek L, Freund A, Braasch A, Bellebaum J, Beckers B, Piper W and Nehls G (2021) Use of an INLA Latent Gaussian Modeling Approach to Assess Bird Population Changes Due to the Development of Offshore Wind Farms. Front. Mar. Sci. 8:701332. doi: 10.3389/fmars.2021.701332
Received: 27 April 2021; Accepted: 17 June 2021;
Published: 08 July 2021.
Edited by:
Wen-Cheng Wang, National Taiwan Normal University, TaiwanReviewed by:
Haavard Rue, King Abdullah University of Science and Technology, Saudi ArabiaCopyright © 2021 Vilela, Burger, Diederichs, Bachl, Szostek, Freund, Braasch, Bellebaum, Beckers, Piper and Nehls. This is an open-access article distributed under the terms of the Creative Commons Attribution License (CC BY). The use, distribution or reproduction in other forums is permitted, provided the original author(s) and the copyright owner(s) are credited and that the original publication in this journal is cited, in accordance with accepted academic practice. No use, distribution or reproduction is permitted which does not comply with these terms.
*Correspondence: Raul Vilela, cmF1bHZpbGVAZ21haWwuY29t
†Present address: Jochen Bellebaum, Sächsische Vogelschutzwarte, Neschwitz, Germany
Disclaimer: All claims expressed in this article are solely those of the authors and do not necessarily represent those of their affiliated organizations, or those of the publisher, the editors and the reviewers. Any product that may be evaluated in this article or claim that may be made by its manufacturer is not guaranteed or endorsed by the publisher.
Research integrity at Frontiers
Learn more about the work of our research integrity team to safeguard the quality of each article we publish.