
95% of researchers rate our articles as excellent or good
Learn more about the work of our research integrity team to safeguard the quality of each article we publish.
Find out more
ORIGINAL RESEARCH article
Front. Mar. Sci. , 15 July 2021
Sec. Marine Biogeochemistry
Volume 8 - 2021 | https://doi.org/10.3389/fmars.2021.701014
This article is part of the Research Topic Geochemical Cycling of 210Po and 210Pb in Marine Environments View all 12 articles
Due to the remoteness and difficulty of sampling, the 210Po and 210Pb data are scarce in the Southern Ocean. Here, the activity concentrations of 210Po and 210Pb around Prydz Bay in austral summer were determined to understand their spatial variation and evaluate the dynamics of particle organic matter (POM). The activity concentrations of dissolved 210Po (D210Po) and 210Pb (D210Pb) range from 0.47 to 3.20 Bq⋅m–3 and from 1.15 to 2.97 Bq⋅m–3, respectively, with the lower values in the shelf. The particulate 210Po (P210Po) and 210Pb (P210Pb) are lower in the open ocean and increase to the coastal waters, among which the circumpolar deep water (CDW) is the lowest. The activity concentration of total 210Pb (T210Pb) ranges from 1.26 Bq⋅m–3 to 3.16 Bq⋅m–3, with a higher value in CDW, which is ascribed to radiogenic production from 226Ra and subsequent lateral transport. Occasionally a high value of T210Po occurs in deep water (>3.00 Bq⋅m–3), which may be caused by the remineralization of POM. The disequilibria between T210Po and T210Pb appears throughout the water column at most stations. The average T210Po/T210Pb)A.R. in the euphotic zone is 0.66, reflecting the effect of strong particle scavenging. There is a good positive correlation between the solid-liquid ratio of 210Po and POC, while 210Pb does not, indicating that particulate organic matter regulates the biogeochemical cycle of 210Po around Prydz Bay. Based on the 210Po/210Pb disequilibria, the export flux of POC in the water column is estimated to be 0.8–31.9 mmol m–2 d–1, with the higher values in the shelf.
210Po (T1/2 = 138.4 days) and 210Pb (T1/2 = 22.3 years) are radionuclides in 238U decay chain. Naturally occurring 210Po is a β–-decay product of 210Pb via short-lived 210Bi (T1/2 = 5.0 days), and 210Pb is produced throughout 226Ra decay via several short-lived isotopes (222Rn, 218Po, 214Pb, etc.). 210Po mainly comes from in-situ decay of 210Pb in seawater, and 210Pb has three sources: atmospheric deposition, terrestrial runoff, and in situ production via 226Ra decay (Bacon et al., 1976; Moore and Smith, 1986; Nozaki et al., 1997; Wei et al., 2011; Kaste and Baskaran, 2012). Unlike 210Pb mainly being adsorbed to particle surfaces, 210Po is additionally assimilated by phytoplankton (Nozaki et al., 1976; Cochran, 1992; Verdeny et al., 2009). The behavior difference results in a depletion of 210Po as compared to 210Pb in water column, which provides a tool for quantifying the adsorption rate by particles, and export flux on a seasonal-to-decadal timescale (Fisher et al., 1983; Cherrier et al., 1995; Stewart et al., 2005; Rigaud et al., 2014; Tang et al., 2019).
The Southern Ocean divides the polar parts from the warm tropical ocean, including the southern part of the Pacific, Atlantic, and Indian Oceans. Although it represents only 10% of the ocean surface area, it accounts for approximately 25% of the oceanic uptake of atmospheric CO2 (Takahashi et al., 2002; Arrigo et al., 2008). The Prydz Bay, located in the Indian sector of the Southern Ocean, is the third largest bay in the Antarctica, following the Weddell Sea and the Ross Sea. Previous studies on 210Po and 210Pb in the Southern Ocean mainly focused on the Antarctic Circumpolar Current (ACC) (Shimmield et al., 1995; Friedrich and Rutgers van der Loeff, 2002), there is still very little research on Prydz Bay. 210Po/210Pb and 234Th/238U disequilibria have been used to estimate POC export flux in the Southern Ocean, but the results obtained by the two methods are sometimes different. The POC export fluxes estimated by 210Po/210Pb disequilibria were significantly lower than those by 234Th/238U disequilibria in the Bellingshausen Sea (Shimmield et al., 1995). In contrast, the POC export fluxes estimated by the two methods were similar in the ACC (Rutgers van der Loeff et al., 1997). Therefore, comparing the two methods not only helps to deepen the understanding of their applicability, but also helps to more accurately understand the temporal and spatial variability of the POC export flux.
Here, we report the activity concentrations of 210Po and 210Pb around Prydz Bay, including dissolved 210Po (D210Po), particulate 210Po (P210Po), dissolved 210Pb (D210Pb), and particulate 210Pb (P210Pb). The main objectives include: (1) revealing the distribution of 210Po and 210Pb around Prydz Bay; (2) assessing the factors affecting the disequilibria between 210Po and 210Pb; and (3) quantifying the export flux of POC via 210Po/210Pb disequilibria, and compared with the result by 234Th/238U disequilibria.
Seawater sample was collected using a Teflon-coated Niskin bottle assembled on a Sea-Bird SBE-911 rosette system (Sea-Bird Electronics Inc., United States) from January 31 to February 3, 2013 onboard R/V XUELONG. A total of 104 water samples (about 5 L each) was collected at different depths at six stations on the transect P7, covering the continental shelf (water depth from 200 to 400 m), continental slope (water depth of about 1,000 m), and the open ocean (water depth of about 3,500 m) (Figure 1). The water sample was filtered through a 0.4 μm polycarbonate membrane to separate the dissolved and particulate phases. The filtrate was acidified to pH <2 with approximately 20 mL concentrated HCl immediately. The particulate matter was frozen and stored at −20°C for further processing in the onshore laboratory.
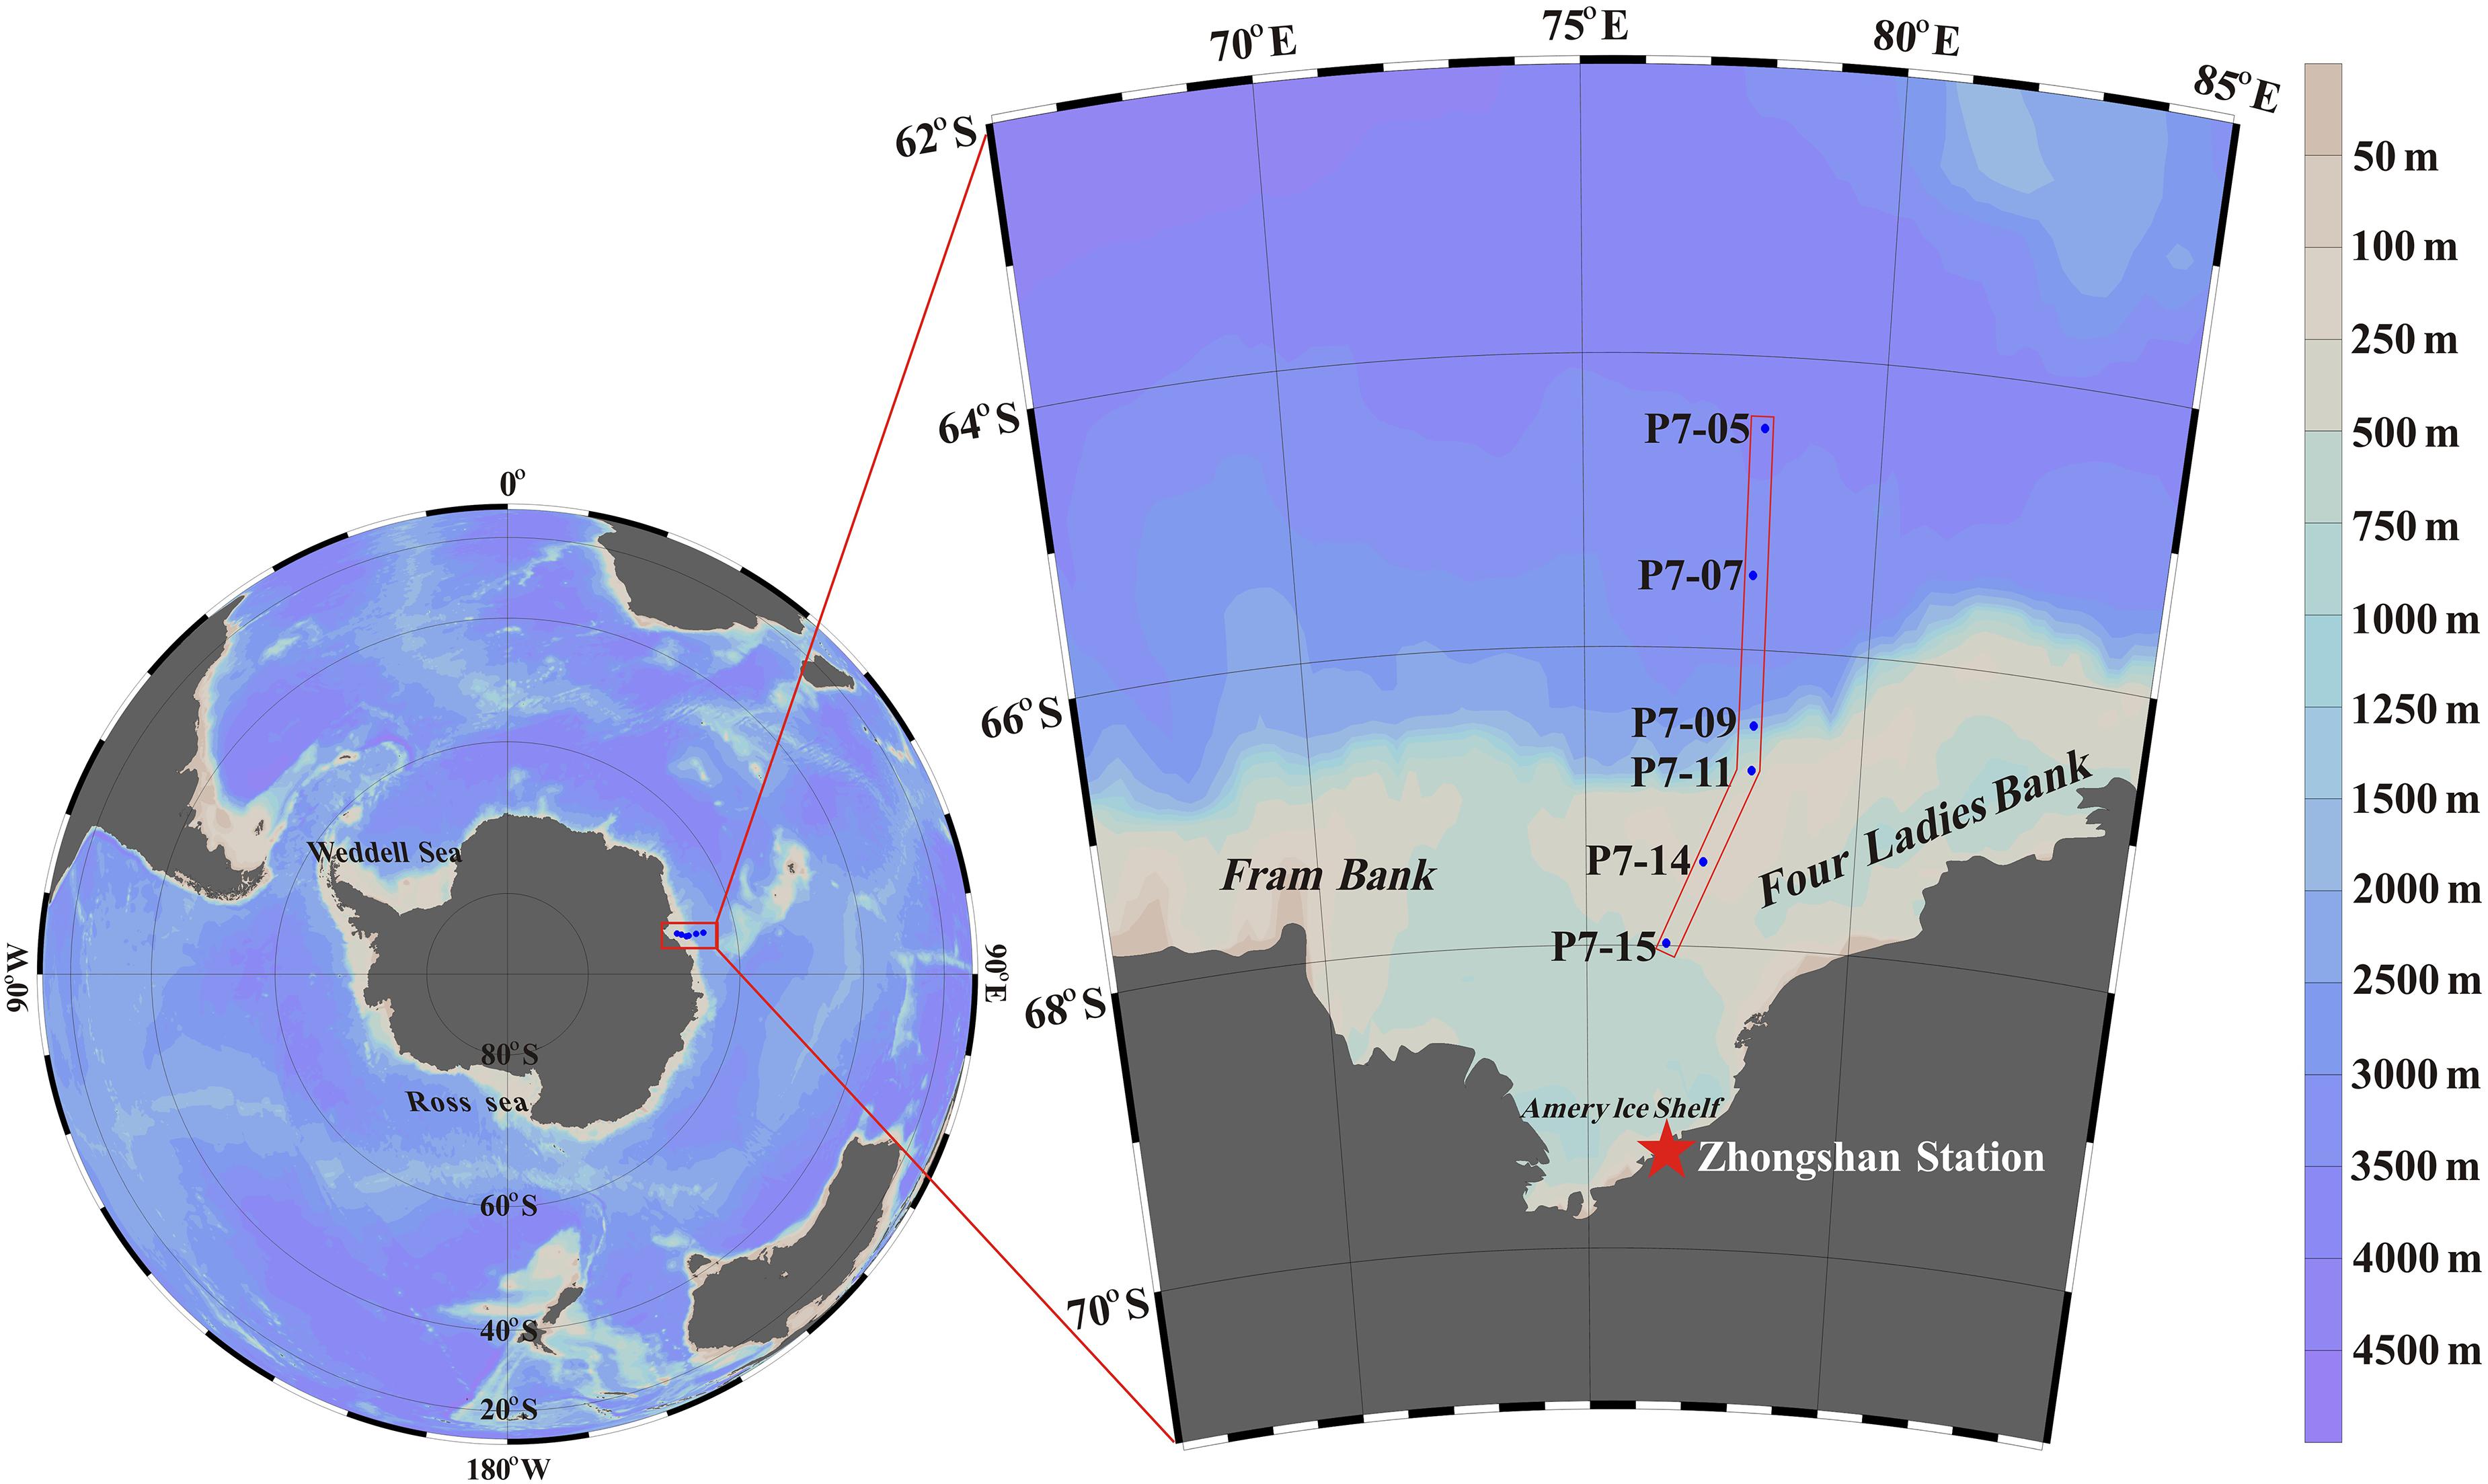
Figure 1. Sampling locations around Prydz Bay. Stations P7-15, P7-14 and P7-11 are located in the shelf, station P7-09 is located in the slope, and stationsP7-07 and P7-05 are located in the basin.
Temperature and conductivity were measured by SBE-911 CTD, the accuracy of which was 0.001°C and 0.0003 S/m, respectively. The water sample used for nutrient determination was filtered through a 0.45 μm cellulose acetate membrane and stored in a 100 mL acid-cleaned HDPE bottle by adding saturated HgCl2 solution. The nitrate (NO3-N), phosphate (PO4-P), and silicate (SiO3-Si) was determined by the zinc-cadmium reduction method, molybdenum-blue method, and molybdate-blue method, respectively (Grasshoff et al., 1983).
The particulate matter in the water sample (5–10 L) was filtered on a pre-combusted 47 mm GF/F membrane (450°C, 4 h) for POC measurement. After the sample was dried at 60°C, it was stored frozen at −20°C. In the laboratory, the filter was fumigated with concentrated HCl for 48 h to remove inorganic carbonate. The sub-sample was encapsulated in a tin boat, and sent to the elemental analyzer (NC2500, Carlo Erba) for POC determination. The detection limit of POC is 0.1 μmolC, and the precision is 0.2% (Ren, 2015).
The dissolved sample was enriched with 210Po by co-precipitating with Fe(OH)3, and purified by spontaneous deposition on a silver disk (4 h at 85°C). The mixed acid of HNO3, HClO4, and HCl was used to digest the particulate sample, and the subsequent procedure was the same as that of the dissolved sample. The radioactivity of 210Po was counted by an alpha spectrometer (Octête® Plus, EG&G) in Xiamen University. After the first self-deposition of 210Po, the sample solution was left for more than 9 months, and the second spontaneous deposition of 210Po was performed to determine the radioactivity of 210Po produced by the decay of 210Pb (Yang, 2005).
The radioactivity of 210Po in the sample was calculated by correcting the 210Po activity measured from the first self-deposition to the sampling time point. The calculation formula is as follows:
where is the activity concentration of 210Po at the time of sampling (Bq⋅m–3); is the activity concentration of 210Po at the time of first self-deposition (Bq⋅m–3); t0 represents the time interval from sampling to the first self-deposition; R2 represents the chemical recovery of 210Po, as determined by the 209Po tracer; B denotes the blank in the analysis process.
In the calculation of 210Pb activity, considering that 210Pb has a long half-life (22.3 years) and the time interval from sampling to co-precipitation is short, the effects of 210Pb decay and ingrowth from sampling to co-precipitation could be ignored. Therefore, the 210Pb activity was corrected back to the time point of co-precipitation. The calculation formula is as follows:
where is the activity of 210Pb at the time point of co-precipitation (that is, the activity of 210Pb in the sample, Bq⋅m–3); is the 210Po activity measured from the second self-deposition sample (Bq⋅m–3); λ1 and λ2 are the decay constants of 210Pb (0.031 a–1) and 210Po (1.828 a–1), respectively; t1 and t2 represent the time interval from co-precipitation to the first self-deposition and the time interval from the first to second self-deposition, respectively; R1 represents the chemical recovery of 210Pb, which was determined by the stable Pb content measured by an atomic absorption spectroscopy; B represents the blank in the analysis process.
The error of 210Po and 210Pb activity reported here is ±1σ counting uncertainty.
Friedrich and Rutgers van der Loeff (2002) found that 210Po activity has a stronger correlation with POC and biogenic silica in the Southern Ocean, indicating that 210Po/210Pb disequilibria is a reliable method for estimating the export flux of POC in the Southern Ocean. Similar to the 234Th approach (Buesseler et al., 1992, 2006; Stewart et al., 2007), the export flux of POC is calculated by multiplying the export flux of P210Po (i.e., the removal flux of 210Po) by the POC/P210Po ratio at the export interface (Shimmield et al., 1995). This is an empirical approach. It is not necessary to assume that POC and P210Po have the same residence time. The calculation equation is as follows:
where FPOC and FP210 Po represent the export flux of POC and P210Po, respectively; is the ratio of POC to P210Po at the export interface.
The FP210 Po was calculated by a classical steady-state irreversible scavenging model after ignoring the atmospheric deposition flux of 210Po (Bacon et al., 1976; Friedrich and Rutgers van der Loeff, 2002; Masqué et al., 2002; Yang et al., 2006).
Here, the integration depth interval of P210Po export is delineated according to the physical properties of water masses, namely, from 0 to 25 m (the mixed layer), from 50 to 200 m (the thermocline water), from 300 to 1,000 m (the CDW), and from 2,000 m to the bottom (the AABW), respectively. As the water depth of the continent shelf is relative shallow, it is divided into surface (from 0 to 25 m), subsurface (from 50 to 100 m), and deep layer (from 200 m to the bottom).
The temperature in the upper water increased to the north outside Prydz Bay (Figure 2A). The summer surface water in the top 50 m layer has a salinity of about 33.8 and a maximum temperature of 0.8°C. Below the surface water, extremely low temperature and higher salinity appear, which are characteristics of the Winter Water (WW, T < −1.5°C, 34.2 < S < 34.56). The formation of the WW is due to the weak mixing in the upper waters in summer, which causes the water to retain the winter characteristics for a long time (Pu et al., 2002a). The water with a depth of 500–2,000 m shows the characteristics of high temperature and high salinity of Circumpolar Deep Water (CDW) (T > 1.0°C, 34.5 < S < 34.75, Figures 2A,B). It is widely distributed in a large area around the continental shelf and is also one of the main water masses of Antarctic Circumpolar Current (ACC) (Pu et al., 2002b). Below the CDW (>2,000 m), the water mass with the highest salinity and the low temperature is called Antarctic Bottom Water (AABW), and its average temperature and salinity are −0.153 ± 0.022°C and 34.651 ± 0.001, respectively.
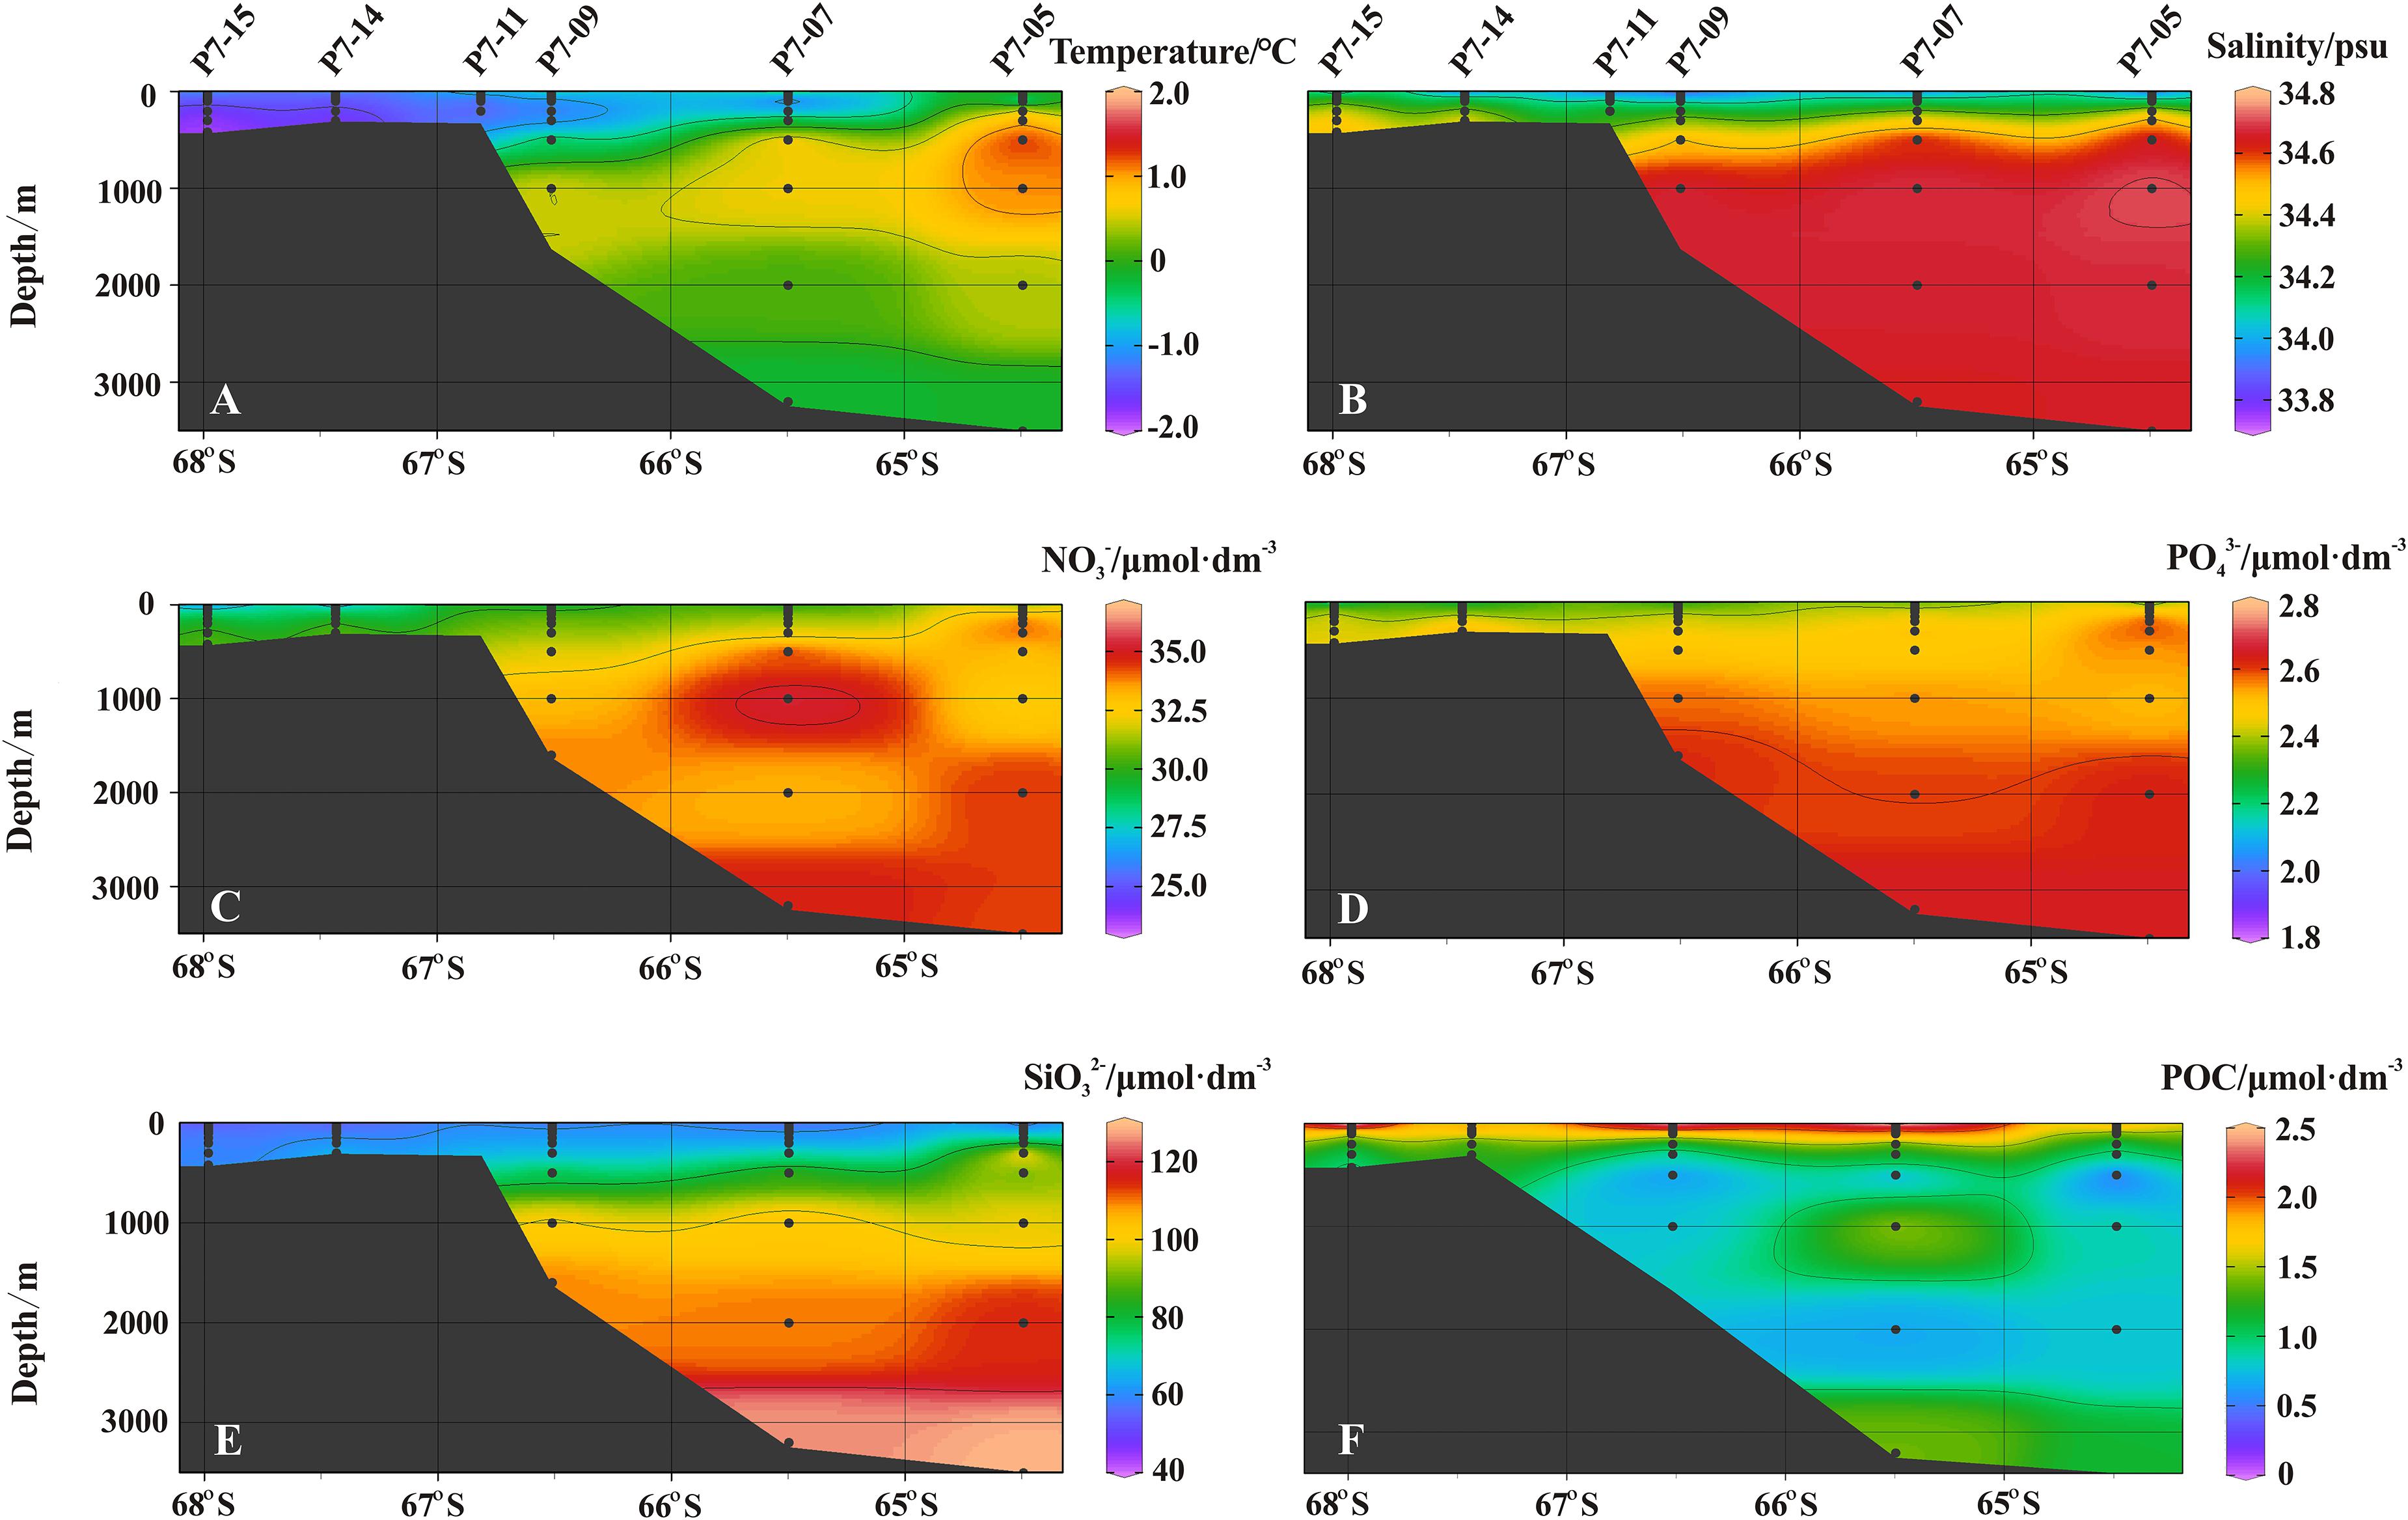
Figure 2. The sectional distribution of (A) temperature (°C), (B) salinity (psu), (C) nitrate (μmol dm–3), (D) phosphate (μmol dm–3), (E) silicate (μmol dm–3), and (F) POC (μmol dm–3).
Nitrate gradually increases from the shelf to the open ocean, while nitrite shows an increasing trend from north to south. Although the concentration of nitrate in surface water is low, it is still detectable. The concentration of nitrate in the bottom water increases, which may be due to the nitrification of ammonia released from the sediments (Figure 2C). The concentration of phosphate in the upper ocean is low, but it remains abundant at depths deeper than the mixed layer (Figure 2D). The vertical change of silicate in the shelf (Stns. P7-15, P7-14, and P7-11) is not obvious, but the profiles in the slope and the open ocean are different, in which the silicate increases as the depth increases. The highest silicate concentration appears near the bottom, which is attributed to the dissolution of biogenic silica in the sediments and subsequent transport to the overlying water (Figure 2E).
The POC concentration varies from 0.35 to 5.37 μmol/dm3, with an average of 1.51 μmol/dm3. The POC concentration in surface water falls in a range of 1.77–5.37 μmol/dm3, with an average of 3.83 μmol/dm3. In the upper 100 m water column, POC decreases significantly as the depth increases, which is resulted from the photosynthesis of phytoplankton and the degradation of organic matter. In addition, the POC concentration in the shelf is higher than those in the slope and the open ocean, reflecting the spatial variation of primary productivity. Note that the POC concentration in near-bottom water tends to increase, especially at stations P7-05, P7-07, and P7-09, which may reflect the effect of sediment resuspension (Figure 2F).
The activity concentrations of 210Po and 210Pb are shown in Table 1, and the sectional distribution along ∼78.0 °E is shown in Figure 3.
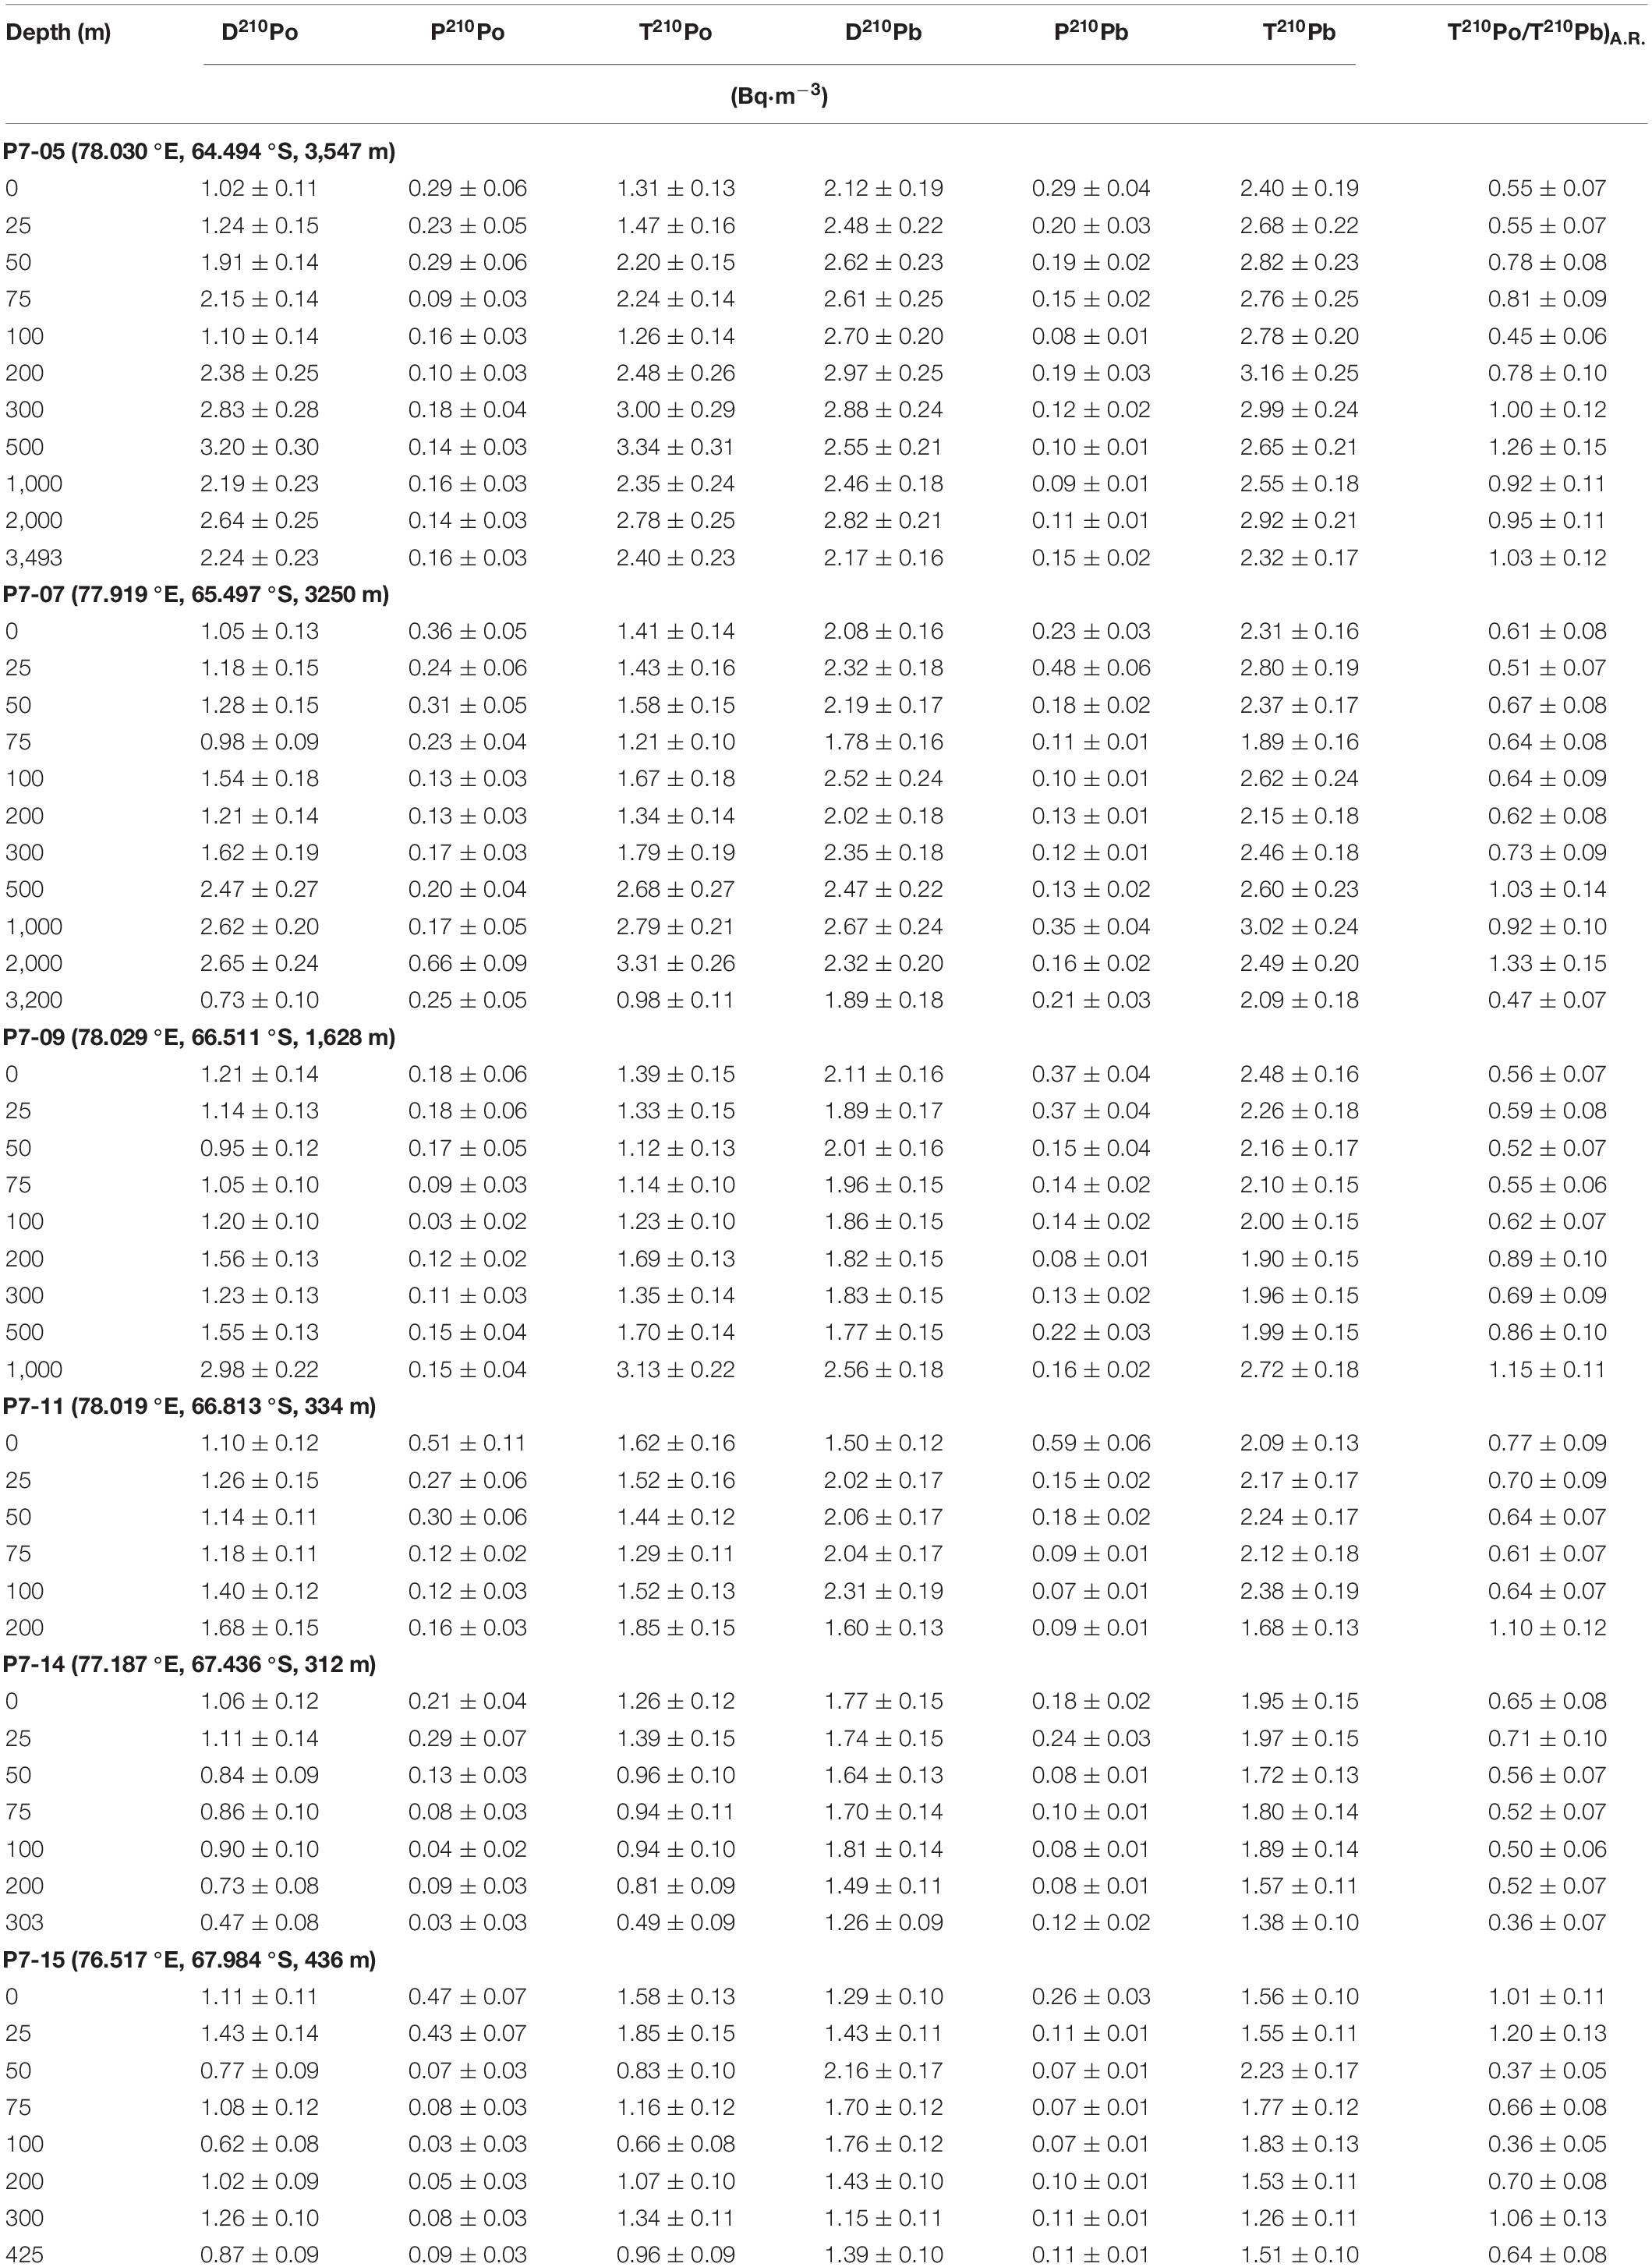
Table 1. The activity concentration of dissolved and particulate 210Po and 210Pb, and the activity ratio of T210Po/T210Pb.
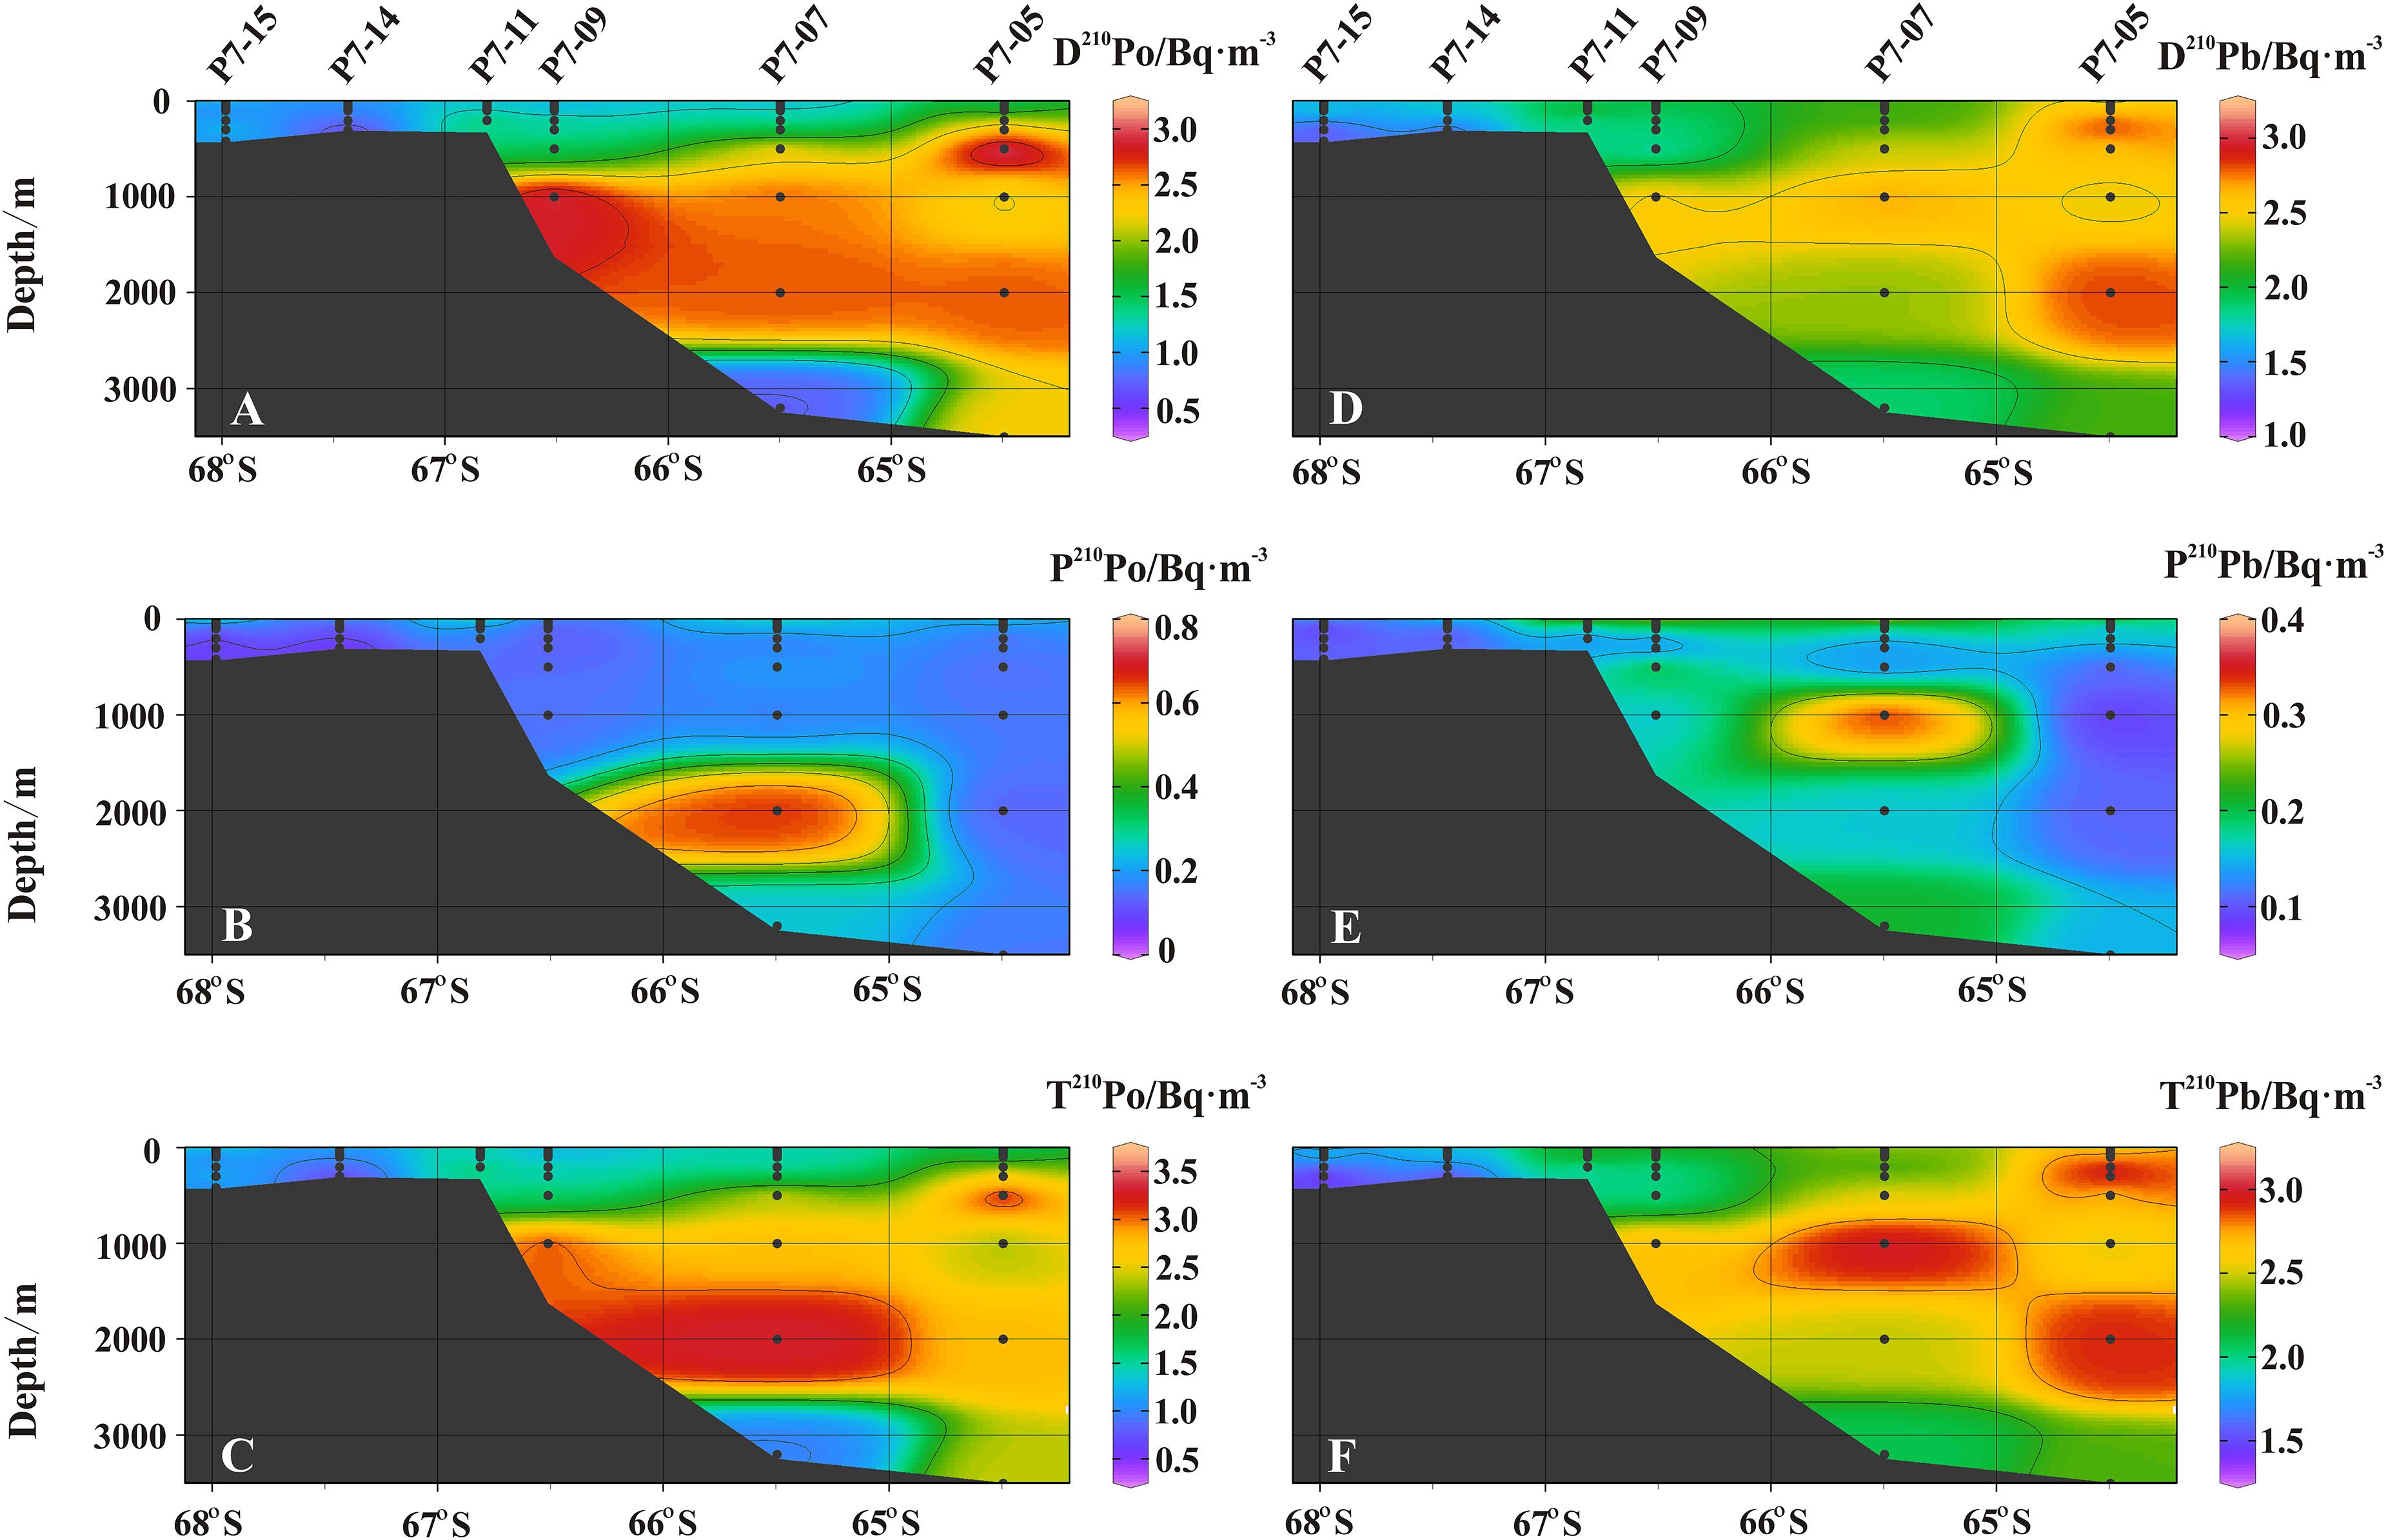
Figure 3. The sectional distribution of (A) dissolved 210Po (Bq/m3), (B) particulate 210Po (Bq⋅m–3), (C) total 210Po (Bq⋅m–3), (D) dissolved 210Pb (Bq⋅m–3), (E) particulate 210Pb (Bq⋅m–3), and (F) total 210Pb (Bq⋅m–3).
The activity concentration of D210Po ranges from 0.47 to 3.20 Bq⋅m–3, with an average of 1.44 ± 0.15 Bq⋅m–3. The D210Po in the shelf water (avg. 1.04 ± 0.11 Bq⋅m–3) is lower than those in the slope (avg. 1.51 ± 0.15 Bq⋅m–3) and open ocean (avg. 2.08 ± 0.20 Bq⋅m–3). Compared with other water masses, the D210Po in CDW is higher (p < 0.0001, one-way ANOVA, Figure 3A). The activity concentration of P210Po varies in a wide range from 0.03 to 0.66 Bq⋅m–3, with an average of 0.18 ± 0.04 Bq⋅m–3. The vertical variation of P210Po in the shelf decreases as the depth increases. The activity concentration of P210Po in the slope is mostly stable at about 0.13 Bq⋅m–3, but an abnormally high value appears at a depth of 2,000 m at station P7-07. The activity concentration of P210Po in surface water (upper 50 m) of the open ocean is higher than that in the shelf and slope, with an average of 0.27 ± 0.06 Bq⋅m–3 (Figure 3B). The activity concentration of T210Po is mainly contributed by D210Po, and its value is between 0.49 and 3.34 Bq⋅m–3 (avg. 1.63 ± 0.15 Bq⋅m–3). The T210Po in the surface and the bottom layer is lower than that in the CDW. In general, the T210Po shows a decreasing trend from open ocean (avg. 2.26 ± 0.21 Bq⋅m–3) to the slope (avg. 1.71 ± 0.16 Bq⋅m–3) and the shelf (avg. 1.21 ± 0.12 Bq⋅m–3) (Figure 3C). This spatial variation is attributed to the high biological productivity and the active sediment resuspension in the shelf, resulting in the rapid scavenging of particle-reactive radionuclides (Chen et al., 2012). The vertical change of T210Po in the shelf is small, which indicates that the particle scavenging is strong in the entire water column.
The distribution pattern of D210Pb is generally similar to that of D210Po (Figures 3A,D). The variation range of D210Pb is from 1.15 to 2.97 Bq⋅m–3, with the lowest in the shelf and the highest in the open ocean (p < 0.001, one-way ANOVA, Figure 3D). The D210Pb is lower in surface water due to more effective particle scavenging, while the D210Pb increases in the subsurface and deep water. The higher D210Pb in CDW is affected by the remineralization of particulate organic matter (Bacon et al., 1976; Somayajulu and Craig, 1976; Thomson and Turekian, 1976; Wei et al., 2011). The activity concentration of P210Pb ranges from 0.07 to 0.59 Bq⋅m–3. In the shelf, the P210Pb is higher in surface water, and lower in deep water (0.07–0.11 Bq⋅m–3) (Figure 3E). The activity concentration of T210Pb ranges from 1.26 to 3.16 Bq⋅m–3, with an average of 2.20 ± 0.17 Bq⋅m–3 (Table 1). The T210Pb in the surface water is the lowest, especially in the shelf (Figure 3F), indicating that 210Pb is effective scavenged by particles. The activity concentration of T210Pb in CDW (2.49–3.02 Bq⋅m–3) is higher than that in other water masses (p < 0.002, one-way ANOVA), which is consistent with the highest T210Pb (∼3 Bq⋅m–3) in ACC reported previously (Rama et al., 1961; Somayajulu and Craig, 1976; Chung and Applequist, 1980; Chung, 1981).
The activity ratio of T210Po/T210Pb ranges from 0.36 to 1.33, and shows a widespread deficiency of 210Po with respect to 210Pb around Prydz Bay (Figure 4). The average value of T210Po/T210Pb)A.R. in the upper 100 m water column is 0.66, reflecting the influence of biological activity and particle scavenging. Compared with 210Pb, organisms preferentially absorb 210Po, and organic tissues have a stronger affinity for 210Po (Bacon et al., 1976; Cochran et al., 1983; Stewart and Fisher, 2003; Stewart et al., 2007; Yang et al., 2009), which leads to more effective removal of 210Po from the euphotic zone. Under the combined action of biological absorption and particle adsorption, the T210Po/T210Pb ratio in the shelf is lower than those in the slope and open ocean (compare the right and left panels in Figure 4), which is consistent with the observed low nutrients and high POC in the shelf (Figure 2).
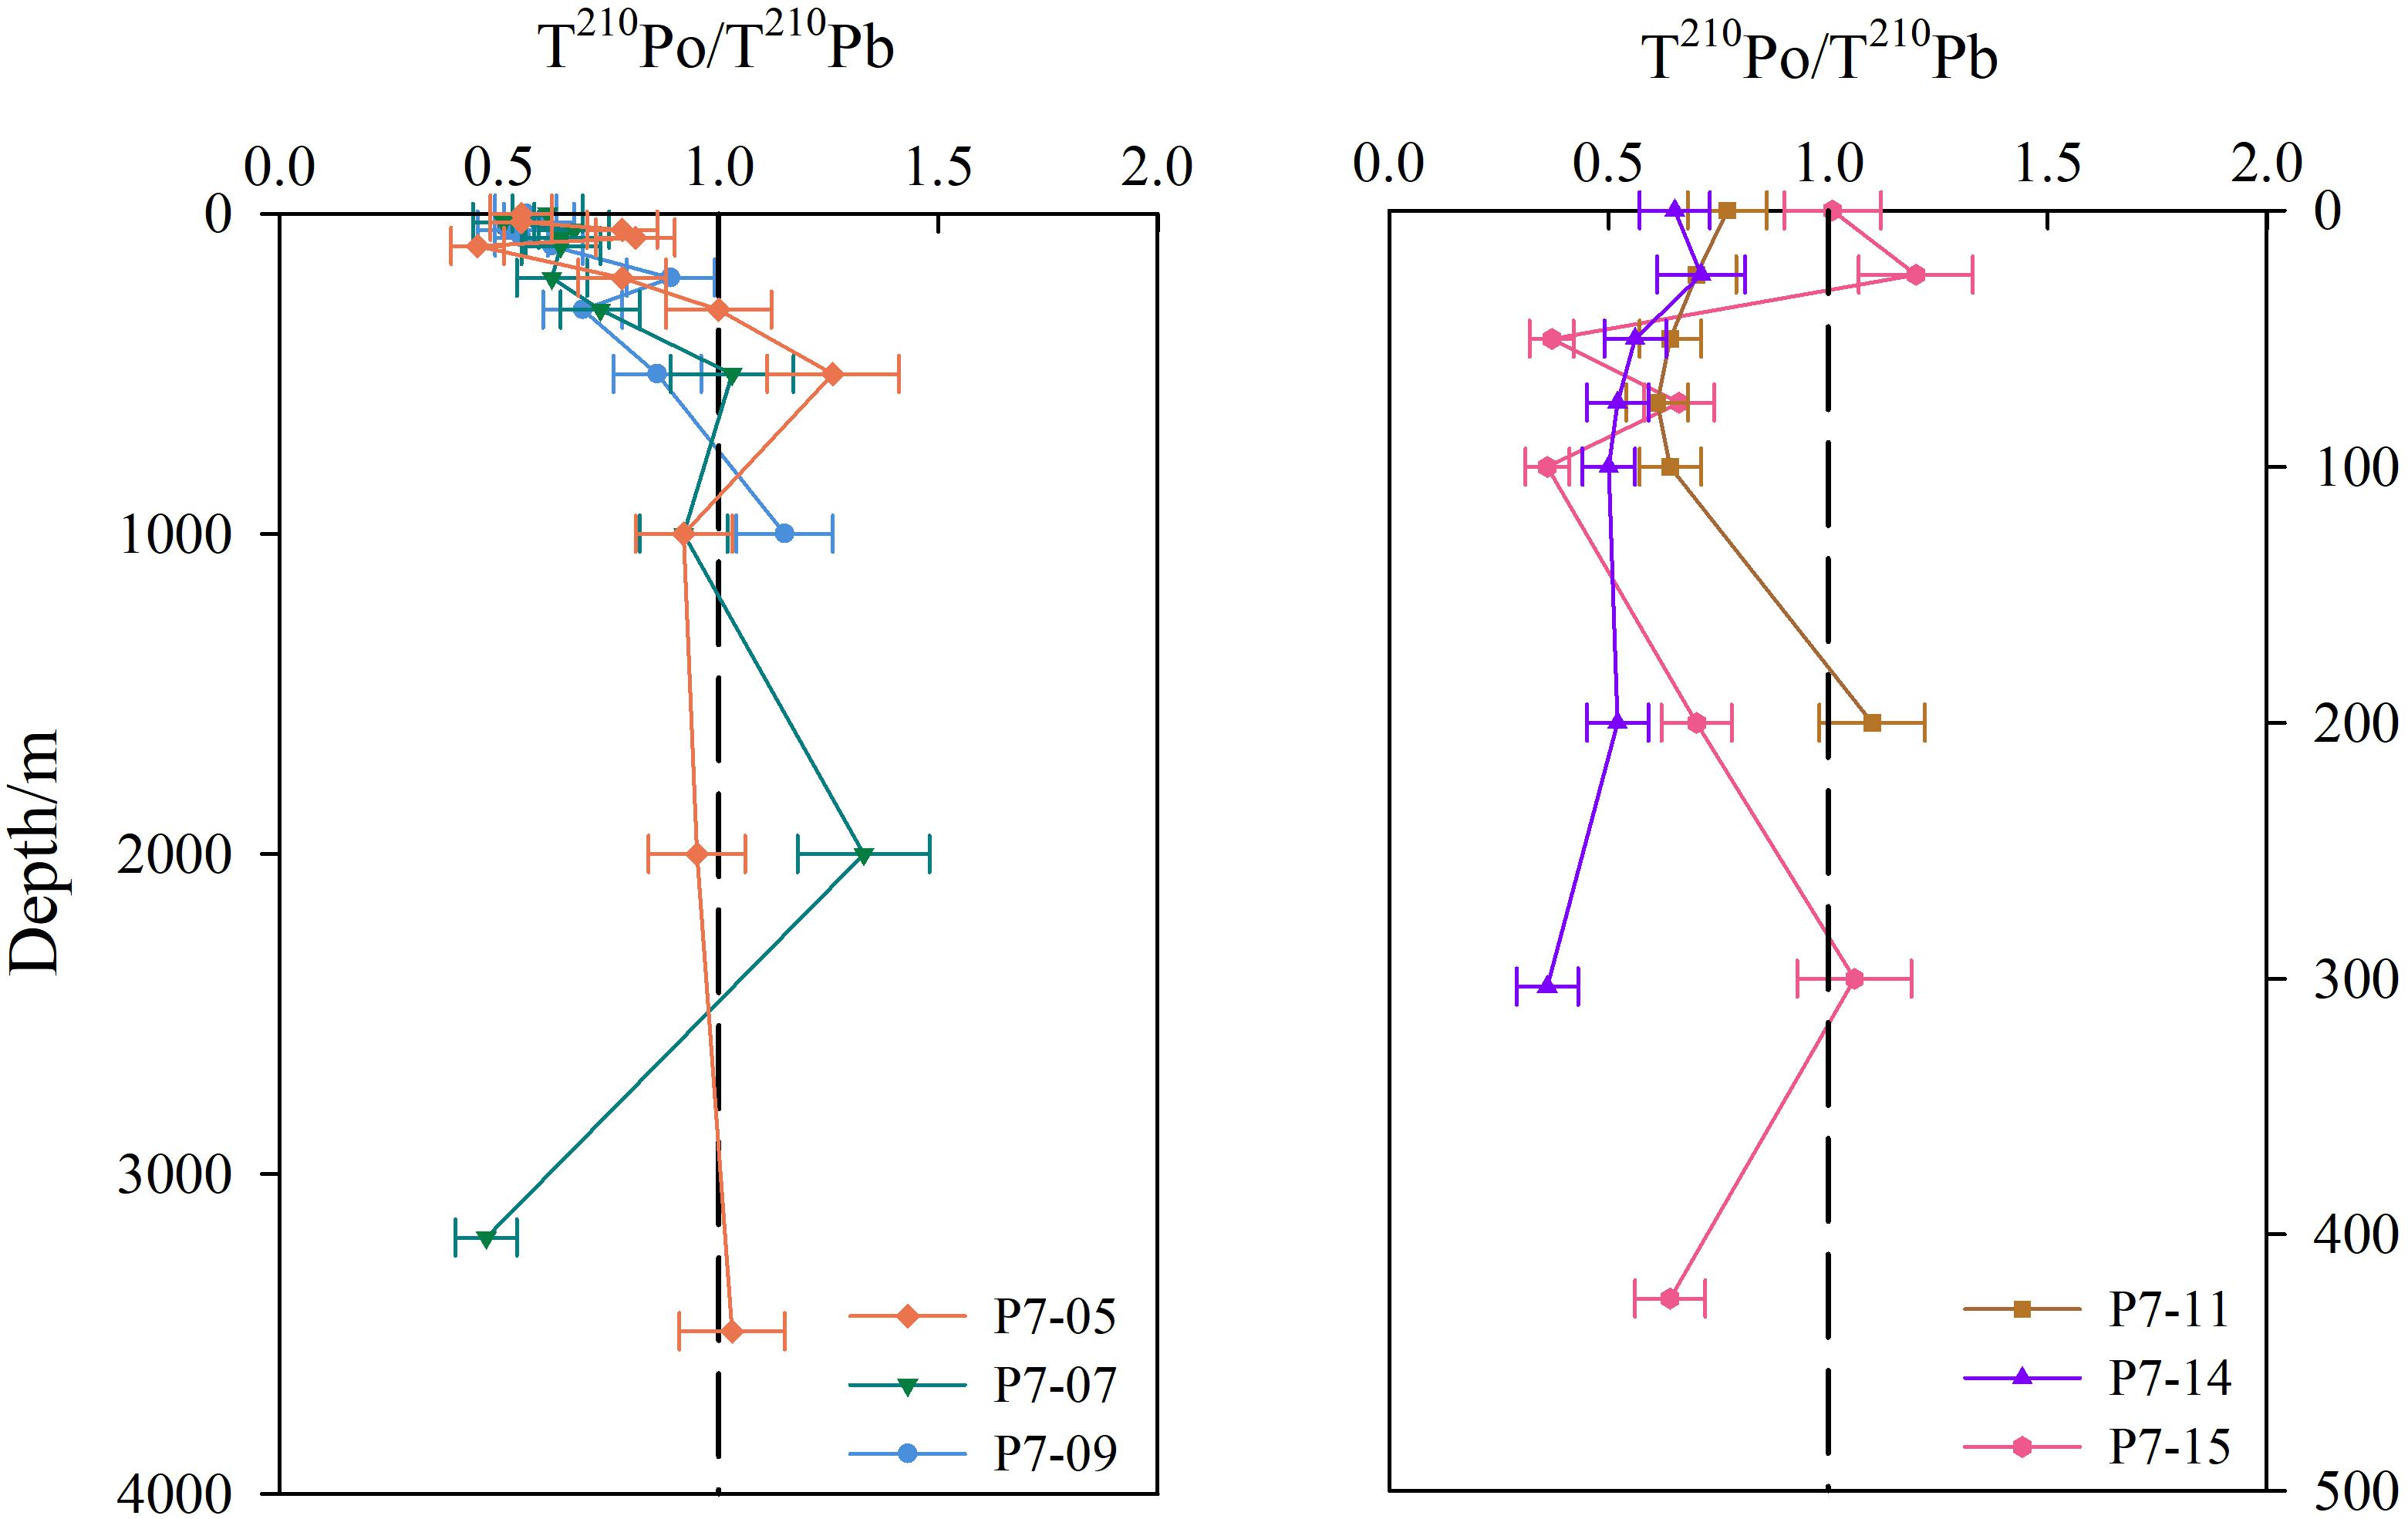
Figure 4. Profiles of T210Po/T210Pb activity ratio at sites around Prydz Bay. The left panel is stations in the slope and the basin, and the right panel is stations in the shelf.
Some previous studies have shown a secular equilibrium is reached between 210Pb and 210Po in water deeper than 1000 m, such as the North Atlantic (Bacon et al., 1976), the South Pacific (Turekian and Nozaki, 1980), and the Indian Ocean (Chung and Finkel, 1988). However, a large deficiency of 210Po has been found in deep waters of some seas, such as the East China Sea and the Philippine Sea (Nozaki et al., 1990), the equatorial Pacific and the Bering Sea (Nozaki et al., 1997), the Sargasso Sea (Kim and Church, 2001), and the South China Sea (Chung and Wu, 2005; Hong et al., 2013). In this study, most of the 210Po in deep water around Prydz Bay are in equilibrium with 210Pb, but there is an excess or deficiency of 210Po at certain depths at some sites (Figure 4). These disequilibria may be caused by differences in particle composition. Hong et al. (2013) found a positive correlation between the flux of P210Po and the flux of calcium carbonate, while no correlation between P210Pb and calcium carbonate. However, Niedermiller and Baskaran (2019) found a significant negative correlation between the inventories of T210Pb and particulate Al, but no correlation between 210Po and particulate Al, suggesting much less removal of 210Po by lithogenic material compared to 210Pb. Therefore, detailed mineralogical and chemical composition of particles play an important role in deep water scavenging.
The activity ratios of T210Po/T210Pb are less than 1.0 in the bottom water of some sites, such as Stns. P7-15, P7-14, and P7-07 (Figure 4), indicating that boundary scavenging results in preferential removal of 210Po over 210Pb. The resuspension of sediments may increase the concentration of particles in near-bottom water, thereby enhancing the scavenging and removal of 210Po in the benthic boundary layer, similar to what happens in the euphotic zone. Ma (2006) found that 210Po in the bottom water of the Northeast Pacific was depleted relative to 210Pb (the average ratio of T210Po/T210Pb was 0.64), which was attributed to the effect of benthic boundary scavenging.
The CDW around Prydz Bay mainly exists in a depth range of 200–2,000 m, and it upwells during southward movement due to the effect of the seabed topography (Smith et al., 1984; Pu and Dong, 2003; Pu et al., 2007). Our results show that CDW has the highest activity concentrations of 210Po and 210Pb compared with other water masses (p < 0.01, one-way ANOVA, Figure 5). The reason is worthy of in-depth study.
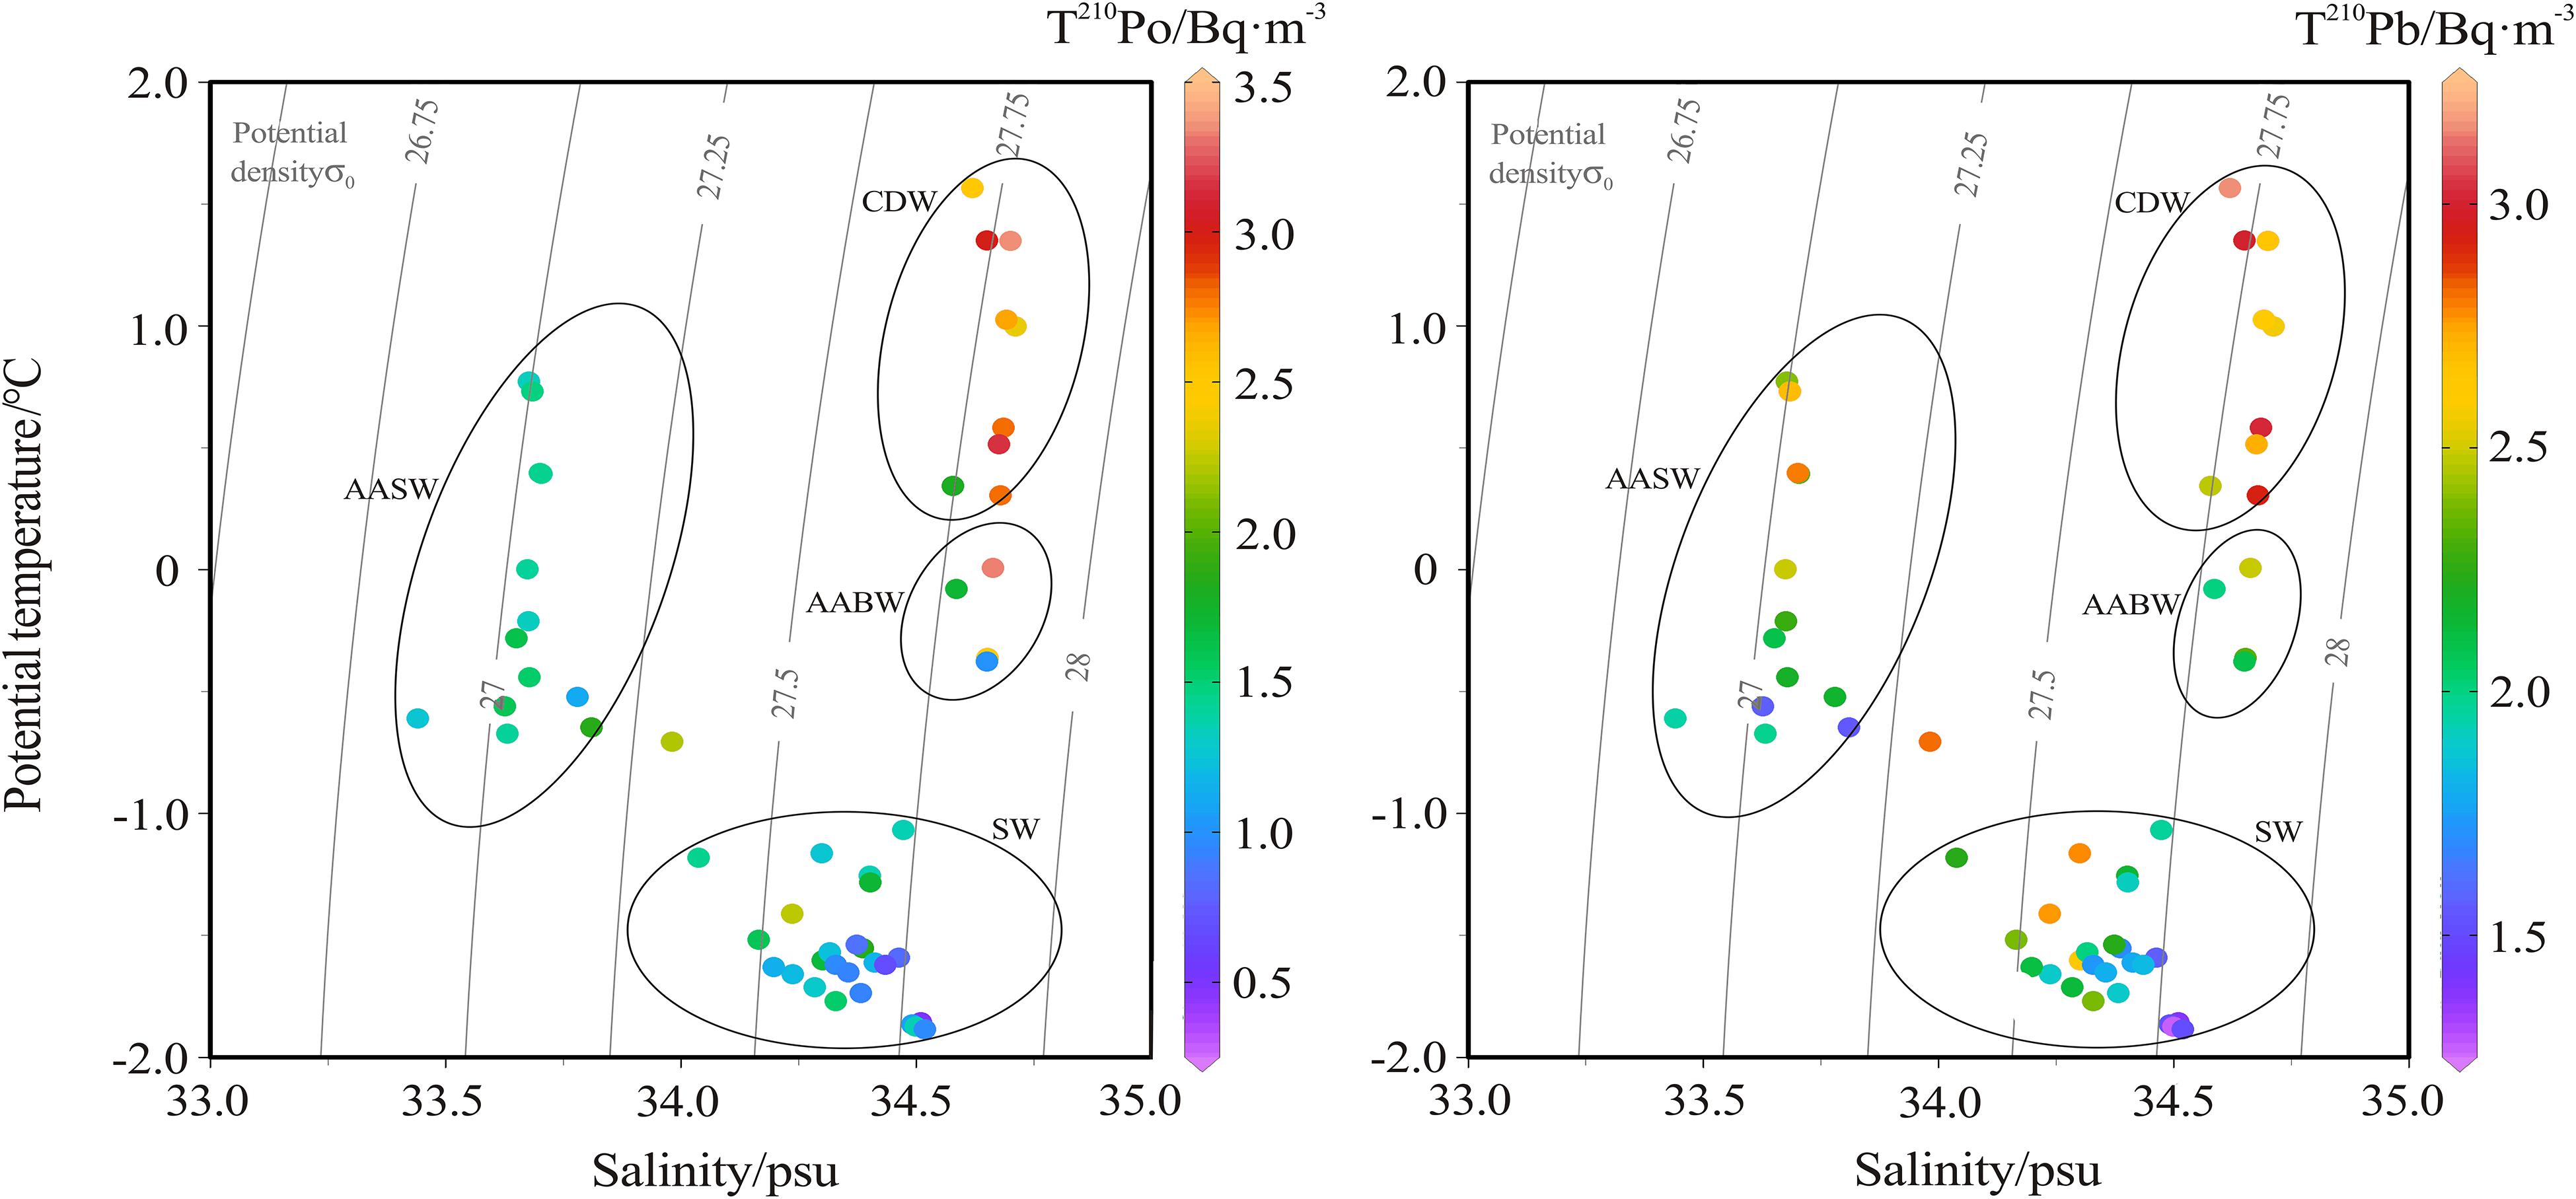
Figure 5. Scatter plots of T210Po (left panel) and T210Pb activity concentration (right panel) versus potential temperature and salinity.
The half-life of 210Pb is relatively long (22.3 years), so lateral transport is one of the important factors affecting its redistribution in seawater (Smoak et al., 1996; Moran et al., 1997). Ku and Lin (1976) measured 226Ra in deep water south of the Antarctic Convergence Zone, and found that the distribution of 226Ra is related to the latitudinal transport of the circumpolar current from the Pacific sector to the Atlantic sector. Hanfland (2002) found that the highest activity concentration of 226Ra (about 3.08 Bq⋅m–3) was stable in the ACC. 226Ra is a soluble radionuclide with a half-life of 1602 years. The movement of ACC around the Antarctic continent causes 226Ra to accumulate in the CDW and present a uniform characteristics. Therefore, the high activity concentration of 210Pb in CDW is attributed to the in situ decay of 226Ra.
However, for the 210Po in CDW, only considering the in situ production by 210Pb decay cannot explain the 210Po excess we observed (Figure 5). Due to the short half-life of 210Po (138.4 days), the horizontal transport of the water mass cannot retain the excess signal of 210Po for a long time. Therefore, the 210Po in CDW is more likely to be supplied by local source. In the process of remineralization of POM, both 210Po and 210Pb are released into the dissolved phase, but the priority of 210Po can lead to an excess of 210Po over 210Pb, because more 210Po is bound to organic matter (Shimmield et al., 1995; Nozaki et al., 1997; Wei et al., 2011). Therefore, the remineralization of particulate organic matter is most likely to be responsible for the high 210Po and its excess in the CDW. A similar situation was observed in the 100–300 m layer in the eastern North Atlantic and the intermediate layer in the northwestern North Pacific, which was attributed to the remineralization of biogenic particles or measurement errors (Bacon et al., 1976; Kawakami et al., 2008).
Our results show that there is a good positive correlation between the solid to liquid ratio of 210Po (i.e., P210Po/D210Po) and POC, while 210Pb does not (Figure 6). This confirms that particulate organic matter regulates the biogeochemical cycle of 210Po, and it is feasible to use 210Po/210Pb disequilibria to estimate POC export flux around Prydz Bay.
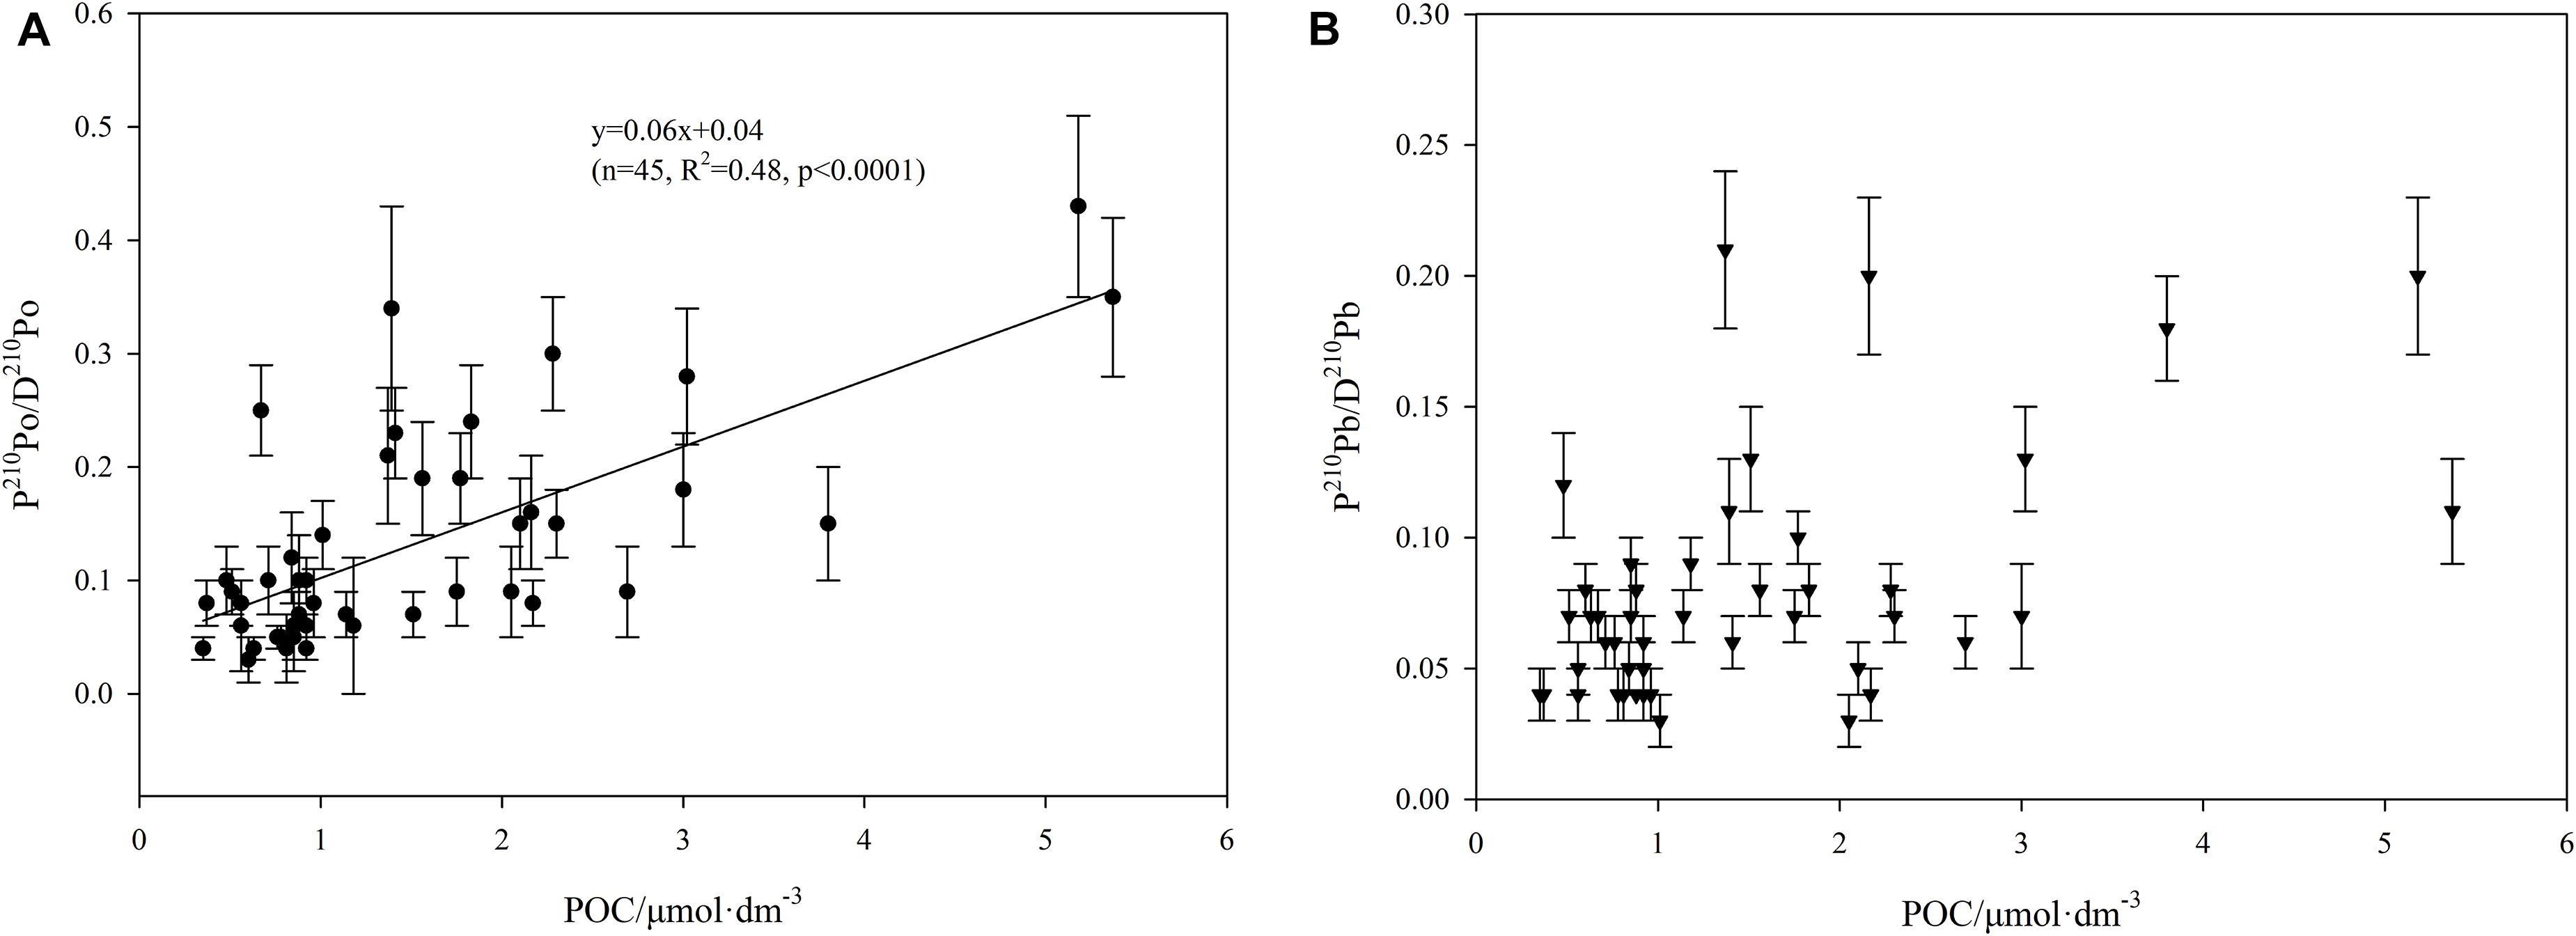
Figure 6. The relationship between P210Po/D210Po ratio, P210Pb/D210Pb ratio, and POC concentration (A: P210Po/D210Po ratio vs POC, B: P210Po/D210Po ratio vs POC).
Based on the 210Po/210Pb disequilibria, the POC export flux in the entire water column varies from 0.8–31.9 mmol⋅m–2⋅d–1, among which the variation ranges in the open ocean, the slope and the shelf are 0.8–20.2, 1.5–4.8, and 4.8–31.9 mmol⋅m–2⋅d–1, respectively (Table 2). Note that the calculated FPOC at station P7-15 is negative, which is caused by a slight excess of 210Po over 210Pb. In this case, the removal flux of 210Po calculated by the model may not represent the real situation and will not be considered in the subsequent discussion. As shown in Figure 7, the POC export flux in the upper water column in the shelf is higher than that in the slope and the open ocean (p < 0.05, one-way ANOVA). The high POC export is consistent with active biological activities in the shelf. Previous studies have shown that the Chl-a concentration and primary productivity in Prydz Bay are significantly higher than those outside the bay, and there is a positive correlation between the Chl-a and POC in the euphotic zone (Liu et al., 2002; Qiu et al., 2004; Cai et al., 2005; Han et al., 2011; Yu et al., 2011; Sun et al., 2012). The active photosynthesis in the upper water enhances the export of POC to the deep sea in Prydz Bay. In fact, the POC export flux in deep water in the shelf (such as Stn. P7-14 and P7-15) is also higher than that in the slope and the open ocean.
In addition to 210Po/210Pb disequilibria, 234Th/238U disequilibria have also been widely used to estimate the POC export flux in the euphotic zone (Murray et al., 1989, 2005; Shimmield et al., 1995; Kim and Church, 2001; Friedrich and Rutgers van der Loeff, 2002; Stewart et al., 2007; Buesseler et al., 2008; Wei et al., 2011). However, the different half-lives of 234Th and 210Po and their different affinities for particulate matter (Po >> Pb ≈ Th >> Ra > U) may cause differences in the POC export fluxes estimated by the two methods (Kharkar et al., 1976; Murray et al., 2005). It is of great significance to compare the POC export flux obtained by the two methods. Since most of the reports based on 234Th/238U disequilibria are concerned with the POC export at a depth of 100 m, here we focus on comparing the POC export at this interface. Based on 210Po/210Pb disequilibria, POC export flux at 100 m depth interface around Prydz Bay is estimated to be in a range of 4.2–9.0 mmol m–2 d–1, with an average of 6.9 mmol m–2 d–1, which is comparable to most previously reported values in Antarctica seas, whether based on 234Th/238U or 210Po/210Pb disequilibria (Table 3). Yang et al. (2009) estimated by 210Po/210Pb disequilibria that the POC export flux at a site (64.00 °S, 73.00 °E) outside Prydz Bay is 2.3 mmol m–2 d–1, which is slightly lower than this study. Note that its site is located in the northern part of our sites and is more affected by the ACC upwelling, its lower POC export is reasonable. In contrast, the reported POC export fluxes at the 100 m interface in Prydz Bay via 234Th/238U disequilibria (17.1−117.2 mmol m–2 d–1, avg. 63.5 mmol m–2 d–1, He et al., 2007) were 9.2 times of our estimates on average, even though the sampling season and locations are close. We found that the POC concentration in the He et al. (2007) (avg. 17.5 μmol/dm3) was on average 8.3 times that of this study (avg. 2.1 μmol/dm3), which resulted in a significant increase in their POC export flux. Considering that biological activities in the Antarctic seas often show large interannual and temporal variability, it cannot be ruled out that the changes in phytoplankton growth have led to such large differences.
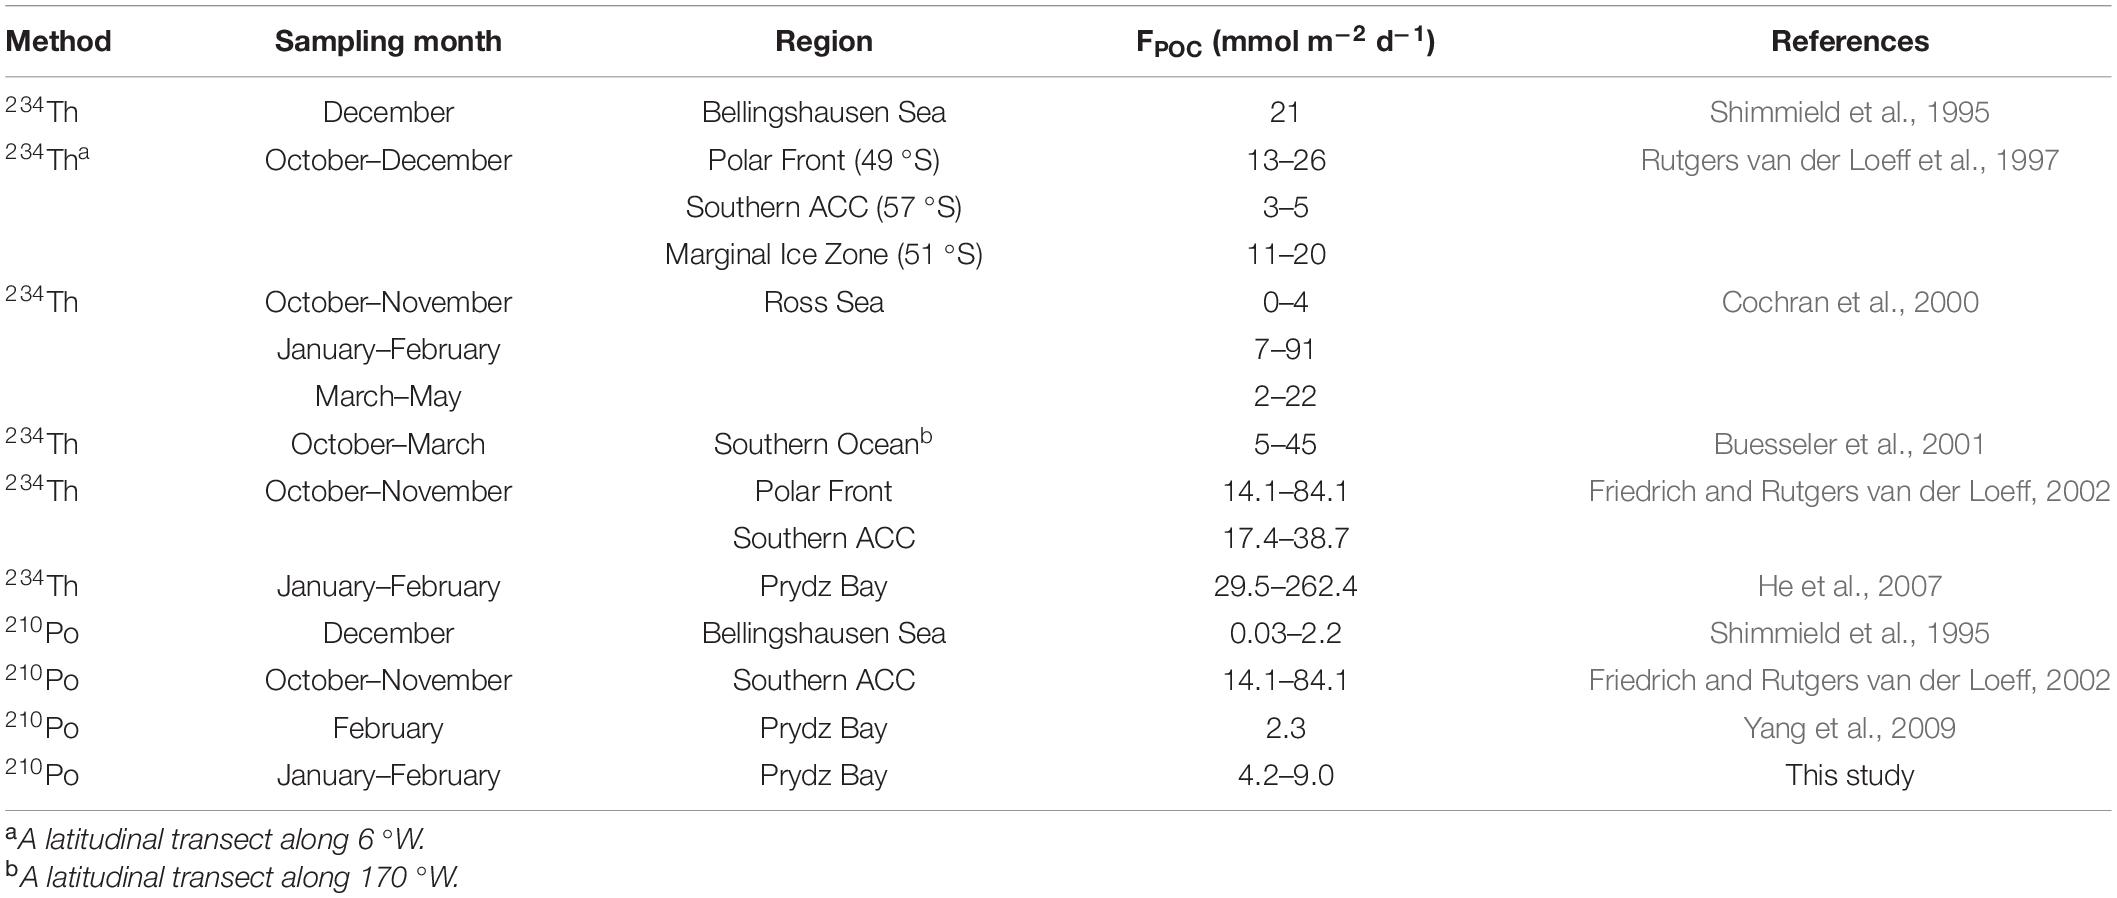
Table 3. The POC export flux at a depth of 100 m in the Southern Ocean estimated from 234Th/238U to 210Po/210Pb disequilibria.
The difference in the POC export flux obtained between the 234Th method and the 210Po method has also been found in the study of the equatorial Pacific Ocean (Murray et al., 1989), the Mediterranean Sea (Stewart et al., 2007), the Bellingshausen Sea (Shimmield et al., 1995), and the Antarctic Circumpolar Current (Friedrich and Rutgers van der Loeff, 2002; Verdeny et al., 2009). The difference in the time scale and biogeochemical behavior between 234Th and 210Po is proposed to be responsible for this. The half-life of 234Th is relatively short (24.1 days), it records the export of particulate matter in a short time scale, including occasional blooms in productive sea areas, while 210Po has a longer half-life (138.4 days), and its record is more likely to be smoothed and homogenized. In addition, in the one-dimensional steady-state model for calculating the export flux of nuclides, the physical processes such as advection, upwelling, and horizontal transport are ignored. This may have different effects on different nuclides, leading to deviations in the calculated export flux. For example, the upwelling brings deep water with a high activity concentration of 210Po or 234Th to the surface, which underestimates the POC export flux. The underestimation of the 210Po method may be greater because 210Po has a longer half-life. The difference in biogeochemical behavior between 234Th and 210Po is another possibility (Fisher et al., 1983; Murray et al., 2005). In the Bellingshausen Sea, the POC export flux estimated by the 234Th method is higher than that by the 210Po method, which is attributed to the fact that 234Th tends to be adsorbed by lithogenic materials (Shimmield et al., 1995). Friedrich and Rutgers van der Loeff (2002) found that in the ACC, 234Th is easier to bind with biogenic silica, while 210Po has a stronger affinity for POC. Murray et al. (2005) pointed out that 210Po can be absorbed into cells by organisms, while 234Th is only adsorbed on particle surface, thereby 210Po may be more conducive to tracking the export of POC. As the phytoplankton around Prydz Bay grows rapidly in summer (Liu et al., 2002; Qiu et al., 2004; Cai et al., 2005), 210Po/210Pb disequilibria is an ideal method to estimate the POC export flux in this case.
Although the values of POC export flux estimated by the two methods are different, their spatial distributions are similar around Prydz Bay, showing that the POC export flux at the 100 m interface in the shelf is higher than those in the slope and open ocean (Figure 7). It is worth noting that He et al. (2007) observed an extremely high POC export flux at 50 m in the slope, which was attributed to the rising CDW transporting nutrients to the surface, stimulating the primary productivity and the removal of 234Th. However, judging from our 210Po/210Pb results, the upwelling of CDW may lead to an underestimation of 210Po export flux due to the impact of organic matter remineralization. In addition, we noticed that the POC/P210Po ratios in the slope are closer to those in the shelf. Therefore, horizontal transport across the shelf may partially compensate for the underestimated 210Po export’s impact on the POC export flux.
In this study, dissolved and particulate 210Po and 210Pb were measured in the entire water column around Prydz Bay. Our results show that the D210Po and D210Pb in the shelf are lower than those in the slope and the open ocean, indicating an enhanced particle scavenging in the shelf. Among the various water masses, the CDW has the highest activity concentrations of T210Pb and T210Po, reflecting the effects of 210Pb decay and POM remineralization. Our results show that there is a good positive correlation between the solid-liquid ratio of 210Po and POC, while 210Pb does not. This indicates that particulate organic matter regulates the biogeochemical cycle of 210Po, and 210Po/210Pb disequilibria is a reliable method for estimating the POC export flux around Prydz Bay. The estimated POC export flux based on 210Po/210Pb disequilibria ranges from 0.8 to 31.9 mmol m–2 d–1. The higher POC export at the 100 m interface in the slope is attributed to the horizontal transport across the shelf. Although the difference in biogeochemical behavior and time scale between 210Po and 234Th may affect the estimated POC export flux, the spatial variation of POC export flux estimated by these two methods is consistent, which shows that 210Po/210Pb disequilibria is a reliable method for POC export.
The original contributions presented in the study are included in the article/supplementary material, further inquiries can be directed to the corresponding author.
HH and MC designed the study and wrote the manuscript. XL sampled onboard and measured 210Po. CR determined POC. RJ sampled and revised the manuscript. YQ and MZ contributed the experimental tools. All authors contributed to the article and approved the submitted version.
This work was supported by Impact and Response of Antarctic Seas to Climate Change (IRASCC 01-01-02C and 02-01-01) and funded by Ministry of Natural Resources of the People’s Republic of China and Chinese Arctic and Antarctic Administration, National Natural Science Foundation of China (41721005), and Program funded by China Ocean Mineral Resources R&D Association (No. DY135-13-E2-03).
The authors declare that the research was conducted in the absence of any commercial or financial relationships that could be construed as a potential conflict of interest.
As with most endeavors, we owe thank to a number of people: Jianming Pan and Zhengbing Han for providing nutrient data, the captains and crews of R/V XUELONG for their assistance in sampling, and colleagues in the SCSEMC for supporting efforts.
Arrigo, K. R., Van Dijken, G. L., and Bushinsky, S. (2008). Primary production in the Southern Ocean, 1997–2006. J. Geophys. Res. 113:C08004. doi: 10.1029/2007JC004551
Bacon, M. P., Spencer, D. W., and Brewer, P. G. (1976). 210Pb/226Ra and 210Po/210Pb disequilibria in seawater and suspended particulate matter. Earth Planet. Sci. Lett. 32, 277–296. doi: 10.1016/0012-821X(76)90068-6
Buesseler, K. O., Bacon, M. P., Cochran, J. K., and Livingston, H. D. (1992). Carbon and nitrogen export during the JGOFS North Atlantic Bloom experiment estimated from 234Th: 238U disequilibria. Deep Sea Res. I 39, 1115–1137. doi: 10.1016/0198-0149(92)90060-7
Buesseler, K. O., Ball, L., Andrews, J., Cochran, J. K., Hirschberg, D. J., Bacon, M. P., et al. (2001). Upper ocean export of particulate organic carbon and biogenic silica in the Southern Ocean along 170°W. Deep Sea Res. II 48, 4275–4297. doi: 10.1016/S0967-0645(01)00089-3
Buesseler, K. O., Benitez-Nelson, C. R., Moran, S. B., Burd, A., Charette, M., Cochran, J. K., et al. (2006). An assessment of particulate organic carbon to thorium-234 ratios in the ocean and their impact on the application of 234Th as a POC flux proxy. Mar. Chem. 100, 213–233. doi: 10.1016/j.marchem.2005.10.013
Buesseler, K. O., Lamborg, C., Cai, P., Escoube, R., Johnson, R., Pike, S., et al. (2008). Particle fluxes associated with mesoscale eddies in the Sargasso Sea. Deep Sea Res. II 55, 1426–1444. doi: 10.1016/j.dsr2.2008.02.007
Cai, Y. M., Ning, X. R., Zhu, G. H., and Shi, J. X. (2005). Size fractionated biomass and productivity of phytoplankton and new production in the Prydz Bay and the adjacent Indian sector of the Southern Ocean during the austral summer of 1998/1999. Acta Oceanol. Sin. 27, 135–147. doi: 10.1029/2002JC001507
Chen, M., Ma, Q., Guo, L. D., Qiu, Y. S., Li, Y. P., and Yang, W. F. (2012). Importance of lateral transport processes to 210Pb budget in the eastern Chukchi Sea during summer 2003. Deep Sea Res. II 81, 53–62. doi: 10.1016/j.dsr2.2012.03.011
Cherrier, J., Burnett, W. C., and LaRock, P. A. (1995). Uptake of polonium and sulfur by bacteria. Geomicrobiol. J. 13, 103–115. doi: 10.1080/01490459509378009
Chung, Y. (1981). 210Pb and 226Ra distributions in the circumpolar waters. Earth Planet. Sci. Lett. 55, 205–216. doi: 10.1016/0012-821X(81)90100-X
Chung, Y., and Applequist, M. D. (1980). 226Ra and 210Pb in the Weddell Sea. Earth Planet. Sci. Lett. 55, 401–410. doi: 10.1016/0012-821X(80)90082-5
Chung, Y., and Finkel, R. (1988). 210Po in the western Indian Ocean: distributions, disequilibria and partitioning between the dissolved and particulate phases. Earth Planet. Sci. Lett. 88, 232–240. doi: 10.1016/0012-821X(88)90080-5
Chung, Y., and Wu, T. (2005). Large 210Po deficiency in the northern South China Sea. Cont. Shelf Res. 25, 1209–1224. doi: 10.1016/j.csr.2004.12.016
Cochran, J. K. (1992). “The oceanic chemistry of the uranium- and thorium-series nuclides,” in Uranium-Series Disequilibrium–Applications to Earth, Marine, and Environmental Sciences, 2nd Edn, eds M. Ivanovich and R. S. Harmon (Oxford: Clarendon Press), 334–395.
Cochran, J. K., Bacon, M. P., Krishnaswami, S., and Turekian, K. K. (1983). 210Po and 210Pb distributions in the central and eastern Indian Ocean. Earth Planet. Sci. Lett. 65, 433–452. doi: 10.1016/0012-821X(83)90180-2
Cochran, J. K., Buesseler, K. O., Bacon, M. P., Wang, H. W., Hirschberg, D. J., Ball, L., et al. (2000). Short-lived thorium isotopes (234Th, 228Th) as indicators of POC export and particle cycling in the Ross Sea, Southern Ocean. Deep Sea Res. II 47, 3451–3490. doi: 10.1016/S0967-0645(00)00075-8
Fisher, N. S., Burns, K. A., and Heyraud, M. (1983). Accumulation and cellular distribution of 241Am, 210Po and 210Pb in two marine algae. Mar. Ecol. Prog. Ser. 11, 233–237. doi: 10.3354/meps011233
Friedrich, J., and Rutgers van der Loeff, M. M. (2002). A two-tracer (210Po-234Th) approach to distinguish organic carbon and biogenic silica export flux in the Antarctic Circumpolar Current. Deep Sea Res. I 49, 101–120. doi: 10.1016/S0967-0637(01)00045-0
Grasshoff, K., Kremling, K., and Ehrhardt, M. (1983). Methods of Seawater Analysis. Weinheim: Verlag Chemie.
Han, Z. B., Hu, C. Y., Xue, B., Pan, J. M., and Zhang, H. S. (2011). Particulate organic carbon in the surface water of South Ocean and Prydz Bay during the austral summer of 2007/2008 and 2008/2009. Chin. J. Polar Res. 23, 11–18. doi: 10.1007/s11589-011-0776-4
Hanfland, C. (2002). Radium-226 and Radium-228 in the Atlantic sector of the Southern Ocean. Polar Mar. Res. 431:135.
He, J. H., Ma, H., Chen, L. Q., Xiang, B. Q., Zeng, X. Z., Yin, M. D., et al. (2007). The estimates of the particulate organic carbon export fluxes in Prydz Bay, Southern Ocean using 234Th/238U disequilibria. Acta Oceanol. Sin. 29, 69–76. doi: 10.3321/j.issn:0253-4193.2007.04.008
Hong, G. H., Baskaran, M., Church, T. M., and Conte, M. (2013). Scavenging, cycling and removal fluxes of 210Po and 210Pb at the Bermuda time-series study site. Deep Sea Res. II 93, 108–118. doi: 10.1016/j.dsr2.2013.01.005
Kaste, J. M., and Baskaran, M. (2012). “Meteoric 7Be and 10Be as process tracers in the environment,” in Handbook of Environmental Isotope Geochemistry, ed. M. Baskaran (Berlin: Springer-Verlag), doi: 10.1007/978-3-642-10637-8_5
Kawakami, H., Yang, Y., and Kusakabe, M. (2008). Distributions of 210Po and 210Pb radioactivity in the intermediate layer of the northwestern North Pacific. J. Radioanal. Nucl. Chem. 279, 561–566. doi: 10.1007/s10967-008-7324-2
Kharkar, D. P., Thomson, J., Turekian, K. K., and Forster, W. O. (1976). Uranium and thorium decay series nuclides in plankton from the Caribbean. Limnol. Oceanogr. 21, 294–299. doi: 10.4319/lo.1976.21.2.0294
Kim, G., and Church, T. M. (2001). Seasonal biogeochemical fluxes of 234Th and 210Po in the upper Sargasso Sea: influence from atmospheric iron deposition. Global Biogeochem. Cycles. 15, 651–661. doi: 10.1029/2000GB001313
Ku, T. L., and Lin, M. C. (1976). 226Ra distribution in the Antarctic Ocean. Earth Planet. Sci. Lett. 32, 236–248. doi: 10.1016/0012-821X(76)90064-9
Liu, Z. L., Cai, Y. M., Chen, Z. Y., Liu, C. G., Zhu, G. H., and Wang, X. G. (2002). The distribution feature of chlorophyll a and primary productivity in Prydz Bay and its north sea area during the austral summer of 1998/1999. Chin. J. Polar Res. 14, 12–21.
Ma, Q. (2006). Particle Transport and Export in the North Pacific and the Western Arctic Ocean as Revealed by Radionuclides. Ph.D thesis. Xiamen: Xiamen University.
Masqué, P., Sanchez-Cabeza, J. A., Bruach, J. M., Palacios, E., and Canals, M. (2002). Balance and residence times of 210Pb and 210Po in surface waters of the northwestern Mediterranean Sea. Cont. Shelf Res. 22, 2127–2146. doi: 10.1016/S0278-4343(02)00074-2
Moore, R. M., and Smith, J. N. (1986). Disequilibria between 226Ra, 210Pb and 210Po in the Arctic Ocean and the implications for chemical modification of the Pacific water inflow. Earth Planet. Sci. Lett. 77, 285–292. doi: 10.1016/0012-821X(86)90140-8
Moran, S. B., Charette, M. A., Hoff, J. A., Edwards, R. L., and Landing, W. M. (1997). Distribution of 230Th in the Labrador Sea and its relation to ventilation. Earth Planet. Sci. Lett. 150, 151–160. doi: 10.1016/S0012-821X(97)00081-2
Murray, J. W., Downs, J. N., Strom, S., Wei, C. L., and Jannasch, H. W. (1989). Nutrient assimilation, export production and 234Th scavenging in the eastern equatorial Pacific. Deep Sea Res. A 36, 1471–1489. doi: 10.1016/0198-0149(89)90052-6
Murray, J. W., Paul, B., Dunne, J. P., and Thomas, C. (2005). 234Th, 210Pb, 210Po and stable Pb in the central equatorial Pacific: tracers for particle cycling. Deep Sea Res. I 52, 2109–2139. doi: 10.1016/j.dsr.2005.06.016
Niedermiller, J., and Baskaran, M. (2019). Comparison of the scavenging intensity, remineralization and residence time of 210Po and 210Pb at key zones (biotic, sediment-water and hydrothermal) along the East Pacific GEOTRACES transect. J. Environ. Radioactiv. 198, 165–188. doi: 10.1016/j.jenvrad.2018.12.016
Nozaki, Y., Ikuta, N., and Yashima, M. (1990). Unusually large 210Po deficiencies relative to 210Pb in the Kuroshio Current of the East China and Philippine Seas. J. Geophys. Res. 95, 5321–5329. doi: 10.1029/JC095iC04p05321
Nozaki, Y., Thomson, J., and Turekian, K. K. (1976). The distribution of 210Pb and 210Po in the surface waters of the Pacific Ocean. Earth Planet. Sci. Lett. 32, 304–312. doi: 10.1016/0012-821X(76)90070-4
Nozaki, Y., Zhang, J., and Takeda, A. (1997). 210Pb and 210Po in the equatorial Pacific and the Bering Sea: the effects of biological productivity and boundary scavenging. Deep Sea Res. II 44, 2203–2220. doi: 10.1016/S0967-0645(97)00024-6
Pu, S. Z., and Dong, Z. Q. (2003). Progress in physical oceanographic studies of Prydz Bay and its adjacent oceanic area. Chin. J. Polar Res. 15, 53–64. doi: 10.1016/S0955-2219(02)00073-0
Pu, S. Z., Dong, Z. Q., Hu, X. M., Yu, F., and Zhao, X. (2002a). Variability of the continental water boundary near the Prydz Bay. Mar. Sci. Bull. 4, 1–10.
Pu, S. Z., Dong, Z. Q., Yu, W. D., Lu, Y., and Xiang, B. Q. (2007). Features and spatial distributions of circumpolar deep water in the Southern Indian Ocean and effect of Antarctic Circumpolar Current. Adv. Mar. Sci. 25, 1–8. doi: 10.3969/j.issn.1671-6647.2007.01.001
Pu, S. Z., Hu, X. M., Dong, Z. Q., Yu, F., and Chen, X. R. (2002b). Features of circumpolar deep water, Antarctic Bottom Water and their movement near the Prydz Bay. Acta Oceanol. Sin. 24, 1–8. doi: 10.3321/j.issn:0253-4193.2002.03.001
Qiu, Y. S., Huang, Y. P., Liu, G. S., and Chen, M. (2004). Spatial and temporal variations of primary productivity in Prydz Bay and its Adjacent Sea Area, Antarctica. J. Xiamen Uni. (Nat. Sci.) 43, 676–681.
Rama, Koide, M., and Goldberg, E. D. (1961). Lead-210 in natural waters. Science 134, 98–99. doi: 10.1126/science.134.3472.98
Ren, C. Y. (2015). Stable Carbon and Nitrogen Isotopic Composition in Particulate organic Matter in the Prydz Bay and the Antarctic Peninsula. PhD thesis. Xiamen: Xiamen University.
Rigaud, S., Stewart, G., Baskaran, M., Marsan, D., and Church, T. (2014). 210Po and 210Pb distribution, dissolved-particulate exchange rates, and particulate export along the North Atlantic US GEOTRACES GA03 section. Deep Sea Res. II 116, 60–78. doi: 10.1016/j.dsr2.2014.11.003
Rutgers van der Loeff, M. M., Friedrich, J., and Bathmann, U. V. (1997). Carbon export during the Spring Bloom at the Antarctic Polar Front, determined with the natural tracer 234Th. Deep Sea Res. II 44, 457–478. doi: 10.1016/S0967-0645(96)00067-7
Shimmield, G. B., Ritchie, G. D., and Fileman, T. W. (1995). The impact of marginal ice zone processes on the distribution of 210Pb, 210Po and 234Th and implications for new production in the Bellingshausen Sea, Antarctica. Deep Sea Res. II 42, 1313–1335. doi: 10.1016/0967-0645(95)00071-W
Smith, N. R., Dong, Z. Q., Kerry, K. R., and Wright, S. (1984). Water masses and circulation in the region of Prydz Bay, Antarctica. Deep Sea Res. I 31, 1121–1147. doi: 10.1016/0198-0149(84)90016-5
Smoak, J. M., Demaster, D. J., Kuehl, S. A., Pope, R. H., and Mckee, B. A. (1996). The behavior of particle-reactive tracers in a high turbidity environment: 234Th and 210Pb on the Amazon continental shelf. Geochim. Cosmochim. Acta. 60, 2123–2137. doi: 10.1016/0016-7037(96)00092-0
Somayajulu, B. L. K., and Craig, H. (1976). Particulate and soluble 210Pb activities in the deep sea. Earth Planet. Sci. Lett. 32, 268–276. doi: 10.1016/0012-821X(76)90067-4
Stewart, G., Cochran, J. K., Miquel, J. C., Masqué, P., Szlosek, J., Rodriguez y Baena, A. M., et al. (2007). Comparing POC export from 234Th/238U and 210Po/210Pb disequilibria with estimates from sediment traps in the northwest Mediterranean. Deep Sea Res. I 54, 1549–1570. doi: 10.1016/j.dsr.2007.06.005
Stewart, G. M., and Fisher, N. S. (2003). Experimental studies on the accumulation of polonium-210 by marine phytoplankton. Limnol. Oceanogr. 48, 1193–1201. doi: 10.4319/lo.2003.48.3.1193
Stewart, G. M., Fowler, S. W., Teyssié, J. L., Cotret, O., Cochran, J. K., and Fisher, N. S. (2005). Contrasting transfer of polonium-210 and lead-210 across three trophic levels in marine plankton. Mar. Ecol. Prog. Ser. 290, 27–33. doi: 10.3354/meps290027
Sun, W. P., Hu, C. Y., Han, Z. B., Pan, J. M., and Weng, H. X. (2012). Distribution of nutrients and Chl a in Prydz Bay during the austral summer of 2011. Chin. J. Polar Res. 24, 178–186. doi: 10.3724/SP.J.1084.2012.00178
Takahashi, T., Sutherland, S. C., Sweeney, C., Poisson, A., Metzl, N., Tibrook, B., et al. (2002). Global sea-air CO2 flux based on climatological surface ocean pCO2, and seasonal biological and temperature effects. Deep Sea Res. II 49, 1601–1622.
Tang, Y., Lemaitre, N., Castrillejo, M., Roca-Martí, M., and Masqué, P. (2019). The export flux of particulate organic carbon derived from 210Po/210Pb disequilibria along the North Atlantic GEOTRACES GA01 transect: GEOVIDE cruise. Biogeosciences 16, 309–327. doi: 10.5194/bg-16-309-2019
Thomson, J., and Turekian, K. K. (1976). 210Po and 210Pb distributions in ocean water profiles from the Eastern South Pacific. Earth Planet. Sci. Lett. 32, 297–303. doi: 10.1016/0012-821X(76)90069-8
Turekian, K. K., and Nozaki, Y. (1980). “210Po and 210Pb in the Eastern South Pacific: the role of upwelling on their distributions in the water column,” in Isotope Marine Chemistry, eds E. D. Goldberg, Y. Horibe, and K. Saruhashi (Tokyo: Uchida Rokakuho Publ Co), 157–164.
Verdeny, E., Masqué, P., Garcia-Orellana, J., Hanfland, C., Cochran, J. K., and Stewart, G. M. (2009). POC export from ocean surface waters by means of 234Th/238U and 210Po/210Pb disequilibria: a review of the use of two radiotracer pairs. Deep Sea Res. II 56, 1502–1518. doi: 10.1016/j.dsr2.2008.12.018
Wei, C. L., Lin, S. Y., Sheu, D. D. D., Chou, W. C., Yi, M. C., Santschi, P. H., et al. (2011). Particle-reactive radionuclides (234Th, 210Pb, 210Po) as tracers for the estimation of export production in the South China Sea. Biogeosciences 8, 3793–3808. doi: 10.5194/bg-8-3793-2011
Yang, W. F. (2005). Marine Biogeochemistry of 210Po and 210Pb and Their Implications Regarding the Cycling and Export of Particles. PhD thesis. Xiamen: Xiamen University.
Yang, W. F., Huang, Y. P., Chen, M., Qiu, Y. S., Peng, A. G., and Zhang, L. (2009). Export and remineralization of POM in the Southern Ocean and the South China Sea estimated from 210Po/210Pb disequilibria. Chin. Sci. Bull. 54, 2118–2123. doi: 10.1007/s11434-009-0043-4
Yang, W. F., Huang, Y. P., Chen, M., Zhang, L., Li, H. B., Liu, G. S., et al. (2006). Disequilibria between 210Po and 210Pb in surface waters of the southern South China Sea and their implications. Sci. China Ser. D. 49, 103–112. doi: 10.1007/s11430-004-5233-y
Keywords: 210Po, 210Pb, POC export flux, Prydz Bay, biogeochemical behavior
Citation: Hu H, Liu X, Ren C, Jia R, Qiu Y, Zheng M and Chen M (2021) 210Po/210Pb Disequilibria and Its Estimate of Particulate Organic Carbon Export Around Prydz Bay, Antarctica. Front. Mar. Sci. 8:701014. doi: 10.3389/fmars.2021.701014
Received: 27 April 2021; Accepted: 22 June 2021;
Published: 15 July 2021.
Edited by:
Laodong Guo, University of Wisconsin–Milwaukee, United StatesReviewed by:
Ravi Bhushan, Physical Research Laboratory, IndiaCopyright © 2021 Hu, Liu, Ren, Jia, Qiu, Zheng and Chen. This is an open-access article distributed under the terms of the Creative Commons Attribution License (CC BY). The use, distribution or reproduction in other forums is permitted, provided the original author(s) and the copyright owner(s) are credited and that the original publication in this journal is cited, in accordance with accepted academic practice. No use, distribution or reproduction is permitted which does not comply with these terms.
*Correspondence: Min Chen, bWNoZW5AeG11LmVkdS5jbg==
Disclaimer: All claims expressed in this article are solely those of the authors and do not necessarily represent those of their affiliated organizations, or those of the publisher, the editors and the reviewers. Any product that may be evaluated in this article or claim that may be made by its manufacturer is not guaranteed or endorsed by the publisher.
Research integrity at Frontiers

Learn more about the work of our research integrity team to safeguard the quality of each article we publish.