 Michael A. Spence
 Paul J. Dolder
 Richard Nash
 Robert B. Thorpe
- Centre for Fisheries Ecology and Aquaculture Science, CEFAS Laboratory, Lowestoft, United Kingdom
Fish communities are multispecies assemblages, so ideally multispecies models should be used directly for assessing this resource. However, progress in this direction has been slow, partly because these models are often more complex and take longer to fit, rendering them too slow to demonstrate near-real-time utility, and thus creating a perception that they are opaque to stakeholders. In this study we implemented a multispecies assessment for the Irish Sea, fitting a model of eight key stocks directly to catch and survey data. Two novel features of our approach allowed the multispecies model to be fitted within a few hours. Firstly, by using size-based theory and life-history invariants to specify many of the required properties of stocks, we reduced the number of general parameters that needed to be fitted directly to a more manageable 25. Secondly, by using state-of-the-art fitting methods, we found acceptable solutions quickly enough to provide assessments within the timescale of an advisory meeting. The outcomes were compared with the standard single species assessments of the same eight species. Model fits were generally good for either catch or at least one of the surveys, but not for all data sources at the same time, illustrating the challenges of fitting multiple stocks to different data sources simultaneously. Estimates of SSB and F agreed qualitatively with the assessments for most stocks with the exception of whiting. Estimates of natural mortality showed modest year to year variability, suggesting that single species assessments may be appropriate for short term tactical management. This method shows great promise for making multispecies assessments as a complement to existing assessments because of the rapid turnaround time and ability to respond at meetings to the requests of stakeholders. In addition, because these models avoid our current dependence on existing single species models they can be used to provide boundary conditions in natural mortality for standard assessment models and check for internal consistency in the assessment process. Furthermore, they are easily accessible because they are based upon freely available code.
Introduction
The incorporation of ecosystem information into operational fisheries management has been mandated at international level (FAO, 2008) and incorporated into legislative frameworks in Europe (EU, 2008, 2013) and the United States (NOAA, 2016). However, though some examples incorporate limited ecosystem interactions (Marshall et al., 2019), most management is based upon single species stock assessments (Skern-Mauritzen et al., 2016). This despite it being widely acknowledged that fish populations, along with other taxa in the ecosystem, interact through predation and competition for resource, which means that natural mortality is not in general constant (Daan, 1987), but instead depends upon the abundance of all populations. As a step towards an ecosystem approach, the management of exploited fish populations should use multispecies assessment alongside the existing single species modeling (see e.g., Howell et al., 2021). Such an approach can take account of interactions in the foodweb and between fleets, and assist with management questions that involve trade-offs between fleets or stocks. However, incorporation of multispecies models into our understanding and prediction of the consequences of exploitation has been slow (Hollowed et al., 2001; Plaganyi et al., 2012; Hyder et al., 2015). There are several reasons for this, including the difficulty of fitting multispecies models directly to survey data (both speed of fitting process and quality of the fit), the perceived complexity of such models (Plagányi, 2007), structural uncertainty associated with charactering the important ecosystem components and processes that must be explicitly represented, and familiarity with single species methods, including the possibility that they are “good enough” for management (Marshak et al., 2017). Within the European Union (EU), multispecies models are used primarily to provide natural mortality boundary conditions for single-species assessments [at present, specifically for the North Sea (ICES, 2019a) and Baltic Sea (ICES, 2020a) using the Stochastic Multispecies Model (SMS: Lewy and Vinther, 2004)]; ICES multispecies advice supports ecosystem overviews [e.g., ICES Greater North Sea Ecosystem (ICES, 2020b) and Baltic Ecosystem (ICES, 2020c)], but is in general not used operationally.
The Irish Sea is no exception, it is a complex multispecies system which supports a mixed fishery. The importance of these multispecies interactions has long been recognized (ICES, 1978). By the 1980s there was a recognition that catches on cod Gadus morhua would affect the catches of the burrowing crustacean Nephrops Nephrops norvegicus through changes in predation pressure by cod (Brander, 1980, 2018). Further, Brander and Bennett (1986) noted that the revenues from the two species were shared by the same fleet and that increased Nephrops catches would increase overall revenues. Therefore, a clear linkage between cod and Nephrops through the foodweb and via technical interactions within the fisheries has been demonstrated for some time. To address these issues, ecosystem considerations have been incorporated into the advised exploitation strategies for the Irish Sea. This was done by taking outputs of the single species process as given, and where these presented a Maximum Sustainable Yield (MSY) range, to choose a reference point within this range based on wider foodweb considerations (ICES, 2019b). In this way aspects of multispecies management could be incorporated into the advice framework, without invalidating the existing assessments (see Howell et al., 2021 for a detailed “Discussion”).
A key part of this initiative involved multispecies and ecosystem modelers and stock assessors taking part in the same advisory meetings so that the outputs of multispecies models could influence the advisory process directly even though only the single species models were used to set quotas (Howell et al., 2021). As part of this initiative, we used the LeMans model framework (Hall et al., 2006) as adapted for the North Sea (Rochet et al., 2011; Thorpe et al., 2015, 2016, 2017; Thorpe and De Oliveira, 2019) and recently implemented as an r-package (Spence et al., 2020) to undertake a multi-species assessment for key Irish Sea stocks and their associated fisheries. LeMans is a length-structured multispecies framework which partitions the fish community by species and length. It is similar in structure to a multispecies stock assessment, but structured by length rather than age as predation is length rather than age dependent. It is a suitable choice for the reasons provided in the Section “Materials and Methods.” Our aim was to address some key barriers to the use of multispecies models in direct stock assessment, namely (a) speed and adequacy of model fit, and (b) perceived complexity of model framework and opacity to stakeholders. These barriers are related because if the fitting is slow and has to be done in advance of an advisory meeting, it becomes invisible to stakeholders and reduces their confidence in the outputs.
The process of model fitting is such a hurdle to acceptance of multispecies models because (a) the model may be very sensitive to assumptions made about how much stocks can predate on each other [whether from stomach sampling data (Trijoulet et al., 2019) or expert judgment (Thorpe et al., 2015)], (b) the requirement of fitting multiple stocks to data simultaneously, and (c) the need to limit the number of parameters to a greater extent than with single species models just to make the model tractable. With each additional stock to fit, the average correspondence of any one stock with data is likely to deteriorate, potentially straining the credibility of stakeholders and resulting in the outputs not being used for advice.
In this study we have limited the number of important foodweb interactions and the number of parameters by focusing on a small number of key stocks (8 commercially important stocks), and further restricted the number of tuning parameters for each stock through the use of life history invariants and size-structuring within the foodweb (Spence et al., 2020). We also fitted the model in an efficient manner using novel methods including a form of history matching (Vernon et al., 2014; Spence et al., 2021) to cut down the plausible parameter space to a manageable level. By doing this we could respond to stakeholder feedback overnight, and hence build confidence in the model through two-way dialog. As a result of feedback received in the meeting we modified the length bins and representation of natural mortality to reflect concerns that the initial parameterizations were not generating reasonable estimates of mortality at age 1.
Materials and Methods
LeMans Model
LeMans (Length-based Multispecies analysis by numerical simulation) is a length-structured fish community model, with the fish community being represented in terms of both species and length (Hall et al., 2006). By representing many processes, including fishing, natural mortality, and predation as functions of length, it is possible to reproduce many aspects of the community dynamics (including the tendency of diet to change with increasing predator size) with a relatively small number of parameters, and modest requirement for data in model set up. This makes the framework particularly suitable for use in data-limited fisheries, and reduces the time required to fit the model, so that it potentially becomes possible to deploy in an advisory setting.
LeMans is well suited for use whenever there is a need for multispecies or mixed-fisheries analysis but where the management questions are internal to the fish-community and do not require the use of more complicated models, such as Atlantis (Fulton et al., 2011). The model has been used to assess the impact of mixed-fisheries (Thorpe et al., 2016), multispecies reference points (Thorpe et al., 2017; Thorpe, 2019), evaluate the effect of harvest control rules (Thorpe and De Oliveira, 2019), and as part of a multi-model ensemble along with other multispecies models (Spence et al., 2018). LeMans models fish length because (a) it is generally easier to measure than weight in the field (Connor et al., 2017), and (b) fisheries selectivity is normally characterized in terms of length (Walker et al., 2017) and is thus more straightforward to relate to the parameterization of mixed-fisheries, although the mathematics of weight-structured models are more elegant (Andersen, 2020).
The LeMans model is based on a discrete time and length where there are ns stock and nl length classes with the lj being the lower length of the jth length class and lj++1 being the upper limit. The mid point of the jth length class is:
for j = 1…nl.
We assume that length and weight are related by a simple power law, and the length-weight equation is defined for stock i in length class j as:
The LeMans model assumes that fish grow continuously throughout their lives at a rate independent of the density of available food (food-independent growth), with the length of stock i at age t being:
where L∞,i is the asymptotic length (cm) of the ith stock, ki is the von Bertalanffy growth rate and t0,i is the theoretical age at which the ith stock would be at length 0.
The amount of time t that stock i spends in length class j is defined as:
Assuming that individuals are evenly distributed across the length class, the proportion of individuals of stock i that leave length class j due to growth over time δt is:
The amount that a fish in stock i in length class j will grow according to the von Bertalanffy growth curve in a time step, δt, is:
This is then converted into weight increments (eq. 7) and then divided by the growth efficiency (eq. 8).
where W∞,i is the weight of a fish in stock i of length L∞,i, π is the rate at which the growth efficiency decays and g0 is the growth efficiency of a fish of length zero. The amount of food required for the fish to grow according von Bertalanffy growth curve in a time step is then:
For stock i in length class j, the proportion of individuals that are mature is defined as:
where is the length at which 50% of individuals are mature and κi is the rate of change from immaturity to maturity.
The number of recruits of stock i in is assumed to be deterministic (contrasting with Thorpe et al., 2017; Thorpe and De Oliveira, 2019 which have stochastic recruitment) and follow a Beverton-Holt relationship with SSB:
where the species-specific parameters αi and βi are the density-dependent and density-independent parameters, respectively (Ogle, 2016) and Si is the SSB in kilo-tons, i.e.
where Nj,i is the number of individuals of stock i in length class j. This is different from the hockey stick relation assumed in Thorpe et al. (2015, 2016, 2017), Thorpe and De Oliveira (2019), and is adopted here because of the need for continuous functional form when using Template Model Builder (TMB) for fitting (Kristensen et al., 2016), although it may also be more realistic.
There are three types of mortality in the LeMans model: background mortality (M1), predation mortality (M2) and fishing mortality (F). In contrast with Hall et al. (2006); Thorpe et al. (2015), background mortality (M1) is a function of weight according to eq. 13, so that it initially declines sharply, reaches a minimum of just over 0.03 and then increases again as the weight tends to the maximum possible to reflect the impact of senescence on large (old) individuals (Eq. 13). This change was made because the initial model fit generated unrealistically high natural mortality at very small and very large sizes as determined by feedback within the advisory meeting.
The stocks in the model interact with each other via predator-prey interactions. The prey weight preference wp for a predator of weight w is defined as:
where μp is the preferred predator-prey mass ratio and σp is the width of the weight preference function. In this model μp = −2.25 and σp=0.5 (c.f. Thorpe et al., 2015, Supplementary Material).
The suitability of prey of weight wp and stock j for a predator of weight w of stock i is defined as:
where τi,j is a value between 0 and 1 that represents the vulnerability of prey stock j to predator stock i (Hall et al., 2006).
In the LeMans model, fishing mortality is dependent on effort and gear catchability. The instantaneous fishing mortality for stock i of in length class j is:
where ek is the effort of the kth gear, for k = 1…H, and qi,k(Lj) is the catchability of a fish of length Lj and stock i by gear k. Effort is added to the model during initialisation (see the next section for more details), whilst catchability is added when setting up the model. The logistic catchability curve is defined as:
where η is the steepness of the slope of the catchability curve and L50 is the length at 50% of the maximum catchability. This function gives a catchability of zero for the smallest length classes, a catchability of 1 for the largest length classes, and a smooth increase in catchability from zero to one around l50.
The LeMans model works by projecting the number of individuals in each length class for each stock forward in time. We will refer to Nj,i,t as the number of individuals of stock i in length class j and time t.
The model is run for many time steps, with the length of each time step being equal to δt. At each time step three processes occur: recruitment, mortality and growth.
In Hall et al. (2006); Thorpe et al. (2015) recruitment only occurs in the first timestep of a new year. The number of individuals after the recruitment phase of the model is thus defined as for j = 2,…,nl and:
where Ri,t is the number of recruits of stock i at time t.
The number of individuals after the mortality phase of the model is defined as:
where M1 is the background mortality, M2 is the predation mortality and F is the fishing mortality. The predation mortality of a fish of stock i in length class j is:
where o is other food.
The catch of stock i in length class j is:
where F(j,i,t) is the fishing mortality (years−1), on species i in length class j at time t, and Z(j,i,t) is the total mortality (years−1) on species i in length class j at the same time.
The number of individuals after the growth phase Nj,i,t is defined as:
Irish Sea Model Set Up
The Irish Sea LeMans model incorporates eight stocks in the Irish Sea representing the key stocks and fisheries. The eight stocks are cod, haddock, herring, Norway lobster functional unit 15, (Irish Sea, west), plaice, sole, whiting, and Norway lobster functional unit 14 (Irish Sea, east) as detailed in Table 1. Nephrops functional units represent discrete geographical groupings of Nephrops which are defined by ICES and managed separately.
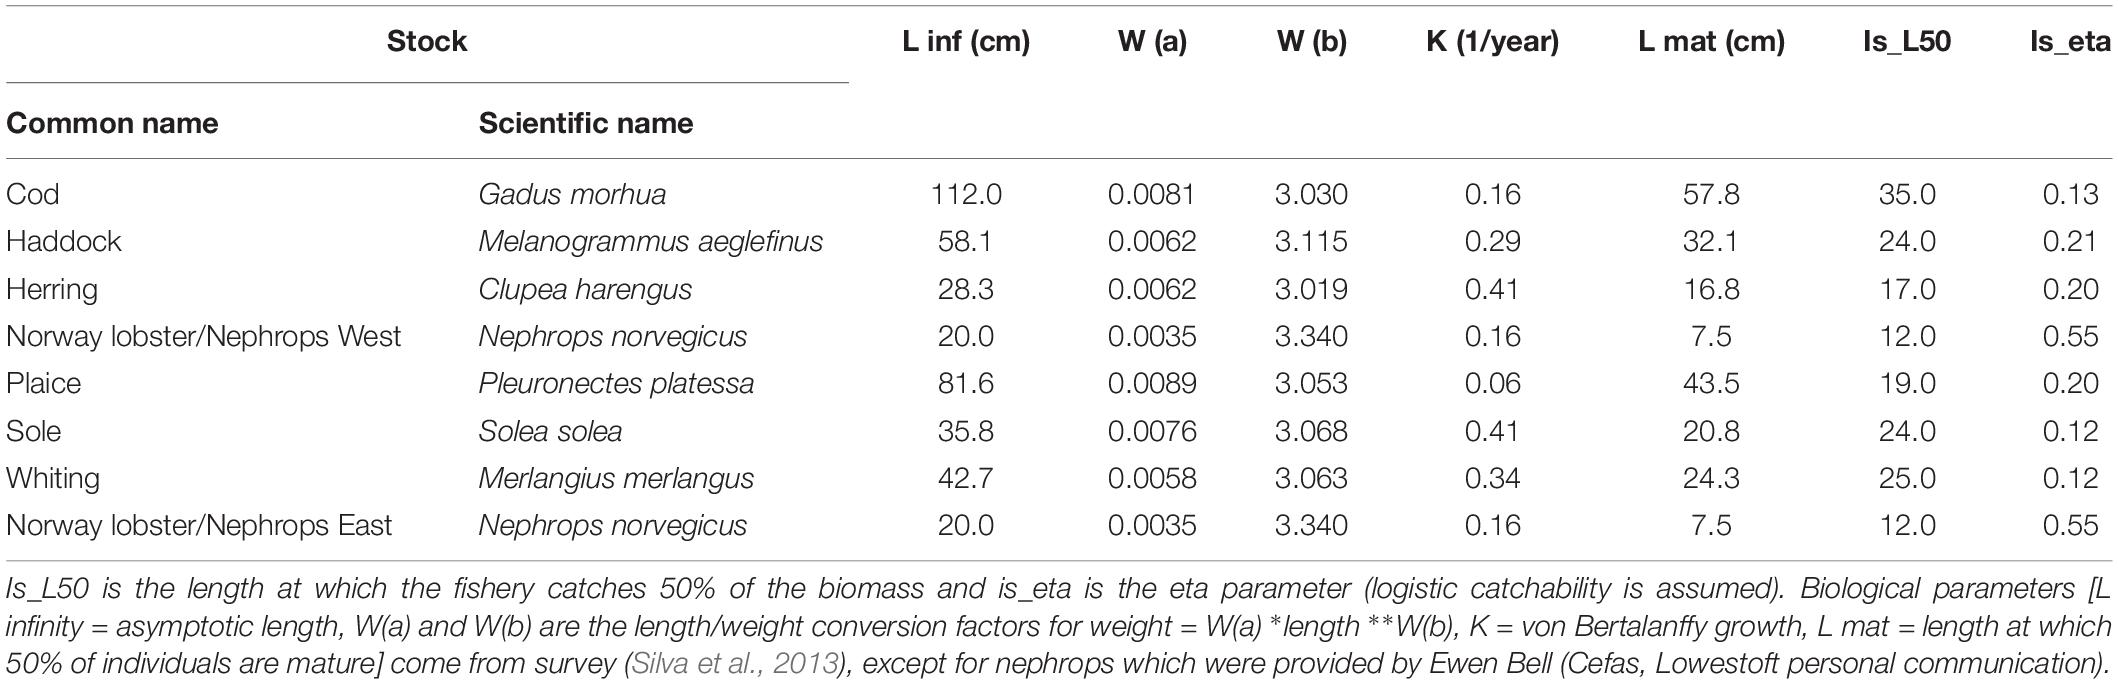
Table 1. Irish Sea model stocks.
To set up the model we used survey information, catches for the survey gears, individual abundances for the TV surveys, and SSB for the acoustic survey. Three trawl surveys were used: the Northern Irish Groundfish Survey (spring and autumn), which operates a rock-hopper otter trawl (ROT) gear (ICES, 2012a), a beam trawl survey (August/September) (ICES, 2012b) and the Irish Sea Celtic Ground Survey (spring and autumn) (ICES, 2012a). In addition, we used underwater television (UTV) surveys for Nephrops (see ICES, 2018b) and acoustic data for herring August/September) (ICES, 2019b). For the six finfish stocks, life history parameters were taken from Silva et al. (2013). Nephrops were assumed to grow like fish and their life-history parameters were provided by Ewen Bell (Cefas, Lowestoft personal communication).
The interaction matrix was split into two parts. Using the DAPSTOM database (Pinnegar, 2014), we developed a suitability matrix. If in any of the sample stomachs of species X contained species Y then species X was deemed to be capable of predating on species Y (suitability one), otherwise it was assumed not to eat species Y (suitability zero), giving the possibility of predation in Table 2.
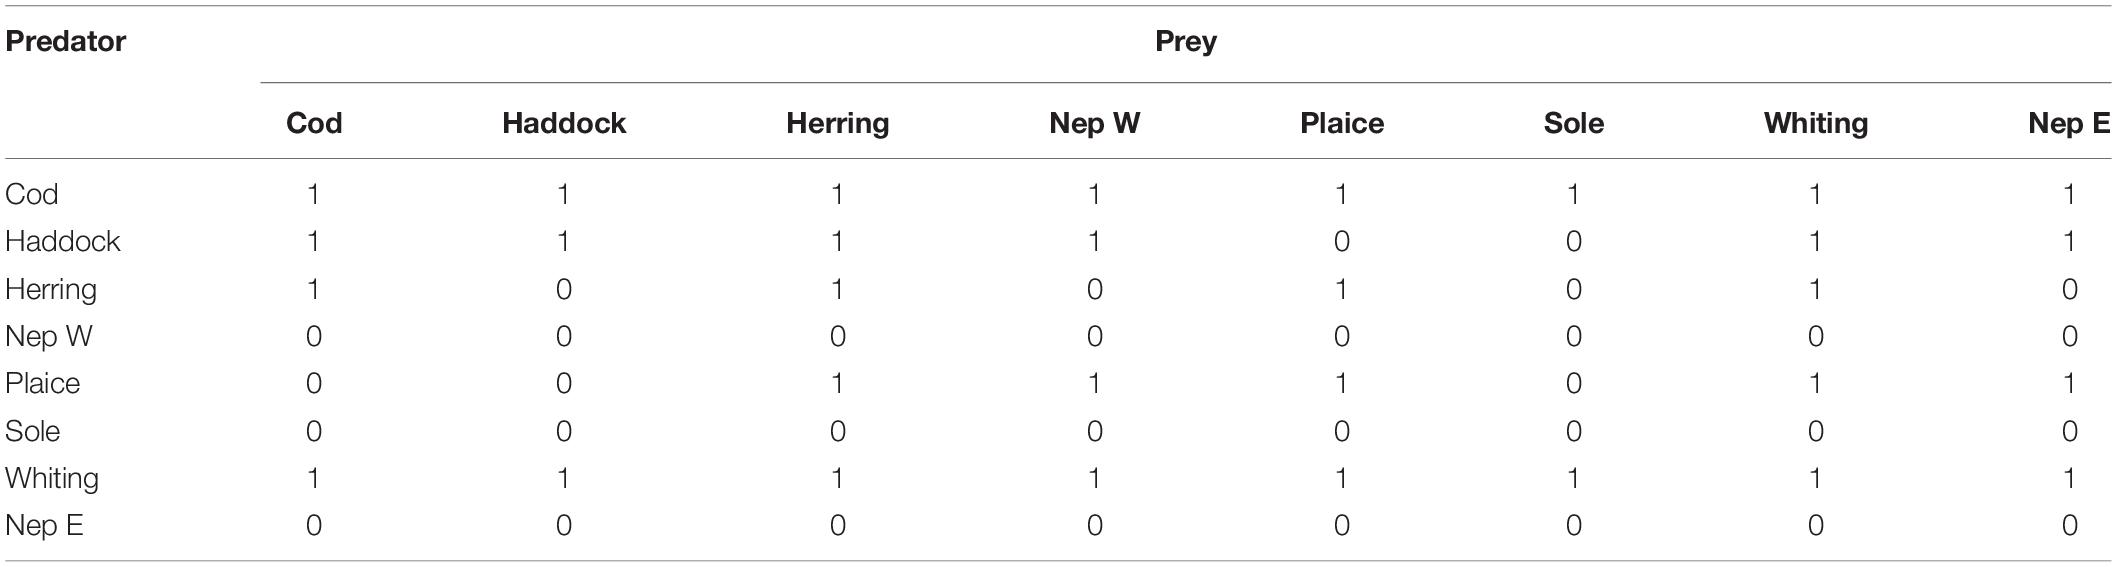
Table 2. Irish Sea suitability matrix.
Whether one stock predates on another depends both on their suitability, and whether they overlap in space and time and hence can interact. This overlap was determined from the survey data by considering the fraction of joint occurrence of each stock compared with the fraction of occurrence of the predator stock. When combined with the suitability index, this gives the model interaction index (diet matrix) shown in Table 3.
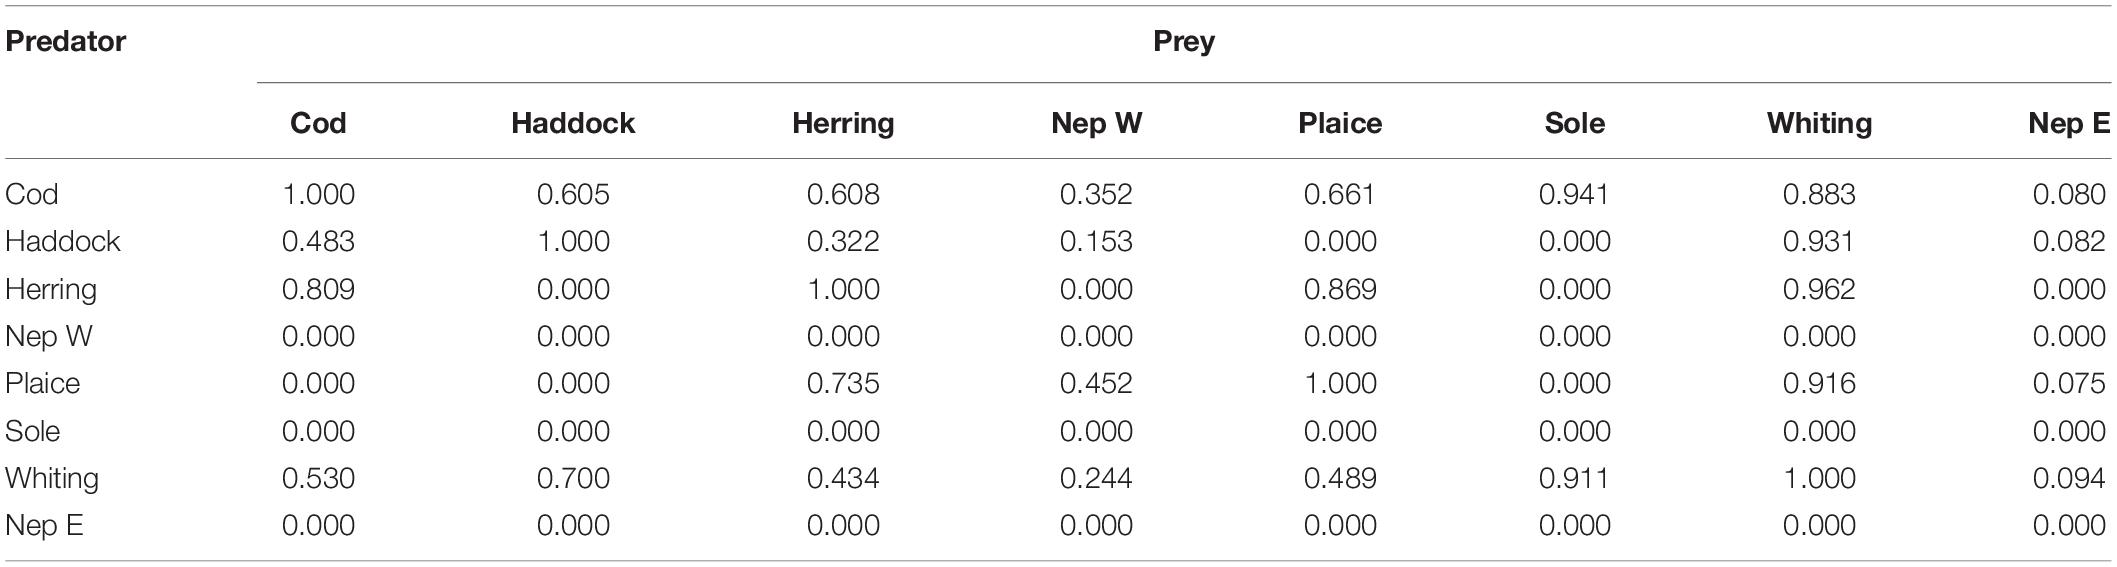
Table 3. Irish Sea LeMans interaction matrix.
We used recruitment derived from a Beverton-Holt stock-recruitment model (Ogle, 2016) for all the stocks, with parameters ai and bi for the ith stock, which were calibrated for the model. All stocks were given logistic catchability curves with parameters as per Table 1 (see also Supplementary Figure 1). The effort, expressed as the maximum fishing mortality at length for each stock, was calibrated for each year. In addition, there are three surveys that are included in the model. Their catchability was taken from Walker et al. (2017) and is shown in Supplementary Figure 2 for beam trawl, Supplementary Figure 3 for the ICES standardized equipment (ICES, 2018a), General Overture (GOV) trawl, and Supplementary Figure 4 for otter trawl. The effort for each of the survey vessels was determined by the proportion of the Irish Sea that was surveyed each year. This was determined by swept area of each vessel and is shown in Supplementary Table 1.
The time-step of the model, δt, was 0.1 years. All other parameter values were as their defaults in the R-package which is based on the North Sea model of Thorpe et al. (2015).
Calibrating the Model
The use of life-history invariants reduces the number of parameters that need to be fitted and makes the problem more tractable. We fitted 25 model parameters, Beverton-Holt stock-recruitment parameters, αi and βi, other food, o, fishing mortality rates in the spin-up of the model, Fi,0, as in Spence et al. (2016) and maximum fishing mortality rates for each stock in each year, Fi,t. To fit to this we have commercial catches, s0,i,t of the ith stock in the tth year, as well as survey indexes for sj,i,t for the jth survey. We have 5 surveys, a beam trawl survey (j = 1), a GOV survey (j = 2), an otter trawl survey (j = 3), a TV survey (j = 4), and an acoustic survey (j = 5).
The likelihood of the model is , with:
where s(θ)i,j,t is the LeMans model simulating the si,j,t data with parameter set θ and Ii,j,t is an indicator function stating whether that data point is included in the parameter set or not, and NML() is a normal density with expectation ln(s(θ)i,j,t and variance evaluated at ln(sj,i,t).
All species were fitted to commercial catch and discard data, which were taken from the single species assessments. There are a number of surveys available for determining trends in target stocks in the Irish Sea, namely cod, haddock, whiting, plaice, sole, herring and Nephrops, each using a different gear and survey plan (see above).
With the exception of herring, all of the fish were fitted to the three surveys, however, we added uncertainty in the beam trawl survey for round fish (cod, haddock, and whiting) by setting w1,1=w2,1=w7,1=0.1, and the otter trawl surveys for the flat fish (plaice and sole) by setting w5,2=w5,3=w6,2=w6,3=0.1. Commercial catches existed for all years for all species except haddock in 1980-1992, plaice in 1980 and Nephrops east in 1980-1999. Beam trawl survey information was available for 1993-2015, the GOV survey for 2003-2016 and the otter trawl survey for 1992-2016 (Supplementary Table 2). The Nephrops stocks were fitted to UTV surveys, 2003-2016 for Nephrops west and 2008-2016 for Nephrops east. The acoustic survey was used to fit herring and was from 1989 to 1990 and 1994 to 2016. In addition, cod was not fitted to the GOV survey.
Finding the Starting Point for Template Model Builder Optimization
We coded the LeMans model in TMB (Kristensen et al., 2016), so that we could take advantage of automatic differentiation enabling us to optimize faster and hence respond to feedback within the timescale of the working group. The uncertain parameter space is non-linear and there are many local maxima, so we had to be careful as to where we started the optimizer.
In order to find an appropriate initial point, we first performed a technique similar to history matching (Vernon et al., 2014; Spence et al., 2021). We first ran 50,000 random combinations of the uncertain model parameters, αi, βi, o and Fi,0 with fishing mortality values from single species stock-assessments. For the kth run of the model, we calculated the log-likelihood for each stock, li,k, by finding maximum variance parameters that maximized the likelihood, i.e.,
Using Wilks theorem (Wilks, 1938) and recognizing that a lower bound for the maximum likelihood is , then:
We excluded any points that had a deviance, Di,k, beyond the 99th pecentile of the distribution as points that are not possible starting values as their overall likelihood would be insufficiently favorable.
We then investigated all 2-dimensional combinations of the parameters to find areas of space where there was no coverage and which could therefore be discounted. For example, Figure 1 shows the herring parameter sets, a3, b3 and F3,0, that were not rejected in the previous step for the herring likelihood.
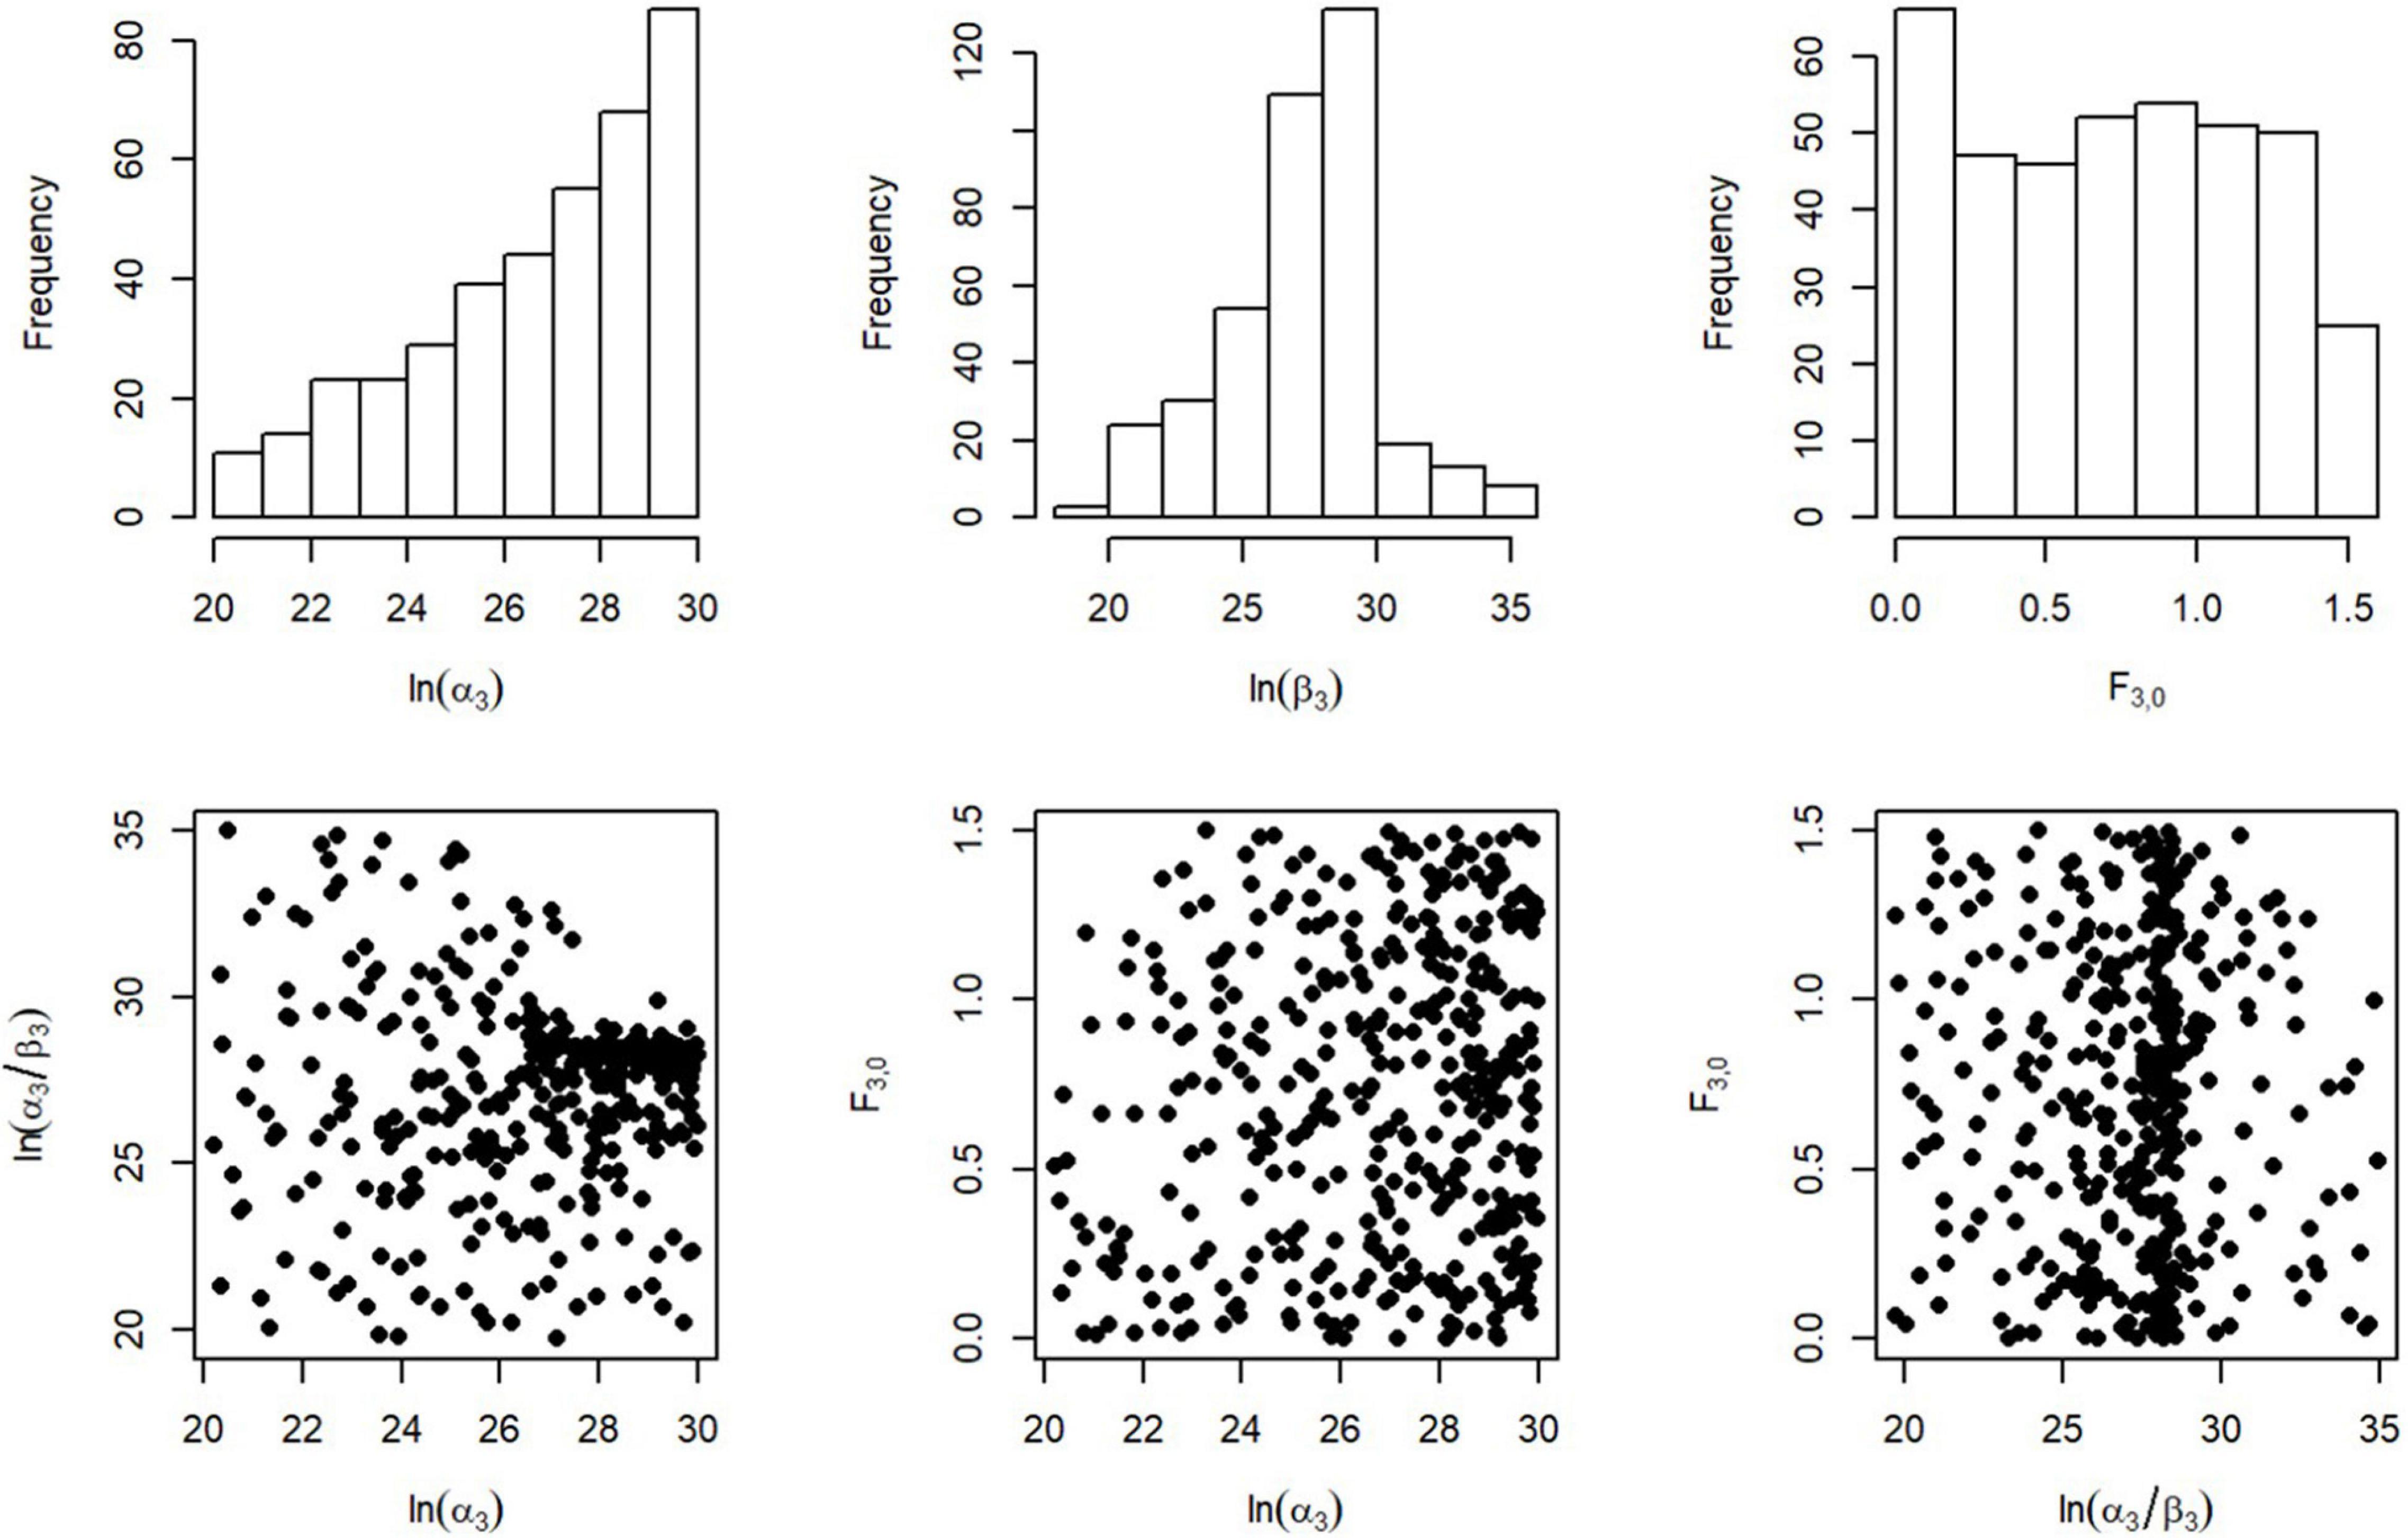
Figure 1. Distribution of possible starting points for the stock-recruit parameters α and β, and the spin-up fishing rate F0 for herring. The spin-up fishing rate is a constant rate of fishing applied to the stock throughout the spin up period of 100 years before the commencement of the simulation proper.
We decide in which marginal direction the points are not likely to be random. For example, for herring (Figure 1), the correlation between log(a3) and log(a3/b3) are probably not random, however, the distribution of F3,0 could be random. From the space that remains we sampled another 1000 parameter sets. Then, from the best parameter set, in terms of total likelihood, we initialise the optimisation algorithm.
We coded the LeMans model in TMB (Kristensen et al., 2016) and optimized using the nlminb function in R.
Results
Model Fitting
We plot the fits of the model (lines) with the data (points) for the commercial catches and surveys. We also compare the model-determined F and SSB (lines) with the values from the most recent single species assessment (dotted lines - ICES, 2018b, 2019b). For cod (Figure 2), which was fitted to the commercial catches, beam trawl and the otter trawl survey, the LeMans model fits well to the ROT survey and captures the pattern of the beam trawl survey, but fits less well to the catch and GOV survey. Whiting (Figure 3) was fitted to commercial catches and all the surveys. We fit the catches and the beam trawl survey well, however, we under-estimate the GOV and ROT surveys.
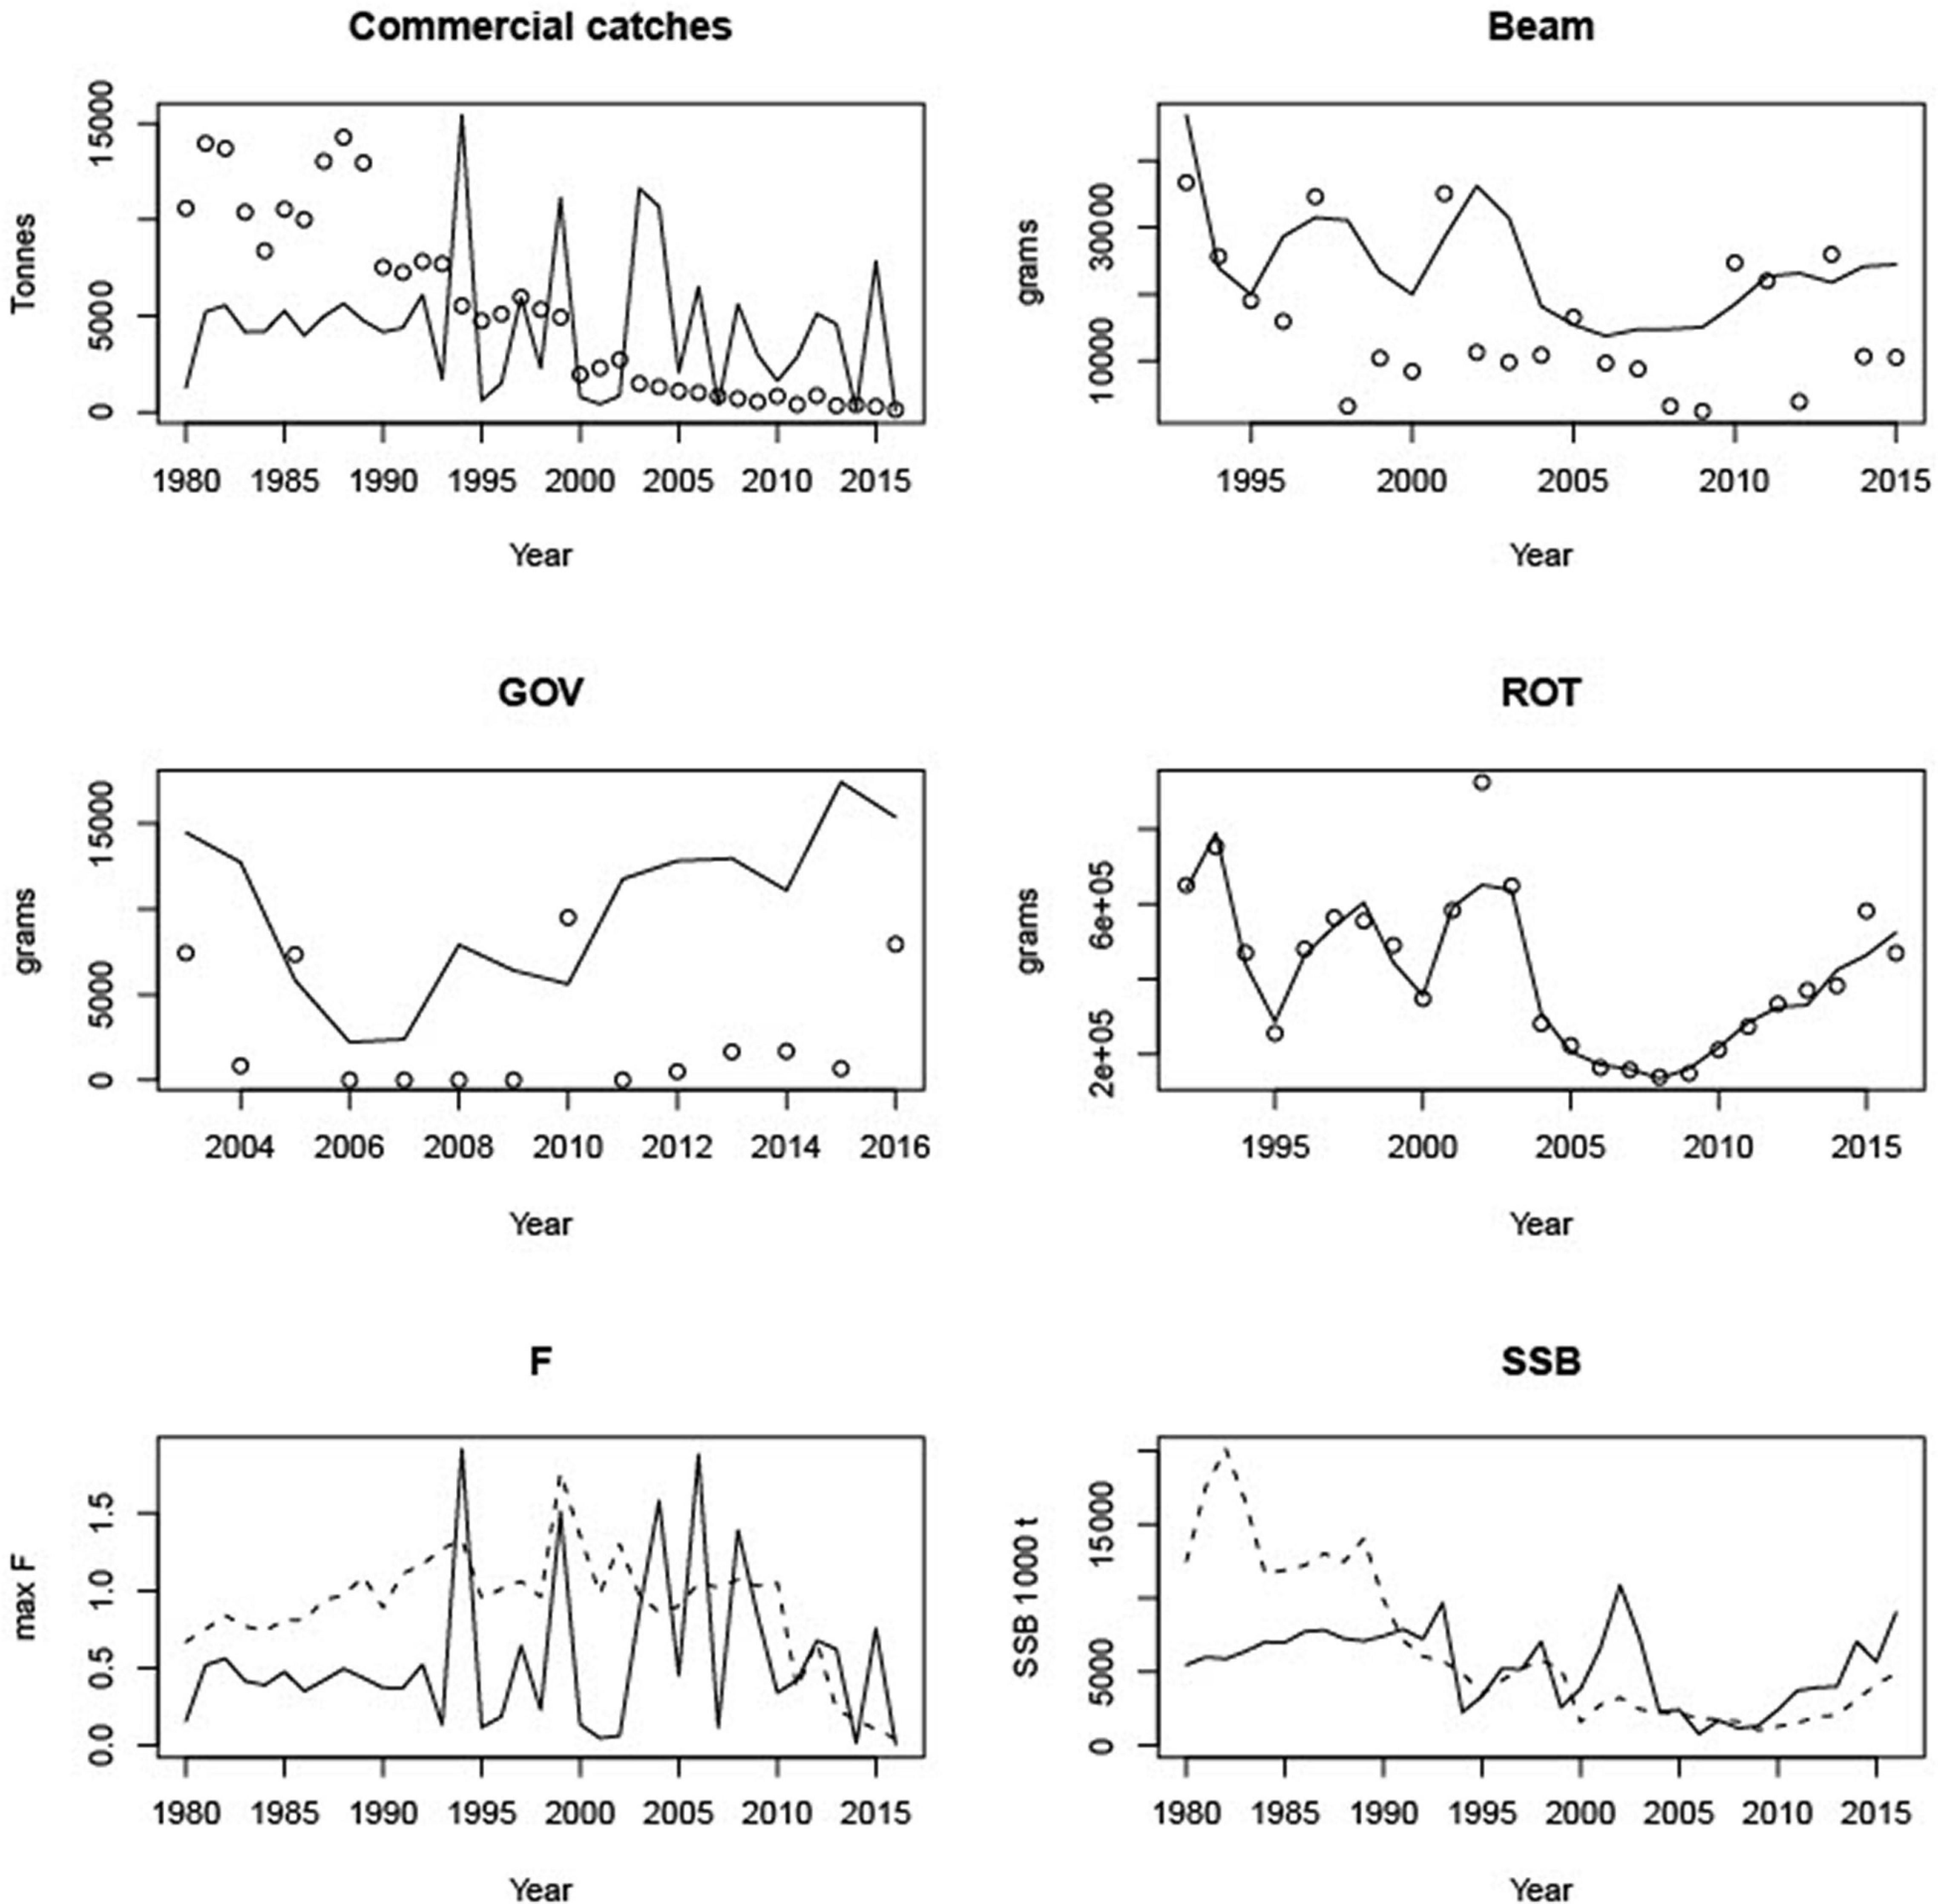
Figure 2. Fits to commercial catches (CV = 0.1) and the three surveys (CV = 0.5) in the top 4 panels, and comparison of estimates of F and SSB with single species assessments for cod. In each case the model is the solid line.
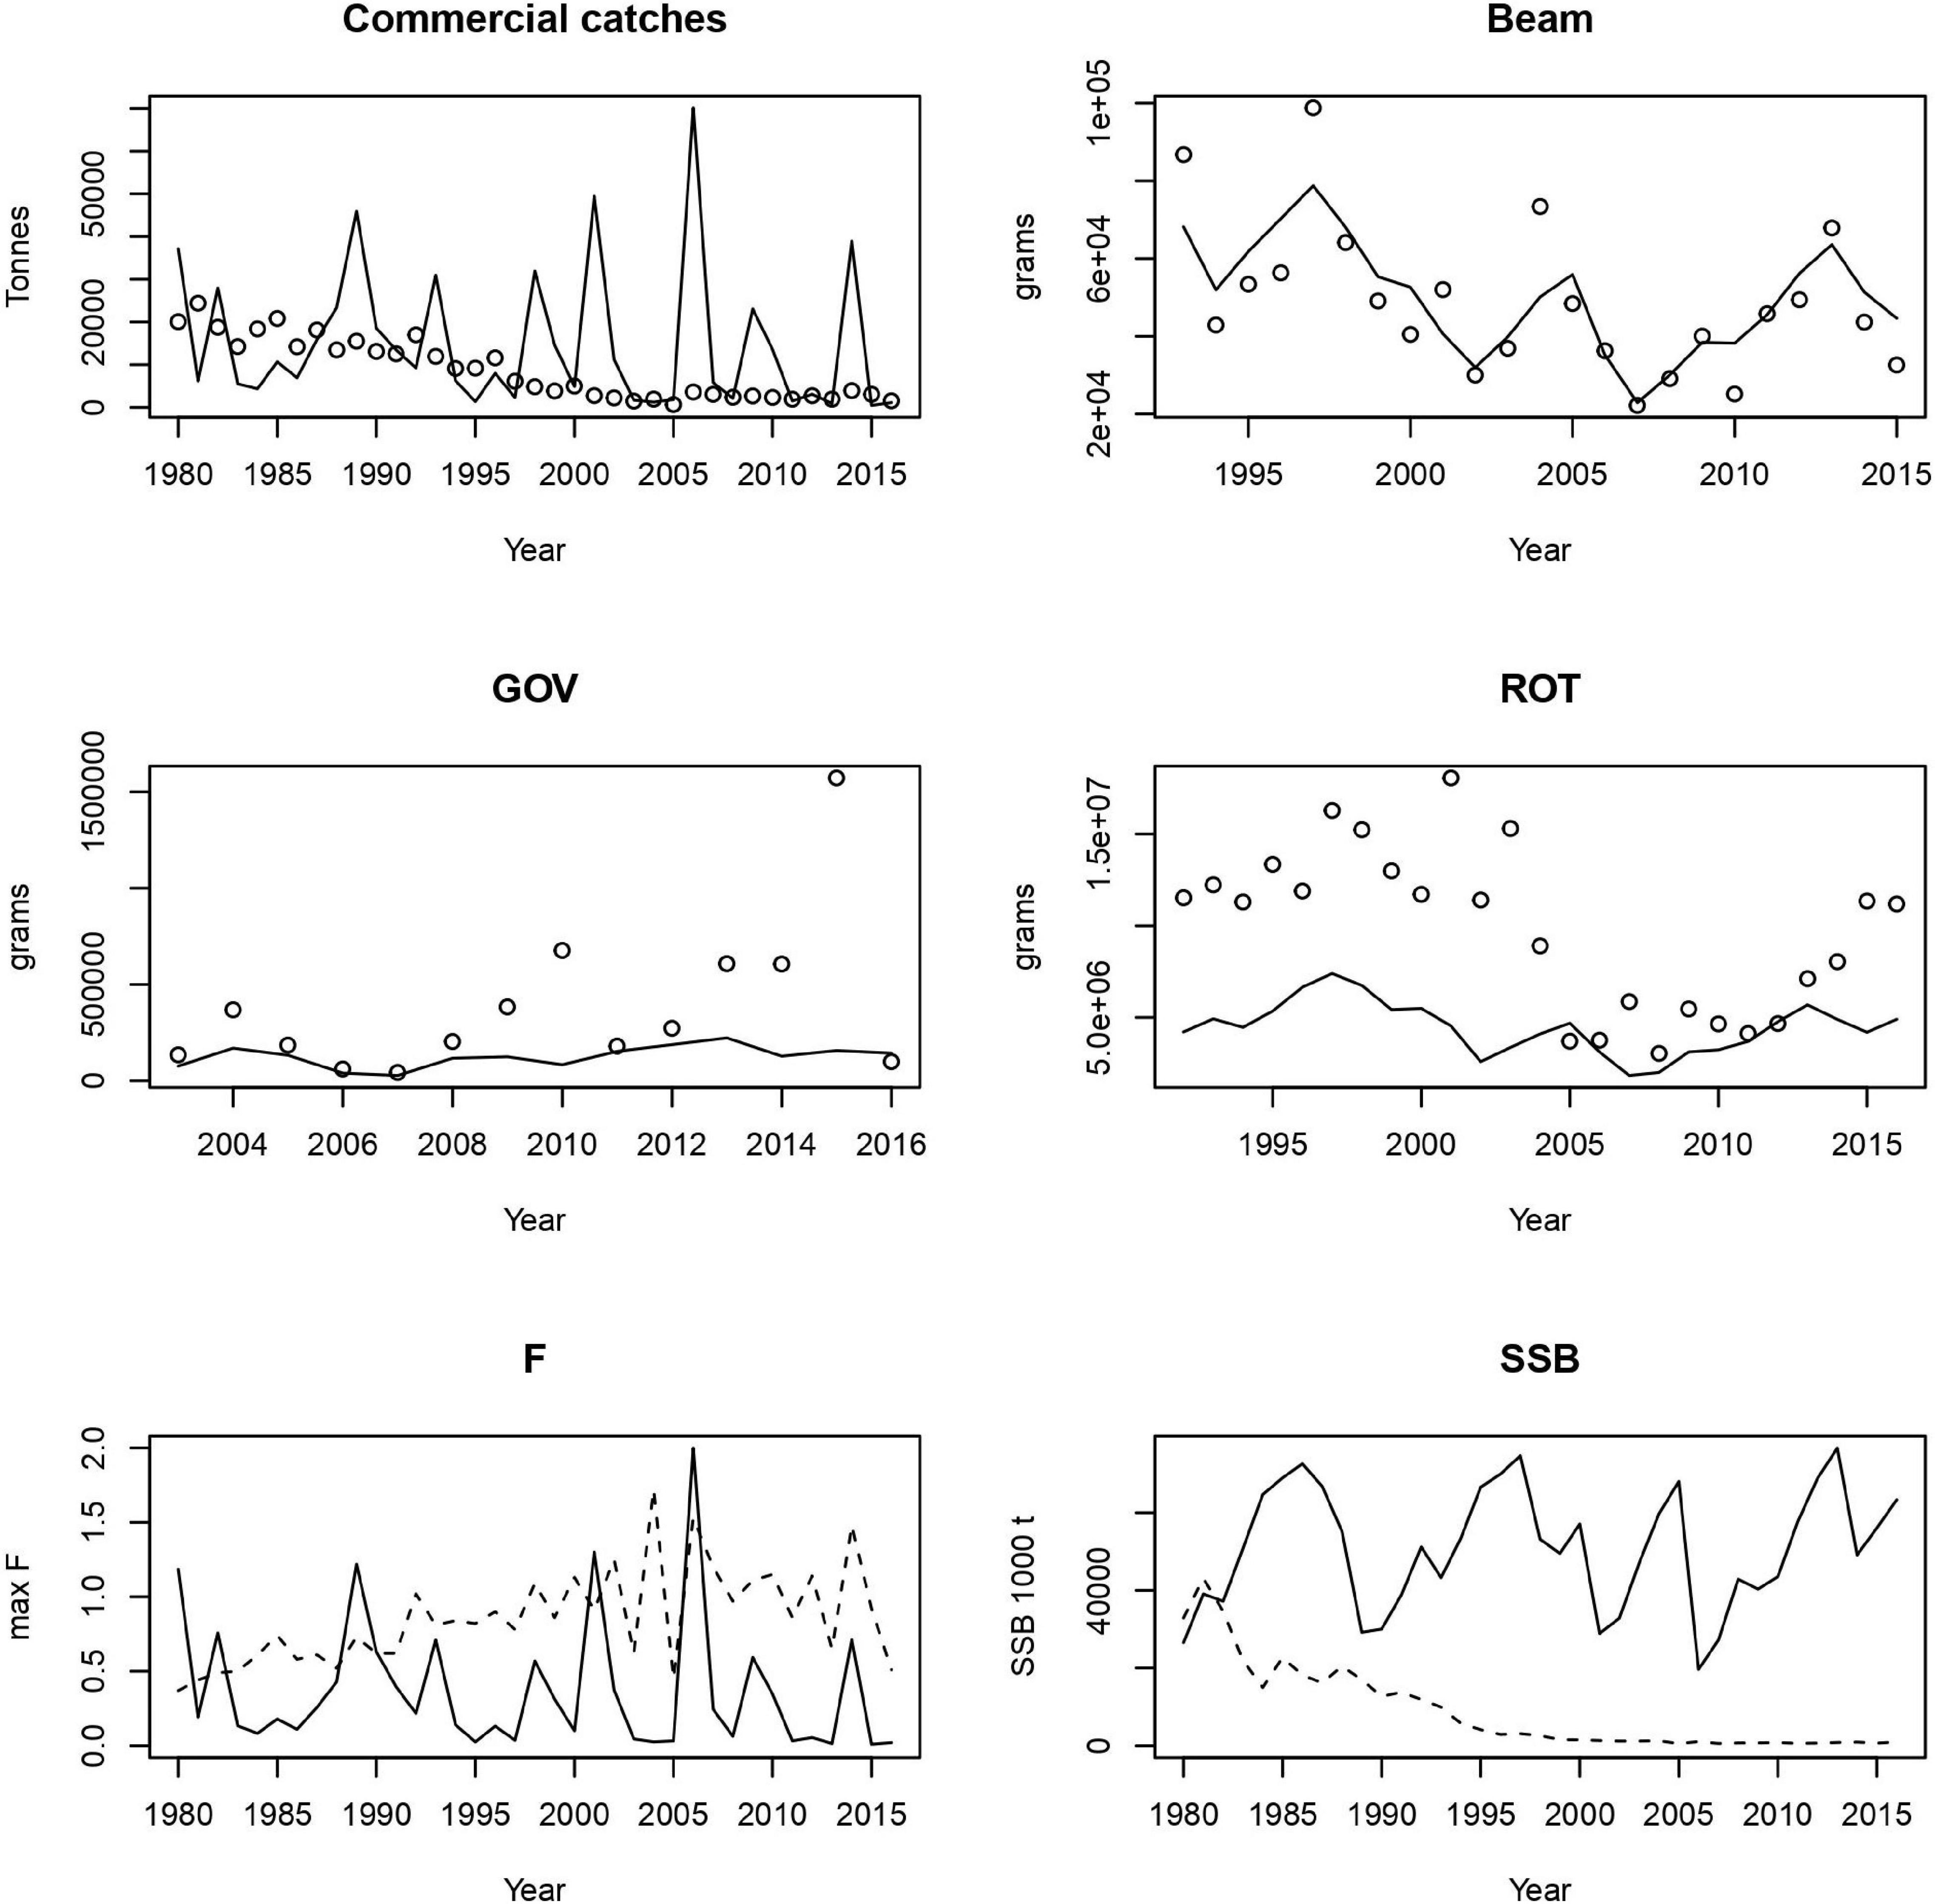
Figure 3. Fits to commercial catches and the three surveys (top 4 panels) and comparison of estimates of F and SSB with single species assessments for whiting. In each case the model is the solid line.
Fits to the other stocks Haddock (S5), Herring (S6), Nephrops West (S7), Plaice (S8), Sole(S9), and Nephrops (S10) are shown in Supplementary Material, but the general outline is summarized in Table 4. Overall catches fit well except for cod, which fits more closely to ROT, and whiting, which fits more closely to the beam trawl. ROT and the beam trawl fit well to plaice, and sole, and the underwater TV survey fits well to nephrops east.
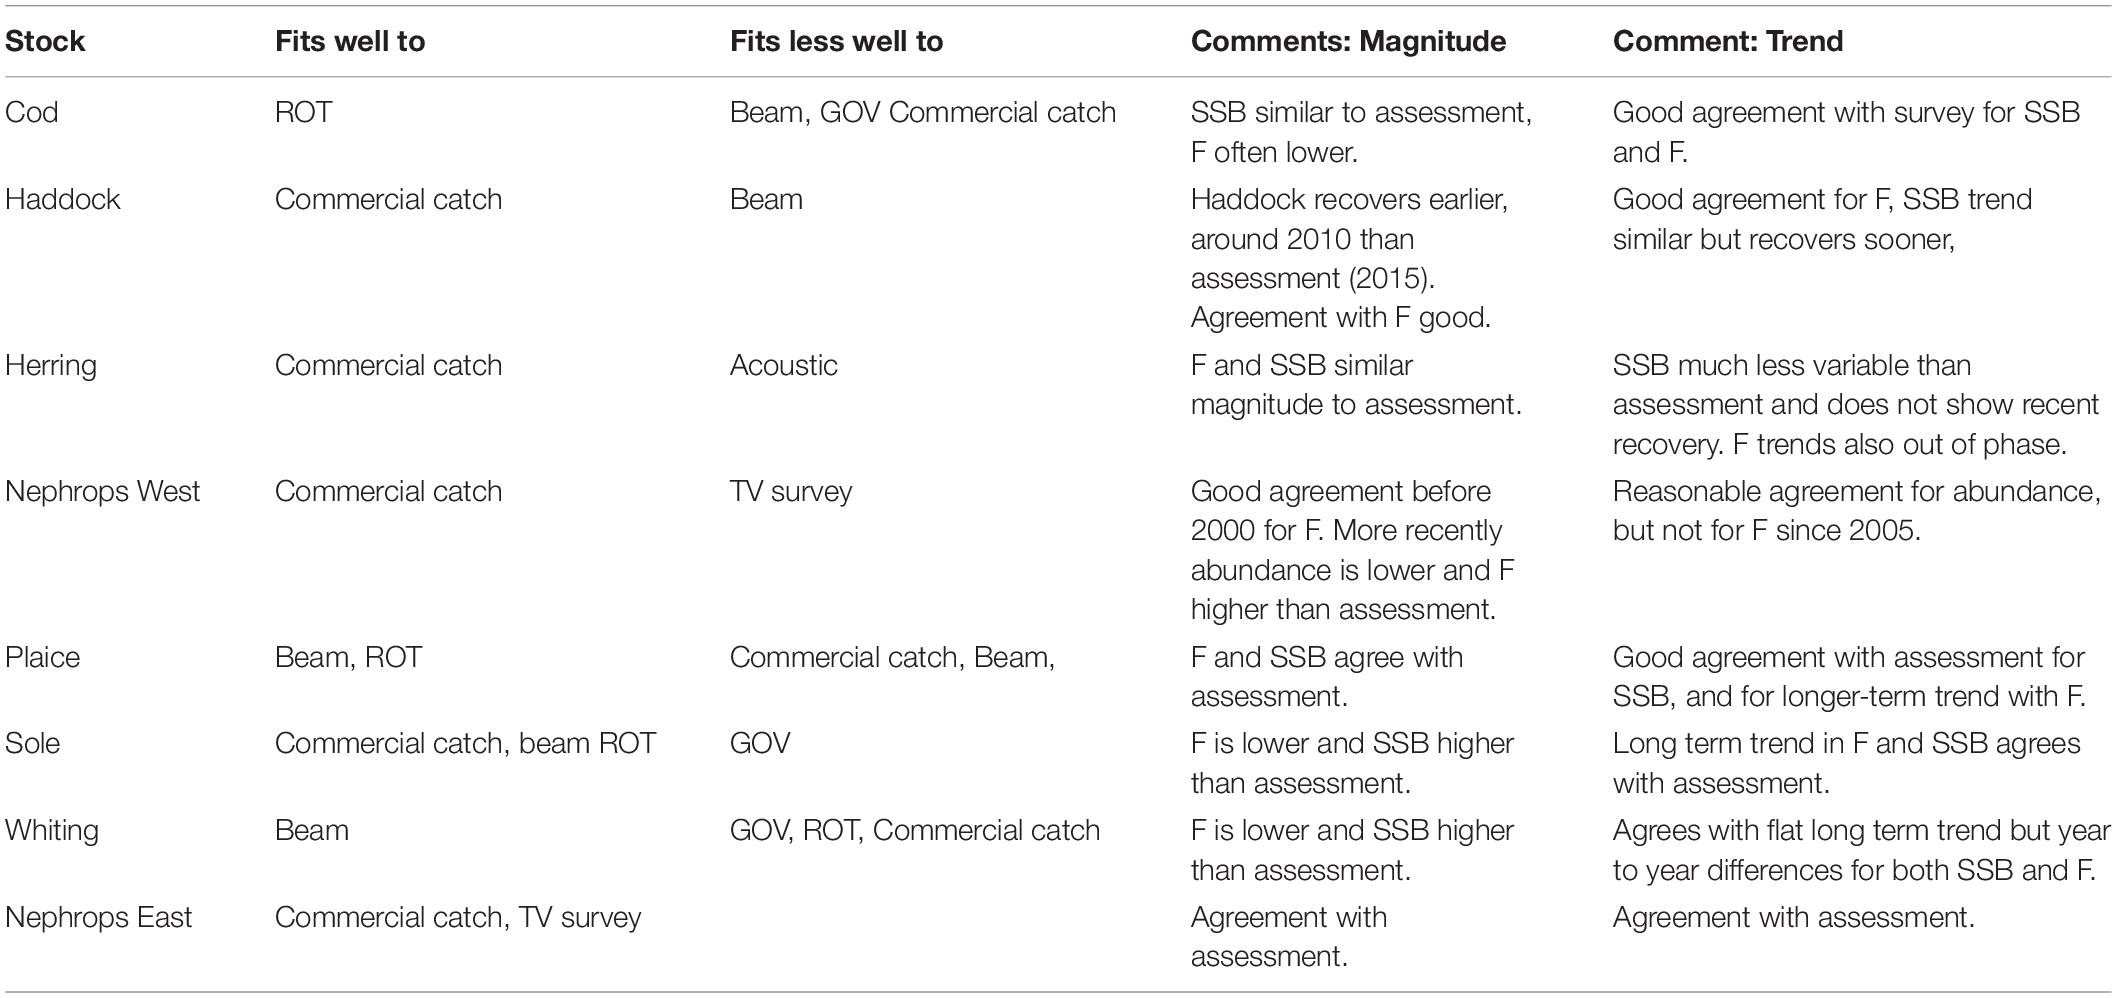
Table 4. Summary of fits to catch and survey data and estimates of F and SSB for all eight stocks.
Calculating Natural Mortality Values
Natural mortality in the model is the sum of predation mortality (M2) and non-predation mortality (M1). For each stock this is calculated as a function of length, but we can express this in terms of age given the assumption of food-independent growth (Figure 4). Common themes in the simulated natural mortality are (a) high levels of natural mortality on age 1, (b) decreasing levels of natural mortality with age (except for age 5 cod, where mortality higher for age 5 than age 3 or age 4), (c) generally similar levels of natural mortality across years, (d) the oft quoted approximation of M = 0.2 is not supported, with M always being above this level. Single species assessments in the Irish Sea have used natural mortality boundary conditions from Lorenzen (1996), where mortality is proportional to weight raised to the power -0.29. The estimates generated here are higher for the largest and smallest length classes but are otherwise similar.
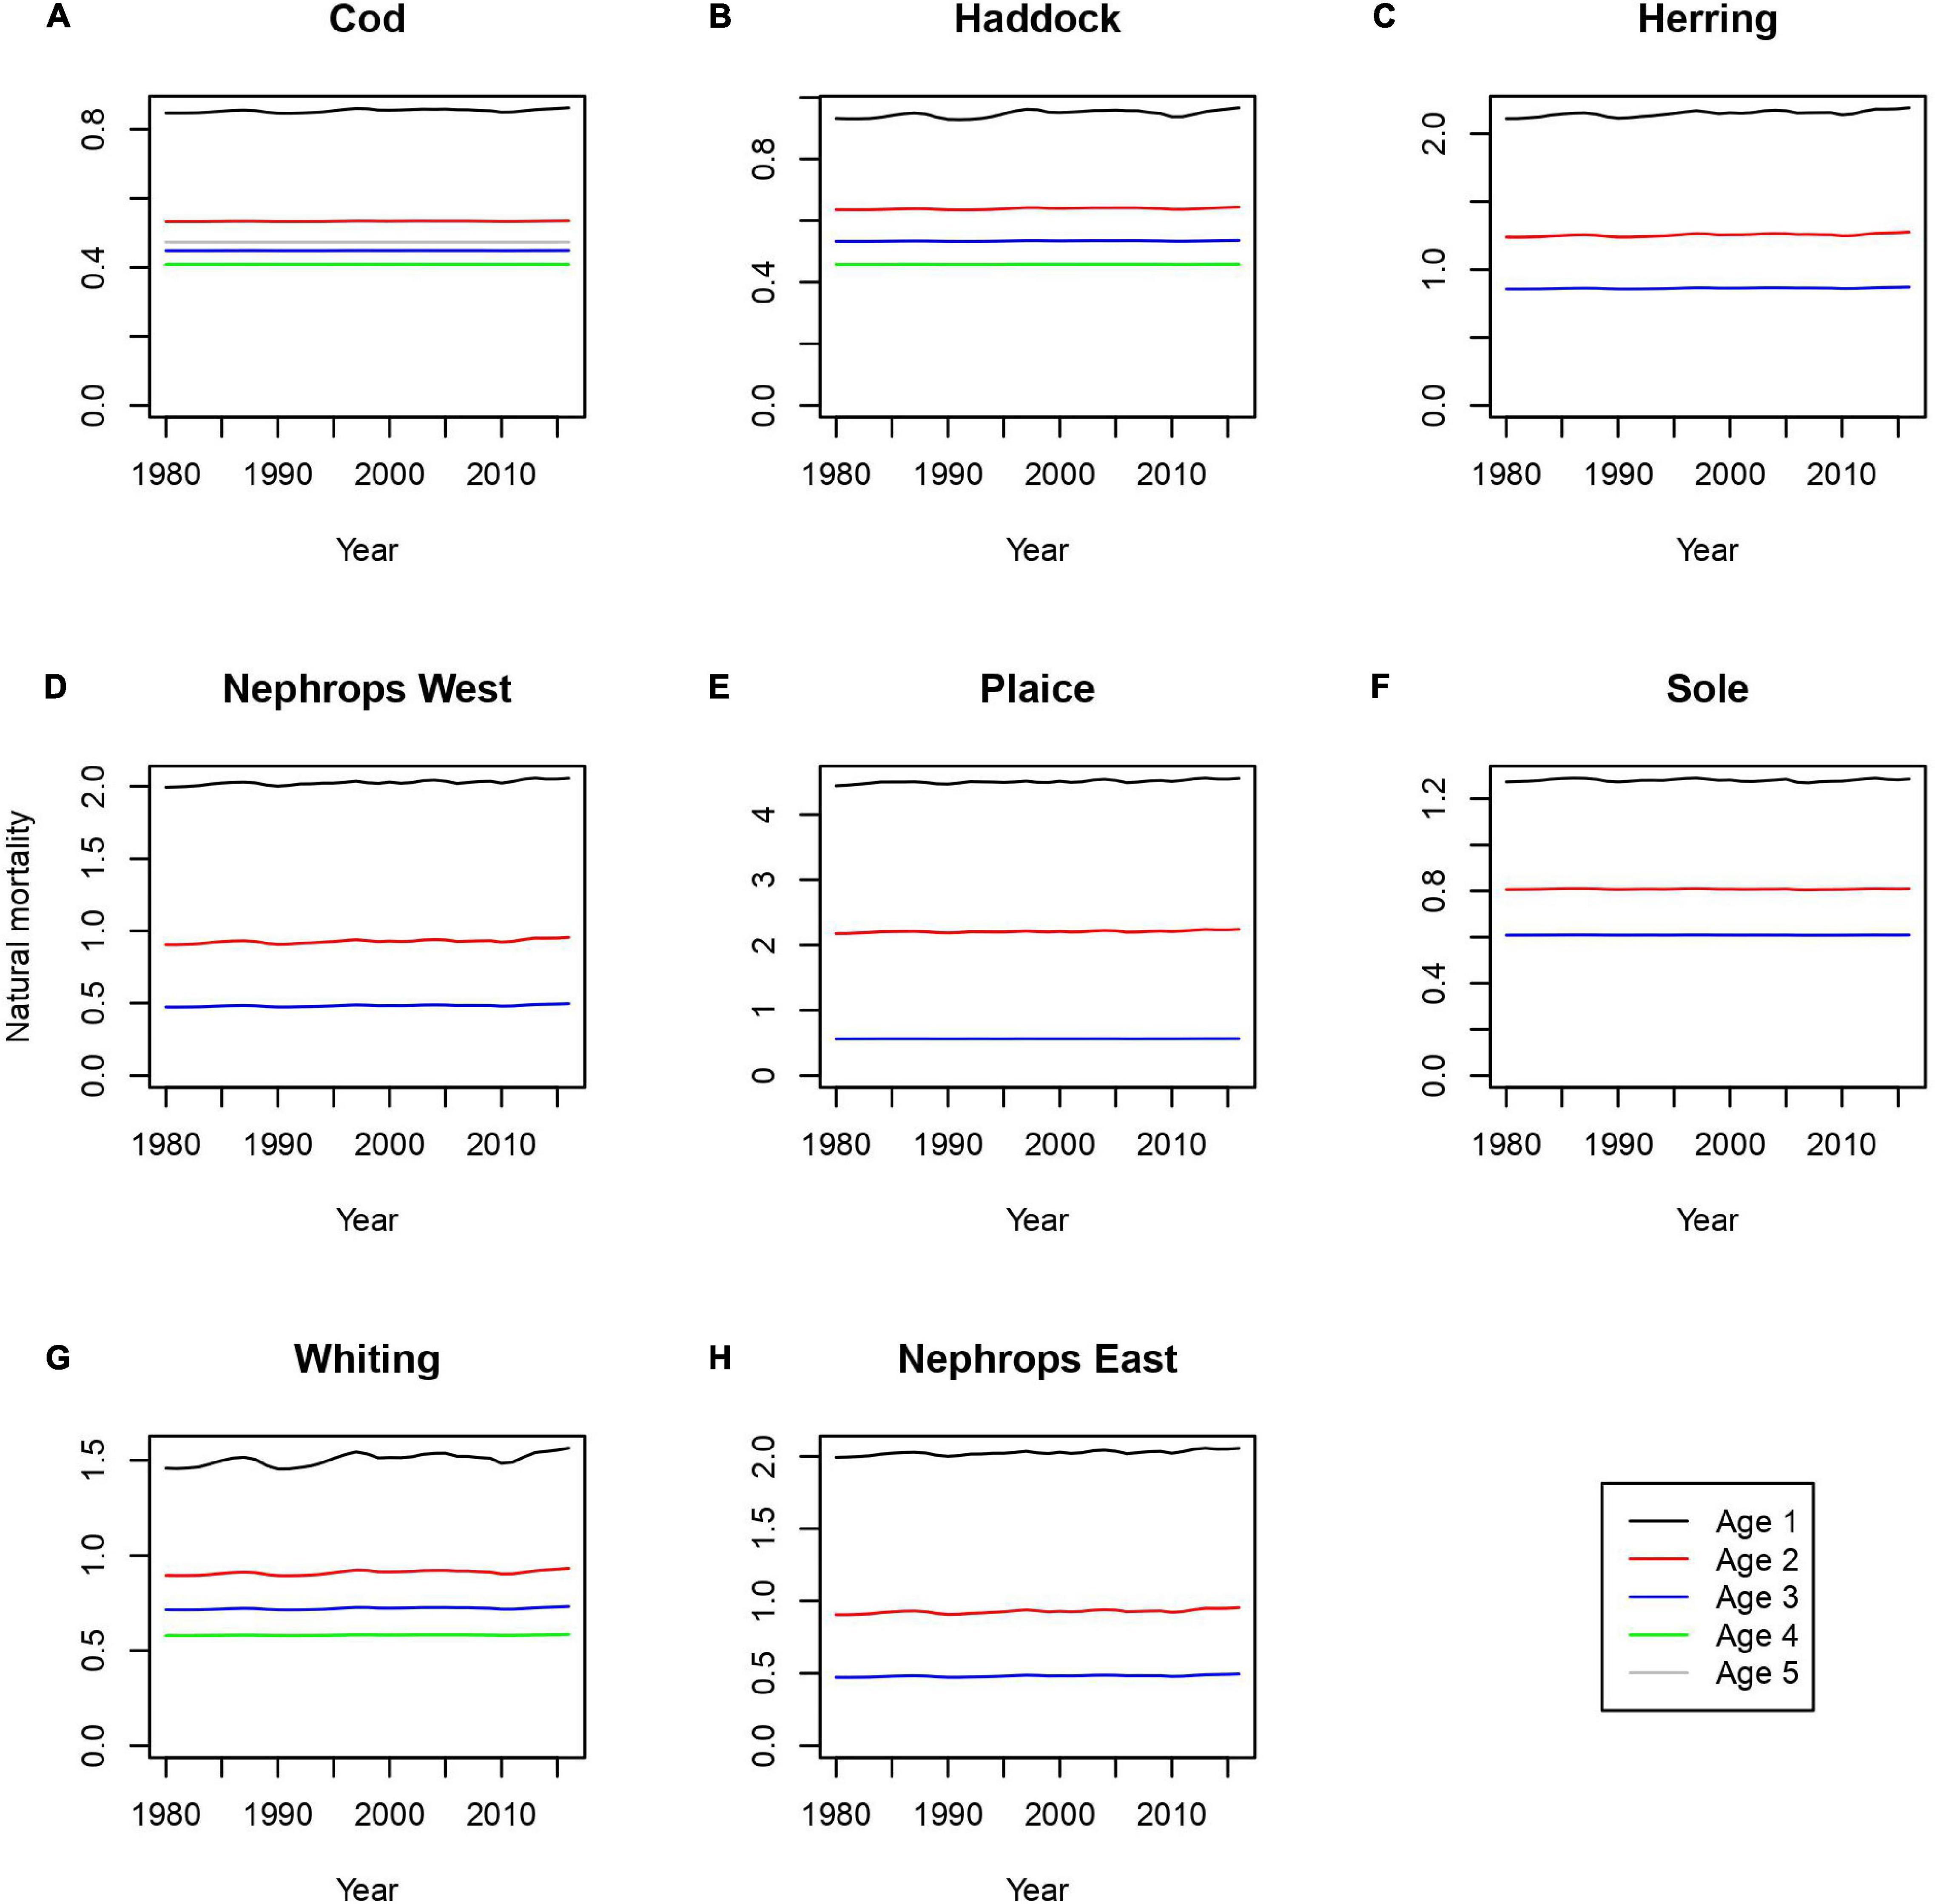
Figure 4. Natural mortality through time for panels (A) cod, (B) haddock, (C) herring, (D) nephrops east, (E) plaice, (F) sole, (G) whiting, and (H) nephrops west. Black = age 1, red = age 2, blue = age 3, green = age 4, gray = age 5.
Discussion
In this study, we conducted a multispecies assessment of key Irish Sea stocks by directly fitting a multispecies model to catch and survey data. Our aim was to address two key barriers to the use of multispecies models in direct assessment, namely (a) the speed and adequacy of the model fit to data, and (b) the perceived complexity of multispecies models and their opacity to stakeholders. These two barriers are of course related; a poorly fitted model will lack credibility, a slowly fitted model will have to be prepared offline, will be inflexible to stakeholder needs, and hence will probably seem opaque.
We used a mechanistic length-based framework (LeMans) in the form of a freely available r-package (Spence et al., 2020) which we adapted for eight key Irish Sea stocks, and produced a multispecies stock-assessment. By restricting the model to a subset of key commercial stocks, and using life-history invariants, we kept the number of parameters requiring fitting to 25, rendering the problem tractable by a combination of history matching and automatic differentiation via TMB. Importantly we were able to generate fits within about 12 h and hence fit the model overnight and present results the next day, indicating an ability to provide near-time strategic advice.
The model fitted the catches very well for all stocks except cod and whiting, but followed the ROT survey for cod, and the beam trawl for whiting. ROT also fit well to plaice and sole, as did the beam trawl data, whilst the TV data fitted nephrops east better than west. The model was unable to fit trends in the acoustic survey for herring. With the exception of nephrops east, no stock was well fitted to all sources of data, illustrating the challenges of simultaneously fitting several stocks, to multiple data targets. Given the uncertainties in catchability associated with survey and commercial gears, we need to explore sensitivity of the model to fleet catchability parameters both for survey and commercial fleets in future work. Currently the survey catchability parameters are from Walker et al. (2017), however, this does not provide catchability parameters for the ROT gear, and so we had to assume that it was the same as the GOV. Fits to these two gears often differed in quality, suggesting that this assumption may not be true. In addition, we currently fit only to the total catch of the survey, which means that the length-structure of the stocks might be unrealistic. In the future, we could fit to timeseries of catch in different length classes, however, it is not immediately obvious what the likelihood for this would be. We also assume that the fish are homogeneously spread out over Irish Sea when sampled by survey. More work needs to be done to determine whether this is reasonable, and what to do instead if it is not.
The overall fit to the cod catch was poor, with excessive inter-year variability, and a flat long-term trend, when in reality the catch has been declining. One option would be to reduce the CV for cod commercial catch and enforce a tighter fit (we used the same CV for catches for all stocks). Comparison with the single species assessment (ICES, 2017) suggests that the latter achieved a good fit to catches by assuming sharply changing selectivity of the cod fleet after 2000, assumed to be driven by fishing restrictions imposed in that year, whereas we assumed a constant selectivity with time. Clearly, parameters of the model are sensitive to catchability curves for the commercial fleets. In the future it might be possible to improve the fit by fitting to individual commercial fleet segments, taking advantage of mixed fishery effects to better constrain the stocks collectively and allow for time-varying selectivity as the mix of fleets changes. This process could inform the choice of selectivity blocks for single species assessments, and provide a coherent framework for incorporating data poor stocks (e.g., Punt et al., 2011), though that was beyond the scope of this study. It should also be noted that the quantitative Irish Sea cod assessment was subsequently rejected and the stock transitioned to a trends only basis for advice (ICES, 2019c).
Comparison with the single species assessments can facilitate the assessment process by addressing the following questions: (a) is estimated natural mortality sufficiently time-invariant to support the use of single species assessments, (b) are the overall results sufficiently similar to suggest that the assessments are internally consistent, and (c) does the pattern of any discrepancies offer any pointers to the future. We found that natural mortality was strongly age/size dependent, but only changed weakly in time, supporting the use of single species assessments with age-dependent mortality estimates. Overall the estimates of F and SSB were qualitatively similar to those of the individual assessments, with the exception of whiting and more moderate agreement with herring and sole, suggesting a reasonable degree of internal consistency.
Remaining discrepancies may be driven at least partly by differences in the treatment of recruitment, which is deterministic in LeMans and follows a Beverton-Holt recruitment curve. However, recruitment often does not appear to follow such a deterministic curve; nor do the single species assessments assume this (whiting and haddock have stochastic recruitment based on SSB, whereas plaice and sole assume no relationship with SSB). Some size-based models have previously included stochastic recruitment (e.g., Blanchard et al., 2014), and it is possible to include this with the LeMans model (Thorpe et al., 2017; Thorpe, 2019; Thorpe and De Oliveira, 2019). However, it may be more beneficial to link recruitment to environmental conditions, such as temperature, and include this in the model (e.g., Payne et al., 2017). Indeed Bentley et al. (2020) suggested that environmental forcing was a key driver of recruitment in the Irish Sea, and so the assumption of a constant environment in this study may need to be revisited in future work. If we are able to produce skilful environmental forecasts for the Irish Sea, we would expect that incorporating the key environmental impacts on recruitment would lead to the model having a much better forecasting ability and help with the framing of medium-term reference points (Bentley et al., 2020; Howell et al., 2021).
Recent research has shown an increase in top predators such as seals (Waggitt et al., 2019) and it is possible that these might significantly influence the dynamics of the fish community. Although the LeMans model as presented here does not currently have marine mammals in it, one of the advantages of the size-based approach is that model could readily be extended it to include seals as an additional species given information on their life-history traits and diet preferences.
Importantly, we showed that it is relatively easy to fit this model, taking only a few hours on a high-end laptop. This could be a real step forward in the working-group setting as alternations to model assumptions can be made rapidly (for example changing assumptions about M1), and revised results can be presented within the time frame of a day. In this way we were able to respond to concerns about initial unrealistic natural mortality and re-fit the model with the revised model producing reasonable estimates of M, However, it is more difficult to quantify the associated uncertainty. Robustly quantifying the uncertain parameters would require fitting the model in a Bayesian framework (Gelman et al., 2013). Other size-based models have been fitted using Markov Chain Monte Carlo (MCMC), but this is a slow process and cannot feasibly be done within a short framework such as a one-week meeting (Spence et al., 2016; Spence et al., 2021). One way of approximating this is to assume that the uncertainty of the parameters is Gaussian, with the co-variance being the inverse of the Hessian matrix, and the expectation being given by the maximum-likelihood, Although the Gaussian assumption is unlikely to hold strictly true, it could still be a reasonable approximation. If this is the case, the model could be fitted in a short time period, along with a quick approximation of the associated uncertainty, with a more robust uncertainty analysis being done later. However, more work needs to be done developing methods for quantifying uncertainty of these models in an advisory setting.
The LeMans model can accommodate multiple fishing fleets, which could be used when giving mixed fishery advice. In the Irish Sea there are broadly three fisheries (Otter trawl, beam trawl and pelagic trawl) (see ICES, 2018b). The otter trawl mixed fisheries tend to use selective gears, e.g., separator panel, square mesh netting and grids to reduce the bycatch. This fishery primarily targets Nephrops, however, there are other species caught, for example haddock amongst a number of other species, and there is evidence of discarding occurring as well. The beam trawl fishery is primarily targeting plaice, however, there are bycatches of sole, megrim and a number of rays. The pelagic fishery almost exclusively catches herring. The model would be able to describe the effect of these technical interactions, through fishing gear, as well as biological interactions, though predation. It would also allow exploration of different fleet scenarios in future, e.g., whitefish effort vs Nephrops directed effort and consideration of multispecies mixed fishery MSY objectives.
The model here, with its modest parameter set and rapid fit to survey and catch data has demonstrated that it is possible to use mechanistic size-based models to inform tactical management as inputs to and alongside single-species assessments. Although the model here is limited by structural uncertainty associated with only explicitly modeling the 8 key commercial stocks, this could be addressed by using it with the Irish Sea Ecopath model (Bentley et al., 2018, 2019) in a multi-model ensemble (Spence et al., 2018). In addition, using the information used to create the LeMans model, it would be relatively straightforward to develop a version of the multispecies size spectrum model, mizer (Scott et al., 2014), further increasing the reliability of the multispecies advice.
Data Availability Statement
The raw data supporting the conclusions of this article will be made available by the authors, without undue reservation.
Author Contributions
MS led on development of the model with RT assisting. RT presented at the working group. RN and PD assisted with the application to the advisory process. All authors contributed to the development of the manuscript.
Funding
This study was funded by the Department for Environment, Food, and Rural Affairs (DEFRA), the EU H2020 project PANDORA, and the Cefas Seedcorn project DP425 “Inference on a Budget.”
Conflict of Interest
The authors declare that the research was conducted in the absence of any commercial or financial relationships that could be construed as a potential conflict of interest.
Publisher’s Note
All claims expressed in this article are solely those of the authors and do not necessarily represent those of their affiliated organizations, or those of the publisher, the editors and the reviewers. Any product that may be evaluated in this article, or claim that may be made by its manufacturer, is not guaranteed or endorsed by the publisher.
Acknowledgments
We would like to thank two reviewers for their constructive and perceptive comments which we feel have improved the quality of the manuscript.
Supplementary Material
The Supplementary Material for this article can be found online at: https://www.frontiersin.org/articles/10.3389/fmars.2021.700534/full#supplementary-material
References
Andersen, K. H. (2020). Size-based theory for fisheries advice. ICES J. Mari. Sci. 77, 2445–2455. doi: 10.1093/icesjms/fsaa157
Bentley, J. W., Hines, D., Borett, S., Serpetti, N., Fox, C. J., Reid, D. G., et al. (2019). Diet uncertainty analysis strengthens model-derived indicators of food web structure and function. Ecol. Indic. 98, 239–250. doi: 10.1016/j.ecolind.2018.11.008
Bentley, J. W., Serpetti, N., Fox, C. J., Heymans, J. J., and Reid, D. G. (2020). Retrospective analysis od the influence of environmental drivers on commercial stocks and fishing opportunities in the Irish Sea. Fish. Oceanogr. 29, 415–435. doi: 10.1111/fog.12486
Bentley, J. W., Serpetti, N., Fox, C. J., Reid, D. G., and Heymans, J. J. (2018). Modelling the Food Web in the Irish Sea in the Context of a Depleted Commercial Fish Community. Part 1: Ecopath Technical Report. SAMS report 294. doi: 10.6084/m9.figshare.6323120.v1
Blanchard, J. L., Anderse, K. H., Scott, F., Hintzen, N. T., Piet, G., and Jennings, S. (2014). Evaluating targets and trade-offs among fisheries and conservation objectives using a multispecies size spectrum model. J. Appl. Ecol. 51, 612–622. doi: 10.1111/1365-2664.12238
Brander, K. M. (1980). Fisheries management and conservation in the Irish Sea. Helgol. Meeresuntersuchungen 33, 687–699. doi: 10.1007/bf02414789
Brander, K. M., and Bennett, D. B. (1986). Interactions between norway lobster (Nephrops norvegicus) and cod (Gadus morhua L.) and their fisheries in the irish sea. Can. Spec. Public. Fish. Aquatic Sci. 92, 269–281.
Connor, L., Matson, R., and Kelly, F. L. (2017). Length-weight relationships for common freshwater fish species in irish lakes and rivers. Biol. Environ. Proc. R. Irish Acad. 117B, 65–75. doi: 10.3318/bioe.2017.07
Daan, N. (1987). Multispecies versus single species assessments of north sea fish stocks. Can. J. Fish. Aquatic Sci. 44, 360–370. doi: 10.1139/f87-337
EU (2008). Directive 2008/56/EC of the European Parliament and of the Council of 17 June 2008 Establishing a Framework Community Action in the Field of Marine Environmental Policy (Marine Strategy Framework Directive). Belgium: European Union, 19–40.
EU (2013). Regulation (EU) No 1380/2013 of the European Parliament and of the Council of 11 December 2013 on the Common Fisheries Policy, Amending Council Regulations (EC) No 1954/2003 and (EC) No 1224/2009 and Repealing Council Regulations (EC) No 2371/2002 and (EC). Belgium: European Union, 22–61.
FAO (2008). Fisheries Management. 2. The Ecosystem Approach to Fisheries. 2.1 Best Practices in Ecosystem Modelling for Informing an Ecosystem Approach to Fisheries. Rome: FAO, 78.
Fulton, E. A., Link, J. S., Kaplan, I. C., Savina-Rolland, M., Johnson, P., Ainsworth, C., et al. (2011). Lessons in modelling and management of marine ecosystems: the atlantis experience. Fish Fish. 12, 171–188. doi: 10.1111/j.1467-2979.2011.00412.x
Gelman, A., Carlin, J., Stern, H., Dunson, D., Vehtari, A., and Rubin, D. (2013). Bayesian Data Analysis, Third Edn. Chapman: Hall/CRC.
Hall, S. J., Collie, J. S., Duplisea, D. E., Jennings, S., Bravington, M., and Link, J. S. (2006). A length-based multispecies model for evaluating community responses to fishing. Can. J. Fish. Aquatic Sci. 63, 1344–1359. doi: 10.1139/f06-039
Hollowed, A. B., Bax, N., Beamish, R. J., Collie, J., Fogarty, M., Livingston, P. A., et al. (2001). Are multispecies models an improvement on single species models for measuring fishing impacts on marine ecosystems? ICES J. Mari. Sci. 57, 707–719. doi: 10.1006/jmsc.2000.0734
Howell, D., Schueller, A. M., Bentley, J. W., Buchheister, A., Chagaris, D., Cieri, M., et al. (2021). Combining ecosystem and single-species modeling to provide ecosystem-based fisheries management advice within current management systems. Front. Mari. Sci. 7:11–63. doi: 10.3389/fmars.2020.607831
Hyder, K., Rossberg, A. G., Allen, J. I., Austen, M. C., Barciela, R. M., Bannister, H. J., et al. (2015). Making modelling count – increasing the contribution of shelf-seas community and ecosystem models to policy development and management. Mari. Policy 61, 291–302. doi: 10.1016/j.marpol.2015.07.015
ICES (1978). Report of the Irish Sea and Bristol Channel Working Group. Copenhagen: International Council for Exploration of the Seas.
ICES (2012a). Manual for the International Bottom Trawl Surveys. Copenhagen: Series of ICES Survey Protocols. SiSP 1-IBTS ICES.
ICES (2018a). Report of the International Bottom Trawl Survey Working Group. Available online at: http://www.ices.dk/sites/pub/Publication%20Reports/Expert%20Group%20Report/EOSG/2018/IBTSWG/IBTSWG%20Report%202018.pdf (accessed February, 2021).
ICES (2018b). 5.2 Celtic Seas EcoregionFisheries Overview, Including Mixed-Fisheries Considerations. Copenhagen: International Council for Exploration of the Seas, doi: 10.17895/ices.pub.4640
ICES (2019a). Working Group on the Assessment of Demersal Stocks in the North Sea and Skagerrak. Copenhagen: International Council for Exploration of the Seas.
ICES (2019b). Herring Assessment Working Group for the Area South of 62∘ N (HAWG). ICES Scientific Reports. 1:2. 971.
ICES (2019c). ICES Advice on Fishing Opportunities, Catch, and Effort. Cod (Gadus morhua) in Division 7.a (Irish Sea). Available online at: https://www.ices.dk/sites/pub/Publication%20Reports/Advice/2019/2019/cod.27.7a.pdf (accessed June 28, 2019)
ICES (2020a). ICES Working Group on Multispecies Assessment Methods, WGSAM. Available online at: https://www.ices.dk/community/groups/Pages/WGSAM.aspx (accessed February, 2021).
ICES (2020b). Greater North Sea EcoregionEcosystem Overview. Available online at: https://ices.dk/sites/pub/Publication%20Reports/Advice/2020/2020/EcosystemOverview_GreaterNorthSea_2020.pdf (accessed February, 2021).
ICES (2020c). Baltic Sea EcoregionEcosystem Overview. Available online at: https://ices.dk/sites/pub/Publication%20Reports/Advice/2020/2020/EcosystemOverview_BalticSea_2020.pdf (accessed February, 2021).
Kristensen, K., Nielsen, A., Berg, C. W., Skaug, H., and Bell, B. M. (2016). TMB: automatic differentiation and laplace approximation. J. Statist. Soft. 70, 1–21. doi: 10.18637/jss.v070.i05
Lewy, P., and Vinther, M. (2004). A Stochastic Age-Length-Structured Multispecies Model Applied to North Sea Stocks. Available online at: https://www.ices.dk/sites/pub/CM%20Doccuments/2004/FF/FF2004.pdf (accessed February, 2021).
Lorenzen, K. (1996). The relationship between body weight and natural mortality in juvenile and adult fish: a comparison of natural ecosystems and aquaculture. J. Fish Biol. 49, 627–647. doi: 10.1111/j.1095-8649.1996.tb00060.x
Marshak, A. R., Link, J. S., Shuford, R., Monaco, M. E., Johannesen, E., Bianchi, G., et al. (2017). International perceptions of an integrated, multi-sectoral, ecosystem approach to management. ICES J. Mar. Sci. 74, 414–420. doi: 10.1093/icesjms/fsw214
Marshall, K. N., Koehn, L. E., Levin, P. S., Essington, T. E., and Jensen, O. P. (2019). Inclusion of ecosystem information in US fish stock assessments suggests progress toward ecosystem-based fisheries management. ICES J. Mar. Sci. 76, 1–9. doi: 10.1093/icesjms/fsy152
NOAA (2016). Ecosystem Based Fisheries Management Policy of the National Marine Fisheries Service. Washington, DC: NOAA, 01–120.
Payne, M. R., Hobday, A. J., MacKenzie, B. R., Tommasi, D., Dempsey, D. P., Fässler, S. M. M., et al. (2017). Lessons from the first generation of marine ecological forecast products. Front. Mari. Sci. 4:289.
Pinnegar, J. K. (2014). An Integrated Database & Portal for Fish Stomach Records. Centre for Environment, Fisheries & Aquaculture Science. Cefas Contract Report: DP332, C3746, ME1228.
Plaganyi, E. E., Punt, A. E., Hillary, R., Morello, E. B., Thebaud, O., Hutton, T., et al. (2012). Multispecies fisheries management and conservation: tactical applications using models of intermediate complexity. Fish Fish. 15, 1–22. doi: 10.1111/j.1467-2979.2012.00488.x
Plagányi, ÉE. (2007). Models for an Ecosystem Approach to Fisheries. FAO Fisheries Technical Paper. Rome: FAO.
Punt, A. E., Smith, D. C., and Smith, A. D. M. (2011). Among-stock comparisons for improving stock assessments of data-poor stocks: the ‘Robin Hood’ approach. ICES J. Mari. Sci. 68, 972–981. doi: 10.1093/icesjms/fsr039
Rochet, M.-J., Collie, J. S., Jennings, S., and Hall, S. J. (2011). Does selective fishing conserve community biodiversity? Predictions from a length-based multispecies model. Can. J. Fish. Aquatic Sci. 68, 469–486. doi: 10.1139/f10-159
Scott, F., Blanchard, J. L., and Andersen, K. H. (2014). Mizer: an R package for multispecies, trait-based and community size spectrum ecological modelling. Methods Ecol. Evolu. 5, 1121–1125. doi: 10.1111/2041-210x.12256
Silva, J., Ellis, J. F., and Ayers, R. A. (2013). Length-weight relationships of marine fish collected from around the British Isles. Sci. Ser. Tech. Rep. Cefas Lowestoft 150:109.
Skern-Mauritzen, M., Ottersen, G., Handegard, N., Huse, G., Dingsør, G., Stenseth, N. C., et al. (2016). Ecosystem processes are rarely included in tactical fisheries management. Fish Fish. 17, 165–175. doi: 10.1111/faf.12111
Spence, M. A., Bannister, H. J., Ball, J. E., Dolder, P. J., Griffiths, C. A., and Thorpe, R. B. (2020). LeMaRns: a length-based multi-species analysis by numerical simulation in R. PLoS One 15:e0227767. doi: 10.1371/journal.pone.0227767
Spence, M. A., Blackwell, P. G., and Blanchard, J. L. (2016). Parameter uncertainty of a dynamic multispecies size spectrum model. Can. J. Fish. Aquatic Sci. 73, 589–597. doi: 10.1139/cjfas-2015-0022
Spence, M. A., Blanchard, J. A., Rossberg, A. G., Heath, M. R., Heymans, J. J., Mackinson, S., et al. (2018). A general framework for combining ecosystem models. Fish Fish. 19, 1031–1042. doi: 10.1111/faf.12310
Spence, M. A., Thorpe, R. B., Blackwell, P. G., Scott, F., Southwell, R., and Blanchard, J. L. (2021). Quantifying uncertainty and dynamical changes in multi-species fishing mortality rates, catches and biomass by combining state- space and size-based multi-species models. Fish Fish. 22, 667–681. doi: 10.1111/faf.12543
Thorpe, R. B. (2019). What is multispecies MSY? A worked example from the North Sea. J. Fish Biol. 94, 1011–1018. doi: 10.1111/jfb.13967
Thorpe, R. B., and De Oliveira, J. A. A. (2019). Comparing conceptual frameworks for a fish community MSY (FCMSY) using management strategy evaluation - an example from the north sea. ICES J. Mari. Sci. 76, 813–823.
Thorpe, R. B., Dolder, P. J., Reeves, S., Robinson, P., and Jennings, S. (2016). Assessing fishery and ecological consequences of alternate management options for multispecies fisheries. ICES J. Mari. Sci. 73, 1503–1512.
Thorpe, R. B., Jennings, S., and Dolder, P. J. (2017). Risks and benefits of catching pretty good yield in multispecies mixed fisheries. ICES J. Mari. Sci. 74, 2097–2106.
Thorpe, R. B., Le Quesne, W. J. F., Luxford, F., Collie, J. S., and Jennings, S. (2015). Evaluation and management implications of uncertainty in a multispecies size-structured model of population and community responses to fishing. Methods Ecol. Evol. 6, 49–58.
Trijoulet, V., Fay, G., Kurti, K. L., Smith, B., and Miller, T. J. (2019). Performance of multispecies assessment models: insights on the influence of diet data. ICES J. Mari. Sci. 76, 1464–1476.
Vernon, I., Goldstein, M., and Bower, R. (2014). Galaxy formation : bayesian history matching for the observable universe. Statist. Sci. Astron. Group 29, 81–90.
Waggitt, J. J., Evans, P. G. H., Andrade, J., Banks, A. N., Boisseau, O., Bolton, M., et al. (2019). Distribution maps of cetacean and seabird populations in the north-east atlantic. J. Appl. Ecol. 57, 253–269. doi: 10.1111/1365-2664.13525
Walker, N. D., Maxwell, D. L., Le Quesne, W. J. F., and Jennings, S. (2017). Estimating efficiency of survey and commercial trawl gears from comparisons of catch-ratios. ICES J. Mari. Sci. 74, 1448–1457.
Keywords: multispecies, advice, Irish Sea, models, assessment, ICES advice
Citation: Spence MA, Dolder PJ, Nash R and Thorpe RB (2021) The Use of a Length-Structured Multispecies Model Fitted Directly to Data in Near-Real Time as a Viable Tool for Advice. Front. Mar. Sci. 8:700534. doi: 10.3389/fmars.2021.700534
Received: 26 April 2021; Accepted: 01 September 2021;
Published: 28 September 2021.
Edited by:
Jie Cao, North Carolina State University, United StatesReviewed by:
Jason Marc Cope, National Marine Fisheries Service (NOAA), United StatesChongliang Zhang, Ocean University of China, China
Copyright © 2021 Spence, Dolder, Nash and Thorpe. This is an open-access article distributed under the terms of the Creative Commons Attribution License (CC BY). The use, distribution or reproduction in other forums is permitted, provided the original author(s) and the copyright owner(s) are credited and that the original publication in this journal is cited, in accordance with accepted academic practice. No use, distribution or reproduction is permitted which does not comply with these terms.
*Correspondence: Robert B. Thorpe, cm9iZXJ0LnRob3JwZUBjZWZhcy5jby51aw==