 Xuekai Zhang
 Chao Fan
 Xingzhi Zhang2
 Zhaoping Wang
- 1Fisheries College, Ocean University of China, Qingdao, China
- 2Guangxi Key Laboratory of Aquatic Genetic Breeding and Healthy Aquaculture, Guangxi Academy of Fisheries Sciences, Nanning, China
Light sensitivity is important for marine benthic invertebrates, and it plays a vital role in the oysters settling. Generally, the emerging of eyespot is a signal of oyster larvae settling, while like most of the other coastal species, the oysters are threatened by artificial light pollution. Crassostrea gigas and Crassostrea sikamea are two oyster species naturally distributed in China, and their hybrids are potential material for oyster cross-breeding. Therefore, we investigated the phototaxis of hybrid eyespot larvae and eyeless larvae under different light intensities and wavelengths to uncover how light affects their behaviors. The results indicated that hybrid oyster larvae had positive phototaxis to specific light intensity and wavelength. We further concluded that 5 lx was the positive phototaxis light intensity for the eyeless hybrid larvae, and that the acceptable light intensity range of the eyespot hybrid larvae expanded to 5–10 lx, but no higher than 15 lx; besides, the hybrid larvae behaved negatively to the light over 25 lx. The present study also suggested the positive effects of green light on larvae gathering and the induction of red light on eyespot larvae settling. In conclusion, our study may contribute to the understanding of phototaxis of hybrid oyster larvae, as well as the further perspective of light pollution on benthic communities and coastal system restoration.
Introduction
The environment has an attractive impact on the development of behavioral patterns, evolution, and morphology (Brown and Braithwaite, 2005). Light, as one of the most basic environmental factors, is the compelling one that has massive ecological functions. Generally, light is an energy signal that directly or indirectly affects the growth and metabolism of organisms. In the process of biological evolution, many animals have gradually formed a biological clock to the rhythmic changes of light that are largely mediated by the occurrence of the photosensitive organ (Naylor, 1999; Gaston et al., 2017; Hobbs et al., 2021).
In nature, animals have evolved various delicate light sensors to adapt to the environment. The pediveliger larva is the last pelagic phase before oysters settling, during which the oyster larvae develop foot and also a pigmented eyespot. Eyespot is the simplest animal eye that is composed of sensory cells and shading pigment cells (Jékely et al., 2008). Ultrastructural studies on the epidermal eyespots of Microstomum lineare and Oncholaimus vesicarius show that pigment cells envelop the processes of the sensory cells, which indicates that the pigmented eyespots have dual functions of photoreceptors and chemoreceptors (Burr and Burr, 1975; Palmberg et al., 1980). Eyespot structure is characteristic of the pelagic larvae for invertebrates in the ocean, though eyespots cannot form images but enable animals to sense the direction of light that mediates the phototaxis of larvae (Thorson, 1964; Jékely et al., 2008).
Light is an electromagnetic radiation that occurs over an extremely wide spectrum, ranging from 10–2 nanometers to meters. Visible light narrowly ranges from approximately 700 nm for red light to 400 nm for violet light in the broad spectrum. Light intensity represents the amplitude of light with the same wavelength, and light wavelength is a property of light that determines the colors of the light (Sliney, 2016). For most marine invertebrates, light can influence the development of their pelagic larvae. A previous study on the response of 141 different oceanic larvae to light suggested that 82% of these larvae respond positively to light, but too much light caused photonegative behaviors (Thorson, 1964). In terms of light wavelength, invertebrate larvae also have notable features of wavelength-dependent phototaxis (Kim et al., 2021). Baker and Mann (1998) suggested that planktonic invertebrates are usually unresponsive, or only weakly responsive, to long-wavelength lights, but the Crassostrea virginica larvae can respond to most of the visible lights.
As a mixture of visible light, ultraviolet, and infrared, sunlight is susceptible to plankton and dissolved organic matters in water, which results in a variety of light intensities and colors on different water layers (Blaxter, 1968). Previous studies indicated that the phototactic behaviors of plankton are highly related to the absorption pattern of different wavelengths by eyespot (Forward and Cronin, 1979; Marsden, 1988; Kim et al., 2018). It was reported that light wavelength ranging from 500 to 650 nm can be efficiently absorbed by the eyespot of Crassostrea gigas larvae, especially in the pigmented area (Kim et al., 2021). The RGB color is an additive color model of which the three primary colors (TPCs; red, green, and blue) are added together in various ways to reproduce a broad array of colors (Ibraheem et al., 2012). By this color model, computers can visualize what the human does in the hue and lightness of colors. According to the principle of liquid crystal display (LCD) processing, displays can emit 700 (red, R), 546.1 (green, G), and 435.8 nm wavelength (blue, B) (Trussell et al., 2005) that offers a reliable artificial light source for the zooplankton phototaxis research.
Recently, light pollution has sparked scientific interests in many ways, one of which is the negative effect on the biological processes of the marine environment. Although the negative impacts of artificial light have been reported in the marine environment, it remains largely unknown how marine organisms in coastal areas had been impacted (Davies et al., 2014; Bolton et al., 2017; O’Connor et al., 2019). As the dominant species in the intertidal zone, the oysters occupy a precise niche in the coastal ecosystem that is also a potential indicator of light pollution. Besides, the oyster is a worldwide aquaculture shellfish with high commodity value as a protein source. The wild hybrid of C. gigas and Crassostrea sikamea has been identified in Suncheon Bay, Korea (Hong et al., 2012) and the northern Ariake Sea, Japan (Hedgecock et al., 1999), where C. gigas and C. sikamea natively live together. Unsurprisingly, both C. gigas and C. sikamea are native species in China, and they are complementary to each other in ecological habits (Wang et al., 2013). As a potential aquaculture variety, the biological characteristics of C. gigas and C. sikamea hybrids need to be further explored (Gaffney and Allen, 1993; Xu et al., 2019).
In this study, we firstly investigated the phototaxis of the C. sikamea and C. gigas hybrid larvae in terms of visible light intensity and light wavelength. Then, we analyzed the relationship between computerized TPCs and the phototaxis of hybrid larvae by the pathway analysis.
Materials and Methods
Eyespot Larvae Recruitment
The C. gigas and C. sikamea were collected from oyster farms located in Rushan, Shandong (36.41°N, 121.36°E) and Beihai, Guangxi (21.46°N, 109.39°E), respectively, in China. Oyster broodstocks were collected before March 2019, then identified by restriction fragment length polymorphism (RFLP)–PCR, and spawned in May 2019. Indoor maturation was deployed to ensure the synchronization of gametes. The hybridization can only be complete between C. sikamea eggs and C. gigas sperms, but not the opposite way (Banks et al., 1994; Xu et al., 2019).
Daily management of the hybrid larvae referenced to the procedure described by Xu et al. (2019). In brief, the fertilized eggs were hatched for 20 h, and hybrid larvae were reared in sand-filtered seawater and initially fed with Isochrysis galbana; when the mean shell height of hybrid larvae exceeded 120 μm, a mixture of I. galbana and Platymonas subcordiformis was added. In the experiment, the eyespots of hybrid larvae emerged around day 24.
Light Source Calibration
Calibrating of Light Intensity and GMTPC
The light source images were built by Adobe Photoshop (PS; Adobe Inc., Delaware, United States; Figure 1A) based on geometric mixed TPCs (GMTPC). The default quantized value of R/G/B (255/255/255) was defined as 100%, then graded the GMTPC image by 10%, and measured the light intensity of each gradient. After that, the fitting formula was calculated statistically (Table 1).

Figure 1. Light intensity adjustment for RGB color model on TFT-LCD display. (A) The quadratic fitting line of light intensity and GMTPC gradients. (B) The quadratic fitting lines of light intensity with TPCs and GMSCs gradients.
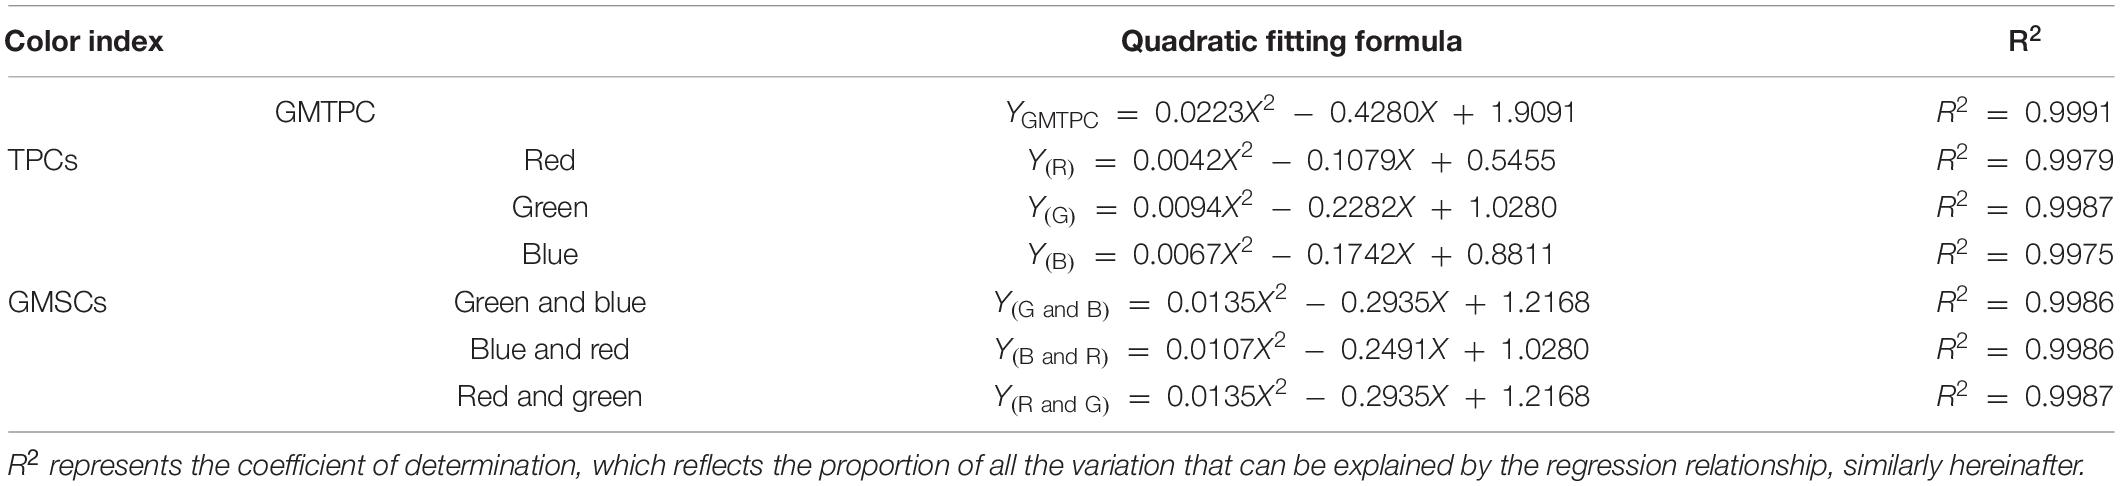
Table 1. The fitting formula of light intensity with the different gradients of GMTPC, TPC, and GMSC.
Calibrating of Light Intensity With TPCs and GMSCs
The light source images based on TPCs and geometric mixed secondary colors (GMSCs) were also built by PS. For the TPCs, we defined the default quantized values of R = 255, G = 255, and B = 255 as 100%; similarly, the GMSCs quantized in R/G = 255/255, G/B = 255/255, and B/R = 255/255 were defined as 100%, then graded the TPC and GMSC images by 10%, and measured the light intensity. After that, the fitting formulas were calculated statistically (Figure 1B and Table 1).
Experimental Design
This study was deployed in a dark room, and each experiment was repeated three times. The hybrid larvae were collected at day 26 with a 200-micrometer sieve with a mean shell height of 307.73 ± 29.63 μm. In this condition, we obtained a mixture of hybrid eyespot larvae and eyeless larvae, of which the eyespot can be easily distinguished under a microscope. Hybrid oyster larvae were placed and aerated in a 20-liter bucket as a larvae pool, and the larvae density was approximately 57.5 ± 8.0 ind/ml. The first and second phases were light intensity experiments. The first phase was set to determine the lighting time and narrow the range of light intensity. The second phase was set to find the specific intensity light that hybrid larvae positively respond to. Based on the above results, the third phase explored the phototaxis of hybrid larvae to various wavelengths at a certain intensity.
The Photosensitivity Experiment of Larvae to Light Intensity
In terms of the first phase, light intensities were graded at 25/50/75/100 lx, and the quantized RGB values were calculated by the fitting formula “YGMTPC” in Table 1, then converting parameters into images by PS (Figure 2B and Table 2). After that, 300 ml of larvae was transferred into a Petri dish from the larvae pool, then stirred, and left for 5–10 min to ensure that the hybrid larvae were evenly distributed in the Petri dish. Turning on the display, hybrid larvae were sampled after 30 and 60 min, respectively.
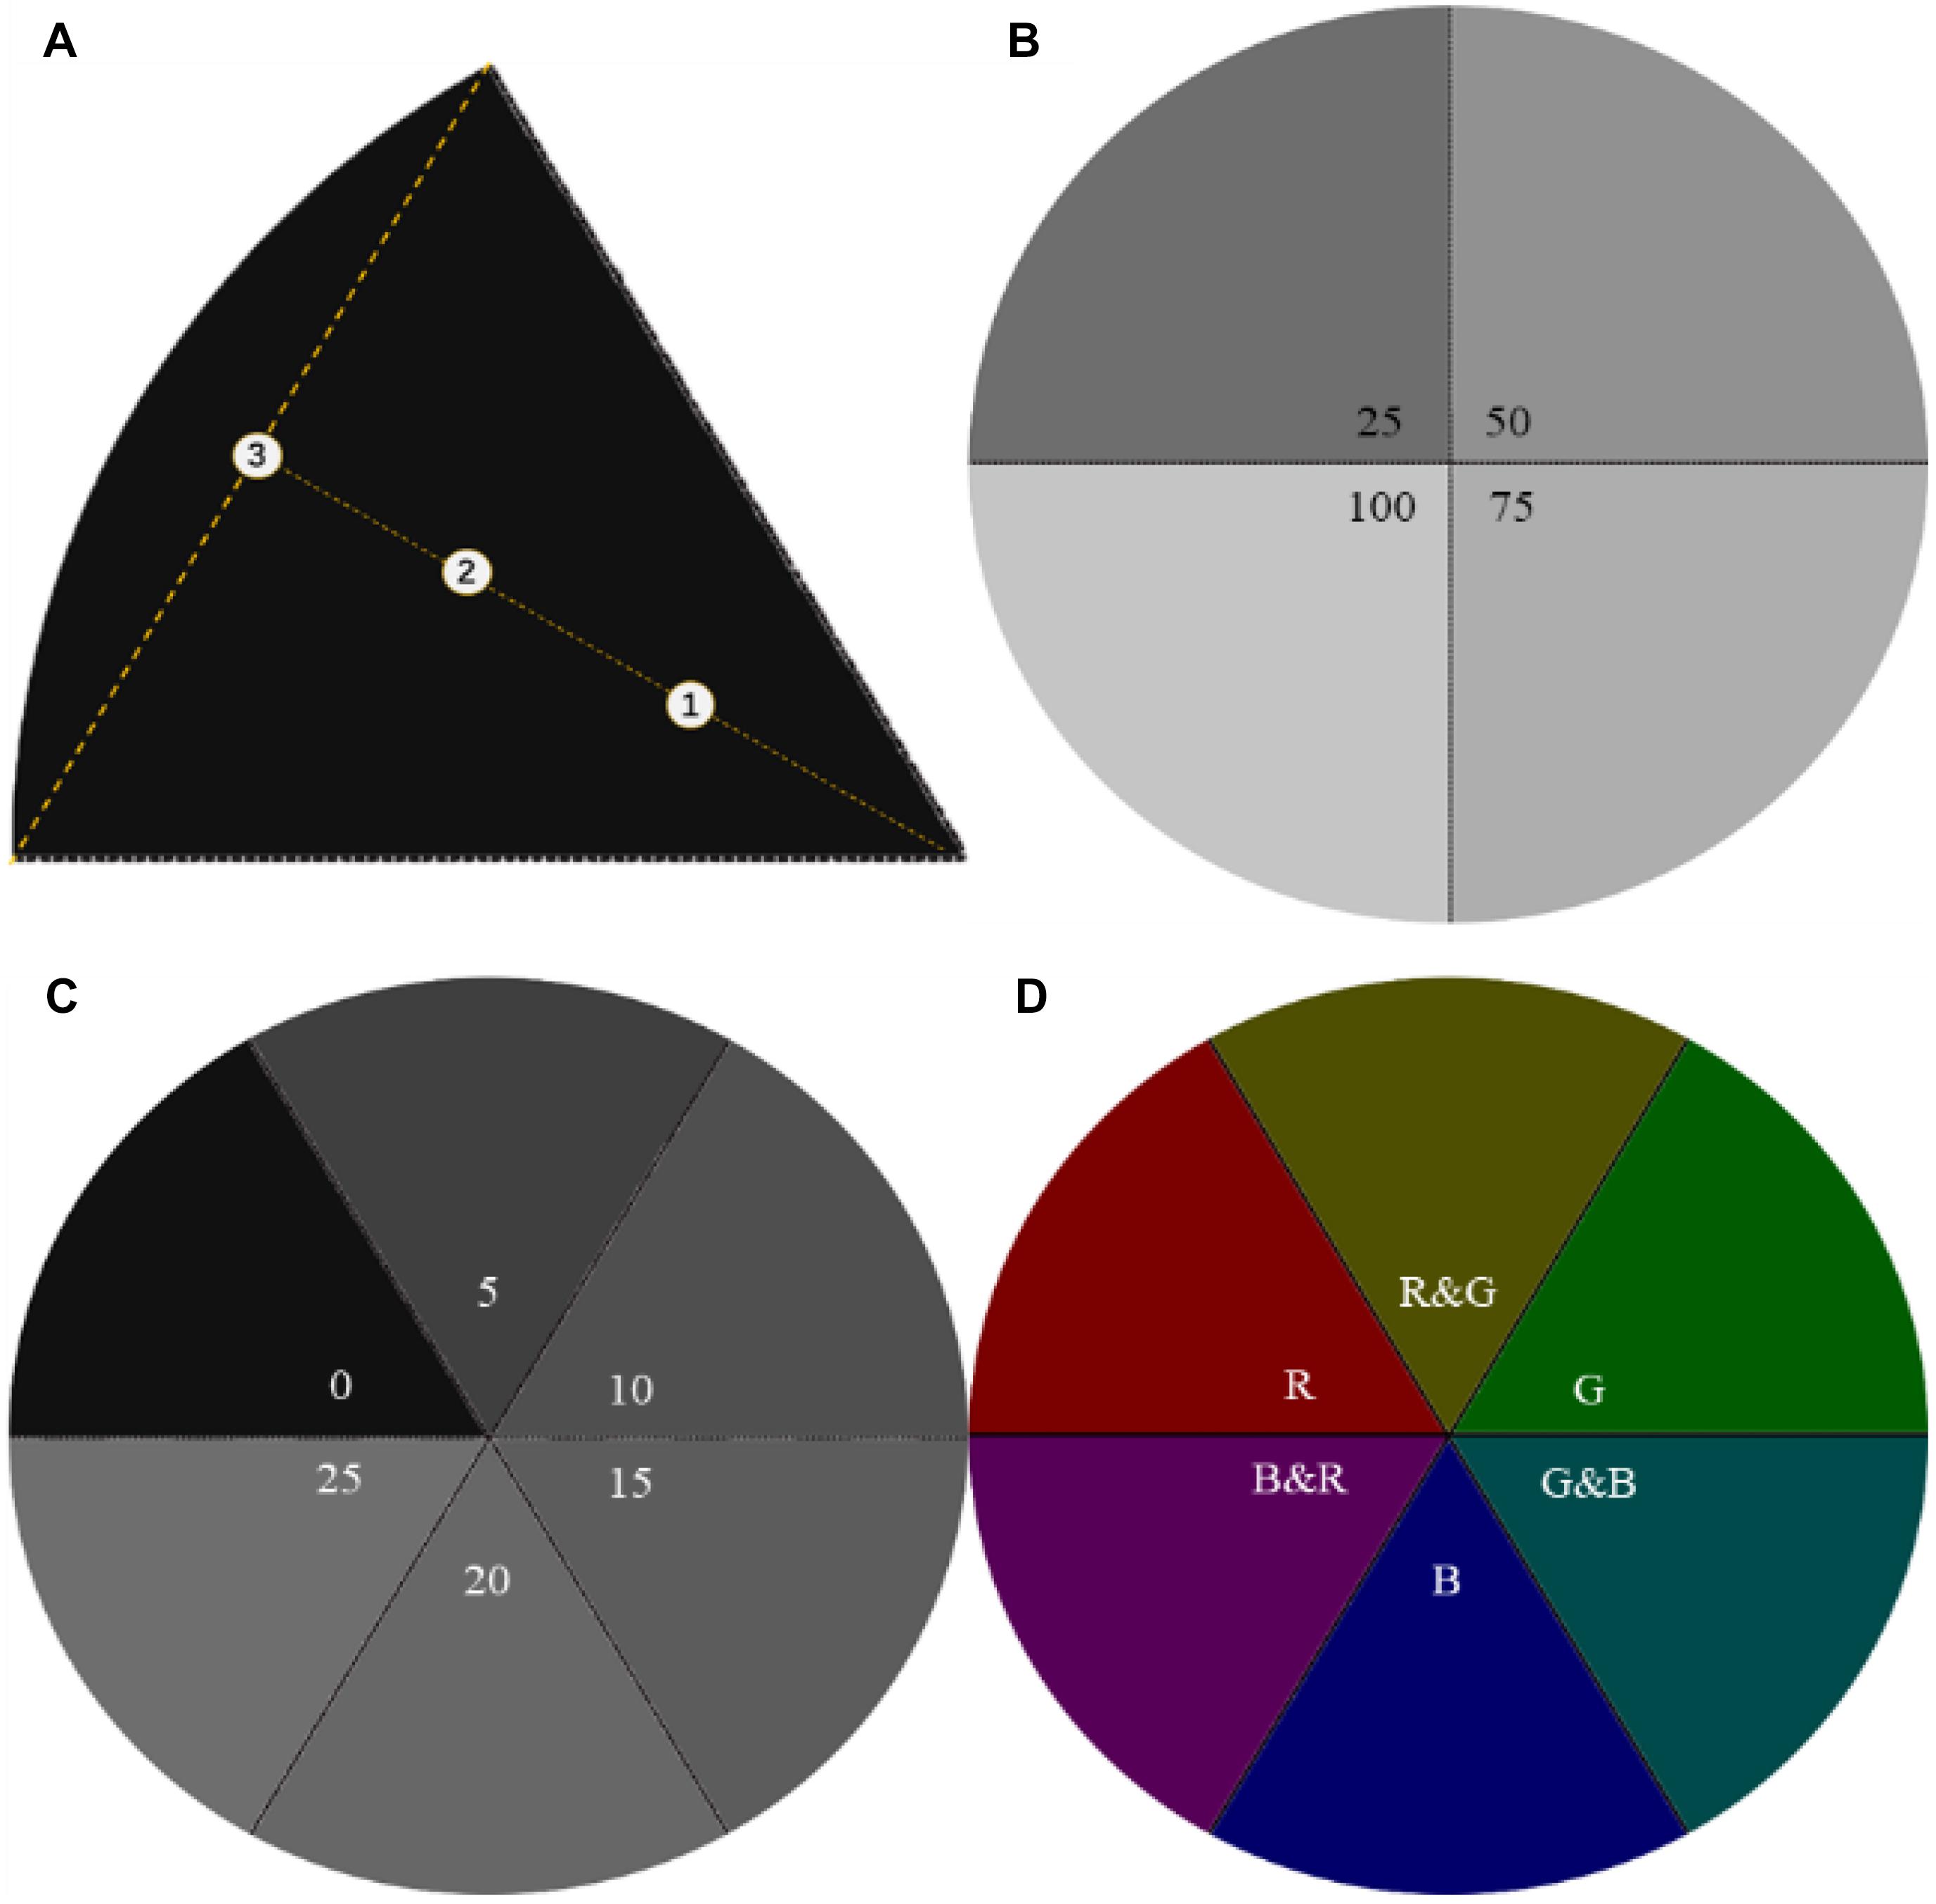
Figure 2. Sampling points and light source images. (A) The markers ➀➁➂ are the sampling points on the centerline in a sector, and ➀➁ is the trisection of the vertical. (B) Light intensity of GMTC at 25/50/75/100 lx in the first phase. (C) Light intensity of GMTC at 0/5/10/15/20/25 lx in the second phase. (D) The three primary colors (TPCs) and the geometric mixed secondary colors (GMSCs) at 5 lx in the third phase.
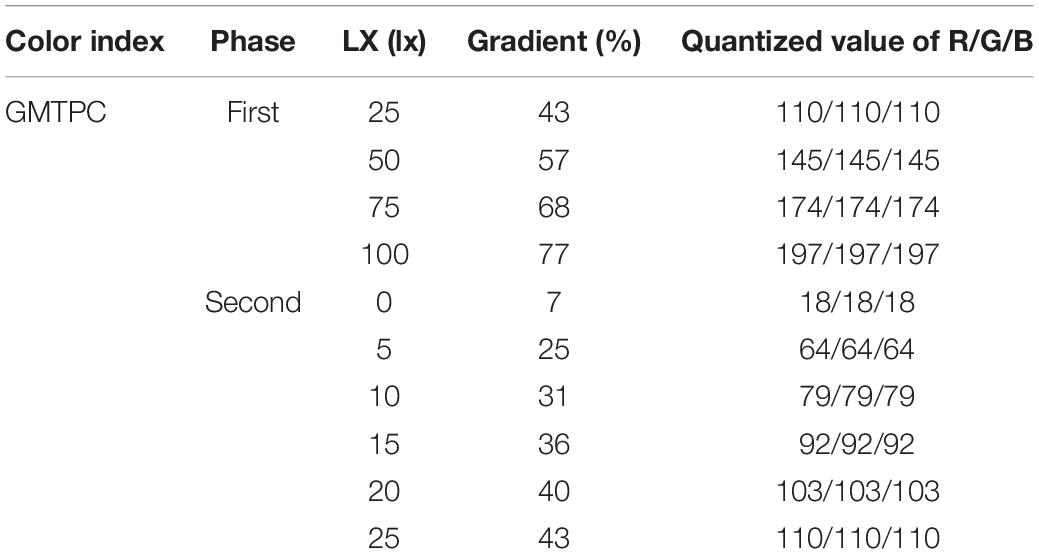
Table 2. The gradient and quantized RGB values of fixed light intensity for the first phase and second phase.
The range of light intensity was narrowed to 0–25 lx in the first experiment. Thus, the light intensities in the second phase were graded at 0/10/15/20/25 lx, and the quantized RGB values are calculated by the fitting formula “YGMTPC” in Table 1, then converting parameters into images by PS (Figure 2C and Table 2). The hybrid oyster larvae were only sampled after 60 min of lighting in this section. All larvae were distinguished and counted under a microscope.
The Photosensitivity Experiment of Larvae to Different Wavelengths of Light
The second experiment finalized the optimum light intensity as 5 lx. In terms of the third phase, the TPCs and GMSCs were fixed, and the quantized RGB values were calculated by the fitting formulas in Table 1. The fixed parameters were converted into images by PS (Figure 2D and Table 3). The hybrid larvae were deployed and transferred in the same way as that of section “The Photosensitivity Experiment of Larvae to Light Intensity.” Then, the display was turned on and the larvae were sampled after 60-minute lighting. All larvae were distinguished and counted under a microscope.
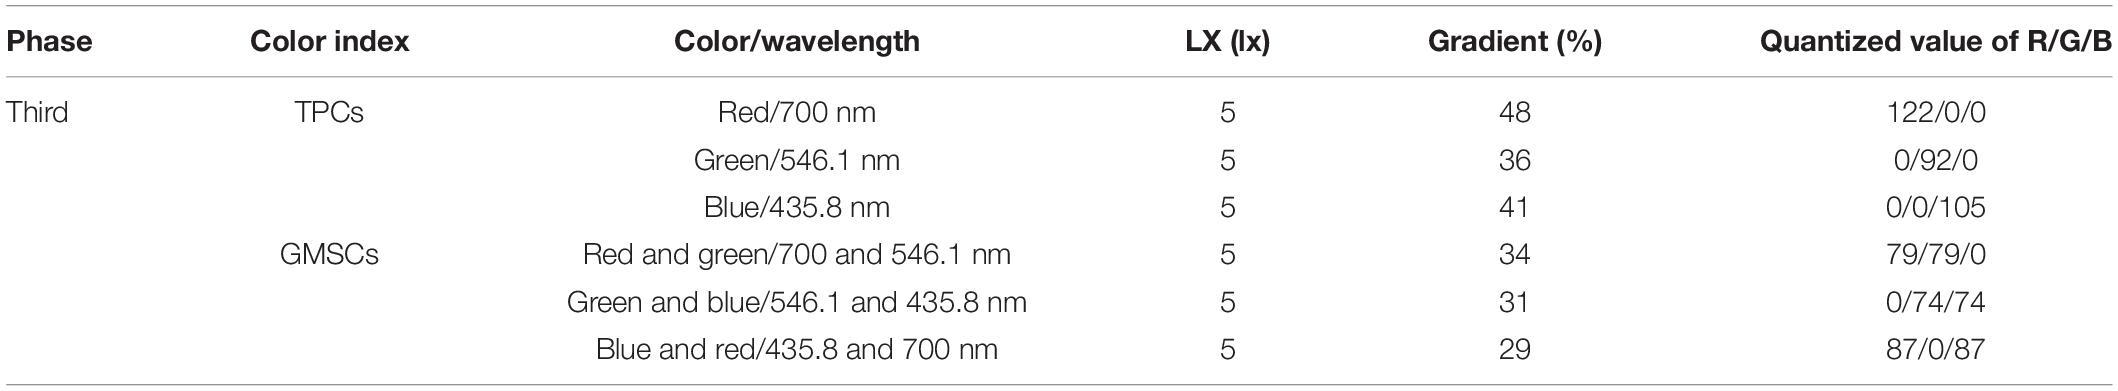
Table 3. The gradient and quantized RGB values of the TPCs and the GMSCs at 5 lx for the third phase.
Data Collection
The lights were emitted by light-emitting diodes (LEDs) inside of the thin-film transistor-liquid crystal display (TFT-LCD, B156HAN02.1; AU Optronics Co., China), RGB (vertical strip), maximum brightness (250 cd/m2), contrast (800:1), and gamma value (2.2); light intensity was measured by a smart sensor photometer (AS813; Arco Electronics Ltd., China) in lux, with an accuracy of ± 5%rdg; the size of the Petri dish is φ1,500 mm, with a depth of 31 mm, and made of borosilicate; larvae were sampled with 1,000 μl Eppendorf pipettes in the middle layer of water. Three sampling points were set in each sector, where points were located on the centerline of equal intervals (Figure 2A).
Statistical Analysis
Normality and homogeneity of variance assumptions for statistical data were tested using the Shapiro–Wilk and Bartlett tests, respectively (with R package “car” version 3.0-8). A: Permutational multivariate analysis of variance (PERMANOVA) with 1,000 permutations per analysis based on Euclidean distance was performed to evaluate the changes in larvae distribution and proportion after light stimulation, and PERMANOVA pairwise comparison tests were run if necessary (Anderson, 2014). PERMANOVA was performed with R package “vegan 2.5-7” version 4.0.3. B: One-way analysis of variance (ANOVA) was carried out to test the difference in larvae counts between sectors. Where significant effects were found, Duncan’s new multiple range comparison was performed to compare the difference between groups with R package “agricolae” version 1.3-3. C: Path analysis (Gauss–Doolittle algorithm) was run to analyze the coefficient of light wavelength to larvae phototaxis with R package “agricolae” version 1.3-3. D: Pearson concordance index analysis was performed to analyze the correlation between larvae distribution and TPCs with R package “agricolae” version 1.3-3. Computations were running in R version 4.0.3 (64 bit) for Windows, and all statistical analyses were carried out at a significance level of p < 0.05.
Results and Discussion
How Does Light Intensity Affect the Phototaxis of Hybrid Oyster Larvae?
The results showed that both distributions of eyespot and eyeless hybrid oyster larvae were significantly affected by light at 25/50/75/100 lx with time (p < 0.001). The distribution change of total larvae and eyespot larvae could be explained at a relatively high level by time (R2 = 0.968 and R2 = 0.922, respectively). The subsequent PERMANOVA pairwise comparisons test showed that the F-value for the comparison of 0 and 60 min was greater than that of the other two comparisons, indicating that the polarized level of total larvae and eyespot larvae distribution was increased at 60 min; on the contrary, the level of polarized distribution for eyeless larvae was reduced (Table 4). Similar to the first phase, the distribution of total larvae, eyespot larvae, and eyeless larvae changed significantly under 0/5/10/15/20/25 lx in the second experiment (p < 0.01). The F-value showed that the distribution of eyespot larvae changed visibly, and F-values were ordered as F(total larvae) > F(eyespot larvae) > F(eyeless larvae) (Table 5). The changes in larvae distribution suggested that hybrid larvae were sensitive to light, and that the response could be traced within only 30 min and intensified later.
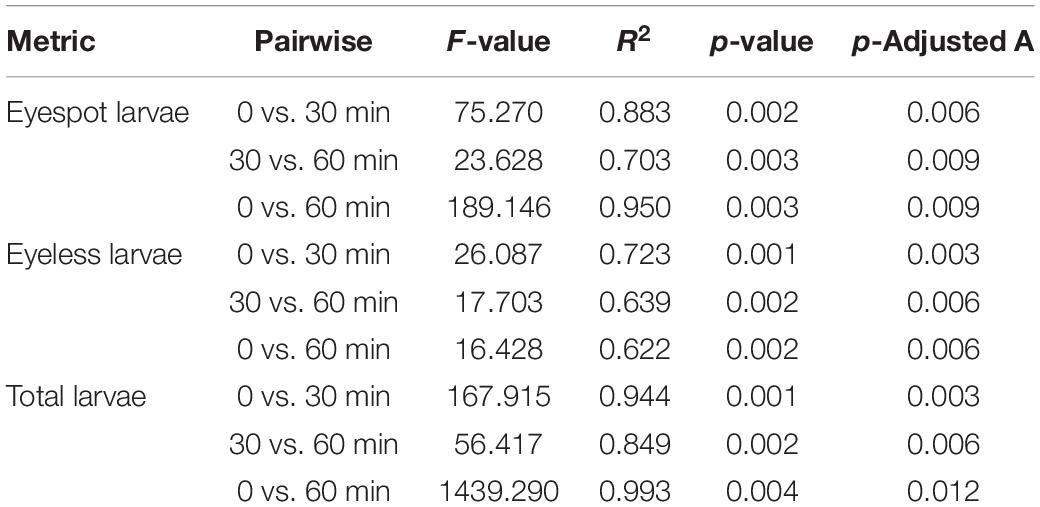
Table 4. PERMANOVA pairwise comparison analysis for the distribution difference in eyespot larvae, eyeless larvae, and total larvae of the hybrid oyster with time.
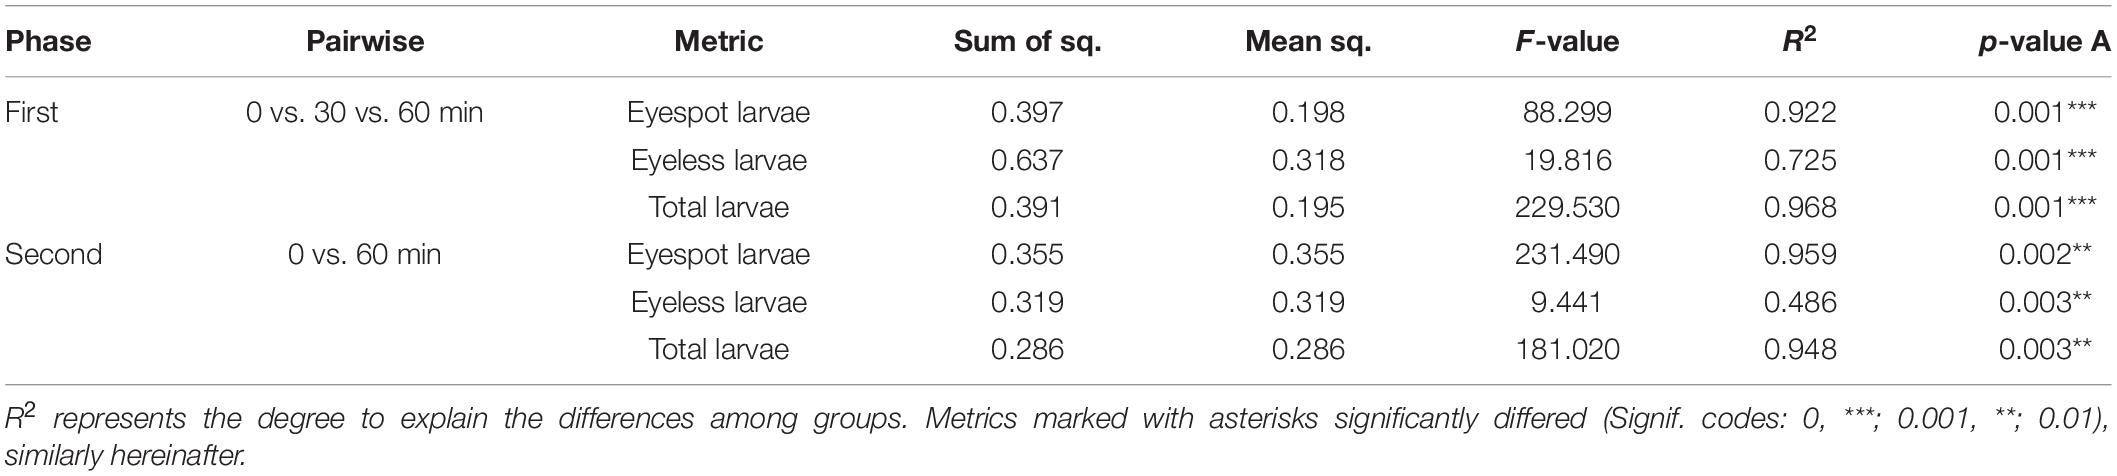
Table 5. PERMANOVA analysis for the distribution difference in eyespot larvae, eyeless larvae, and total larvae of the hybrid oyster with time.
For the first phase, massive larvae with eyespot moved to the area at 50 lx light after 30 min where eyespot larvae density was significantly higher than the other sectors. However, there was no significant difference in the distribution of eyeless larvae compared between the 25 lx sector, 50 lx sector, and 75 lx sector. In terms of total larvae, when the lighting time extended to 60 min, the density of total larvae amounted to 205.0 ± 17.5 and 224.0 ± 10.0 (per 1.5 ml) in the 25 lx sector and 50 lx sector, respectively, resulting in no significant difference between the two sectors (Table 6 and Figure 3A). As the extension of lighting time, there was no significant difference in the distribution of eyespot larvae between the 25 lx sector and 50 lx sector (p > 0.05; Table 6). The results showed that the density of eyeless larvae was positively correlated with light intensity in the 30-min group (except for the 100 lx sector); interestingly, the correlation was reversed in the 60-minute group (Figure 3A).
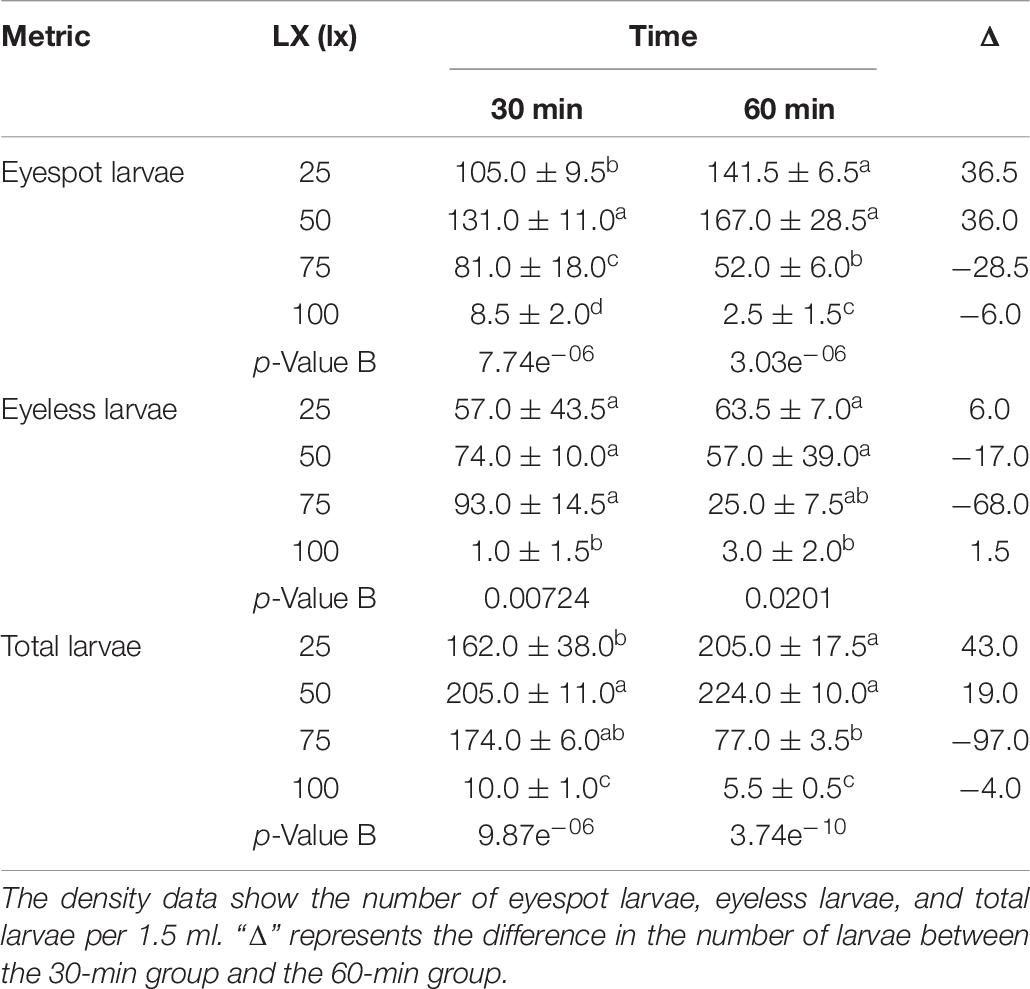
Table 6. The density distribution of eyespot larvae, eyeless larvae, and total larvae of the hybrid oyster with time and light intensity (25/50/75/100 lx).
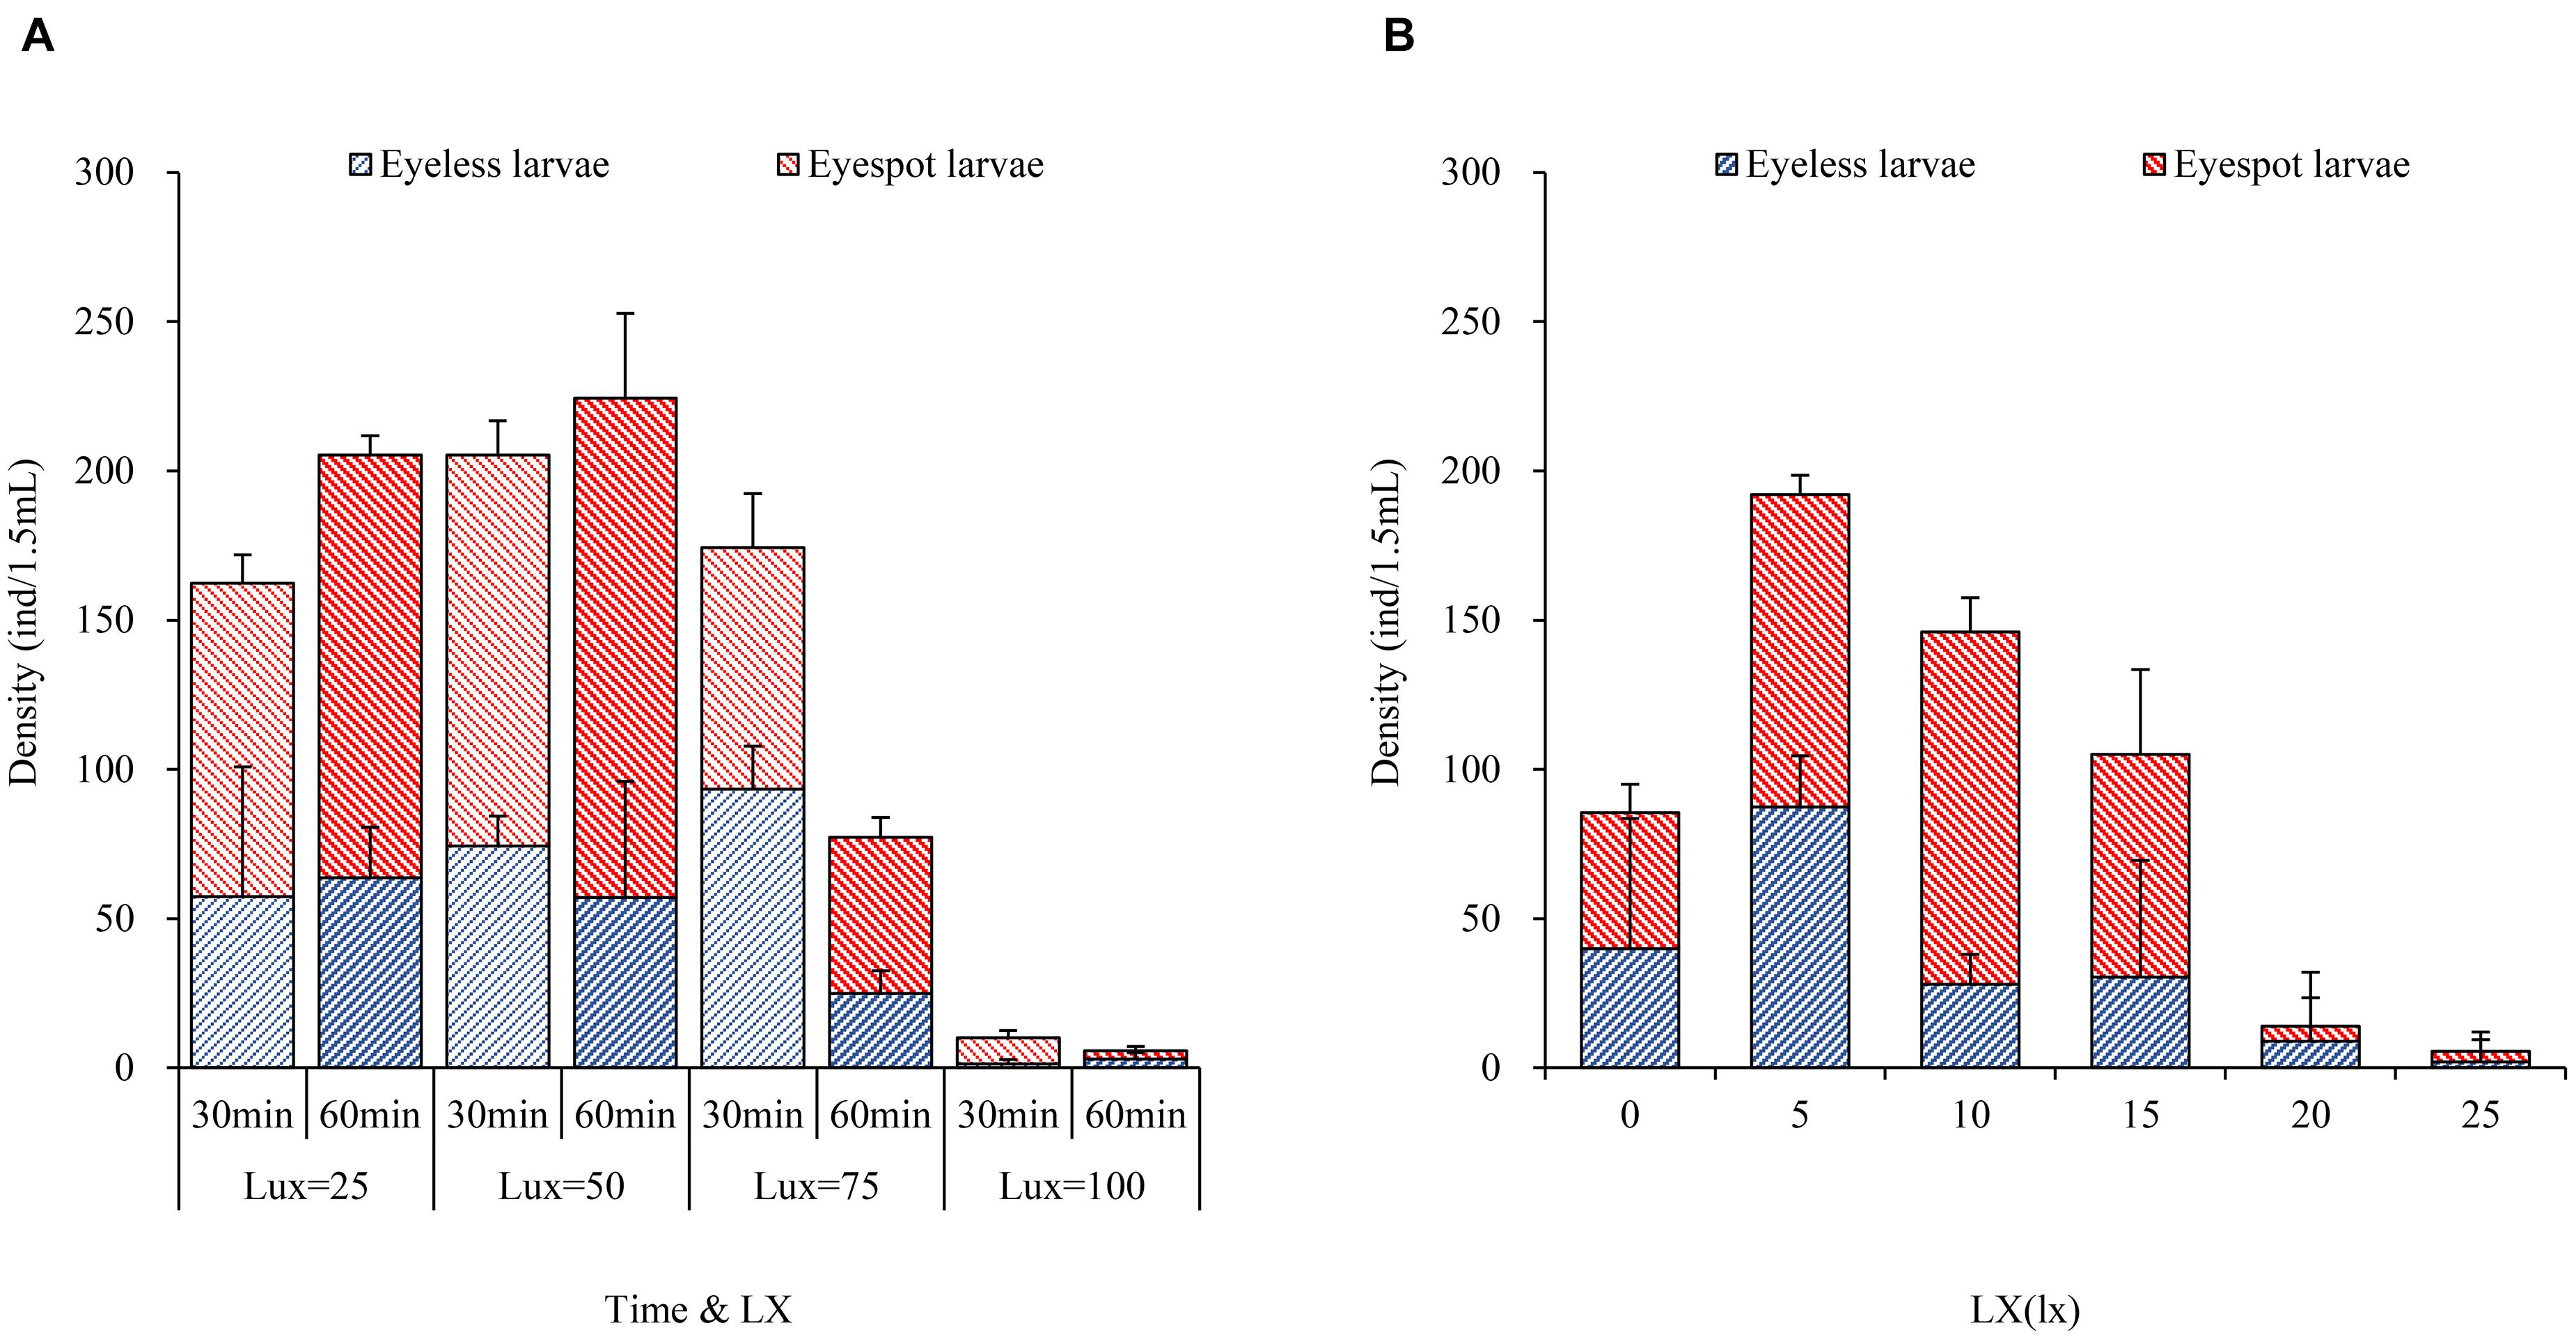
Figure 3. The bar plots of hybrid oyster larvae distribution to light intensity. (A) The density of eyespot larvae and eyeless larvae with time and light intensity. (B) The density of eyespot larvae and eyeless larvae with light intensity.
In general, zooplankton will migrate to the depth layer during daylight to avoid the threats of visual predation and surfacing at night to feed (Medcof, 1955; Forward, 1988; Hobbs et al., 2021); thus, many of them evolved to adapt to low light environments and cannot endure high-intensity light. Kim et al. (2014) found that reproduction of Brachionus plicatilis will be negatively affected by light over 0.5 W/m2, and Tielmann et al. (2017) reported that larval Sander lucioperca had significantly higher natural mortality when reared under a light intensity of 2,500 lx. Similarly, in the present study, in terms of total larvae when the light intensity was over 25 lx and lighting time exceeded 30 min, oyster larvae would move to the weakest light area that was the evidence of negative phototaxis.
In the second phase, the 5 lx light sector gathered the most larvae of 192.0 ind (±23.5 ind per 1.5 ml), which was significantly higher than the other light intensities (p < 0.01); the highest density of eyespot larvae was sampled in the 10 lx sector (118.0, ± 4.0 ind per 1.5 ml), and there was no significant difference from the 5 lx sector; eyeless larvae density under the 5 lx light (87.5, ± 32.5 ind per 1.5 ml) was also significantly higher than the other intensities (p < 0.01; Table 7 and Figure 3B). Based on the above results, we gave the following conjecture and interpretation that hybrid oyster larvae had positive phototaxis to a certain range of light intensity, but it could reverse to be negative if the light intensity exceeded a critical intensity. A previous study inferred that the invertebrate larvae had positive phototaxis to light at a low intensity and negative phototaxis to light at a high intensity (Forward, 1976), which was in conjunction with our findings. On this basis, we had a further conclusion that 5 lx intensity light was the positive phototaxis light for eyeless hybrid larvae, and that the optimal intensity for eyespot larvae was between 5 and 10 lx, but no higher than 15 lx. In a nutshell, the presumed optimal light intensity ranged from 0 to 15 lx for hybrid oyster larvae, and the light over 25 lx might cause negative phototaxis.
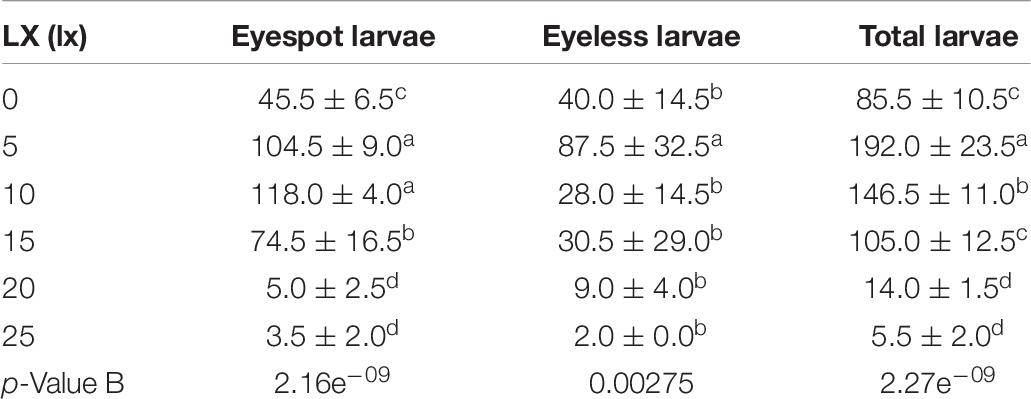
Table 7. The density distribution of eyespot larvae, eyeless larvae, and total larvae of hybrid oysters under 0, 5, 10, 15, 20, and 25 lx light.
How Do Light Wavelengths (TPCs) Affect the Phototaxis of Hybrid Oyster Larvae?
Previous studies suggested that the sensitivity wavelength of zooplankton could be predicted by the efficient absorbance of light wavelengths by eyespot (Kim et al., 2013, 2014, 2018). The eyespot of C. gigas had a higher absorbance in the range of visible light, from 500 to 650 nm, and the highest absorbance of wavelength was at 620 nm (Kim et al., 2021), which meant that oyster larvae were more sensitive to green light (wavelength at 546.1 nm) among TPCs. In the present study, the PERMANOVA analysis of the third experiment showed that light wavelength could significantly affect the distribution of hybrid oyster larvae under the same light intensity (p < 0.01). Differences in the distribution of eyespot larvae, eyeless larvae, and total larvae could be highly explained by time changes (R2 = 0.986, R2 = 0.989, and R2 = 0.995, respectively). Besides, the PERMANOVA analysis also showed that the number of attached larvae was significantly related to light wavelength (p < 0.01; Table 8). The above results further proved that hybrid oyster larvae were sensitive to light wavelength.
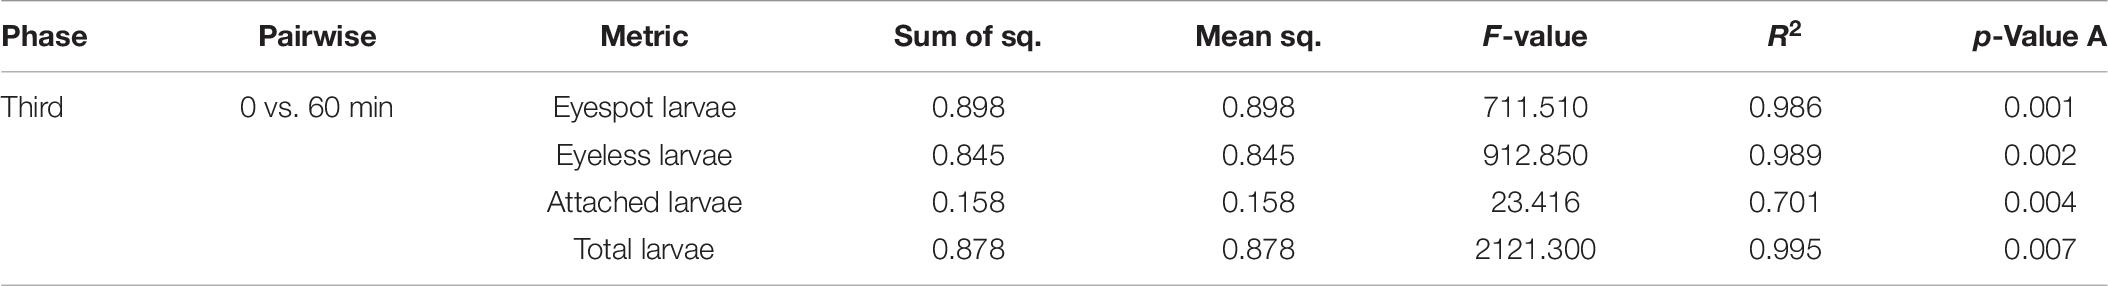
Table 8. PERMANOVA analysis for the distribution difference in eyespot larvae, eyeless larvae, and total larvae and the number of attached larvae of hybrid oysters with time.
The absorption of visible light in aquatic environments led to the common assumption that aquatic organisms sensed and adapted to penetrative blue/green light but little or no response to red light (Fortunato et al., 2016). Coincidentally, the green light patch and the green-blue light patch gathered the most eyespot larvae and eyeless larvae in the study, which was significantly higher than the other patches (p < 0.01). The eyespot larvae were significantly gathered by red-green light but less than that of green light and green-blue light (p < 0.01), and eyeless larvae were also relatively highly gathered in the red-green patch. These results indicated that green light caused positive phototaxis of hybrid oyster larvae. Surprisingly, the settling data suggested that though the red-green patch did not gather the most larvae, it collected a massive amount of settled larvae (20.0, ± 3.5 ind), which were significantly higher than the other patches (Table 9). Thus, we gave a bold assumption that red light had the function of settling induction to eyespot larvae, and that green light had a certain attraction to both eyespot larvae and eyeless larvae resulting in the largest number of hybrid larvae settled onto the red-green patch. The promotion of red light on eyespot larvae settling was also proposed in the study of C. gigas (Kim et al., 2021). Recently, four rhodopsin-like superfamily genes were identified in the genomic study of C. gigas (Wu et al., 2018), which provided us with another perspective on it.
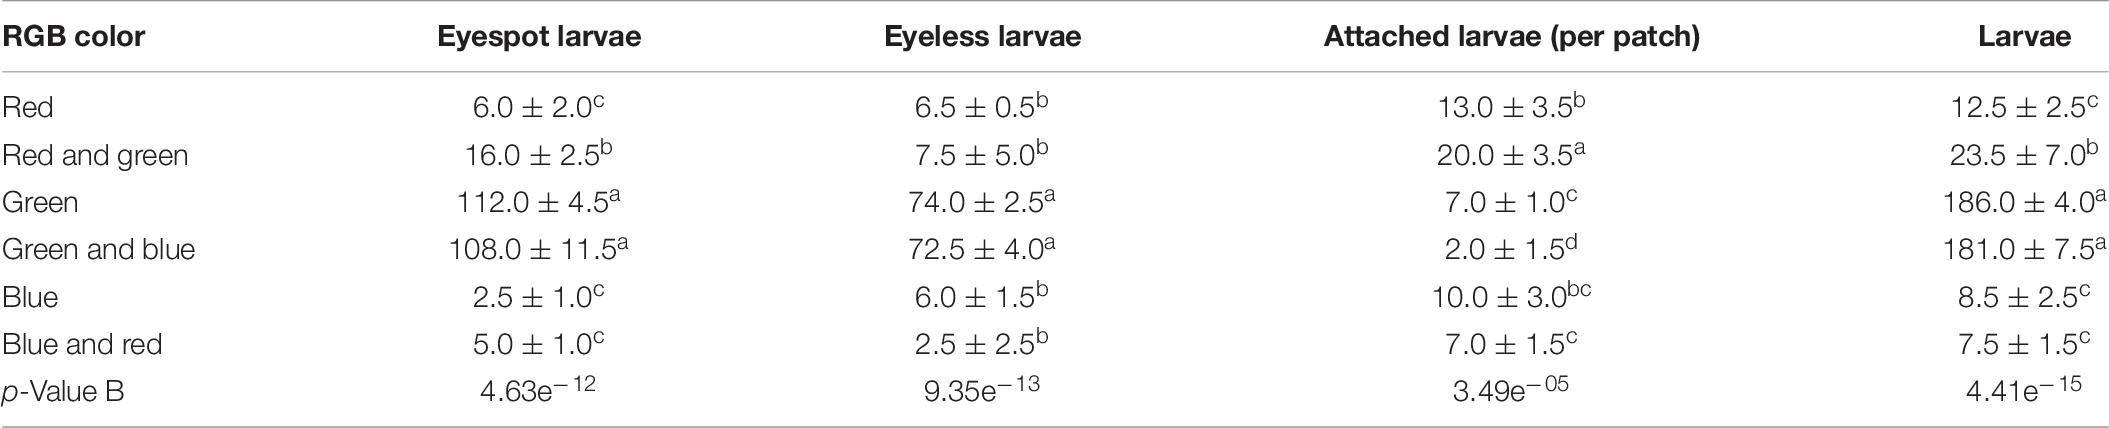
Table 9. The density distribution of eyespot larvae, eyeless larvae, and total larvae and the number of attached larvae of the hybrid oyster to each TPC and the GMSCs patch (LX = 5 lx).
The relationship between TPCs (red, green, and blue) and hybrid larvae distribution was deployed by path analysis (Table 10). The result showed that green light and red light could be two key points to the distribution of eyespot larvae and eyeless larvae (p < 0.01). Besides, red light and blue light were significantly correlated with the settling of oyster larvae (p < 0.05).
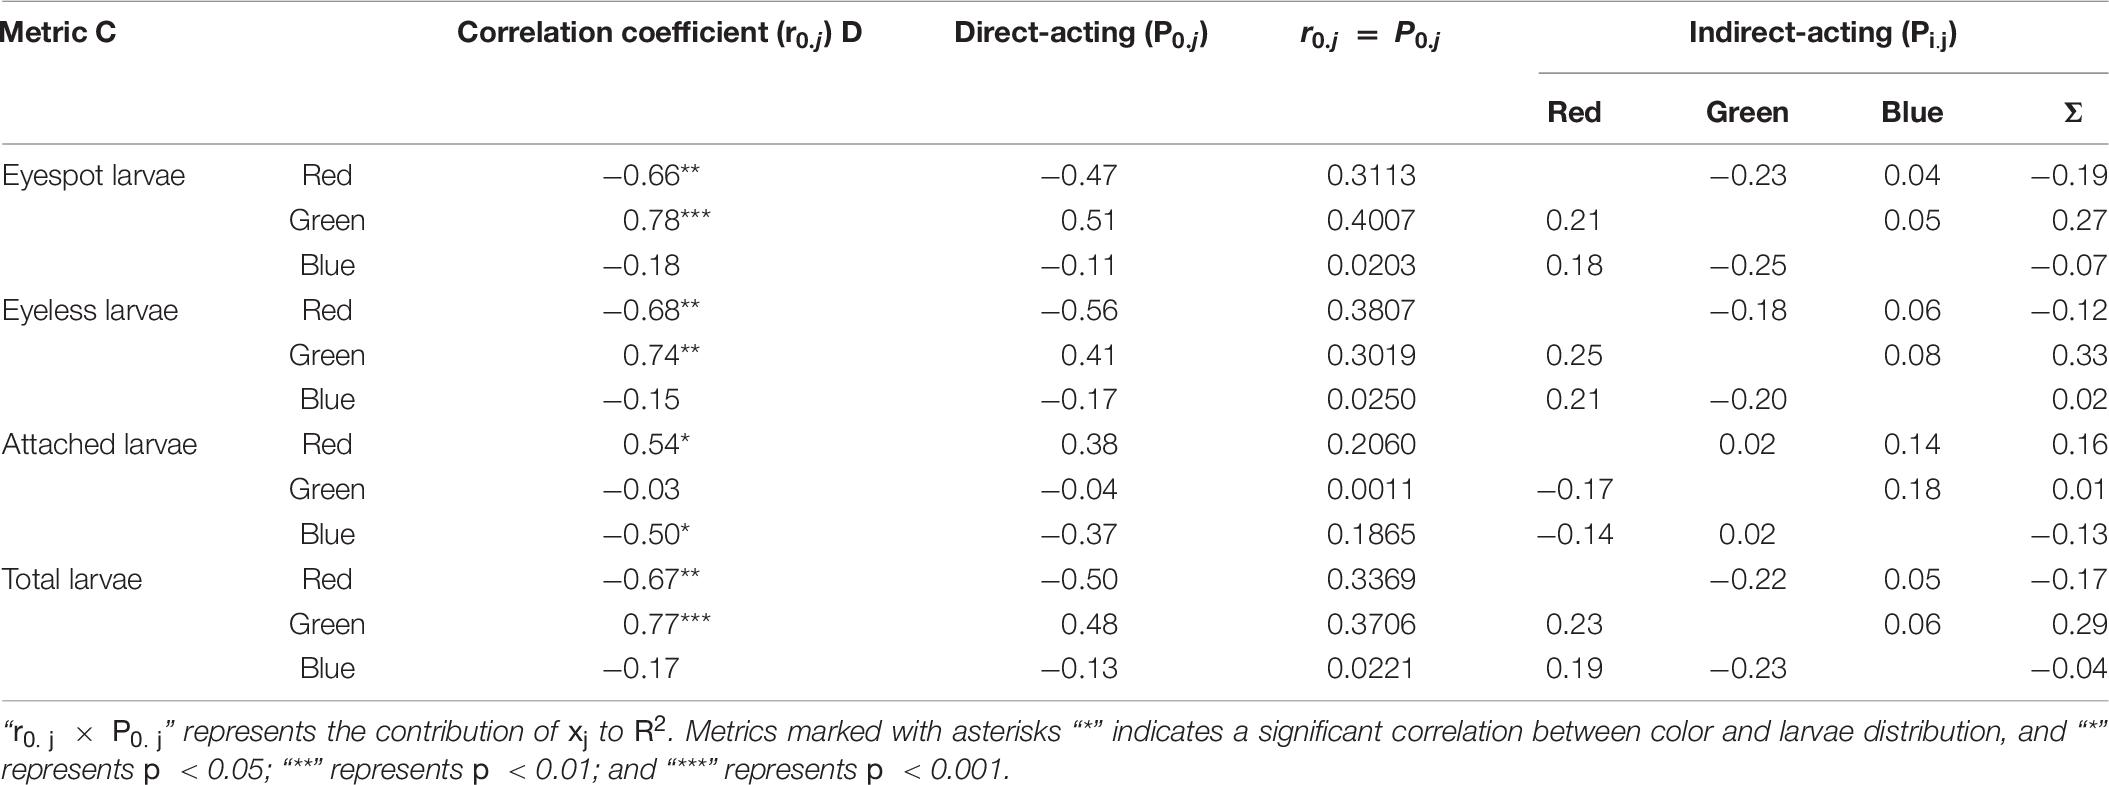
Table 10. The path analysis for the distribution difference in eyespot larvae, eyeless larvae, and total larvae and the number of attached larvae of the hybrid oyster to the TPCs.
The direct-acting and indirect-acting coefficients of red light on total larvae distribution were negative (P0.j = −0.50, Pi.j = −0.17), but positive for green light (P0.j = 0.48, Pi.j = 0.29), and total larvae distribution was poorly determined by blue light. In terms of eyespot larvae, the distribution was positively related to green light (P0.j = 0.51), and red light had a negative attraction on them (P0.j = −0.66). Similar to eyespot larvae, red light and green light had opposite effects on eyeless larvae (P0.j = −0.68, P0.j = 0.74; p < 0.01; Table 10).
In terms of larvae settling, green light had no significant effect on hybrid larvae settling, but red light was positively related to it, which meant that red light might be a factor in inducing hybrid oyster settling. Besides, blue light was negatively related to larvae settling, and the direct-acting coefficient on larvae settling was −0.37, which suggested that blue light could be an inhibiting factor to eyespot larvae settling (p < 0.01, Table 10). Oyster spat collection is an important process of oyster seedling (Taylor et al., 1998; Funo et al., 2019; Poirier et al., 2019), while oyster spat collection is unstable in the wild, as it is largely dependent on environmental situation (Absher, 2016). Many studies on oyster aquaculture had tried to enhance spat collection by developing tools (Holliday et al., 1993; Devakie and Ali, 2002; Buitrago and Alvarado, 2005; Arini and Jaya, 2011). Our findings demonstrated that red light had the function of inducing oyster larvae settling and green light had a certain attraction to oyster larvae that could be a guideline in oyster spat collection.
On a global scale, the oyster is distributed widely in tropical and temperate waters, predominantly coastal, and occupying the intertidal estuaries, marshes, and bays (Bayne, 2017). Oyster reefs provide important habitat for a marine animal assemblage that is both ecologically interesting and important to the estuarine food web (Luckenbach et al., 1999; Baggett et al., 2015)9). In the past century, the extent and intensity of nighttime illumination have dramatically increased such that it has substantial effects on the biology and ecology of species in the wild (Cinzano et al., 2001; Longcore and Rich, 2004), resulting in coastal habitats adjacent to populated areas becoming particularly vulnerable to light pollution (Gaston et al., 2013; Tamir et al., 2017). Considering the conclusion of the present study, light intensity and wavelength could be a potential tool for coastal habitat restoration, due to the function of specific light on oyster larvae gathering and settling induction. Surely, more studies need to be done for the comprehensive assessment of artificial light and coastal ecosystems.
Conclusion
To our knowledge, the present research firstly reported the impacts of light intensity and artificial TPCs on the phototaxis of the C. gigas (♂) and C. sikamea (♀) hybrid larvae. The result showed that the hybrid oyster larvae had positive phototaxis to specific light intensity and wavelength, and that this ability was not a unique characteristic of eyespot larvae, which was also observed in eyeless larvae. When the eyespot appeared, the acceptable light intensity range of the hybrid larvae was expanded. The present study also suggested the potential positive effects of the green light on oyster larvae gathering and settling induction of the red light. In conclusion, our study may contribute to the understanding of the phototaxis of hybrid oyster larvae, as well as the further perspective of light pollution on the benthic communities and coastal system.
Data Availability Statement
The original contributions presented in the study are included in the article/supplementary material, further inquiries can be directed to the corresponding author/s.
Author Contributions
XuZ, CF, and ZW gathered, analyzed and interpreted data, discussed the results and co-wrote the manuscript. XiZ, QL, and YL contributed constructively ideas for the work. All authors contributed to the article and approved the submitted version.
Conflict of Interest
The authors declare that the research was conducted in the absence of any commercial or financial relationships that could be construed as a potential conflict of interest.
Acknowledgments
This study is a contribution of the National Natural Science Foundation of China (911221680). The authors thank the staff, faculty and students of Guangxi Key Laboratory of Aquatic Genetic Breeding and Healthy Aquaculture for their hospitality during the workshop, and colleagues in Ocean University of China for the valued information.
References
Absher, T. M. (2016). Recruitment of oysters of Crassostrea genus (Bivalvia, Ostreidae) in Guaratuba Bay, PR, Brazil. Panam. J. Aquat. Sci. 11, 301–308.
Anderson, M. J. (2014). “Permutational multivariate analysis of variance (PERMANOVA),” in Wiley Statsref: Statistics Reference Online, eds N. Balakrishnan, T. Colton, B. Everitt, W. Piegorsch, F. Ruggeri, and J. L. Teugels (Hoboken, NJ: John Wiley & Sons Ltd), 1–15. doi: 10.1002/9781118445112.stat07841
Arini, E., and Jaya, N. T. S. P. (2011). The effect of various spat collector materials for spat attachment of pearl oyster (Pinctada maxima). J. Coast. Dev. 15, 34–44.
Baggett, L. P., Powers, S. P., Brumbaugh, R. D., Coen, L. D., DeAngelis, B. M., Greene, J. K., et al. (2015). Guidelines for evaluating performance of oyster habitat restoration. Restor. Ecol. 23, 737–745. doi: 10.1111/rec.12262
Baker, P., and Mann, R. L. (1998). Response of settling oyster larvae, Crassostrea virginica, to specific portions of the visible light spectrum. J. Shellfish Res. 17:1081.
Banks, M., McGoldrick, D., Borgeson, W., and Hedgecock, D. (1994). Gametic incompatibility and genetic divergence of Pacific and Kumamoto oysters, Crassostrea gigas and C. sikamea. Mar. Biol. 121, 127–135. doi: 10.1007/bf00349481
Bayne, B. L. (2017). Ecology i: distribution at regional and global scales. Dev. Aquac. Fish. Sci. 41, 89–138.
Blaxter, J. (1968). Visual thresholds and spectral sensitivity of herring larvae. J. Exp. Biol. 48, 39–53. doi: 10.1242/jeb.48.1.39
Bolton, D., Mayer-Pinto, M., Clark, G., Dafforn, K., Brassil, W., Becker, A., et al. (2017). Coastal urban lighting has ecological consequences for multiple trophic levels under the sea. Sci. Total Environ. 576, 1–9. doi: 10.1016/j.scitotenv.2016.10.037
Brown, C., and Braithwaite, V. A. (2005). Effects of predation pressure on the cognitive ability of the poeciliid Brachyraphis episcopi. Behav. Ecol. 16, 482–487. doi: 10.1093/beheco/ari016
Buitrago, E., and Alvarado, D. (2005). A highly efficient oyster spat collector made with recycled materials. Aquac. Eng. 33, 63–72. doi: 10.1016/j.aquaeng.2004.11.003
Burr, A., and Burr, C. (1975). The amphid of the nematode Oncholaimus vesicarius: ultrastructural evidence for a dual function as chemoreceptor and photoreceptor. J. Ultrastruct. Res. 51, 1–15. doi: 10.1016/s0022-5320(75)80003-7
Cinzano, P., Falchi, F., and Elvidge, C. D. (2001). The first world atlas of the artificial night sky brightness. Mon. Not. R. Astron. Soc. 328, 689–707. doi: 10.1046/j.1365-8711.2001.04882.x
Davies, T. W., Duffy, J. P., Bennie, J., and Gaston, K. J. (2014). The nature, extent, and ecological implications of marine light pollution. Front. Ecol. Environ. 12:347–355. doi: 10.1890/130281
Devakie, M., and Ali, A. (2002). Effective use of plastic sheet as substrate in enhancing tropical oyster (Crassostrea iredalei Faustino) larvae settlement in the hatchery. Aquaculture 212, 277–287. doi: 10.1016/s0044-8486(02)00270-3
Fortunato, A. E., Jaubert, M., Enomoto, G., Bouly, J.-P., Raniello, R., Thaler, M., et al. (2016). Diatom phytochromes reveal the existence of far-red-light-based sensing in the ocean. Plant Cell 28, 616–628. doi: 10.1105/tpc.15.00928
Forward, R. B. (1988). Diel vertical migration: zooplankton photobiology and behaviour. Oceanogr. Mar. Biol. Annu. Rev. 26, 583–603.
Forward, R. B., and Cronin, T. W. (1979). Spectral sensitivity of larvae from intertidal crustaceans. J. Comp. Physiol. 133, 311–315. doi: 10.1007/bf00661133
Funo, I., Antonio, I., Marinho, Y. F., Monteles, J. S., Lopes, R. G. P. S., and Gálvez, A. O. (2019). Recruitment of oyster in artificial collectors on the Amazon macrotidal mangrove coast. Cienc. Rural 49:e20180482.
Gaffney, P. M., and Allen, S. K. (1993). Hybridization among Crassostrea species: a review. Aquaculture 116, 1–13. doi: 10.1016/0044-8486(93)90217-m
Gaston, K. J., Bennie, J., Davies, T. W., and Hopkins, J. (2013). The ecological impacts of nighttime light pollution: a mechanistic appraisal. Biol. Rev. 88, 912–927. doi: 10.1111/brv.12036
Gaston, K. J., Davies, T. W., Nedelec, S. L., and Holt, L. A. (2017). Impacts of artificial light at night on biological timings. Annu. Rev. Ecol. Evol. Syst. 48, 49–68. doi: 10.1146/annurev-ecolsys-110316-022745
Hedgecock, D., Li, G., Banks, M., and Kain, Z. (1999). Occurrence of the kumamoto oyster Crassostrea sikamea in the Ariake Sea, Japan. Mar. Biol. 133, 65–68. doi: 10.1007/s002270050443
Hobbs, L., Banas, N. S., Cohen, J. H., Cottier, F. R., Berge, J., and Varpe, Ø (2021). A marine zooplankton community vertically structured by light across diel to interannual timescales. Biol. Lett. 17:20200810.
Holliday, J. E., Allan, G. L., Frances, J., and Diver, L. P. (1993). Evaluation of commercially-used collectors for Sydney rock oysters, Saccostrea commercialis and Pacific oysters, Crassostrea gigas. Aquac. Eng. 12, 63–79. doi: 10.1016/0144-8609(93)90017-6
Hong, J.-S., Sekino, M., and Sato, S. (2012). Molecular species diagnosis confirmed the occurrence of Kumamoto oyster Crassostrea sikamea in Korean waters. Fish. Sci. 78, 259–267. doi: 10.1007/s12562-011-0453-5
Ibraheem, N. A., Hasan, M. M., Khan, R. Z., and Mishra, P. K. (2012). Understanding color models: a review. ARPN J. Sci. Technol. 2, 265–275.
Jékely, G., Colombelli, J., Hausen, H., Guy, K., Stelzer, E., Nédélec, F., et al. (2008). Mechanism of phototaxis in marine zooplankton. Nature 456, 395–399. doi: 10.1038/nature07590
Kim, H.-J., Lee, J.-S., and Hagiwara, A. (2018). Phototactic behavior of live food rotifer Brachionus plicatilis species complex and its significance in larviculture: A review. Aquaculture 497, 253–259. doi: 10.1016/j.aquaculture.2018.07.070
Kim, H. J., Sawada, C., and Hagiwara, A. (2014). Behavior and reproduction of the rotifer Brachionus plicatilis species complex under different light wavelengths and intensities. Int. Rev. Hydrobiol. 99, 151–156.
Kim, H.-J., Suematsu, Y., Kaneda, H., and Satuito, C. G. (2021). Light wavelength and intensity effects on larval settlement in the Pacific oyster Magallana gigas. Hydrobiologia 848, 1611–1621. doi: 10.1007/s10750-021-04550-9
Kim, H.-J., Suga, K., and Hagiwara, A. (2013). Effect of light wavelength on the sexual and asexual reproduction of the monogonont rotifer Brachionus manjavacas. Aquac. Sci. 61, 261–268.
Longcore, T., and Rich, C. (2004). Ecological light pollution. Front. Ecol. Environ. 2:191–198. doi: 10.1890/1540-92952004002[0191:ELP]2.0.CO;2
Luckenbach, M., Mann, R., and Wesson, J. (1999). Oyster Reef Habitat Restoration: a Synopsis and Synthesis of Approaches; Proceedings from the Symposium, Williamsburg, Virginia, April 1995. Gloucester Point, VA: Virginia Institute of Marine Science Press.
Marsden, J. (1988). Light responses of the larva of the serpulid polychaete Galeolaria caespitosa. Mar. Biol. 99, 397–407.
Medcof, J. (1955). Day and night characteristics of spatfall and of behaviour of oyster larvae. J. Fish. Board Can. 12, 270–286. doi: 10.1139/f55-017
Naylor, E. (1999). Marine animal behaviour in relation to lunar phase. Earth Moon Planets 85, 291–302. doi: 10.1007/978-94-010-0800-6_26
O’Connor, J., Fobert, E., Besson, M., Jacob, H., and Lecchini, D. (2019). Live fast, die young: behavioural and physiological impacts of light pollution on a marine fish during larval recruitment. Mar. Pollut. Bull. 146, 908–914. doi: 10.1016/j.marpolbul.2019.05.038
Palmberg, I., Reuter, M., and Wikgren, M. (1980). Ultrastructure of epidermal eyespots of Microstomum lineare (Turbellaria, Macrostomida). Cell Tissue Res. 210, 21–32.
Poirier, L. A., Clements, J. C., Davidson, J. D., Miron, G., Davidson, J., and Comeau, L. A. (2019). Sink before you settle: settlement behaviour of Eastern oyster (Crassostrea virginica) larvae on artificial spat collectors and natural substrate. Aquac. Rep. 13:100181. doi: 10.1016/j.aqrep.2019.100181
Sliney, D. (2016). What is light? The visible spectrum and beyond. Eye 30, 222–229. doi: 10.1038/eye.2015.252
Tamir, R., Lerner, A., Haspel, C., Dubinsky, Z., and Iluz, D. (2017). The spectral and spatial distribution of light pollution in the waters of the northern Gulf of Aqaba (Eilat). Sci. Rep. 7, 1–10.
Taylor, J. J., Southgate, P. C., and Rose, R. A. (1998). Assessment of artificial substrates for collection of hatchery-reared silver-lip pearl oyster (Pinctada maxima, Jameson) spat. Aquaculture 162, 219–230. doi: 10.1016/s0044-8486(98)00213-0
Thorson, G. (1964). Light as an ecological factor in the dispersal and settlement of larvae of marine bottom invertebrates. Ophelia 1, 167–208. doi: 10.1080/00785326.1964.10416277
Tielmann, M., Schulz, C., and Meyer, S. (2017). The effect of light intensity on performance of larval pike-perch (Sander lucioperca). Aquac. Eng. 77, 61–71. doi: 10.1016/j.aquaeng.2017.03.001
Trussell, H. J., Saber, E., and Vrhel, M. (2005). “Color image processing: basics and special issue overview,” in Proceedings of the IEEE Signal Processing Magazine (Piscataway: NY: Institute of Electrical and Electronics Engineers), 14–22. doi: 10.1109/msp.2005.1407711
Wang, H., Qian, L., Wang, A., and Guo, X. (2013). Occurrence and distribution of Crassostrea sikamea (Amemiya 1928) in China. J. Shellfish Res. 32, 439–446. doi: 10.2983/035.032.0224
Wu, C., Jiang, Q., Wei, L., Cai, Z., Chen, J., Yu, W., et al. (2018). A rhodopsin-Like gene may be associated with the light-sensitivity of adult Pacific oyster Crassostrea gigas. Front. physiol. 9:221. doi: 10.3389/fphys.2018.00221
Keywords: phototaxis, light intensity and wavelength, eyespot larvae, RGB color model, hybrid oyster
Citation: Zhang X, Fan C, Zhang X, Li Q, Li Y and Wang Z (2021) Effects of Light Intensity and Wavelength on the Phototaxis of the Crassostrea gigas (♂) and Crassostrea sikamea (♀) Hybrid Larvae. Front. Mar. Sci. 8:698874. doi: 10.3389/fmars.2021.698874
Received: 22 April 2021; Accepted: 07 June 2021;
Published: 09 July 2021.
Edited by:
Kit Yue Kwan, Beibu Gulf University, ChinaReviewed by:
Fangzhu Wu, Alfred Wegener Institute Helmholtz Centre for Polar and Marine Research (AWI), GermanyLiqiang Zhao, Guangdong Ocean University, China
Copyright © 2021 Zhang, Fan, Zhang, Li, Li and Wang. This is an open-access article distributed under the terms of the Creative Commons Attribution License (CC BY). The use, distribution or reproduction in other forums is permitted, provided the original author(s) and the copyright owner(s) are credited and that the original publication in this journal is cited, in accordance with accepted academic practice. No use, distribution or reproduction is permitted which does not comply with these terms.
*Correspondence: Zhaoping Wang, enB3YW5nQG91Yy5lZHUuY24=
†These authors have contributed equally to the work