- 1Centre for Ocean and Atmospheric Sciences, School of Environmental Sciences, University of East Anglia, Norwich, United Kingdom
- 2Department of Ocean Systems (OCS), Royal Netherlands Institute for Sea Research (NIOZ), Texel, Netherlands
- 3Centre for Environment, Fisheries and Aquaculture Science, Lowestoft, United Kingdom
- 4Plymouth Marine Laboratory, Plymouth, United Kingdom
- 5National Oceanography Centre Southampton, University of Southampton, Southampton, United Kingdom
Accurate, low-power sensors are needed to characterize biogeochemical variability on underwater glider missions. However, the needs for high accuracy and low power consumption can be difficult to achieve together. To overcome this difficulty, we integrated a novel sensor combination into a Seaglider, comprising a spectrophotometric lab-on-a-chip (LoC) pH sensor and a potentiometric pH sensor, in addition to the standard oxygen (O2) optode. The stable, but less frequent (every 10 min) LoC data were used to calibrate the high-resolution (1 s) potentiometric sensor measurements. The glider was deployed for a 10-day pilot mission in August 2019. This represented the first such deployment of either type of pH sensor on a glider. The LoC pH had a mean offset of +0.005±0.008 with respect to pH calculated from total dissolved inorganic carbon content, c(DIC), and total alkalinity, AT, in co-located water samples. The potentiometric sensor required a thermal-lag correction to resolve the pH variations in the steep thermocline between surface and bottom mixed layers, in addition to scale calibration. Using the glider pH data and a regional parameterization of AT as a function of salinity, we derived the dissolved CO2 content and glider c(DIC). Glider surface CO2 and O2 contents were used to derive air-sea fluxes, Φ(CO2) and Φ(O2). Φ(CO2) was mostly directed into the ocean with a median of −0.4 mmol m–2 d–1. In contrast, Φ(O2) was always out of the ocean with a median of +40 mmol m–2 d–1. Bottom water apparent oxygen utilization (AOU) was (35±1) μmol kg–1, whereas apparent carbon production (ACP) was (11±1) μmol kg–1, with mostly insignificant differences along the deployment transect. This deployment shows the potential of using pH sensors on autonomous observing platforms such as Seagliders to quantify the interactions between biogeochemical processes and the marine carbonate system at high spatiotemporal resolution.
Introduction
The ocean helps mitigate the effect of human activities on Earth’s climate by absorbing about a quarter of the anthropogenic CO2 emitted to the atmosphere each year (Friedlingstein et al., 2020). Coastal and shelf seas (bottom depth <200 m) play a key role in the global carbon cycle by linking the terrestrial, oceanic, and atmospheric reservoirs of carbon (Walsh, 1991; Mackenzie et al., 2004). These seas occupy only 7% of the global ocean surface area but yield 10–30% of marine net primary production (Gattuso et al., 1998). Coupled with seasonal stratification and circulation of off-shelf waters, this primary production supports net CO2 uptake from the atmosphere and export to the deep ocean via the “continental shelf pump” (Tsunogai et al., 1999).
The North Sea is a shelf sea that has been studied extensively for decades (Pegler and Kempe, 1988; Hoppema, 1991; Kempe and Pegler, 1991). Many studies have focused on the southern North Sea and its coastal systems (Borges, 2003; Schiettecatte et al., 2007; Gypens et al., 2009). The North Sea carbonate system has been studied using research cruises (Bozec et al., 2005, 2006; Thomas et al., 2005b, 2007; Omar et al., 2010; Salt et al., 2013; Meyer et al., 2018) and models (Blackford and Gilbert, 2007; Gypens et al., 2009; Prowe et al., 2009; Kühn et al., 2010; Artioli et al., 2012). These datasets and models have quantified changes of surface partial CO2 pressure, p(CO2) (Thomas et al., 2005b, 2007; Omar et al., 2010) and air-sea flux (Meyer et al., 2018); uncovered a correlation of pH and p(CO2) with the North Atlantic Oscillation (Salt et al., 2013); quantified pH variability and ocean acidification (Blackford and Gilbert, 2007); quantified net community production (NCP) (Bozec et al., 2006) and demonstrated the existence of a continental shelf pump for CO2 (Thomas et al., 2004; Bozec et al., 2005).
However, the biogeochemistry of shelf seas is challenging to observe because they have higher temporal and spatial variability than the open ocean. The studies above mostly used samples sparsely distributed in time and space, focusing on changes across wider spatial areas such as the entire North Sea. Expensive ship based-campaigns were used to survey these regions because they are too shallow or have currents too fast for autonomous floats (Bushinsky et al., 2019). In contrast, gliders can be deployed for long periods in water depths as shallow as 50 m and can overcome currents up to 0.4 m s–1. Thus, gliders can help uncover variability in processes such as vertical mixing, air-sea gas exchange, NCP and the continental shelf pump.
Power demand and measurement drift limit the use of autonomous sensors on gliders. Also, for shallow dives less than the glider’s maximum depth (1000 m), the mission endurance is limited because more power is used to communicate with the base station, to detect the bottom using the altimeter, and to change the glider direction from descent to ascent. Battery usage can be reduced through sensors with low power requirements and targeted, rather than continuous, sensor operation. An example of targeted sensor operation was a glider deployment in the central North Sea for 3 days (Queste et al., 2016). That glider mission had the target to quantify oxygen concentration changes at a site in the central North Sea suspected to be vulnerable to oxygen depletion. During this short deployment, the glider data revealed O2 supply to the bottom mixed layer (BML) at a rate of (2±1) mmol m–3 d–1 and larger BML O2 consumption rates than previous studies. The glider used 5% of its battery capacity, demonstrating that longer shallow-water deployments of up to 2 months should be possible.
The ocean carbon system has been modified since the industrial revolution (starting around 1760) by the increase of the atmospheric carbon dioxide amount fraction x(CO2) by >100 μmol mol–1, resulting in a decrease of the global surface ocean pH average from 8.21 to 8.10, corresponding to a 29% increase in H+ activity (Fabry et al., 2008; Doney et al., 2009). The increase of x(CO2) is driven by human activities such as fossil fuel combustion and deforestation (Doney and Schimel, 2007). Future projections suggest that in the next decades the ocean CO2 uptake will continue, decreasing the ocean pH in a process known as ocean acidification (OA). High-resolution pH sensors can provide the accurate measurements needed to quantify OA magnitude and variability.
The first ocean pH measurements using a benchtop spectrophotometer were reported by Byrne and Breland (1989). Originally, this method was limited and developed for shipboard measurements, requiring spectrophotometric blanks, and an indicator dye. As a result, the first sensors using spectrophotometric pH methods were complex, large in size and had high power requirements (Seidel et al., 2008). However, recent developments have reduced sensor size, complexity, and power requirements (Bellerby et al., 2002; Martz et al., 2003; Wang et al., 2007; Seidel et al., 2008; Carter et al., 2013; Staudinger et al., 2019). For example, the Lab-On-Chip (LoC) sensor deployed in this study was developed by the Ocean Technology and Engineering Group (OTE) of the National Oceanography Centre (NOC) in Southampton (Rérolle et al., 2012) and is an example of these recent developments because it has a small size and mass (195 mm × 125 mm; 920 g), low power consumption (3 W while measuring) and low sample volume (700 μL), and indicator use (2.3 μL). The sensor has a high-pressure tolerance (600 bar). Unlike potentiometric ion-sensitive field effect transistor (ISFET) and glass electrode sensors, spectrophotometric pH sensors are less prone to calibration offsets and drift (Rérolle et al., 2012).
Along with the spectrophotometric pH sensor, the glider was equipped with a glass pH electrode, which measured at higher resolution than the spectrophotometric sensor, but less accurately. Glass electrodes can achieve an accuracy <0.01 (Seiter and DeGrandpre, 2001) and a precision in the laboratory of 0.003 (Byrne et al., 1988). However, the measured pH is affected by a series of problems: uncertainties due to temperature changes, glass and reference electrode drift (up to 0.02 d–1), electromagnetic interferences, residual liquid-junction potential variation and ionic strength changes (Dickson, 1993; Seiter and DeGrandpre, 2001). Long deployments of glass electrodes are challenging because they require regular calibration. Our intention was to calibrate periodically the more frequent potentiometric data against the less frequent, but more accurate spectrophotometric data.
We validated the sensor performance against discrete samples for total alkalinity (AT) and total dissolved inorganic carbon content [c(DIC)] collected during the glider deployment. We show that the glider data can be used to calculate O2 and CO2 air-sea fluxes, apparent carbon production (ACP), and apparent oxygen utilization (AOU) in the BML.
Materials and Methods
Glider Mission
University of East Anglia (UEA) Seaglider 510 “Orca” (iRobot/Kongsberg) was deployed in the North Sea on 19 August 2019 at 56.77° N 0.28° E and was recovered on 29 August 2019 at 57.06° N 0.23° W, during survey CEND 12/19 of RV Cefas Endeavour (Lowestoft–Lowestoft, 7 August to 5 September 2019), part of the International Bottom Trawl Surveys (IBTS) Q3 survey. The glider covered the 45 km transect once in a total of 341 dives (Figure 1).
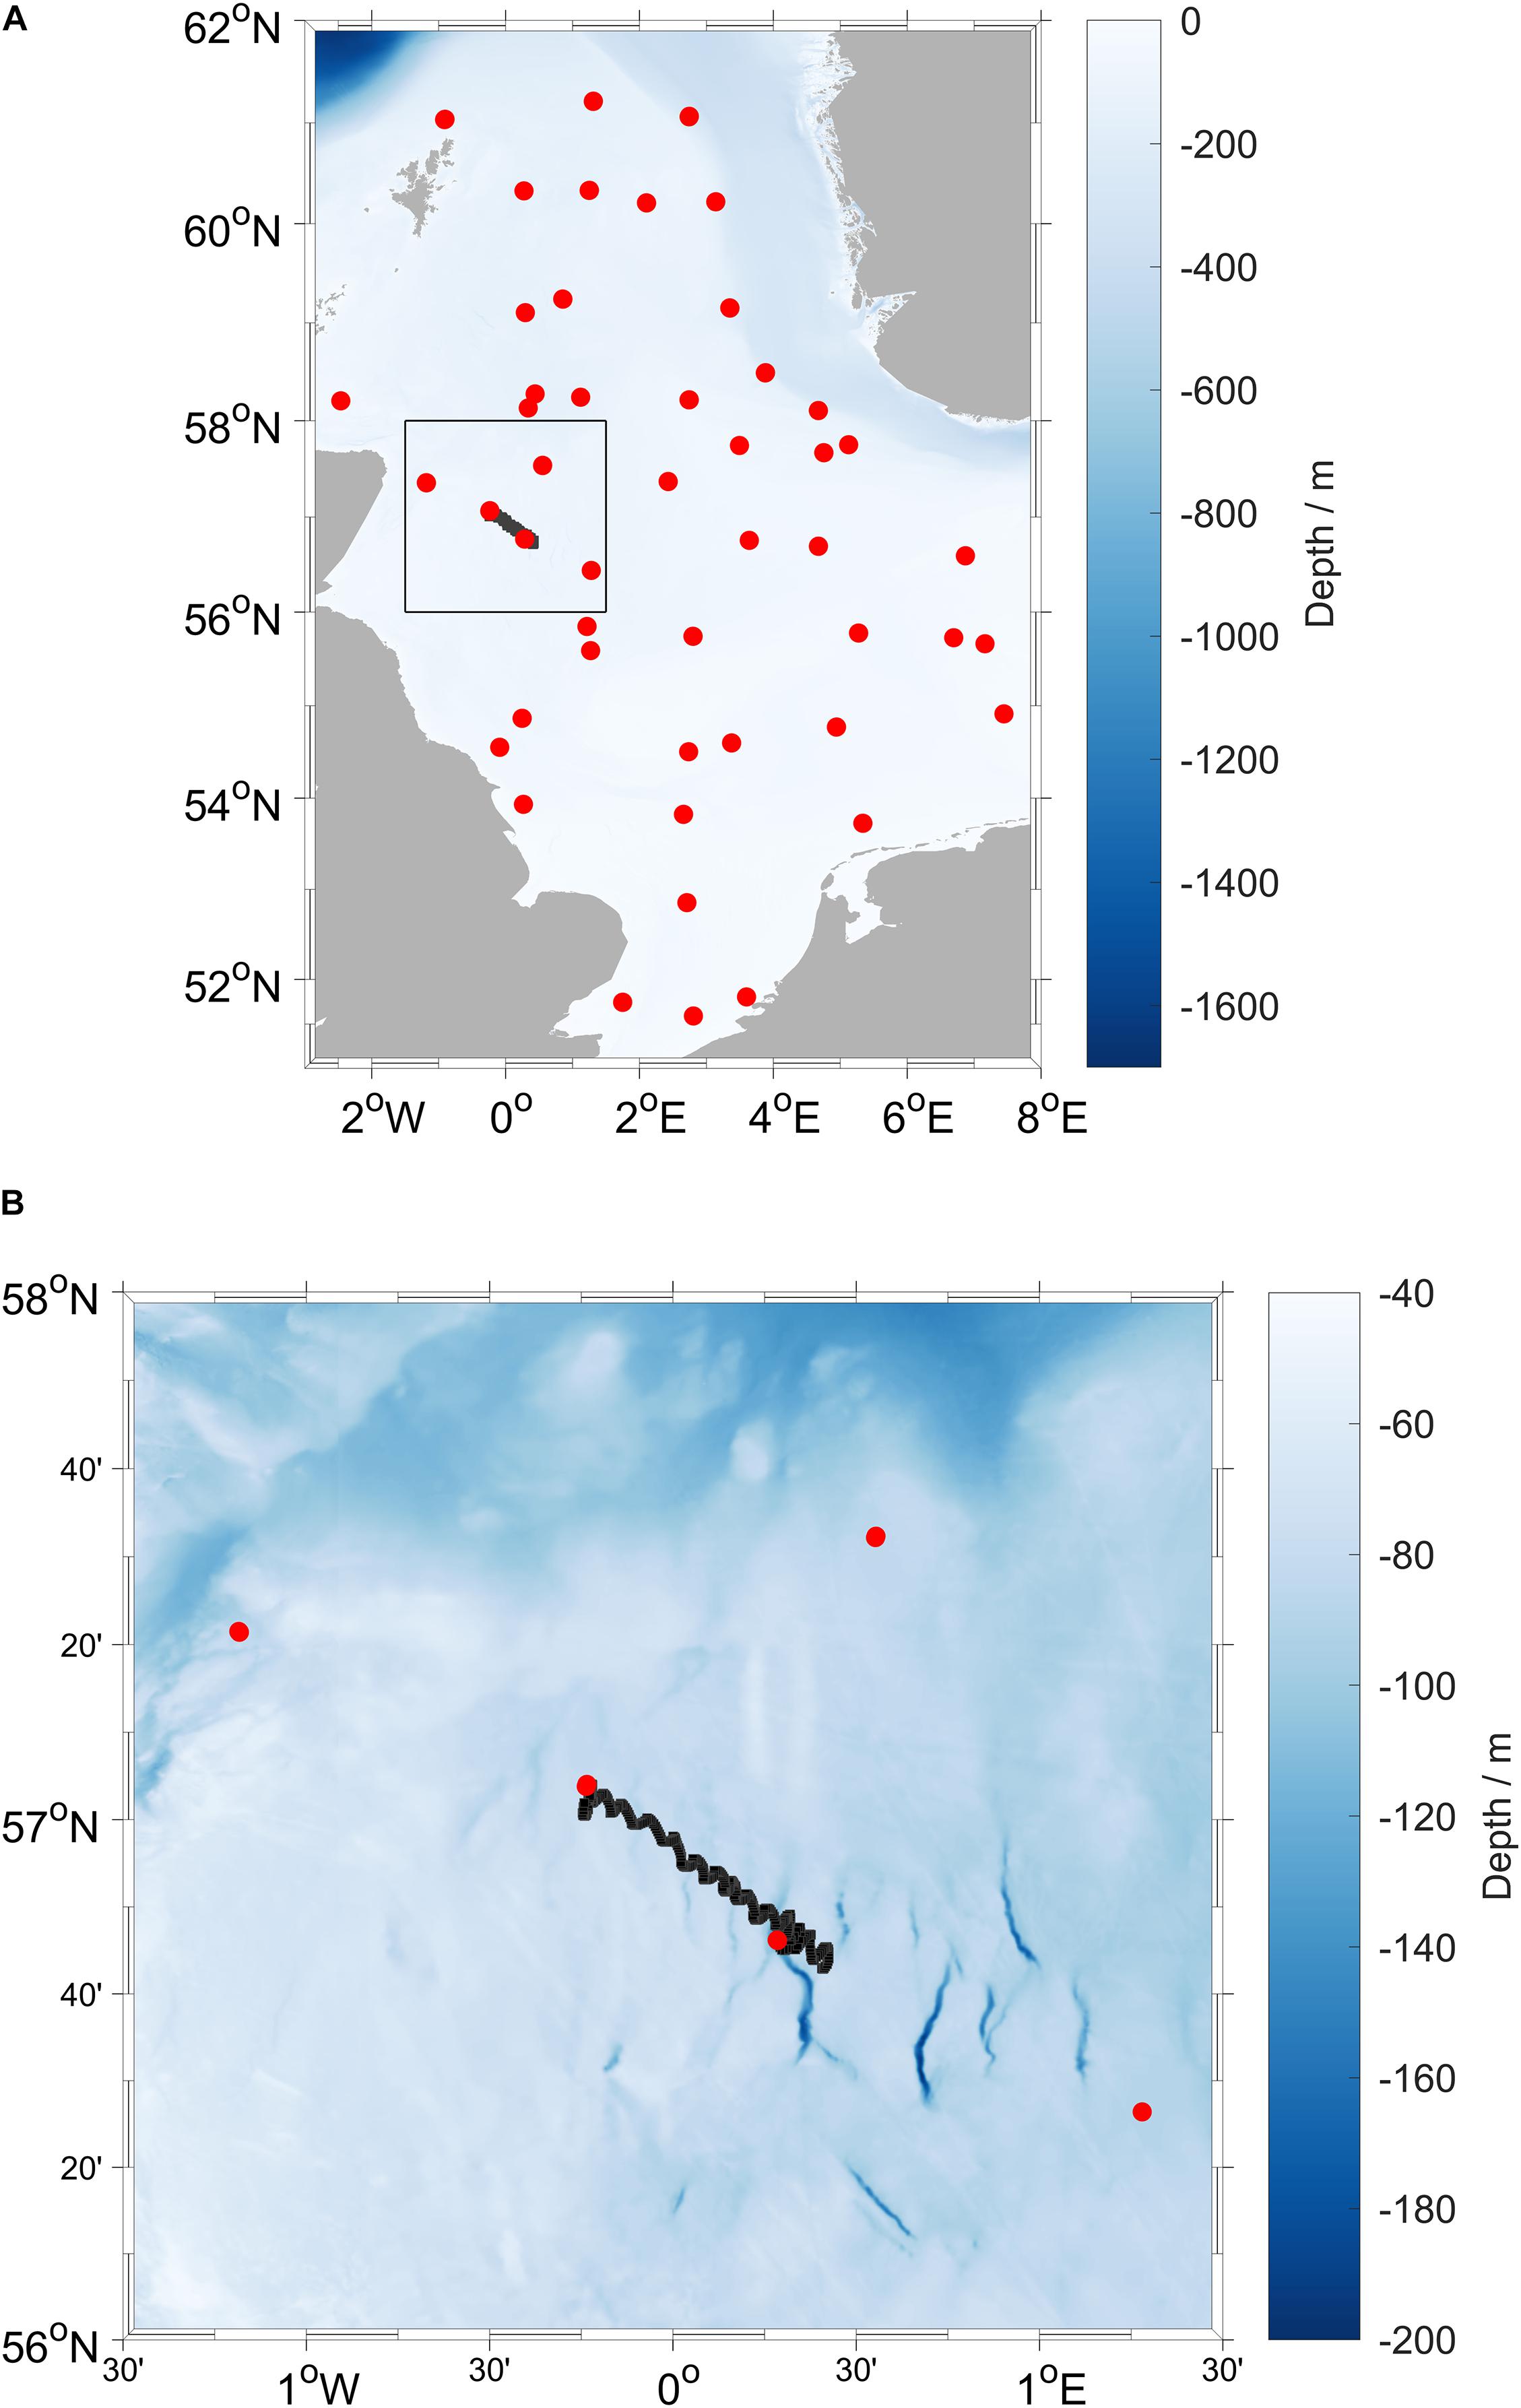
Figure 1. (A) Map of the North Sea, with the black box indicating (B) the location of the deployment area with glider positions from 19 to 29 August 2019 (black line) and CTD stations (red points) occupied during RV Cefas Endeavour survey CEND 12/19 (7 August to 5 September 2019).
The Seaglider was equipped with a NOC lab-on-a-chip (LoC) spectrophotometric pH sensor (Rérolle, 2013), a Fluidion potentiometric pH sensor, an Aanderaa 4831F oxygen optode (Tengberg et al., 2006) and a Sea-Bird CT sensor (Figure 2). The O2 optode was mounted with the sensing foil facing downward to the glider body to avoid sunlight interference (Binetti et al., 2020). The sensor measurement interval was 8.6 s for the CTD and O2 sensors, 11 min for the spectrophotometric pH sensor and 15 s for the potentiometric pH sensor. These were the shortest measurement intervals the glider and sensor software permitted.
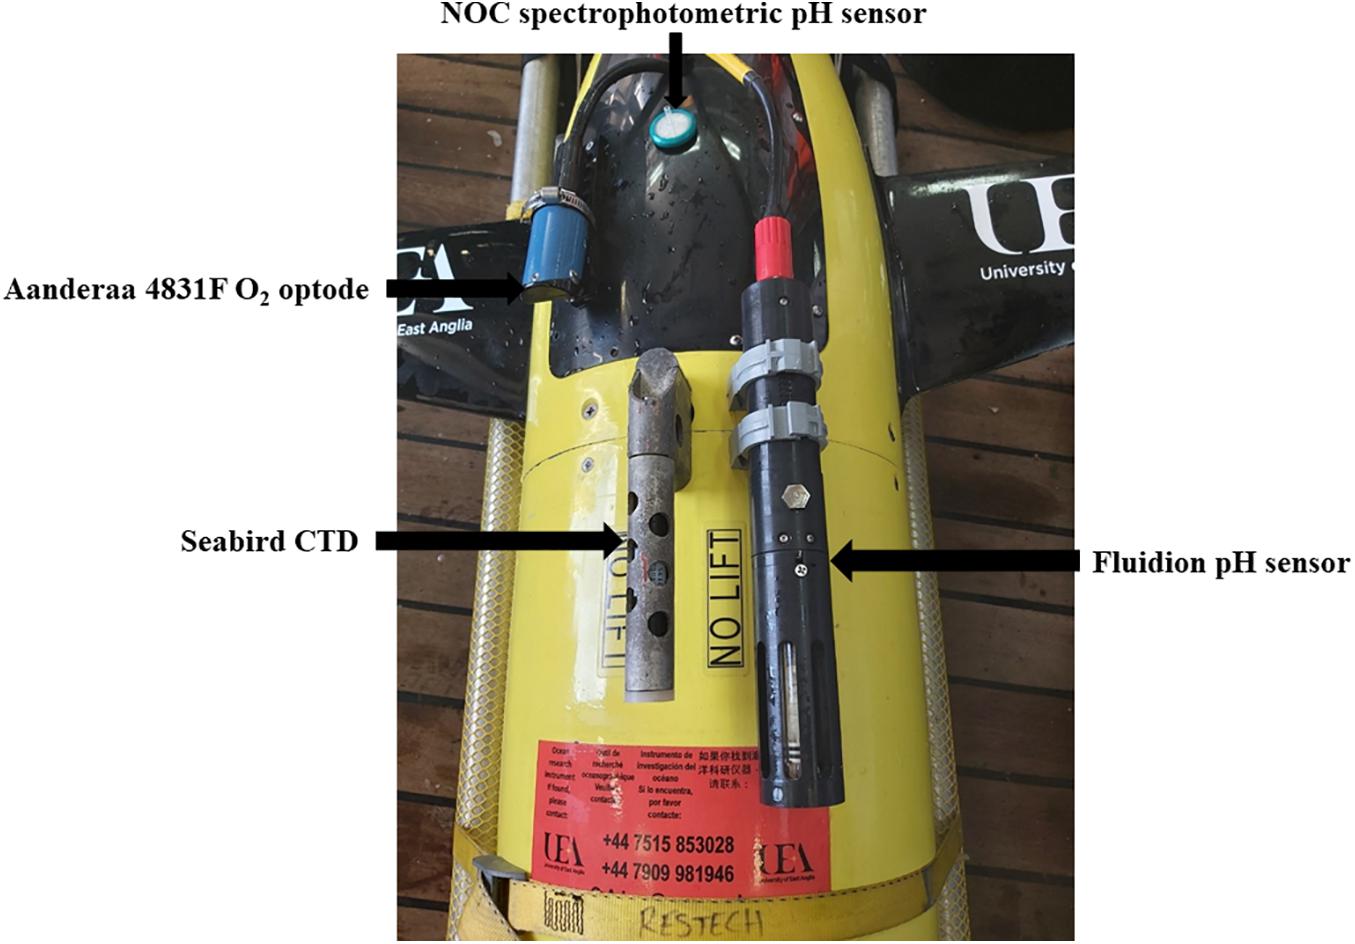
Figure 2. UEA Seaglider 510 “Orca” before the deployment showing the Aanderaa 4831F oxygen optode (Tengberg et al., 2006), a Sea-Bird CT sail (conductivity and temperature), the Fluidion potentiometric pH sensor, and the inlet filter of the NOC lab-on-chip (LoC) spectrophotometric pH sensor (Rérolle, 2013).
Every 10 dives and for every dive between dives 51 (21 August 2019, 0500; 56.75° N 0.33° E) to 60 (same day, 1800; 56.77° N 0.32° E) the glider was commanded to do longer dives, termed “loiter dives.” Loiter dives were designed to collect more samples by decreasing the glider’s ascent speed. During loiter dives, the glider had an average vertical speed of 0.04 m s–1, compared with 0.09 m s–1 for normal, non-loiter dives. During loiter dives, the NOC sensor performed up to nine measurements (normal dives: 2 or 3). The decrease of the vertical speed doubled the duration of the dive from around 30 min with 0.5 km horizontal movement to more than 1 h over 0.8 km horizontally.
The bottom depth measured by the glider altimeter was within (1.7 ± 2.3) m of the General Bathymetric Chart of the Oceans (GEBCO) (Weatherall et al., 2015), except for the first three dives when the glider deliberately performed shallower dives (Figure 3).
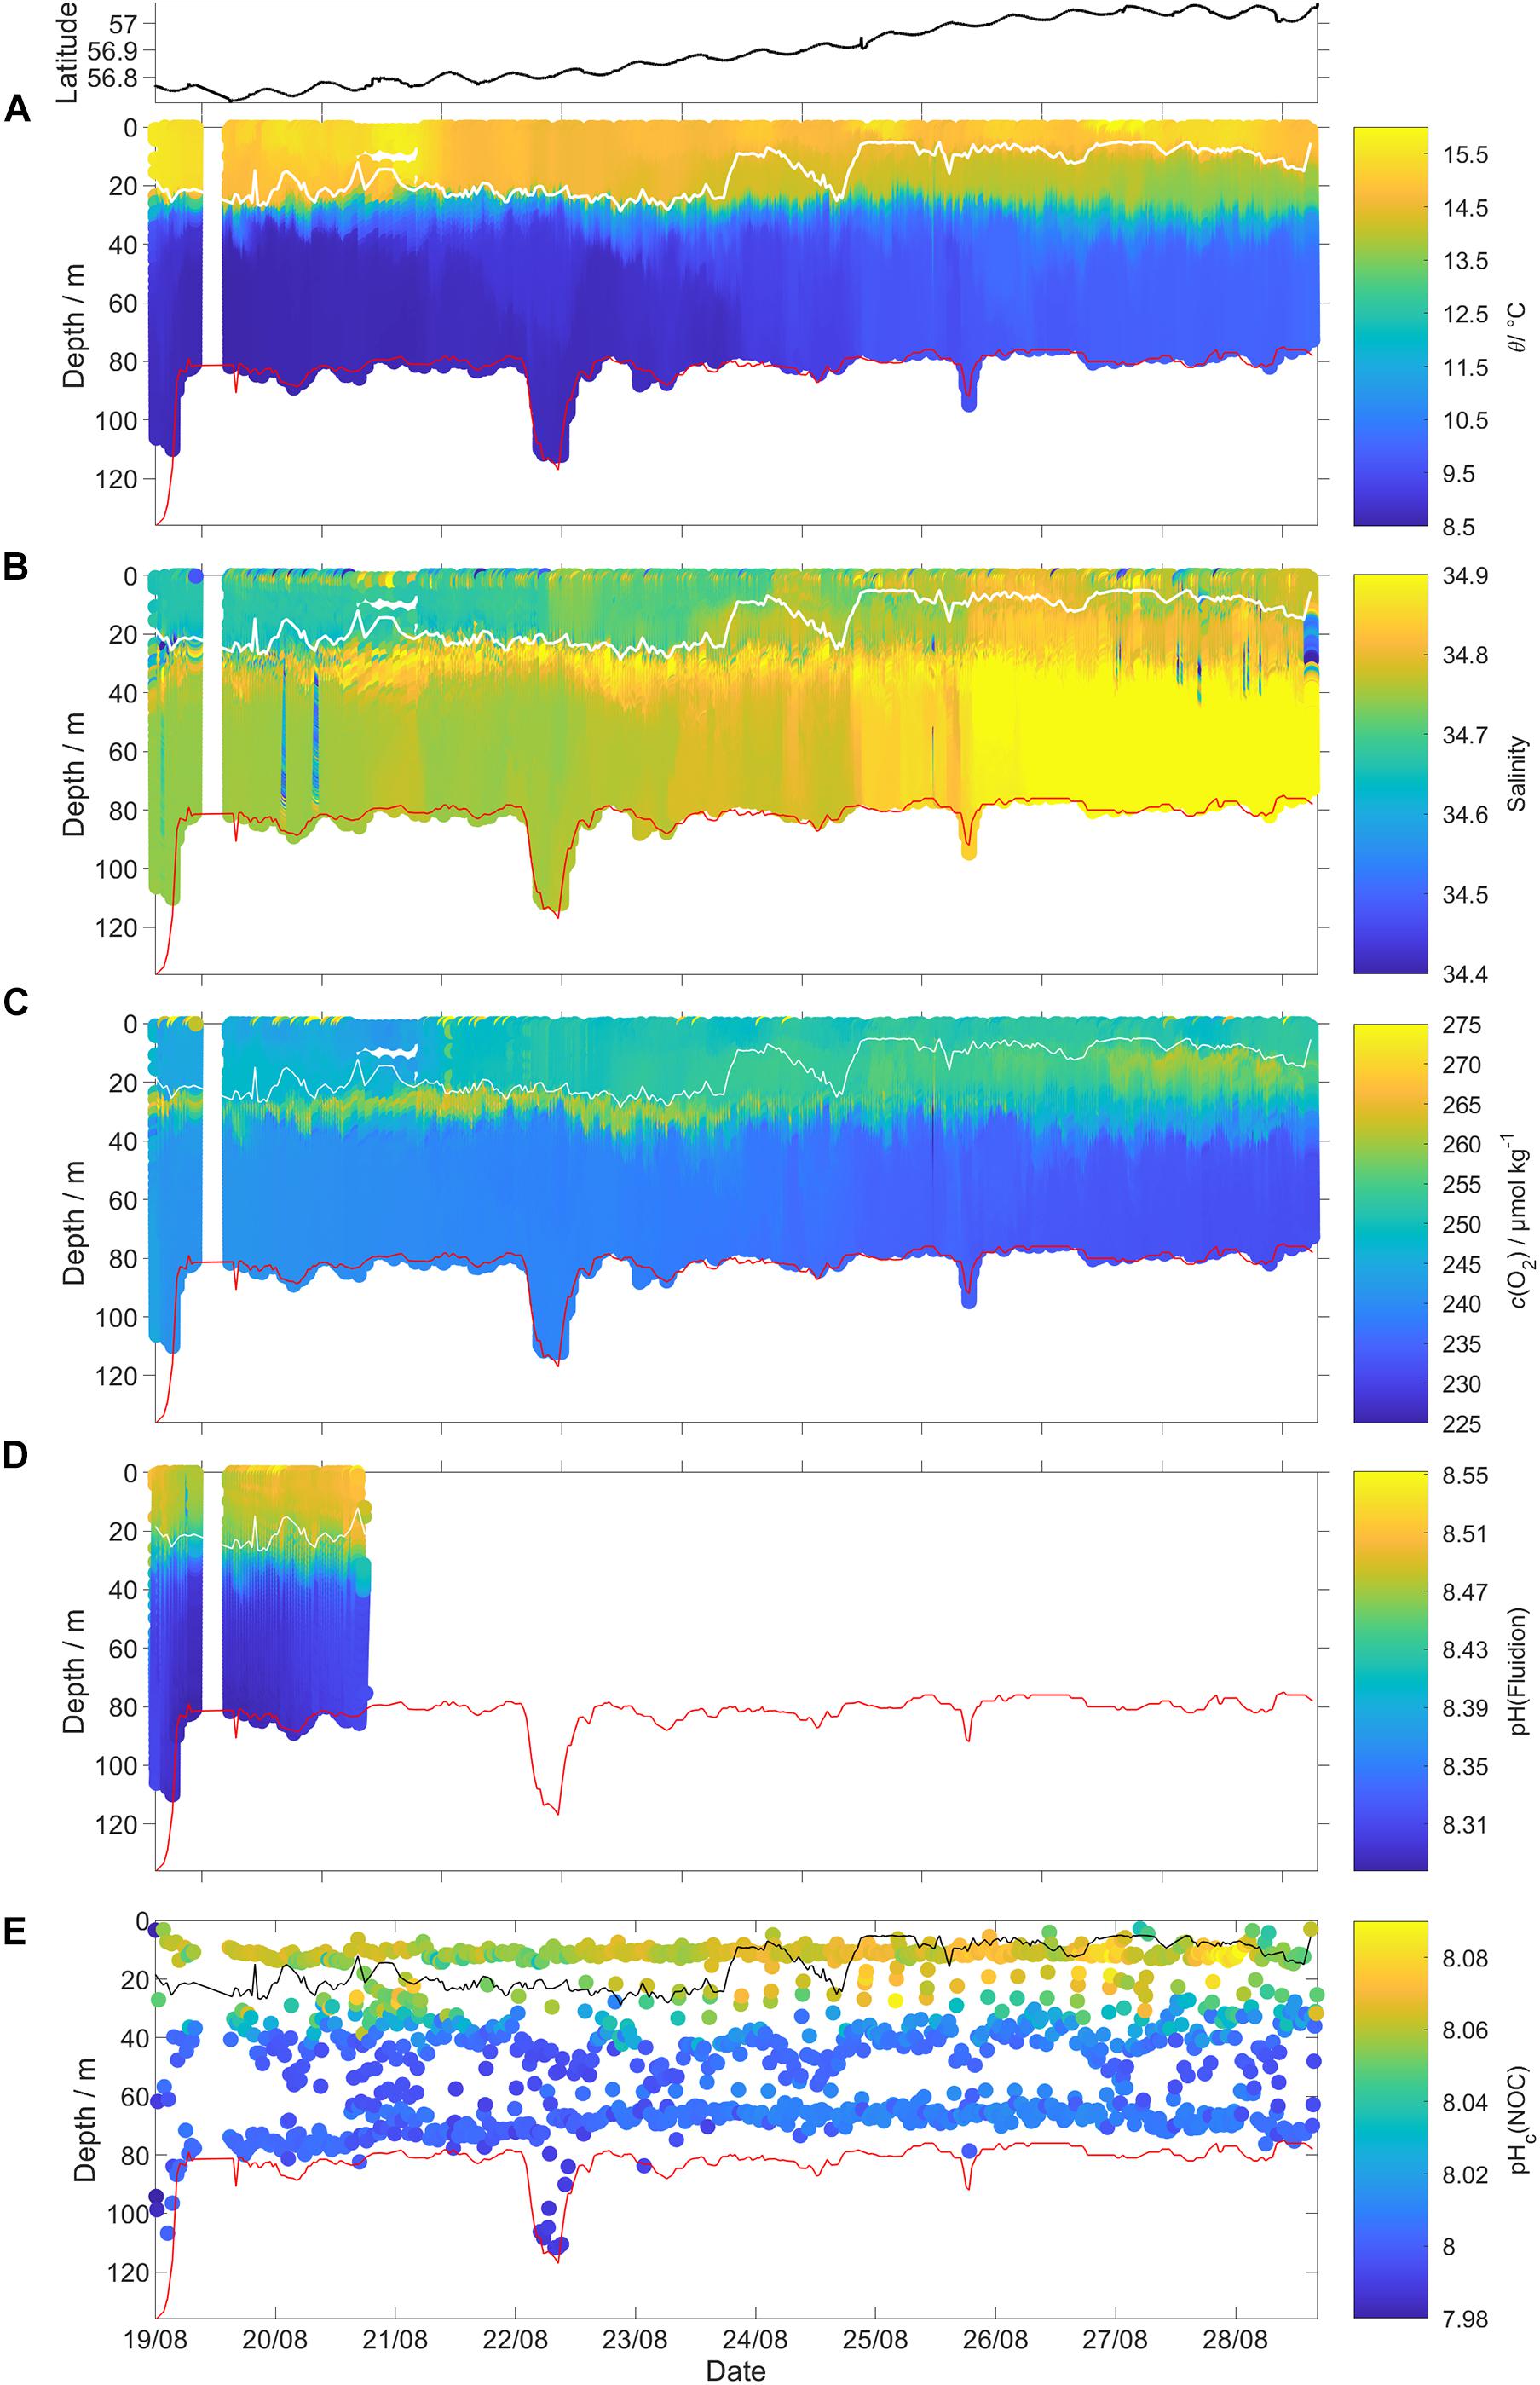
Figure 3. Uncalibrated glider data for all 341 dives (top panel: latitude of the glider location). (A) Potential temperature θ, (B) practical salinity S, (C) dissolved oxygen content c(O2), (D) pH(Fluidion), and (E) temperature corrected pHc(NOC). The measurements taken during the glider ascent were removed for θ, S, and c(O2). The white lines in (A–D) and the black line in (E) show the surface mixed layer depth (zmix) and the red lines show the GEBCO 2019 bathymetry (https://www.gebco.net/data_and_products/gridded_bathymetry_data/#a1).
Mixed layer depth (zmix) was calculated using a temperature (θ) threshold criterion of Δθ = 0.5 °C with respect to the median temperature in the top 5 m (Obata et al., 1996; United States. National Environmental Satellite and Information Service, Monterey and Levitus, 1997; Foltz et al., 2003).
Discrete Sampling
During survey CEND 12/19, 96 discrete samples were collected for c(DIC), AT, phosphate and silicate contents; four of these samples were collected next to the glider and another four samples in the glider deployment region. A Sea-Bird CTD SBE-911plus V2 CTD was attached to a SBE 32 rosette of 12 Niskin bottles (10 L each). The rosette was also equipped with a JFE-Advantech RINKO-III Model ARO-CAV oxygen optode, a Seapoint SCF fluorometer, a Seapoint STM turbidity meter, Satlantic OCR-504 PAR radiometer and a Teledyne-Benthos PSA-916 altimeter. During rough weather, a single Niskin bottle and a CTD sensor attached to a wire were used instead.
The c(DIC) and AT discrete samples were collected using 500 cm3 serum bottles with chlorobutyl rubber stoppers. The c(DIC), AT and nutrient samples were preserved with 0.1 cm3 saturated HgCl2 solution (final HgCl2 concentration: 15 mg dm–3). When the water column was fully mixed, one discrete sample was collected; when it was stratified, one sample each was collected from the surface and bottom mixed layers. The c(DIC) and AT samples were analyzed on-shore according to Dickson et al. (2007) using two Versatile INstruments for the Determination of Total inorganic carbon and titration Alkalinity (VINDTA; MARIANDA, Kiel, Germany). The results were calibrated using certified reference material (CRM) batch 182 obtained from A. G. Dickson at Scripps Institution of Oceanography, San Diego, CA, United States (Dickson et al., 2003). The measurement uncertainty was estimated as the standard deviation of the CRMs’ c(DIC) and AT. Initial results for the reference material gave a mean standard deviation for c(DIC) of 1.8 and 2.0 μmol kg–1 for the two VINDTAs, and 3.3 and 3.2 μmol kg–1 for AT. pH and p(CO2) were calculated using the MATLAB toolbox CO2SYS v2 (Van Heuven et al., 2011) with the following constants: K1 and K2 carbonic acid dissociation constants of Lueker et al. (2000), hydrogen sulfate dissociation constant of Dickson (1990), and borate-to-chlorinity ratio of Lee et al. (2010).
Sixty-eight dissolved oxygen samples were analyzed onboard using an automatic Winkler titration system to a potentiometric endpoint (Culberson, 1991; Holley and Hydes, 1995). For each sample, three or four replicates were analyzed; the median standard deviation was 0.5 μmol kg–1.
Quality Control of Glider CTD Measurements
The thermal lag of the glider conductivity sensor was corrected using the method of Gourcuff (2014). The glider CT cell was affected by unstable temperature readings during the glider ascent in loiter dives. The temperature variability during the ascent in loiter dives was associated with salinity and c(O2) spikes especially close to and below the thermocline (Figure 4). For that reason, all temperature, salinity and c(O2) data measured during loiter dive ascents were excluded. To correct pH(NOC) we used the CT temperature measured during the loiter dives glider descent because it was the only temperature available. At the surface and in BML the difference between the descent and ascent temperature was 0.003 °C leading to a negligible pH uncertainty (<0.0001). In the SML and at the thermocline the temperature difference was 0.066 °C leading to a pH(NOC) uncertainty of 0.001.
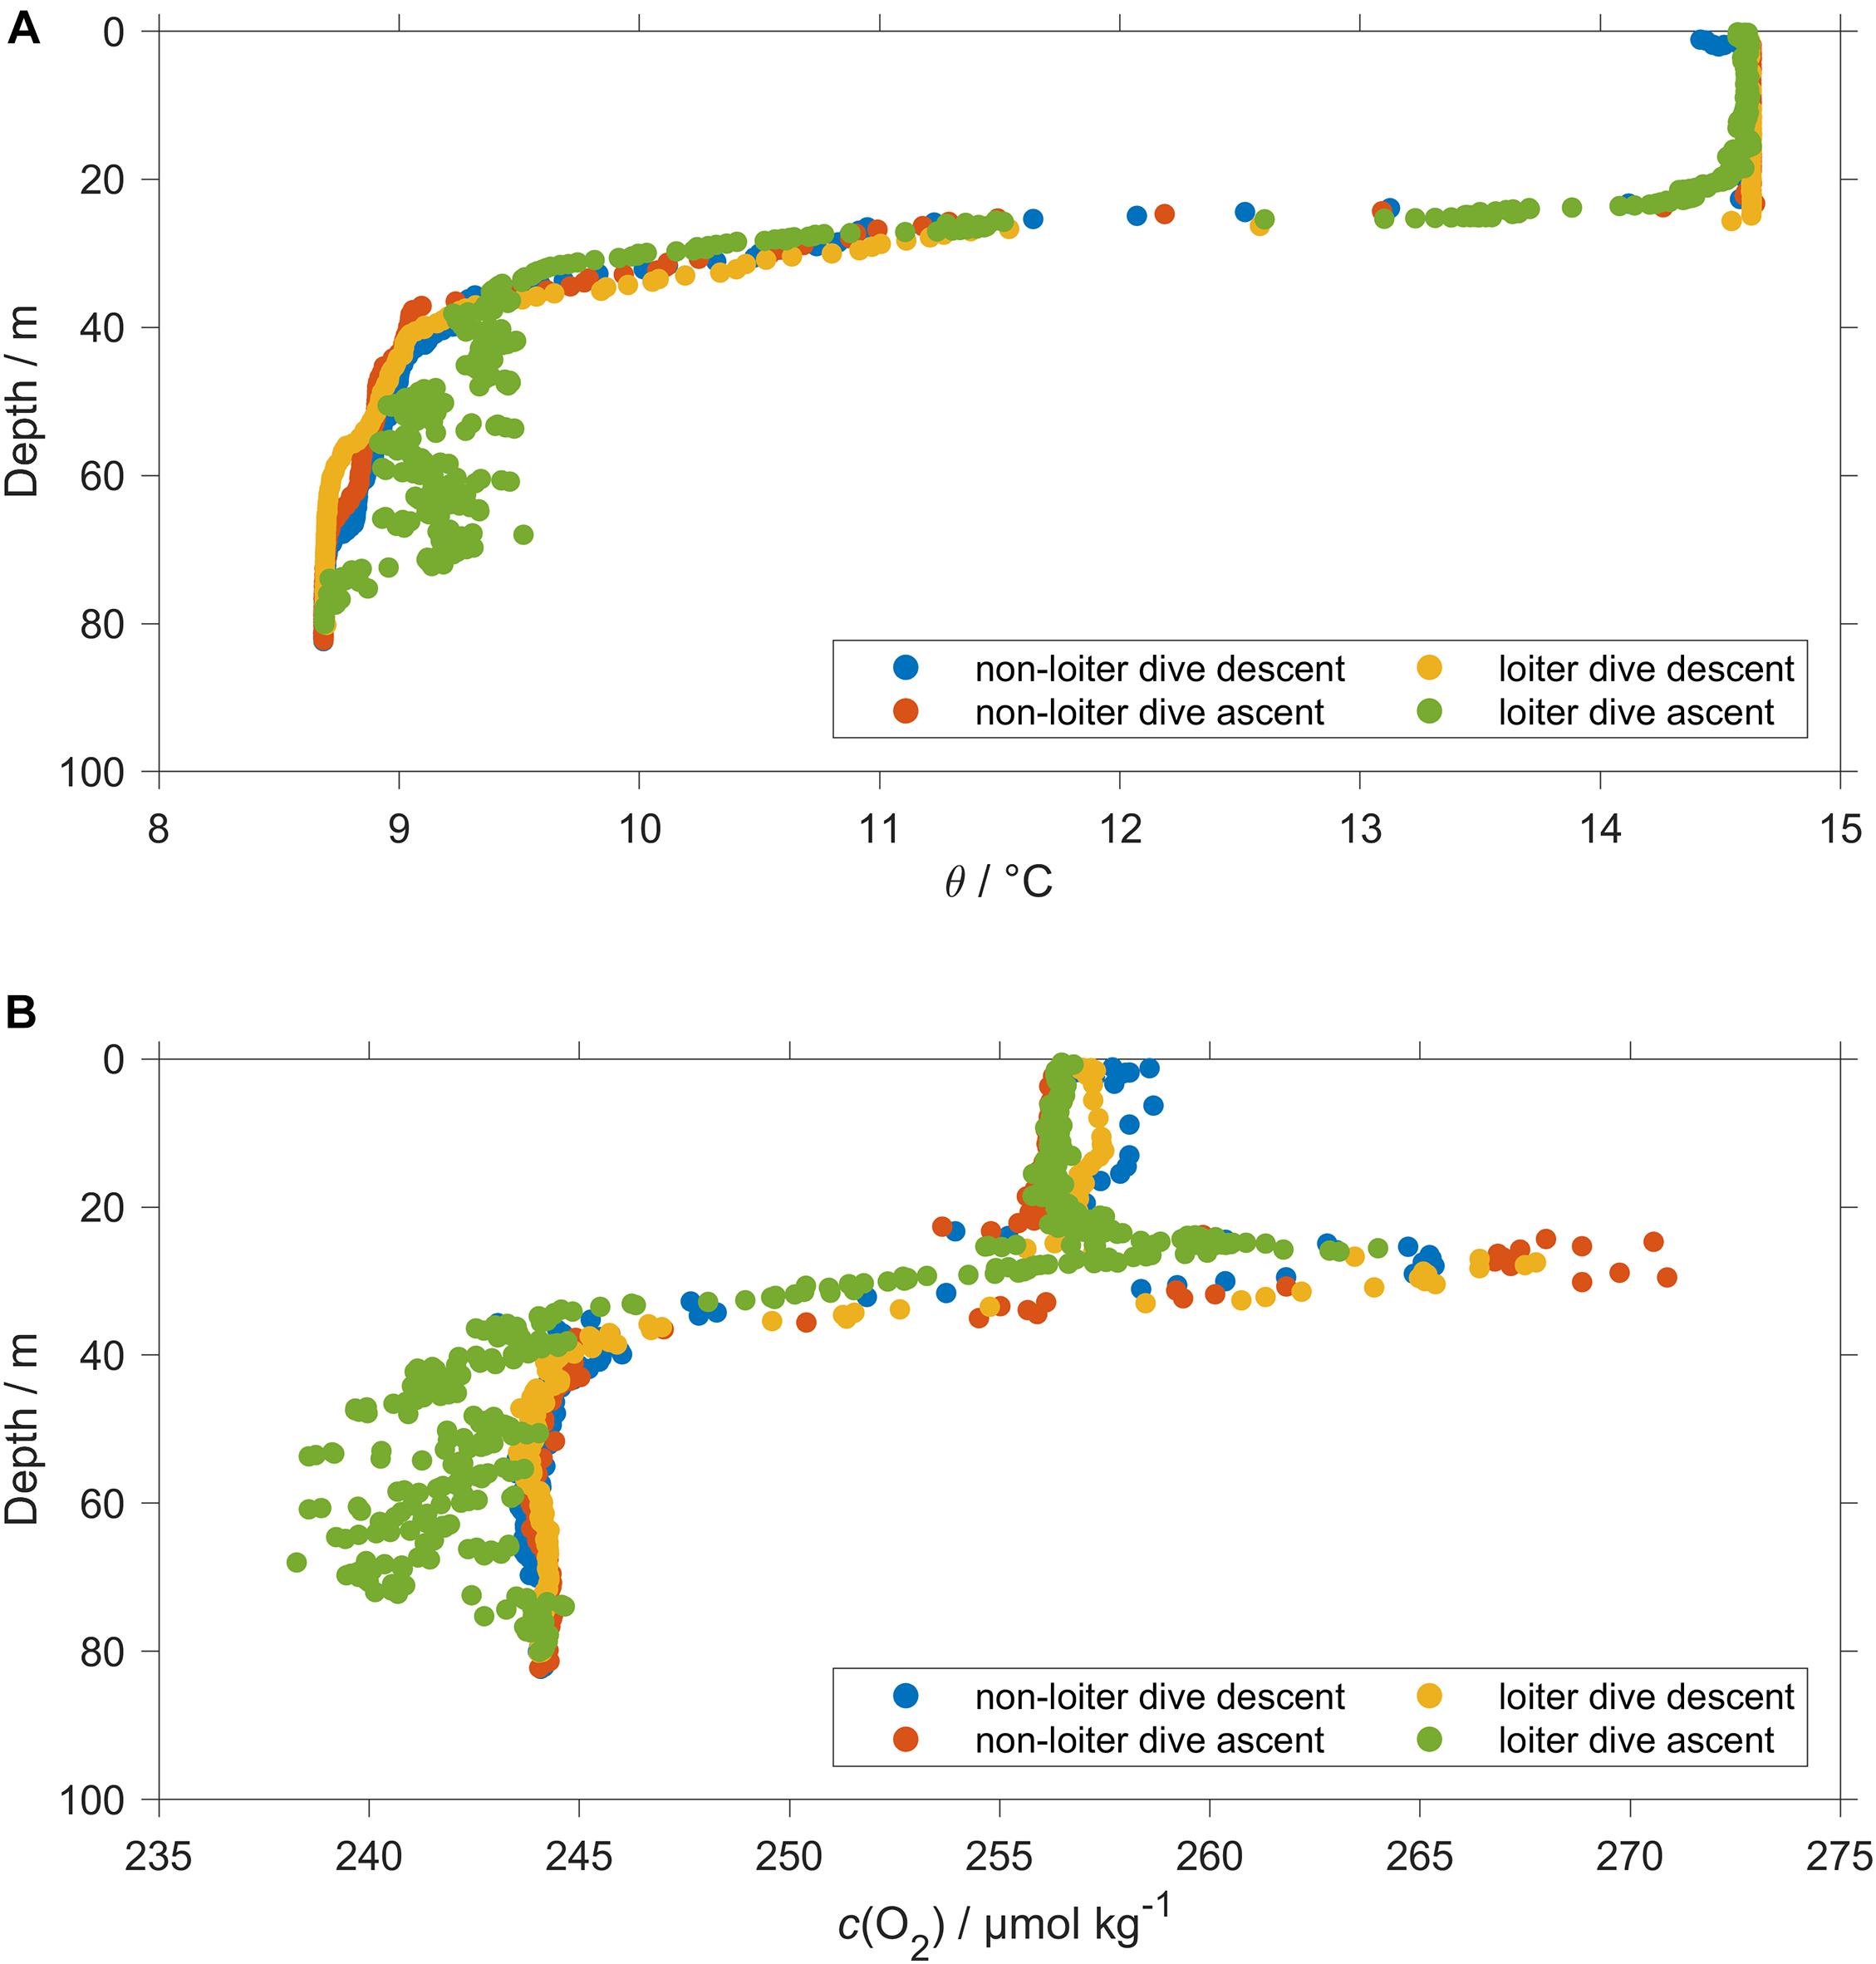
Figure 4. Comparison between a normal dive (110) and a loiter dive (111). During dive 110 data were stable. During dive 111 the loiter dive caused abnormal readings for ascent temperature (A) θ and (B) O2 content c(O2) and conductivity (not shown).
The differences between BML glider salinity Sg and CTD rosette salinity Sr at the deployment and recovery sites were −0.019 and +0.012, respectively. The temperature difference between glider and rosette was larger at deployment (0.040 °C) than at recovery (0.010 °C). The match-up between glider and rosette was therefore better at recovery than at deployment, and the glider salinity was adjusted by subtracting 0.012. The correction is in agreement with previous and following glider dives showing that the spatial and temporal variability did not have an effect (Supplementary Figure S1). However, even using the salinity offset of −0.019 measured at deployment would not have made a significant difference for pH and c(O2), or the biogeochemical variables and fluxes derived from them.
Spectrophotometric LoC pH Sensor Corrections
The NOC pH sensor is based on the lab-on-a-chip (LoC) technology using a spectrophotometric method with purified meta-cresol purple (mCP) as an indicator dye (Patsavas et al., 2013). The sensor includes a long serpentine mixer channel, a built-in optical detector that includes a two-wavelength LED/photosystem and a temperature sensor. These two wavelengths are at 435 and 596 nm close to the absorption maxima of the two charged mCP forms (HI– and I2–). Absorption measurements at both wavelengths are used to calculate the sample pH taking into account the indicator pH perturbation. The pH value on the total scale is calculated from the absorbance ratio of the protonated and deprotonated dye forms using the algorithm of Soli et al. (2013) that takes into account the effects of temperature, salinity and pressure on the mCP absorption coefficient. The sample and the indicator are pumped into the sensor by a syringe pump and controlled using solenoid valves. To avoid carryover between measurements, the new sample is flushed through the whole system three times before a measurement is made. The sensor collected a sample every 11 min allowing 5–6 measurements per hour. The sensor was electronically integrated with the Seaglider, which powered the sensor on at the beginning of each dive.
During the glider deployment the internal sensor temperature (within the measurement cell) was higher than the ambient water temperature by an average of (3±3) °C (due to waste heat from the sensor’s electronics). This alters the pH of the sample and requires correction using the temperature difference Δθ between NOC internal sensor and ambient water (measured when the sensor aspired the sample) with a coefficient of −0.01582 °C–1 (Millero, 2007):
Raw pH(NOC) showed a clear trend with temperature, having a mean of 7.926±0.017 for θ < 10 °C and 8.068±0.021 for θ > 14 °C (Supplementary Figure S2). This trend was also visible for pHc(NOC), which had a mean of 8.007±0.013 for θ < 10 °C and 8.056±0.018 for θ > 14 °C.
Temperature-corrected pHc(NOC) was 0.005±0.008 higher than pHws (n = 4) calculated for the discrete samples collected at deployment and recovery (Figure 5A).
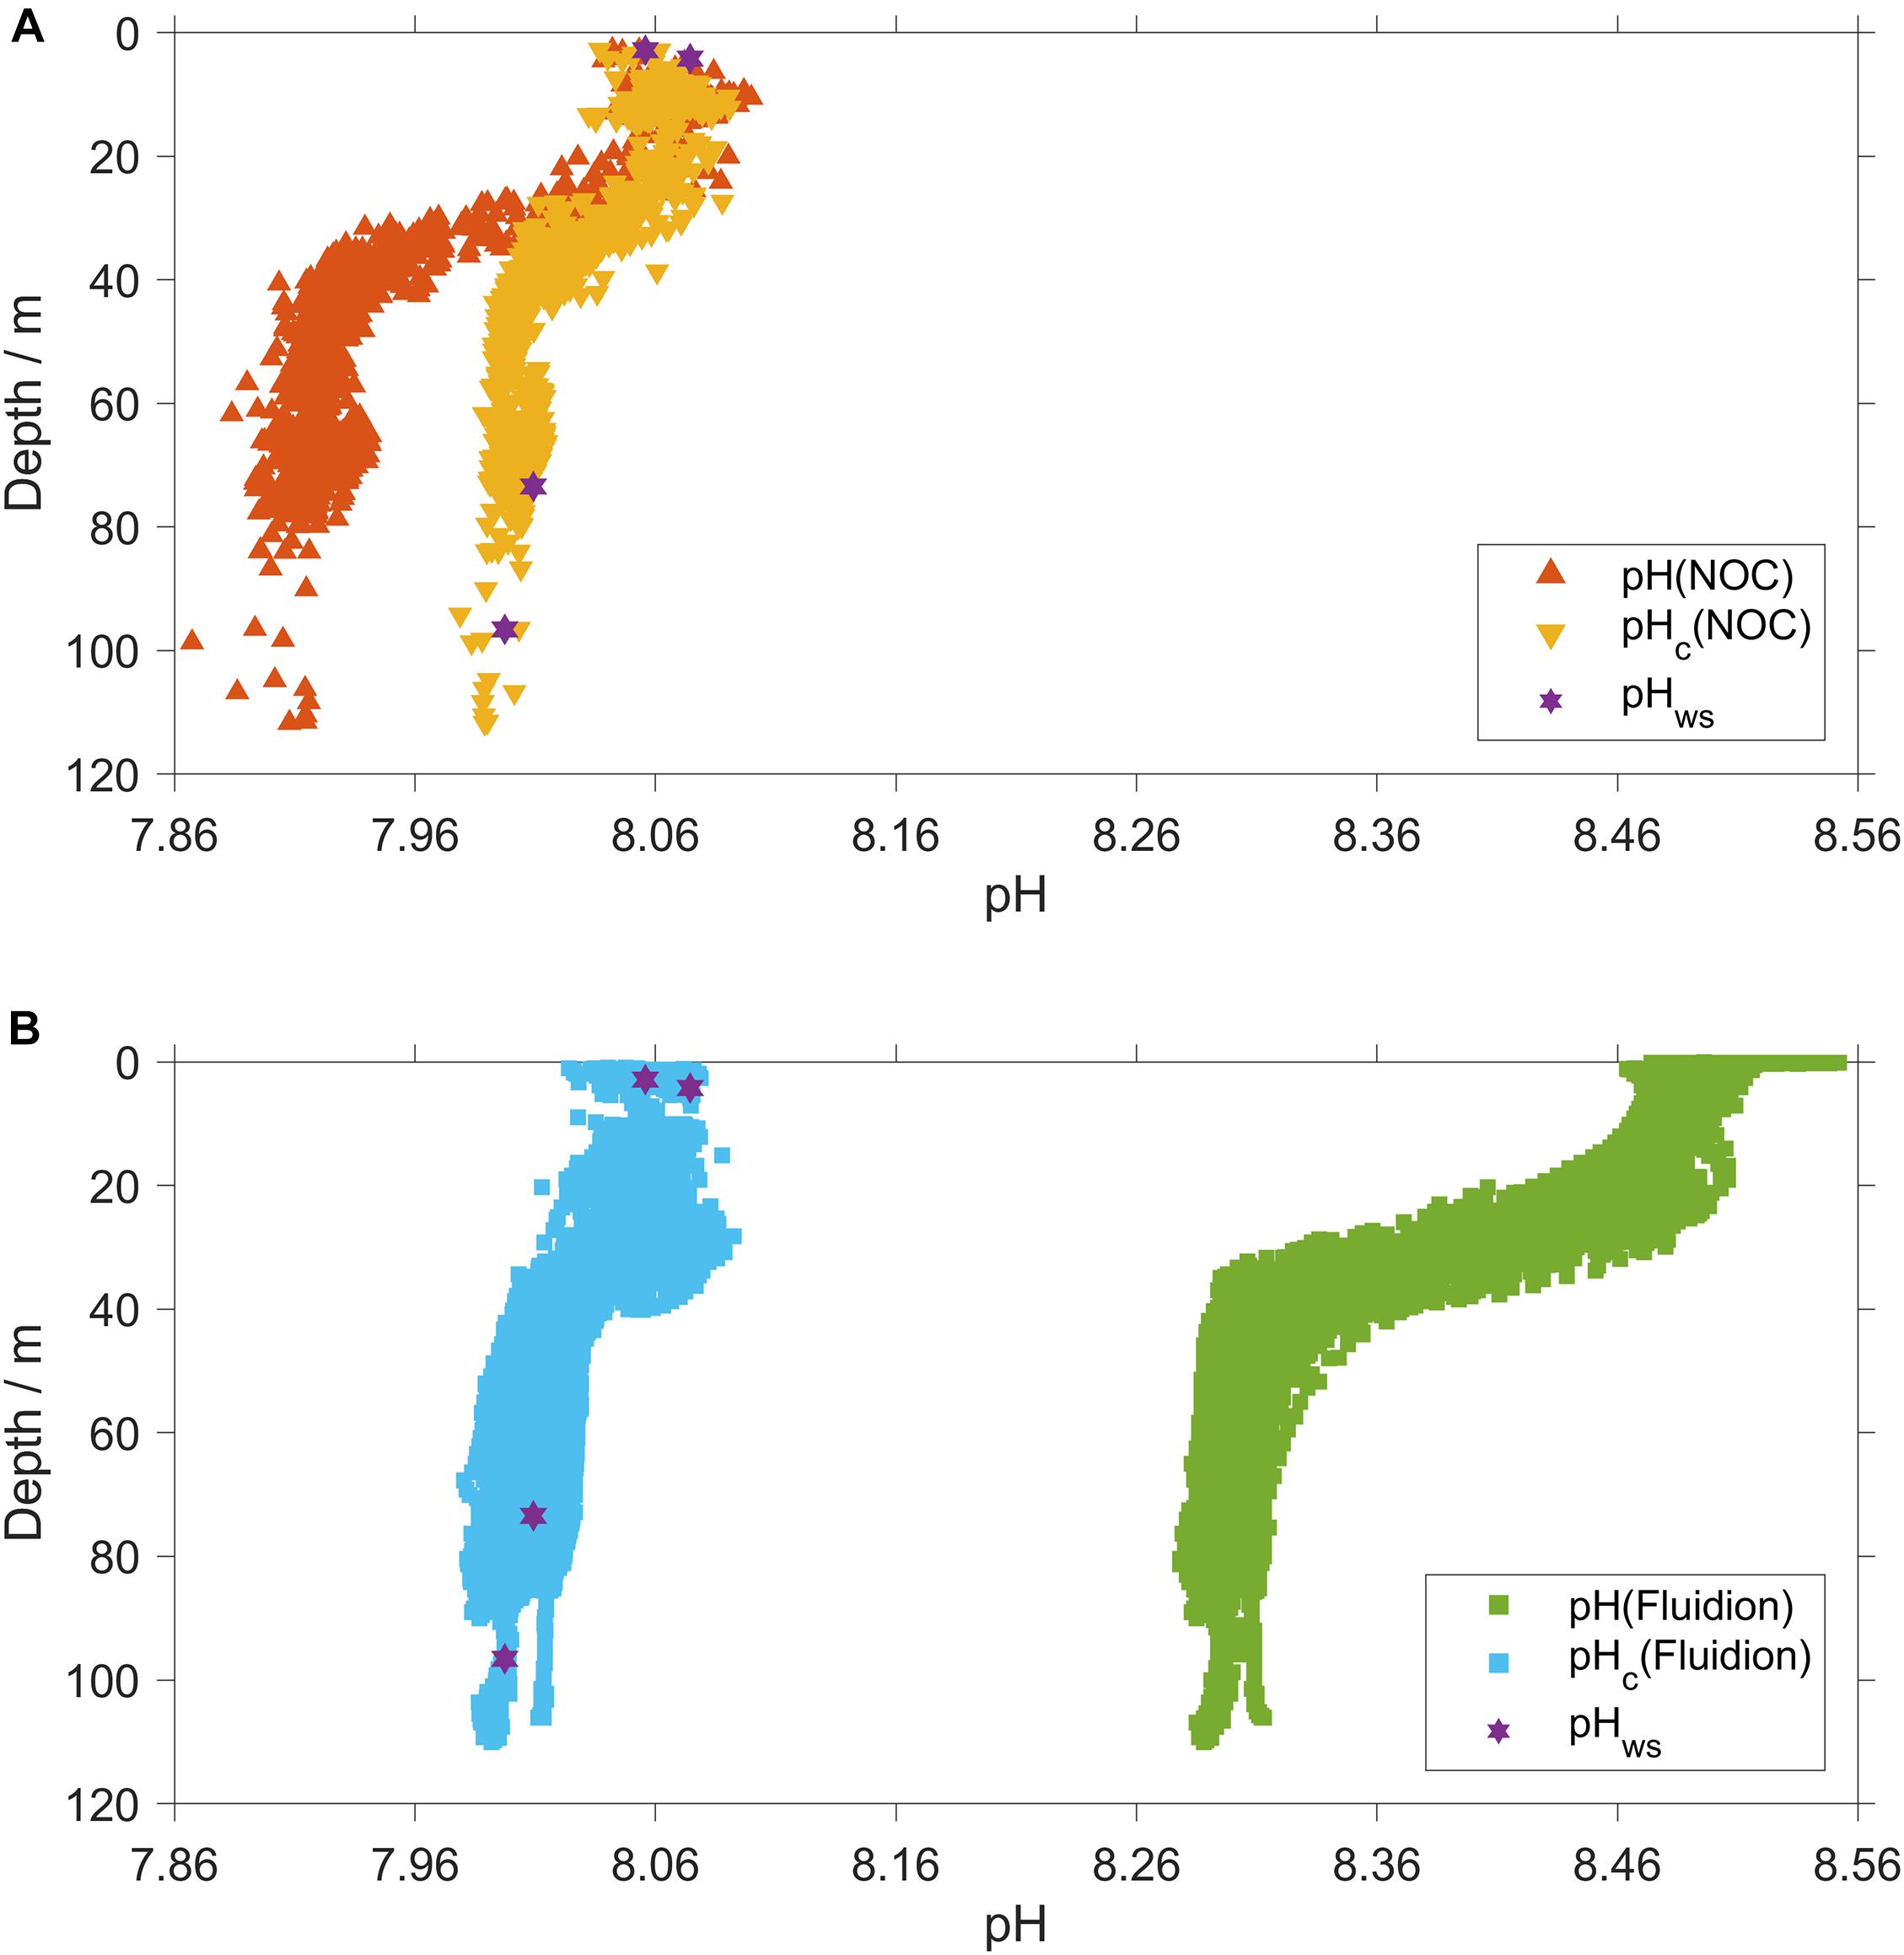
Figure 5. (A) NOC pH corrections. Red triangles: uncorrected, pH(NOC); yellow triangles: delay- and temperature corrected (Eq. 1), pHc(NOC). (B) Fluidion pH corrections. Green squares: uncorrected, pH(Fluidion); azure squares: temperature and pH calibrated using Eq. 3, pHc(Fluidion). Violet stars: discrete samples collected at glider deployment and recovery, pHws.
Potentiometric pH Sensor Corrections
The deep-water Fluidion pH sensor is a potentiometric sensor composed of a pressure-balanced glass electrode and a reference electrode (Ag/AgCl) in a plastic rod. The presence of a ceramic diaphragm containing a high number of pores allows quick equilibration with the external solution. To make the sensor H2S resistant, the electrolyte is a KCl gel without silver ions. The pH measured by this sensor is reported on the total scale.
During the deployment the sensor failed on day 3 after 53 glider dives due to a sensor file system management problem (a new file was created for each sample, which the processor was too slow to manage). The manufacturer of the potentiometric sensor (Fluidion) has since resolved this issue; now the sensor creates a single file for the whole deployment.
The manufacturer-stated response time is 1 s. We tested this in the laboratory and could confirm it to be <10 s. The response time was obtained by adding a drop of 1 M HCl to seawater, over a temperature range from 0.5 to 30 °C. Under all conditions, the response time was <10 s. Despite the fast pH response, a thermal lag correction and a scale adjustment of pH was necessary because the sensor temperature θ(Fluidion) adjusted only slowly over the sharp thermocline, which created a mismatch between glider descent and ascent, as shown by a comparison between the temperature of the Fluidion probe and the glider (conductivity-temperature) CT temperature (Supplementary Figure S3).
We first corrected the Fluidion sensor temperature, θ(Fluidion), using the temperature measured by the glider CT sensor, θ(CT), when they were both at equilibrium with the ambient water, i.e., in the top 20 m of the descent in the surface mixed layer (SML) and the beginning of the ascent in the BML, at depths greater than 50 m. This correction was necessary because θ(Fluidion) was not calibrated before the deployment. θ(Fluidion) was adjusted via linear regression of θ(CT) against θ(Fluidion) (Supplementary Figure S4):
The thermal lag effect and scale error of pH(Fluidion) was then corrected by linear regression of the pH difference to pHc(NOC) against θcal(Fluidion) (Supplementary Figure S5):
The Fluidion sensor was not calibrated before deployment, so the use of pHc(NOC) as reference also provided a correction of the Fluidion sensor measurements (Figure 5B).
Regional Algorithm to Estimate Total Alkalinity
To calculate c(DIC) and c(CO2), two variables were used: pHc(NOC) derived as described in section “Spectrophotometric LoC pH Sensor Corrections” and AT derived using a regional algorithm based on linear regression against practical salinity S. The AT algorithm was derived from 66 discrete samples collected in the northern North Sea for latitudes >55° N (Figure 1A), collected at two depths (near surface and near bottom). The derived best-fit AT as a function of S is:
with R2 = 0.51 and a root-mean square error of 12 μmol kg–1.
Glider pH measurements and AT,reg were used to calculate ccalc(DIC) and ccalc(CO2) in CO2SYS (Van Heuven et al., 2011). ccalc(DIC) was compared with cws(DIC) obtained for the discrete samples at glider deployment and recovery. The mean difference was (0.6±7.9) μmol kg–1. In the case of ccalc(CO2), the mean difference was (0.2±0.4) μmol kg–1. The non-zero biases and standard deviations are due to the uncertainties in the AT,reg parameterization and pHc(NOC).
Oxygen Optode Drift Correction
The oxygen optode output was lag-corrected using the method of Hahn (2013), giving cg,l(O2). Oxygen optodes may be affected by drift (Bittig and Körtzinger, 2015), especially for the fast-response foils used in the 4831F optode (Binetti et al., 2020). The optode was calibrated and drift-corrected using discrete rosette oxygen samples collected at glider deployment (4 and 97 m) and recovery (3, 20, and 73 m). The calibration function used a gain factor approach with a time-dependent drift, where Δt is the time elapsed since deployment (Supplementary Figure S6):
with a root mean square error of 0.0015.
Mounting the O2 optode facing downward reduced the presence of c(O2) spikes (often >500 μmol kg–1) that were encountered on previous missions in the first meters of the water column due to sunlight interference (Binetti et al., 2020). The elevated c(O2) values in the top 0.3 m during the glider ascent (filled red dots in Supplementary Figure S7) were possibly caused by the contact of the foil with air or light interference during the glider surface maneuver (albeit to a lesser extent than on previous missions, thanks to the downward facing mounting position).
Using the calibrated and lag-corrected cg,c(O2), we calculated oxygen saturation s(O2) as the ratio between cg,c(O2) and the saturation content csat(O2) (Garcia and Gordon, 1992) at an atmospheric pressure of 1 atm = 1013.25 hPa.
The Rinko optode attached to the rosette was calibrated based on a linear regression between discrete Winkler samples and the oxygen content measured by the rosette optode, cr(O2):
with a root-mean-square error of 1.1 μmol kg–1.
Air-Sea Gas Flux Calculation
The air-sea flux of oxygen, Φ(O2), was calculated for each glider dive using the median of c(O2), θ and S in the top 10 m of the surface mixed layer. A positive flux is out of the ocean into the atmosphere. The air-sea flux was calculated using the O2 concentration C(O2) derived from the oxygen content c(O2) by multiplication with the water density (about 1027 kg m–3, but we used the actual values). We used the parameterization of Woolf and Thorpe (1991) to include the bubble equilibrium supersaturation:
where kw(O2) is the gas transfer coefficient, B(O2) is the increase of equilibrium supersaturation due to bubble injection and csat(O2) is the oxygen saturation. csat(O2) was calculated from S and θ at the sea level pressure (pbaro) downloaded from ECMWF using the solubility coefficients of Benson and KrauseJr. (1984), as fitted by Garcia and Gordon (1992). B(O2) was calculated from the following equation:
where U0 = 9 m s–1 (Woolf and Thorpe, 1991). U is the wind speed at 10 m above sea-level (ECMWF ERA5)1. The reanalysis data have a spatial resolution of 0.25° latitude, 0.25° longitude and 1 h in time, and were interpolated to the glider position at the beginning of each dive.
kw(O2) and Schmidt number, Sc(O2), were calculated as per Wanninkhof (2014):
kw(O2) was weighted over 7 days prior to sampling using Eq. 6 in Reuer et al. (2007), but without the correction factor 1−ωend in the denominator of Reuer’s equation (Gloël, 2012).
The CO2 air-sea flux, Φ(CO2), was calculated using the kw parameterization as for O2, but without bubble correction. As for O2, we used the CO2 concentration C(CO2) derived from the CO2 content c(CO2) by multiplication with the water density. The air-saturation concentration Csat(CO2) was calculated as,
where pbaro is the mean sea level pressure downloaded from ECMWF and F(CO2) is the CO2 solubility function calculated from surface θ and S (Weiss and Price, 1980). We did not measure the atmospheric CO2 dry amount fraction xatm(CO2); however, a temperate northern hemisphere background value should be a good approximation since the transect was remote from local sources. The Greenhouse Gases Reference Network site (Dlugokencky et al., 2015) closest to the deployment is Mace Head in western Ireland, which recorded xatm(CO2) = (401.0±1.4) μmol mol–1 during August 20192.
As surface seawater C(CO2), we used the median in the top 15 m for glider ascent and descent of the following dive. Φ(CO2) was then calculated as:
kw(CO2) and Sc(CO2) were calculated using the parameterizations of Wanninkhof (2014):
kw(CO2) was weighted over 7 days prior to sampling, just as described for kw(O2) above.
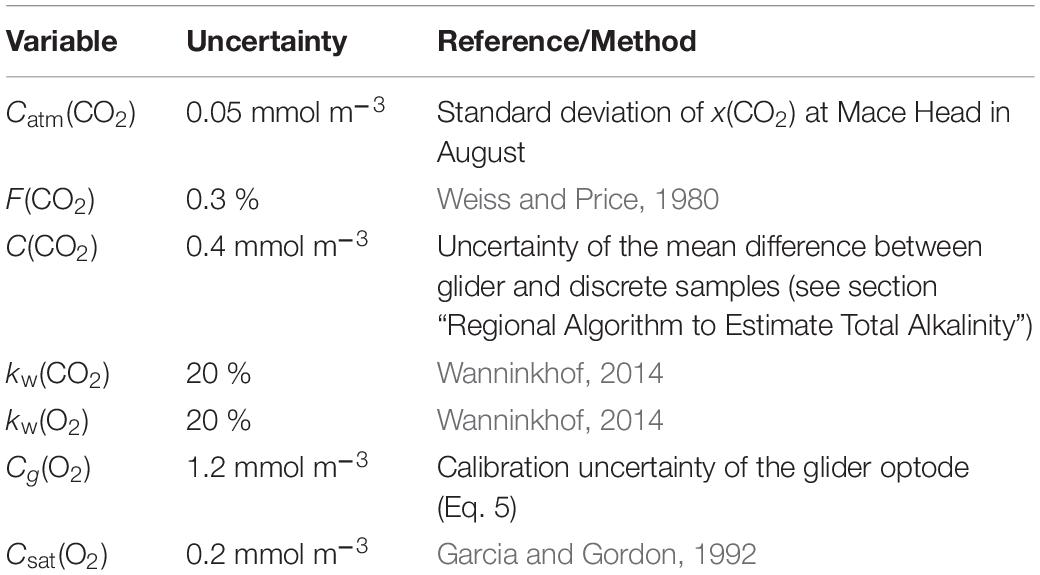
The uncertainties in Φ(O2) and Φ(CO2) were evaluated using a Monte-Carlo approach. The uncertainties of the input variables are shown in Table 1; the analysis was repeated 1,000 times. The total uncertainty in Φ was calculated as the standard deviation of the Monte-Carlo runs.
Apparent Carbon Production (ACP)
To quantify remineralization in deep waters, we calculated apparent (inorganic) carbon production. This quantity includes the impact of benthic fluxes on water column values. The calculations assume that CO2 equilibrates between atmosphere and ocean at the surface. According to this concept, the water parcel leaves the surface in a state of equilibrium with saturation s(CO2) = c(CO2)/csat(CO2; 1 atm) = 1.
We assume that the water mass was most recently in contact with the atmosphere in March 2019 in the North Atlantic (59.7° N, 2.0° W). This assumption was made because the water residence time in the North Sea is less than 1 year (Salt et al., 2013), the northern North Sea is dominated by the Atlantic inflow (Thomas et al., 2005a), and is vertically mixed down to the seafloor and brought close to equilibrium with atmospheric CO2 each winter (Hartman et al., 2019). The North Sea starts to stratify in March/April (Sharples et al., 2006); and according to SOCAT (Bakker et al., 2016) the difference between the seawater and atmospheric xatm(CO2) for the central and northern North Sea (from 55 to 60° N and from 3° W to 2° E) in March 2019 had a median of −39±6 μmol mol–1 (Supplementary Figure S8). For that reason, we assume that BML has not been in contact with the atmosphere from at least March.
The March 2019 average atmospheric dry amount fraction x(CO2) was 415.68 μmol mol–1 at Mace Head. We calculated psat(CO2) using the median seawater temperature in BML and assuming 100% humidity as in Eq. 10. AT,reg and csat(CO2) were used as inputs in CO2SYS (Van Heuven et al., 2011) to calculate the DIC air-saturation content csat(DIC). ACP was calculated as the difference between glider cg(DIC) and csat(DIC).
Apparent Oxygen Utilization (AOU)
To quantify the oxygen consumption during respiration, we calculated AOU as difference between csat(O2) and c(O2) (Ogura, 1970). This assumes that O2 equilibrates between atmosphere and ocean at the surface. As for ACP, the water parcel leaves the surface in a state of equilibrium with saturation s(O2) = c(O2)/csat(O2; 1 atm) = 1.
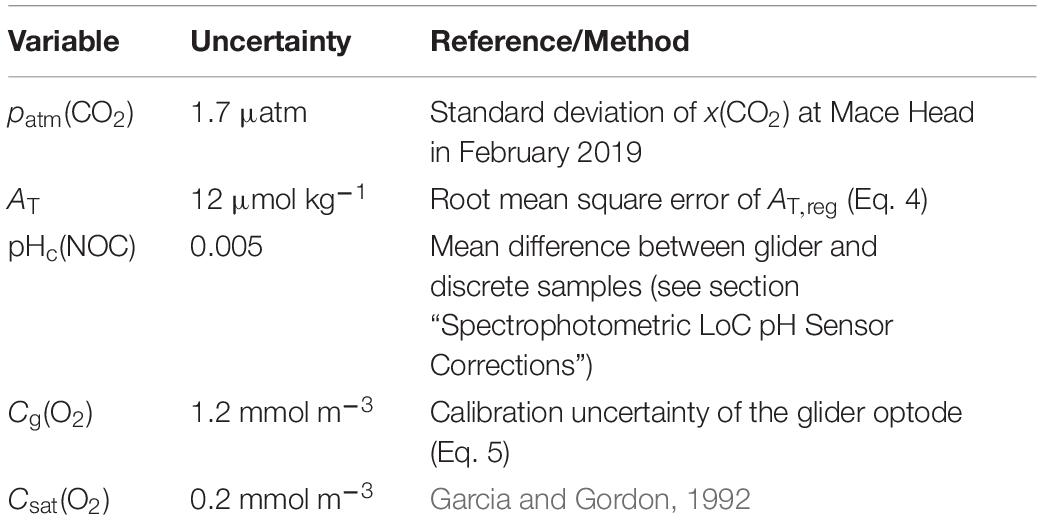
The uncertainties in AOU and ACP were evaluated with 1,000 Monte-Carlo runs using the uncertainties of the input variables in Table 2.
Results
Three Different Regimes Along the Glider Transect
The glider was deployed in the seasonally stratified northern North Sea where a strong thermocline divided the water column into a surface mixed layer down to a depth (zmix) between 5 and 29 m, and a bottom mixed layer from 40 m down to the bottom.
In the SML, salinity gradually increased from 34.7 to 34.8 (Figure 3B), from south to north. The temperature (θ) profile also changed: on 21 August (around 56.80° N), surface θ decreased from 15.8 to 14.7 °C (Figure 3A). On 25 August (around 56.99° N), θ started to increase reaching its maximum of 15.5 °C on 28 August (57.04° N). SML c(O2) increased along the transect from 248 to 263 μmol kg–1 (Figure 6A). In contrast, SML pH did not show a trend, with a median value of 8.062 (Figure 3).
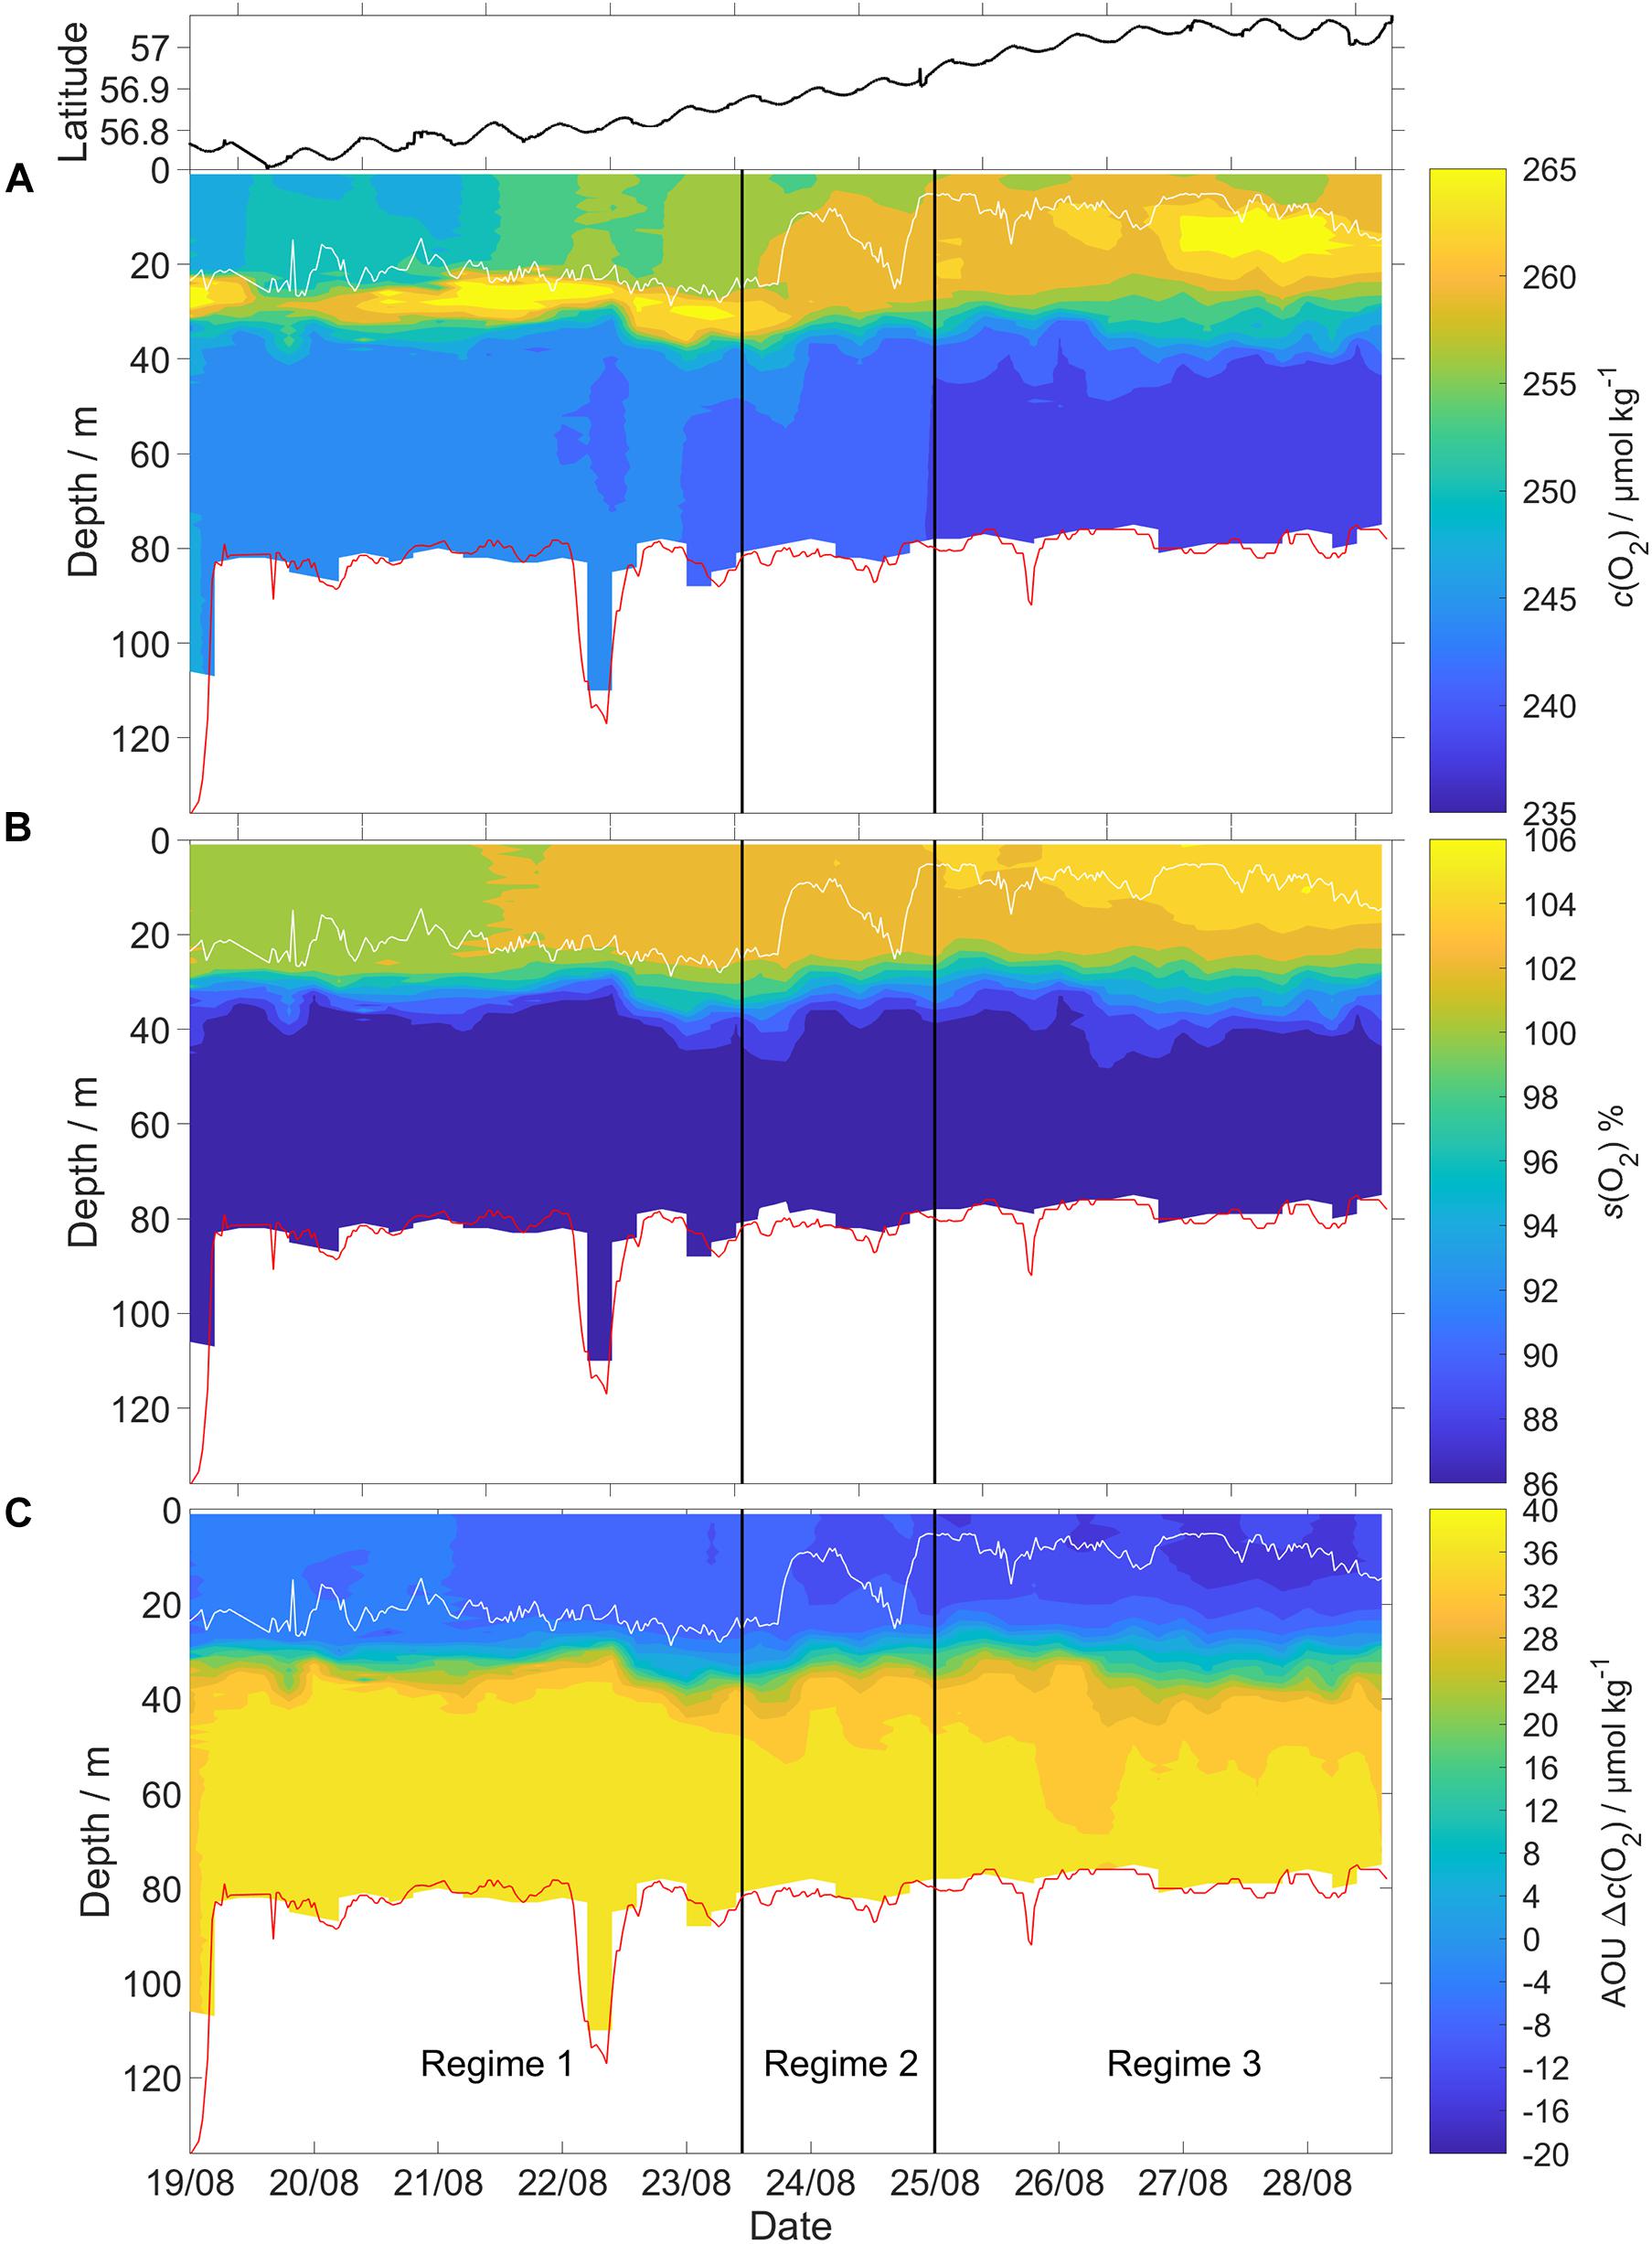
Figure 6. The glider deployment was divided into three different regimes based on salinity. Each regime also had a distinct vertical pattern of (A) c(O2), (B) the saturation ratio [s(O2)] percentage, defined as c(O2)/csat(O2) × 100, and (C) apparent oxygen utilization (AOU) calculated according to the method in section “Apparent Oxygen Utilization (AOU).” The vertical black lines show the regime boundaries. White line: surface mixed layer depth (zmix). Red line: GEBCO bathymetry. Top panel: glider latitude.
Based on the BML (z >60 m) variations in salinity along the transect, the deployment can be divided into three distinct regimes (Figure 6) with different c(O2) characteristics. The (southernmost) regime 1 was identified as Central North Sea Water or CNSW [S(BML) was < 34.8]; the (northernmost) regime 3 was influenced by North Atlantic Water (NAW) [S(BML) > 34.82]; regime 2 in between had S(BML) between 34.8 and 34.82, corresponding to a mix of CNSW and NAW.
Regime 1 (56.72 to 56.86° N, 19 to 23 August) was characterized by a subsurface oxygen concentration maximum (SOM) at depths between 20 and 30 m. At the SOM, c(O2) was 267 μmol kg–1. Surface c(O2) increased northward from 248 to 258 μmol kg–1. The SML was always oxygen-supersaturated; the saturation ratio s(O2) = c(O2)/csat(O2) varied from 1.01 to 1.03.
Regime 2 (56.87 to 56.93° N, 23 to 25 August) showed no SOM and zmix varied between 24 and 9 m. Surface S increased from 34.6 to 34.8, presumably due to Atlantic-influenced waters (Queste et al., 2013). This higher S was accompanied by higher c(O2, SML) and a drop of surface θ. The increase of c(O2, SML) to 260 μmol kg–1 is only partially explained by the csat(O2) increase from 247 to 250 μmol kg–1, resulting in a higher s(O2) value of 1.05 in regime 2.
Regime 3 (56.94 to 57.08° N, 25 to 28 August) also displayed an SOM between 10 and 20 m, i.e., shallower than in regime 1. c(O2, SML) reached a maximum of 262 μmol kg–1, with s(O2) = 106%. c(O2, SOM) was 268 μmol kg–1, also with s(O2) = 106% (identical to the SML value due to lower θ.
During the first 2 days of deployment the Fluidion sensor detected a pH increase of about 0.02 at the SOM (Figure 7). This may be due photosynthesis increasing surface pH, associated with a corresponding c(O2) increase (Figure 6A). The lower-resolution measurements of the LoC sensor did not clearly reveal this pH maximum (Figure 3E), demonstrating the benefit of the novel sensor combination tested.
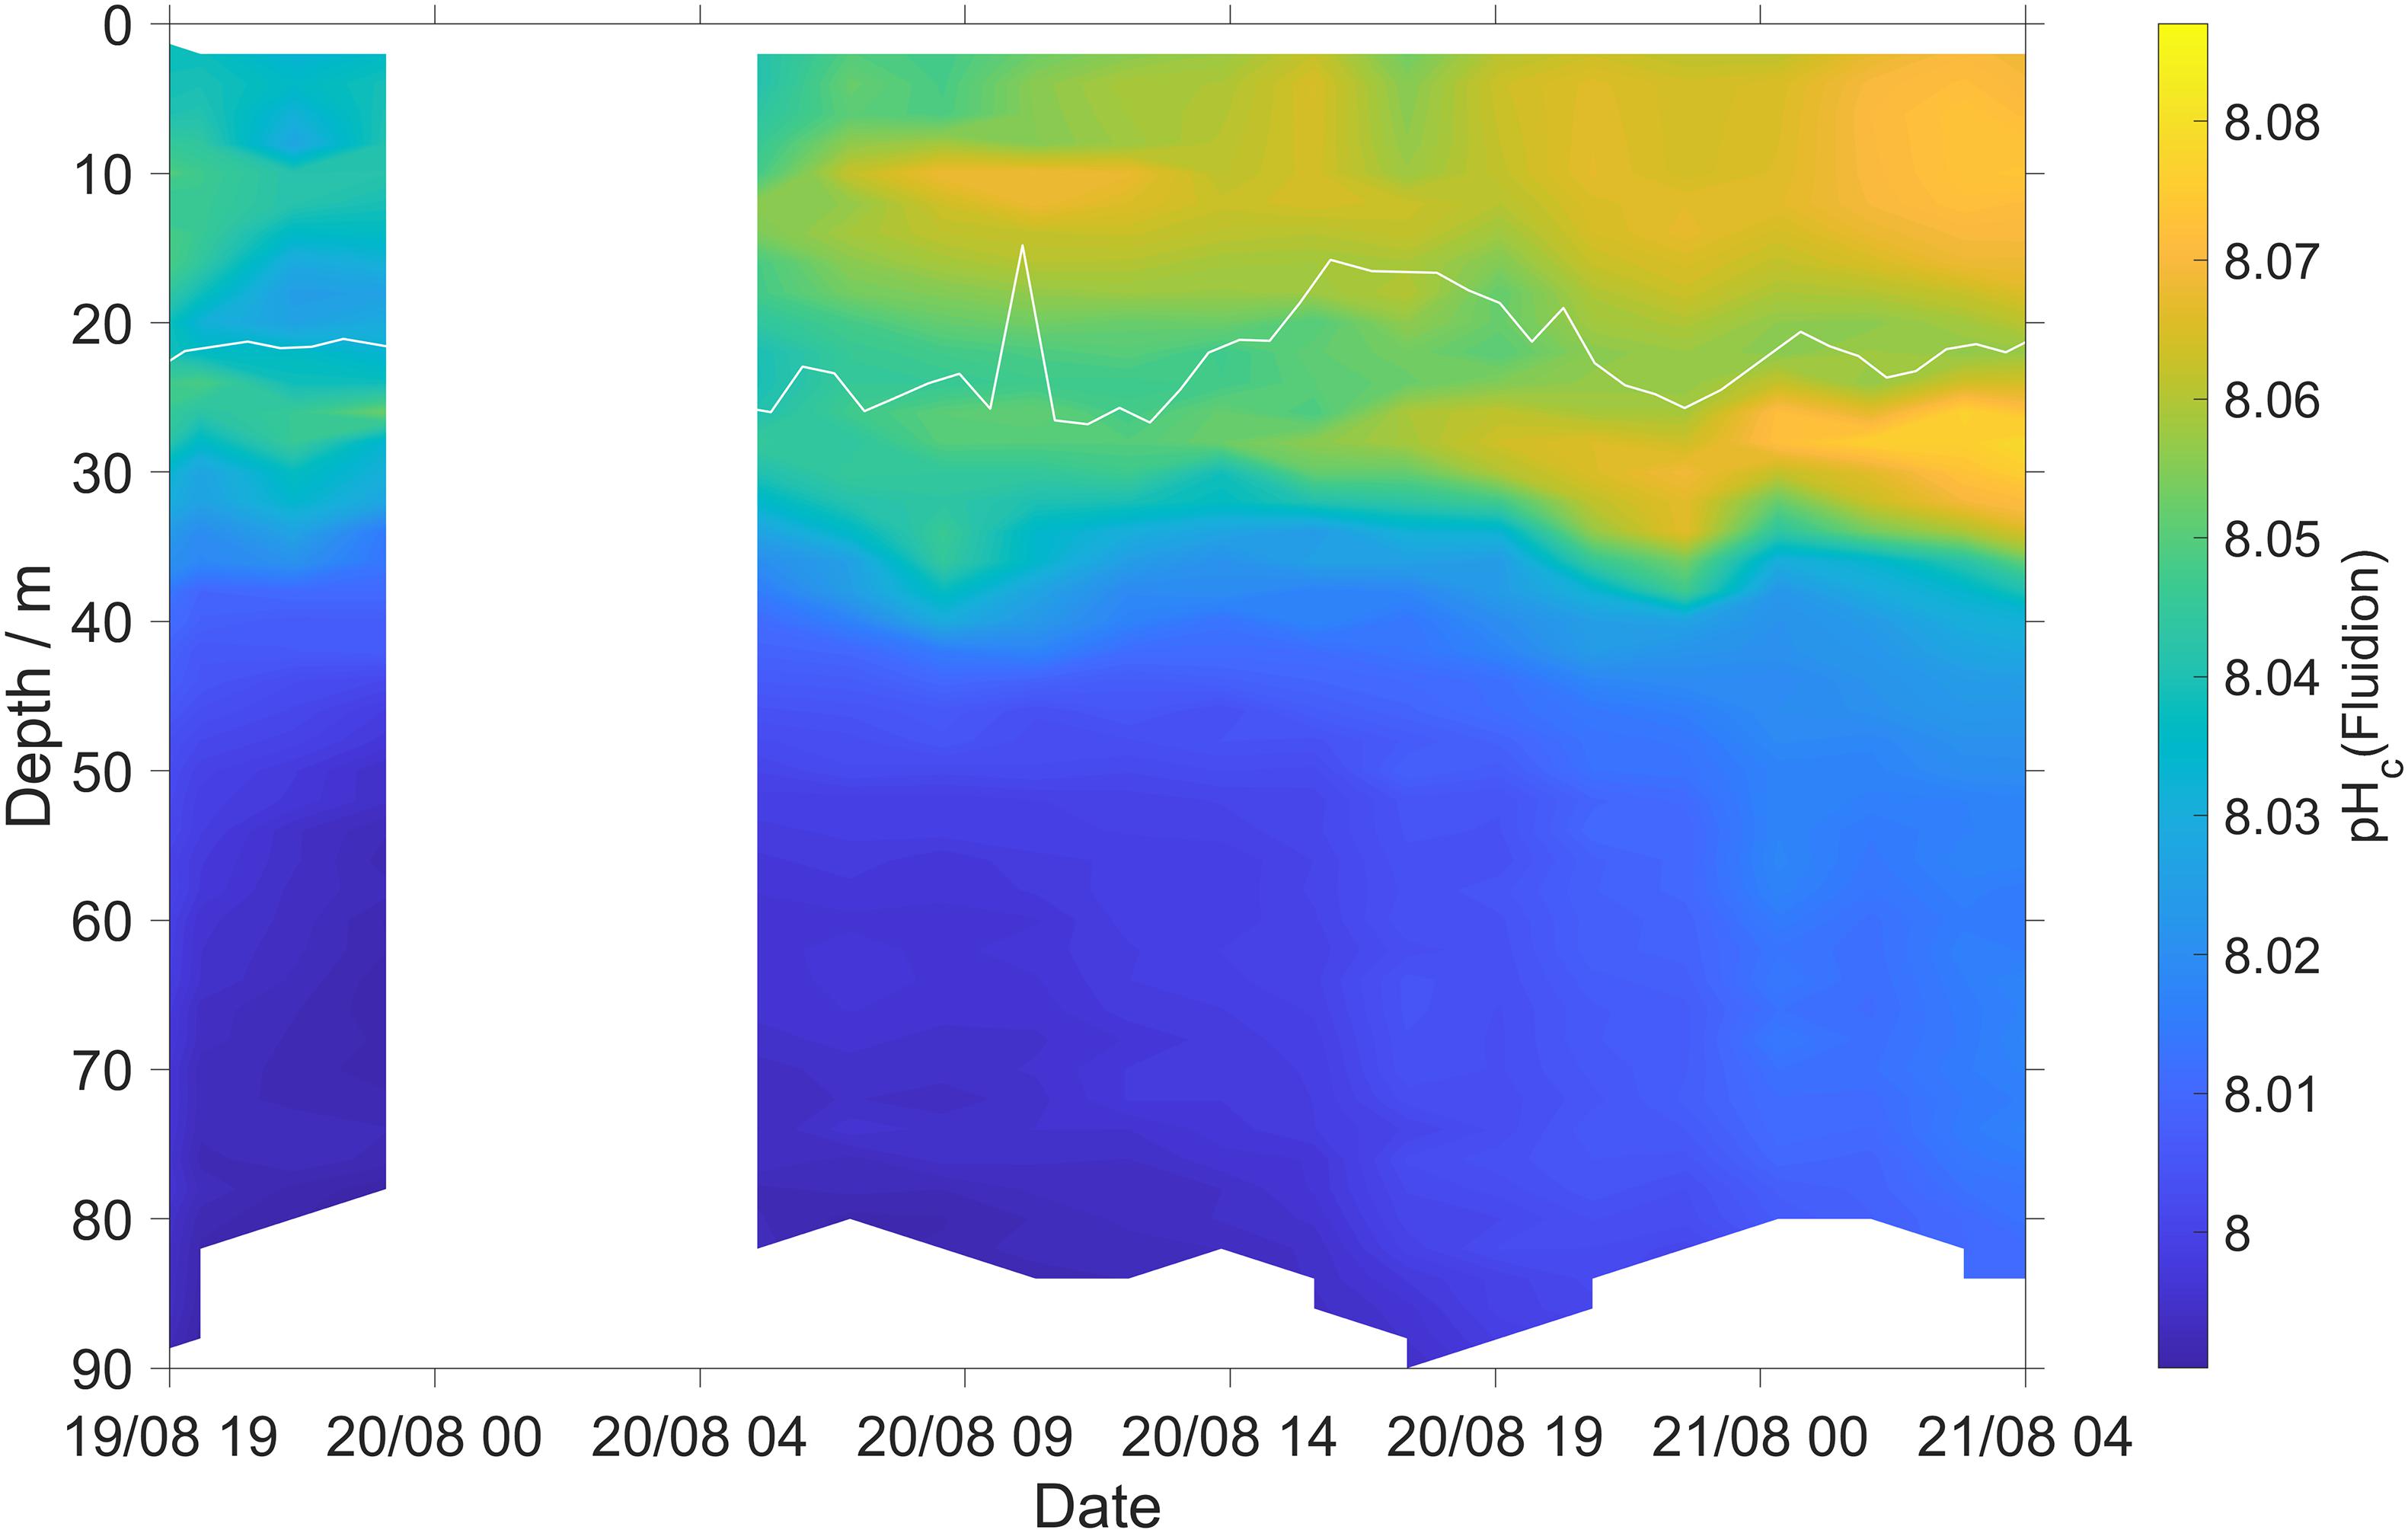
Figure 7. Thermal-lag corrected and calibrated Fluidion pH sensor measurements (Eq. 3). White line: surface mixed layer depth (zmix).
Air-Sea Exchange
Throughout the transect, the SML was oxygen-supersaturated, due to net community production (Figure 8).
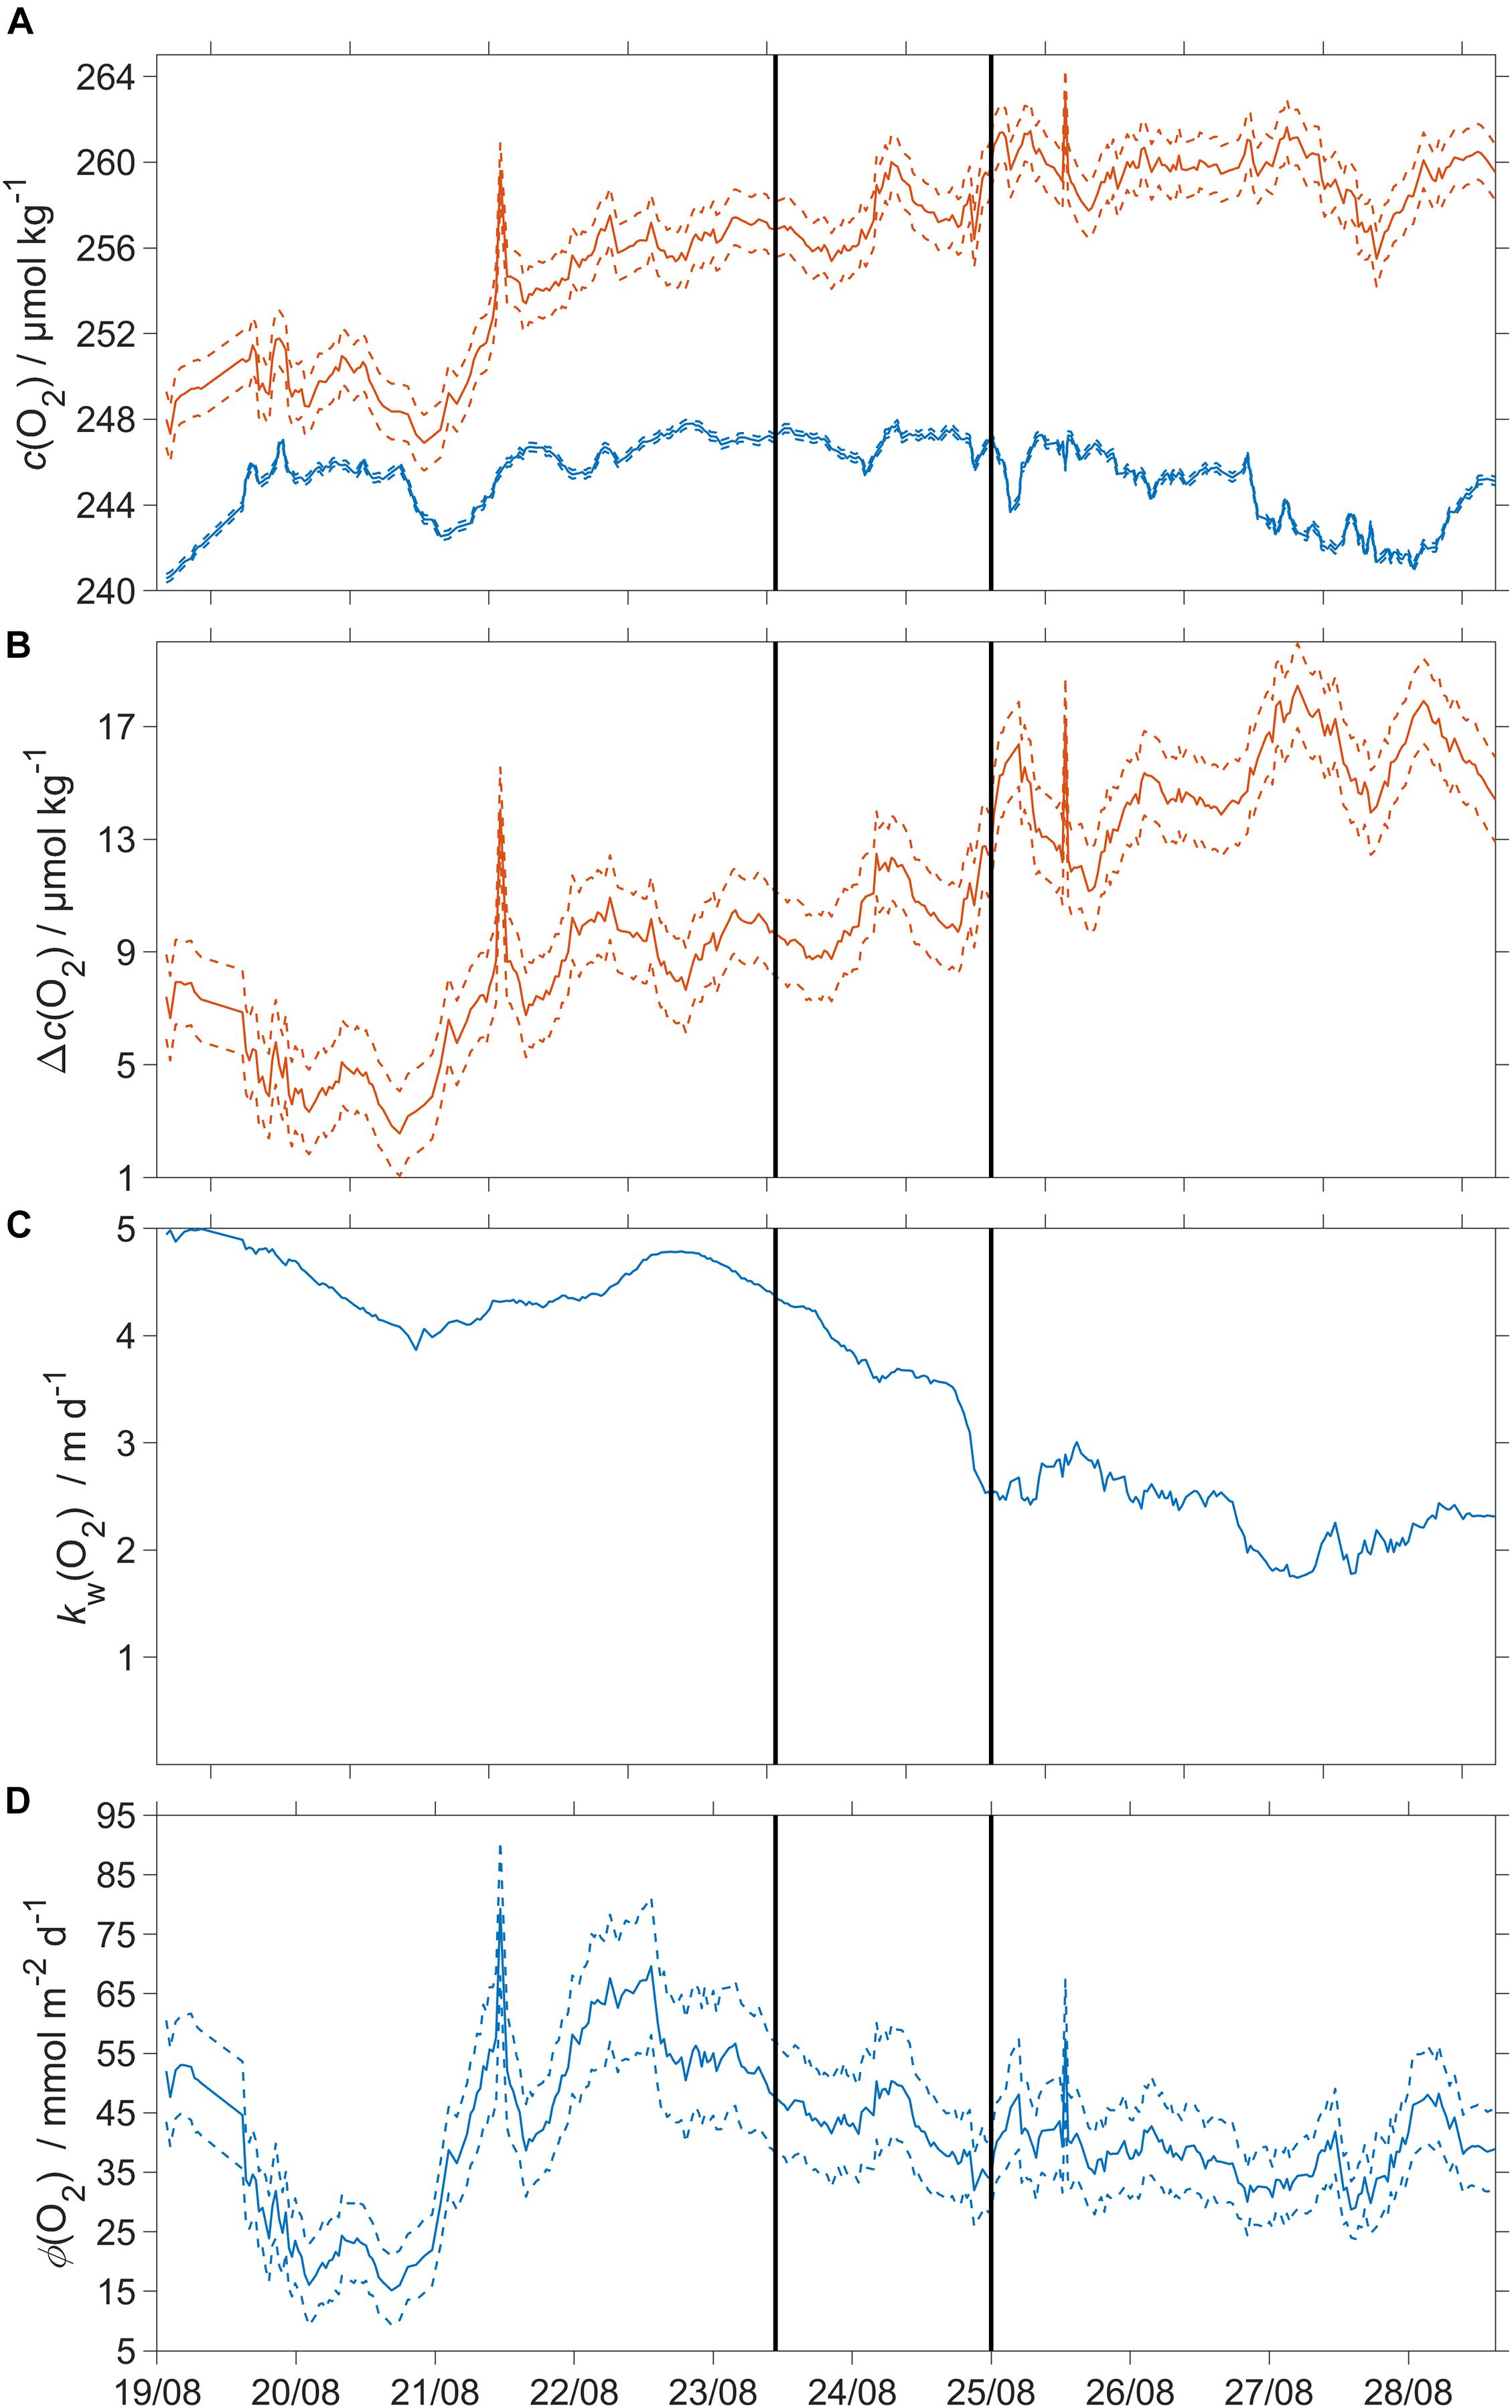
Figure 8. Oxygen air-sea flux and related quantities. Dashed lines represent uncertainties and the black vertical lines divide the three regimes. (A) Blue: csat(O2), red: c(O2); (B) Δc(O2) = c(O2) – csat(O2), (C) kw(O2) weighted over the preceding 7 days (Reuer et al., 2007); (D) oxygen air-sea flux Φ(O2). The flux from sea to air is positive while that from air to sea is negative.
The surface saturation anomaly Δc(O2) was (7±2) μmol kg–1 at deployment and continuously increased to (18±2) μmol kg–1 (Figure 8B). Φ(O2) was positive, with a median sea-to-air flux of 40 mmol m–2 d–1 (5th centile: 21 mmol m–2 d–1; 95th centile: 61 mmol m–2 d–1). The changes of Φ(O2) were due to temporal changes in Δc(O2) across the three regimes.
Φ(CO2) was not significantly different from zero across all three regimes: −0.4 mmol m–2 d–1 (5th centile: −1.6 mmol m–2 d–1; 95th centile: 1.4 mmol m–2 d–1) (Figure 9).
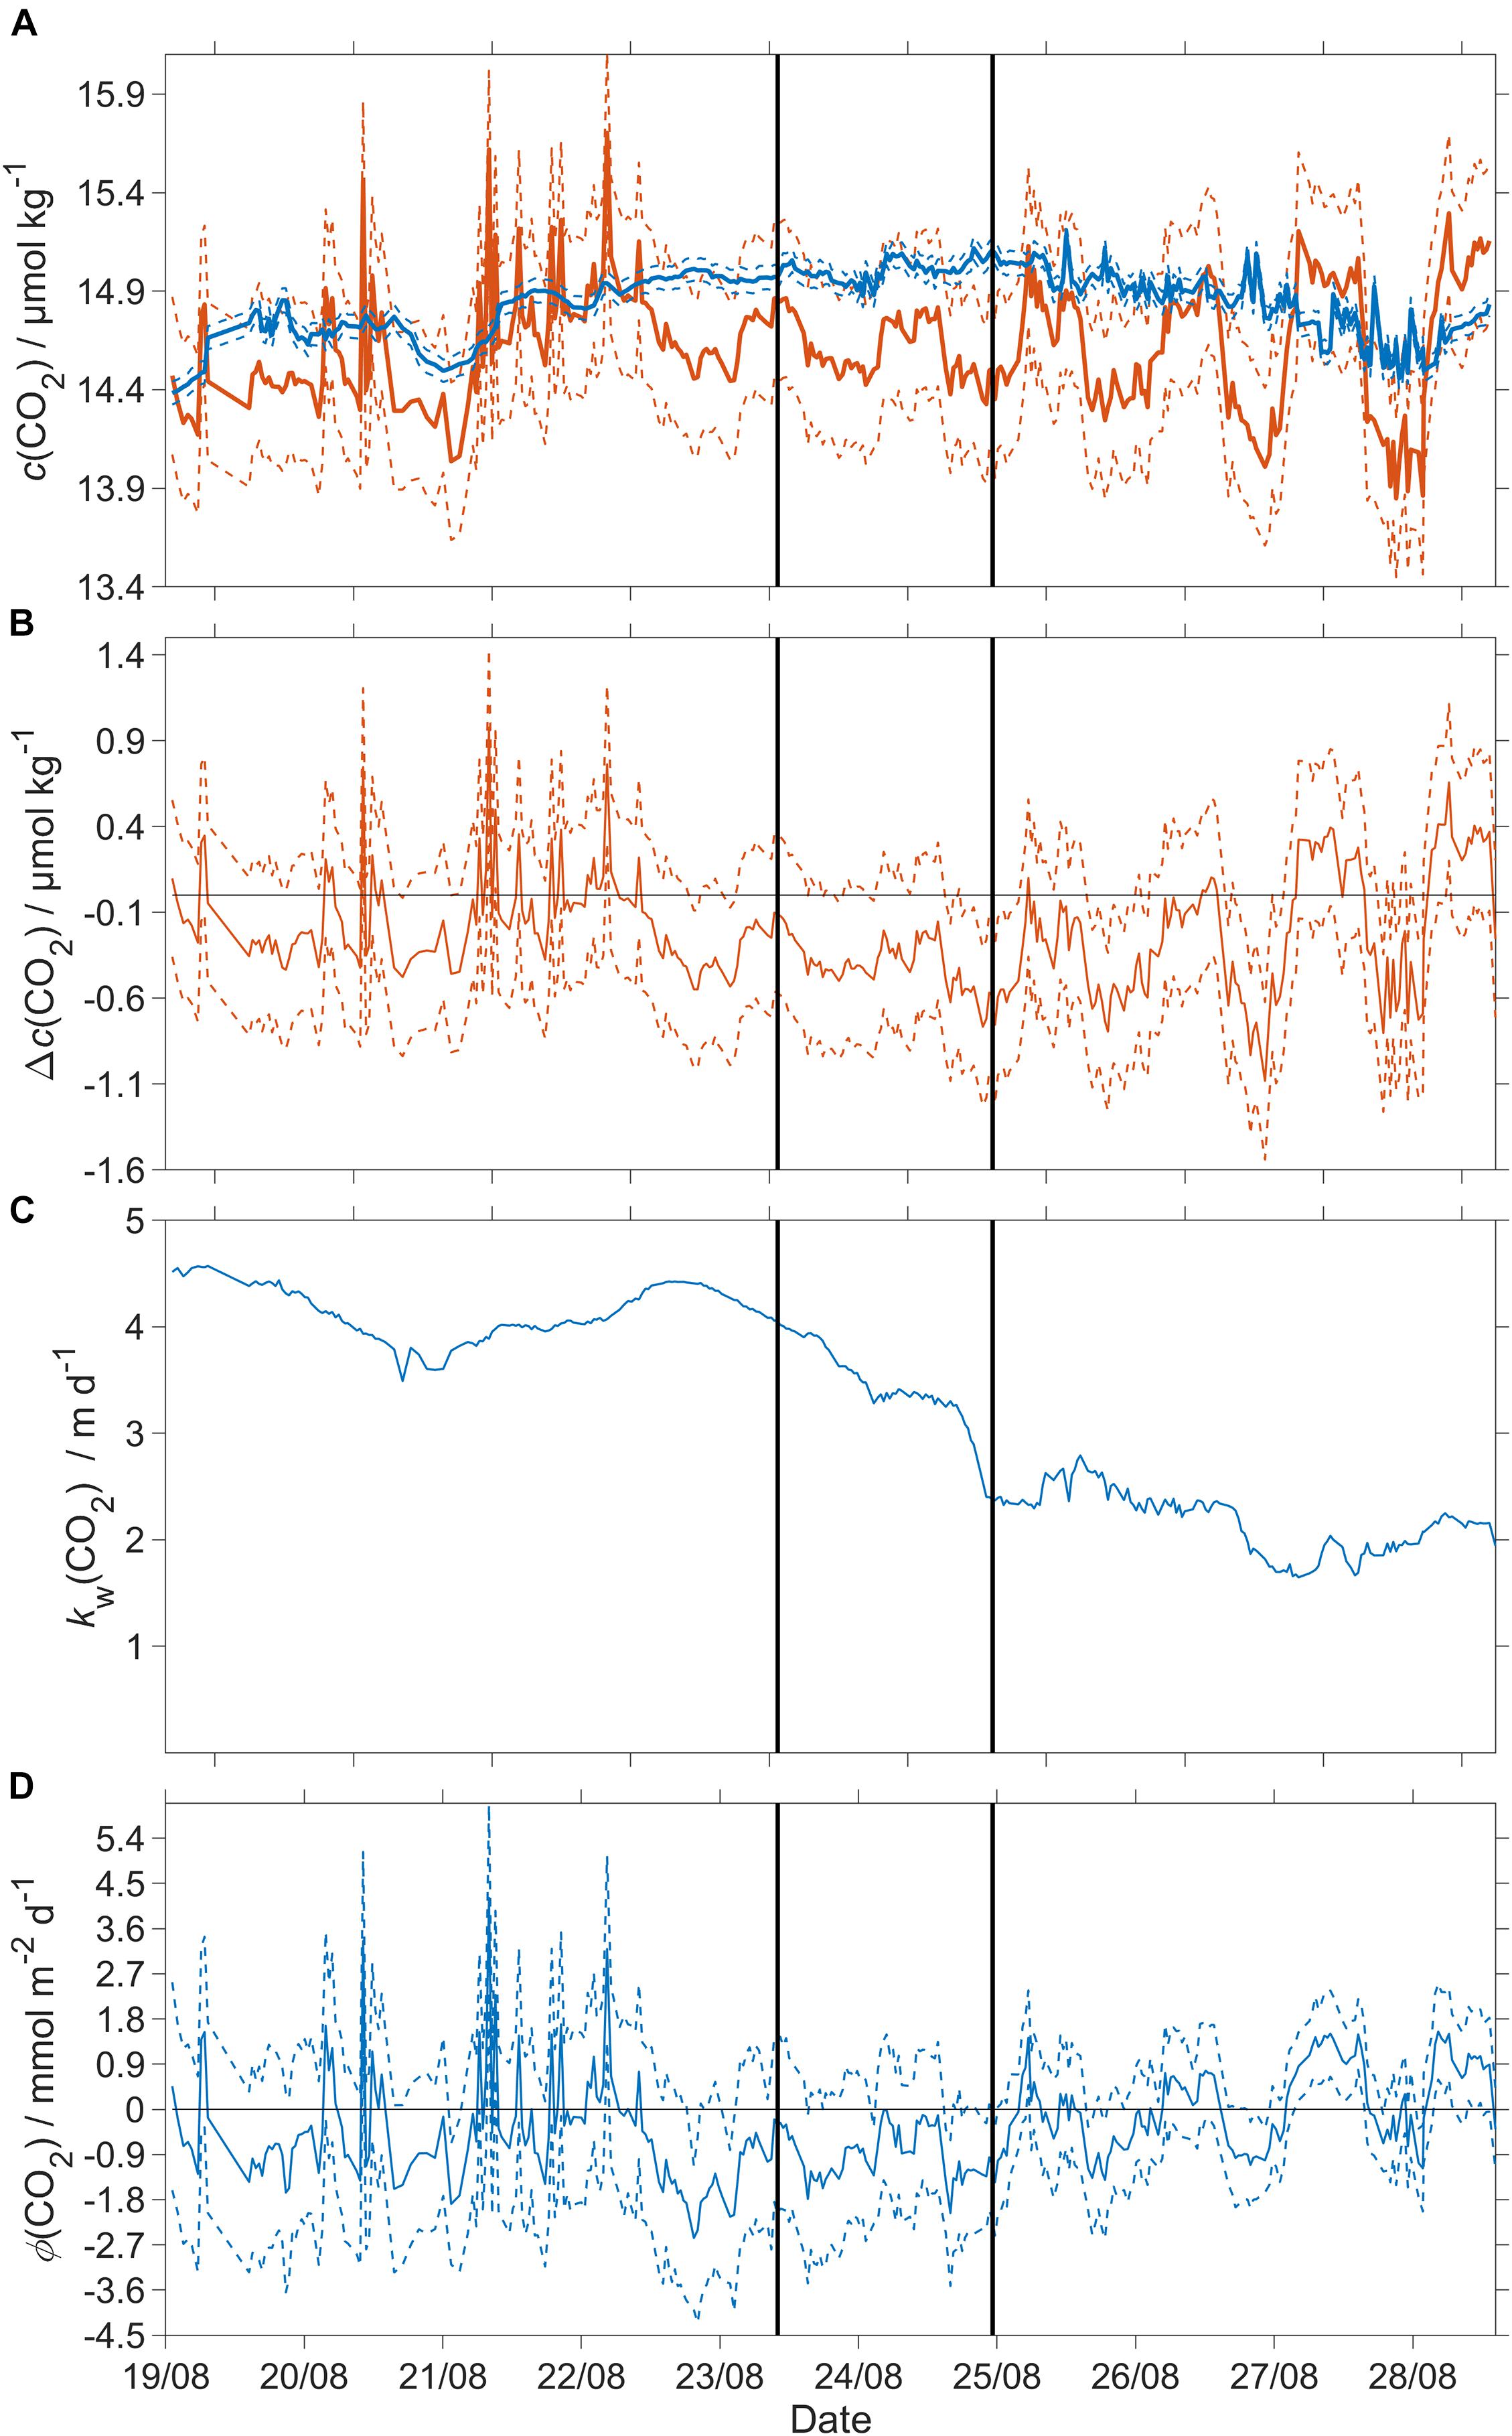
Figure 9. CO2 air-sea flux and related quantities. Dashed lines represent uncertainties and the black vertical lines divide the three regimes. (A) Blue: csat(CO2), red: c(CO2); (B) Δc(CO2) = c(CO2) – csat(CO2), (C) kw(CO2), weighted over the preceding 7 days (Reuer et al., 2007); (D) CO2 air-sea flux Φ(CO2). The flux from sea to air is positive while that from air to sea is negative. A decrease of x(CO2) by 10 μmol mol–1 results in a decrease of atmospheric CO2 content [catm(CO2)] of −0.37 μmol kg–1.
Remineralization in the Bottom Mixed Layer
The glider encountered three distinct regimes defined by their salinity below 60 m (see section “Three Different Regimes Along the Glider Transect”) and characterized by different c(O2) and c(DIC) (Figure 10).
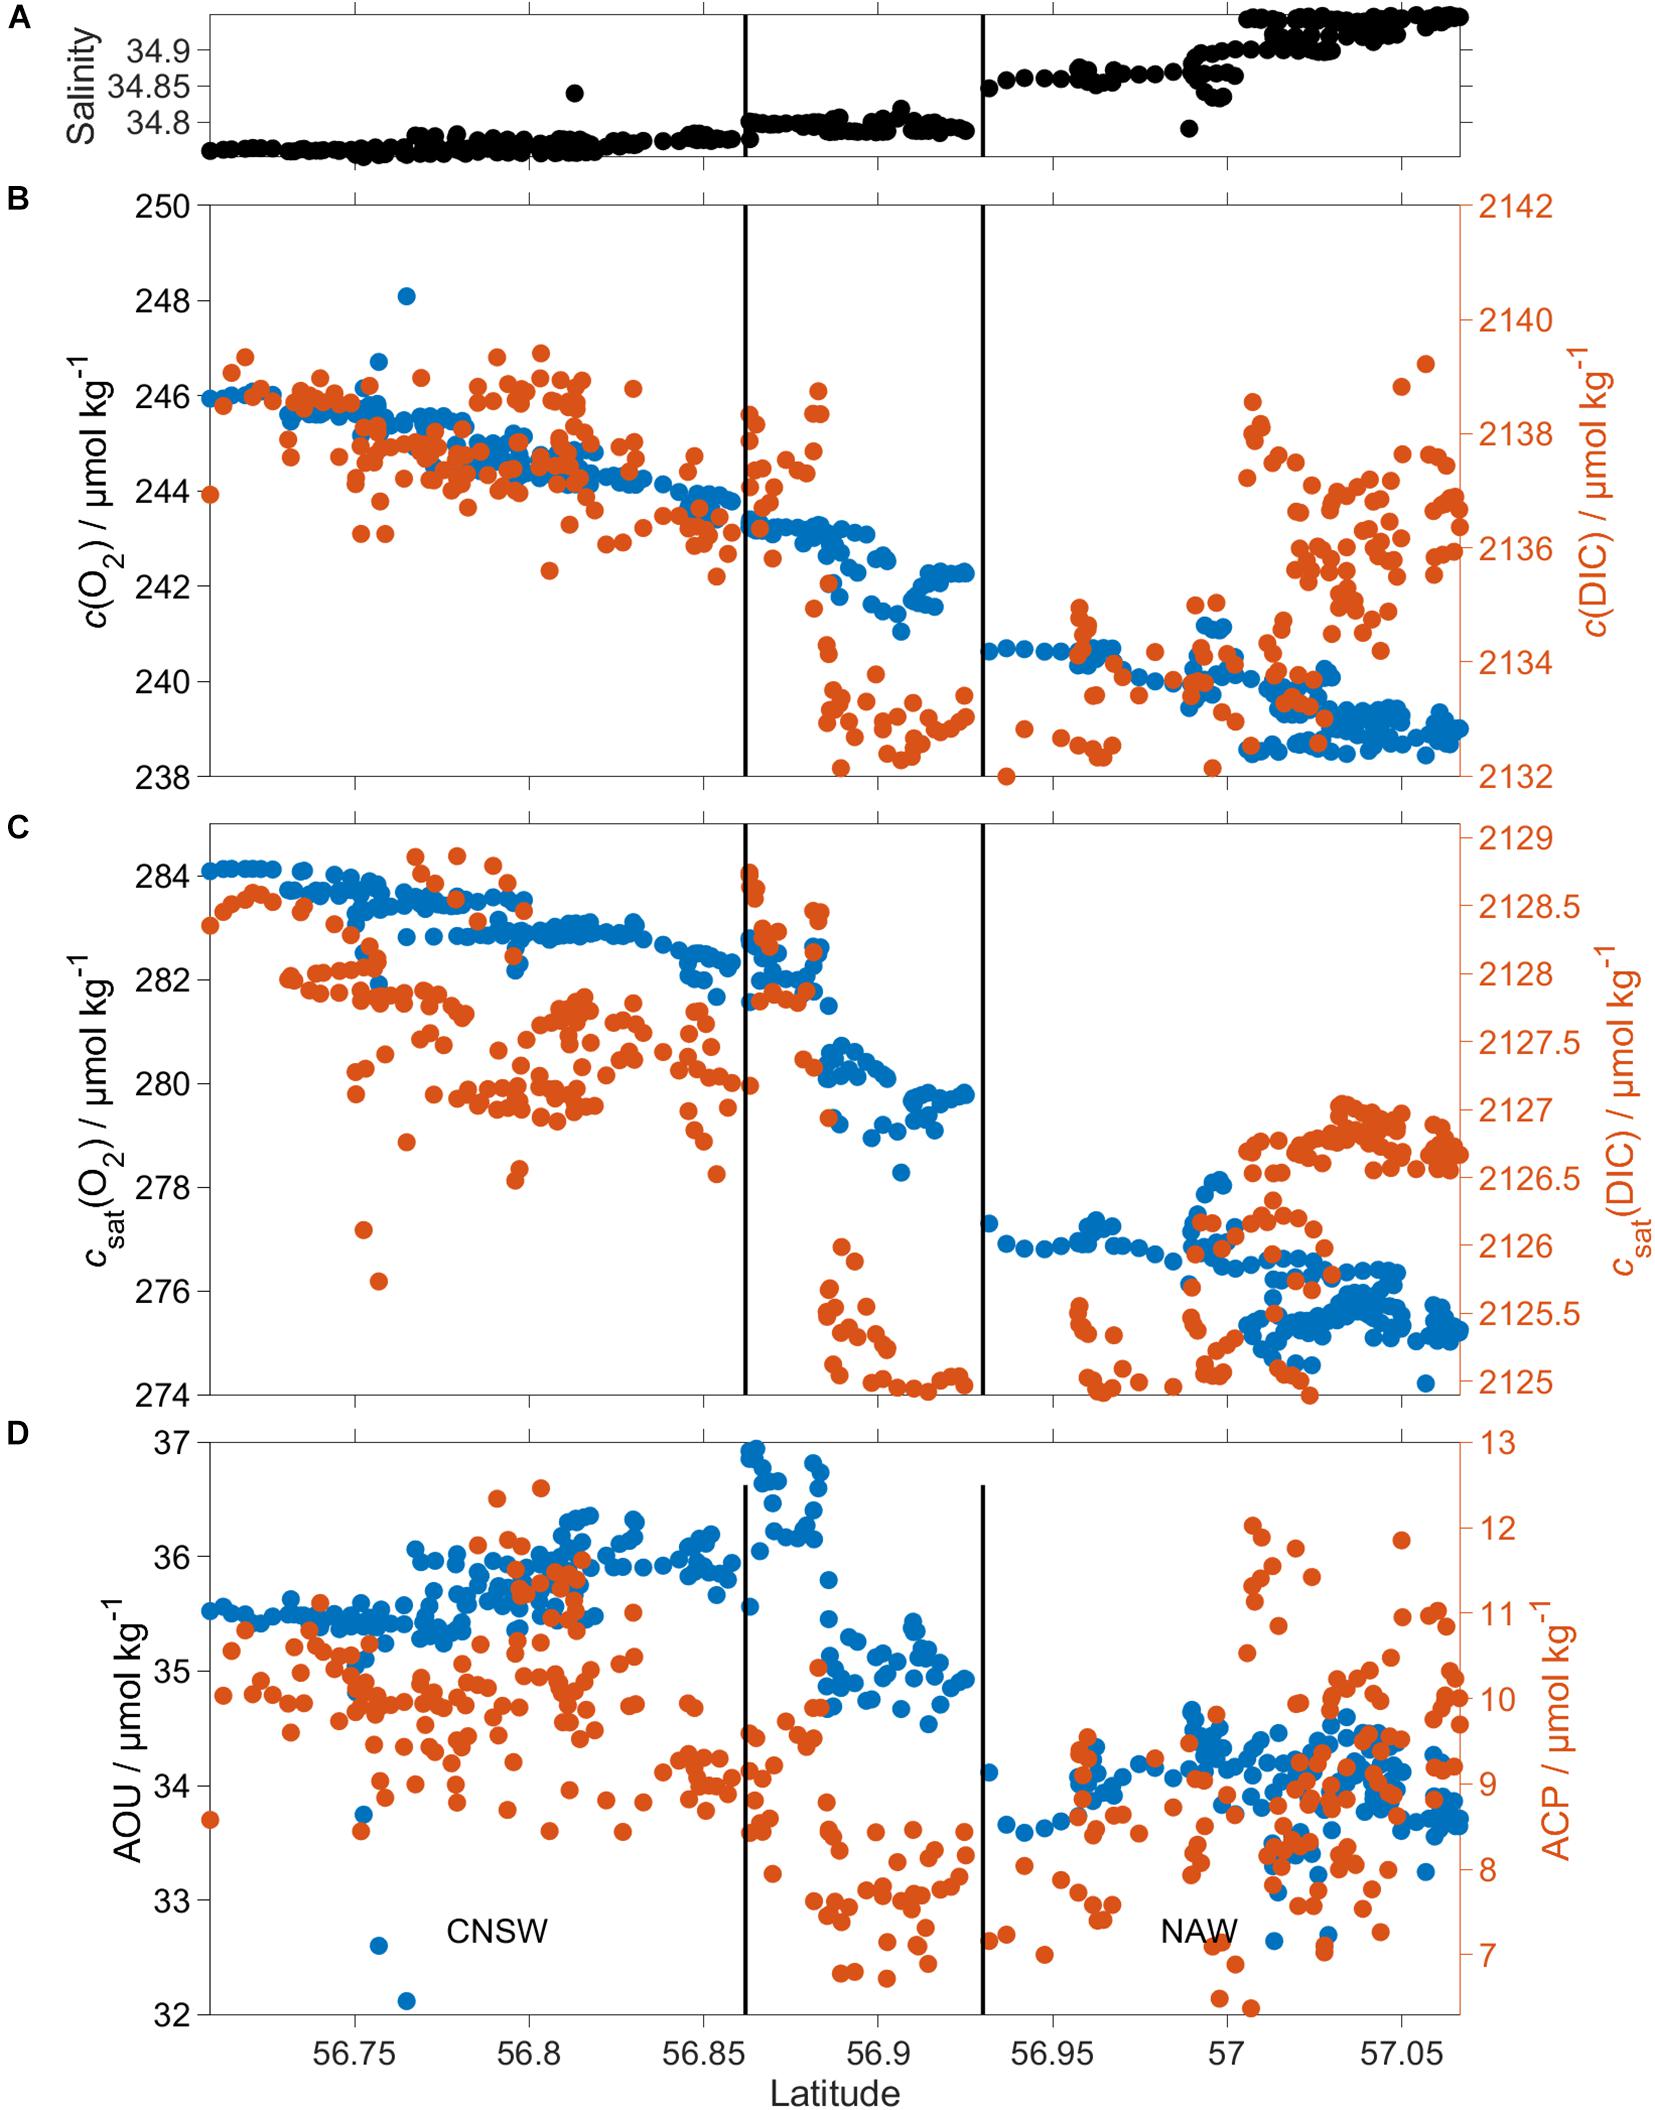
Figure 10. ACP and AOU in the BML for CNSW and NAW. (A) Shows the increase of S (z > 60 m) from south to north, while (B) c(DIC) (red) and c(O2) (blue), (C) csat(DIC) (red) and csat(O2) (blue), and (D) ACP (red) and AOU (blue) are lower in NAW than CNSW. The black vertical lines divide the three regimes defined in section “Three Different Regimes Along the Glider Transect.”
c(O2) was 245 μmol kg–1 in regime 1 and 239 μmol kg–1 in regime 3 (Table 3). This corresponded to an AOU of 35.7 μmol kg–1 in regime 1, 35.1 μmol kg–1 in regime 2, and 34.0 μmol kg–1 in regime 3. Regime 2 was not significantly different (within 2σ) from the other two regimes, but regimes 1 and 3 differed significantly from each other. ACP varied from 10.0 μmol kg–1 in regime 1 to 7.9 μmol kg–1 in regime 2 and 9.0 μmol kg–1 in regime 3, but these variations were within mutual 2σ uncertainties (Table 3).
The ratio of AOU and ACP, also known as respiratory quotient (RQ), is always larger than 3, in disagreement with the expected Redfield ratio of 1.45±0.15 (Redfield, 1963; Anderson, 1995). Part of this discrepancy may be due to uncertainties in the calculation of ACP and AOU. The c(DIC) uncertainty (see section “Regional Algorithm to Estimate Total Alkalinity”) was 7.9 μmol kg–1; the c(O2) uncertainty 1.2 μmol kg–1 (see section “Oxygen Optode Drift Correction”), giving an uncertainty in RQ between 0.7 and 0.9 for the three regimes. The mean RQ was 3.8 ± 0.5.
We also tested the assumption that the water mass was last in contact with the atmosphere in March 2019, by looking at the temperature difference between the sea surface in March downloaded from ECMWF ERA5 and the bottom mixed layer temperature measured by the glider. The temperature difference was (0.6±0.5) °C on average, but only (0.03±0.13) °C in regime 3, suggesting that March is a reasonable assumption.
Different xatm(CO2) values would apply if last contact with the atmosphere was at a different time. For example, using xatm(CO2) of January leads to an ACP of (10±1) μmol kg–1, February: (10±1) μmol kg–1, March: (9 ± 1) μmol kg–1, April: (9±1) μmol kg–1; May: (9±1) μmol kg–1; June: (11±1) μmol kg–1, July: (13±1) μmol kg–1. Another, source of error is that the water is not in equilibrium with the atmospheric CO2 given the slow gas exchange rate for CO2. The CO2 gas exchange is 10 times slower than for O2 leading to a slow response of the ocean to atmospheric x(CO2) changes. The ACP calculated is probably calculated from the response of the ocean of an old xatm(CO2). The pronounced seasonal xatm(CO2) variability suggests that ACP should only be used semi-quantitatively to look at the direction of changes.
Discussion
pH Sensor Performance
This is the first study that deployed a spectrophotometric LoC sensor and a potentiometric glass electrode together on a glider.
Against our expectations, the potentiometric sensor was not significantly affected by drift because its readings at depths greater than 60 m remained stable, with a standard deviation of 0.01 (n = 2308). Storing and conditioning the sensor in seawater for 2 months prior to deployment may have helped reducing the sensor drift. The pH(Fluidion) standard deviation at >60 m was larger than the pHc(NOC) standard deviation of 0.005, but better than drift reported for potentiometric sensors as high as 0.02 d–1 (Seiter and DeGrandpre, 2001). However, we did encounter a thermal lag issue (see section “Potentiometric pH Sensor Corrections”) that required correction. Further investigations are required to understand its nature, but the fact that the Fluidion temperature was lagging points to a problem related to the thermal mass of the sensor. Also, before the deployment the Fluidion temperature was not calibrated and that led to inaccurate temperature readings.
The spectrophotometric sensor was stable and accurate throughout the deployment. The difference to discrete water samples was +0.005±0.008. The stability was quantified by calculating the standard deviation below 60 m depth. It was 0.005 across the whole mission. The stability was calculated per each regime and had a constant of 0.005. This performance fulfills the Global Ocean Acidification Observing Network (GOA-ON) “weather goal” of an accuracy of better than 0.02 (Newton et al., 2014). It is not sufficient for the more stringent “climate goal” of <0.003 (Newton et al., 2014). The difference to discrete water samples also includes uncertainties both in the discrete sample measurements and in the carbonate system calculations because pH was not measured directly in the discrete samples. Millero (2007) quantified the error in calculating pH from AT and c(DIC) as 0.006, based on analytical errors for AT and c(DIC) of 3 and 2 μmol kg–1, respectively. A systematic difference of +0.006 between spectrophotometric pH and pH calculated from paired AT–c(DIC) measurements was found for pH 8 by Carter et al. (2018), indicating an incomplete understanding of the marine inorganic carbon system. This systematic difference is comparable to the value of +0.005 we found. The estimated statistical uncertainty of ±0.008 is similar to previous deployments of a similar microfluidic sensor. Rérolle (2013) operated the sensor continuously on a cruise with an offset from discrete samples between 0.005 and 0.013. The same sensor on a cruise in the Arctic gave an uncertainty of 0.007 (Rérolle et al., 2016).
The accuracy found here is better than previous deployments of pH sensors on gliders. The first deployment of a pH sensor on a glider was carried out by Hemming et al. (2017) but the sensor stability was poor and it drifted in a non-monotonous fashion. Saba et al. (2019) deployed a Deep-Sea DuraFET (Johnson et al., 2016) on a Slocum glider with an accuracy of 0.011 and a precision of 0.005. Also, Takeshita et al. (2021) performed nine missions using a Deep-Sea DuraFET on a Spray glider with an estimated accuracy of ±0.01 and a drift of 0.015 just in the last mission.
Oxygen Changes in the Bottom Mixed Layer
Queste et al. (2016) measured a strong AOU increase in the BML over a 3 days-glider transect by (2.8±0.3) mmol m–3 d–1. This corresponded to an AOU increase from 75 mmol m–3 to a maximum of 85 mmol m–3, indicating O2 consumption. Queste et al. (2016) hypothesized that this high O2 consumption happened over time and was linked to localized depocenters (regions with poor circulation) and rapid remineralization of organic matter gathered from much wider regions. The resuspension of these depocenters led to rapid O2 consumption.
The AOU change observed by Queste et al. (2016) was larger than the AOU and ACP variations we have seen during our glider mission. Our mission stretched across three different biogeochemical regimes, characterized by different c(O2), S and θ and DCM depth.
Apparent oxygen utilization and ACP were always positive pointing to respiration. However, the size of AOU and ACP changes were smaller than Queste et al. (2016). Looking at the AOU changes in isolation suggests that the high apparent oxygen consumption measured by Queste et al. (2016) could be partly due to spatial variations and not just to temporal changes. This is confirmed by the temperature and salinity measured in the study by Queste et al. (2016). The surface salinity continuously decreased by 0.35 and temperature increased by 1 °C, suggesting a possible Baltic overflow influence. In the BML, Queste et al. (2016) reported a near-opposite pattern since temperature increased by less than 0.1 °C and salinity increased by 0.15 to >35. For that reason, Queste et al. (2016) excluded the last part of the deployment from their AOU calculation.
In each regime, the c(CO2) changes were not affected by significant biogeochemical change because c(O2) in each regime had a standard deviation between 0.7 and 0.8 μmol kg–1. However, an important source of uncertainty was the possible disequilibrium between the x(CO2) in seawater [xsea(CO2)] and xatm(CO2). The values of ACP were not affected by monthly changes of xatm(CO2) before June because the median ACP varied between (10±1) and (9±1) μmol kg–1. Supplementary Figure S8 shows that in 2017, 2018, and 2019 the difference between xsea(CO2) and xatm(CO2) between January and March varied between −54 and +10 μmol mol–1 with the largest difference in March. In March 2019 this difference varied between −52 and −21 μmol mol–1 leading to an ACP average between (32±1) and (18±1) μmol kg–1, respectively. The calculated large ACP would explain the large RQ values of this study and the importance to consider the disequilibrium between atmospheric and seawater CO2, in fact applying an uncertainty in xatm(CO2) of −39 μmol mol–1 would decrease to 1.4. Despite the uncertainties to calculate the method gives an important estimate on the drivers (e.g., mixing, primary production, respiration, etc.) controlling c(DIC) in space and time.
We would suggest that the presence of different regimes could also explain or contribute to the large increase in AOU. To more accurately quantify changes in AOU and ACP, horizontal processes and mixing should be considered when studying biogeochemical variables over short timescales, perhaps using multiple gliders deployed simultaneously.
North Sea Air-Sea Gas Exchange
The North Sea air-sea CO2 and O2 fluxes vary in space and time. Previous studies that used ship data showed that during summer, the stratified northern North Sea is a CO2 sink (Thomas et al., 2004, 2005b). Another study from Bozec et al. (2005) found that in late summer (mid-August-September) the whole North Sea acted as a CO2 sink (−1.5 to −2.2 mmol m–2 d–1). The northern North Sea Φ(CO2) changes are controlled by NCP. In contrast, in the southern North Sea, Φ(CO2) changes are controlled by temperature (Prowe et al., 2009), with summer heating leading to CO2 outgassing. Thomas et al. (2005b) located the expected change in the direction of summer Φ(CO2) at 54° N.
During the glider deployment in the northern North Sea, the surface layer acted as a moderate CO2 sink (−0.4 mmol m–2 d–1), but the Φ(CO2) direction and magnitude changed several times during the deployment, mainly driven by c(CO2) variability (Figure 9). During the deployment Φ(CO2) changed from an influx of −2.2 mmol m–2 d–1 to and efflux of +4.5 mmol m–2 d–1. The positive fluxes were unexpected for the northern North Sea. The data showed that Φ(CO2) was not affected by spatial variability. However, given the high uncertainty in the calculation of Φ(CO2) we are not able to give a definitive answer on the direction of the flux.
Conclusion
This study was the first deployment of a spectrophotometric and a potentiometric pH sensor on a Seaglider. This deployment shows the potential of using pH sensors on autonomous observing platforms like Seagliders to quantify biogeochemical processes at high spatiotemporal resolution.
The deployment was in the northern North Sea where the seafloor was always shallower than 150 m. This deployment required the use of loiter dives because of the spectrophotometric sensor’s relatively long measurement interval (11 min). Loiter dives tripled the glider battery usage but allowed the collection up to 9 pH measurements per dive compared to just 2–3 during a normal dive. In future, the number of samples collected by the spectrophotometric sensor could be reduced to 1 or 2 per day when coupled to a fully functional pH glass electrode or other electrochemical sensors with potentially greater stability (ISFET DuraFET, Sea-Bird Scientific; solid state sensors, ANB Sensors)3. In this configuration, pH(NOC) could be used to calibrate and drift-correct the glass electrode, allowing longer deployments. The use of a spectrophotometric sensor can reduce the mission costs relative to a glider mission that requires the collection of discrete samples for calibration. However, the collection of discrete samples during deployment and recovery would be beneficial to check the spectrophotometric sensor. The potentiometric glass electrode sensor (Fluidion) has the potential to be used in such deployments, but its stability, accuracy and glider communication should be assessed further. In this study, the two sensors showed good potential for short-term studies (pH accuracy target better than 0.02), but not for long term ocean acidification trends (which would require pH accuracy better than 0.003) (Newton et al., 2014).
This study also showed that mounting the O2 optode facing downward looking at the glider body could reduce the number of highly anomalous data points (spikes) caused by sunlight hitting the sensing foil. Small residual spikes were probably caused by the contact of the sensor with air or dissolved bubbles in the surface waters.
Data Availability Statement
The datasets presented in this study can be found in online repositories. The names of the repository/repositories and accession number(s) can be found below: https://www.bodc.ac.uk/data/published_data_library/catalogue/10.5285/c80806e5-7334-6915-e053-6c86abc09409/.
Author Contributions
This publication is part of LP’s Ph.D. project at the University of East Anglia under the supervision of JK, MH, LF, SL, and MM. GL and MC-G led the sensor implementation and glider preparation. FP determined the discrete oxygen concentrations. LP and DB analyzed the total dissolved inorganic carbon and total alkalinity samples. LP wrote the first draft of the manuscript. All authors contributed to further editing and writing.
Funding
LP’s Ph.D. project was supported by the Next Generation Unmanned Systems Science (NEXUSS) Centre for Doctoral Training, funded by the Natural Environment Research Council (NERC) and the Engineering and Physical Sciences Research Council (EPSRC) (Grant No. NE/N012070/1), as well as the University of East Anglia (UEA). We would also like to thank NERC for additional funding via grant NE/P013899/1 (An Alternative Framework to Assess Marine Ecosystem Functioning in Shelf Seas, AlterEco, https://altereco.ac.uk/).
Conflict of Interest
The authors declare that the research was conducted in the absence of any commercial or financial relationships that could be construed as a potential conflict of interest.
Publisher’s Note
All claims expressed in this article are solely those of the authors and do not necessarily represent those of their affiliated organizations, or those of the publisher, the editors and the reviewers. Any product that may be evaluated in this article, or claim that may be made by its manufacturer, is not guaranteed or endorsed by the publisher.
Acknowledgments
The mission was part of the English International Bottom Trawl Survey (IBTS) Q3. We would like to thank the scientists, engineers, and crew who contributed to the glider mission and data collection, in particular those on board RV Cefas Endeavour survey CEND12/19.
Supplementary Material
The Supplementary Material for this article can be found online at: https://www.frontiersin.org/articles/10.3389/fmars.2021.696772/full#supplementary-material
Abbreviations
ACP, apparent carbon production (μ mol kg–1); AOU, apparent oxygen utilization (μ mol kg–1); AT, total alkalinity (μ mol kg–1); BML, bottom mixed layer; c, amount content (μ mol kg–1); C, amount concentration (mmol m–3); Chl a, chlorophyll a; CNSW, Central North Sea Water; CT, conductivity and temperature; DIC, dissolved inorganic carbon; DCM, deep-chlorophyll maximum; NAW, North Atlantic Water; pH(Fluidion), raw Fluidion pH; pHc(Fluidion), calibrated Fluidion pH; pH(NOC), raw NOC pH; pHc(NOC), temperature corrected NOC pH; RQ, respiratory quotient; s, saturation ratio (1); S, practical salinity (1); Sc, Schmidt number (1); SML, surface mixed layer; SOM, subsurface oxygen concentration maximum; t, time (s); U, wind speed (m s–1); x, amount fraction in dry air (μ mol mol–1); zmix, mixed layer depth (m); Φ, air-sea flux (mmol m–2 d–1); θ, Celsius temperature (° C); θ(CT), glider CT temperature (° C); θ(Fluidion), uncalibrated Fluidion temperature (° C); θcal(Fluidion), calibrated Fluidion temperature (° C).
Footnotes
- ^ https://www.ecmwf.int/en/forecasts/datasets/reanalysis-datasets/era5
- ^ https://www.esrl.noaa.gov/gmd/ccgg/ggrn.php
- ^ http://www.anbsensors.com
References
Anderson, L. A. (1995). On the hydrogen and oxygen content of marine phytoplankton. Deep Sea Res. 1 Oceanogr. Res. Pap. 42, 1675–1680. doi: 10.1016/0967-0637(95)00072-e
Artioli, Y., Blackford, J. C., Butenschön, M., Holt, J. T., Wakelin, S. L., Thomas, H., et al. (2012). The carbonate system in the North Sea: sensitivity and model validation. J. Mar. Syst. 102, 1–13. doi: 10.1016/j.jmarsys.2012.04.006
Bakker, D. C. E., Pfeil, B., Landa, C. S., Metzl, N., Brien, K. M. O., Olsen, A., et al. (2016). A multi-decade record of high-quality fCO2 data in version 3 of the surface ocean CO2 Atlas (SOCAT). Earth Syst. Sci. Data 8, 383–413. doi: 10.5194/essd-8-383-2016
Bellerby, R. G. J., Olsen, A., Johannessen, T., and Croot, P. (2002). A high precision spectrophotometric method for on-line shipboard seawater pH measurements: the automated marine pH sensor (AMpS). Talanta 56, 61–69. doi: 10.1016/s0039-9140(01)00541-0
Benson, B. B., and Krause, D. Jr. (1984). The concentration and isotopic fractionation of oxygen dissolved in freshwater and seawater in equilibrium with the atmosphere 1. Limnol. Oceanogr. 29, 620–632. doi: 10.4319/lo.1984.29.3.0620
Binetti, U., Kaiser, J., Damerell, G. M., Rumyantseva, A., Martin, A. P., Henson, S., et al. (2020). Net community oxygen production derived from Seaglider deployments at the Porcupine Abyssal Plain site (PAP; northeast Atlantic) in 2012–13. Prog. Oceanogr. 183:102293. doi: 10.1016/j.pocean.2020.102293
Bittig, H. C., and Körtzinger, A. (2015). Tackling oxygen optode drift: near-surface and in-air oxygen optode measurements on a float provide an accurate in situ reference. J. Atmos. Ocean. Technol. 32, 1536–1543. doi: 10.1175/JTECH-D-14-00162.1
Blackford, J. C., and Gilbert, F. J. (2007). pH variability and CO2 induced acidification in the North Sea. J. Mar. Syst. 64, 229–241. doi: 10.1016/j.jmarsys.2006.03.016
Borges, A. V. (2003). Distribution of surface carbon dioxide and air-sea exchange in the English channel and adjacent areas. J. Geophys. Res. 108:3140. doi: 10.1029/2000JC000571
Bozec, Y., Thomas, H., Elkalay, K., and De Baar, H. J. W. (2005). The continental shelf pump for CO2 in the North Sea–evidence from summer observation. Mar. Chem. 93, 131–147. doi: 10.1016/j.marchem.2004.07.006
Bozec, Y., Thomas, H., Schiettecatte, L.-S., Borges, A. V., Elkalay, K., and de Baar, H. J. W. (2006). Assessment of the processes controlling the seasonal variations of dissolved inorganic carbon in the North Sea. Limnol. Oceanogr. 51, 2746–2762. doi: 10.4319/lo.2006.51.6.2746
Bushinsky, S. M., Takeshita, Y., and Williams, N. L. (2019). Observing changes in ocean carbonate chemistry: our autonomous future. Curr. Clim. Chang. Reports 5, 207–220. doi: 10.1007/s40641-019-00129-8
Byrne, R. H., and Breland, J. A. (1989). High precision multiwavelength pH determinations in seawater using cresol red. Deep Sea Res. A Oceanogr. Res. Pap. 36, 803–810. doi: 10.1016/0198-0149(89)90152-0
Byrne, R. H., Robert-Baldo, G., Thompson, S. W., and Chen, C. T. A. (1988). Seawater pH measurements: an at-sea comparison of spectrophotometric and potentiometric methods. Deep Sea Res. A Oceanogr. Res. Pap. 35, 1405–1410. doi: 10.1016/0198-0149(88)90091-X
Carter, B. R., Feely, R. A., Williams, N. L., Dickson, A. G., Fong, M. B., and Takeshita, Y. (2018). Updated methods for global locally interpolated estimation of alkalinity, pH, and nitrate. Limnol. Oceanogr. Methods 16, 119–131. doi: 10.1002/lom3.10232
Carter, B. R., Radich, J. A., Doyle, H. L., and Dickson, A. G. (2013). An automated system for spectrophotometric seawater pH measurements. Limnol. Oceanogr. Methods 11, 16–27. doi: 10.4319/lom.2013.11.16
Culberson, C. H. (1991). WHP Operations and Methods, Dissolved Oxygen. WHP Office Report WHPO 91-1. WOCE Report No. 68/91. Woods Hole Oceanographic Institution: WOCE Hydrographic Programme Office.
Dickson, A. G. (1990). Thermodynamics of the dissociation of boric acid in synthetic seawater from 273.15 to 318.15 K. Deep Sea Res. A Oceanogr. Res. Pap. 37, 755–766. doi: 10.1016/0198-0149(90)90004-f
Dickson, A. G. (1993). The measurement of sea water pH. Mar. Chem. 44, 131–142. doi: 10.1016/0304-4203(93)90198-W
Dickson, A. G., Afghan, J. D., and Anderson, G. C. (2003). Reference materials for oceanic CO2 analysis: a method for the certification of total alkalinity. Mar. Chem. 80, 185–197. doi: 10.1016/s0304-4203(02)00133-0
Dickson, A. G., Sabine, C. L., and Christian, J. R. (2007). Guide to Best Practices for Ocean CO2 Measurements. Sidney, CA: North Pacific Marine Science Organization.
Dlugokencky, E. J., Lang, P. M., Masarie, K. A., Crotwell, A. M., and Crotwell, M. J. (2015). Atmospheric Carbon Dioxide Dry Air Mole Fractions From the NOAA ESRL Carbon Cycle Cooperative Global Air Sampling Network, 1968–2014. Boulder, CO: NOAA ESRL Global Monitoring Division.
Doney, S. C., Fabry, V. J., Feely, R. A., and Kleypas, J. A. (2009). Ocean acidification: the other CO2 problem. Ann. Rev. Mar. Sci. 1, 169–192. doi: 10.1146/annurev.marine.010908.163834
Doney, S. C., and Schimel, D. S. (2007). Carbon and climate system coupling on timescales from the Precambrian to the Anthropocene. Annu. Rev. Environ. Resour. 32, 31–66. doi: 10.1146/annurev.energy.32.041706.124700
Fabry, V. J., Seibel, B. A., Feely, R. A., and Orr, J. C. (2008). Impacts of ocean acidification on marine fauna and ecosystem processes. ICES J. Mar. Sci. 65, 414–432. doi: 10.1093/icesjms/fsn048
Foltz, G. R., Grodsky, S. A., Carton, J. A., and McPhaden, M. J. (2003). Seasonal mixed layer heat budget of the tropical Atlantic Ocean. J. Geophys. Res. Ocean 108:3146.
Friedlingstein, P., O’Sullivan, M., Jones, M. W., Andrew, R. M., Hauck, J., Olsen, A., et al. (2020). Global carbon budget 2020. Earth Syst. Sci. Data 12, 3269–3340.
Garcia, H. E., and Gordon, L. I. (1992). Oxygen solubility in seawater: better fitting equations. Limnol. Oceanogr. 37, 1307–1312. doi: 10.4319/lo.1992.37.6.1307
Gattuso, J.-P., Frankignoulle, M., and Wollast, R. (1998). Carbon and carbonate metabolism in coastal aquatic ecosystems. Annu. Rev. Ecol. Syst. 29, 405–434. doi: 10.1146/annurev.ecolsys.29.1.405
Gloël, J. (2012). Triple Oxygen Isotopes and Oxygen/Argon Ratio Measurements to Enhance Coastal and Open Ocean Production/Respiration Comparisons, Ph.D. thesis. Norwich: University of East Anglia.
Gourcuff, C. (2014). ANFOG Slocum CTD Data Correction, Australian National Facility for Ocean Gliderrs. Battery Point, Tas: Integrated Marine Observing System.
Gypens, N., Borges, A. V., and Lancelot, C. (2009). Effect of eutrophication on air-sea CO2 fluxes in the coastal Southern North Sea: a model study of the past 50 years. Glob. Chang. Biol. 15, 1040–1056. doi: 10.1111/j.1365-2486.2008.01773.x
Hahn, J. (2013). Oxygen Variability and Eddy-Driven Meridional Oxygen Supply in the Tropical North East Atlantic Oxygen Minimum Zone. Ph.D. thesis, Kiel: Christian-Albrechts-Universität Kiel.
Hartman, S. E., Humphreys, M. P., Kivimäe, C., Woodward, E. M. S., Kitidis, V., McGrath, T., et al. (2019). Seasonality and spatial heterogeneity of the surface ocean carbonate system in the northwest European continental shelf. Prog. Oceanogr. 177:101909. doi: 10.1016/j.pocean.2018.02.005
Hemming, M. P., Kaiser, J., Heywood, K. J., Bakker, D. C. E., Boutin, J., Shitashima, K., et al. (2017). Measuring pH variability using an experimental sensor on an underwater glider. Ocean. Sci. 13, 427–442. doi: 10.5194/os-13-427-2017
Holley, S. E., and Hydes, D. J. (1995). Procedures for the Determination of Dissolved Oxygen in Seawater. Southampton: Institute of Oceanographic Sciences Deacon Laboratory.
Hoppema, J. M. J. (1991). The seasonal behaviour of carbon dioxide and oxygen in the coastal North Sea along the Netherlands. Netherlands J. Sea Res. 28, 167–179. doi: 10.1016/0077-7579(91)90015-s
Johnson, K. S., Jannasch, H. W., Coletti, L. J., Elrod, V. A., Martz, T. R., Takeshita, Y., et al. (2016). Deep-sea DuraFET: a pressure tolerant pH sensor designed for global sensor networks. Anal. Chem. 88, 3249–3256. doi: 10.1021/acs.analchem.5b04653
Kempe, S., and Pegler, K. (1991). Sinks and sources of CO2 in coastal seas: the North Sea. Tellus B 43, 224–235. doi: 10.3402/tellusb.v43i2.15268
Kühn, W., Pätsch, J., Thomas, H., Borges, A. V., Schiettecatte, L. S., Bozec, Y., et al. (2010). Nitrogen and carbon cycling in the North Sea and exchange with the North Atlantic-a model study, part II: carbon budget and fluxes. Cont. Shelf Res. 30, 1701–1716. doi: 10.1016/j.csr.2010.07.001
Lee, K., Kim, T., Byrne, R. H., Millero, F. J., Feely, R. A., and Liu, Y. (2010). The universal ratio of boron to chlorinity for the North Pacific and North Atlantic oceans. Geochim. Cosmochim. Acta 74, 1801–1811. doi: 10.1016/j.gca.2009.12.027
Lueker, T. J., Dickson, A. G., and Keeling, C. D. (2000). Ocean pCO2 calculated from dissolved inorganic carbon, alkalinity, and equations for K1 and K2: validation based on laboratory measurements of CO2 in gas and seawater at equilibrium. Mar. Chem. 70, 105–119. doi: 10.1016/S0304-4203(00)00022-0
Mackenzie, F. T., Lerman, A., and Andersson, A. J. (2004). Past and present of sediment and carbon biogeochemical cycling models. Biogeosciences 1, 11–32. doi: 10.5194/bg-1-11-2004
Martz, T. R., Carr, J. J., French, C. R., and DeGrandpre, M. D. (2003). A submersible autonomous sensor for spectrophotometric pH measurements of natural waters. Anal. Chem. 75, 1844–1850. doi: 10.1021/ac020568l
Meyer, M., Pätsch, J., Geyer, B., and Thomas, H. (2018). Revisiting the estimate of the North Sea air−sea flux of CO2 in 2001/2002: The dominant role of different wind data products. J. Geophys. Res. Biogeosci. 123, 1511–1525. doi: 10.1029/2017jg004281
Millero, F. (2007). The marine inorganic carbon cycle. Chem. Rev. 107, 308–341. doi: 10.1021/cr0503557
Monterey, D., and Levitus, S. (1997). Seasonal Variability of Mixed Layer Depth for the World Ocean, US Department of Commerce. Washington, DC: National Oceanic and Atmospheric Administration.
Newton, J. A., Feely, R. A., Jewett, E. B., Williamson, P., and Mathis, J. (2014). Global Ocean Acidification Observing Network: Requirements and Governance Plan. Available online at: http://www.goa-on.org/documents/general/GOA-ON_2nd_edition_final.pdf (accessed July 2021).
Obata, A., Ishizaka, J., and Endoh, M. (1996). Global verification of critical depth theory for phytoplankton bloom with climatological in situ temperature and satellite ocean color data. J. Geophys. Res. Ocean. 101, 20657–20667. doi: 10.1029/96jc01734
Ogura, N. (1970). The relation between dissolved organic carbon and apparent oxygen utilization in the Western North Pacific. Deep Sea Res. Oceanogr. Abstracts 17, 221–231. doi: 10.1016/0011-7471(70)90016-1
Omar, A. M., Olsen, A., Johannessen, T., Hoppema, M., Thomas, H., and Borges, A. V. (2010). Spatiotemporal variations of fCO2 in the North Sea. Ocean. Sci. 6, 77–89.
Patsavas, M. C., Byrne, R. H., and Liu, X. (2013). Purification of meta-cresol purple and cresol red by flash chromatography: procedures for ensuring accurate spectrophotometric seawater pH measurements. Mar. Chem. 150, 19–24. doi: 10.1016/j.marchem.2013.01.004
Pegler, K., and Kempe, S. (1988). The carbonate system of the North Sea: determination of alkalinity and TCO2 and calculation of PCO2 and SIcal (spring 1986). Mitt. Geol.paläont. Inst. Univ. Hamb. 65, 35–87.
Prowe, A. E. F., Thomas, H., Pätsch, J., Kühn, W., Bozec, Y., Schiettecatte, L. S., et al. (2009). Mechanisms controlling the air-sea CO2 flux in the North Sea. Cont. Shelf Res. 29, 1801–1808. doi: 10.1016/j.csr.2009.06.003
Queste, B., Fernand, L., Jickells, T., Heywood, K., and Hind, A. (2016). Drivers of summer oxygen depletion in the central North Sea. Biogeosciences 13, 1209–1222. doi: 10.5194/bg-13-1209-2016
Queste, B. Y., Fernand, L., Jickells, T. D., and Heywood, K. J. (2013). Spatial extent and historical context of North Sea oxygen depletion in August 2010. Biogeochemistry 113, 53–68. doi: 10.1007/s10533-012-9729-9
Rérolle, V. (2013). Development and Deployment of an in Situ Sensor for Seawater Ph Based on the Spectrophotometric Method. Available online at: https://eprints.soton.ac.uk/359137/1/Rerolle%252C%2520V_VR_PhD_Thesis_130719.pdf. (accessed July 2021).
Rérolle, V. M. C., Floquet, C. F. A., Mowlem, M. C., Connelly, D. P., Achterberg, E. P., and Bellerby, R. R. G. J. (2012). Seawater-pH measurements for ocean-acidification observations. Trends Analyt. Chem. 40, 146–157. doi: 10.1016/j.trac.2012.07.016
Rérolle, V., Ruiz-Pino, D., Rafizadeh, M., Loucaides, S., Papadimitriou, S., Mowlem, M., et al. (2016). Measuring pH in the Arctic Ocean: colorimetric method or SeaFET? Methods Oceanogr. 17, 32–49. doi: 10.1016/j.mio.2016.05.006
Reuer, M. K., Barnett, B. A., Bender, M. L., Falkowski, P. G., and Hendricks, M. B. (2007). New estimates of Southern Ocean biological production rates from O2/Ar ratios and the triple isotope composition of O2. Deep Sea Res. I Oceanogr. Res. Pap. 54, 951–974. doi: 10.1016/j.dsr.2007.02.007
Saba, G., Wright-Fairbanks, E. K., Chen, B., Cai, W.-J., Barnard, A., Jones, C., et al. (2019). The development and validation of a profiling glider deep ISFET-based pH sensor for high resolution observations of coastal and ocean acidification. Front. Mar. Sci. 6:664. doi: 10.3389/fmars.2019.00664
Salt, L. A., Thomas, H., Prowe, A. E. F., Borges, A. V., Bozec, Y., and De Baar, H. J. W. (2013). Variability of North Sea pH and CO2 in response to North Atlantic oscillation forcing. J. Geophys. Res. Biogeosci. 118, 1584–1592. doi: 10.1002/2013JG002306
Schiettecatte, L. S., Thomas, H., Bozec, Y., and Borges, A. V. (2007). High temporal coverage of carbon dioxide measurements in the Southern Bight of the North Sea. Mar. Chem. 106, 161–173. doi: 10.1016/j.marchem.2007.01.001
Seidel, M. P., Degrandpre, M. D., and Dickson, A. G. (2008). A sensor for in situ indicator-based measurements of seawater pH. Mar. Chem. 109, 18–28. doi: 10.1016/j.marchem.2007.11.013
Seiter, J. C., and DeGrandpre, M. D. (2001). Redundant chemical sensors for calibration-impossible applications. Talanta 54, 99–106. doi: 10.1016/S0039-9140(00)00635-4
Sharples, J., Ross, O. N., Scott, B. E., Greenstreet, S. P. R., and Fraser, H. (2006). Inter-annual variability in the timing of stratification and the spring bloom in the North-western North Sea. Cont. Shelf Res. 26, 733–751. doi: 10.1016/j.csr.2006.01.011
Soli, A. L., Pav, B. J., and Byrne, R. H. (2013). The effect of pressure on meta-Cresol Purple protonation and absorbance characteristics for spectrophotometric pH measurements in seawater. Mar. Chem. 157, 162–169. doi: 10.1016/j.marchem.2013.09.003
Staudinger, C., Strobl, M., Breininger, J., Klimant, I., and Borisov, S. M. (2019). Fast and stable optical pH sensor materials for oceanographic applications. Sens. Actuators B Chem. 282, 204–217. doi: 10.1016/j.snb.2018.11.048
Takeshita, Y., Jones, B. D., Johnson, K. S., Chavez, F. P., Rudnick, D. L., Blum, M., et al. (2021). Accurate pH and O2 measurements from spray underwater gliders. J. Atmos. Ocean. Technol. 38, 181–195. doi: 10.1175/jtech-d-20-0095.1
Tengberg, A., Hovdenes, J., Andersson, H. J., Brocandel, O., Diaz, R., and Hebert, D. (2006). Evaluation of a lifetime-based optode to measure oxygen in aquatic systems. Limnol. Oceanogr. Methods 4, 7–17. doi: 10.4319/lom.2006.4.7
Thomas, H., Bozec, Y., de Baar, H. J. W., Elkalay, K., Frankignoulle, M., Schiettecatte, L.-S., et al. (2005a). The carbon budget of the North Sea. Biogeosciences 2, 87–96. doi: 10.5194/bg-2-87-2005
Thomas, H., Bozec, Y., Elkalay, K., and de Baar, H. J. W. (2004). Enhanced open ocean storage of CO2 from shelf sea pumping. Science 304, 1005–1008. doi: 10.1126/science.1095491
Thomas, H., Bozec, Y., Elkalay, K., de Baar, H. J. W., Borges, A. V., and Schiettecatte, L. S. (2005b). Controls of the surface water partial pressure of CO2 in the North Sea. Biogeosciences 2, 323–334. doi: 10.5194/bg-2-323-2005
Thomas, H., Prowe, A. E. F., van Heuven, S., Bozec, Y., de Baar, H. J. W., Schiettecatte, L. S., et al. (2007). Rapid decline of the CO2 buffering capacity in the North Sea and implications for the North Atlantic Ocean. Glob. Biogeochem. Cycles 21, 1–13. doi: 10.1029/2006GB002825
Tsunogai, S., Watanabe, S., and Sato, T. (1999). Is there a ‘continental shelf pump’ for the absorption of atmospheric CO2? Tellus B Chem. Phys. Meteorol. 51, 701–712. doi: 10.1034/j.1600-0889.1999.t01-2-00010.x
Van Heuven, S., Pierrot, D., Rae, J. W. B., Lewis, E., and Wallace, D. W. R. (2011). MATLAB Program Developed for CO2 System Calculations, ORNL/CDIAC-105b. Carbon Dioxide Inf. Anal. Center. Oak Ridge, Ten: Oak Ridge National Laboratory, 530.
Walsh, J. J. (1991). Importance of continental margins in the marine biogeochemical cycling of carbon and nitrogen. Nature 350, 53–55. doi: 10.1038/350053a0
Wang, Z. A., Liu, X., Byrne, R. H., Wanninkhof, R., Bernstein, R. E., Kaltenbacher, E. A., et al. (2007). Simultaneous spectrophotometric flow-through measurements of pH, carbon dioxide fugacity, and total inorganic carbon in seawater. Anal. Chim. Acta 596, 23–36. doi: 10.1016/j.aca.2007.05.048
Wanninkhof, R. (2014). Relationship between wind speed and gas exchange over the ocean revisited. Limnol. Oceanogr. Methods 12, 351–362. doi: 10.4319/lom.2014.12.351
Weatherall, P., Marks, K. M., Jakobsson, M., Schmitt, T., Tani, S., Arndt, J. E., et al. (2015). A new digital bathymetric model of the world’s oceans. Earth Space Sci. 2, 331–345.
Weiss, R. F., and Price, B. A. (1980). Nitrous oxide solubility in water and seawater. Mar. Chem. 8, 347–359. doi: 10.1016/0304-4203(80)90024-9
Keywords: North Sea, pH, glider, air-sea gas flux, respiration, deep-chlorophyll maximum, oxygen
Citation: Possenti L, Humphreys MP, Bakker DCE, Cobas-García M, Fernand L, Lee GA, Pallottino F, Loucaides S, Mowlem MC and Kaiser J (2021) Air-Sea Gas Fluxes and Remineralization From a Novel Combination of pH and O2 Sensors on a Glider. Front. Mar. Sci. 8:696772. doi: 10.3389/fmars.2021.696772
Received: 17 April 2021; Accepted: 04 August 2021;
Published: 23 September 2021.
Edited by:
Griet Neukermans, Ghent University, BelgiumReviewed by:
Laurent Coppola, UMR 7093 Laboratoire d’Océanographie de Villefranche (LOV), FranceYuichiro Takeshita, Monterey Bay Aquarium Research Institute (MBARI), United States
Copyright © 2021 Possenti, Humphreys, Bakker, Cobas-García, Fernand, Lee, Pallottino, Loucaides, Mowlem and Kaiser. This is an open-access article distributed under the terms of the Creative Commons Attribution License (CC BY). The use, distribution or reproduction in other forums is permitted, provided the original author(s) and the copyright owner(s) are credited and that the original publication in this journal is cited, in accordance with accepted academic practice. No use, distribution or reproduction is permitted which does not comply with these terms.
*Correspondence: Luca Possenti, bHVjYS5wb3NzZW50aUBuaW96Lm5s
 Luca Possenti1,2*
 Gareth A. Lee
 Matt Charles Mowlem