- Department of Ocean Sciences, Inha University, Incheon, South Korea
Erosion of cohesive sediments is a ubiquitous phenomenon in estuarine and intertidal environments. Several methods have been proposed to determine the surface erosion threshold (τc0), which are still debatable because of the numerous and uncertain definitions. Based on erosion microcosm experiments, we have compared three different methods using (1) eroded mass (EM), (2) erosion rate (ER), and (3) suspended sediment concentration (SSC), and suggested a suitable method for revealing the variation of erodibility in intertidal sediments. Erosion experiments using a microcosm system were carried out in the Muuido tidal flat, west coast of South Korea. The mean values of τc0 for three methods were: 0.20 ± 0.08 Pa (EM); 0.18 ± 0.07 Pa (ER); and (3) 0.17 ± 0.09 Pa (SSC). The SSC method yielded the lowest τc0, due to the outflow of suspended sediment from the erosion chamber of the microcosm. This was because SSC gradually decreased with time after depleting the erodible sediment at a given bed shear stress (τb). Therefore, the regression between SSC and applied τb might skew an x-intercept, resulting in the underestimation (or “not-determined”) of τc0. The EM method yielded robust and accurate (within the range of τb step at which erosion begins) results. The EM method represents how the erodible depth thickens as τb increases and therefore seems better suited than the SSC and ER methods for representing depth-limited erosion of cohesive sediments. Furthermore, this study identified the spatiotemporal variations of τc0 by EM method in an intertidal flat. The τc0 in mud flat was about two times higher than that in mixed flat. Compared to the end of tidal emersion, the sediment was 10–40% more erodible at the beginning stage.
Introduction
The sediment erodibility plays a key role in the evaluation of resistance to erosion, and is quantified as the eroded mass (EM) and erosion rate (ER). Understanding the erodibility of cohesive sediments is important for many ecological (e.g., primary production, benthic-pelagic coupling, and toxicity problems) and engineering applications (e.g., siltation of harbors, dredging of navigation channels, and coastal protection). The erodibility of non-cohesive sediments is primarily determined by their physical properties (e.g., grain size and bulk density) (Roberts et al., 1998). As cohesive sediments have highly variable parameters in space and time, however, it is difficult to directly measure or predict them. Furthermore, complex interactions occur between the physical, biological, and chemical parameters that impact the erodibility of cohesive sediment (Black et al., 2002; Grabowski et al., 2011). Thus, the site- and time-specific field experiments are often required to obtain the information on the erodibility of cohesive sediments.
The surface erosion threshold (τc0, also known as an initial critical shear stress for erosion) is largely used as one of parameters representing for sediment erodibility. It is defined as the bed shear stress (τb) at which the sediment erosion begins (Winterwerp and van Kesteren, 2004). Currently, several methods have been proposed to estimate a specific threshold. Amos et al. (2003), for instance, proposed three practical methods to define τc0: (1) the surface intercept of the failure-envelope on a plot of eroded depth vs. τb; the extrapolation to the ambient level through the regression of (2) ER and (3) suspended sediment concentration (SSC) vs. τb, respectively.
Despite such methodological efforts, the determination of τc0 is still debatable because of the investigator’s subjective definitions used to identify the initial sediment motion on the seabed (Sutherland et al., 1998). A portable and easy-to-use erosion microcosm system capable of deployment in the field has been developed. This type of device has been widely used in littoral environments, particularly intertidal flats, to quantify spatiotemporal variations of erodibility (Dickhudt et al., 2009; Wiberg et al., 2013; Ha H. J. et al., 2018). To date, many researchers have visually defined a τc0 based on the abrupt increase in SSC (or ER) (e.g., Maa and Kim, 2002), however, this approach is quite subjective. For example, τc0 was defined as the τb when an abrupt increase of SSC (>1.5 mg l–1) was first observed (Ha H. K. et al., 2018). Thus, there is a need to develop an accurate and objective method for determining τc0 using the extrapolation method (Widdows et al., 2007; Seo et al., 2020).
A series of erosion experiments were conducted on the intertidal flat, the west coast of South Korea to meet the aforementioned technical needs in the cohesive sediment community. The collected data were used as input in the three extrapolation methods using EM (the amount of erodible sediment at the bed), ER (the mass loss per unit time and area), and SSC, respectively. The main objectives of this study were (1) to compare methods for estimating τc0, and (2) to suggest a method suitable for revealing the spatiotemporal variation of erodibility in intertidal environments.
Materials and Methods
Study Area
The study area is located in the Muuido tidal flat, the west coast of South Korea (Figure 1). In Gyeonggi Bay, extensive tidal flats comprising a total area of 873 km2 have developed around the bedrock islands (Koh and Khim, 2014). The surface sediments consist of fine sand to silt with a mean grain size of 51.5 μm (Ha H. K. et al., 2018). Erosion experiments have been conducted at two sites: mud flat (GB01) and mixed flat (GB02) from September 11 to 17, 2020. Sediment cores were selectively collected at the neap (N1: September 11; and N2: September 13) and spring (S1: September 16; and S2: September 17) tides to examine the spring-neap tidal variation of erodibility (Figure 2A). The tides have a semi-diurnal regime, with mean tidal range of approximately 9 m (KMA, 2017), and tidal currents are ebb-dominated, reaching up to 1.5 m s–1 (Lee et al., 2013). Winds are dominated by the regional monsoon with mild south-southeasterly winds during summer and strong north-northwesterly winds during winter (KMA, 2017). The SSC was observed ranging from about 100–1,000 mg l–1 at nearby tidal channel (Park and Lee, 2016).
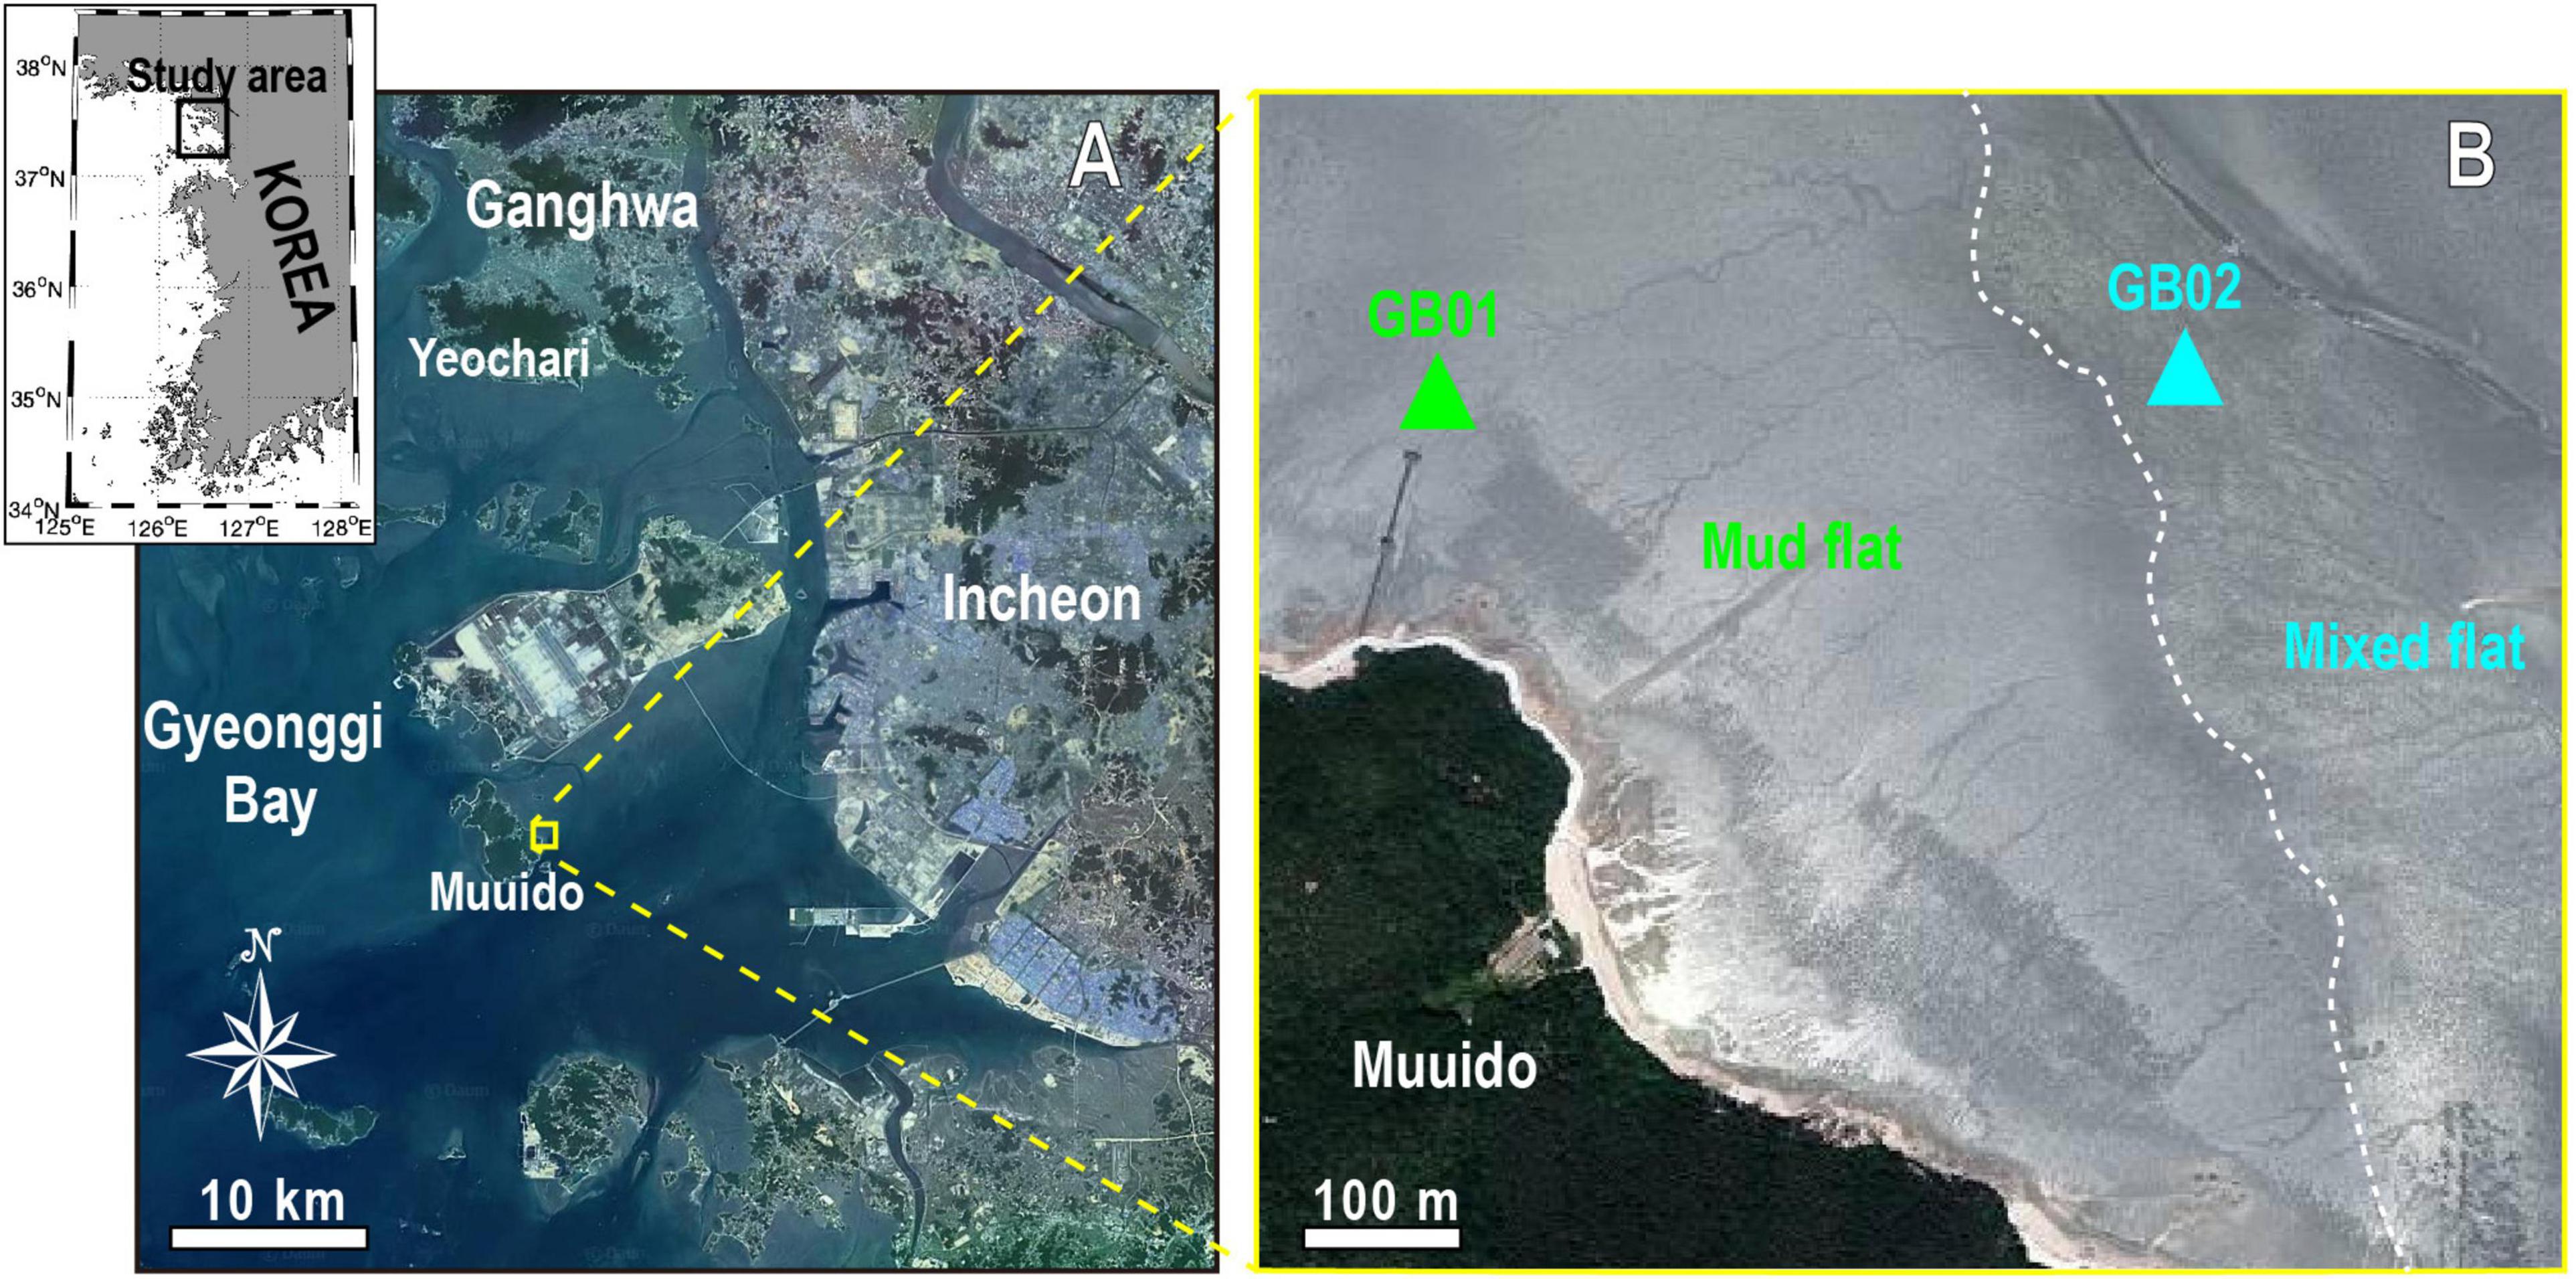
Figure 1. (A) Satellite image of the Gyeonggi Bay. The upper left inset shows the coast of Korean Peninsula. (B) Study area on the Muuido tidal flat showing the two sampling sites (GB01 and GB02) for sediment cores. All satellite images were acquired from http://map.kakao.com.
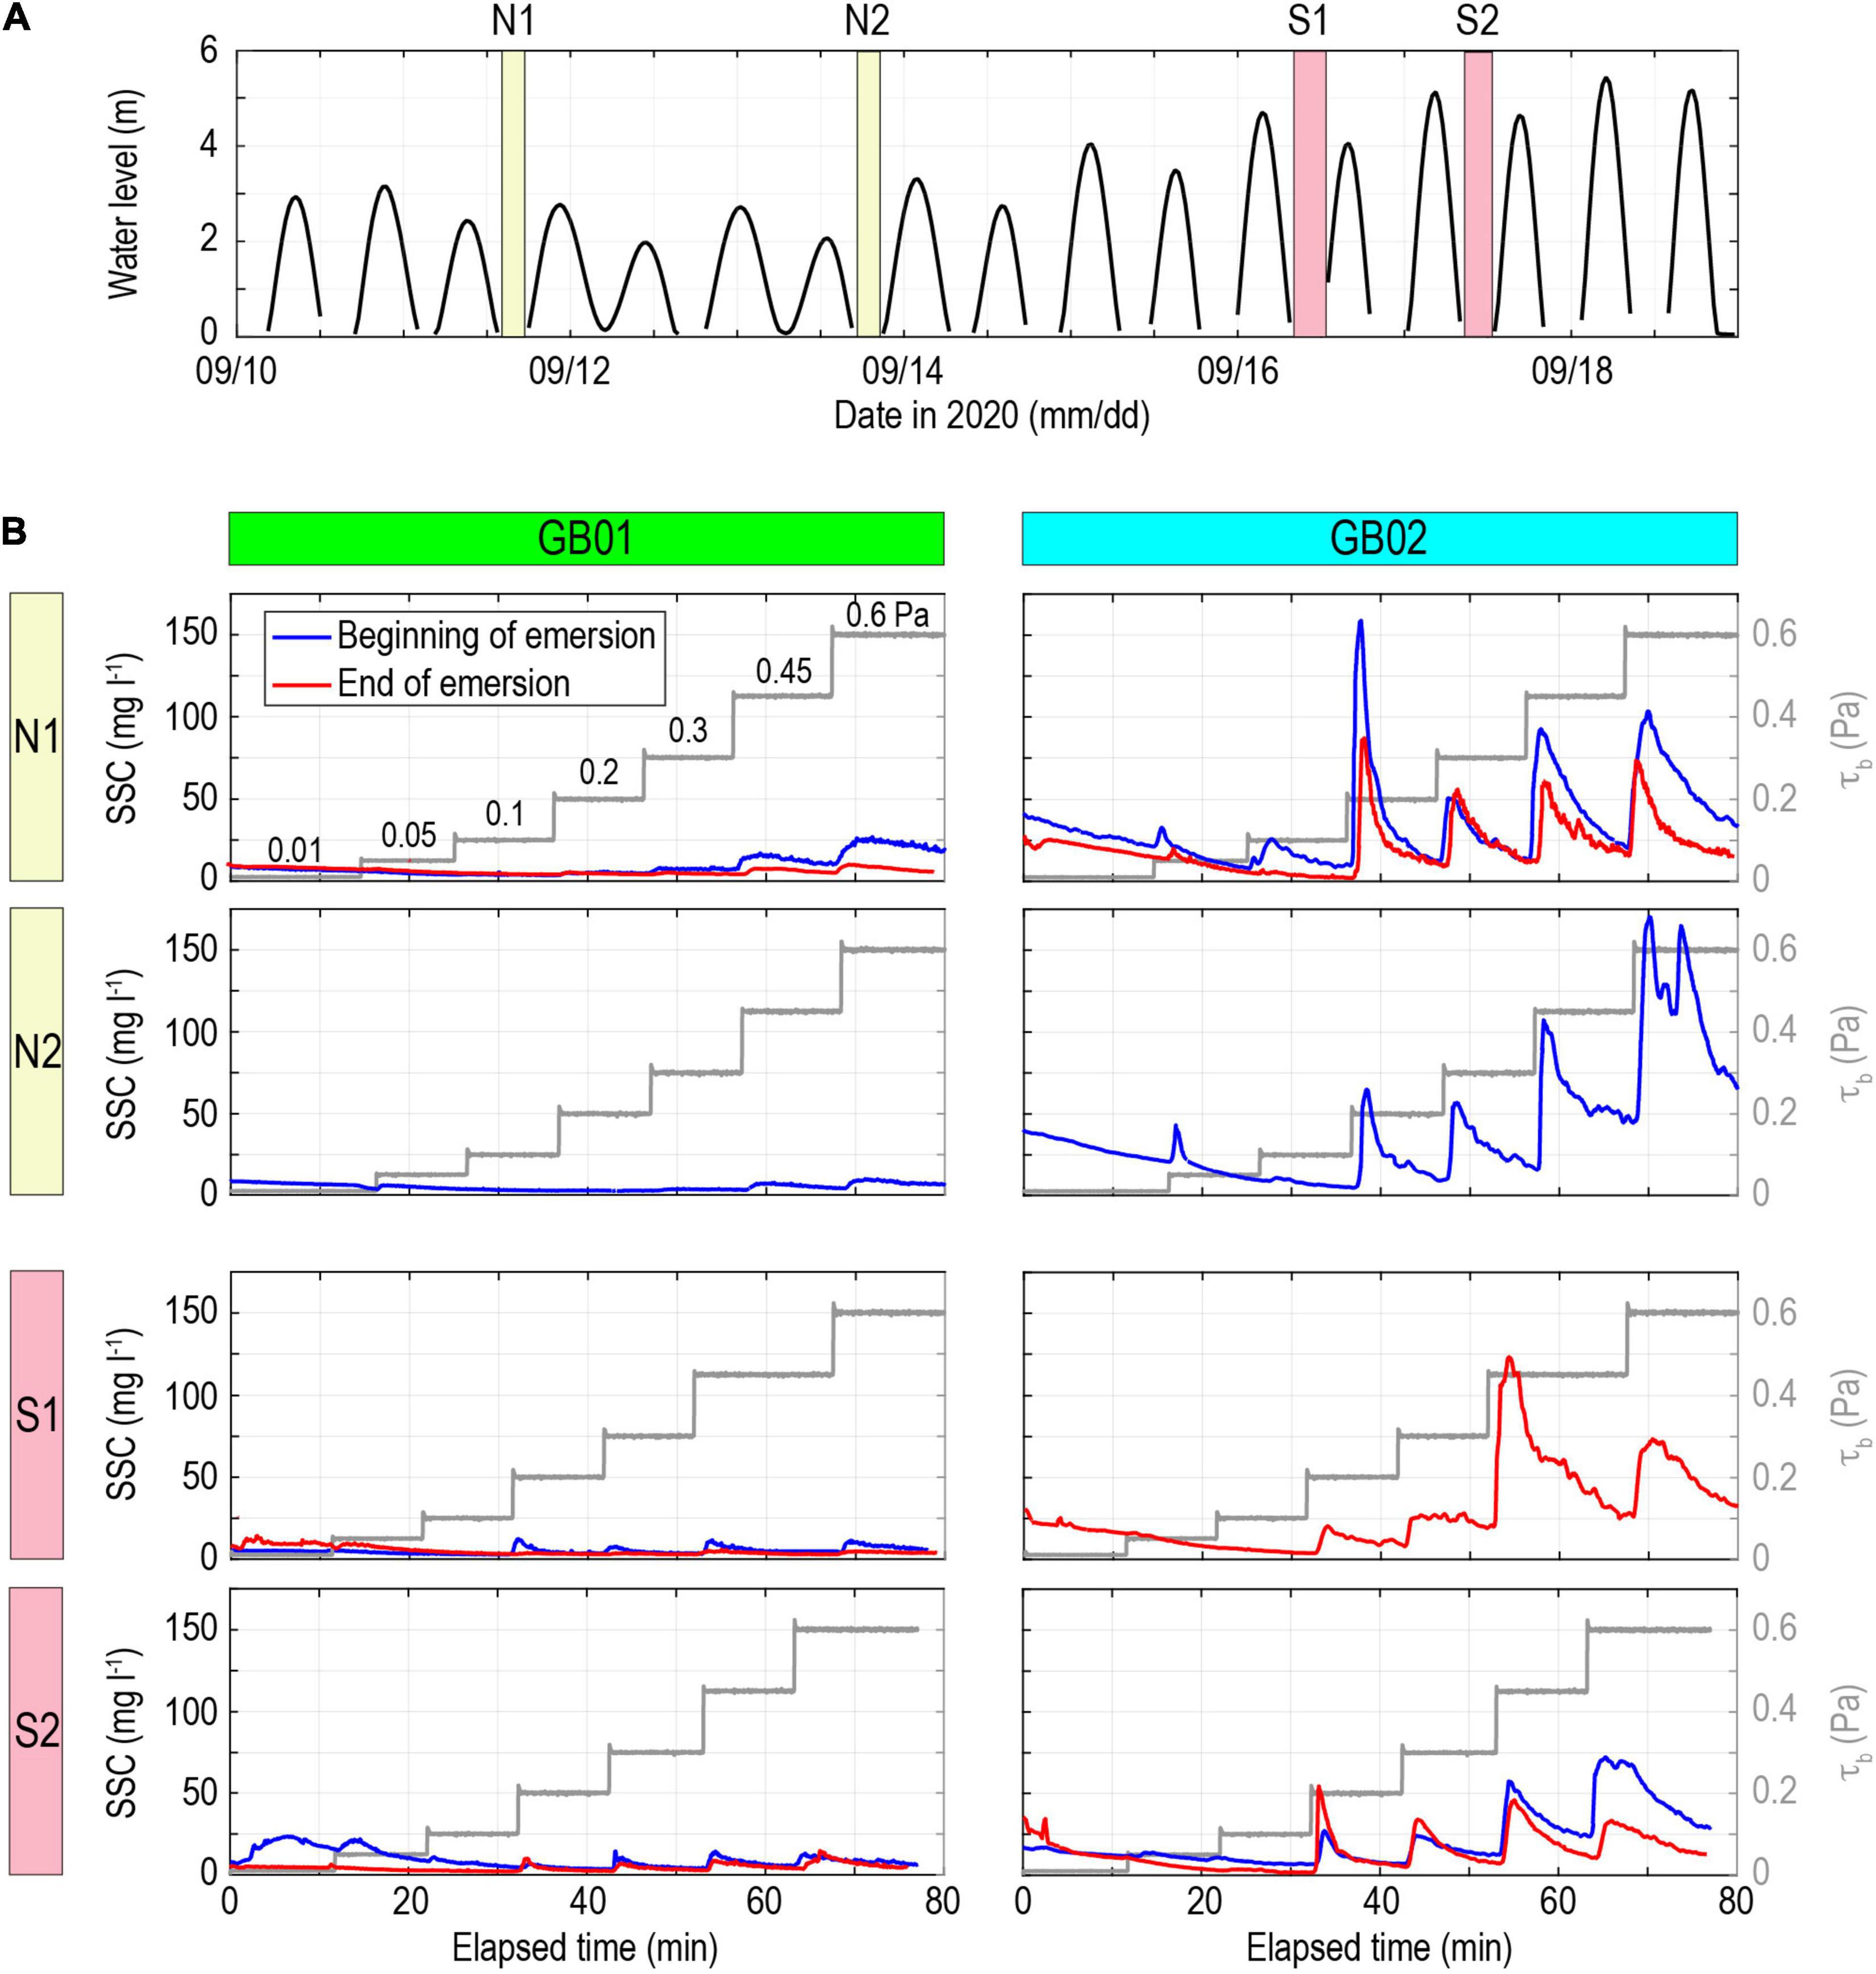
Figure 2. (A) Time series of water level (m) at GB02. Pressure sensor (RBR SoloD) was deployed at 0.1 m above bed. Pressure data were converted to water level. The shaded areas indicate the sampling times at 09/11 (N1), 09/13 (N2), 09/16 (S1), and 09/17 (S2). (B) Results of GEMS experiments. Sediment cores were collected at the beginning (blue line) and the end (red line) of emersion. Seven steps of τb (0.01–0.6 Pa) were applied for approximately 10 min per each step.
Microcosm Experiments
Sediment erodibility was measured using a dual-core Gust Erosion Microcosm System (GEMS) designed by Gust and Müller (1997). A GEMS comprises an erosion chamber, electronic control box, turbidimeter (Hach, 2100AN), water pump, erosion motor, and rotating disk (Supplementary Figure 1). A series of increasing τb is applied to the surficial of the sediment core by controlling both the rotation rate of disk and the water pumping rate. A conceptual diagram and a photograph of the GEMS could be found in Ha H. K. et al. (2018) and Seo et al. (2020). Sediment cores for erosion microcosm experiments were collected using an acrylic cylinder at the beginning and end of tidal emersion. The emersion time, which indicates how long since the site emerged from tidal flooding, was determined by the pressure sensor (RBR SoloD) at GB02. This sensor was deployed at 0.1 m above bed. After the collection, sediment cores were carefully carried to the laboratory, and then installed in the GEMS. Measurement of erodibility was started within 2 h after collecting a sediment core, to minimize the effects of dewatering and self-weight consolidation. Prior to the beginning of the erosion experiment, the sediment surface within the core was positioned at 10 cm below the bottom unit of rotating disk. Seven stepwise sequences of τb (0.01, 0.05, 0.1, 0.2, 0.3, 0.45, and 0.6 Pa) were applied to the top surface of core for approximately 10 min at each step. During the first 10 min of the experiment, a minimum τb (i.e., 0.01 Pa) was applied to flush out pre-existing suspended sediments within the core and inlet/outlet tubes. While the rotating disk began applying a given stress, the seawater obtained from the field site was pumped into the erosion chamber. The effluent water containing the eroded or resuspended sediments was passed through a turbidimeter, which was continuously recorded in turbidity [in nephelometric turbidity units (NTU)]. Throughout the erosion experiments, the τb and turbidity data were logged at 1 s interval. The effluent water from each stress step was sampled and then filtered through a 0.7 μm glass fiber filter (GF/F). The filters were oven dried at 105°C for 24 h and then weighed to estimate the ground-truth SSC (in mg l–1). The turbidity was converted to SSC using a linear regression between recorded NTU and the SSC derived from filtering (R2 = 0.92, not shown). This was then used to determine the EM at each τb. An erosion formulation developed by Sanford and Maa (2001) and Sanford (2006) was used as follows:
where m is the eroded mass (kg m–2), t is the elapsed time (s), ER is the erosion rate (kg m–2 s–1), M is the erosion rate parameter (kg m–2 s–1 Pa–1), τc is the depth-varying erosion threshold (Pa), and λ is the rate of sediment depletion (s–1).
Estimation of Surface Erosion Thresholds
In microcosm experiments, sediment erosion can be determined by the responses of SSC under increasing τb, which is expressed as the EM and ER. The τc0, a point of initial erosion of the bed, was estimated by three methods: (1) EM method: τc0 was determined by an x-intercept of the regression of the eroded mass vs. τb; (2) ER method: τc0 was determined, at background level of ER, through the linear regression of the time-averaged erosion rate vs. τb; and (3) SSC method: τc0 was determined, at background level of SSC, through the linear regression of the time-averaged SSC vs. τb. All the three have been used to compare the τc0 from various erosion devices (e.g., Neumeier et al., 2007; Widdows et al., 2007; Thompson et al., 2013; Seo et al., 2020) (Supplementary Table 1). In case of the ER and SSC methods, using time-averaged erosion rate and SSC from each τb, the linear regression was computed to remove the horizontal heterogeneity in τb and erosion parameters (Schoellhamer et al., 2017). Many researchers (e.g., Sanford, 2006; Jacobs et al., 2011) have interpreted the erosion rate for each applied τb as the average over the time interval. Detail explanations of each method are given in Widdows et al. (1998) and Amos et al. (2003).
The type of erosion was determined from the trends in erosion rate through time (Amos et al., 1992). Depth-limited erosion (type I), which is characterized by an increase in bed resistance and a decrease in erodibility with depth, is identified by an erosion rate that peaks rapidly when τb is increased, but then declines exponentially with time. Steady-state erosion (type II) is identified as having a near-constant erosion rate for a given τb because the τc does not change with depth in the sediment bed. Erosion of type I/II is a transitional form between type I and type II. The process of type I began with entrainment of the organic-rich fluff layer (type Ia), which then gave way to erosion of surface bed materials (type Ib) (Amos et al., 2003). Type Ib is considered more significant threshold concerning bed erosion (Widdows et al., 2007). The erosion amount of the fluff layer was negligibly small because it was a thin layer; and its threshold for erosion was small because this material was newly deposited and did not have sufficient time to develop self-weight consolidation (Ha and Maa, 2009). In this study, therefore, τc0 was determined by the onset of type Ib. If the linear regression between the erosion variables (EM, erosion rate, and SSC) and τb is divided into two parts by an inflection point, thereby transitioning from type Ib to type I/II (Seo et al., 2020). This partitioning of erosion type would be better suited for threshold estimation than no partitioning of this.
Results and Discussion
Comparison of Different Surface Erosion Thresholds
Figure 2B shows the time series of SSC under the applied τb’s. At GB01, SSC decreased with time until τb = 0.05 Pa, except the sediment core at the beginning of the emersion during S2 period. At GB02, SSC increased slightly in the transition period at which τb increased stepwise from 0.01–0.05 Pa, and then it quickly decreased. This small amount of erosion is representative of the removal of the fluff layer. The highest SSC generated among all the sediment cores was 24.45 mg l–1 at GB01, and it was 170.18 mg l–1 at GB02, indicating the presence of more erodible sediments at GB02. In GB01 and GB02, there was initial erosion of sediment at the τb of 0.3–0.45 Pa and 0.1–0.2 Pa, respectively.
τc0 was derived using linear regression between the erosion variables and τb. Representative cases of the three methods for estimating τc0 are shown in Figures 3, 4. For example, the time series of SSC at each τb in GB02 during N2 period (see Figure 2B) was converted to the data in Figure 3F indicated by the light red squares. The regression of ER and SSC method was fit through the time-averaged ER and SSC at each τb, respectively. At GB01, the relationship between erosion variables and τb showed a linear regression without an inflection point corresponding to type Ib (Figures 3A,C,E). At GB02, the relationship between the EM and τb revealed two phases (except the sediment cores at the end of emersion during N1 and S2): the first was a region of steady increase in EM with increasing τb from 0.1–0.3 Pa; the second was a distinct inflection in the regression line at the τb between 0.3 and 0.45 Pa (Figure 3B). These phases might correspond to type Ib and type I/II, respectively. There was also an inflection in the regression line between the ER (and SSC) and τb (Figures 3D,F). At the end of emersion during N1 and S2 periods, a linear regression between the EM and τb reflected type Ib (i.e., a single regression line without inflection) in GB02 (Figure 4B).
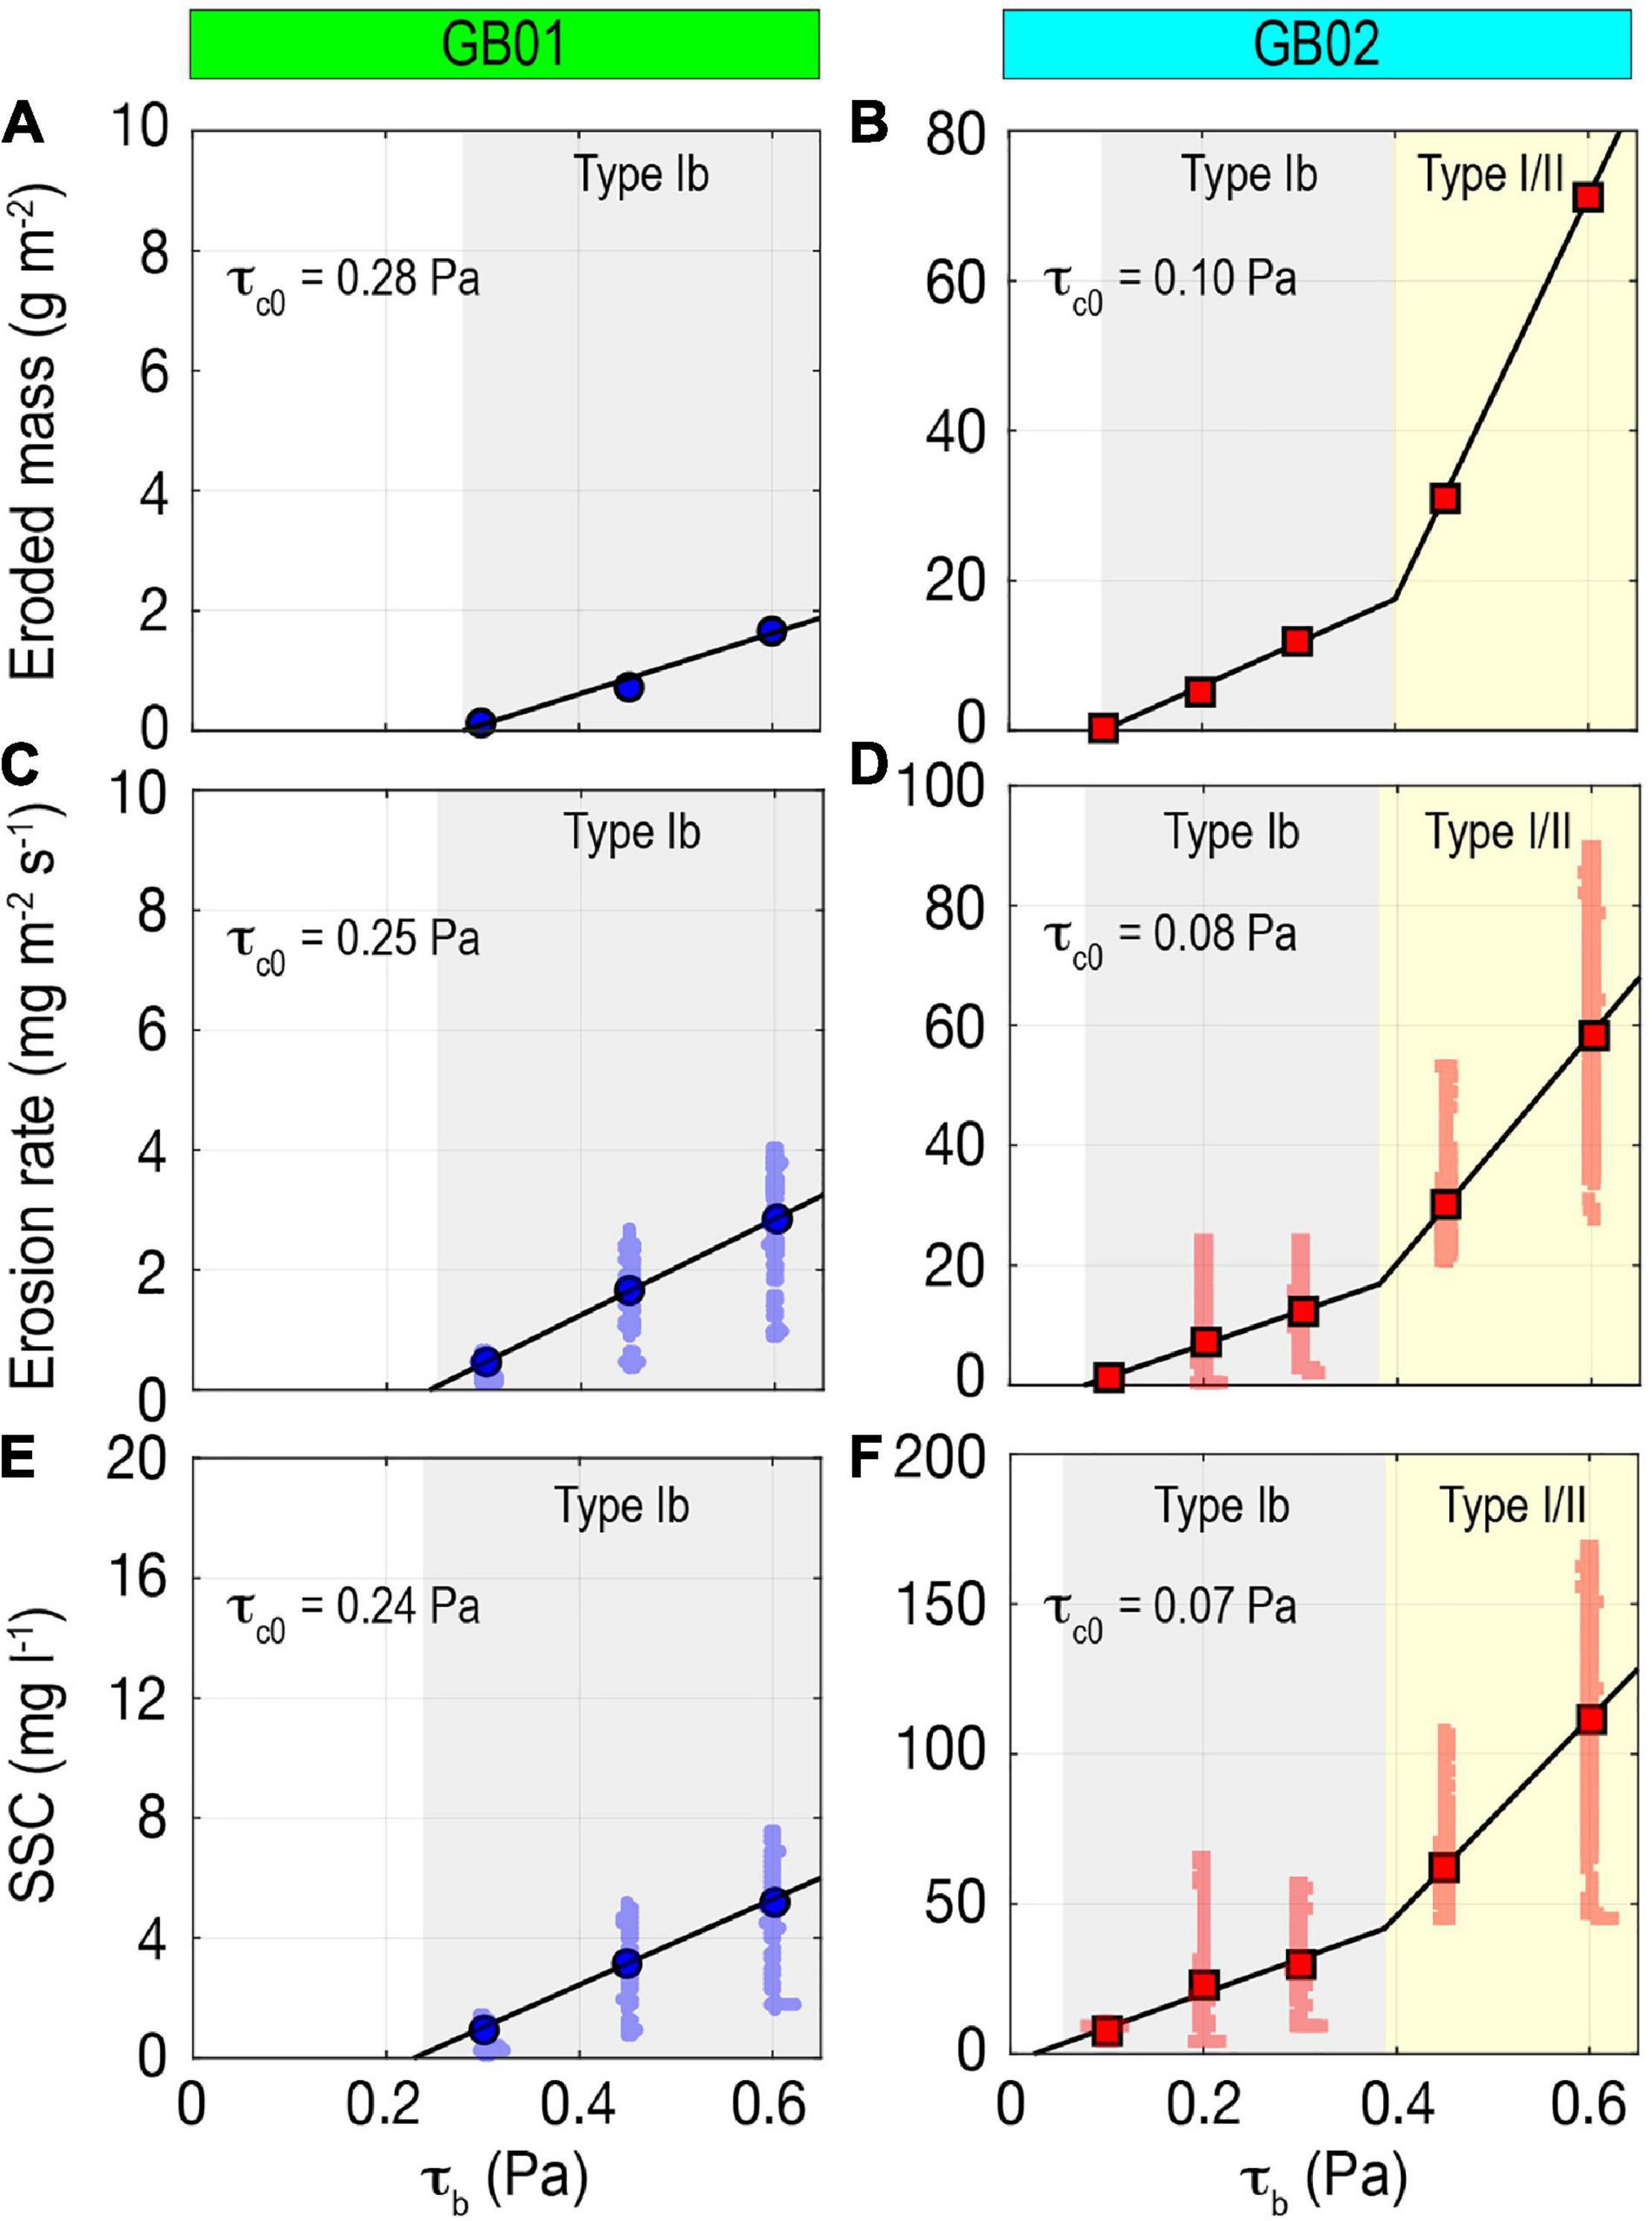
Figure 3. Plots used in the determination of surface erosion threshold (τc0) in GB01 (A,C,E) and GB02 (B,D,F) at the beginning of emersion during N2 period (see Figure 2A): eroded mass (A,B), erosion rate (C,D), and SSC (E,F) as a function of applied bed shear stress (τb), respectively. Blue dots and red squares indicate mean values at each step of τb. Black solid lines indicate the fitting of regression line. Areas of light gray and yellow indicate the erosion of type Ib and type I/II, respectively.
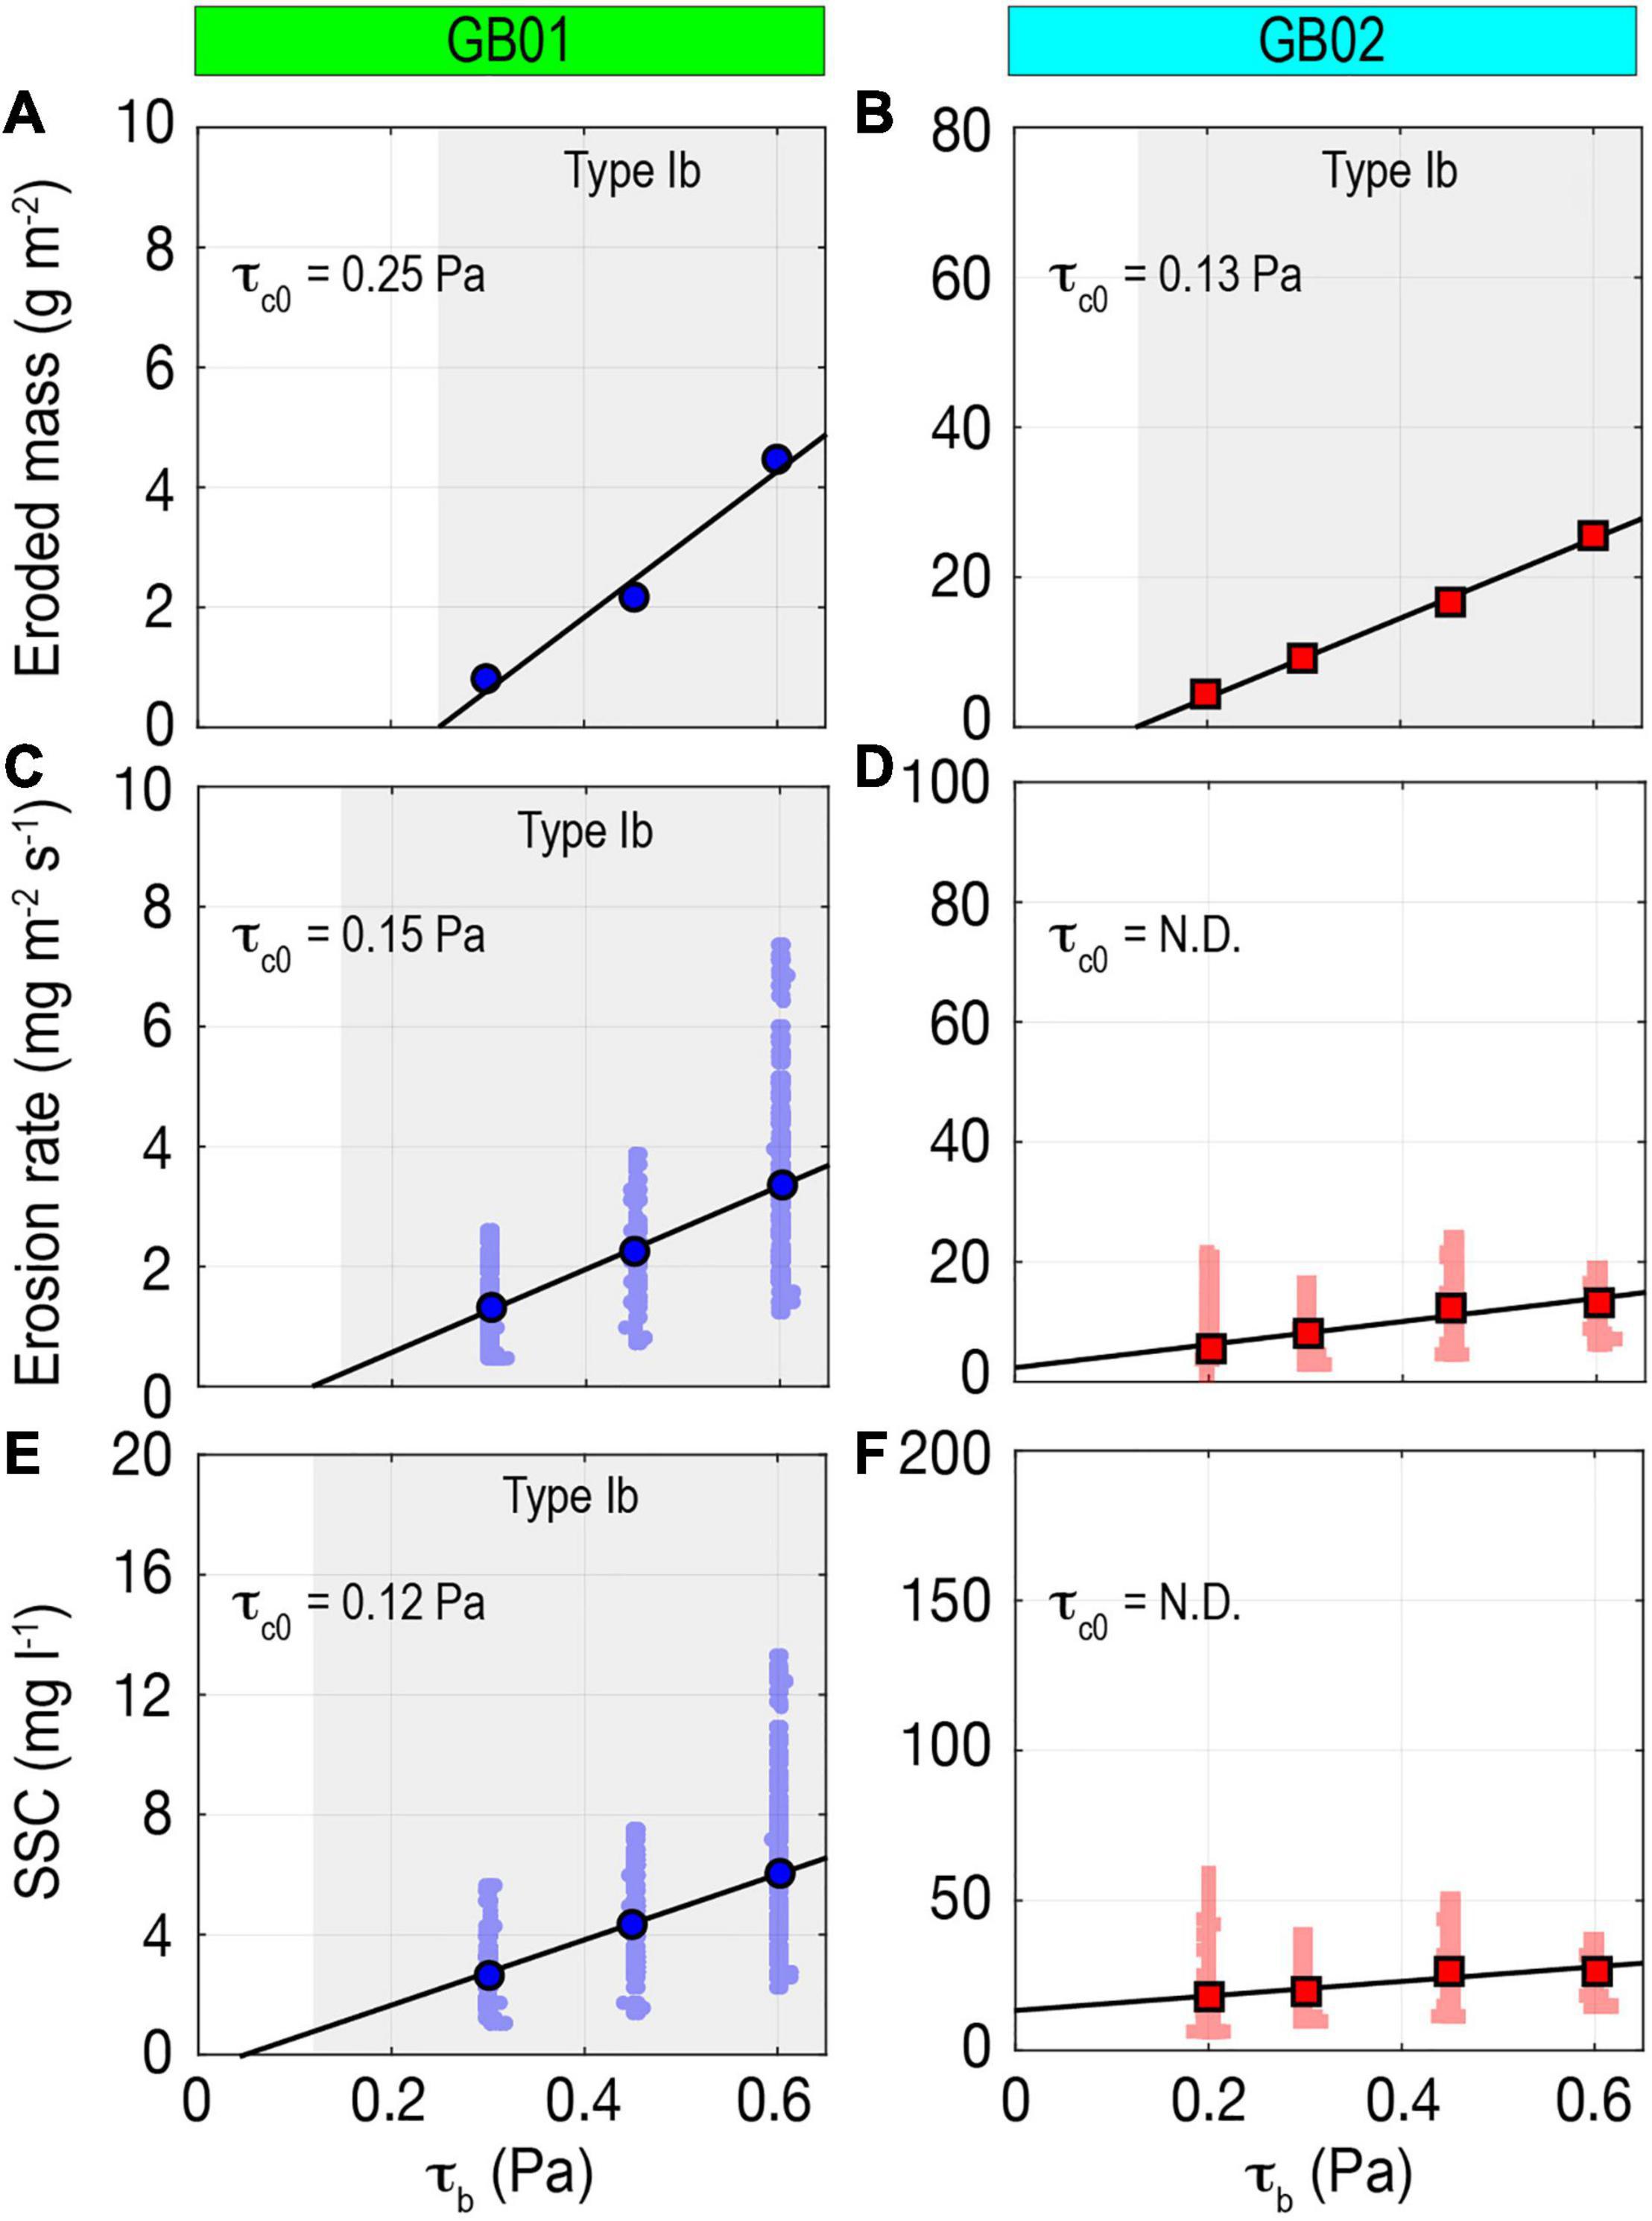
Figure 4. Plots used in the determination of surface erosion threshold (τc0) in GB01 (A,C,E) and GB02 (B,D,F) at the end of emersion during S2 period (see Figure 2A): eroded mass (A,B), erosion rate (C,D), and SSC (E,F) as a function of applied bed shear stress (τb), respectively. Blue dots and red squares indicate mean values at each step of τb. Black solid lines indicate the fitting of regression line. Area of light gray indicates the erosion of type Ib. N.D., not determined.
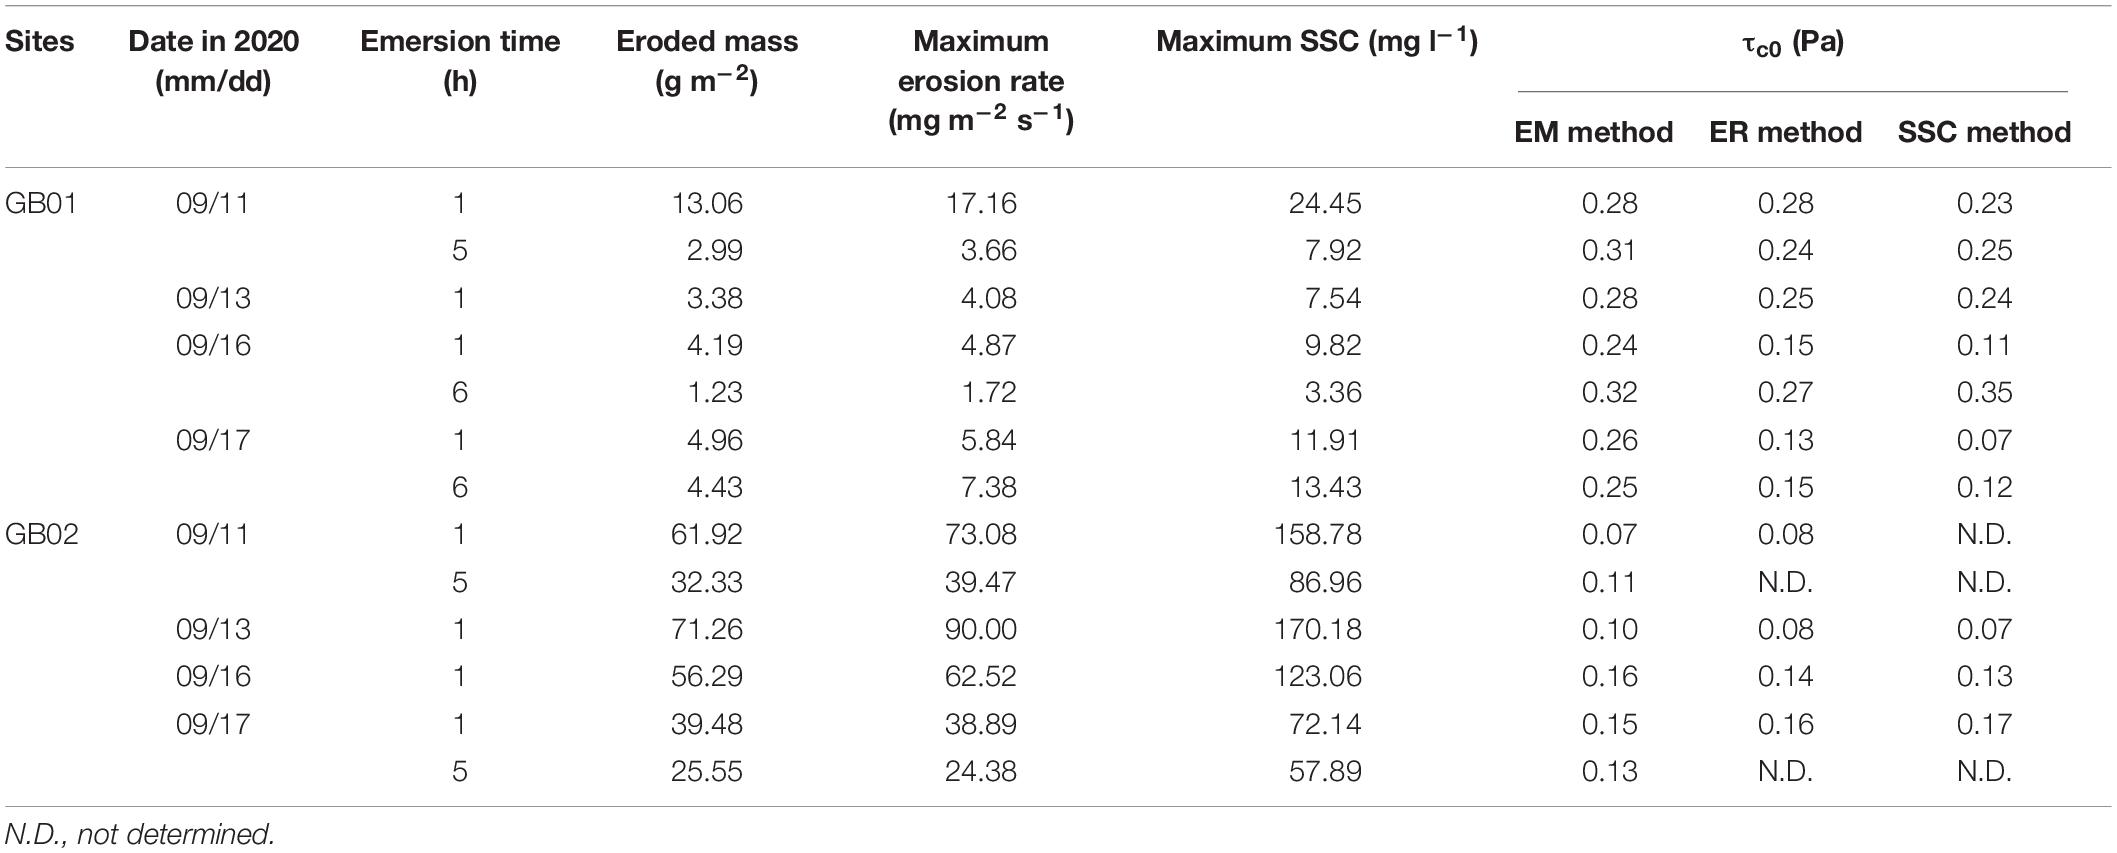
A summary of τc0 is provided in Table 1. At GB01, the mean values of τc0 for three methods were: (1) 0.28 ± 0.03 Pa (EM); (2) 0.21 ± 0.06 Pa (ER); and (3) 0.20 ± 0.10 Pa (SSC). The τc0 in ER and SSC methods were similar. The τc0 by EM method was consistently higher than the results from ER and SSC methods, due to the steeper slope in the regression line (Figures 4A,C,E). At GB02, the τc0 by ER and SSC methods partly yielded a negative x-intercept caused by the extremely low slope in regression (Figures 4D,F), resulting in the “not-determined (N.D.) τc0” (Table 1). During N2 and S1 periods, the τc0 by EM method was about 25% higher than the results from ER and SSC methods. During S2 period, it was about 10% lower than the τc0 by ER and SSC methods. Because the EM representing the erodible depth was accumulated with increasing τb, the EM method is suitable for reflecting the depth-limited erosion of cohesive sediments. After the erodible sediment was removed at each step of τb, SSC and ER gradually decreased with time. Thus, the regression of the SSC and ER vs. τb might skew an x-intercept. Especially, the SSC method yielded the lowest τc0 due to the outflow water containing eroded sediments from the erosion chamber.
The data from the GEMS experiments could be represented as the plots of the EM vs. τc (Figure 5). Based on the data from all sediment cores at each site, the equation was obtained using a best-fit power law regression in the form of m = a(τc -τc0)b, where m is the eroded mass (kg m–2) (Sanford and Maa, 2001; Dickhudt et al., 2009). This regression equation could be used in sediment transport models (Fall et al., 2014). The results of other published erodibility data in tidal flat/marsh environments measured by GEMS were similar to the results presented here from the Muuido tidal flat (Figure 5). Based on the best-fit curve, the τc0 in GB02 was determined as 0.03 Pa, which corresponds to an erosion threshold of fluff layer (i.e., type Ia) (Jago et al., 2002; Ha and Maa, 2009). However, the τc0 in GB01 could not be determined because of a negative x-intercept of the regression curve caused by low erodibility. In this case, the previous studies (see references in Table 2) suggested either 0.01 Pa (the minimum τb applied for GEMS) or 0 Pa for τc0 to ensure that the fit produced reasonable data.
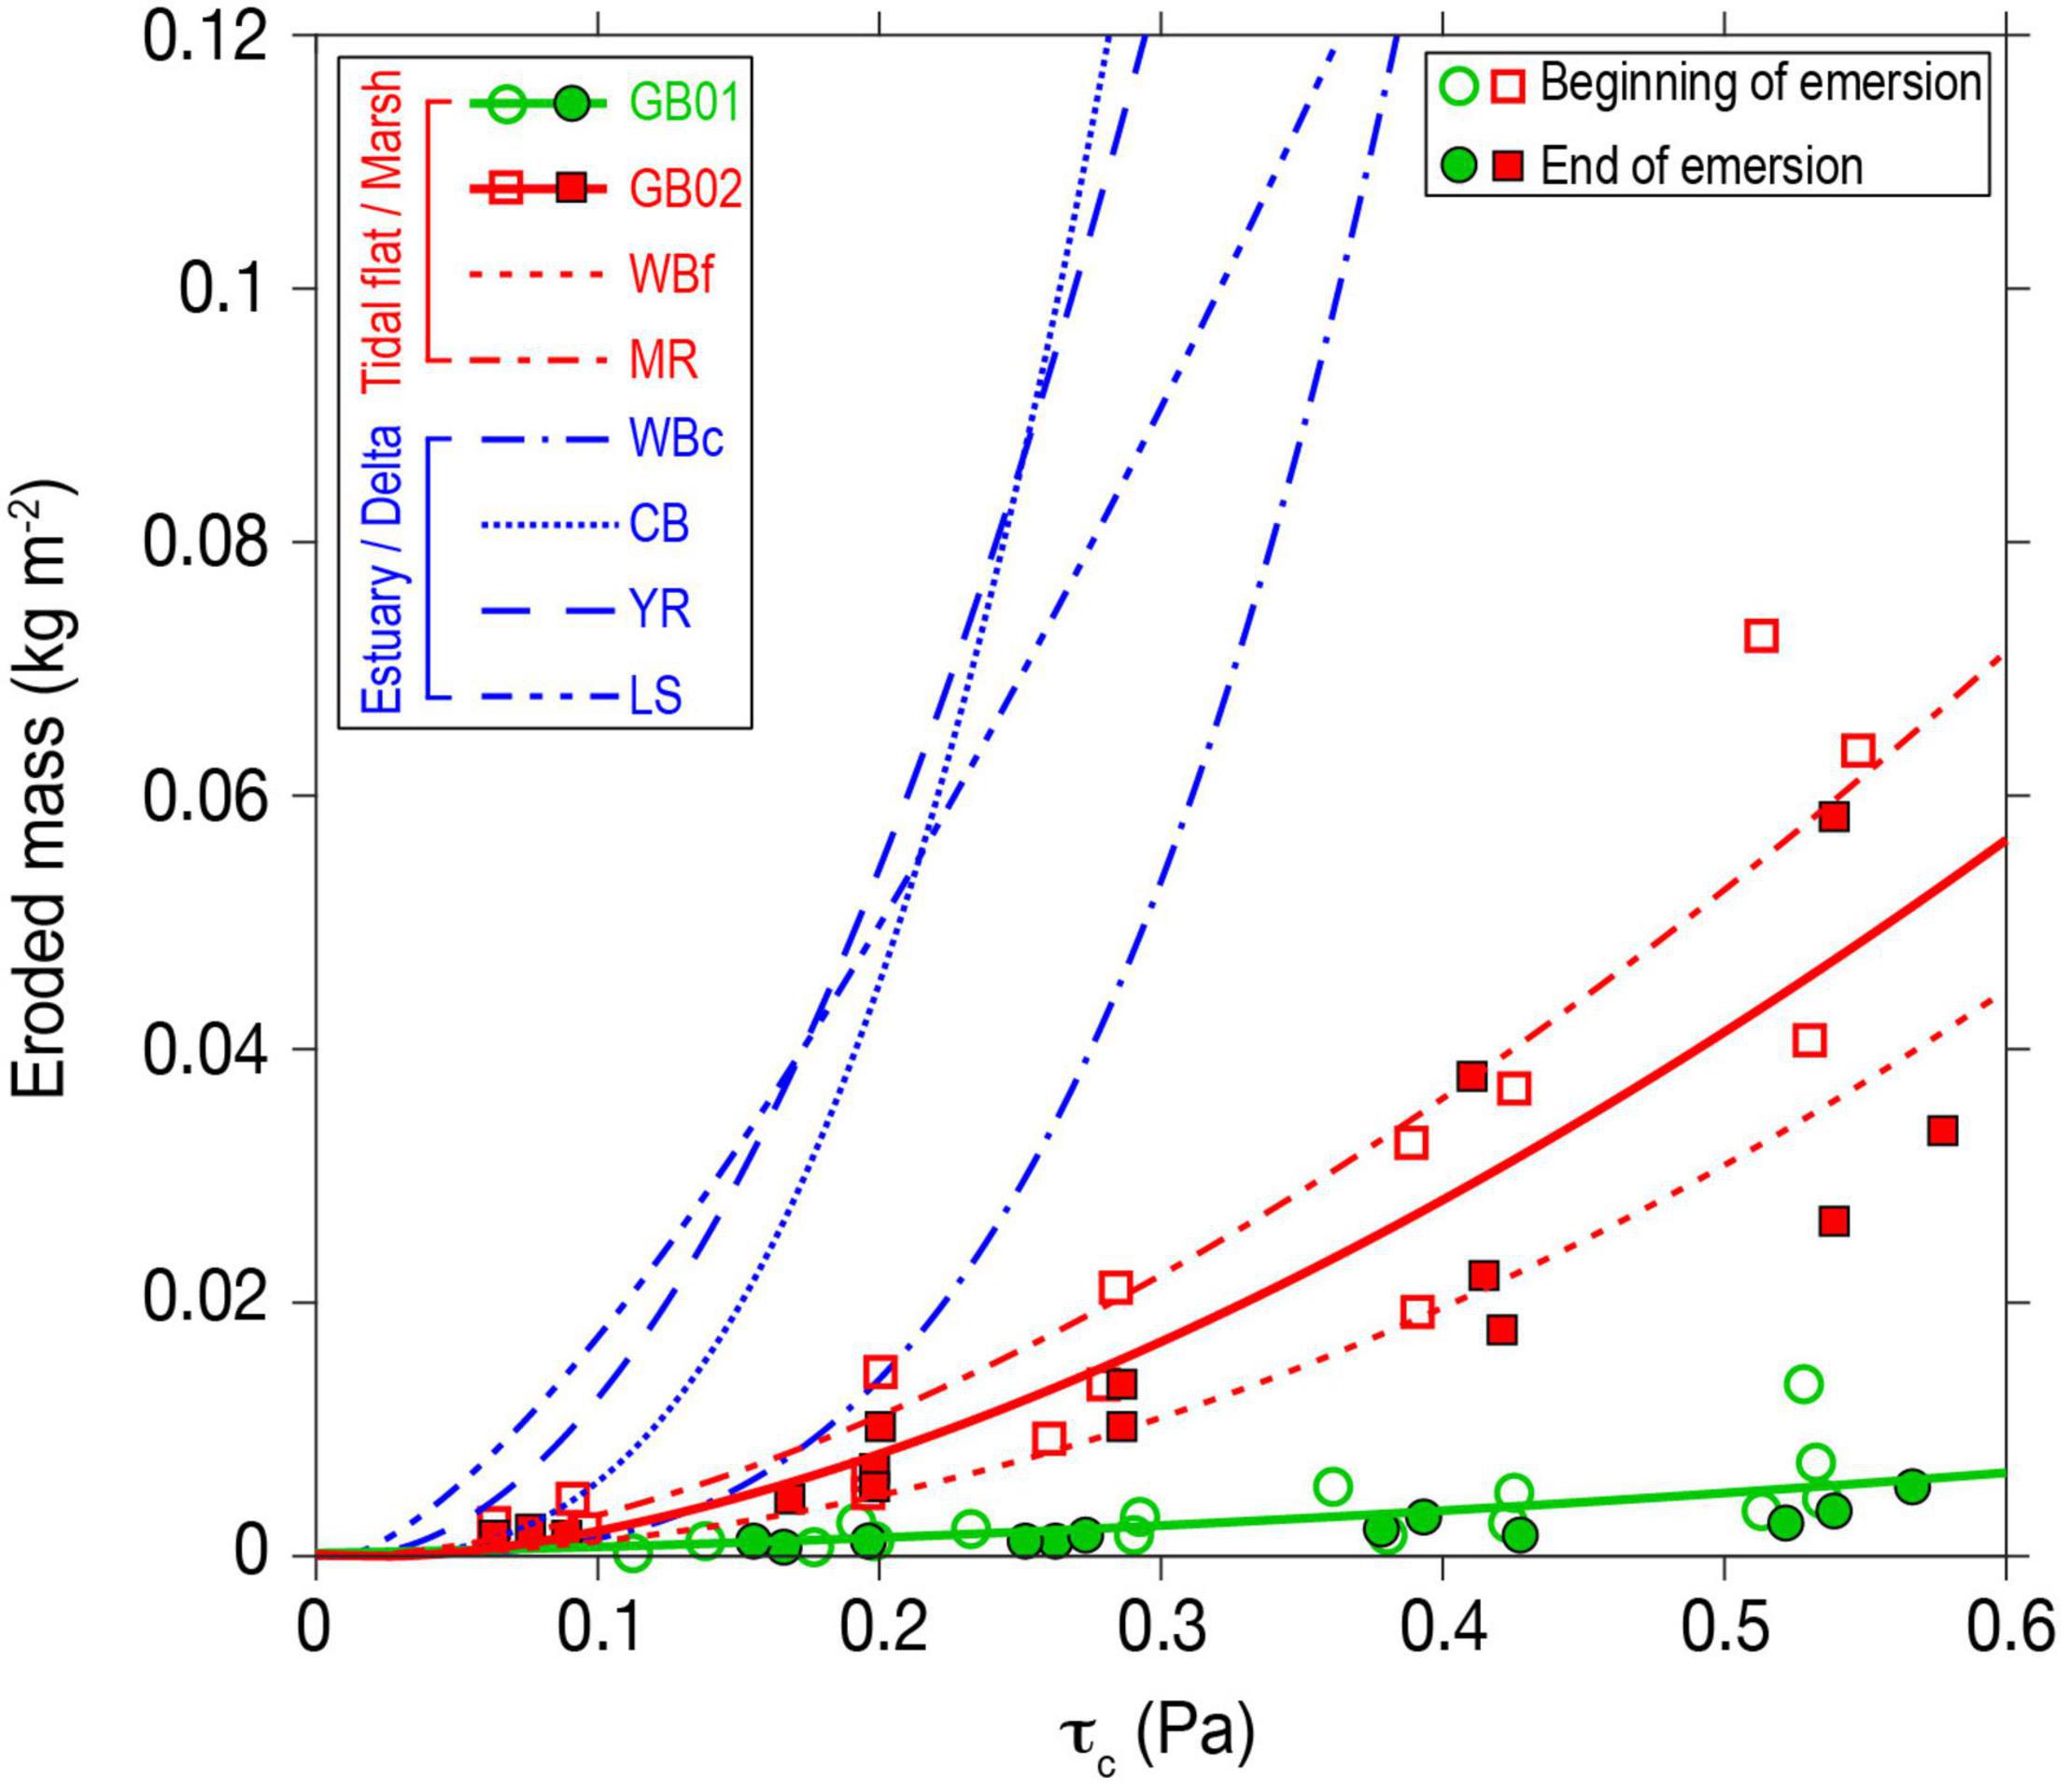
Figure 5. Relationship between eroded mass and erosion threshold (τc) in GB01 (green circles) and GB02 (red squares). Data at other sites are from Sanford (2006); Dickhudt et al. (2009), Wiberg et al. (2013), and Xu et al. (2014, 2016). See Table 2 for site information in legend.
Spatiotemporal Variation in Erodibility
The erodibility of cohesive sediment has been quantified as the τc0 and EM (Dickhudt et al., 2009; Ha H. K. et al., 2018). Our results indicated a spatial variation of erodibility between mud flat and mixed flat. The τc0 by EM method in GB01 (mud flat, mean = 0.28 ± 0.03 Pa) was about two times higher than that in GB02 (mixed flat, mean = 0.12 ± 0.03 Pa). The EM in GB01 (mean = 4.89 ± 3.80 g m–2) also was about one order lower than that in GB02 (mean = 47.81 ± 18.03 g m–2). As seen in the erosion curves (Figure 5), the mixed flat was more erodible than the mud flat. Previous studies suggested that the spatial variations of erodibility of intertidal flats were caused by two main factors: (1) the sediment composition; and (2) the extracellular polymeric substances (EPS) concentration (Panagiotopoulos et al., 1997; Andersen et al., 2010). Even small amounts of mud content can create the cohesive attachment when mixed in non-cohesive sediment. Proportions of clay greater than 10% is sufficient for sediment stabilization (van Ledden et al., 2004). Ha H. J. et al. (2018) found that the sediment erodibility in mud flat was about seven times lower than that in mixed flat due to increasing clay content on the Yeochari tidal flat, northern Gyeonggi Bay (for location, see Figure 1A). Therefore, the field-based measurements of spatial variability in erodibility and sediment composition are needed to understand the regional-scale sediment transport and morphology evolution. The EPS, which is secreted out of microphytobenthos (MPB), plays a key role in the “biostabilization” (Andersen et al., 2010). The EPS concentration and MPB biomass, which have a semi-annual to annual variability, are at their lowest levels from September to November (Park et al., 2014). In this study, it seems unlikely that the sediment erodibility was affected by EPS.
Temporal variation of sediment erodibility has been found on various timescales such as intra-tidal and spring-neap tidal cycles (Grabowski et al., 2011). As shown in Figure 6, the τc0 at the beginning of tidal emersion was about 10–40% lower than that at the end, indicating that the subaerial emersion time might be a factor to determine the intra-tidal variation of τc0 (Fagherazzi et al., 2017). In addition, the sediment in the spring tide was about 80% less erodible than in the neap tide at GB02 (Figure 6). As the spring tides have stronger currents compared to neap tides, more sediments are resuspended into the water column, and the consolidated (i.e., low erodibility) sediment beds are more exposed.
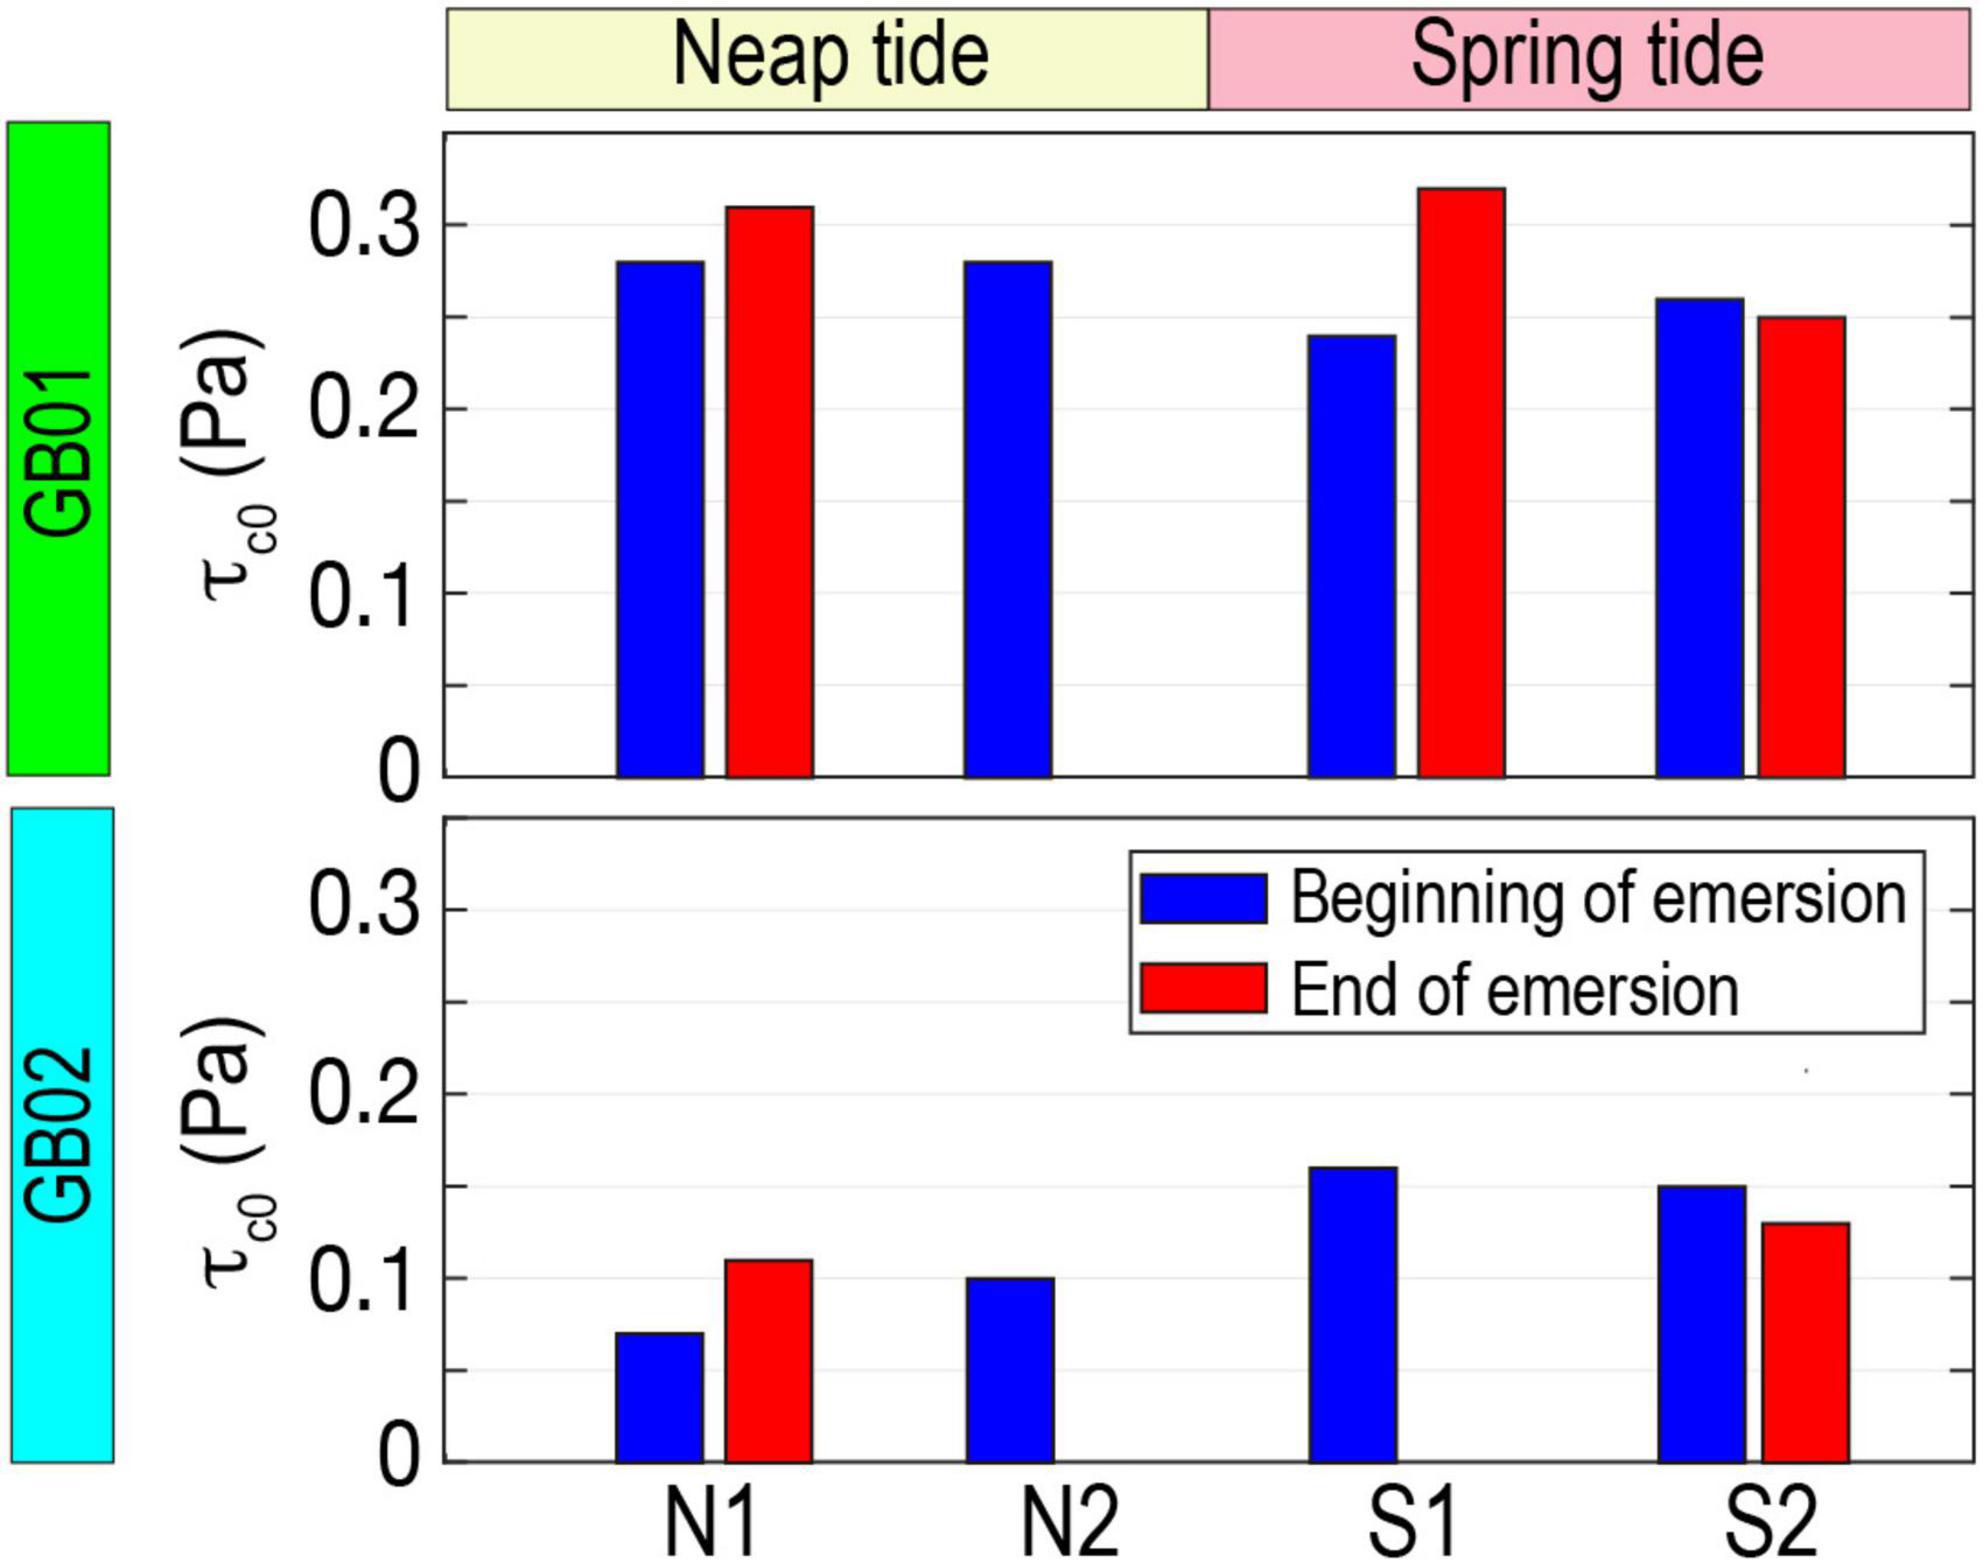
Figure 6. The surface erosion threshold (τc0) at GB01 (upper panel) and GB02 (lower panel) sites during N1, N2, S1, and S2 periods (see Figure 2A).
Conclusion
Three methods for determining the τc0 of cohesive sediments in an intertidal flat were compared using an erosion microcosm system. The conclusions drawn from this study could be summarized as follows:
(1) The τc0 by EM method was slightly higher than the results from the ER and SSC methods. The EM method is more robust and accurate (within the range of τb step at which erosion begins) than the ER and SSC methods. The τc of the consolidated sediment bed increased with sediment depth, and thus the eroded mass representing the erodible depth was accumulated with increasing τb. This suggested that the EM method is suitable for reflecting the depth-limited erosion of cohesive sediments.
(2) The SSC method produced the lowest τc0, owing to the outflow of suspended sediment from the erosion chamber. After depleting the erodible sediment at each step of τb, the SSC gradually decreased with time. Therefore, the regression between SSC and applied τb might skew an x-intercept, leading to a lower τc0.
(3) This study identified the spatiotemporal variations of sediment erodibility in an intertidal flat. The τc0 in mud flat was about two times higher than that in mixed flat. Compared to the end of tidal emersion, the sediment was 10–40% more erodible at the beginning stage. The τc0 during spring tide was about 80% higher than that during neap tide.
Data Availability Statement
The datasets generated for this study are available on request to the corresponding author.
Author Contributions
HJH designed the study, performed the experiments, and wrote the manuscript. HKH identified research goals, performed the analysis, and supervised the study. Both authors contributed to the article and approved the submitted version.
Funding
This study is supported by the National Research Foundation of Korea (NRF-2018R1D1A1A02085804). This study is also supported by the project entitled “Marine Ecosystem-Based Analysis and Decision-Making Support System Development for Marine Spatial Planning” (20170325), and “Development of Advanced Science and Technology for Marine Environmental Impact Assessment” (20210427), funded by the Ministry of Oceans and Fisheries of Korea (MOF).
Conflict of Interest
The authors declare that the research was conducted in the absence of any commercial or financial relationships that could be construed as a potential conflict of interest.
Publisher’s Note
All claims expressed in this article are solely those of the authors and do not necessarily represent those of their affiliated organizations, or those of the publisher, the editors and the reviewers. Any product that may be evaluated in this article, or claim that may be made by its manufacturer, is not guaranteed or endorsed by the publisher.
Supplementary Material
The Supplementary Material for this article can be found online at: https://www.frontiersin.org/articles/10.3389/fmars.2021.695845/full#supplementary-material
References
Amos, C. L., Daborn, G. R., Christian, H. A., Atkinson, A., and Robertson, A. (1992). In situ erosion measurements on fine-grained sediments from the Bay of Fundy. Mar. Geol. 108, 175–196. doi: 10.1016/0025-3227(92)90171-D
Amos, C. L., Droppo, I. G., Gomez, E. A., and Murrphy, T. P. (2003). The stability of a remediated bed in Hamilton Harbour, Lake Ontario, Canada. Sedimentology 50, 149–168. doi: 10.1046/j.1365-3091.2003.00542.x
Andersen, T. J., Lanuru, M., van Bernem, C., Pejrup, M., and Riethmueller, R. (2010). Erodibility of a mixed mudflat dominated by microphytobenthos and Cerastoderma edule, East Frisian Wadden Sea, Germany. Estuar. Coast. Shelf Sci. 87, 197–206. doi: 10.1016/j.ecss.2009.10.014
Black, K. S., Tolhurst, T. J., Paterson, D. M., and Hagerthey, S. E. (2002). Working with natural cohesive sediments. J. Hydraul. Eng. 128, 2–8. doi: 10.1061/(ASCE)0733-94292002128:1(2)
Dickhudt, P. J., Friedrichs, C. T., Schaffner, L. C., and Sanford, L. P. (2009). Spatial and temporal variation in cohesive sediment erodibility in the York River estuary, eastern USA: a biologically influenced equilibrium modified by seasonal deposition. Mar. Geol. 267, 128–140. doi: 10.1016/j.margeo.2009.09.009
Fagherazzi, S., Viggato, T., Vieillard, A., Mariotti, G., and Fulweiler, R. W. (2017). The effect of evaporation on the erodibility of mudflats in a mesotidal estuary. Estuar. Coast. Shelf Sci. 194, 118–127. doi: 10.1016/j.ecss.2017.06.011
Fall, K. A., Harris, C. K., Friedrichs, C. T., Rinehimer, J. P., and Sherwood, C. R. (2014). Model behavior and sensitivity in an application of the cohesive bed component of the community sediment transport modeling system for the York River Estuary, VA, USA. J. Mar. Sci. Eng. 2, 413–436. doi: 10.3390/jmse2020413
Grabowski, R. C., Droppo, I. G., and Wharton, G. (2011). Erodibility of cohesive sediment: the importance of sediment properties. Earth Sci. Rev. 105, 101–120. doi: 10.1016/j.earscirev.2011.01.008
Gust, G., and Müller, V. (1997). “Interfacial hydrodynamics and entrainment functions of currently used erosion devices,” in Cohesive Sediments, eds N. Burt, R. Parker, and J. Watts (Wallingford, CT: Wiley), 149–174.
Ha, H. J., Choi, S. M., Seo, J. Y., and Ha, H. K. (2018). Erodibility of sand-mud mixed sediment on the Yeochari tidal flat, Gyeonggi Bay, Korea. J. Coast. Res. 85, 416–420. doi: 10.2112/SI85-084.1
Ha, H. K., Ha, H. J., Seo, J. Y., and Choi, S. M. (2018). Effects of vegetation and fecal pellets on the erodibility of cohesive sediments: Ganghwa tidal flat, west coast of Korea. Environ. Pollut. 241, 468–474. doi: 10.1016/j.envpol.2018.05.067
Ha, H. K., and Maa, J. P.-Y. (2009). Evaluation of two conflicting paradigms for cohesive sediment deposition. Mar. Geol. 265, 120–129. doi: 10.1016/j.margeo.2009.07.001
Jacobs, W., Le Hir, P., van Kesteren, W., and Cann, P. (2011). Erosion threshold of sand-mud mixtures. Cont. Shelf Res. 31, S14–S25. doi: 10.1016/j.csr.2010.05.012
Jago, C. F., Jones, S. E., Latter, R. J., McCandliss, R. R., Hearn, M. R., and Howarth, M. J. (2002). Resuspension of benthic fluff by tidal currents in deep stratified waters, northern North Sea. J. Sea Res. 48, 259–269. doi: 10.1016/S1385-1101(02)00181-8
Koh, C.-H., and Khim, J. S. (2014). The Korean tidal flat of the Yellow sea: physical setting, ecosystem and management. Ocean Coast. Manage. 102, 398–414. doi: 10.1016/j.ocecoaman.2014.07.008
KMA (2017). National Climate Data Service System. Available online at: http://sts.kma.go.kr/. (accessed September 30, 2020).
Lee, H. J., Park, J. Y., Lee, S. H., Lee, J. M., and Kim, T. K. (2013). Suspended sediment transport in a rock-bound, macrotidal estuary: Han estuary, eastern Yellow sea. J. Coast. Res. 29, 358–371. doi: 10.2112/JCOASTRES-D-12-00066.1
Maa, J. P.-Y., and Kim, S. C. (2002). A constant erosion rate model for fine sediment in the York River, Virginia. Environ. Fluid Mech. 1, 343–360. doi: 10.1023/A:1015799926777
Neumeier, U., Friend, P. L., Gangelhof, U., Lunding, J., Lundkvist, M., Bergamasco, A., et al. (2007). The influence of fish feed pellets on the stability of seabed sediment: a laboratory flume investigation. Estuar. Coast. Shelf Sci. 75, 347–357. doi: 10.1016/j.ecss.2007.04.036
Panagiotopoulos, I., Voulgaris, G., and Collins, M. B. (1997). The influence of clay on the threshold of movement of fine sandy beds. Coast. Eng. 32, 19–43. doi: 10.1016/S0378-3839(97)00013-6
Park, H. B., and Lee, G. (2016). Evaluation of ADCP backscatter inversion to suspended sediment concentration in estuarine environments. Ocean Sci. J. 51, 109–125. doi: 10.1007/s12601-016-0010-3
Park, J., Kwon, B. O., Kim, M., Hong, S., Ryu, J., Song, S. J., et al. (2014). Microphytobenthos of Korean tidal flats: a review and analysis on floral distribution and tidal dynamics. Ocean Coast. Manag. 102, 471–482. doi: 10.1016/j.ocecoaman.2014.07.007
Roberts, J., Jepsen, R., Gotthard, D., and Lick, W. (1998). Effects of particle size and bulk density on erosion of quartz particles. J. Hydraul. Eng. 124, 1261–1267. doi: 10.1061/(ASCE)0733-94291998124:121261
Sanford, L. P. (2006). Uncertainties in sediment erodibility estimates due to a lack of standards for experimental protocols and data interpretation. Integr. Environ. Assess. Manage. 2, 29–34. doi: 10.1002/ieam.5630020106
Sanford, L. P., and Maa, J. P. Y. (2001). A unified erosion formulation for fine sediments. Mar. Geol. 179, 9–23. doi: 10.1016/S0025-3227(01)00201-8
Schoellhamer, D. H., Manning, A. J., and Work, P. A. (2017). Erosion characteristics and horizontal variability for small erosion depths in the Sacramento-San Joaquin River Delta, California, USA. Ocean Dyn. 67, 799–811. doi: 10.1007/s10236-017-1047-2
Seo, J. Y., Choi, S. M., Ha, H. K., and Lee, K. E. (2020). Enhanced erodibility of deep-sea sediments by presence of calcium carbonate particles. Geo Mar. Lett. 40, 559–571. doi: 10.1007/s00367-020-00651-x
Sutherland, T. F., Amos, C. L., and Grant, J. (1998). “The erosion threshold of biotic sediments: a comparison of methods,” in Sedimentary Processes in the Intertidal Zone, eds K. S. Black, D. M. Paterson, and A. Cramp (London: Geological Society), 295–307.
Thompson, C. E. L., Couceiro, F., Fones, G. R., and Amos, C. L. (2013). Shipboard measurements of sediment stability using a small annular flume-Core Mini Flume (CMF). Limnol. Oceanogr. Methods 11, 604–615. doi: 10.4319/lom.2013.11.604
van Ledden, M., van Kesteren, W. G. M., and Winterwerp, J. C. (2004). A conceptual framework for the erosion behavior of sand-mud mixtures. Cont. Shelf Res. 24, 1–11. doi: 10.1016/j.csr.2003.09.002
Wiberg, P. L., Law, B. A., Wheatcroft, R. A., Milligan, T. G., and Hill, P. S. (2013). Seasonal variations in erodibility and sediment transport potential in a mesotidal channel-flat complex, Willapa Bay, WA. Cont. Shelf Res. 60S, S185–S197. doi: 10.1016/j.csr.2012.07.021
Widdows, J., Brinsley, M. D., Bowley, N., and Barrett, C. (1998). A benthic annular flume for in situ measurement of suspension feeding/biodeposition rates and erosion potential of intertidal cohesive sediments. Estuar. Coast. Shelf Sci. 46, 27–38. doi: 10.1006/ecss.1997.0259
Widdows, J., Friend, P. L., Bale, A. J., Brinsley, M. D., Pope, N. D., and Thompson, C. E. L. (2007). Inter-comparison between five devices for determining erodability of intertidal sediments. Cont. Shelf Res. 27, 1174–1189. doi: 10.1016/j.csr.2005.10.006
Winterwerp, J. C., and van Kesteren, W. G. M. (2004). Introduction to the Physics of Cohesive Sediment Dynamics in the Marine Environment. Oxford: Elsevier B.V.
Xu, K., Bentley, S. J., Robichaux, P., Sha, X., and Yang, H. (2016). Implications of texture and erodibility for sediment retention in receiving basins of coastal Louisiana diversions. Water 8:26. doi: 10.3390/w8010026
Keywords: erosion threshold, intertidal flat, cohesive sediment, methods, microcosm system
Citation: Ha HJ and Ha HK (2021) Comparison of Methods for Determining Erosion Threshold of Cohesive Sediments Using a Microcosm System. Front. Mar. Sci. 8:695845. doi: 10.3389/fmars.2021.695845
Received: 15 April 2021; Accepted: 15 October 2021;
Published: 04 November 2021.
Edited by:
Joanna Staneva, Institute of Coastal Systems Helmholtz Centre Hereon, GermanyReviewed by:
Courtney Harris, College of William and Mary, United StatesJun Choi, Pukyong National University, South Korea
Copyright © 2021 Ha and Ha. This is an open-access article distributed under the terms of the Creative Commons Attribution License (CC BY). The use, distribution or reproduction in other forums is permitted, provided the original author(s) and the copyright owner(s) are credited and that the original publication in this journal is cited, in accordance with accepted academic practice. No use, distribution or reproduction is permitted which does not comply with these terms.
*Correspondence: Ho Kyung Ha, aGFoa0BpbmhhLmFjLmty; aG9reXVuZy5oYUBnbWFpbC5jb20=
 Hun Jun Ha
 Ho Kyung Ha